Embed Size (px)
Citation preview
lable at ScienceDirect
Nutrition 29 (2013) 1042–1047
Contents lists avai
Nutrition
journal homepage: www.nutr i t ionjrnl .com
Applied nutritional investigation
Food groups and fatty acids associated with self-reported depression:An analysis from the Australian National Nutrition and Health Surveys
Barbara J. Meyer Ph.D. a,*, Nithin Kolanu M.D. a, David A. Griffiths Ph.D. b, Ben Grounds M.P.H. a,Peter R.C. Howe Ph.D. c, Irene A. Kreis M.D., Ph.D. d
a School of Health Sciences, Metabolic Research Centre, University of Wollongong, Wollongong, NSW, AustraliabCentre for Statistical and Survey Methodology, School of Mathematics and Applied Statistics, University of Wollongong, Wollongong, NSW, AustraliacClinical Nutrition Research Centre, University of Newcastle, Callaghan, AustraliadCentre for Academic Systems and Resources (CASR), University of Wollongong, Wollongong, NSW, Australia
a r t i c l e i n f o
Article history:Received 2 February 2012Accepted 8 February 2013
Keywords:Food groupsPolyunsaturated fatty acidsEPADepressionSurveys
BJM, NK, DAG, BG, PRCH, IK initiated the study, incontributed to writing the manuscript; BG and NK coBJM wrote the manuscript with input from all co-autconflicts of interest. NK is now at Gosford and WSydney and Central Coast Area Health Service, GosfoDarebin City Council Melbourne, Australia.* Corresponding author. Tel.: þ61 2 4221 3459; fax
E-mail address: [email protected] (B. J. Meyer)
0899-9007/$ - see front matter � 2013 Elsevier Inc. Ahttp://dx.doi.org/10.1016/j.nut.2013.02.006
a b s t r a c t
Objective: The aim of this study was to explore the associations between incidence of depressionand dietary intakes of foods and fatty acids in adult Australians.Methods: Data from the 1995 Australian National Nutrition Survey (NNS), the 1995 AustralianNational Health Survey (NHS) and an updated fatty acid database were merged and the 24-h fattyacid intakes were calculated for the 10 986 adult participants ages 18 to 79 y in the 1995 NNS. Themerged data set was used to run a logistic regression with depression as the response variable andthe food groups and calculated fatty acid values, age, and sex as predictors.Results: The regression model indicated that increased intakes per kilojoule of meat, poultry, andgame; vegetables; and eicosapentaenoic acid (EPA) are associated with lower odds of havingdepression, whereas increased intakes of non-alcoholic beverages, milk products and dishes, anddocosapentaenoic acid (DPA) are associated with an increase in the odds of having depression. Theresults confirm a collective effect of diet on mood. Although other studies have shown that fishconsumption is associated with lower odds of depression, this study showed lower odds ofdepression with high meat consumption, possibly reflecting the fact that Australians consume sixtimes more meat than fish.Conclusion: Significant associations between food and mood identified in this study warrantfurther research to determine causality.
� 2013 Elsevier Inc. All rights reserved.
Introduction (specifically fruit and nut consumption, monounsaturated/satu-
The prevalence of depression in the United States has morethan doubled over the past 10 y, and it is a major cause ofmorbidity and disability in the Western world [1]. Depression isamong the 10 leading conditions causing disability in Australia[2]. Gender differences are well documented with a higherprevalence of depression in women [3–5].
The effect of food onmood is a complex area [6]. Some studieshave shown beneficial effects from the Mediterranean diet
terpreted the results, andnducted the data analysis;hors. The authors have noyong Hospitals, Northernrd, Australia.BG is now at
: þ61 2 4221 5945..
ll rights reserved.
rated fat ratio and legumes) [7], whereas others have shownbenefits of meat and vegetable consumption on depression [3].Some studies have shown an association between fruit andvegetables and reduced depressive symptoms [8,9], whereasenergy-dense foods have been associated with increaseddepression [8]. These poorer food choices can become a viciouscycle because foods consumed affect mood and mood affectsfood choices [10].
A large cross-national study noted that fish consumptioncorrelated negatively with the prevalence of major depression[11]. There are many more studies that have shown beneficialeffects of fish consumption on depression [4,5,12–17]. Fish isa rich source of long-chain u-3 polyunsaturated fatty acids(LC u-3 PUFA) [17]. Recent research reflects an increasingawareness of the importance of u-3 and u-6 PUFA in thepathogenesis and management of depression and other mooddisorders [18,19]. Some studies show the direct protective effect

B. J. Meyer et al. / Nutrition 29 (2013) 1042–1047 1043
of LC u-3 PUFA on depression [5], whereas other studies showthat a low u-6/u-3 PUFA ratio is important [20]. More recently,a prospective study shows no protective effects of LC u-3 PUFAon depression, but a high ratio of a-linolenic acid to linoleic acidis associated with a reduced risk for depression [21].
In order to elucidate the role of these fatty acids in peoplewith depression, several randomized controlled trials of PUFAsupplementation have been conducted with patients diagnosedwith depression. Some of these have shown significant im-provements in the condition of the patients [22–24], whereasothers are equivocal [25–27]. Such inconsistency in results mayhave been due to a difference in the PUFA type and dose used indifferent studies, relatively small sample sizes, and use ofnon-pharmacologic interventions such as counseling in bothcontrol and intervention groups [26].
An updated meta-analysis of the effects of LC u-3 PUFA onpeople diagnosed with depression concluded that there isevidence for the effect of LC u-3 PUFA on mood, but recognizingthat there is great heterogeneity among the studies [28].Furthermore, most trials have used a combination of eicosa-pentaenoic acid (EPA) and docosahexaenoic acid (DHA) and it isunclear which is more important or if a combination is impor-tant, although a recent meta-analysis suggests that EPA may bemore efficacious than DHA in treating depression but moreresearch is warranted [29].
Given that some studies have shown the benefits of certainfoods in relation to risk for depression, whereas other studieshave focused on specific fatty acids in relation to risk fordepression, no studies have assessed foods and fatty acidstogether. Therefore, the aim of this study was to determine ifthere was an association between food groups as well as dietaryPUFA intakes and depression in an Australian population usingthe 1995 Australian National Nutrition and Health Surveys (NHS)together with an updated fatty acid database.
Experimental methods
Data
Data for the present study were obtained from three sources: the 1995 NHS,the 1995 Australian National Nutrition Survey (NNS) [30], and a fatty acid data-base (FA database) [31].
The 1995 NHS collected data about the health status, use of health services,and health-related lifestyle of 57 633 people from 21 787 households acrossAustralia [32]. The NNS was conducted on a subset of the respondents to the NHS,and included data from 10 986 adult individuals. Trained personnel administeredthe NNS and collected data regarding the 24-h food intake of the participants,frequency of various food consumption, and data regarding health status [33]. TheNNS and the NHS data were available in the form of a confidentialized unit recordfile (CURF) released by the Australian Bureau of Statistics for research purposes. Noethics approval was required or sought because the Australian Bureau of Statisticscollected the data as part of its statutory obligation to collect data that does notrequire ethics. The data was made available to universities with conditions of useas outlined in their technical paper [34]. The FA database was the updated [35]fatty acid extension of the Australian Nutrient database from the Food StandardsAustralia and New Zealand. It contained updated quantities of fatty acids fordifferent types of foods, coded with the same food codes as in the 1995 NNS.
The participants were asked about any recent illness (defined as “medicalconditions during the 2 wk prior to the interview”) or long-term illness (definedas “conditions that lasted at least 6 mo or which the respondent expects to lastfor 6 mo”) that they had suffered. The responses of both recent and long-termillnesses were coded as conditions suffered according to a classification basedon the ICD-10 classification of diseases [32]. Depressionwas one of these medicalconditions. The data, therefore, included those with depression at the time of thesurvey or within 6 mo before.
Merging and calculation
Merging files from the three sources, calculation, and statistical analyseswere conducted using Statistical Analysis Software version 9.1 [SAS; SAS InstituteInc., Cary, NC, USA].
The NNS and NHS data were merged as described in the NNS CURF technicalpaper [30]. Food codes were used to merge the fatty acid data from the FAdatabase to this merged NNS–NHS data set. Subsequently, the total intake of eachof the fatty acids per day for each person was calculated.
Study participants
The present study included all those participants for whom both the 1995NNS and the 1995 NHS data were available: 10 986 adult Australians ages 18 andabove were included [32].
Statistical analysis
The sex, age, certain food groups, EPA and DPA were included as predictorvariables and self-reported depressionwas included as the response variable andlogistic regressionwas performed using SAS 9.1 [SAS Institute Inc., Cary, NC, USA]and the odds ratios and 95% confidence intervals were estimated. A P-value <
0.05 was considered significant in this study.
Modified variables
The data covered a wide interval of ages and therefore it was presumed thatmodeling age as a linear predictor would be inadequate. Among various alter-native approaches, including both age and its square root as linear predictorsproved effective in modeling the non-linear influence of age on depression.
Stepwise elimination of non-significant variables led to a preferred modelwith nine predictors: sex, age, square root of age, and intake measures for fourdifferent food groups, EPA and docosapentaenoic acid (DPA). The four differentfood groups were non-alcoholic beverages; meat poultry, and game; milkproduct and dishes; and vegetable products and dishes.
Results
The population characteristics of the participants have beendescribed elsewhere [35]. Table 1 shows the number of partici-pants with and without depression grouped by sex and agecategories, with similar representation of both sexes (48% menand 52% women). A majority of the participants (57%) belongedto the 25 to 64 y age group.
The best logistic regression model (Table 2) showed that, inaddition to age (P ¼ 0.031) and gender (P < 0.0001), intakesof the following four food groups and two fatty acids weresignificant predictors of depression: meat, poultry, and gameproducts (P¼ 0.002); milk products and dishes (P¼ 0.009); non-alcoholic beverages (P ¼ 0.01); vegetable products and dishes(P ¼ 0.015); EPA (0.027); and DPA (P ¼ 0.0291). The u-6/u-3ratio was not significant and did not contribute to the regressionmodel. The intakes of the four food groups and fatty acids areshown in Tables 3 and 4. Men with depression had 25% signifi-cantly lower intakes of meat (P < 0.05) and arachidonic acid(P < 0.05) compared with men without depression (Table 3).Womenwith depression had 20% significantly increased intakesof non-alcoholic beverages (P < 0.05) and milk products anddishes (P < 0.05) compared with women without depression(Table 4). There was also a 12% lower intake of vegetable prod-ucts and dishes in women with depression compared withwomen without depression but this did not reach significance(P ¼ 0.062). Alcohol and/or fish consumption did not contributeto the prediction of depression in men, women, or the wholeadult population.
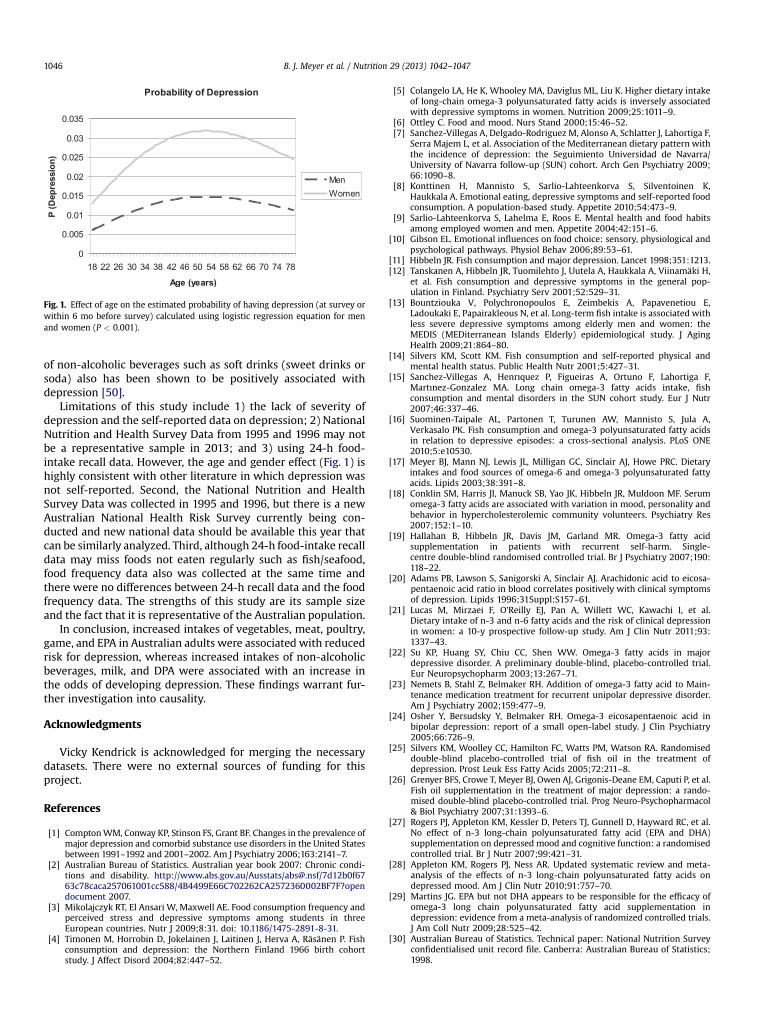
The data set covered a wide interval of ages and hence itwas presumed thatmodeling age as a “linear” predictorwould beinadequate. Among various alternative approaches, includingboth age and its square root as linear predictors proved effectivein modeling the non-linear influence of age on depression.The probability of having depression was estimated using theregression equation from the best-fitting model (Table 2).Figure 1 is based on arbitrarily setting each food group and fattyacid intake to its median level and plotting the effect of change in
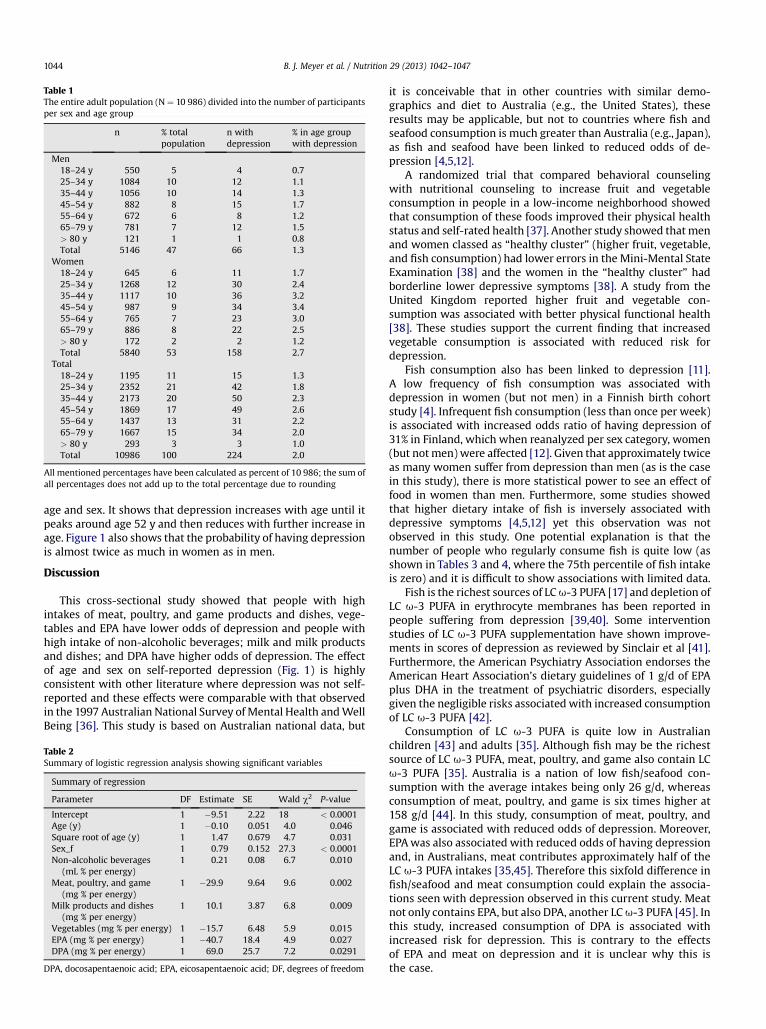
Table 1The entire adult population (N ¼ 10 986) divided into the number of participantsper sex and age group
n % totalpopulation
n withdepression
% in age groupwith depression
Men18–24 y 550 5 4 0.725–34 y 1084 10 12 1.135–44 y 1056 10 14 1.345–54 y 882 8 15 1.755–64 y 672 6 8 1.265–79 y 781 7 12 1.5> 80 y 121 1 1 0.8Total 5146 47 66 1.3
Women18–24 y 645 6 11 1.725–34 y 1268 12 30 2.435–44 y 1117 10 36 3.245–54 y 987 9 34 3.455–64 y 765 7 23 3.065–79 y 886 8 22 2.5> 80 y 172 2 2 1.2Total 5840 53 158 2.7
Total18–24 y 1195 11 15 1.325–34 y 2352 21 42 1.835–44 y 2173 20 50 2.345–54 y 1869 17 49 2.655–64 y 1437 13 31 2.265–79 y 1667 15 34 2.0> 80 y 293 3 3 1.0Total 10986 100 224 2.0
All mentioned percentages have been calculated as percent of 10 986; the sum ofall percentages does not add up to the total percentage due to rounding
B. J. Meyer et al. / Nutrition 29 (2013) 1042–10471044
age and sex. It shows that depression increases with age until itpeaks around age 52 y and then reduces with further increase inage. Figure 1 also shows that the probability of having depressionis almost twice as much in women as in men.
Discussion
This cross-sectional study showed that people with highintakes of meat, poultry, and game products and dishes, vege-tables and EPA have lower odds of depression and people withhigh intake of non-alcoholic beverages; milk and milk productsand dishes; and DPA have higher odds of depression. The effectof age and sex on self-reported depression (Fig. 1) is highlyconsistent with other literature where depression was not self-reported and these effects were comparable with that observedin the 1997 Australian National Survey of Mental Health andWellBeing [36]. This study is based on Australian national data, but
Table 2Summary of logistic regression analysis showing significant variables
Summary of regression
Parameter DF Estimate SE Wald c2 P-value
Intercept 1 �9.51 2.22 18 < 0.0001Age (y) 1 �0.10 0.051 4.0 0.046Square root of age (y) 1 1.47 0.679 4.7 0.031Sex_f 1 0.79 0.152 27.3 < 0.0001Non-alcoholic beverages
(mL % per energy)1 0.21 0.08 6.7 0.010
Meat, poultry, and game(mg % per energy)
1 �29.9 9.64 9.6 0.002
Milk products and dishes(mg % per energy)
1 10.1 3.87 6.8 0.009
Vegetables (mg % per energy) 1 �15.7 6.48 5.9 0.015EPA (mg % per energy) 1 �40.7 18.4 4.9 0.027DPA (mg % per energy) 1 69.0 25.7 7.2 0.0291
DPA, docosapentaenoic acid; EPA, eicosapentaenoic acid; DF, degrees of freedom
it is conceivable that in other countries with similar demo-graphics and diet to Australia (e.g., the United States), theseresults may be applicable, but not to countries where fish andseafood consumption is much greater than Australia (e.g., Japan),as fish and seafood have been linked to reduced odds of de-pression [4,5,12].
A randomized trial that compared behavioral counselingwith nutritional counseling to increase fruit and vegetableconsumption in people in a low-income neighborhood showedthat consumption of these foods improved their physical healthstatus and self-rated health [37]. Another study showed thatmenand women classed as “healthy cluster” (higher fruit, vegetable,and fish consumption) had lower errors in the Mini-Mental StateExamination [38] and the women in the “healthy cluster” hadborderline lower depressive symptoms [38]. A study from theUnited Kingdom reported higher fruit and vegetable con-sumption was associated with better physical functional health[38]. These studies support the current finding that increasedvegetable consumption is associated with reduced risk fordepression.
Fish consumption also has been linked to depression [11].A low frequency of fish consumption was associated withdepression in women (but not men) in a Finnish birth cohortstudy [4]. Infrequent fish consumption (less than once per week)is associated with increased odds ratio of having depression of31% in Finland, which when reanalyzed per sex category, women(but notmen) were affected [12]. Given that approximately twiceas many women suffer from depression than men (as is the casein this study), there is more statistical power to see an effect offood in women than men. Furthermore, some studies showedthat higher dietary intake of fish is inversely associated withdepressive symptoms [4,5,12] yet this observation was notobserved in this study. One potential explanation is that thenumber of people who regularly consume fish is quite low (asshown in Tables 3 and 4, where the 75th percentile of fish intakeis zero) and it is difficult to show associations with limited data.
Fish is the richest sources of LCu-3 PUFA [17] and depletion ofLC u-3 PUFA in erythrocyte membranes has been reported inpeople suffering from depression [39,40]. Some interventionstudies of LC u-3 PUFA supplementation have shown improve-ments in scores of depression as reviewed by Sinclair et al [41].Furthermore, the American Psychiatry Association endorses theAmerican Heart Association’s dietary guidelines of 1 g/d of EPAplus DHA in the treatment of psychiatric disorders, especiallygiven the negligible risks associatedwith increased consumptionof LC u-3 PUFA [42].
Consumption of LC u-3 PUFA is quite low in Australianchildren [43] and adults [35]. Although fish may be the richestsource of LC u-3 PUFA, meat, poultry, and game also contain LCu-3 PUFA [35]. Australia is a nation of low fish/seafood con-sumption with the average intakes being only 26 g/d, whereasconsumption of meat, poultry, and game is six times higher at158 g/d [44]. In this study, consumption of meat, poultry, andgame is associated with reduced odds of depression. Moreover,EPAwas also associated with reduced odds of having depressionand, in Australians, meat contributes approximately half of theLC u-3 PUFA intakes [35,45]. Therefore this sixfold difference infish/seafood and meat consumption could explain the associa-tions seen with depression observed in this current study. Meatnot only contains EPA, but also DPA, another LCu-3 PUFA [45]. Inthis study, increased consumption of DPA is associated withincreased risk for depression. This is contrary to the effectsof EPA and meat on depression and it is unclear why this isthe case.

Table 3The mean, SD, median, 25th and 75th percentile of intakes from major foods groups and fatty acids in adult men (18–79 y) with and without depression
No depression (n ¼ 10762) With depression (n ¼ 224)
Mean SD Median P25 P75 Mean SD Median P25 P75
Energy (kJ) 11056 4273 10389 8111 13227 10108 3179 10235 8425 12064Food group (g/d)Non-alcoholic beverages 1298 834 1171 761 1696 1228 894 1062 589 1548Alcoholic beverages 435 822 0 0 529 376 780 0 0 381Alcohol 19.4 34.1 0 0 28.6 21.0 47.4 0 0 25.4Fish and seafood products & dishes 34 103 0 0 0 42 108 0 0 0Meat, poultry, game products & dishes* 298 272 229 112 413 225 203 191 73 337Milk products & dishes 327 336 252 83 465 318 260 271 124 467Vegetable products & dishes 288 242 247 96 424 256 216 221 67 356
Fatty acid (g/d)Linoleic acid 11.59 7.64 9.81 6.37 14.89 9.97 6.23 9.18 5.38 13.74Arachidonic acid* 0.188 0.173 0.148 0.076 0.246 0.140 0.122 0.122 0.047 0.191Total u-6 PUFA 11.94 7.72 10.17 6.67 15.27 10.22 6.29 9.41 5.66 13.93a-linolenic acid 1.16 0.77 0.99 0.68 1.43 1.12 0.82 0.94 0.55 1.46EPA 0.089 0.218 0.042 0.018 0.085 0.061 0.097 0.031 0.013 0.070DPA 0.087 0.103 0.060 0.023 0.118 0.070 0.076 0.054 0.014 0.093DHA 0.118 0.334 0.035 0.014 0.080 0.100 0.189 0.026 0.010 0.064Total u-3 PUFA 1.46 1.02 1.22 0.84 1.78 1.35 0.92 1.20 0.79 1.53Total PUFA 13.40 8.26 11.56 7.79 16.94 11.57 6.92 10.69 6.59 15.88
ANOVA, analysis of variance; DHA, docosahexaenoic acid; DPA, docosapentaenoic acid; EPA, eicosapentaenoic acid; PUFA, polyunsaturated fatty acid* P < 0.05 one-way ANOVA.
B. J. Meyer et al. / Nutrition 29 (2013) 1042–1047 1045
Although the exact role of the various PUFA in the patho-genesis of depression is unclear, it is suggested that the metab-olism of fatty acids in people diagnosed with depression isabnormal, as indicated by the changes in the phospholipidconcentrations of LC PUFA [46]. Maes et al [46] showed thatmajor depression was associated with reduced EPA (20:5u-3)and DPA (22:5n-3) fractions in phospholipids, reduced a-lino-lenic acid (ALA; 18:3u-3), EPA and total u-3 in cholesteryl estersand increased arachidonic acid (AA; 20:4u-6) to EPA ratio in bothphospholipids and in cholesteryl esters. It also has been shownthat depression is directly associated with increases in the ratiosof u-6 PUFA/u-3 PUFA and of AA to EPA concentrations in plasmaand erythrocytes [20,45,47].
Foods that are linked to increased risk for depression are non-alcoholic beverages and milk, which taken together suggests theconsumption of tea and coffee, as these beverages are often
Table 4The mean, SD, median, 25th and 75th percentile of intakes from major foods groups
No depression
Mean SD Median P25
Energy (kJ) 7505 2949 7103 549Food group (g/d)Non-alcoholic beverages* 1158 671 1058 76Alcoholic beverages 106 321 0Alcohol 7.5 19.2 0Fish and seafood products & dishes 25 80 0Meat, poultry, game products & dishes 178 186 127 4Milk products & dishes* 259 248 200 7Vegetable products & dishes 237 195 208 8
Fatty acid (g/d)Linoleic acid 8.05 5.50 6.88Arachidonic acid 0.115 0.114 0.087Total u-6 PUFA 8.25 5.55 7.08a-linolenic acid 0.795 0.551 0.674EPA 0.058 0.137 0.024DPA 0.051 0.062 0.033DHA 0.085 0.228 0.021Total u-3 PUFA 0.99 0.70 0.82Total PUFA 9.24 5.92 8.07
ANOVA, analysis of variance; DHA, docosahexaenoic acid; DPA, docosapentaenoic aci* P < 0.05 one-way ANOVA.
consumed with milk. This is contrary to the reported negativecorrelation between consumption of tea and depression ina Finnish population, where daily tea consumption was associ-ated with a 53% reduction in the odds of developing depression[48]. However, the authors acknowledge that Finland is a coffee-drinking nation, with 86% of Finnish people drinking coffee dailyand only 27% drinking tea on a daily basis. The authors suggestthat perhaps this minority tea-drinking group could be morehealth conscious and that the lower depression rates are asso-ciated with factors other than tea consumption [48].
Coffee and tea contains caffeine and it is certainly well knownthat caffeine is associated with increased alertness and anincrease in the capacity to process information [49]. It isconceivable that people with depression are consuming thesenon-alcoholic beverages to provide these effects, which couldexplain why they are associated with depression. Consumption
and fatty acids in adult women (18–79 y) with and without depression
With depression
P75 Mean SD Median P25 P75
4 9127 7697 3177 7489 5437 9254
1 1509 1416 859 1269 772 18380 4.1 129 349 0 0 640 1.2 8.9 19.5 0 0 10.30 0 23 75 0 0 08 252 152 175 104 23 2112 370 331 295 287 118 4469 346 208 170 185 69 305
4.32 10.33 8.14 5.33 6.65 4.34 10.840.041 0.156 0.110 0.103 0.081 0.034 0.1594.50 10.55 8.34 5.37 6.92 4.59 10.970.450 0.985 0.871 0.605 0.721 0.432 1.180.009 0.050 0.046 0.062 0.025 0.007 0.0540.010 0.068 0.052 0.061 0.035 0.007 0.0790.008 0.050 0.073 0.149 0.018 0.008 0.0480.55 1.22 1.04 0.68 0.88 0.54 1.375.23 11.78 9.38 5.85 8.27 5.23 12.17
d; EPA, eicosapentaenoic acid; PUFA, polyunsaturated fatty acid
Probability of Depression
0
0.005
0.01
0.015
0.02
0.025
0.03
0.035
18 22 26 30 34 38 42 46 50 54 58 62 66 70 74 78
Age (years)
P (
Dep
ressio
n)
MenWomen
Fig. 1. Effect of age on the estimated probability of having depression (at survey orwithin 6 mo before survey) calculated using logistic regression equation for menand women (P < 0.001).
B. J. Meyer et al. / Nutrition 29 (2013) 1042–10471046
of non-alcoholic beverages such as soft drinks (sweet drinks orsoda) also has been shown to be positively associated withdepression [50].
Limitations of this study include 1) the lack of severity ofdepression and the self-reported data on depression; 2) NationalNutrition and Health Survey Data from 1995 and 1996 may notbe a representative sample in 2013; and 3) using 24-h food-intake recall data. However, the age and gender effect (Fig. 1) ishighly consistent with other literature in which depression wasnot self-reported. Second, the National Nutrition and HealthSurvey Data was collected in 1995 and 1996, but there is a newAustralian National Health Risk Survey currently being con-ducted and new national data should be available this year thatcan be similarly analyzed. Third, although 24-h food-intake recalldata may miss foods not eaten regularly such as fish/seafood,food frequency data also was collected at the same time andthere were no differences between 24-h recall data and the foodfrequency data. The strengths of this study are its sample sizeand the fact that it is representative of the Australian population.
In conclusion, increased intakes of vegetables, meat, poultry,game, and EPA in Australian adults were associated with reducedrisk for depression, whereas increased intakes of non-alcoholicbeverages, milk, and DPA were associated with an increase inthe odds of developing depression. These findings warrant fur-ther investigation into causality.
Acknowledgments
Vicky Kendrick is acknowledged for merging the necessarydatasets. There were no external sources of funding for thisproject.
References
[1] ComptonWM, Conway KP, Stinson FS, Grant BF. Changes in the prevalence ofmajor depression and comorbid substance use disorders in the United Statesbetween 1991–1992 and 2001–2002. Am J Psychiatry 2006;163:2141–7.
[2] Australian Bureau of Statistics. Australian year book 2007: Chronic condi-tions and disability. http://www.abs.gov.au/Ausstats/[email protected]/7d12b0f6763c78caca257061001cc588/4B4499E66C702262CA2572360002BF7F?opendocument 2007.
[3] Mikolajczyk RT, El Ansari W, Maxwell AE. Food consumption frequency andperceived stress and depressive symptoms among students in threeEuropean countries. Nutr J 2009;8:31. doi: 10.1186/1475-2891-8-31.
[4] Timonen M, Horrobin D, Jokelainen J, Laitinen J, Herva A, Räsänen P. Fishconsumption and depression: the Northern Finland 1966 birth cohortstudy. J Affect Disord 2004;82:447–52.
[5] Colangelo LA, He K, Whooley MA, Daviglus ML, Liu K. Higher dietary intakeof long-chain omega-3 polyunsaturated fatty acids is inversely associatedwith depressive symptoms in women. Nutrition 2009;25:1011–9.
[6] Ottley C. Food and mood. Nurs Stand 2000;15:46–52.[7] Sanchez-Villegas A, Delgado-Rodriguez M, Alonso A, Schlatter J, Lahortiga F,
Serra Majem L, et al. Association of the Mediterranean dietary pattern withthe incidence of depression: the Seguimiento Universidad de Navarra/University of Navarra follow-up (SUN) cohort. Arch Gen Psychiatry 2009;66:1090–8.
[8] Konttinen H, Mannisto S, Sarlio-Lahteenkorva S, Silventoinen K,Haukkala A. Emotional eating, depressive symptoms and self-reported foodconsumption. A population-based study. Appetite 2010;54:473–9.
[9] Sarlio-Lahteenkorva S, Lahelma E, Roos E. Mental health and food habitsamong employed women and men. Appetite 2004;42:151–6.
[10] Gibson EL. Emotional influences on food choice: sensory, physiological andpsychological pathways. Physiol Behav 2006;89:53–61.
[11] Hibbeln JR. Fish consumption and major depression. Lancet 1998;351:1213.[12] Tanskanen A, Hibbeln JR, Tuomilehto J, Uutela A, Haukkala A, Viinamäki H,
et al. Fish consumption and depressive symptoms in the general pop-ulation in Finland. Psychiatry Serv 2001;52:529–31.
[13] Bountziouka V, Polychronopoulos E, Zeimbekis A, Papavenetiou E,Ladoukaki E, Papairakleous N, et al. Long-term fish intake is associated withless severe depressive symptoms among elderly men and women: theMEDIS (MEDiterranean Islands Elderly) epidemiological study. J AgingHealth 2009;21:864–80.
[14] Silvers KM, Scott KM. Fish consumption and self-reported physical andmental health status. Public Health Nutr 2001;5:427–31.
[15] Sanchez-Villegas A, Henrıquez P, Figueiras A, Ortuno F, Lahortiga F,Martınez-Gonzalez MA. Long chain omega-3 fatty acids intake, fishconsumption and mental disorders in the SUN cohort study. Eur J Nutr2007;46:337–46.
[16] Suominen-Taipale AL, Partonen T, Turunen AW, Mannisto S, Jula A,Verkasalo PK. Fish consumption and omega-3 polyunsaturated fatty acidsin relation to depressive episodes: a cross-sectional analysis. PLoS ONE2010;5:e10530.
[17] Meyer BJ, Mann NJ, Lewis JL, Milligan GC, Sinclair AJ, Howe PRC. Dietaryintakes and food sources of omega-6 and omega-3 polyunsaturated fattyacids. Lipids 2003;38:391–8.
[18] Conklin SM, Harris JI, Manuck SB, Yao JK, Hibbeln JR, Muldoon MF. Serumomega-3 fatty acids are associated with variation in mood, personality andbehavior in hypercholesterolemic community volunteers. Psychiatry Res2007;152:1–10.
[19] Hallahan B, Hibbeln JR, Davis JM, Garland MR. Omega-3 fatty acidsupplementation in patients with recurrent self-harm. Single-centre double-blind randomised controlled trial. Br J Psychiatry 2007;190:118–22.
[20] Adams PB, Lawson S, Sanigorski A, Sinclair AJ. Arachidonic acid to eicosa-pentaenoic acid ratio in blood correlates positively with clinical symptomsof depression. Lipids 1996;31Suppl:S157–61.
[21] Lucas M, Mirzaei F, O’Reilly EJ, Pan A, Willett WC, Kawachi I, et al.Dietary intake of n-3 and n-6 fatty acids and the risk of clinical depressionin women: a 10-y prospective follow-up study. Am J Clin Nutr 2011;93:1337–43.
[22] Su KP, Huang SY, Chiu CC, Shen WW. Omega-3 fatty acids in majordepressive disorder. A preliminary double-blind, placebo-controlled trial.Eur Neuropsychopharm 2003;13:267–71.
[23] Nemets B, Stahl Z, Belmaker RH. Addition of omega-3 fatty acid to Main-tenance medication treatment for recurrent unipolar depressive disorder.Am J Psychiatry 2002;159:477–9.
[24] Osher Y, Bersudsky Y, Belmaker RH. Omega-3 eicosapentaenoic acid inbipolar depression: report of a small open-label study. J Clin Psychiatry2005;66:726–9.
[25] Silvers KM, Woolley CC, Hamilton FC, Watts PM, Watson RA. Randomiseddouble-blind placebo-controlled trial of fish oil in the treatment ofdepression. Prost Leuk Ess Fatty Acids 2005;72:211–8.
[26] Grenyer BFS, Crowe T, Meyer BJ, Owen AJ, Grigonis-Deane EM, Caputi P, et al.Fish oil supplementation in the treatment of major depression: a rando-mised double-blind placebo-controlled trial. Prog Neuro-Psychopharmacol& Biol Psychiatry 2007;31:1393–6.
[27] Rogers PJ, Appleton KM, Kessler D, Peters TJ, Gunnell D, Hayward RC, et al.No effect of n-3 long-chain polyunsaturated fatty acid (EPA and DHA)supplementation on depressed mood and cognitive function: a randomisedcontrolled trial. Br J Nutr 2007;99:421–31.
[28] Appleton KM, Rogers PJ, Ness AR. Updated systematic review and meta-analysis of the effects of n-3 long-chain polyunsaturated fatty acids ondepressed mood. Am J Clin Nutr 2010;91:757–70.
[29] Martins JG. EPA but not DHA appears to be responsible for the efficacy ofomega-3 long chain polyunsaturated fatty acid supplementation indepression: evidence from a meta-analysis of randomized controlled trials.J Am Coll Nutr 2009;28:525–42.
[30] Australian Bureau of Statistics. Technical paper: National Nutrition Surveyconfidentialised unit record file. Canberra: Australian Bureau of Statistics;1998.

B. J. Meyer et al. / Nutrition 29 (2013) 1042–1047 1047
[31] Mann NJ, Sinclair AJ, Percival P, Lewis JL, Meyer BJ, Howe PRC. Developmentof a database of fatty acids in Australian foods. Nutr Diet 2003;60:34–7.
[32] Mc LennanW. National Health Survey user’s guide. Canberra: Commonwealthof Australia; 1996.
[33] Mc Lennan W, Podger A. National Nutrition Survey user’s guide. Canberra:Australian Bureau of Statistics; 1998.
[34] Australian Bureau of Statistics. Technical paper. National Nutrition Survey.confidentialised unit record file. Canberra: Australian Bureau of Statistics;1995.
[35] Howe P, Meyer B, Record S, Baghurst K. Dietary intake of long-chainomega-3 polyunsaturated fatty acids: contribution of meat sources. Nutr2006;22:47–53.
[36] Australian Institute of Health and Welfare. Incidence and prevalenceof chronic diseases. http://www.aihw.gov.au/cdarf/data_pages/incidence_prevalence/index.cfm 2007.
[37] Steptoe A, Perkins-Porras L, Hilton S, Rink E, Cappuccio FP. Quality oflife and self-rated health in relation to changes in fruit and vegetableintake and in plasma vitamins C and E in a randomised trial ofbehavioural and nutritional education counselling. Br J Nutr 2004;92:177–84.
[38] Samieri C, Jutand MA, F�eart C, Capuron L, Letenneur L, Barberger-Gateau P.Dietary patterns derived by hybrid clustering method in older people:association with cognition, mood, and self-rated health. J Am Diet Assoc2008;108:1461–71.
[39] Peet M, Murphy B, Shay J, Horrobin D. Depletion of omega-3 fatty acidlevels in red blood cell membranes of depressive patients. Biol Psychiatry1998;43:315–9.
[40] Milte C, Sinn N, Howe P. Polyunsaturated fatty acid status in ADHD,depression and Alzheimer’s disease: towards an omega-3 index for mentalhealth? Nutr Rev 2009;67:573–90.
[41] Sinclair AJ, Begg D, Mathai M, Weisinger RS. Omega-3 fatty acids andthe brain: review of studies in depression. Asia Pac J Clin Nutr 2007;16:391–7.
[42] McNamara RK. The emerging role of omega-3 fatty acids in psychiatry.Prost Leuk Ess Fatty Acids 2006;75:223–5.
[43] Meyer BJ, Kolanu N. Australian children are not consuming enough longchain omega-3 polyunsaturated fatty acids for optimal health. Nutrition2011;27:1136–40.
[44] Ollis TE, Meyer BJ, Howe PRC. Australian food sources and intakes ofomega-6 and omega-3 polyunsaturated fatty acids. Annals Nutr Metab1999;43:346–55.
[45] Howe PRC, Buckley J, Meyer BJ. Red meat: a source of long chain omega-3.Nutr Diet 2007;64:S135–9.
[46] Maes M, Christophe A, Delanghe J, Altamura C, Neels H, Meltzer HY.Lowered omega-3 polyunsaturated fatty acids in serum phospholipids andcholesteryl esters of depressed patients. Psychiatry Res 1995;85:275–91.
[47] Fontani G, Corradeschi F, Felici A, Alfatti F, Bugarini R, Fiaschi AI, et al. Bloodprofiles, body fat and mood state in healthy subjects on different dietssupplemented with omega-3 polyunsaturated fatty acids. Eur J Clin Invest2005;35:499–507.
[48] Hintikka J, Tolmunen T, Honkalampi K, Haatainen K, Koivumaa-Honkanen H, Tanskanen A, et al. Daily tea drinking is associated with a lowlevel of depressive symptoms in the Finnish general population. Eur JEpidemiol 2005;20:359–63.
[49] Hindmarch I, Quinlan PT, Moore KL, Parkin C. The effects of black tea andother beverages on aspects of cognition and psychomotor performance.Pscychopharmacol 1998;139:230–8.
[50] Shi Z, Taylor AW, Wittert G, Goldney R, Gill TK. Soft drink consumption andmental health problems among adults in Australia. Public Health Nutr2010;13:1073–9.