• Emerson Nation Hunger Fellowship, Congressional Hunger Center
• A few facts about me: • A few facts about me: – Graduated from Stanford University with a degree in Human biology, focus in Global Development & Health
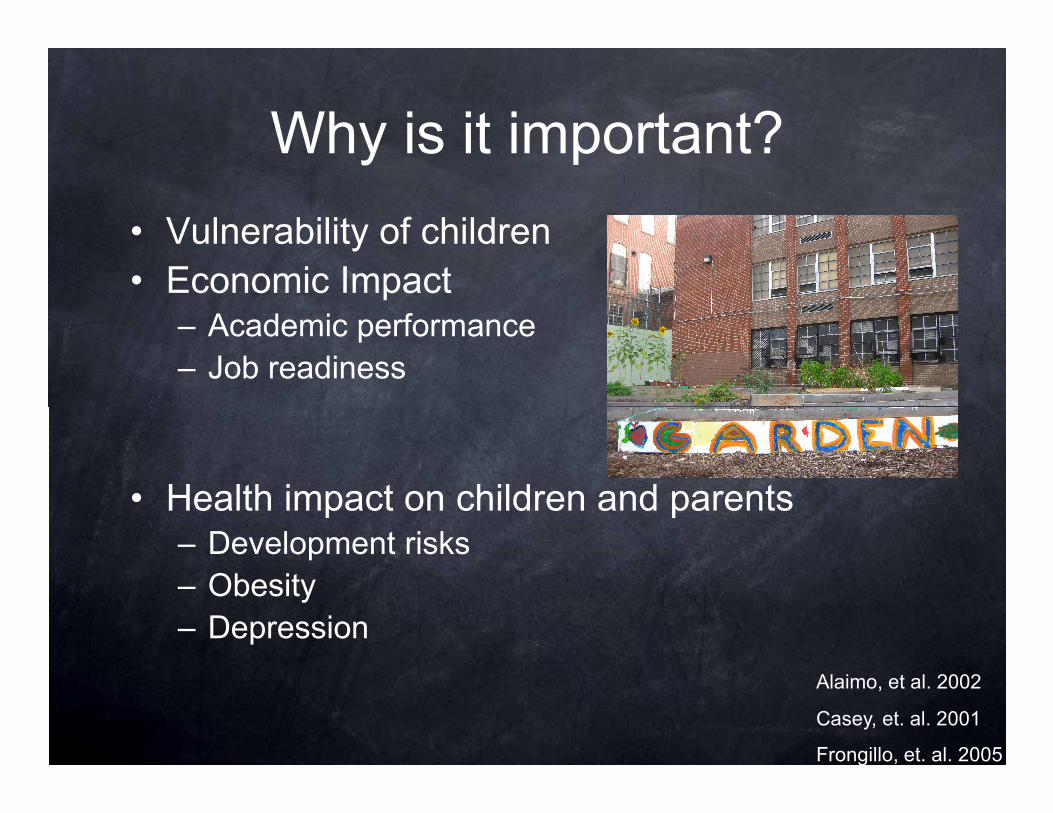
• Vulnerability of children • Economic Impact – Academic performance – Job readiness
• Health impact on children and parents– Development risks – Obesity – Depression
Alaimo, et al. 2002
Casey, et. al. 2001
Frongillo, et. al. 2005
Methodology
• Interviews with different service-providers, academic institutions, and community stake-holders
• Data collection on programs
• Academic literature review
• Food insecurity surveys in schools
The data and information for this report was collected through a series of interviews with different service-provider groups, government agencies, stake-holders in the community, academic institutions, and public as well as charter schools within Baltimore (see Appendix # for a list of organizations interviewed). Extensive research on current and past reports, recommendations, and academic literature pertaining to food insecurity was also conducted in order to align the findings and recommendations of this report with existing endeavors to address food insecurity among school-age youth. Additionally, food insecurity assessments were conducted [ #] schools within the Baltimore City school district. These school surveys were either sent home to parents or focus groups were conducted among parents to collect a cross-sectional review of the frequency of food insecurity within each individual school (See Appendix #).
Purpose
• Try to capture prevalence of food insecurity among children in Baltimore
• Create a complete “picture” of services • Create a complete “picture” of services for children and their families
• Complete a literature review of food insecurity among children
Prevalence: U.S.
VS.
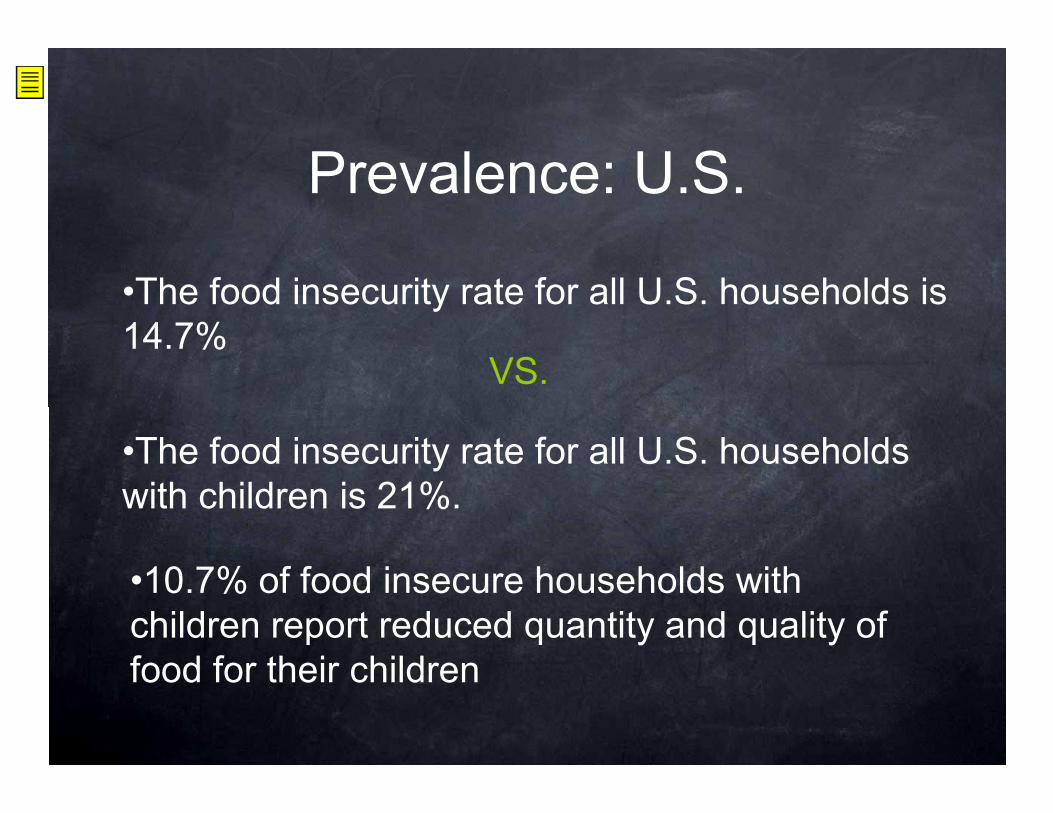
•The food insecurity rate for all U.S. households is 14.7%
•The food insecurity rate for all U.S. households with children is 21%.
•10.7% of food insecure households with children report reduced quantity and quality of food for their children
Food insecurity disproportionately affects households with children. The food insecurity rate for all U.S. households for the 2009 year was 14.7%, while the food insecurity rate for all U.S. households with children was 21%. And while households often do try to shield their children from the effects of food insecurity first, 15.8% of households with children report food insecurity among children. Childhood represents a vulnerable period – a period of great possibility and good interventions can help food insecure children realize their physical and mental growth potentials. Food insecurity statistics for the state and federal levels are derived from the Current Population Survey Food Security Supplement (CPS-FSS). This supplemental survey is asked once a year during the CPS, which is a monthly labor force survey of approximately 50,000 households. CPS-FSS questions ask about ?ood security, food expenditures, and use of food and nutrition assistance programs.? Other sources for food insecurity data at the national and state level are: the early childhood longitudinal survey, birth cohort of 2001(ECLS-B), the early childhood longitudinal survey, kindergarten class of 1998-99 (ECLS-K), the panel study of income dynamics (PSID)food security files, the survey of program dynamics (SPD), and the survey of income and program participation (SIPP). http://www.ers.usda.gov/Data/foodsecurity/cps/ http://nces.ed.gov/ecls/birth.asp http://www.ers.usda.gov/data/FoodSecurity/eclsk/ http://www.ers.usda.gov/data/FoodSecurity/spd/ http://www.ers.usda.gov/data/FoodSecurity/SIPP/
Prevalence: Maryland
• 11.1% of households in Maryland are food insecure
• 4.3% of households in Maryland are categorized with very low food insecurity
Prevalence: Baltimore City
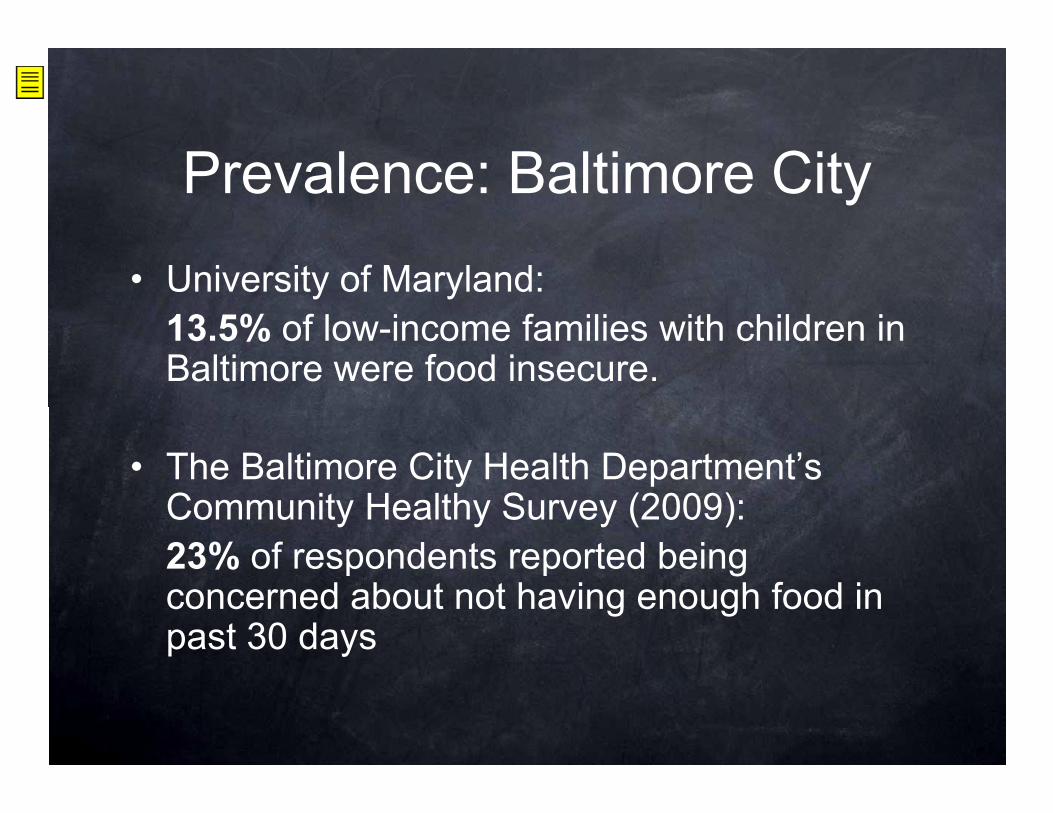
• University of Maryland: 13.5% of low-income families with children in Baltimore were food insecure.
• The Baltimore City Health Department’s Community Healthy Survey (2009): 23% of respondents reported being concerned about not having enough food in past 30 days
Without the same systematic and wide-scale collection of food insecurity information in Baltimore City comparable data is not available, but a study by the University of Maryland found that approximately 13.5% of low-income families with children in Baltimore were food insecure. Additionally, the Baltimore City Health Department’s Community Healthy Survey found that 23% of respondents reported being concerned about not having enough food in 2009. These cross Black, Maureen, et al. (2008) Food Security: Ensuring the Health of Baltimores Babies. University of Maryland Baltimore City Health Department, Office of Epidemiology and Planning. (2010). 2009 Baltimore City Community Health Survey: Summary Results Report.
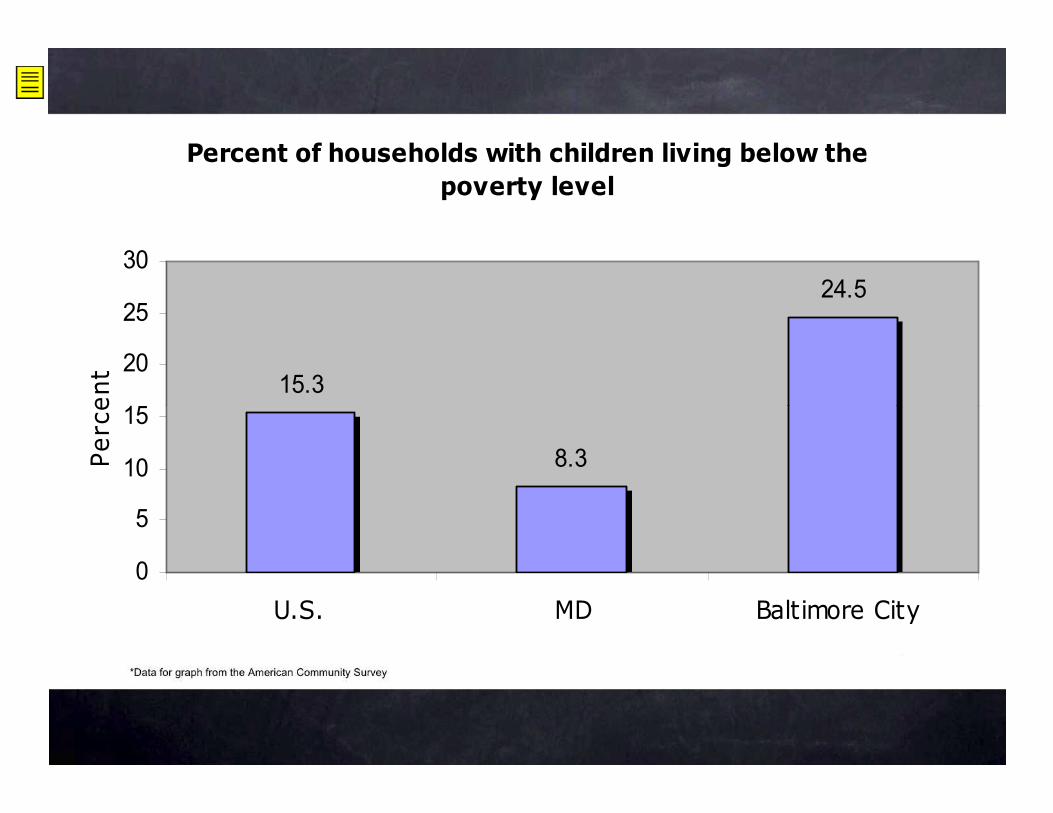
Percent of households with children living below the poverty level
15.3
24.5
15
20
25
30
Percent
8.3
0
5
10
15
U.S. MD Baltimore City
Percent
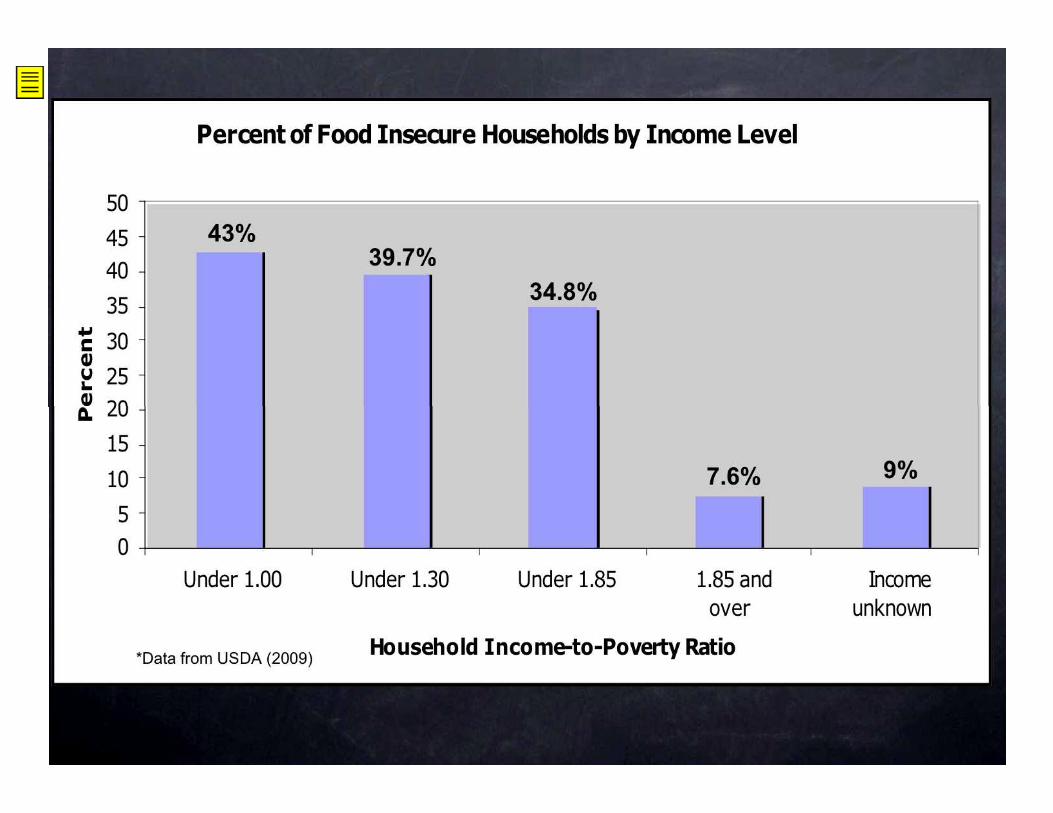
We may not have comprehensive food insecurity data on Baltimore City, but we can use other data that is collected to make approximations.
We can use numbers like this as a proxy because know that poverty and food insecurity are inextricably linked. The poorer the family the more likely they are to be food insecure. This is made further likely for families with children because they are at higher risk for food insecurity.
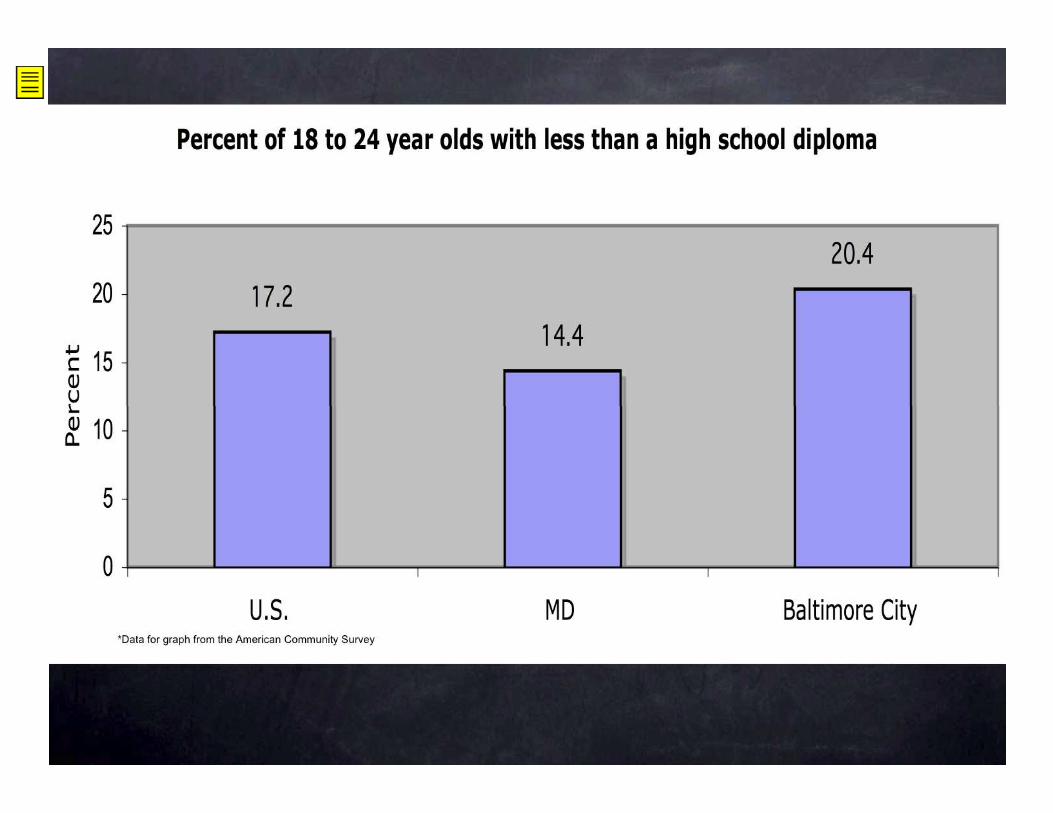
Food insecurity will be a persistent issue given that it is correlated to poverty and there are is high number of young people in Baltimore who are without a high school diploma = high number of ppl working in low-wage jobs with fewer opportunities for social mobility
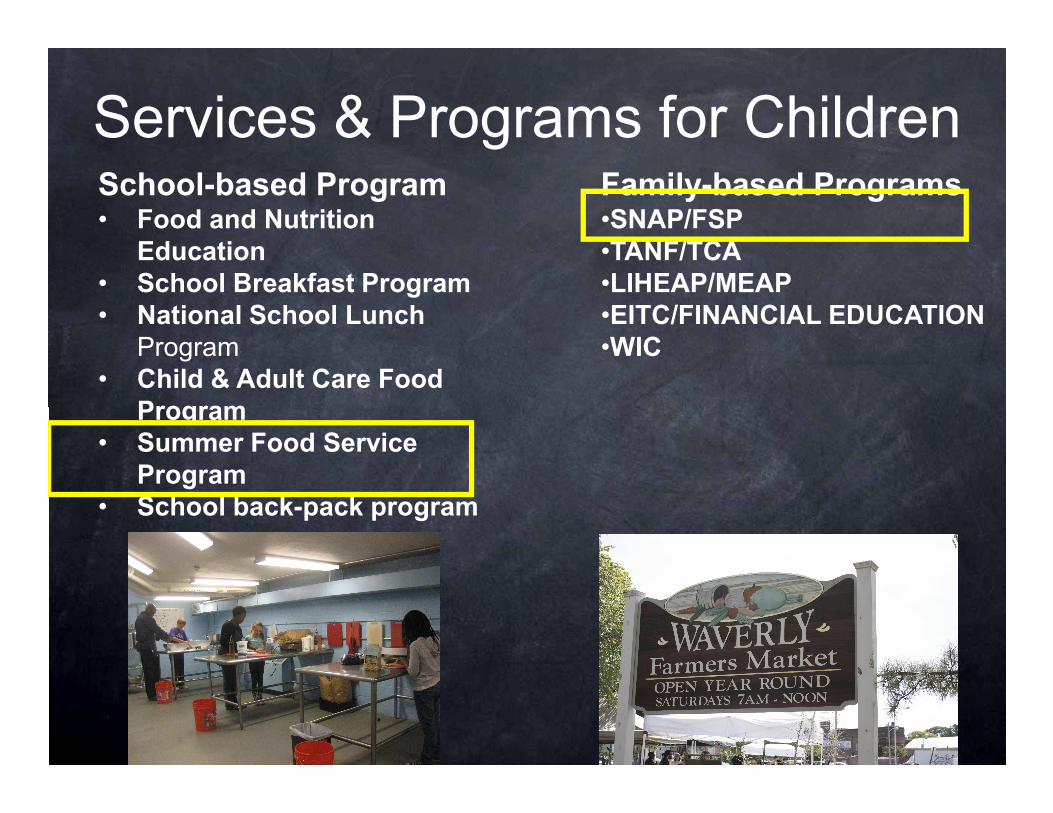
Services & Programs for ChildrenSchool-based Program Family-based Programs• Food and Nutrition
Education • School Breakfast Program • National School Lunch Program
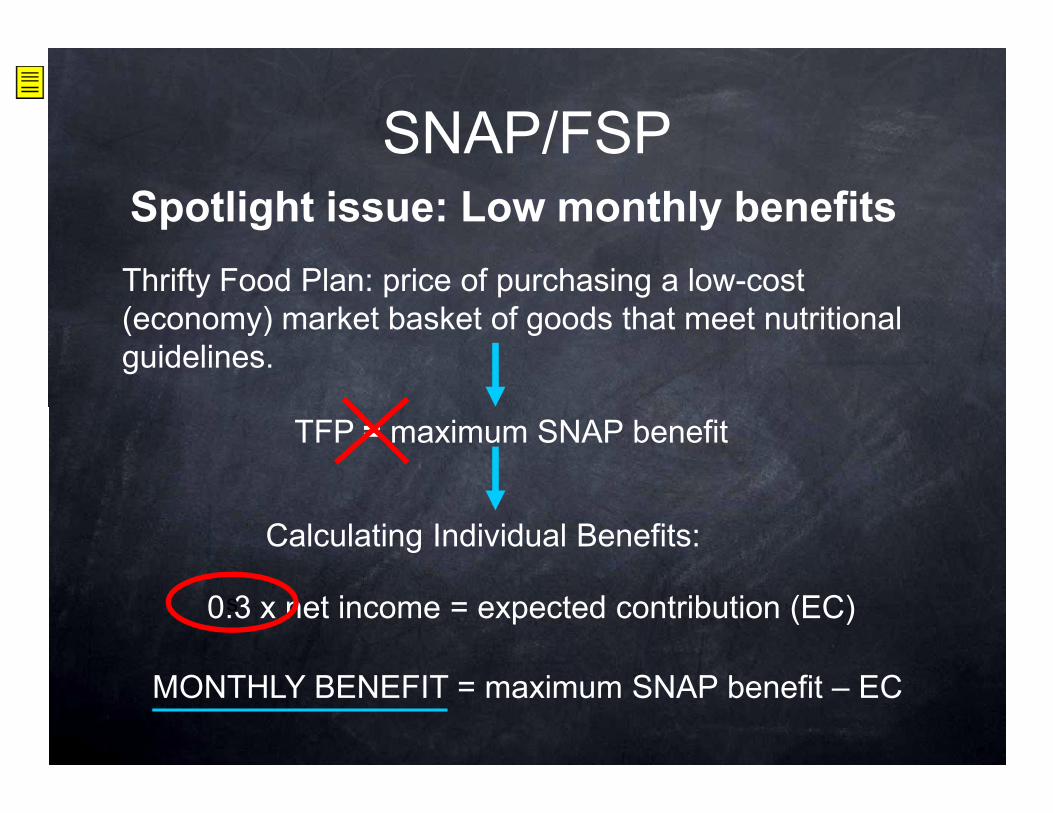
Thrifty Food Plan: price of purchasing a low-cost (economy) market basket of goods that meet nutritional guidelines.
TFP = maximum SNAP benefit
MONTHLY BENEFIT = maximum SNAP benefit – EC
0.3 x net income = expected contribution (EC)
Calculating Individual Benefits:
s
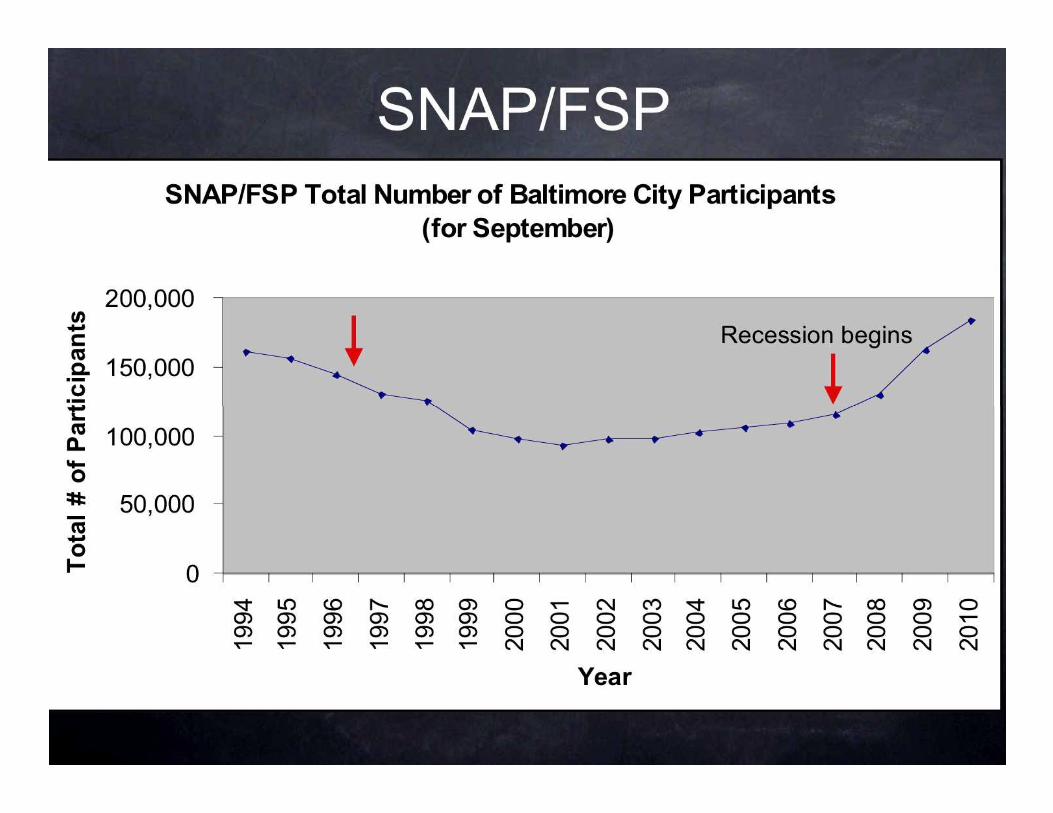
How Benefits are Calculated: In its founding days SNAP or Foodstamps was literally a stamp program. Recipients paid for stamps to purchase food with and in return received additional stamps in order to make up the needed difference to supply their households with what was considered an adequate diet. How benefits for SNAP beneficiaries are calculated today actually does not differ much. Households are expected to spend 30% of their income on food, and SNAP benefits are meant to make up the difference needed in order to meet ability to purchase an adequate diet based on the Thrifty Food Plan (TFP). The TFP is the price of purchasing a low-cost (economy) market basket of goods that meet nutritional guidelines. The maximum SNAP benefit is equal to cost of the TFP with price adjustments for household size, gender, and ages of household members . ?upplemental Nutrition Assistance Program: A Short History of SNAP? United States Department of Agriculture, Food and Nutrition Services. (2009) Household Food Insecurity in the United States. 2008/ ERR-83. Economic Research Service/USDA , , http://www.cnpp.usda.gov/Publications/FoodPlans/MiscPubs/TFP2006Report.pdf The amount of benefits that each household receives for the month is calculated by multiply .3(households are expected to spend 1/3 of their income on food) by the net income of the household. This product is then subtracted from the maximum SNAP benefit possible for the household size. The resulting number from this subtraction is the monthly benefit the household receives: 0.3 x net income = product 1 ? maximum SNAP benefit possible – product 1 = monthly benefit. The notion that household spend 1/3 of their entire income on food is extremely outdated. Current households have expenses that were not imagined when the 1/3 notion was incorporated into the SNAP benefit calculation. From rises in the price of fuel, transportation, housing, and daycare to the falling purchasing power of minimum wages, struggling households often times can barely afford enough food to eat let alone spend a 1/3 of their limited income on food. http://www.fns.usda.gov/snap/applicant_recipients/eligibility.htm Approximately 30% of SNAP participants receive close to the maximum benefit. This indicates the neediest households are the ones participating in SNAP because they qualify for the highest amount of benefits possible. Despite receiving almost the maximum benefit, households still fall short of being about to purchase enough food. The calculated cost of the TFP exceeded the maximum SNAP benefits all but 3 months from fiscal year 1997 to fiscal year 2008 – that’s a 144 month span. This is because the maximum benefits are only set once a year, while food prices are notorious for being volatile. Resultantly, benefits falling short of the real cost of purchasing an adequate diet, so SNAP households cannot make it through the entire month without resorting to tactics like reducing food intake. For example, the mean food intake among infrequent shopping households (often times these are SNAP recipients because they shop only shop at the beginning of the month when they receive their benefits) falls from 83% of the RDA (Recommended Dietary Allowance) to 73.4% by the end of the month. Hanson, Kenneth, Andrews, Margaret. Rising Food Prices Take a Bite Out of Food Stamp Benefits. Economic Information Bulletin Number 41. 2008. United States Department of Agriculture, Economic Research Service. Wilde, Parke E., Ranney, Christine K. The Monthly Food Stamp Cycle: Shopping Frequency and Food Intake Decisions in an Endogenous Switching Regression Framework. Amer. J. Agr. Econ. 82 February 2000 [Create a pop out text box about the BBB Program] The lack of enough benefits to purchase food throughout the month spills over into other programs. There is a documented high need for soup kitchens and pantries by households at the end of the month. Baltimore City should create programs and initiatives to help close the food shortage gap households’ face. A program that is paving the way in closing this gap as well as supporting healthier eating and local farmers is Boston’s Bounty Bucks (BBB) Program. BBB matches EBT spending at farmers markets dollar to dollar up to $10, which means it doubles spending at markets up to $20 per recipient. The program encourages low-income households to support farmers market as well as increases the purchasing power of SNAP benefits. Funding comes from The Boston Food Project and the City of Boston. More specifically in 2007, they got started with $30,000 from the Mayor’s Fresh Food Fund and $10,000 grants from Project Bread, Wholesome Wave Foundation, and Farm Aid. Wholesome Wave Foundation already partners with three farmers’ markets in Baltimore – Waverly, Highlandtown, and Park Heights/Pimilico. Creating a similar program in Baltimore would help SNAP recipients to purchase more healthy food to last them through the month. It also financially attractive because it could help offset the cost of running EBT machines at the markets with more customers at the markets while simultaneously double current spending. In a survey at Boston’s farmers markets, 72% people using EBT said the BBB was a major deciding factor in why they decided to spend money at the markets versus a conventional store. As a testament to the success of the program, the reach of the program has been expanding to more and more markets each year: with 7 markets in 2008, 13 markets in 2009, and 21 markets in 2010. [Add in line about spending as well.] SNAP spending has $1,310 in 2008, $20,093 in 2009, and ????? in 2010. Wilde, Parke E., Ranney, Christine K. The Monthly Food Stamp Cycle: Shopping Frequency and Food Intake Decisions in an Endogenous Switching Regression Framework. Amer. J. Agr. Econ. 82 February 2000 Kim, Gina - Bill Emerson Congressional Hunger Fellow. Boston Bounty Bucks: Increasing Access to and Affordability of Fresh Fruits and Vegetables for SNAP Participants. The Boston Foods Project. 2010. They know the number of the sales. 72% in a survey said the program was important for them participating in farmers market A program to bolster the shortcomings in benefits would be well-timed with the recent cuts to SNAP. Though the recently passed Hunger-Free Kids Act improves many food and nutrition programs more than half of the funding for the bill was taken from ARRA funding that had been originally allocated towards boosting SNAP benefits. The increase in benefits from the ARRA funding were set to run out in 2014, but SNAP beneficiaries would not experience a dip in benefits because they increased benefit allotment was set to eroded to inflation by 2014. Thus, returning them to their normal level. However, because the cuts in SNAP have yet to be restored, clients will face a ?liff effects? in their benefits when 2013 rolls in. Food Research and Action Center. (2010). Dont Cut Snap to Pay For Other Priorities. Center for Law and Social Policy. (2010) Child Nutrition Passes, But Includes Ill-Advised SNAP Benefit Cut.
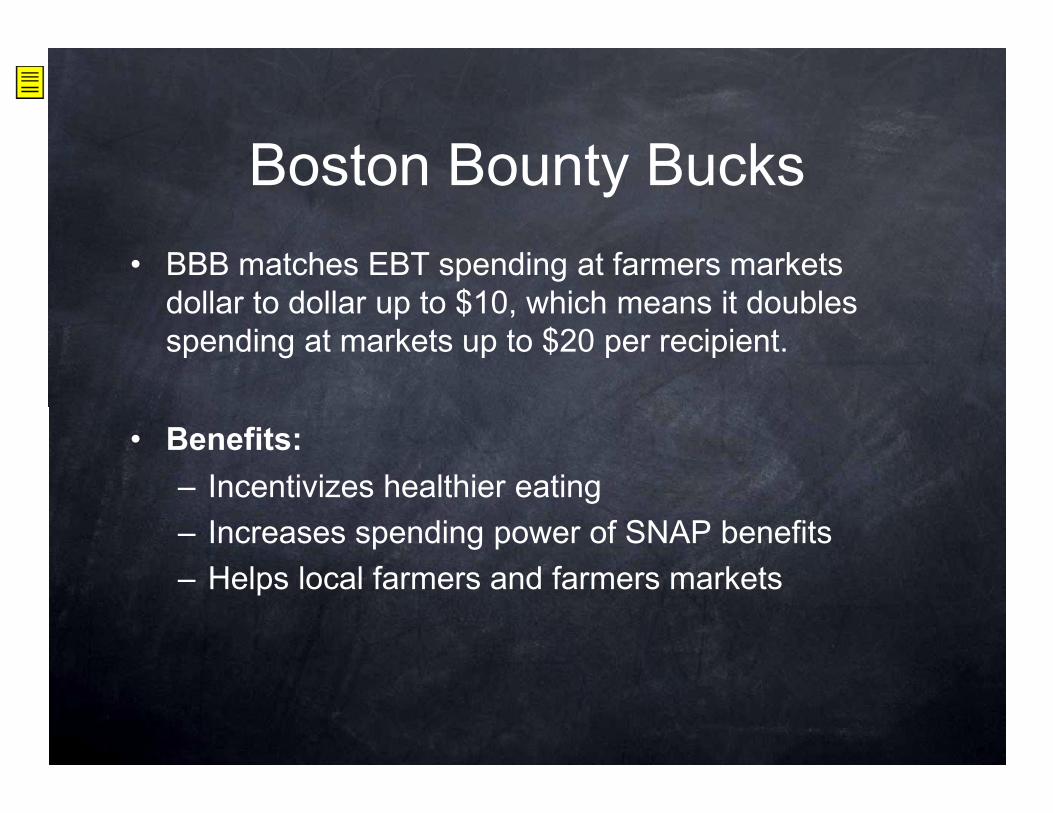
Boston Bounty Bucks
• BBB matches EBT spending at farmers markets dollar to dollar up to $10, which means it doubles spending at markets up to $20 per recipient.
• Benefits:– Incentivizes healthier eating – Increases spending power of SNAP benefits– Helps local farmers and farmers markets
A program that is paving the way in closing this gap as well as supporting healthier eating and local farmers is Boston’s Bounty Bucks (BBB) Program. BBB matches EBT spending at farmers markets dollar to dollar up to $10, which means it doubles spending at markets up to $20 per recipient. The program encourages low-income households to support farmers market as well as increases the purchasing power of SNAP benefits. Funding comes from The Boston Food Project and the City of Boston. More specifically in 2007, they got started with $30,000 from the Mayor’s Fresh Food Fund and $10,000 grants from Project Bread, Wholesome Wave Foundation, and Farm Aid. Wholesome Wave Foundation already partners with three farmers’ markets in Baltimore – Waverly, Highlandtown, and Park Heights/Pimilico. Creating a similar program in Baltimore would help SNAP recipients to purchase more healthy food to last them through the month. It also financially attractive because it could help offset the cost of running EBT machines at the markets with more customers at the markets while simultaneously double current spending. In a survey at Boston’s farmers markets, 72% people using EBT said the BBB was a major deciding factor in why they decided to spend money at the markets versus a conventional store. As a testament to the success of the program, the reach of the program has been expanding to more and more markets each year: with 7 markets in 2008, 13 markets in 2009, and 21 markets in 2010 Kim, Gina - Bill Emerson Congressional Hunger Fellow. Boston Bounty Bucks: Increasing Access to and Affordability of Fresh Fruits and Vegetables for SNAP Participants. The Boston Foods Project. 2010.
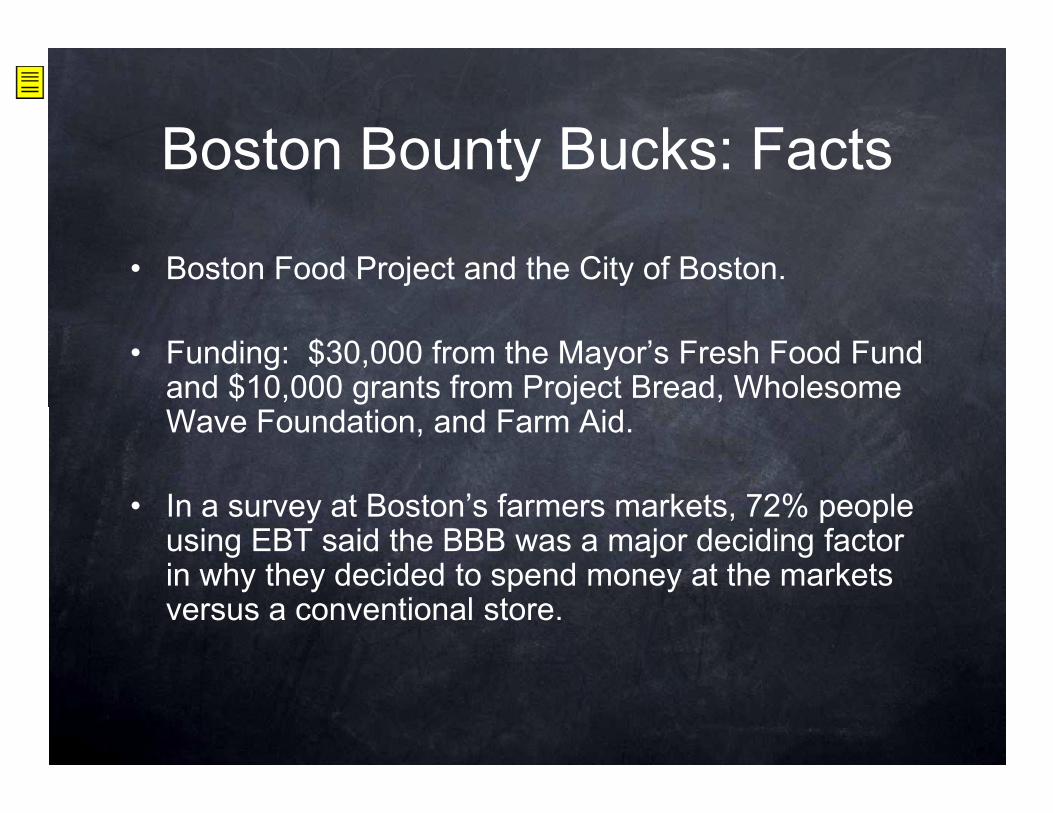
Boston Bounty Bucks: Facts
• Boston Food Project and the City of Boston.
• Funding: $30,000 from the Mayor’s Fresh Food Fund and $10,000 grants from Project Bread, Wholesome Wave Foundation, and Farm Aid. Wave Foundation, and Farm Aid.
• In a survey at Boston’s farmers markets, 72% people using EBT said the BBB was a major deciding factor in why they decided to spend money at the markets versus a conventional store.
In a survey at Boston’s farmers markets, 72% people using EBT said the BBB was a major deciding factor in why they decided to spend money at the markets versus a conventional store. As a testament to the success of the program, the reach of the program has been expanding to more and more markets each year: with 7 markets in 2008, 13 markets in 2009, and 21 markets in 2010 Wholesome Wave Foundation already partners with three farmers’ markets in Baltimore – Waverly, Highlandtown, and Park Heights/Pimilico.
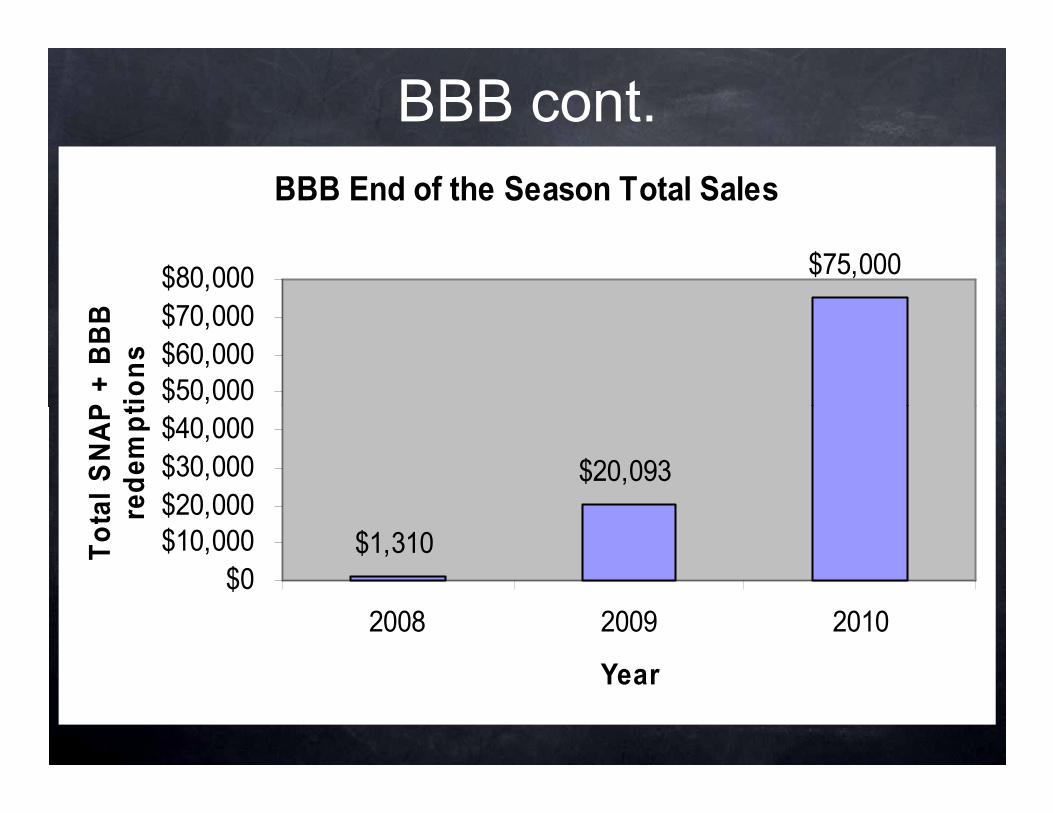
BBB cont.BBB End of the Season Total Sales
$75,000
$50,000$60,000$70,000$80,000
Total SNAP + B
BB
redem
ptions
$1,310
$20,093
$0$10,000$20,000$30,000$40,000
2008 2009 2010
Year
Total SNAP + B
BB
redem
ptions
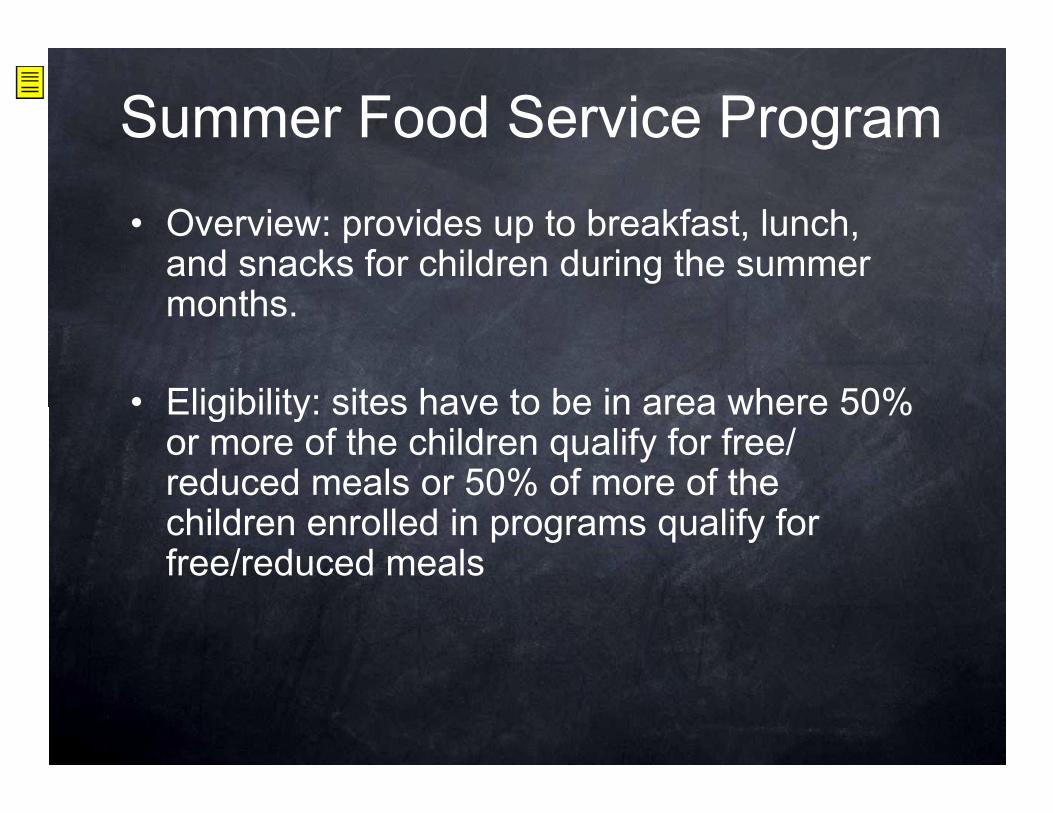
Summer Food Service Program
• Overview: provides up to breakfast, lunch, and snacks for children during the summer months.
• Eligibility: sites have to be in area where 50% • Eligibility: sites have to be in area where 50% or more of the children qualify for free/ reduced meals or 50% of more of the children enrolled in programs qualify for free/reduced meals
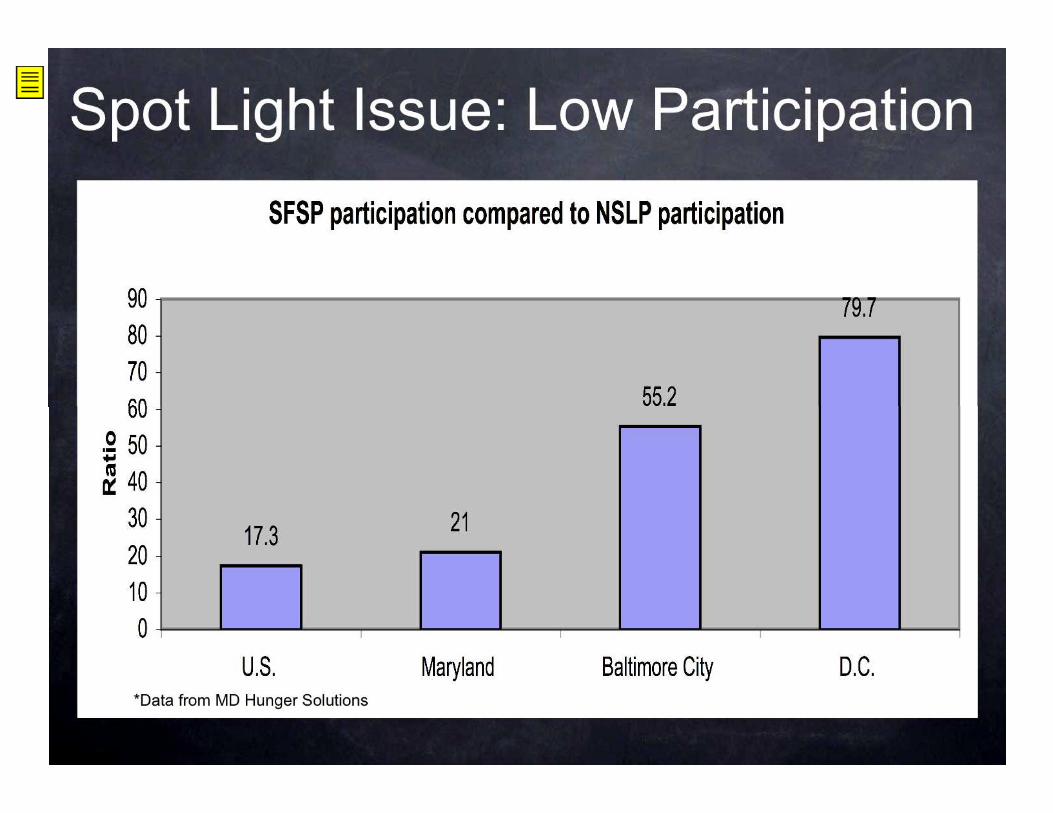
In Baltimore, obesity is an increasing concern. Disconcerting is the high prevalence of overweight and obesity among children: 19.9 % of all high school students surveyed (ages 13-18) were categorized as overweight and 18.5% obese in 2007. These numbers exceed the national prevalence in 2007: 15.8% overweight and 13% obese. Overweight is defined as ?hildren whose body mass index [BMI] exceeds the 85th percentile on the CDC’s BMI-for-age charts, while obese is defined as exceeding the 95th percentile. Meals and the selection of foods available in public schools are often attributed to being a major cause to children’s poor diet and obesity. However, a recent study shows that contrary to widely-held beliefs average BMI growth is slower during the school year than during summer. Those at risk for overweight were more likely to experience excess BMI gain when they were out of school. Hispanic and Black children were also more likely to start out with heavier BMIs than their white counterparts at the beginning of school. During the school year, however, the BMI growths for all three groups equalized to a slower growth. It is only during summer that the BMI gains of Black and Hispanic children outplace white children. The summer food and nutrition programs can serve as a weight intervention for children in Baltimore, especially students of color, and mitigate existing health disparities. Summer nutrition program can serve as an intervention point for obesity among children because it continues to provide children with a regular eating and activity routine similar to the school year. CDC Youth Online High School YRBS Baltimore, MD 2007 CDC Youth Online High School YRBS United States 2007 ?he Effect of School on Overweight in Childhood: Gain in Body Mass Index During the School Year and During Summer Vacation.? American Journal of Public Health ?he Effect of School on Overweight in Childhood: Gain in Body Mass Index During the School Year and During Summer Vacation.? American Journal of Public Health The effectiveness of the SNP is calculated by comparing participation in the NSLP during the school year to summer participation in NSLP and SFSP. Nationally, for the 2008-2009 school year, only 16.1% or 1/6 children who participated in the NSLP had access to a summer nutrition program. The state of Maryland faired better with a participation ratio of 24.2. Baltimore City had the highest country participation with a ratio of 55.2. Though Baltimore City does have a relatively high participation ratio compared to other counties and states, half of all children in Baltimore City that eat school meals during the school year still do not have access to summer nutrition programs. For the summer of 2008 there were 466 sites serving meals to 22,443 participants for Baltimore City. ?unger Doesnt Take a Vacation: Summer Nutrition Status Report 2010? Food Research and Action Center. June 2010 Policy Brief: Summer Nutrition in the Counties, May 2009. Maryland Hunger Solutions ? ?
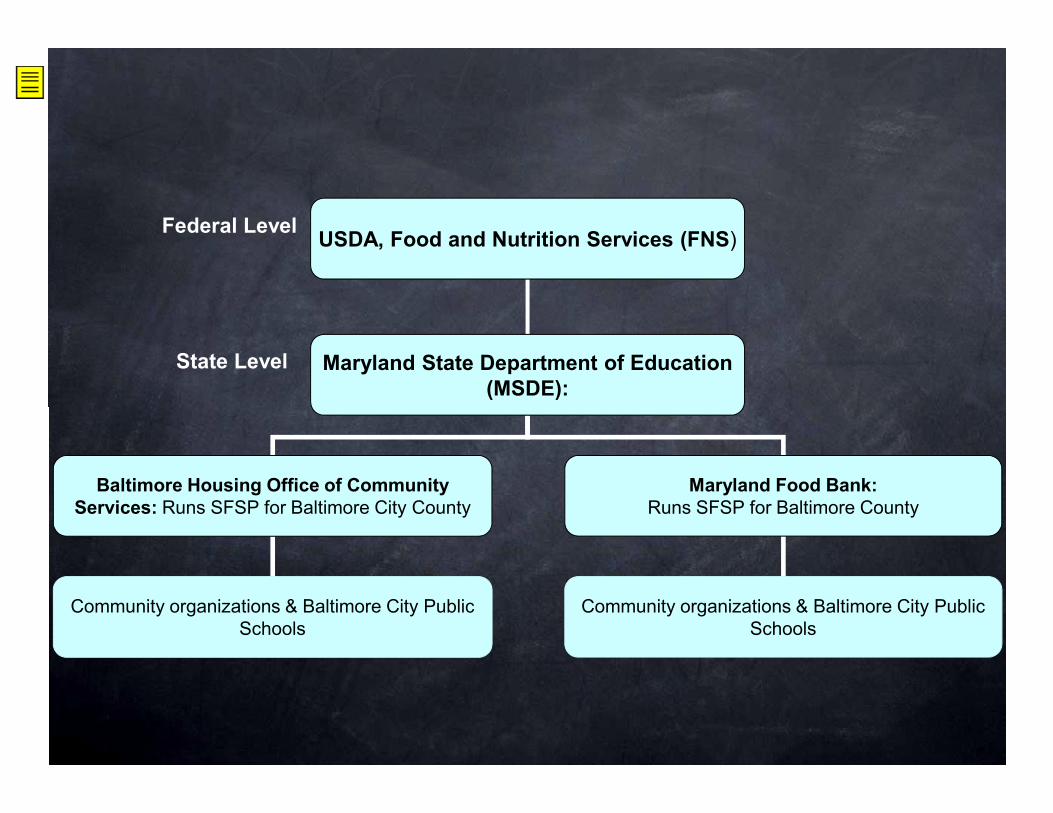
USDA, Food and Nutrition Services (FNS)
Maryland State Department of Education (MSDE):
Federal Level
State Level
Baltimore Housing Office of Community Services: Runs SFSP for Baltimore City County
Community organizations & Baltimore City Public Schools
Maryland Food Bank: Runs SFSP for Baltimore County
Community organizations & Baltimore City Public Schools
Vignette: California year-round pilot – may not be possible yet but should build up programs as to make it easy to convert over
Great that ratio is so high but when you think of it in actual numbers nearly 20,000 other eligible students aren’t participating in program. Low reimbursement rates for sponsors Lack of funding for start-up cost Difficult application process for sites Restrictions on # of non-profit organization sites California Year-round Pilot
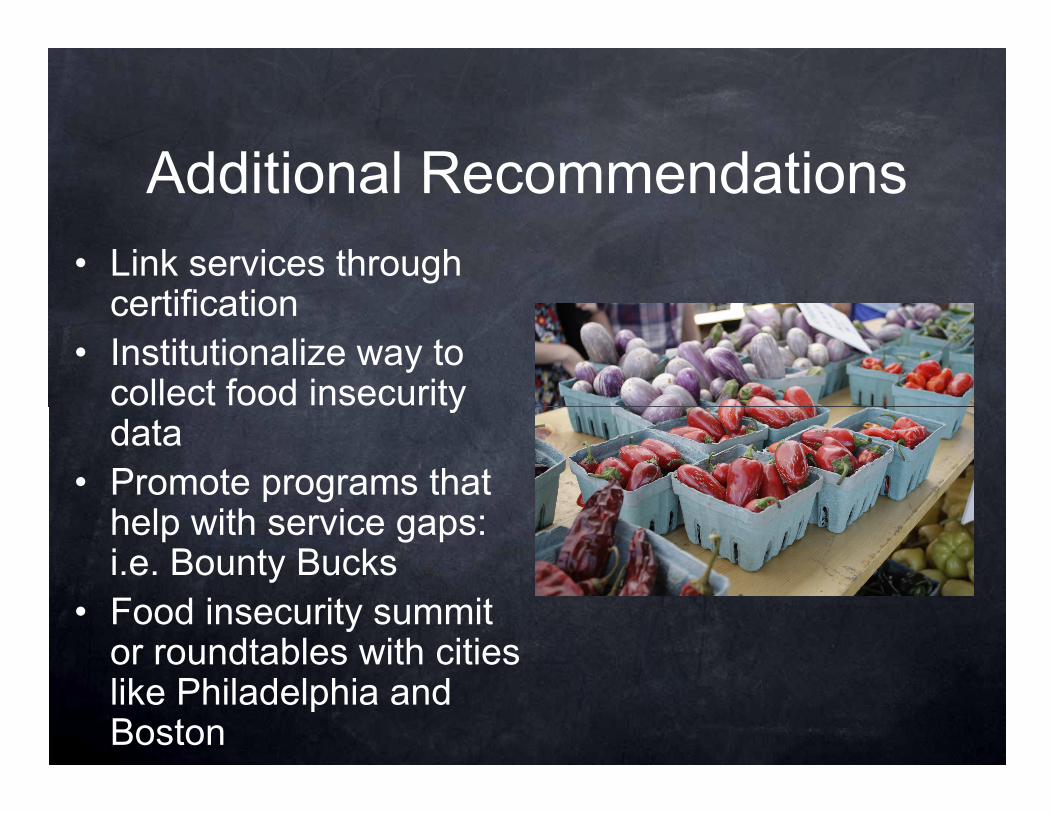
Additional Recommendations • Link services through certification
• Institutionalize way to collect food insecurity collect food insecurity data
• Promote programs that help with service gaps: i.e. Bounty Bucks
• Food insecurity summit or roundtables with cities like Philadelphia and Boston
Work for the Future
• Continue to institutionalize ways of collecting food insecurity data
• Research on cross-utilization of programs
• Collect qualitative data from clients
BCHD plans on adding two food insecurity questions (used by the University of Maryland) into this upcoming Community Health Survey Cross utilitization data: how strong are the chain links in the food safety net? Eligibility are not an congruous, however, many clients are eligible for several programs how well is the system working to reduce redunancy and certification on the provider side? Collect data and survey on cross utilization But also get client perspectives about barriers It would be the ultimate benefit to include a client voice in improving programs because ultimately if they view it as being to difficult to enroll then everyone loses out, especially the children
Hands in PartnershipCivic Works & Clifton FarmMoveable FeastBaltimore City Head StartBureau of Maternal and Infant CareFood and Nutrition Services, Baltimore City Public SchoolsCenter for a Livable FutureBaltimore Montessori SchoolDepartment of Human ResourcesUniversity of Maryland School of NursingOffice of SustainabilityAmazing Grace Lutheran ChurchCharm City Clinic
Thank You!Charm City ClinicStadium SchoolJohns Hopkins WIC ClinicHampstead Hill Elementary Baltimore Green SpaceMaryland Hunger SolutionsKodem Kol: Kennedy KriegerWaverly Farmer's MarketSoutheast Baltimore Early Head StartPark Heights Family Support CenterThe BaltimarketsMaryland Food BankWolfe Street AcademyBaltimore CASH Campaign