Embed Size (px)
Citation preview

FOOD PROCESSING INDUSTRY REPORT Q2/2018

Abbreviation 3 3.2. Major groups in the industry 64
Executive summary 4 3.2.1 Processed seafood 65
1. Business environment 8 3.2.2 Canned meat and other meat products processing 74
1.1 Macroeconomic situation 9 3.2.3 Fresh and processed fruit-vegetables 86
1.2 Legal framework 15 3.2.4 Processed starch 95
1.3 Trade agreements 22 3.2.5Other food (sugar, confectionery, noodle, ready-made
food)105
2. World market 27 4 Industry risks 131
2.1 Definition and classification 28 4.1 SWOT analysis 132
2.2. Food processing industry overview 29 4.2 Risk analysis 134
2.3 Major groups in the industry 34 5 Outlook and forecast 137
2.3.1 Processed seafood 35 5.1 Industry development planning 138
2.3.2 Processed meat 39 5.2 Outlook 140
2.3.4 Fresh and processed fruit-vegetables 43 5.3 Forecast 142
2.3.5 Processed starch 47 6 Enterprise analysis 144
2.4 Processed food markets in some big countries 51 6.1 Enterprise introduction 145
2.5 Big companies in food processing industry 59 6.2 Financial analysis 154
3 Vietnam market 61 7 Appendix of financial statements 164
3.1 History of industry formation and development 62
Content
2

FS Food safety FDA Food and Drug Administration
FHAS Food hygiene and safety FIA Foreign Investment Department
MARD Ministry of Agriculture and Rural
DevelopmentFSMA Food Safety Modernization Act
CCI Consumer confidence index Ltd Limited
JSC Joint-stock company GSO General Statistics Office
CS Cost of sales GDVC General Department of Vietnam Customs
ECM Enterprise Cost Management USDA United States Department of Agriculture
NR Net revenue OECDOrganization for Economic Cooperation and
Development
EIU Economist Intelligence Unit FAO The World Food Organization
Abbreviation
3

4
Executive summary
• Global food processing industry has a value of more than USD 2,000
billion with over 400,000 enterprises.
• Global processed seafood market reached a revenue of USD 202 billion
in 2017
• Global processed seafood trade in 2017 was estimated tp be valued at
USD 27.82 billion, a sharp increase of 20.6% compared to 2016. The
United States and Japan are the two countries having the largest
processed seafood import turnover in the world in both 2016 and 2017,Content is intentionally removed for demo purpose

5
Executive summary
• Global processed fruit and vegetables market was estimated to reach
USD 245.97 billion in 2017 and is expected to reach USD 346.05 billion
in 2022 with a CAGR of 7.1% in the period of 2018 – 2022.
• Corn starch is most produced and used in the world and mainly in food
processing industry.
• China ranked second in top largest starch importing countries in 2016
and 2017.
• Starch exports of Thailand declined to the 4th position in 2017
compared to the second in 2016 due to a decrease in cassava starch
because of unfavourable weather condition.
Content is intentionally removed for demo purpose

6
Executive summary
• In Q1/2018, frozen seafood output reached 327.3 thousand tons.
• Canned seafood consumption in 2017 was estimated to reach VND
10,602 billion, increasing by 15% compared to 2016, in which, canned
tuna is currently the most favourable product.
• Processed seafood exports in Q1/2018 was estimated to reach USD
121.3 million, slightly increasing by 5% compared to the same period in
2017
• Canned meat production in Q1/2018 reached 1,768 tons, increasing by
9% compared to the same period in 2017.
Content is intentionally removed for demo purpose
7
Executive summary
• Cassava starch prices tended to increase in Q1/2018, which is the
motivation to boost cassava starch productionContent is intentionally removed for demo purpose

8
1. Business environment
1.1 Macroeconomic situation
1.2 Legal framework
1.3 Trade agreements
Content
9
Source: VIRAC, GSO
GDP growth rate by quarter, 2015 - Q1/2018
Source: VIRAC, GSO
%
GDP at current prices and GDP per capita, 2013 - Q1/2018
VND trillionUSD
1. Business environment
1.1 Macroeconomic situation
Content is intentionally removed for demo purpose

10
Source: VIRAC, EIU
Source: VIRAC, GSOSource: VIRAC, GSO
VND trillion
1. Business environment
1.1 Macroeconomic situation
Industrial production value of food processing and producing industry, 2009 - 2017 Industrial production index of food processing industry, 2012 -
Q1/2018
Consumption structure in Vietnam, 2017
Content is intentionally removed for demo purpose

11
Source: VIRAC, Nielsen
Source: VIRAC, GSO
VND trillion
1. Business environment
1.1 Macroeconomic situation
Retails sales of goods, 2010 - Q1/2018
Consumer Confidence Index by quarter, 2014 - Q4/2017
Content is intentionally removed for demo purpose

12
Source: VIRAC, GSO
Monthly CPI fluctuation 2014 – 3/2018
1. Business environment
1.1 Macroeconomic situation
Content is intentionally removed for demo purpose

13
Source: VIRAC, Economist Intelligence Unit
Total disposable income and household expenditures, 2010–
2017f
Source: VIRAC, GSO
USD
billion
1. Business environment
1.1 Macroeconomic situation
Retail sales in Vietnam 2011–2017F
Content is intentionally removed for demo purpose

14
Source: VIRAC, FIA, GSO
Source: VIRAC, FIA
USD billion
1. Business environment
1.1 Macroeconomic situation
FDI capital in agriculture investment, 2009 - Q1/2018
FDI Structure in agriculture,2015
Content is intentionally removed for demo purpose

15
1. Business environment
1.1 Macroeconomic situation
1.2 Legal framework
1.3 Trade agreements
Content

16
1. Business environment
1.2 Legal framework
Domestic policy
• Food safety law by the National assembly on 17/06/2010 . This law regulated for the rights and obligations for organization and individuals
Content is intentionally removed for demo purpose

17
1. Business environment
1.2 Legal framework
Content is intentionally removed for demo purpose

18
1. Business environment
1.2 Legal framework
Content is intentionally removed for demo purpose

19
1. Business environment
1.2 Legal framework
Content is intentionally removed for demo purpose
20
1. Business environment
1.2 Legal framework
Policy of export market
Content is intentionally removed for demo purpose
21
1. Business environment
1.2 Legal framework
Content is intentionally removed for demo purpose

22
1. Business environment
1.1 Macroeconomic situation
1.2 Legal framework
1.3 Trade agreements
Content

23
1. Business environment
1.3. Trade agreements
The list of FTAs that Vietnam has signed and will sign
Source: VIRAC
Content is intentionally removed for demo purpose

24
The tariff preferences in the Vietnam - EU Free Trade Agreement (EVFTA) will provide an undeniable opportunity for Vietnamese seafood exporters to
enter the European Union markets
1. Business environment
1.3. Trade agreements
Content is intentionally removed for demo purpose

25
1. Business environment
1.3. Trade agreements
Content is intentionally removed for demo purpose

26
SWOT Matrix food processing industry when joining FTAs
Cơ hội Nguy cơ
Điểm yếu Điểm mạnh
1. Business environment
1.3. Trade agreements
Content is intentionally removed for demo purpose

27
2. World market
2.1 Definition and classification
2.2. Food processing industry overview
2.3 Major groups in the industry
2.4 Processed food markets in some big countries
2.5 Big companies in food processing industry
Content

28
2. World market
2.1. Definition and classification
Source: VIRAC
The structure of the food processing industry
Content is intentionally removed for demo purpose

29
2. World market
2.1 Definition and classification
2.2. Food processing industry overview
2.3 Major groups in the industry
2.4 Processed food markets in some big countries
2.5 Big companies in food processing industry
Content

30
Main activity
Main factor
2. World market
2..2. Food processing industry overview- 2.2.1. Value chain
Value chain of the food processing industry
Source: VIRAC
Content is intentionally removed for demo purpose

31
2. World market
2..2. Food processing industry overview- 2.2.2. Industry scale
Source: VIRAC, Statisticbrain
Source: VIRAC, Statisticbrain
Content is intentionally removed for demo purpose
Proportion of food consumption in the world, 2016
The structure of processed meat consumption in the world, 2016
32
2. World market
2..2. Food processing industry overview- 2.2.2. Industry scale
Source: VIRAC, Statisticbrain
Source: VIRAC, Statisticbrain
USD
billion
Turnover of food processing market in the world
2014 - 2019F
Content is intentionally removed for demo purposeThe proportion of ready-to-eat food consumption, 2016

33
Global food processing machinery market achieved 52,787 million USD in 2016 and is forecasted to reach 68,882 million USD in 2023
2. World market
2..2. Food processing industry overview- 2.2.3. Machinery and technology market for food processing industry
Content is intentionally removed for demo purpose

34
2. World market
2.1 Definition and classification
2.2. Food processing industry overview
2.3 Major groups in the industry
2.4 Processed food markets in some big countries
2.5 Big companies in food processing industry
Content

35
Source: VIRAC, Statista
Source: VIRAC, Statista
Million
tons
USD
billion
2. World market
2.3. Major groups in the industry – 2.3.1. Processed seafood
Global seafood trade, 2008 – 2017e
Global fish production, 2010 - 2017e
Content is intentionally removed for demo purpose

36
2. World market
2.3. Major groups in the industry – 2.3.1. Processed seafood
Content is intentionally removed for demo purpose

37
2. World market
2.3. Major groups in the industry – 2.3.1. Processed seafood
Content is intentionally removed for demo purpose

38
USD
million
USD
million
2. World market
2.3. Major groups in the industry – 2.3.1. Processed seafood
Source: VIRAC, Uncomtrade
Source: VIRAC, Uncomtrade
USD
billion
Source: VIRAC, Uncomtrade
Processed seafood trade, 2012 – 2017e
Top largest seafood exporting countries, 2016 - 2017
(HS 1604)
Top largest seafood importing countries, 2016 - 2017
(HS 1604)
Content is intentionally removed for demo purpose
39
Million
tons
Source: VIRAC, USDA
Million
tons
2. World market
2.3. Major groups in the industry – 2.3.2. Processed meat
Source: VIRAC, USDA
Global production of main types of meat, 2013 - 2017f
Global consumption of main types of meat, 2010 - 2017f
Content is intentionally removed for demo purpose

40
2. World market
2.3. Major groups in the industry – 2.3.2. Processed meat
Content is intentionally removed for demo purpose

41
2. World market
2.3. Major groups in the industry – 2.3.2. Processed meat
Content is intentionally removed for demo purpose

42
USD
billion
Source: VIRAC, Uncomtrade
2. World market
2.3. Major groups in the industry – 2.3.2. Processed meat
Source: VIRAC, Uncomtrade
USD
million
USD million
Source: VIRAC, Uncomtrade
Global processed meat trade, 2012 – 2017e
Top largest processed meat importing countries,
2016 - 2017 (HS 1602)
Top largest processed meat exporting countries,
2016 - 2017 (HS 1602)Content is intentionally removed for demo purpose

43
5 leading meat processing companies in the world
WH Corporation (China)
JBS Foods International (Brazil)
Smithfield Foods (USA)
JBS USA (USA)
Danish Crown (Denmark)
Content is intentionally removed for demo purpose
2. World market
2.3. Major groups in the industry – 2.3.2. Processed meat
44
Source: VIRAC, Statista
Source: VIRAC, Statista
Million
tons
Million tons
2. World market
2.3. Major groups in the industry – 2.3.3. Fresh and processed fruit-vegetables
Global vegetables production, 2009 - 2016
Top largest fresh vegetable – fruit producing countries in the world, 2016
Content is intentionally removed for demo purpose

45
USD
billion
Source: VIRAC, Statista
Source: VIRAC, Statista
2. World market
2.3. Major groups in the industry – 2.3.3. Fresh and processed fruit-vegetables
Scale of global vegetable fruit processing market, 2010 - 2022F
Structure of global processed vegetable fruit consumption market, 2015
Content is intentionally removed for demo purpose

46
Source: VIRAC, Statista
2. World market
2.3. Major groups in the industry – 2.3.3. Fresh and processed fruit-vegetables
Structure of processed fruit and vegetables by variety, 2015
Content is intentionally removed for demo purpose
47
USD
billion
USD
billionUSD
billion
Source: VIRAC, Statista
Source: VIRAC, StatistaSource: VIRAC, Trade map
2. World market
2.3. Major groups in the industry – 2.3.3. Fresh and processed fruit-vegetables
Global processed fruit and vegetable trade, 2012 - 2017e
Top largest fruit and vegetable importers, 2016 - 2017
Top largest fruit and vegetable exporters, 2016 - 2017
Content is intentionally removed for demo purpose
48
Source: VIRAC, Statista
Source: VIRAC, Statista
Million
tons
Million
tons
Source: VIRAC, Eurosta
2. World market
2.3. Major groups in the industry – 2.3.4. Processed starch
Production and consumption of global cereals by season,
2011/12 – 2016/17 Million
tons
World's top largest cereal producing countries, 2015
Global cereal production in 2016/2017 by type
Content is intentionally removed for demo purpose

49
2. World market
2.3. Major groups in the industry – 2.3.4. Processed starch
Million tons
Source: VIRAC, EUstarch
Global starch production capacity by type of material, 2015
Content is intentionally removed for demo purpose

50
Source: VIRAC, Starch EU
2. World market
2.3. Major groups in the industry – 2.3.4. Processed starch
Source: VIRAC, Transparency Market Research
Application structure of starch, 2016
Production structure of corn starch products in the world, 2016Content is intentionally removed for demo purpose

51
Source: VIRAC, Trade map
2. World market
2.3. Major groups in the industry – 2.3.4. Processed starch
Source: VIRAC, Trade map
USD
million
USD
million
Top largest starch importing countries, 2016 - 2017
Top largest starch exporting countries, 2016 - 2017
Content is intentionally removed for demo purpose

52
2. World market
2.1 Definition and classification
2.2. Food processing industry overview
2.3 Major groups in the industry
2.4 Processed food markets in some big countries
2.5 Big companies in food processing industry
Content

53
Kg/person/year
Source: VIRAC, Statista
2. World market
2.4. Processed food markets in some big countries – 2.4.1. China
Consumption of some types of food per capita in China, 2013
- 2017
Content is intentionally removed for demo purpose

54
2. World market
2.4. Processed food markets in some big countries – 2.4.1. China
Source: VIRAC, USDA
Source: VIRAC, USDA
Revenue of China's food processing industry, 2011 - 2015
Number of enterprises in the food processing industry in China, 2011 -
2015
Content is intentionally removed for demo purpose

55
2. World market
2.4. Processed food markets in some big countries – 2.4.1. China
USD million
Source: VIRAC, Statista
Source: VIRAC, Statista
USD/person/year
Processed seafood consumption in China, 2010 - 2017f
Processed seafood consumption per capita in China, 2010 - 2017f
Content is intentionally removed for demo purpose

56
Commodity 2012 2013 2013 2015 2016
2. World market
2.4. Processed food markets in some big countries – 2.4.1. China
Import value of processed food products of China, 2012 – 2016 (Unit: 100 USD million)
Source: VIRAC, USDA
Content is intentionally removed for demo purpose

57
USD billion
Source: VIRAC, Statista
Source: VIRAC, StatistaSource: VIRAC, Statista
2. World market
2.4. Processed food markets in some big countries – 2.4.2. The United States
USD billion USD/shop/week
Processed meat consumption in the United States, 2009 - 2014
Sales of top US meat processing companies, 2016Retail sales of processed meat products in the United States, 2017
Content is intentionally removed for demo purpose

58
USD million
Source: VIRAC, Statista
2. World market
2.4. Processed food markets in some big countries – 2.4.2. The United States
USD/person/year
Source: VIRAC, Statista
Source: VIRAC, Statista
Sales and consumption of processed seafood in the United
States, 2010 - 2017f Thousand tons
Consumption of processed seafood per capita in the United States, 2010 - 2017fConsumption structure of canned seafood, 2015
Content is intentionally removed for demo purpose

59
Source: VIRAC, Statista
Source: VIRAC, Statista
2. World market
2.4. Processed food markets in some big countries – 2.4.2. The United States
Labor structure in the US food and beverage industry, 2015
Top 10 companies having the largest revenue from processed food in the
United States and Canada, 2015 - 2016Content is intentionally removed for demo purpose

60
2. World market
2.1 Definition and classification
2.2. Food processing industry overview
2.3 Major groups in the industry
2.4 Processed food markets in some big countries
2.5 Big companies in food processing industry
Content
61
Company name
Revenue
2015 (USD
billion)
Profit 2015
(USD
billion)
Number of
staffGeneral information
2. World market
2.5. Big companies in food processing industry
Content is intentionally removed for demo purpose

62
3 Vietnam market
3.1 History of industry formation and development and M&A activities
3.2. Major groups in the industry
3.2.1 Processed seafood
3.2.2 Canned meat and other meat products processing
3.2.3 Processed fruit and vegetables
3.2.4 Processed starch
3.2.5 Other food (sugar, confectionery, noodle, ready-made food
Content

63
3. Vietnam market
3.1. History of industry formation and development and M&A activities
Content is intentionally removed for demo purpose

64
3. Vietnam market
3.1. History of industry formation and development and M&A activities
Content is intentionally removed for demo purpose
65
3 Vietnam market
3.1 History of industry formation and development
3.2. Major groups in the industry
3.2.1 Processed seafood
3.2.2 Canned meat and other meat products processing
3.2.3 Fresh and processed fruit-vegetables
3.2.4 Processed starch
3.2.5 Other food (sugar, confectionery, noodle, ready-made food)
Content

66
3. Vietnam market
3.2. Major groups in the industry – 3.2.1. Processed seafood - Overview
Source: VIRAC, GSO
Source: VIRAC, GSO
Number of enterprises and employees in dried and canned seafood
processing, 2010 - 2016
Distribution of dried and canned seafood processing enterprises by
region, 2010 - 2016
Content is intentionally removed for demo purpose

67
3. Vietnam market
3.2. Major groups in the industry – 3.2.1. Processed seafood – Overview
Source: VIRAC, GSO
Source: VIRAC, GSO
Revenue and profit of dried and canned seafood processing
industry, 2010 - 2016
Investment capital and fixed assets of dried and canned
seafood processing, 2010 - 2016
Content is intentionally removed for demo purpose

68
Production process of canned fish
3. Vietnam market
3.2. Major groups in the industry – 3.2.1. Processed seafood – Production process
Source: VIRAC
Content is intentionally removed for demo purpose

69
Seafood production from fishing and farming, 1995 – 2017e
Source: VIRAC, GSO
Thousand tons
3. Vietnam market
3.2. Major groups in the industry – 3.2.1. Processed seafood – Raw materials
Content is intentionally removed for demo purpose

70
Source: VIRAC, GSO
Thousand tons
Source: VIRAC, GSO
Thousand tons
3. Vietnam market
3.2. Major groups in the industry – 3.2.1. Processed seafood – Production
Dried seafood production, 2010 - Q1/2018e
Canned seafood production, 2010 - Q1/2018e
Content is intentionally removed for demo purpose

71
Source: VIRAC, GSO
Frozen seafood production, 2011 – Q1/2018e
Thousand
tons
3. Vietnam market
3.2. Major groups in the industry – 3.2.1. Processed seafood – Production
Content is intentionally removed for demo purpose

72
Source: VIRAC, GSO
Source: VIRAC, GSO
3. Vietnam market
3.2. Major groups in the industry – 3.2.1. Processed seafood – Consumption
Consumption value of canned seafood, 2010 - Q1/2018e
Consumption value of dried seafood, 2010 - Q1/2018eContent is intentionally removed for demo purpose

73
Source: VIRAC, GDVC
3. Vietnam market
3.2. Major groups in the industry – 3.2.1. Processed seafood – Import export
Export of processed and preserved seafood products, 2012 -
Q1/2018e
Content is intentionally removed for demo purpose
74
Source: VIRAC, GDVC
Source: VIRAC, GDVC
3. Vietnam market
3.2. Major groups in the industry – 3.2.1. Processed seafood – Import export
Top largest importers of processed and preserved seafood products, Q1/2018
Import of processed and preserved seafood products, 2012 -
Q1/2018e
Content is intentionally removed for demo purpose

75
3 Vietnam market
3.1 History of industry formation and development
3.2. Major groups in the industry
3.2.1 Processed seafood
3.2.2 Canned meat and other meat products processing
3.2.3 Fresh and processed fruit-vegetables
3.2.4 Processed starch
3.2.5 Other food (sugar, confectionery, noodle, ready-made food)
Content
76
Source: VIRAC, GSO
Source: VIRAC, GSO
3. Vietnam market
3.2. Major groups in the industry – 3.2.2. Canned meat and other meat products processing – Raw materials
Number of enterprises and employees in meat products processing
industry, 2010 - 2016
Distribution of meat processing enterprises, 2010 - 2016Content is intentionally removed for demo purpose
77
Source: VIRAC, GSO
3. Vietnam market
3.2. Major groups in the industry – 3.2.2. Canned meat and other meat products processing – Raw materials
Revenue and profit of meat products processing industry,
2010 - 2016
Investment capital and fixed assets of meat product
processing industry, 2010 - 2016
Content is intentionally removed for demo purpose
78
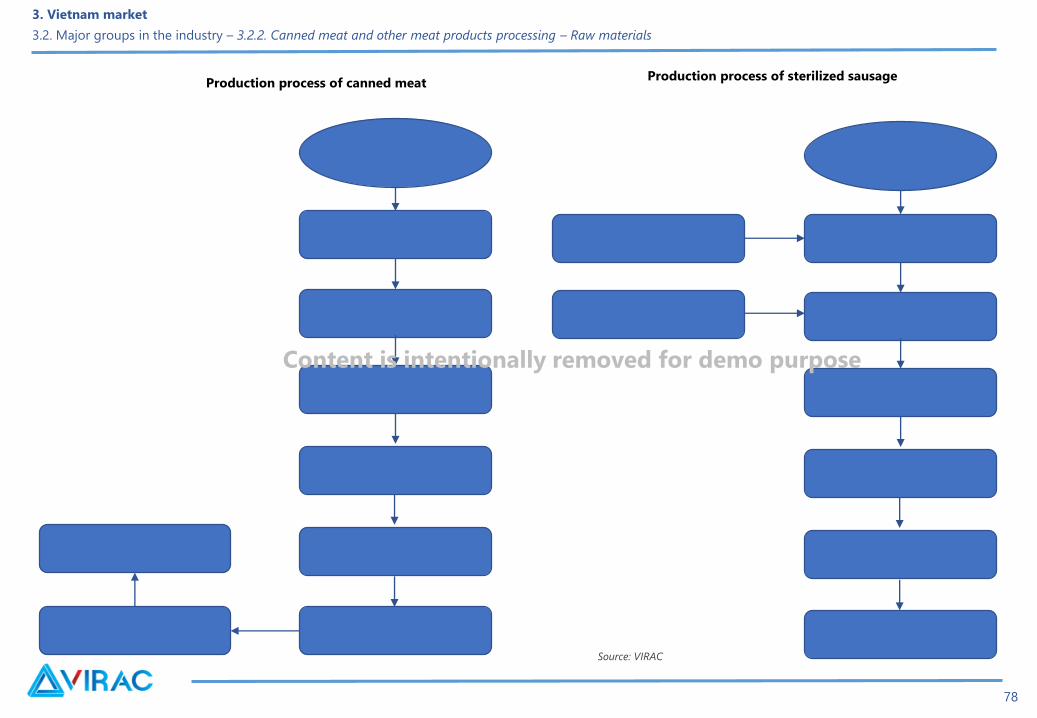
Production process of sterilized sausageProduction process of canned meat
Source: VIRAC
3. Vietnam market
3.2. Major groups in the industry – 3.2.2. Canned meat and other meat products processing – Raw materials
Content is intentionally removed for demo purpose

79
Thousand tons
Source: VIRAC, MARD
3. Vietnam market
3.2. Major groups in the industry – 3.2.2. Canned meat and other meat products processing – Raw materials
Meat production, 2010 - 2017
Content is intentionally removed for demo purpose

80
Pork price fluctuation, 2016 – 2/2018
Source: VIRAC, MARD
VND/kg
3. Vietnam market
3.2. Major groups in the industry – 3.2.2. Canned meat and other meat products processing – Raw materials
Content is intentionally removed for demo purpose

81
Ton
Source: VIRAC, GSO
3. Vietnam market
3.2. Major groups in the industry – 3.2.2. Canned meat and other meat products processing – Raw materials
Canned meat production, 2010 - Q1/2018e
Content is intentionally removed for demo purpose

82
Source: VIRAC, GSO
Ton
3. Vietnam market
3.2. Major groups in the industry – 3.2.2. Canned meat and other meat products processing – Raw materials
Production of other processed meat products, 2010 - Q1/2018e
Content is intentionally removed for demo purpose

83
VND billion
Source: VIRAC, GSO
3. Vietnam market
3.2. Major groups in the industry – 3.2.2. Canned meat and other meat products processing – Raw materials
Consumption value of meat products, 2010 - Q1/2018e
Content is intentionally removed for demo purpose

84
Source: VIRAC, Euromonitor
Source: VIRAC, Euromonitor
3. Vietnam market
3.2. Major groups in the industry – 3.2.2. Canned meat and other meat products processing – Raw materials
Market share of the top 10 processed seafood and meat
consuming enterprises, 2017
Vissan's market share in processed meat sector, 2016
Content is intentionally removed for demo purpose

85
Source: VIRAC, GDVC
USD million
Source: VIRAC, GDVC
3. Vietnam market
3.2. Major groups in the industry – 3.2.2. Canned meat and other meat products processing – Raw materials
Top largest importers of processed meat products, Q1/2018
Import turnover of processed meat products,
2010 - Q1/2018e
Content is intentionally removed for demo purpose
86
Source: VIRAC, Uncomtrade
USD million
3. Vietnam market
3.2. Major groups in the industry – 3.2.2. Canned meat and other meat products processing – Raw materials
Export turnover of processed meat products,
2010 - Q1/2018e
Content is intentionally removed for demo purpose
87
3 Vietnam market
3.1 History of industry formation and development
3.2. Major groups in the industry
3.2.1 Processed seafood
3.2.2 Canned meat and other meat products processing
3.2.3 Fresh and processed fruit-vegetables
3.2.4 Processed starch
3.2.5 Other food (sugar, confectionery, noodle, ready-made food)
Content

88
Source: VIRAC, GSO
Source: VIRAC, GSO
3. Vietnam market
3.2. Major groups in the industry – 3.2.3. Fresh and processed fruit-vegetables - Overview
Number of enterprises and employees in fruits and vegetables
processing sector, 2010 - 2016
Distribution of fruit and vegetable processing enterprises
by region, 2010 - 2016
Content is intentionally removed for demo purpose

89
VND billion
VND billion
Source: VIRAC, GSO
Source: VIRAC, GSO
3. Vietnam market
3.2. Major groups in the industry – 3.2.3. Fresh and processed fruit-vegetables - Overview
Revenue and profit of fruit and vegetable processing
sector, 2010 - 2016
Investment capital and fixed assets of fruits and vegetables processing sector,
2010 - 2016
Content is intentionally removed for demo purpose

90
Source: VIRAC, GSO
Source: VIRAC, GSO
3. Vietnam market
3.2. Major groups in the industry – 3.2.3. Fresh and processed fruit-vegetables - Raw materials
Cultivated area of fruit trees in Vietnam, 2008 - 2017
Fruit production, 2008 - 2016 (*)
Content is intentionally removed for demo purpose

91
Thousand tons
Source: VIRAC, GSO
Source: VIRAC, GSO
3. Vietnam market
3.2. Major groups in the industry – 3.2.3. Fresh and processed fruit-vegetables - Production
Production output of canned vegetables and fruits, 2010 - Q1/2018e
Production output of fresh vegetable juice, 2010 - Q1/2018e
Thousand tons
Content is intentionally removed for demo purpose
92
Source: VIRAC, Euromonitor
VND billion
Source: VIRAC, Euromonitor
3. Vietnam market
3.2. Major groups in the industry – 3.2.3. Fresh and processed fruit-vegetables - Consumption
Consumption value of canned and dried fruit vegetables in Vietnam,
2010 - Q1/2018e Market share of processed fruits and vegetables, 2017
Content is intentionally removed for demo purpose

93
Source: VIRAC, GDVC
Source: VIRAC, GDVC
USD
million
3. Vietnam market
3.2. Major groups in the industry – 3.2.3. Fresh and processed fruit-vegetables - Import export
Export turnover of processed fruits and vegetables, 2010 - Q1/2018e
Export structure of vegetables and fruits of Vietnam to EU, 2016
Content is intentionally removed for demo purpose

94
Source: VIRAC, GDVC
3. Vietnam market
3.2. Major groups in the industry – 3.2.3. Fresh and processed fruit-vegetables - Import export
Export market structure of processed fruit and vegetables, 2016
Content is intentionally removed for demo purpose

95
Source: VIRAC, GDVC
Source: VIRAC, TCQ
USD
million
3. Vietnam market
3.2. Major groups in the industry – 3.2.3. Fresh and processed fruit-vegetables - Import export
Import value of processed fruits and vegetables, 2010 - Q1/2018e
Import market structure of processed fruit and vegetables, 2016
Content is intentionally removed for demo purpose

96
3 Vietnam market
3.1 History of industry formation and development
3.2. Major groups in the industry
3.2.1 Processed seafood
3.2.2 Canned meat and other meat products processing
3.2.3 Fresh and processed fruit-vegetables
3.2.4 Processed starch
3.2.5 Other food (sugar, confectionery, noodle, ready-made food)
Content

97
Source: VIRAC, GSO
Source: VIRAC, GSO
3. Vietnam market
3.2. Major groups in the industry – 3.2.4. Processed starch – Overview
Number of enterprises and employees in starch and starch
product processing sector, 2010 - 2016
Distribution of starch and starch product processing
enterprises by region, 2010 - 2016
Content is intentionally removed for demo purpose

98
Source: VIRAC, GSO
Source: VIRAC, GSO
3. Vietnam market
3.2. Major groups in the industry – 3.2.4. Processed starch – Overview
Revenue and profit of starch and starch product processing
sector, 2010 - 2016
Investment Capital and fixed assets of starch and starch
product processing sector, 2010 - 2016Content is intentionally removed for demo purpose

99
Process of starch production
3. Vietnam market
3.2. Major groups in the industry – 3.2.4. Processed starch – Production process
Source: VIRAC
Content is intentionally removed for demo purpose
100
Source: VIRAC, GSO
3. Vietnam market
3.2. Major groups in the industry – 3.2.4. Processed starch – Raw materials
Cultivated area and output of cassava, 2010 - 2017
Content is intentionally removed for demo purpose

101
Source: VIRAC, GSO
Thousand tons
Source: VIRAC, GSO
3. Vietnam market
3.2. Major groups in the industry – 3.2.4. Processed starch – Production
Production of starch and starch products, 2010 - Q1/2018e
Starch production structure in Vietnam, 2017
Content is intentionally removed for demo purpose

102
Source: VIRAC, GSO
Source: VIRAC, GSO
3. Vietnam market
3.2. Major groups in the industry – 3.2.4. Processed starch – Consumption
Consumption value of starch and starch products, 2010 - Q1/2018e
Use of cassava starch in Vietnam, 2016
Content is intentionally removed for demo purpose

103
Source: VIRAC, GDVC
Source: VIRAC, GDVC
3. Vietnam market
3.2. Major groups in the industry – 3.2.4. Processed starch – Import export
Source: VIRAC, GDVC
Export of cassava starch by month, 2017 - 2018 Export market structure of cassava starch, Q1/2018
Export output of cassava starch over the years, 2013 - Q1/2018
Content is intentionally removed for demo purpose

104
Source: VIRAC, Agromonitor
USD/Ton
3. Vietnam market
3.2. Major groups in the industry – 3.2.4. Processed starch – Import export
Export price of cassava starch in Vietnam by month, 2016 - 2017
Content is intentionally removed for demo purpose

105
Source: VIRAC, GDVC
Source: VIRAC, GDVC
3. Vietnam market
3.2. Major groups in the industry – 3.2.4. Processed starch – Import export
USD
million
Import of starch and starch products, 2010 - 2017
Import volume of cassava starch, 2013 - 2016
Content is intentionally removed for demo purpose

106
3 Vietnam market
3.1 History of industry formation and development
3.2. Major groups in the industry
3.2.1 Processed seafood
3.2.2 Canned meat and other meat products processing
3.2.3 Fresh and processed fruit-vegetables
3.2.4 Processed starch
3.2.5 Other food (sugar, confectionery, noodle, ready-made food)
Content

107
Source: VIRAC, GSO
Source: VIRAC, GSO
3. Vietnam market
3.2. Major groups in the industry – 3.2.5. Other processed food – 3.2.5.1. Overview
Distribution of other food processing enterprises by region, 2010 - 2016
Number of enterprises and employees in the other food processing
industry, 2010 - 2016
Content is intentionally removed for demo purpose

108
Source: VIRAC, GSO
Source: VIRAC, GSO
3. Vietnam market
3.2. Major groups in the industry – 3.2.5. Other processed food – 3.2.5.1. Overview
Number of enterprises and employees in the other food processing industry,
2010 - 2016
Investment capital and fixed assets of other food processing industry, 2010 - 2016
Content is intentionally removed for demo purpose

109
Source: VIRAC, GSO
Thousand tons
3. Vietnam market
3.2. Major groups in the industry – 3.2.5. Other processed food – 3.2.5.2. Noodle processing
Production of kinds of noodle, 2010 - Q1/2018e
Content is intentionally removed for demo purpose

110
Source: VIRAC, Intelligent Investor
Source: VIRAC, GSO
3. Vietnam market
3.2. Major groups in the industry – 3.2.5. Other processed food – 3.2.5.2. Noodle processing
Consumption value of noodle products, 2010 - Q1/2018e
Consumption of instant noodles in Vietnam, 2010 - 2016
Content is intentionally removed for demo purpose

111
Source: VIRAC, Kanta Worldpanel
3. Vietnam market
3.2. Major groups in the industry – 3.2.5. Other processed food – 3.2.5.2. Noodle processing
Market share of instant noodles in rural areas, 2014 - 6M/2016
Content is intentionally removed for demo purpose

112
Source: VIRAC, GDVC
Source: VIRAC, GDVC
USD million
3. Vietnam market
3.2. Major groups in the industry – 3.2.5. Other processed food – 3.2.5.2. Noodle processing
Top largest noodle exporting enterprises, Q1/2018
Export turnover of noodle products, 2012 - Q1/2018e
Content is intentionally removed for demo purpose

113
Source: VIRAC, GDVC
Source: VIRAC, GDVC
USD million
3. Vietnam market
3.2. Major groups in the industry – 3.2.5. Other processed food – 3.2.5.2. Noodle processing
Top largest noodle importing enterprises, Q1/2018
Import turnover of noodle products, 2012 - Q1/2017e
Content is intentionally removed for demo purpose

114
Source: VIRAC, GSO
Ton
3. Vietnam market
3.2. Major groups in the industry – 3.2.5. Other processed food – 3.2.5.2. Ready-made food
Production of other processed food, 2010 - Q1/2018e
Content is intentionally removed for demo purpose

115
Source: VIRAC, GSO
VND
billion
3. Vietnam market
3.2. Major groups in the industry – 3.2.5. Other processed food – 3.2.5.2. Ready-made food
Consumption value of other processed food, 2011 - Q1/2018e
Content is intentionally removed for demo purpose

116
Source: VIRAC, GDVC
USD million
Source: VIRAC, GDVC
3. Vietnam market
3.2. Major groups in the industry – 3.2.5. Other processed food – 3.2.5.2. Ready-made food
Top largest processed food exporting enterprises, Q1/2018
Export of processed food, 2015 - Q1/2018e
Content is intentionally removed for demo purpose

117
Source: VIRAC, GSO
Source: VIRAC, GDVC
USD million
3. Vietnam market
3.2. Major groups in the industry – 3.2.5. Other processed food – 3.2.5.2. Ready-made food
Top largest processed food importing enterprises Q1/2018
Import of processed food, 2012 - Q1/2018e
Content is intentionally removed for demo purpose

118
Source: VIRAC, GSO
Source: VIRAC, GSO
Thousand tons
3. Vietnam market
3.2. Major groups in the industry – 3.2.5. Other processed food – 3.2.5.3. Confectionery
Confectionery production, 2011 - Q1/2018e
Structure of confectionery production by output, 2016
Content is intentionally removed for demo purpose

119
Source: VIRAC, Indexmundi Source: VIRAC, Indexmundi
3. Vietnam market
3.2. Major groups in the industry – 3.2.5. Other processed food – 3.2.5.3. Confectionery
Fluctuation of sugar prices, 2/2013 - 4/2018Fluctuation of wheat prices, 9/2012 - 4/2018
Content is intentionally removed for demo purpose

120
Source: VIRAC, GSO
VND billion
VND
million
Time
3. Vietnam market
3.2. Major groups in the industry – 3.2.5. Other processed food – 3.2.5.3. Confectionery
Source: VIRAC, GSO
Top 10 brands having the most advertisement in
confectionery sector, 4M/2017
Consumption value of confectionery in Vietnam, 2011 - Q1/2018e
Content is intentionally removed for demo purpose

121
Source: VIRAC, GDVC
Source: VIRAC, GDVC
USD million
3. Vietnam market
3.2. Major groups in the industry – 3.2.5. Other processed food – 3.2.5.3. Confectionery
Import of confectionery and cereal products of Vietnam, 2010 - Q1/2018e
Import market structure of confectionery and cereal products, Q1/2018
Content is intentionally removed for demo purpose

122
Source: VIRAC, GDVC
Source: VIRAC, GDVC
USD million
3. Vietnam market
3.2. Major groups in the industry – 3.2.5. Other processed food – 3.2.5.3. Confectionery
Export of confectionery and cereal products of Vietnam, 2010 - Q1/2018
Export market structure of confectionery and cereal products, Q1/2018
Content is intentionally removed for demo purpose

123
Thousand tons
Source: VIRAC, GSO
3. Vietnam market
3.2. Major groups in the industry – 3.2.5. Other processed food – 3.2.5.4. Sugar
Sugar production by season, 2009/2010 - 2017/2018e
Content is intentionally removed for demo purpose
124
Production process of sugar extracted from sugarcane
Source: VIRAC
3. Vietnam market
3.2. Major groups in the industry – 3.2.5. Other processed food – 3.2.5.4. Sugar
Content is intentionally removed for demo purpose

125
Source: VIRAC, MARD Source: VIRAC, OECD
3. Vietnam market
3.2. Major groups in the industry – 3.2.5. Other processed food – 3.2.5.4. Sugar
Situation of sugar factories in Vietnam, 2015/2016 Sugar production cost, 2015
Content is intentionally removed for demo purpose

126
Source: VIRAC, GSOSource: VIRAC, GSO
Thousand tons
3. Vietnam market
3.2. Major groups in the industry – 3.2.5. Other processed food – 3.2.5.4. Sugar
Sugarcane production, 2009 - 2017Cultivated area of sugarcane, 2010 - 2017
Content is intentionally removed for demo purpose

127
Thousand tons
Source: VIRAC, OECD, GSO
3. Vietnam market
3.2. Major groups in the industry – 3.2.5. Other processed food – 3.2.5.4. Sugar
Sugar consumption in Vietnam, 2010 – 2018e
Content is intentionally removed for demo purpose

128
Thousand tons
Source: VIRAC, Vietnam sugar and sugarcane association
3. Vietnam market
3.2. Major groups in the industry – 3.2.5. Other processed food – 3.2.5.4. Sugar
Inventories in sugar sector, 2004 - Q1/2018
Content is intentionally removed for demo purpose
129
USD million
Source: VIRAC, GDVC
3. Vietnam market
3.2. Major groups in the industry – 3.2.5. Other processed food – 3.2.5.4. Sugar
Sugar imports, 2012 - 11M/2017
Content is intentionally removed for demo purpose

130
Source: VIRAC, GDVC
3. Vietnam market
3.2. Major groups in the industry – 3.2.5. Other processed food – 3.2.5.4. Sugar
Sugar import markets of Vietnam, 11M/2017
Content is intentionally removed for demo purpose

131
Source: VIRAC, GDVC
USD million
3. Vietnam market
3.2. Major groups in the industry – 3.2.5. Other processed food – 3.2.5.4. Sugar
Sugar exports, 2012 - 11M/2017
Content is intentionally removed for demo purpose

132
Content
4 Risk analysis
4.1 SWOT analysis
4.2 Risk analysis

133
4. Risk analysis
4.1. SWOT analysis
Content is intentionally removed for demo purpose

134
4. Risk analysis
4.1. SWOT analysis
Content is intentionally removed for demo purpose

135
Content
4 Risk analysis
4.1 SWOT analysis
4.2 Risk analysis

136
Risk of unsafe food hygiene
Risks of raw materials
Competitive risk
4. Risk analysis
4.2. Risk analysis
Content is intentionally removed for demo purpose

137
Risk of integration
Consumer perceptions risk
4. Risk analysis
4.2. Risk analysis
Content is intentionally removed for demo purpose

138
Content
5 Outlook and forecast
5.1 Industry development planning
5.2 Outlook
5.3 Forecast

139
5. Outlook and forecast
5.1. Industry development planning
Content is intentionally removed for demo purpose
140
5. Outlook and forecast
5.1. Industry development planning
Content is intentionally removed for demo purpose

141
Content
5 Outlook and forecast
5.1 Industry development planning
5.2 Outlook
5.3 Forecast

142
5. Outlook and forecast
5.2. Outlook
Content is intentionally removed for demo purpose

143
Content
5 Outlook and forecast
5.1 Industry development planning
5.2 Outlook
5.3 Forecast

144
5. Outlook and forecast
5.3. Forecast
Content is intentionally removed for demo purpose
145
Content
6 Enterprise analysis
6.1 Enterprise introduction
6.2 Financial analysis

146
6. Enterprise analysis
6.1. Enterprise introduction
Quangngai Sugar JSC
Content is intentionally removed for demo purpose

147
Dabaco Group
6. Enterprise analysis
6.1. Enterprise introduction
Content is intentionally removed for demo purpose

148
Asia Food JSC
6. Enterprise analysis
6.1. Enterprise introduction
Content is intentionally removed for demo purpose

149
Uniben JSC
6. Enterprise analysis
6.1. Enterprise introduction
Content is intentionally removed for demo purpose

150
Masan North Company,.Ltd
6. Enterprise analysis
6.1. Enterprise introduction
Content is intentionally removed for demo purpose
151
Fococev Viet Nam JSC
6. Enterprise analysis
6.1. Enterprise introduction
Content is intentionally removed for demo purpose

152
VIKYBOMI CORP.
6. Enterprise analysis
6.1. Enterprise introduction
Content is intentionally removed for demo purpose

153
VIFON
6. Enterprise analysis
6.1. Enterprise introduction
Content is intentionally removed for demo purpose

154
Bibica Joint Stock Company
6. Enterprise analysis
6.1. Enterprise introduction
Content is intentionally removed for demo purpose

155
Content
6 Enterprise analysis
6.1 Enterprise introduction
6.2 Financial analysis

156
6. Enterprise Analysis
6.2. Financial Analysis
Gross profit margin, 2015-2016
Content is intentionally removed for demo purpose

157
6. Enterprise Analysis
6.2. Financial Analysis
Content is intentionally removed for demo purpose

158
6. Enterprise Analysis
6.2. Financial Analysis
Selling expenses/Net revenue ratio
Content is intentionally removed for demo purpose

159
.
6. Enterprise Analysis
6.2. Financial Analysis
Administrative and general expenses/ net revenue
Content is intentionally removed for demo purpose

160
6. Enterprise Analysis
6.2. Financial Analysis
Self-financing ratio, 2015 - 2016
Content is intentionally removed for demo purpose

161
6. Enterprise Analysis
6.2. Financial Analysis
Current ratio, 2015-2016
Content is intentionally removed for demo purpose

162
6. Enterprise Analysis
6.2. Financial Analysis
Average number of days of receivable, 2016
Average number of days of inventory, 2016
Content is intentionally removed for demo purpose

163
6. Enterprise Analysis
6.2. Financial Analysis
Content is intentionally removed for demo purpose
Net profit margin, 2015 - 2016

164
6. Enterprise Analysis
6.2. Financial Analysis
Content is intentionally removed for demo purpose

165
Content
7 Appendix of Financial statement

166
7. Appendix of Financial statement
7.1. Quang Ngai Sugar JSC
INCOME STATEMENT
Unit: VND 2015 2016
1 Net revenue
2 Cost of goods sold
3 Gross profit
4 Revenue from financial activities
5 Financial expenses
Loan interest expenses
6 Cost of sales
7 General and administrative expenses
8 Net profit from business activities
9 Before-tax profit
10 Current income tax
11 Deferred income tax
12 After-tax profit
BALANCE SHEETS
Unit: VND 2015 2016
I CURRENT ASSETS
1 Cash and cash equivalents
2 Short-term financial investments
3 Short-term receivable
Receivables of customers
5 Inventories
II NON-CURRENT ASSETS
1 Other long-term receivables
2 Fixed assets
3 Tangible fixed assets
Intangible fixed assets
5 Commercial advantage
III TOTAL ASSETS
I LIABILITIES
1 Current liabilities
Current borrowings and liabilities
Receivables of sellers
Taxes and other payables to the State budget
2 Non-current liabilities
II EQUITY
III TOTAL CAPITAL RESOURCES
Content is intentionally removed for demo purpose

167
7. Appendix of Financial statement
7.2. Dabaco Vietnam JSC
INCOME STATEMENT
Unit: VND 2015 2016
1 Net revenue
2 Cost of goods sold
3 Gross profit
4 Revenue from financial activities
5 Financial expenses
Loan interest expenses
6 Cost of sales
7 General and administrative expenses
8 Net profit from business activities
9 Before-tax profit
10 Current income tax
11 Deferred income tax
12 After-tax profit
BALANCE SHEETS
Unit: VND 2015 2016
I CURRENT ASSETS
1 Cash and cash equivalents
2 Short-term financial investments
3 Short-term receivable
Receivables of customers
5 Inventories
II NON-CURRENT ASSETS
1 Other long-term receivables
2 Fixed assets
3 Tangible fixed assets
Intangible fixed assets
5 Commercial advantage
III TOTAL ASSETS
I LIABILITIES
1 Current liabilities
Current borrowings and liabilities
Receivables of sellers
Taxes and other payables to the State budget
2 Non-current liabilities
II EQUITY
III TOTAL CAPITAL RESOURCES
Content is intentionally removed for demo purpose

168
7. Appendix of Financial statement
7.3. Asia Food JSC
INCOME STATEMENT
Unit: VND 2015 2016
1 Net revenue
2 Cost of goods sold
3 Gross profit
4 Revenue from financial activities
5 Financial expenses
Loan interest expenses
6 Cost of sales
7 General and administrative expenses
8 Net profit from business activities
9 Before-tax profit
10 Current income tax
11 Deferred income tax
12 After-tax profit
BALANCE SHEETS
Unit: VND 2015 2016
I CURRENT ASSETS
1 Cash and cash equivalents
2 Short-term financial investments
3 Short-term receivable
Receivables of customers
5 Inventories
II NON-CURRENT ASSETS
1 Other long-term receivables
2 Fixed assets
3 Tangible fixed assets
Intangible fixed assets
5 Commercial advantage
III TOTAL ASSETS
I LIABILITIES
1 Current liabilities
Current borrowings and liabilities
Receivables of sellers
Taxes and other payables to the State budget
2 Non-current liabilities
II EQUITY
III TOTAL CAPITAL RESOURCES
Content is intentionally removed for demo purpose

169
7. Appendix of Financial statement
7.4. Uniben JSC
INCOME STATEMENT
Unit: VND 2015 2016
1 Net revenue
2 Cost of goods sold
3 Gross profit
4 Revenue from financial activities
5 Financial expenses
Loan interest expenses
6 Cost of sales
7 General and administrative expenses
8 Net profit from business activities
9 Before-tax profit
10 Current income tax
11 Deferred income tax
12 After-tax profit
BALANCE SHEETS
Unit: VND 2015 2016
I CURRENT ASSETS
1 Cash and cash equivalents
2 Short-term financial investments
3 Short-term receivable
Receivables of customers
5 Inventories
II NON-CURRENT ASSETS
1 Other long-term receivables
2 Fixed assets
3 Tangible fixed assets
Intangible fixed assets
5 Commercial advantage
III TOTAL ASSETS
I LIABILITIES
1 Current liabilities
Current borrowings and liabilities
Receivables of sellers
Taxes and other payables to the State budget
2 Non-current liabilities
II EQUITY
III TOTAL CAPITAL RESOURCES
Content is intentionally removed for demo purpose

170
7. Appendix of Financial statement
7.5. Masan North Co., Ltd
INCOME STATEMENT
Unit: VND 2015 2016
1 Net revenue
2 Cost of goods sold
3 Gross profit
4 Revenue from financial activities
5 Financial expenses
Loan interest expenses
6 Cost of sales
7 General and administrative expenses
8 Net profit from business activities
9 Before-tax profit
10 Current income tax
11 Deferred income tax
12 After-tax profit
BALANCE SHEETS
Unit: VND 2015 2016
I CURRENT ASSETS
1 Cash and cash equivalents
2 Short-term financial investments
3 Short-term receivable
Receivables of customers
5 Inventories
II NON-CURRENT ASSETS
1 Other long-term receivables
2 Fixed assets
3 Tangible fixed assets
Intangible fixed assets
5 Commercial advantage
III TOTAL ASSETS
I LIABILITIES
1 Current liabilities
Current borrowings and liabilities
Receivables of sellers
Taxes and other payables to the State budget
2 Non-current liabilities
II EQUITY
III TOTAL CAPITAL RESOURCES
Content is intentionally removed for demo purpose

171
7. Appendix of Financial statement
7.6. Fococev Vietnam JSC
INCOME STATEMENT
Unit: VND 2015 2016
1 Net revenue
2 Cost of goods sold
3 Gross profit
4 Revenue from financial activities
5 Financial expenses
Loan interest expenses
6 Cost of sales
7 General and administrative expenses
8 Net profit from business activities
9 Before-tax profit
10 Current income tax
11 Deferred income tax
12 After-tax profit
BALANCE SHEETS
Unit: VND 2015 2016
I CURRENT ASSETS
1 Cash and cash equivalents
2 Short-term financial investments
3 Short-term receivable
Receivables of customers
5 Inventories
II NON-CURRENT ASSETS
1 Other long-term receivables
2 Fixed assets
3 Tangible fixed assets
Intangible fixed assets
5 Commercial advantage
III TOTAL ASSETS
I LIABILITIES
1 Current liabilities
Current borrowings and liabilities
Receivables of sellers
Taxes and other payables to the State budget
2 Non-current liabilities
II EQUITY
III TOTAL CAPITAL RESOURCES
Content is intentionally removed for demo purpose

172
7. Appendix of Financial statement
7.7. Vifon JSC
INCOME STATEMENT
Unit: VND 2015 2016
1 Net revenue
2 Cost of goods sold
3 Gross profit
4 Revenue from financial activities
5 Financial expenses
Loan interest expenses
6 Cost of sales
7 General and administrative expenses
8 Net profit from business activities
9 Before-tax profit
10 Current income tax
11 Deferred income tax
12 After-tax profit
BALANCE SHEETS
Unit: VND 2015 2016
I CURRENT ASSETS
1 Cash and cash equivalents
2 Short-term financial investments
3 Short-term receivable
Receivables of customers
5 Inventories
II NON-CURRENT ASSETS
1 Other long-term receivables
2 Fixed assets
3 Tangible fixed assets
Intangible fixed assets
5 Commercial advantage
III TOTAL ASSETS
I LIABILITIES
1 Current liabilities
Current borrowings and liabilities
Receivables of sellers
Taxes and other payables to the State budget
2 Non-current liabilities
II EQUITY
III TOTAL CAPITAL RESOURCES
Content is intentionally removed for demo purpose

173
7. Appendix of Financial statement
7.8. Vietnam Flour Industry JSC
INCOME STATEMENT
Unit: VND 2015 2016
1 Net revenue
2 Cost of goods sold
3 Gross profit
4 Revenue from financial activities
5 Financial expenses
Loan interest expenses
6 Cost of sales
7 General and administrative expenses
8 Net profit from business activities
9 Before-tax profit
10 Current income tax
11 Deferred income tax
12 After-tax profit
BALANCE SHEETS
Unit: VND 2015 2016
I CURRENT ASSETS
1 Cash and cash equivalents
2 Short-term financial investments
3 Short-term receivable
Receivables of customers
5 Inventories
II NON-CURRENT ASSETS
1 Other long-term receivables
2 Fixed assets
3 Tangible fixed assets
Intangible fixed assets
5 Commercial advantage
III TOTAL ASSETS
I LIABILITIES
1 Current liabilities
Current borrowings and liabilities
Receivables of sellers
Taxes and other payables to the State budget
2 Non-current liabilities
II EQUITY
III TOTAL CAPITAL RESOURCES
Content is intentionally removed for demo purpose

174
7. Appendix of Financial statement
7.9. Vietnam Food Industry JSC
INCOME STATEMENT
Unit: VND 2015 2016
1 Net revenue
2 Cost of goods sold
3 Gross profit
4 Revenue from financial activities
5 Financial expenses
Loan interest expenses
6 Cost of sales
7 General and administrative expenses
8 Net profit from business activities
9 Before-tax profit
10 Current income tax
11 Deferred income tax
12 After-tax profit
BALANCE SHEETS
Unit: VND 2015 2016
I CURRENT ASSETS
1 Cash and cash equivalents
2 Short-term financial investments
3 Short-term receivable
Receivables of customers
5 Inventories
II NON-CURRENT ASSETS
1 Other long-term receivables
2 Fixed assets
3 Tangible fixed assets
Intangible fixed assets
5 Commercial advantage
III TOTAL ASSETS
I LIABILITIES
1 Current liabilities
Current borrowings and liabilities
Receivables of sellers
Taxes and other payables to the State budget
2 Non-current liabilities
II EQUITY
III TOTAL CAPITAL RESOURCES
Content is intentionally removed for demo purpose

175
7. Appendix of Financial statement
7.10. Bibica JSC
BALANCE SHEETS
Unit: VND 2015 2016
I CURRENT ASSETS
1 Cash and cash equivalents
2 Short-term financial investments
3 Short-term receivable
Receivables of customers
5 Inventories
II NON-CURRENT ASSETS
1 Other long-term receivables
2 Fixed assets
3 Tangible fixed assets
Intangible fixed assets
5 Commercial advantage
III TOTAL ASSETS
I LIABILITIES
1 Current liabilities
Current borrowings and liabilities
Receivables of sellers
Taxes and other payables to the State budget
2 Non-current liabilities
II EQUITY
III TOTAL CAPITAL RESOURCES
INCOME STATEMENT
Unit: VND 2015 2016
1 Net revenue
2 Cost of goods sold
3 Gross profit
4 Revenue from financial activities
5 Financial expenses
Loan interest expenses
6 Cost of sales
7 General and administrative expenses
8 Net profit from business activities
9 Before-tax profit
10 Current income tax
11 Deferred income tax
12 After-tax profit
Content is intentionally removed for demo purpose

Report Disclaimer
176
Report Disclaimer
This document has been prepared in good faith on the basis of information available at the date of publication without any independent verification. VIRAC has
produced this report for private circulation to professional clients only. All information and statistical data herein have been obtained from sources we believe to
be reliable and made to ensure the accuracy of the contents of the pages of the report at the time of preparation. Such information has not been independently
verified and VIRAC makes no representation or warranty, whether express or implied, of any kind with respect to the document and its contents, information and
materials. The content found in this report is proprietary to VIRAC and is provided solely for your personal and non-commercial use. You agree that you will not
use this report for any purpose that is unlawful and that you will not reproduce the report or redistribute it outside your organisation, or place it on a website for
public access without the express written permission of VIRAC.
SHOULD YOU NEED ANY ASSISTANCE, PLEASE CONTACT US:
VIETNAM INDUSTRY RESEARCH AND CONSUTANCY (VIRAC JSC.,)
6th Floor, Anh Minh Building, 36 Hoang Cau, O Cho Dua, Dong Da, Hanoi, Vietnam
Website: http://virac.com.vn/
Email: [email protected] | Tel: +84 463289520

Thank you !