Embed Size (px)
Citation preview
Required Report - public distributionDate: 02/01/2007
GAIN Report Number: PO7002PO2222Iberian Peninsula (Spain and Portugal)Food-processing Ingredients SectorAnnual2007
Approved by:Stephen HammondU.S. EmbassyPrepared by:Arantxa MedinaAndy Jessen
Report Highlights:The Iberian Peninsula food-processing sector is one of the most vibrant within the European Union. U.S. exporters of food ingredients may find trade opportunities in this market; however, market access requirements can be complicated and at times prohibitive.
Includes PSD Changes: NoIncludes Trade Matrix: No
Annual ReportMadrid [SP1]
[SP]
USDA Foreign Agricultural Service
GAIN ReportGlobal Agriculture Information Network
Template Version 2.08

GAIN Report – PO7002 Page 2 of 17
INDEX
I. MARKET SUMMARY.........................................................................................3SPAIN................................................................................................................................3
Economic Trends............................................................................................................3PORTUGAL.........................................................................................................................4
Economic Trends............................................................................................................4ADVANTAGES AND CHALLENGES FACING U.S. PRODUCTS IN THE IBERIAN PENINSULA......6
II. ROAD MAP FOR MARKET ENTRY......................................................................6A. Entry Strategy..............................................................................................................6B. Market Structure..........................................................................................................6C. Company Profiles.........................................................................................................6
III. BEST PRODUCT PROSPECTS...........................................................................6IV. POST CONTACT AND OTHER INFORMATION.....................................................6
SPAIN................................................................................................................................6PORTUGAL.........................................................................................................................6
UNCLASSIFIED USDA Foreign Agricultural Service

GAIN Report – PO7002 Page 3 of 17
I. MARKET SUMMARY
SPAIN
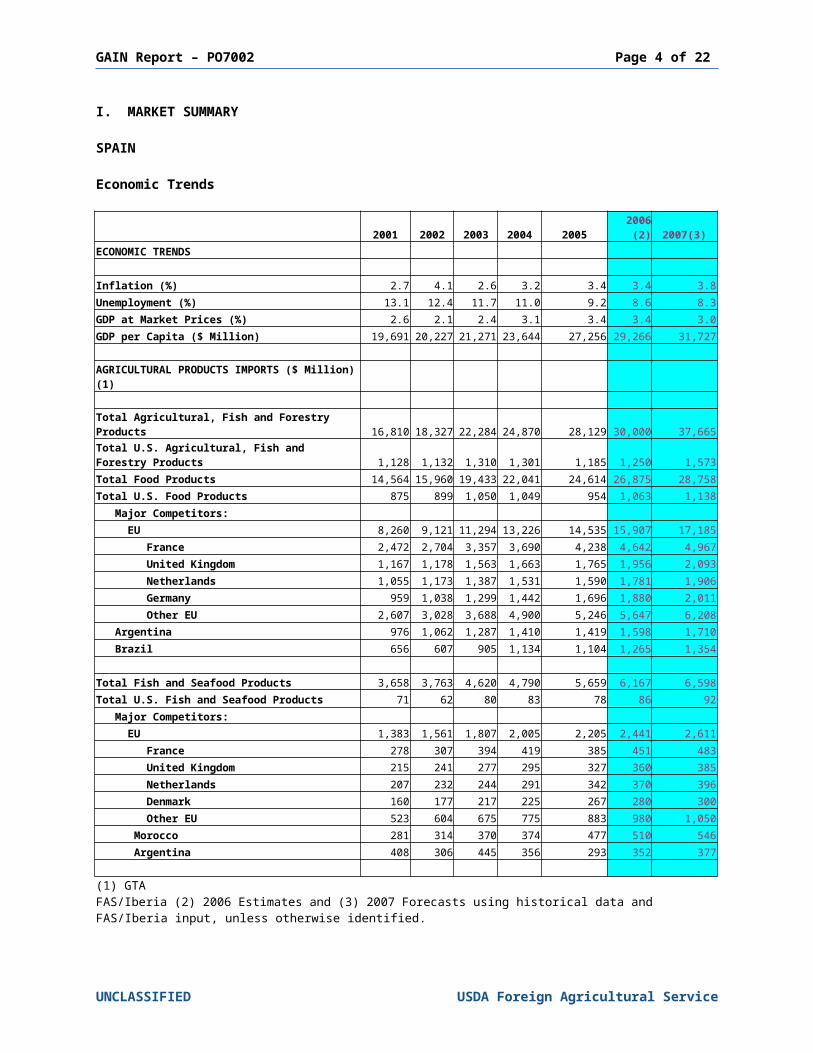
Economic Trends
2001 2002 2003 2004 2005 2006 (2) 2007(3)ECONOMIC TRENDS
Inflation (%) 2.7 4.1 2.6 3.2 3.4 3.4 3.8Unemployment (%) 13.1 12.4 11.7 11.0 9.2 8.6 8.3GDP at Market Prices (%) 2.6 2.1 2.4 3.1 3.4 3.4 3.0GDP per Capita ($ Million) 19,691 20,227 21,271 23,644 27,256 29,266 31,727
AGRICULTURAL PRODUCTS IMPORTS ($ Million) (1)
Total Agricultural, Fish and Forestry Products 16,810 18,327 22,284 24,870 28,129 30,000 37,665Total U.S. Agricultural, Fish and Forestry Products 1,128 1,132 1,310 1,301 1,185 1,250 1,573Total Food Products 14,564 15,960 19,433 22,041 24,614 26,875 28,758Total U.S. Food Products 875 899 1,050 1,049 954 1,063 1,138 Major Competitors: EU 8,260 9,121 11,294 13,226 14,535 15,907 17,185 France 2,472 2,704 3,357 3,690 4,238 4,642 4,967 United Kingdom 1,167 1,178 1,563 1,663 1,765 1,956 2,093 Netherlands 1,055 1,173 1,387 1,531 1,590 1,781 1,906 Germany 959 1,038 1,299 1,442 1,696 1,880 2,011 Other EU 2,607 3,028 3,688 4,900 5,246 5,647 6,208 Argentina 976 1,062 1,287 1,410 1,419 1,598 1,710 Brazil 656 607 905 1,134 1,104 1,265 1,354
Total Fish and Seafood Products 3,658 3,763 4,620 4,790 5,659 6,167 6,598Total U.S. Fish and Seafood Products 71 62 80 83 78 86 92 Major Competitors: EU 1,383 1,561 1,807 2,005 2,205 2,441 2,611 France 278 307 394 419 385 451 483 United Kingdom 215 241 277 295 327 360 385 Netherlands 207 232 244 291 342 370 396 Denmark 160 177 217 225 267 280 300 Other EU 523 604 675 775 883 980 1,050 Morocco 281 314 370 374 477 510 546 Argentina 408 306 445 356 293 352 377
(1) GTAFAS/Iberia (2) 2006 Estimates and (3) 2007 Forecasts using historical data and FAS/Iberia input, unless otherwise identified.
UNCLASSIFIED USDA Foreign Agricultural Service
GAIN Report – PO7002 Page 4 of 17
PORTUGAL
Economic Trends
2001 2002 2003 2004 2005 2006 (2) 2007(3)ECONOMIC TRENDS
Inflation (%) 4.4 3.6 3.3 2.4 2.1 2.6 2.2Unemployment (%) 4.1 5.1 6.4 6.7 7.6 7.7 7.6GDP at Market Prices (%) 1.8 0.5 -1.2 0.8 0.4 1.2 1.5GDP per Capita ($ Million) 15,138 15,740 15,863 16,387 17,456 18,161 19,2885
AGRICULTURAL PRODUCTS IMPORTS ($ Million) (1)
Total Agricultural, Fish and Forestry Products 5,495 5,704 6,677 7,467 7,506 8,172 8,500Total U.S. Agricultural, Fish and Forestry Products 244 275 292 289 292 312 330Total Food Products 4,699 4,927 5,874 6,558 7,037 7,554 8,082Total U.S. Food Products 202 233 241 234 236 254 272 Major Competitors: EU 3,281 3,498 4,331 4,805 5,005 5,515 5,901 Spain 1,733 1,778 2,307 2,468 2,681 2,928 3,133 France 592 576 679 728 718 764 818 Germany 264 291 341 394 449 496 530 Netherlands 177 239 306 375 325 409 437 Other EU 515 613 699 840 832 919 982 Brazil 200 203 239 365 311 381 408 Argentina 139 130 176 173 146 169 180
Total Fish and Seafood Products 913 921 1,065 1,183 1,322 1,412 1,496Total U.S. Fish and Seafood Products 36 27 28 41 52 51 54 Major Competitors: EU 464 536 689 797 897 1,025 1,087 Spain 307 325 444 455 545 603 639 Sweden 12 22 34 90 82 103 109 Denmark 43 67 62 77 80 95 101 Netherlands 28 36 48 66 69 86 91 Other EU 74 86 101 109 121 138 147 Russia 65 61 83 101 91 110 116 Norway 107 89 57 56 52 50 50(1) GTA FAS/Iberia (2) 2006 Estimates and (3) 2007 Forecasts using historical data and FAS/Iberia input, unless otherwise identified.
UNCLASSIFIED USDA Foreign Agricultural Service

GAIN Report – PO7002 Page 5 of 17
The Iberian Peninsula food-processing sector modernized and expanded significantly during the last couple of decades. With integration into the European Union in 1986, the Iberian Peninsula food-processing sector began a profound modernization in order to adapt to new EU requirements. Spain and Portugal now have some of the most competitive food processing industries in Europe, which makes this sector an important target for U.S. food-ingredient exporters.
The Iberian Peninsula food-processing sector in summary: Modern, with special attention to the quality, safety, and traceability of the food products it produces.
In Spain this sector:
Generates just under 20 percent of Spain’s total industrial production, accounting for about 7 percent of the national gross domestic product and providing about 480,000 jobs;
Is comprised of mostly small companies--about 97 percent of the 31,824 food processors employ less than 50 people; 833 employ between 50 and 200 people; 155 employ between 200 and 500 people; and only 68 food processors employ more than 500 people; and,
Produces an estimated € 65 billion in product, of which € 16 billion is exported.
In Portugal the food-processing sector:
Generates about 16 percent of Portugal’s total industrial production, accounting for about nine percent of the national gross domestic product and providing an estimated 110,000 jobs;
Is dominated by even smaller companies—only 11 percent of the 8,500 food processors employ more than 20 people, accounting for about 2/3 of the sector manpower and about 85 percent of the € 12.5 billion in product produced. Just over €1 billion of the final product is exported.
The Iberian Peninsula Food-processing Sector
Spain PortugalYear 2005 2004Total Production (Million €) 65,435 12,500Total No. Of Food Processors 31,824 8,500Labor Force 481,650 110,000Total Exports (Million €) 13,495 1,625
Source: Spain - FIAB – Spanish Food Industry Federation Portugal - FIPA – Portuguese Food Industry Federation
Current market developments affecting the food-processing sector include:
Changes in demographics and working patterns are shifting demand to moreconvenient and ready-to-eat foods. Due to higher income, people are eating out more often.
UNCLASSIFIED USDA Foreign Agricultural Service

GAIN Report – PO7002 Page 6 of 17
New, demanding labeling and traceability requirements are forcing consolidation of all levels of the food chain, from farm to fork.
Consumers have become more health conscious: problems concerning food safety are widely publicized and usually receive immediate attention from government agencies.
Spain Total Food Consumption Expenditures(Billion Euros)
2000 2001 2002 2003 2004 2005 2006 (1) 2007 (2)
Home 40.7 44.8 48.5 50.7 54.2 56.2 60 64
Hotel & Restaurants
14.5 15.5 16.5 17.5 19.2 20.1 21.5 23
Institutions 1.1 1.1 1.2 1.2 1.3 1.5 1.5 1.5
Total 56.5 61.4 66.2 69.4 74.8 77.8 83 88.5
% Increase 6.8 8.6 7.8 4.8 7.7 4.0 6.7 7.0Source: MAPAFAS/Iberia (1) 2006 Estimates and (2) 2007 Forecasts using historical data and FAS/Iberia input, unless otherwise identified.
Source: FIAB
UNCLASSIFIED USDA Foreign Agricultural Service

GAIN Report – PO7002 Page 7 of 17
Source: INE
Source: FIPA
UNCLASSIFIED USDA Foreign Agricultural Service

GAIN Report – PO7002 Page 8 of 17
Source: FIPA
UNCLASSIFIED USDA Foreign Agricultural Service

GAIN Report – PO7002 Page 9 of 17
ADVANTAGES AND CHALLENGES FACING U.S. PRODUCTS IN THE IBERIAN PENINSULA
Advantages Challenges
The dynamic IP food-processing sector will continue to grow, creating increased demand for food ingredients.
Food imported from third countries, including the U.S., must comply with EU food law, which varies considerably from U.S. regulation and practice.
Food products in the market are becoming more diversified.
Competition from neighboring EU countries, where tastes and traditional products may be well known.
Good network of agents and importers to help get product into the market.
EU labeling, traceability, and packaging laws and a reluctance to purchase products containing genetically modified ingredients.
Overall sales of consumer-ready food products continue to expand.
U.S. exports face higher transportation costs and difficulties in shipping mixed or smaller container loads.
Consumers are more health conscious, and tastes are becoming more diversified.
High marketing costs (advertising, discounts, etc.) are necessary.
II. ROAD MAP FOR MARKET ENTRY
A. Entry Strategy
Success in introducing products in the Iberian Peninsula market requires local representation and personal contact. A local representative can provide up-to-date market intelligence, guidance on business practices and trade related laws, sales contact with existing and potential buyers, and market development expertise. The Office of Agricultural Affairs in Madrid maintains listings of potential importers and are developing sector-specific information to help you introduce your product in the IP market.
We are also developing a series of product-specific market access reports that are/will be available to U.S. exporters (please see SP5037 and SP6002). Spain and Portugal generally apply EC rules and regulations. However, there are subtleties that you should learn about if you are thinking of exporting to the IP market. For more information, we invite potential U.S. exporters to contact us for additional, unpublished sector-specific information.
In general terms, U.S. exporters already exporting to other EU Members will likely be meeting most of the requirements for exporting into the IP. The U.S. exporter needs to make contact with an IP importer and/or distributor for his product.
Typically, IP food processors buy their food ingredients from importers or wholesalers. Some large companies buy directly from foreign suppliers. Around 20 percent of the IP food production is sold to export markets, mainly to the EU. Some food-processing companies concentrate on the domestic or on export markets, but most of them will have mixed customers. Companies supplying mainly the domestic market frequently market their products directly and have their own logistics infrastructure. However, their customers will vary from wholesalers to buying groups and retailers. Companies producing for the export market may have their own marketing office overseas, local agents or may work with local importers.
U.S. processed food exporters now face even greater challenges in the IP market, because of the new EC labeling and traceability regulations. Any product that contains genetically
UNCLASSIFIED USDA Foreign Agricultural Service

GAIN Report – PO7002 Page 10 of 17
modified ingredients must be labeled so that the consumer can distinguish the product. Because, IP consumers don’t yet have familiarity with genetically modified foods, food processors, retailers and the HRI sector are reluctant to purchase these processed products or food ingredients for processing.
The following documents are required for ocean or air cargo shipments of foodstuffs to Spain and Portugal:
Bill of Lading and/or Airway Bill
Commercial Invoice
Phytosanitary Certificate and/or Health Certificate when applicable If your product is or contains plant or animal products, it will require a phytosanitary or health certificate issued by the competent U.S. authority. Also, if you are exporting animal products, your production plant has to be approved to export into the EU.
Import CertificateMost food products require an Import Certificate issued by the competent Spanish or Portuguese authority. However, the Import Certificate is obtained by the Spanish or Portuguese importer and/or the agent involved in the business and is intended for tariff classification purposes.
For more information on Spanish and Portuguese import and inspection procedures please see SP6018 and PO6009 respectively.
These reports should be read in conjunction with the FAS Office in the U.S. Mission to the European Commission’s (USEU) equivalent report (E36098).
For more information on exporting to Spain and Portugal, please see PO6012. Also, please check the U.S. Mission to the European Union webpage at http://www.useu.be/agri/expguide.html, which will guide you on exporting into the EU.
For an overview of the EU Food-processing Sector, please check the U.S. Mission to the European Union sector report E35067 at http://www.fas.usda.gov/gainfiles/200504/146119335.doc.
UNCLASSIFIED USDA Foreign Agricultural Service

GAIN Report – PO7002 Page 11 of 17
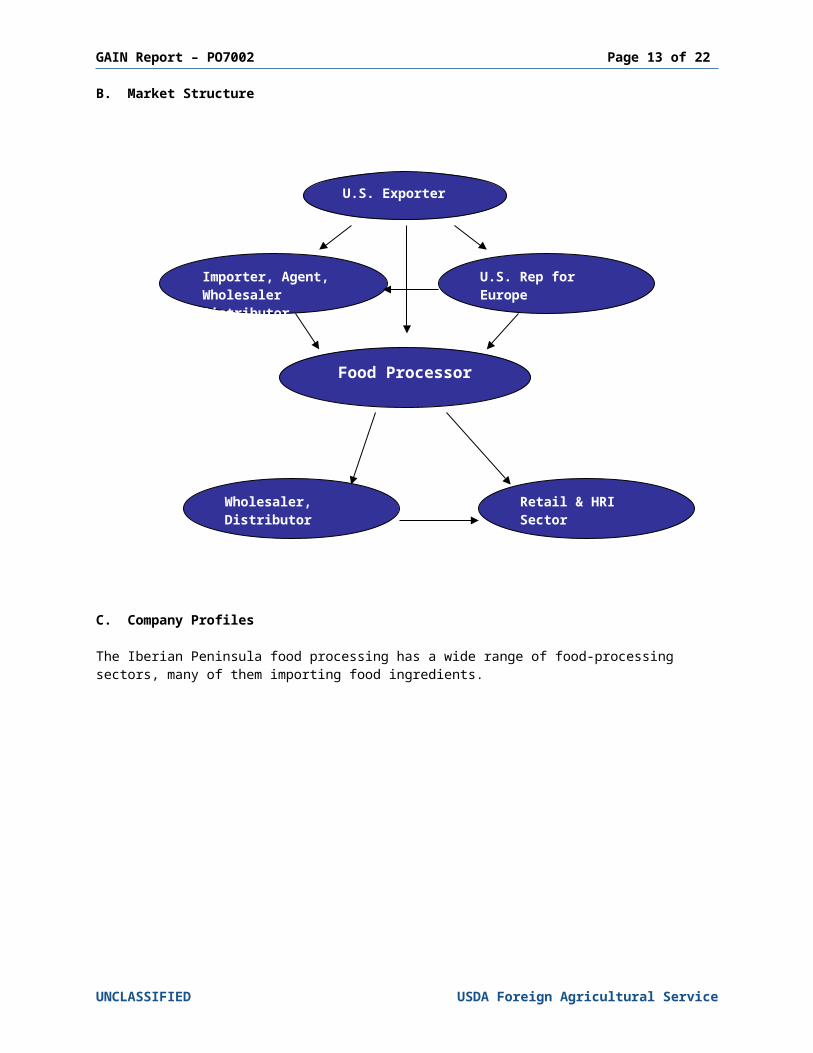
B. Market Structure
C. Company Profiles
The Iberian Peninsula food processing has a wide range of food-processing sectors, many of them importing food ingredients.
UNCLASSIFIED USDA Foreign Agricultural Service
U.S. Exporter
Importer, Agent, Wholesaler Distributor
U.S. Rep for Europe
Food Processor
Wholesaler, Distributor
Retail & HRI Sector

GAIN Report – PO7002 Page 12 of 17
Spain – Main Companies Operating in the Food-processing Industry – 2005
Subsector Company Sales (Million €)
End-Use Channels
Procurement Channels
Other Foods Ebro Puleva 2,360 Retail & HRI Importers, Direct
Dairy Products, Other Foods, and Beverage Industry Nestle España 1,998 Retail & HRI Importers, Direct
Fats & Oils and Other Foods Grupo SOS 1,255 Retail & HRI Importers, Direct
Cobega 1,200 Retail & HRI Importers, Direct
Nutreco España 1,005 Retail & HRI Importers, Direct
Fishery Products and Fruits & Vegetables Pescanova 999 Retail & HRI Importers, Direct
Beverage Industry Grupo Heineken 984 Retail & HRI Importers, Direct
Meat ProductsCampofrío Alimentación 911 Retail & HRI Importers, Direct
Other Foods, Dairy Products Unilever España 865 Retail & HRI Importers, Direct
Cooperativas Orensanas 844 Retail & HRI Importers, Direct
Source: ESADE
UNCLASSIFIED USDA Foreign Agricultural Service
GAIN Report – PO7002 Page 13 of 17
Portugal – Main Companies Operating in the Food-processing Industry - 2004
Subsector CompanySales
(Million €)End-Use Channels
Procurement Channels
Milling Industry &Other Foods CEREALIS N/A Retail & HRI Direct / Importers
Beverage Industry COCA-COLA N/A Retail & HRI Direct
Beverage Industry andFruits & Vegetables COMPAL, SA 11,126 Retail & HRI Importers, Direct
Dairy Products DANONE N/A Retail & HRI Importers, Direct
Dairy Products LACTOGAL 681 Retail & HRI Importers, Direct
Other Foods MATUTANO N/A Retail & HRI Importers, Direct
Dairy Products, Other Foodsand Beverage Industry NESTLE, SA 650 Retail & HRI Importers, Direct
Fats & Oils NUTRINVESTE, SA 616 Retail & HRI Importers, Direct
Beverage Industry andOther Foods SCHWEPPES N/A Retail & HRI Importers, Direct
Beverage Industry SUMOLIS 160 Retail & HRI Importers, Direct
Other Foods, Dairy ProductsUNILEVER BESTFOODS N/A Retail & HRI Importers, Direct
and Fats & Oils PORTUGALSource: FIPA
III. BEST PRODUCT PROSPECTS
Tree Nuts, particularly almonds and walnutsSunflower seeds,Fish and Seafood, fresh and frozenPulsesHardwood
IV. POST CONTACT AND OTHER INFORMATION
If you have any questions or comments regarding this report or need assistance exporting to Iberian Peninsula, please contact the Office of Agricultural Affairs in Madrid or Lisbon at the following address:
UNCLASSIFIED USDA Foreign Agricultural Service

GAIN Report – PO7002 Page 14 of 17
Foreign Agricultural ServiceAmerican Embassy, Madrid American Embassy, MadridPSC 61, Box 20 C/ Serrano, 75APO AE 09642 28006 MadridTel. 34-91 587 2555 SpainFax: 34-91 587 2556Email: [email protected] http://www.embusa.es/fas/index.html
For detailed information on the EU Food-processing Industry, please consult the report E35067 at http://www.fas.usda.gov/gainfiles/200504/146119335.doc.
Please consult our home page for more information on exporting U.S. food products to the Iberian Peninsula, including:
Spain
The Exporter Guide, SP6025 at http://www.fas.usda.gov/gainfiles/200609/146249056.doc;
The Retail Food Sector, SP6039 at http://www.fas.usda.gov/gainfiles/200701/146279917.doc;
The HRI Sector, SP6008 at http://www.fas.usda.gov/gainfiles/200608/146208690.doc.
Portugal
The Exporter Guide, PO6012 at http://www.fas.usda.gov/gainfiles/200609/146249055.doc;
The Retail Food Sector, PO5024 at http://www.fas.usda.gov/gainfiles/200511/146131460.doc;
The HRI Sector, PO6003 at http://www.fas.usda.gov/gainfiles/200602/146176934.doc.
Importer lists are also available from our office to exporters of U.S. food products. A list of trade associations and useful government agencies is provided below:
SPAIN
Trade Associations
FIAB- Federación de Industrias de Alimentación y Bebidas(Spanish Federation of Food and Beverage Industries)
Diego de León, 4428006 MadridTel: 34 – 91 411 7211Fax: 34 – 91 411 7344http://www.fiab.es
UNCLASSIFIED USDA Foreign Agricultural Service

GAIN Report – PO7002 Page 15 of 17
FEHR – Federación Española de Hostelería(Spanish Federation for HRIs Sector)Camino de las Huertas, 18, 1ª28223 Pozuelo de AlarcónTel: 34- 91 352 9156Fax: 34- 91 352 9026http://www.fehr.es
ASEDAS – Asociación Española de Distribuidores, Autoservicios y Supermercados(Spanish Association for Distributors and Supermarkets)
Cedaceros, 11, 2 Despacho28014 MadridTel: 34- 91 429 8956Fax: 34- 91 http://www.asedas.es
ANGED – Asociación Nacional de Grandes y Medianas Empresas de Distribución(National Association of Midsize and Large Distributors)
Velazquez, 2429006 MadridTel: 34- 91 522 3004Fax: 34 –91 522 6125http://www.anged.es
Government Agencies
Imported Foodstuffs, Infections and Compound Residues, Health Certification, Port Inspection and EU AlertsSubdireccion General de Sanidad ExteriorMinisterio de Sanidad y ConsumoPaseo del Prado, 18 y 2028014 MadridPhone: (34-91) 596-2038Fax: (34-91) 596-2047http://www.msc.es/profesionales/saludPublica/sanidadExterior/home.htm
AGENCIA ESPAÑOLA DE SEGURIDAD ALIMENTARIA (AESA)Spanish Food Safety AgencyAlcalá, 5628071 MadridFax: (34-91) 338-0375http://www.aesa.msc.es/aesa/web/AESA.jsp
UNCLASSIFIED USDA Foreign Agricultural Service

GAIN Report – PO7002 Page 16 of 17
Dirección General de la Industria Agroalimentaria y AlimentaciónMinisterio de Agricultura, Pesca y AlimentaciónMinistry of Agriculture, Fisheries and FoodPaseo de Infanta Isabel, 128014 MadridTel: 34-91 347 5361Fax: 34 – 91 347 5770http://www.mapya.es/es/alimentacion/alimentacion.htm
PORTUGAL
Trade Associations
APED-Associação Portuguesa de Empresas de Distribuição(Portuguese Association of Distribution Companies)
Campo Grande, 285-5º1700-096 Lisboa Tel: 351-21-751-0920Fax: 351-21-757-1952www.aped.pt
ARESP-Associação da Restauração e Similares de Portugal(Portuguese Associations for HRIs Sector)
Av. Duque d’Avila, 751000 LisboaTel. 351-21-352-7060Fax: 351-21-354-9428www.aresp.pt
FIPA-Federação das Indústrias Portuguesas Agro-Alimentares(Federation of the Agro-Food Portuguese Industries)
Av. António José de Almeida, 7-2º1000-042 LisboaTel: 351-21-793-8679Fax: 351-21-793-8537www.fipa.pt
Government Agencies
Direcção Geral de Fiscalização e Controlo da Qualidade Alimentar (General Directorate for Control of Food Quality)Av. Conde Valbom, 961050 LISBOATel. 351-21-798-3600Fax: 351-21-798-3834www.min-agricultura.pt
UNCLASSIFIED USDA Foreign Agricultural Service

GAIN Report – PO7002 Page 17 of 17
Direcção Geral da Alfandega e Dos Impostos Especiais sobre o Consumo(General Directorate for Customs and Special Taxation on Consumption)Rua da Alfandega, No. 5 r/c1149-006 LisboaTel. 351-218813700Fax: 351-218813990www.dgaiec.min-financas.pt
Direcção Geral da Alfandega e Dos Impostos Especiais sobre o Consumo(General Directorate for Customs and Special Taxation on Consumption)Direcção de Serviços do Licenciamentos (Import Certificates)R. Terreiro do TrigoEdif. Alfândega1149-060 LisboaTel. 351-218814262Fax: 351-218814261www.dgaiec.min-financas.pt
For more information on exporting U.S. agricultural products to other countries, please visit the Foreign Agricultural Service home page at www.fas.usda.gov.
UNCLASSIFIED USDA Foreign Agricultural Service