Embed Size (px)
Citation preview

University of Arkansas, Fayetteville University of Arkansas, Fayetteville
ScholarWorks@UARK ScholarWorks@UARK
Theses and Dissertations
5-2020
Food Safety Risk in an Indoor Microgreen Cultivation System Food Safety Risk in an Indoor Microgreen Cultivation System
Gina Marie Misra University of Arkansas, Fayetteville
Follow this and additional works at: https://scholarworks.uark.edu/etd
Part of the Bacterial Infections and Mycoses Commons, Environmental Public Health Commons, Food
Biotechnology Commons, Food Microbiology Commons, and the Food Processing Commons
Citation Citation Misra, G. M. (2020). Food Safety Risk in an Indoor Microgreen Cultivation System. Theses and Dissertations Retrieved from https://scholarworks.uark.edu/etd/3563
This Thesis is brought to you for free and open access by ScholarWorks@UARK. It has been accepted for inclusion in Theses and Dissertations by an authorized administrator of ScholarWorks@UARK. For more information, please contact [email protected].
Food Safety Risk in an Indoor Microgreen Cultivation System
A thesis submitted in partial fulfillment
of the requirements for the degree of
Master of Science in Cell and Molecular Biology
by
Gina Misra
Pennsylvania State University
Bachelor of Science in Nutrition, 2005
May 2020
University of Arkansas
This thesis is approved for recommendation to the Graduate Council.
____________________________________
Kristen E. Gibson, Ph.D.
Thesis Chair
____________________________________ ___________________________________
Steven Ricke, Ph.D. Mary Savin, Ph.D.
Committee Member Committee Member
____________________________________
Jyotisha Datta, Ph.D.
Committee Member
Abstract
Microgreens are immature sprouts of edible plants, sharing some similarities with sprouted seeds
and petite leafy greens. Since they are most often grown in containers in buildings or
greenhouses, they present a new area for food safety research at the intersection of the built
environment and produce farming. Contamination by human pathogens has been extensively
studied in other types of produce typically eaten raw, including sprouted seeds, which have been
implicated in numerous outbreaks of salmonellosis over the last several decades. There is a
paucity of knowledge about the microgreen sector of the fresh-cut industry; thus, it was
determined that a survey of operational details, microgreen varieties grown, and food safety
practices would be needed to determine research directions. Following a nationwide survey of
US-based microgreen farmers, two laboratory experiments were conducted using the most
common production system type and microgreen varieties. Soil-free growing media (SFGM) was
inoculated with Listeria monocytogenes FSL R2-574 and Salmonella enterica Javiana in a plant-
free bench scale experiment as well as during cultivation of sunflower microgreens in a fully
indoor, artificially lit, stacked track system similar to that of the microgreen farmers surveyed. It
was found that the type of SFGM influenced survival of these two pathogens, which are
commonly associated with sprouted seed outbreaks as well as several recent microgreen product
recalls. Furthermore, it was found that survival of these pathogens was enhanced in the presence
of the microgreen root environment. These results are important for informing system design
decisions by microgreen farmers.

©2020 by Gina Misra
All Rights Reserved

Acknowledgements
I would like to acknowledge and thank my advisor, Dr. Kristen E. Gibson, for her expert
guidance in the construction of my research questions, experiments, and this thesis. I would also
like to thank my lab-mates, Sarah Jones, Thomas Yeargin, Wenjun Deng, and Alyssa Ferri for
their support in conducting experiments and proofreading manuscripts and posters. I would also
like to acknowledge the support of Dr. Jyotishka Datta and Dr. Jung-Ae Lee for their valuable
assistance with the statistical analyses conducted. This work was also supported in part by the
National Institute of Food and Agriculture (NIFA), U.S. Department of Agriculture (USDA),
Hatch Act funding; the Arkansas Water Resources Center; the United States Geological Survey
(USGS) 104(b) Competitive Research Grants Program, and the University of Arkansas Doctoral
Academy Fellowship for 2017-2019.

Dedication
It is with genuine gratitude that I dedicate this work to my husband and partner in all things,
Jacob Haqq Misra. Without his tireless emotional and intellectual support, this work may not
have been completed. This thesis is only the beginning of all the great science we will do
together in the decades to come.
Table of Contents
Introduction: Why study indoor microgreen cultivation systems? ................................................. 1
I. What is controlled environment agriculture? ....................................................................... 1
II. Common CEA crops and techniques ................................................................................... 1
III. The Appeal of Indoor Farming ............................................................................................ 2
IV. Food Safety in CEA ............................................................................................................. 3
V. Microgreens ......................................................................................................................... 5
VI. References ............................................................................................................................ 7
Chapter 1: Microgreens—A review of food safety considerations along the farm to fork
continuum ..................................................................................................................................... 12
I. Abstract .............................................................................................................................. 12
II. Introduction ........................................................................................................................ 12
III. Traits of high-risk crops: how microgreens compare ........................................................ 16
i. Tissue damage increases susceptibility .......................................................................... 16
ii. Hand harvesting and farm worker hygiene .................................................................... 18
iii. Sprouts: an ideal disease vector ..................................................................................... 20
IV. The Produce Safety Rule and Guidance for the Sprout Industry ....................................... 22
i. Good Agricultural Practices ........................................................................................... 23
ii. Are commodity-specific guidelines for microgreens needed? ....................................... 24
V. Potential Control Points for Microgreens .......................................................................... 24
i. Irrigation Water and Irrigation Methods ........................................................................ 24
ii. Decontamination of the seed .......................................................................................... 26
iii. The relationship between post-harvest washing, spoilage, and contamination.............. 28
VI. Microgreen safety .............................................................................................................. 30
VII. Future Research ................................................................................................................. 35
VIII. Conclusion .................................................................................................................. 36
IX. References .......................................................................................................................... 37
X. Figures................................................................................................................................ 44
XI. Tables ................................................................................................................................. 46

Chapter 2: Characterization of Microgreen Businesses in the United States with Emphasis on
Food Safety ................................................................................................................................... 47
I. Abstract .............................................................................................................................. 47
II. Introduction ........................................................................................................................ 47
III. Materials and Methods ....................................................................................................... 51
i. Ethics statement.............................................................................................................. 51
ii. Survey development and implementation ...................................................................... 52
iii. Survey Questions............................................................................................................ 52
iv. Estimating Total Production........................................................................................... 53
v. Data Analysis ................................................................................................................. 54
IV. Results ................................................................................................................................ 55
i. Demographics................................................................................................................. 55
ii. Growing Techniques ...................................................................................................... 58
iii. Agricultural Water.......................................................................................................... 61
iv. Microgreen Varieties ...................................................................................................... 61
v. Key Food Safety Practices ............................................................................................. 62
vi. Multiple Linear Regression of Food Safety Practices .................................................... 67
vii. Survey Limitations ......................................................................................................... 68
V. Discussion .......................................................................................................................... 69
VI. References .......................................................................................................................... 73
VII. Figures................................................................................................................................ 78
VIII. Tables.......................................................................................................................... 79
Chapter 3: Survival of Salmonella enterica and Listeria monocytogenes on different types of
soil-free microgreen growing media ............................................................................................. 83
I. Abstract .............................................................................................................................. 83
II. Introduction ........................................................................................................................ 84
III. Materials and Methods ....................................................................................................... 88
i. Selection and Preparation of SFGM .............................................................................. 88
ii. Chemical Analysis of SFGM ......................................................................................... 89
iii. Preparation of Bacterial Cultures ................................................................................... 90
iv. Inoculation Method ........................................................................................................ 91

v. Recovery of Bacteria from SFGM ................................................................................. 91
vi. Sanger Sequencing of Isolates........................................................................................ 92
vii. Statistical Analysis ......................................................................................................... 93
IV. Results ................................................................................................................................ 94
i. Overview ........................................................................................................................ 94
ii. Survival of Salmonella Javiana on SFGM ..................................................................... 95
iii. Survival of Listeria monocytogenes on SFGM .............................................................. 95
iv. Pathogen Differences ..................................................................................................... 96
v. Compositional Analysis of SFGM ................................................................................. 96
vi. Differences in Recovery Efficiency Between Pathogens ............................................... 96
vii. Background Microorganisms Isolated from SFGM ....................................................... 97
V. Discussion .......................................................................................................................... 97
i. Differences Between SFGM Materials .......................................................................... 97
ii. Hemp and Biostrate Support Growth of L. monocytogenes ......................................... 100
iii. S. Javiana survived on all SFGM tested ....................................................................... 103
iv. Study Limitations ......................................................................................................... 104
VI. Conclusion ....................................................................................................................... 105
VII. References ........................................................................................................................ 107
VIII. Figures ...................................................................................................................... 112
IX. Tables ............................................................................................................................... 114
Chapter 4: Transfer and survival of Salmonella enterica and Listeria monocytogenes from soil-
free growing media to sunflower microgreens ........................................................................... 116
I. Abstract ............................................................................................................................ 116
II. Introduction ...................................................................................................................... 117
III. Materials and Methods ..................................................................................................... 119
i. Preparation of Bacterial Cultures ................................................................................. 119
ii. Preparing the Microgreen Trays ................................................................................... 120
iii. Inoculation of Growing Media ..................................................................................... 121
iv. Microgreen Cultivation ................................................................................................ 121
v. Harvesting and Sampling ............................................................................................. 122
vi. Elution and Recovery ................................................................................................... 123
vii. Statistical Analysis ....................................................................................................... 124
IV. Results .............................................................................................................................. 125
i. Salmonella Javiana survival and transfer to sunflower microgreens ........................... 125
ii. L. monocytogenes survival and transfer to sunflower microgreens ............................. 125
iii. Between-pathogen differences ..................................................................................... 126
V. Discussion ........................................................................................................................ 127
i. Pathogen Transfer to Microgreens ............................................................................... 127
ii. The Presence of Roots on SFGM ................................................................................. 128
iii. Study Limitations ......................................................................................................... 130
VI. Conclusion ....................................................................................................................... 132
VII. References ........................................................................................................................ 133
VIII. Figures ...................................................................................................................... 139
IX. Tables ............................................................................................................................... 140
Chapter 5: Conclusion and Future Research Directions ............................................................. 142
I. Operational Effects .......................................................................................................... 143
i. Does sub-irrigation decrease contamination risk of the edible product? ..................... 143
ii. Is the widely used hydrogen peroxide method effective against seed contaminants? . 143
iii. What is the impact of soaking and post-harvest washing on sunflower and peas? ...... 144
iv. Is there a difference in risk between microgreens sold cut versus “living trays”? ....... 144
II. Biological effects ............................................................................................................. 145
i. Are some microgreen varieties at greater risk of contamination than others? ............. 145
ii. Do soil-free media types transfer pathogens more or less than soil? ........................... 145
iii. Are container systems more or less risky than hydroponic? ........................................ 146
iv. Are there different risks between indoor, greenhouse, and outdoor systems? ............. 146
III. Compliance ...................................................................................................................... 147
i. What factors influence non-compliance with food safety regulatory requirements? ... 147
ii. Is a microgreen guidance for industry, separate from sprout guidance, necessary? .... 147
IV. A Path Forward for Microgreen Producers ...................................................................... 148
V. References ........................................................................................................................ 149
Appendix ..................................................................................................................................... 151
I. Chapter 2 Supplemental Information ............................................................................... 151

II. Chapter 3 Supplemental Information ............................................................................... 152
III. Chapter 4 Supplemental Information ............................................................................... 160
IV. R Code and Raw Data Repository Location .................................................................... 164

List of Tables and Figures
Chapter 1
Figure 1. Leafy green consumption and availability.
Figure 2. Microgreens and sprouts differ by age at harvest.
Figure 3. Differences in seed topography.
Table 1: Sprout Outbreaks by Year
Table 2: Sprout Outbreaks by Etiology
Table 3: Sprout Illnesses by Food Vehicle
Chapter 2
Figure 1. Farm geographic distribution by revenue category.
Table 1. Number of farm employees by revenue category
Table 2. Combinations of System Type and Location.
Table 3. Environmental Conditions Reported by Microgreen Growers.
Table 4: Frequency of Microgreen Varieties Produced.
Table 5: Summary of significant relationships found using Pearson’s Chi-Square tests.
Table 6: Water testing frequency by system type.
Table 7. Water treatment by water source.
Table 8. Frequency of Sanitation of Production Surfaces and Equipment.
Table 9. Number of Processes Documented by Revenue.
Table 10. Negative and Positive Predictors of Documentation.
Table 2-S1. Predictors of Water Testing.
Chapter 3
Figure 1. 10-Day Survival of Salmonella Javiana on SFGM.
Figure 2. 10-Day Survival of Listeria monocytogenes on SFGM.
Table 1. Chemical composition of SFGM materials.
Table 2. Background Isolates: Colony Morphology, Source, and Identity.
Table 3. Survival of S. Javiana and L. monocytogenes at day 10.
Figure 3-S1. Experimental Set-Up.
Table 3-S1. Comparison of Experiment 1 and 2 for Pooling Datasets
Table 3-S2. Water Retention Capacity of SFGM.
Table 3-S3. Recovery efficiency for each pathogen.
Table 3-S4. Salmonella Javiana ANOVA.
Table 3-S5. Listeria monocytogenes ANOVA.
Table 3-S6. Pairwise Comparisons from the Tukey HSD post-hoc analysis.
Table S7. Sequences of the SFGM Background Isolates.
Chapter 4
Figure 1. S. enterica transfer to sunflower microgreens grown in Biostrate and peat.
Figure 2. L. monocytogenes transfer to sunflower microgreens grown in Biostrate and peat.
Table 1. S. enterica mean log CFU/g change between initial and harvest.
Table 2. L. monocytogenes mean log CFU/g change between initial and harvest.
Table 3. Between-pathogen differences in mean log CFU/g change between initial and harvest by
presence of plant roots and media type.
Figure 4-S1. Microgreen Tray Sampling Diagram
Table 4-S1. Salmonella Javiana Microgreen p-values.
Table 4-S2. Salmonella Javiana SFGM p-values.
Table 4-S3. Salmonella means and standard deviations.
Table 4-S4. Listeria Microgreen p-values.

Table 4-S5. Listeria SFGM p-values.
Table 4-S6. Listeria means and standard deviations.
Table 4-S7. Between-Pathogen Microgreen p-values.
Table 4-S8. Between-Pathogen SFGM p-values.
List of Published Papers
Chapter 1. Riggio, G.M., Wang, Q., Kniel, K.E., Gibson, K.E., 2018. Microgreens—A review of
food safety considerations along the farm to fork continuum. Int. J. Food Microbiol. 290, 76–85.
https://doi.org/10.1016/j.ijfoodmicro.2018.09.027
Chapter 2. Submitted to Food Protection Trends on 2/13/2020.
Chapter 3. Submitted to the Journal of Applied Microbiology on 2/1/2020.
1
Introduction: Why study indoor microgreen cultivation systems?
What is controlled environment agriculture?
Controlled environment agriculture (CEA) encompasses a variety of non-traditional farming
methods that take place inside climate controlled buildings. Examples of CEA may include
greenhouses or high tunnels, which have transparent or translucent walls that let in natural
sunlight, or spaces with opaque walls that rely on artificial lighting. Greenhouses and fully
indoor spaces may require varying degrees of climate modulation such as heating, cooling, and
humidity control. Indoor farmers often use soil-free horticulture techniques that include
hydroponics, aquaponics, aeroponics, or growing on mats and soil alternatives.
The term “zero acreage farming” or z-farming has been coined to describe methods of indoor
farming that do not burden arable land (Specht et al. 2014, Thomaeir et al. 2015). CEA is also
referred to as protected agriculture because its climatic conditions are tightly controlled
(McCartney et al. 2018). The most commonly used term appears to be “vertical farming”
(Despommier 2011, Martin et al. 2016, McCartney et al. 2018, Mok et al. 2014, Shamshiri et al
2018, Specht et al. 2014). Vertical farming may refer to either vertically stacked artificially lit
shelves, or vertically inclined surfaces, such as outdoor “green walls” (Specht et al. 2014).
Common CEA crops and techniques
Indoor farming systems may include hydroponics, aquaponics, aeroponics, trays, gutters, or pots
with soil or soil-free media (FAO 2014). Hydroponics is a soil-free growing technique that
involves submerging plant roots into soil-free media such as gravel, vermiculite, perlite, or
pumice and flooding with a precisely mixed nutrient solution. In addition, some systems use only

2
nutrient solution with no rooting medium. Methods may include flood-and-drain, nutrient film
technique (NFT), or deep water raft culture (DWC) (Sharma et al. 2019). Aquaponics is a type of
hydroponic system that uses nitrogen-rich aquaculture wastewater as the nutrient solution instead
of more precise chemical nutrient mixtures (Forchino et al., 2017). Aeroponics involves
suspending plants above ground so that their roots are exposed to air and then sprayed with a
nutrient solution, a technique that is used mainly for growing root crops for the herbal
supplement industry (Hayden et al., 2015). Non-hydroponic soil-free techniques include growing
in coco coir or on mats made of either synthetic or natural fibers (Verhagen and Boon, 2008,
Carlile et al, 2015, Sarkar et al., 2018). Crops most commonly grown indoors include leafy
greens, herbs, and microgreens. (Agrilyst, 2016). On hydroponic and aquaponic farms in
particular, lettuce, tomatoes, peppers, and strawberries are among the primary crops grown
(Agrilyst, 2016).
The Appeal of Indoor Farming
The CEA concept is intended as a more sustainable alternative to traditional field cultivation.
Proponents claim that it allows resource-efficient, intensive, year-round fruit and vegetable
production in a variety of climates, on land that is not suitable for farming (Despommier 2011
and 2013, McCartney et al., 2018). Claims have been made that CEA will potentially solve
problems such as feeding a growing population by intensifying food production (Touliatos et al.
2016), adapting agriculture to climate change (Tirado et al. 2010), reducing food miles (Specht et
al., 2014, Eigenbrod et al., 2015) and saving water (Kozai et al., 2016, Martin and Molin, 2018).
3
Critics of CEA point to the high start-up capital and energy needed to recreate the outdoors, such
as artificial lighting, plumbing, heating, and cooling (Banerjee et al., 2014, Kalantari et al.,
2015). Others say its promise of feeding people in urban centers is overstated in terms of meeting
nutritional needs (Van Iersel 2013) and acceptance by target consumers (Guthman 2008).
Additionally, above-ground farming requires either soil or soil-free media to be purchased and
often used only once—a point which weakens the case for indoor farming as resource-efficient
and economical (Banerjee et al. 2014). Research has also pointed to risk of chemical
contamination of produce from polluted city air (Mok et al. 2014, Specht et al. 2014, Thomaeir et
al. 2015). Notably, the risk of pathogen contamination was not adequately addressed (Mok et al.
2014, Specht et al. 2014, Thomaeir et al. 2015).
Food Safety in CEA
The risk of contamination of produce by human pathogens in controlled-environment farming
has only been minimally investigated. A systematic review of CEA literature (Thomaier et al.
2015) did not reveal any food safety studies on fresh produce grown in controlled, indoor
environments. There has been discussion of food contamination by industrial pollutants such as
heavy metals, pesticides/herbicides, asbestos, petroleum products, and solvents, suggesting that
CEA may protect crops better than outdoor urban agriculture (Mok et al. 2014, Specht et al.
2014). For example, crops grown in outdoor urban gardens may have reduced yields, lower
quality, and may be more susceptible to pests and plant diseases (Bell et al. 2011); thus, these
issues may be mitigated by bringing plants into controlled settings.

4
Food safety is also important for sustainability because food production systems susceptible to
contamination by pathogens counteract the food security and human health aspects of sustainable
development. A 2016 survey of 198 indoor farms by the company Agrilyst reported that small (<
1,500 ft.2 or 140 m2) CEA farms appear more likely to be fully indoors rather than in
greenhouses (Agrilyst 2016). Scaling up indoor operations for large-scale production may
increase the number of food safety failure points. Previous research on small to medium sized
farms and farmers’ market vendors’ food safety practices demonstrates that these groups
typically struggle to maintain consistent food safety practices (Harrison et al. 2013, Behnke et al.
2012). This is discussed in further detail in Chapter 2.
In addition, pathogens may recirculate easily in air handling systems and water supplies of
closed environments such as buildings. Microbiome studies of the built environment suggest that
humans are a main driver of microbial diversity in these settings, and a wide variety of
microorganisms occupy unique niches in buildings (Kelley and Gilbert 2013, Mahnert et al.
2015, Stamper et al., 2016). The built environment may have overall lower biological diversity
compared to outdoor environments (Hanski et al. 2012, Berg et al. 2014), which may limit
competitive inhibition among microbial species, particularly between human pathogens and
environmental microorganisms (Meadow et al. 2013).
Human handling contributes significantly to contamination of fresh produce. Human pathogens
commonly associated with contamination of fresh produce include bacteria Listeria
monocytogenes, Salmonella serovars, as well as human noroviruses (Ahmed et al 2014,
Sivapalasingam et al. 2004, Herman et al. 2015, and Bennett et al. 2018). Research on L.
5
monocytogenes (Carpentier et al. 2011) as well as extensive study of Salmonella biofilm
formation on abiotic surfaces (Fatica et al., 2011, Iibuchi et al. 2010, Kusumaningrum et al.,
2003) demonstrates that these pathogens have characteristics which allow survival in the built
environment, particularly that of food production, for weeks to months or even years. The
microbiome of soil-free culture may be different from soil based growing environments
(Koohakan et al. 2004), suggesting that this may be a source of the variation between indoor and
outdoor farming. Thus, the aspects of indoor vegetable and leafy green production where human
handling is a significant factor, such as during planting or packaging, are appropriate research
targets, as well as studying the interaction between human pathogens and the various types of
soil-free growing media available for indoor farming applications.
Microgreens
Microgreens may serve as a model crop for indoor farming research. These immature shoots of
crops such as sunflower, peas, chard, beets, spinach, kale, and cilantro are a popular choice for
indoor farmers according to our US-based microgreen grower survey (see Chapter 2), and
another survey showing that 63 of the 198 farms interviewed produced microgreens (Agrilyst
2016). They are often grown indoors on stacked, artificially lit shelves, or in greenhouses, and
considered to be nutrient-dense (Weber 2017, Treadwell et al., 2016). Their seed to harvest time
is approximately 7 to 21 days (Kyriacou et al. 2016). Their relatively short life cycle combined
with their premium price and year-round production makes this crop profitable for small farmers
(gross sales < 250,000 USD/year) and attractive to entrepreneurs (Charlebois et al. 2018). They
have a short shelf life of approximately one week even under refrigeration and are used in small
quantities as garnishes, toppings, or seasonings (Xiao et al. 2012, Mir et al. 2017).

6
Microgreens have been chosen as the focus for this research because of the similarities they
share with high risk crops, specifically leafy greens and sprouts. There have been numerous
product recalls of microgreens related to Salmonella and L. monocytogenes since 2016 (CFIA
2018a-f, 2019a, and 2019b; US FDA 2016, 2018, and 2019), but no reported illnesses. Although
no recalls have yet been associated with viruses, this does not exclude them from future risk
assessment. Microgreen production has multiple steps where human hands are involved, which is
a principle route of contamination for pathogens where humans are the main reservoir (Escudero
et al. 2012, Rönnqvist et al. 2014).
This thesis first discusses the literature that has directly addressed food safety issues in
microgreen cultivation systems as well as the rationale for further research into this emerging
raw salad crop (Chapter 1). Then, a survey was conducted to understand operational details and
food safety practices of microgreen producers in the United States (Chapter 2). Finally, several
experiments were conducted to determine the survival of common produce-associated pathogens
L. monocytogenes and S. enterica on four types of soil-free growing media (SFGM) used in an
indoor, artificially lit shelf system (Chapter 3). Survival of each pathogen was then tested with
and without the presence of sunflower microgreens, and transfer to the final product was also
assessed (Chapter 4).

7
References
Agrilyst, 2016. State of Indoor Farming. Available at: https://artemisag.com/wp-
content/uploads/2019/06/stateofindoorfarming-report-2016.pdf. Date accessed: 7 Feb 2020
Agrilyst, 2017. State of Indoor Farming. Available at: https://artemisag.com/wp-
content/uploads/2019/06/stateofindoorfarming-report-2017.pdf. Date accessed: 7 Feb 2020
Behnke, C., S. Seo, and K. Miller. 2012. Assessing food safety practices in farmers’ markets.
Food Prot. Trends 32: 232–239.
Bell, J. N. B., S. A. Power, N. Jarraud, M. Agrawal, and C. Davies. 2011. The effects of air
pollution on urban ecosystems and agriculture. Int. J. Sustain. Dev. World Ecol. 18:226–235.
https://doi.org/10.1080/13504509.2011.570803
Berg, G., A. Mahnert, and C. Moissl-Eichinger. 2014. Beneficial effects of plant-associated
microbes on indoor microbiomes and human health? Front. Microbiol. 5:1–5.
https://doi.org/10.3389/fmicb.2014.00015
Canadian Food Inspection Agency, 2019a. Pousses et Cie brand Mix Spicy Microgreens recalled
due to Listeria monocytogenes. Food Recall Warnings and Allergy Alerts, May 22. Available at:
https://healthycanadians.gc.ca/recall-alert-rappel-avis/inspection/2019/70007r-eng.php. Date
accessed: 2/1/2020.
Canadian Food Inspection Agency, 2019b. Food Recall Warning - GPM brand Pea Shoots
recalled due to Listeria monocytogenes. Food Recall Warnings and Allergy Alerts, April 19.
Available at: https://www.inspection.gc.ca/food-recall-warnings-and-allergy-alerts/2019-04-
19/eng/1555725095376/1555725097506. Date accessed: 2/1/2020.
Canadian Food Inspection Agency, 2018a. Food Recall Warning - Certain Greenbelt
Microgreens brand microgreens recalled due to Listeria monocytogenes. Food Recall Warnings
and Allergy Alerts, August 25. Available at: https://www.inspection.gc.ca/food-recall-warnings-
and-allergy-alerts/2018-08-25/eng/1535250311816/1535250313826. Date accessed: 2/1/2020
Canadian Food Inspection Agency, 2018b. Lufa Farms Inc. brand Arugula Microgreens recalled
due to Salmonella. Food Recall Warnings and Allergy Alerts, June 29. Available at:
https://healthycanadians.gc.ca/recall-alert-rappel-avis/inspection/2018/67156r-eng.php. Date
accessed: 2/1/2020
Canadian Food Inspection Agency, 2018c. Correction - Food Recall Warning - Certain Greenbelt
Microgreens brand microgreens recalled due to Listeria monocytogenes. Food Recall Warnings
and Allergy Alerts, April 30. Date accessed: 2/1/2020
Canadian Food Inspection Agency, 2018d. Food Recall Warning - GPM brand Pea Shoots
recalled due to Listeria monocytogenes. Food Recall Warnings and Allergy Alerts, June 7.
Available at: http://inspection.gc.ca/about-the-cfia/newsroom/food-recall-warnings/complete-
listing/2018-06-07/eng/1528383445910/1528383449409. Date accessed: 2/1/2020
Canadian Food Inspection Agency, 2018e. Food Recall Warning - Goodleaf brand Daikon
Radish microgreens recalled due to Listeria monocytogenes. Food Recall Warnings and Allergy
Alerts, June 28. Available at: http://inspection.gc.ca/about-the-cfia/newsroom/food-recall-

8
warnings/complete-listing/2018-06-28/eng/1530237479767/1530237483085. Date accessed:
2/1/2020
Canadian Food Inspection Agency, 2018f. Updated Food Recall Warning - Evergreen Herbs
brand Pea Shoots recalled due to Listeria monocytogenes. Food Recall Warnings and Allergy
Alerts, June 7. Available at: http://inspection.gc.ca/about-the-cfia/newsroom/food-recall-
warnings/complete-listing/2018-06-07/eng/1528409624622/1528409626775. Date accessed:
2/1/2020
Carlile, W. R., C. Cattivello, and P. Zaccheo. 2015. Organic growing media: Constituents and
properties. Vadose Zo. J. 14:1–13. https://doi.org/10.2136/vzj2014.09.0125
Carpentier, B. and O. Cerf. 2011. Review Persistence of Listeria monocytogenes in food industry
equipment and premises. Int. J. Food Microbiol. 145:1–8.
https://doi.org/10.1016/j.ijfoodmicro.2011.01.005
Chance, E., Ashton, W., Pereira, J., Mulrow, J., Norberto, J., Derrible, S., Guilbert, S., 2018. The
Plant—An experiment in urban food sustainability. Environ. Prog. Sustain. Energy 37, 82–90.
https://doi.org/10.1002/ep.12712
Charlebois, S. 2018. Can Greenbelt Microgreens expand its model? A discussion on the future of
microgreens. J. Agric. Stud. 6:17. https://doi.org/10.5296/jas.v6i2.12885
Despommier, D. 2013. Farming up the city: the rise of urban vertical farms. Trends Biotechnol.
31:388–389. https://doi.org/10.1016/j.tibtech.2013.03.008
Despommier, D. 2011. The vertical farm: Controlled environment agriculture carried out in tall
buildings would create greater food safety and security for large urban populations. J. fur
Verbraucherschutz und Leb. 6:233–236. https://doi.org/10.1007/s00003-010-0654-3
Escudero, B. I., H. Rawsthorne, C. Gensel, and L. A. Jaykus. 2012. Persistence and
transferability of noroviruses on and between common surfaces and foods. J. Food Prot. 75:927–
935. https://doi.org/10.4315/0362-028X.JFP-11-460
Fatica, M. K., and K. R. Schneider. 2011. Salmonella and produce: Survival in the plant
environment and implications in food safety. Virulence 2, 573–579.
https://doi.org/10.4161/viru.2.6.17880
Forchino, A. A., H. Lourguioui, D. Brigolin, and R. Pastres. 2017. Aquaponics and
sustainability: The comparison of two different aquaponic techniques using the Life Cycle
Assessment (LCA). Aquac. Eng. 77:80–88. https://doi.org/10.1016/j.aquaeng.2017.03.002
Guthman, J. and J. Guthman. 2012. Bringing good food to others: investigating the subjects of
alternative food practice. Cultural Geographies 15(4):431–447.
https://doi.org/10.1177/1474474008094315
Hanski, I., L. Von Hertzen, N. Fyhrquist, K. Koskinen, K. Torppa, T. Laatikainen, P. Karisola, P.
Auvinen, L. Paulin, M. J. Mäkelä, E. Vartiainen, T. U. Kosunen, H. Alenius, and T. Haahtela.
2012. Environmental biodiversity, human microbiota, and allergy are interrelated. Proc. Natl.
Acad. Sci. 109:8334–8339. https://doi.org/10.1073/pnas.1205624109

9
Harrison, J. A. 2017. Food safety for farmers’ markets: A guide to enhancing safety of local
foods. Springer. https://doi.org/10.1007/978-3-319-66689-1
Hayden, A.L., T. N. Yokelsen, G. A. Giacomelli, and J. J. Hoffmann. 2015. Aeroponics: an
alternative production system for high-value root crops. Acta Hortic. 629:207–213.
https://doi.org/10.17660/actahortic.2004.629.27
Iibuchi, R., Y. Hara-Kudo, A. Hasegawa, and S. Kumagai. 2010. Survival of salmonella on a
polypropylene surface under dry conditions in relation to biofilm-formation capability. J. Food
Prot. 73, 1506–1510. https://doi.org/10.4315/0362-028X-73.8.1506
Kalantari, F., O. M. Tahir, R. A. Joni, and E. Fatemi, E., 2015. Opportunities and challenges in
sustainability of vertical eco-farming: a review. J. Landsc. Ecol. 2:98–105.
https://doi.org/10.12720/joaat.2.2.98-105
Kelley, S. T. and J. A. Gilbert. 2013. Studying the microbiology of the indoor environment.
Genome Biol. 14:1–9. https://doi.org/10.1186/gb-2013-14-2-202
Koohakan, P., H. Ikeda, T. Jeanaksorn, M. Tojo, S. I. Kusakari, K. Okada, and S. Sato. 2004.
Evaluation of the indigenous microorganisms in soilless culture: Occurrence and quantitative
characteristics in the different growing systems. Sci. Hortic. 101:179–188.
https://doi.org/10.1016/j.scienta.2003.09.012
Kozai, T., G. Niu. 2016. Role of the plant factory with artificial lighting (PFAL) in urban areas,
in: Plant Factory. Elsevier, pp. 7–33. doi.org/10.1016/B978-0-12-801775-3.00002-0
Kumar, K., O. P. Chaurasia, N. Singh, N. Sharma, S. Acharya. 2019. Hydroponics as an
advanced technique for vegetable production: an overview. J. Soil Water Conserv. 17:364.
https://doi.org/10.5958/2455-7145.2018.00056.5
Kusumaningrum, H.D., G. Riboldi, W. C. Hazeleger, and R. R. Beumer. 2003. Survival of
foodborne pathogens on stainless steel surfaces and cross-contamination to foods. Int. J. Food
Microbiol. 85:227–236. https://doi.org/10.1016/S0168-1605(02)00540-8
Kyriacou, M. C., Y. Rouphael, F. Di Gioia, A. Kyratzis, F. Serio, M. Renna, S. De Pascale, and
P. Santamaria. 2016. Micro-scale vegetable production and the rise of microgreens. Trends Food
Sci. Technol. 57:103–115. https://doi.org/10.1016/j.tifs.2016.09.005
Mahnert, A., C. Moissl-Eichinger, and G. Berg. 2015. Microbiome interplay: Plants alter
microbial abundance and diversity within the built environment. Front. Microbiol. 6:1–11.
https://doi.org/10.3389/fmicb.2015.00887
Martin, G., R. Clift, and I. Christie. 2016. Urban cultivation and its contributions to
sustainability: nibbles of food but oodles of social capital. Sustainability 8(5):409.
https://doi.org/10.3390/su8050409
Martin, M., and E. Molin. 2018. Reviewing the energy and environmental performance of
vertical farming systems in urban environments. IVL Swedish Environmental Research Institute.
McCartney, L. 2018. Protected agriculture in extreme environments: a review of controlled
environment agriculture in tropical, arid, polar, and urban locations. Appl. Eng. Agric. 34:455–
473. https://doi.org/10.13031/aea.12590

10
Meadow, J. F., A. E. Altrichter, S. W. Kembel, J. Kline, G. Mhuireach, M. Moriyama, D.
Northcutt, T. K. O’Connor, A. M. Womack, G. Z. Brown, J. L. Green, and B. M. Bohannan,
2014. Indoor airborne bacterial communities are influenced by ventilation, occupancy, and
outdoor air source. Indoor Air 24:41–48. https://doi.org/10.1111/ina.12047
Mir, S.A., M. A. Shah, and M. M. Mir. 2017. Microgreens: Production, shelf life, and bioactive
components. Crit. Rev. Food Sci. Nutr. 57:2730–2736.
https://doi.org/10.1080/10408398.2016.1144557
Mok, H.F., V. G. Williamson, J. R. Grove, K. Burry, S. F. Barker, and A. J. Hamilton. 2014.
Strawberry fields forever? Urban agriculture in developed countries: A review. Agron. Sustain.
Dev. 34:21–43. https://doi.org/10.1007/s13593-013-0156-7
Rönnqvist, M., E. Aho, A. Mikkelä, J. Ranta, P. Tuominen, M. Rättö, and L. Maunula. 2014.
Norovirus transmission between hands, gloves, utensils, and fresh produce during simulated food
handling. Appl. Environ. Microbiol. 80:5403–5410. https://doi.org/10.1128/AEM.01162-14
Sarkar, A., and M. Majumder. 2018. Suitable substrate for crop growth under protected farms –
an assessment. J. Sci. Agric. 2:62. https://doi.org/10.25081/jsa.2018.v2.860
Shamshiri, R. R., F. Kalantari, K. C. Ting, K. R. Thorp, I. A. Hameed, C. Weltzien, D. Ahmad,
and Z. Shad. 2018. Advances in greenhouse automation and controlled environment agriculture:
A transition to plant factories and urban agriculture. Int. J. Agric. Biol. Eng. 11:1–22.
https://doi.org/10.25165/j.ijabe.20181101.3210
Specht, K., R. Siebert, I. Hartmann, U. B. Freisinger, M. Sawicka, A. Werner, S. Thomaier, D.
Henckel, H. Walk, and A. Dierich. 2014. Urban agriculture of the future: An overview of
sustainability aspects of food production in and on buildings. Agric. Human Values 31:33–51.
https://doi.org/10.1007/s10460-013-9448-4
Stamper, C.E., A. J. Hoisington, O. M. Gomez, A. L. Halweg-Edwards, D. G. Smith, K. L.
Bates, K. A. Kinney, T. T. Postolache, L. A. Brenner, G. A. W. Rook, and C. A. Lowry. 2016.
The microbiome of the built environment and human behavior: implications for emotional health
and well-being in postmodern western societies. Int. Rev. Neurobiol. 131:289–323.
https://doi.org/10.1016/bs.irn.2016.07.006
Thomaier, S., K. Specht, D. Henckel, A. Dierich, R. Siebert, U. B. Freisinger, and M. Sawicka.
2015. Farming in and on urban buildings: Present practice and specific novelties of zero-acreage
farming. Renew. Agric. Food Syst. 30:43–54. https://doi.org/10.1017/S1742170514000143
Tirado, M.C., R. Clarke, A. McQuatters-Gollop, L. A. Jaykus, J. M. Frank. 2010. Climate
change and food safety: A review. Food Res. Int. 43:1745–1765.
https://doi.org/10.1016/j.foodres.2010.07.003
Touliatos, D., I. C. Dodd, and M. McAinsh. 2016. Vertical farming increases lettuce yield per
unit area compared to conventional horizontal hydroponics. Food Energy Secur. 5:184–191.
https://doi.org/10.1002/fes3.83
Treadwell, D., R. Hochmuth, L. Landrum, and W. Laughlin. 2016. Microgreens: a new specialty
crop. University of Florida, IFAS Extension. pp. 1-3
11
United States Food Drug Administration, 2016. Osage Gardens Inc. recalls Osage Gardens
Organic 2oz microgreens because of possible health risk. Recalls, withdrawals, safety alerts.
http://wayback.archive-
it.org/7993/20180126102042/https://www.fda.gov/Safety/Recalls/ucm524638.htm. Date
accessed: 12/5/19
United States Food Drug Administration, 2018. Greenbelt Greenhouse Ltd recalls Greenbelt
Microgreens brand microgreens because of possible health risk. Recalls, withdrawals, safety
alerts. https://www.fda.gov/Safety/Recalls/ucm605702.htm. Date accessed: 12/5/19
United States Food Drug Administration, 2019. Chlorofields recalls Asian microgreens because
of possible health risk. Recalls, recalls, withdrawals, safety alerts.
https://www.fda.gov/safety/recalls-market-withdrawals-safety-alerts/chlorofields-recalls-asian-
miicrogreens-because-possible-health-risk. Date accessed: 12/5/19
Van Iersel, M., 2013. The Potential — and Limitations — of Urban Farming. 2013. Resources
Magazine.
Verhagen, J. B. G. M. and H. T. M. Boon. 2008. Classification of growing media on their
environmental profile. Acta Hortic. 779:231–238.
https://doi.org/10.17660/ActaHortic.2008.779.28
Weber, C. F. 2017. Broccoli microgreens: a mineral-rich crop that can diversify food systems.
Front. Nutr. 4:1–9. https://doi.org/10.3389/fnut.2017.00007
12
Chapter 1: Microgreens—A review of food safety considerations along the farm to fork
continuum
Abstract
The food safety implications of microgreens, an emerging salad crop, have been studied only
minimally. The farm to fork continuum of microgreens and sprouts has some overlap in terms of
production, physical characteristics, and consumption. This review describes the food safety risk
of microgreens as compared to sprouts, potential control points for microgreen production, what
is known to date about pathogen transfer in the microgreen production environment, and where
microgreens differ from sprouts and their mature vegetable counterparts. The synthesis of
published research to date may help to inform Good Agricultural Practices (GAPs) and Good
Handling Practices (GHPs) for the emerging microgreen industry.
Introduction
One in ten people worldwide contract illnesses from food contaminated with infectious agents,
and 420,000 of those cases result in death (Alegbeleye et al., 2018; Hoffmann et al., 2017). The
World Health Organization reported in 2015 that Africa, Southeast Asia, and the Eastern
Mediterranean bear the greatest burden, while the Americas and Europe bear the least (World
Health Organization, 2015). Nevertheless, the most recent report of confirmed cases of
foodborne illness from the Centers for Disease Control and Prevention (CDC) in the United
States concluded that in 2015 alone there were 902 food-borne disease outbreaks resulting in
15,202 illnesses, 950 hospitalizations, 15 deaths, and 20 food product recalls (Center for
Emerging Diseases, 2015). The true figures could be greater as these events are from confirmed
outbreaks. Scallan et al. (2011) reported that an estimated 47.8 million cases of domestically

13
acquired food-borne illness may occur annually in the United States. A 2013 CDC report on the
attribution of illnesses to food commodities showed that 46% of the foods involved in outbreaks
are produce, causing 23% of the fatalities (Painter et al., 2013). Further, the CDC's Food-borne
Disease Outbreak Surveillance System reported that out of 120 multi-state outbreaks between
2010 and 2014, 17 were from fruits, 15 were from vegetable row crops, 10 were from sprouts,
and 9 were from seeded vegetables (e.g. cucumbers, mini peppers) (Crowe et al., 2015). A
myriad of pathogens can contaminate produce, including spore-forming bacteria, non-spore
forming bacteria, viruses, parasites, and prions. The multi-state outbreak report by Crowe et al.
(2015) demonstrates that the most common produce-associated bacterial pathogens are
Salmonella enterica, Listeria monocytogenes, and shiga toxin-producing Escherichia coli.
Human norovirus, the leading cause of food-associated acute gastroenteritis, is responsible for
5% of all food-borne illnesses of known etiology in the United States (Scallan et al., 2011) and
65% of those in Canada (Thomas et al., 2013). A search on September 7, 2018 for ‘norovirus’
and ‘food’ in the CDC's National Outbreak Reporting System (NORS) Database revealed that
norovirus is the major cause of outbreaks associated with leafy greens. After multiple ingredient
foods and foods considered ‘unclassifiable,’ ‘vegetable row crops,’ ‘other,’ ‘mollusks,’ and
‘fruits’ are the most common food categories implicated in norovirus outbreaks.
A 2013 report by the European Food Safety Authority (EFSA) attributed an increase in cases of
foodborne illness (from 18% to 26%), hospitalizations (from 8% to 35%) and deaths (5% to
46%) between 2007 and 2011 to one large verocytotoxigenic Escherichia coli (VTEC) outbreak
in Germany in 2011. Fenugreek sprouts were identified as the infected food and over 3800
people were affected (European Food Safety Authority, 2013). The EFSA later reported that
14
active surveillance of eight European Union (EU) member states revealed one sample of 344
collected was positive in 2016 compared to zero positive samples out of 444 collected from six
member states in 2013 (European Food Safety Authority, 2017). Produce-associated outbreaks in
the United States have also increased in the last two decades, from 8% of foodborne illness
outbreaks between 1998 and 2001 to 16% between 2010 and 2013 (Bennett et al., 2018).
Alegbeleye et al. (2018) postulated that increases in produce-related outbreaks are at least
partially due to improved surveillance and reporting. However, they suggest a true increase in
produce-associated illness may simply be a result of increased consumption of fruits and
vegetables. Data collected by the United States Department of Agriculture's Economic Research
Service (ERS/USDA) from 1990 to 2016 show that while head lettuce availability per capita and
domestic production has gone down, there has been an increase in availability and production of
romaine lettuce and a slight increase in spinach availability. There has also been an increase in
imported fresh vegetables that is suggested to correspond with an increase in imported Romaine
and head lettuce (Fig. 1).
An increase in importing supports the assertion by Alegbeleye et al. (2018) that agriculture has
become more globalized. Globalization adds challenges in regulating food safety since practices
differ between countries, such as water quality management and waste water treatment.
According to a report by the International Food Policy Research Institute (IFPRI), developing
countries often have difficulty meeting the strict food safety requirements of developed nations
(Käferstein, 2003). Lastly, agriculture has become more intensive due to increased demand for
fresh fruits and vegetables, so produce may be more likely to be in close proximity to potential

15
sources of contamination such as livestock. In these settings, fresh produce may become
contaminated via the soil, irrigation water, wildlife, insects, livestock, pets, or soil amendments
such as manure (Alegbeleye et al., 2018).
As the consumption of fresh produce is changing, so are the types of fresh produce available.
Microgreens, which are the immature shoots of products such as sunflower, peas, chard, beets,
spinach, kale, and cilantro, are an emerging salad crop. They are often grown in trays indoors or
in greenhouses and are touted for their reported high nutrient content. Microgreens have recently
grown in popularity in developed countries due to increased interest in gourmet cooking, healthy
eating, and indoor gardening. They have a relatively short shelf life even in refrigeration and are
used in small quantities as garnishes, toppings, or seasonings (Delian et al., 2015; Kyriacou et
al., 2016; Mir et al., 2017; Treadwell et al., 2010; Xiao et al., 2012).
Microgreens may be easily confused with sprouted seeds, which have been frequently implicated
in food-borne illness (Gensheimer and Gubernot, 2016). However, while microgreens share
some characteristics with sprouts, they share others with fresh herbs and petite greens. Examples
of fresh herbs include basil, thyme, and cilantro and examples of petite greens include baby
spinach and spring mix. While there is a growing body of literature on both microgreen nutrition
and physiology, only eight studies since 2009 have specifically examined the food safety risk of
microgreens. However, leafy green and sprout safety has been studied extensively. The purpose
of this review is to compare microgreens to other raw salad crops previously shown to be linked
to food-borne illness and identify potential control points given what is currently known about
how raw produce is colonized by disease-causing microorganisms.
16
Traits of high-risk crops: how microgreens compare
Produce can become contaminated at any point along the farm to fork continuum. Common
control points for growers include irrigation water, soil amendments such as manure or compost,
livestock and wild animal fecal contamination, worker health and hygiene, field and harvest
sanitation, sanitation of packing facilities, post-harvest water and handling, value-added
processing, storage, transportation, and distribution (Olaimat and Holley, 2012; Suslow, 2003).
The crops with the greatest risk of becoming contaminated with human pathogens include
lettuce, spinach, parsley, basil, berries, green onions, melons, sprouts, and tomatoes (Alegbeleye
et al., 2018). Each of these crops have earned their high-risk status because of growing
conditions that facilitate the growth or transfer of microorganisms, production methods that
expose the product to contaminants from animals or humans, and physiological characteristics of
the plant that facilitate contact and binding with microorganisms. Microgreens share some traits
with these high-risk crops.
Tissue damage increases susceptibility
Harvesting by cutting may increase susceptibility to contamination. For example, tomato stem
scars result from picking or cutting a tomato from its stem during harvest, and research in this
area demonstrates that tissue damage can expose produce to contaminants. Lin and Wei (1997)
demonstrated that Salmonella Montevideo clusters around tomato stem scars at 103 colony
forming units (CFU). At greater inoculum doses of 104 and 105 CFU, Salmonella Montevideo
spread to the interior of the tomato. Lettuce and spinach are often vehicles of produce-associated
foodborne illness (Gao et al., 2016; Waitt et al., 2014; Wang et al., 2017). Damage to leaves,
stems, and roots sustained during post-harvest processing may facilitate pathogen contamination.
17
Like tomatoes, lettuce is harvested by cutting, and the cut site may be a route of entry for
pathogens. Aruscavage et al. (2008) demonstrated that Escherichia coli O157:H7 survived better
on lettuce split along the central vein compared to healthy, undamaged leaves. Microgreen
harvesting also involves cutting by hand above the root, but to our knowledge there is no
research indicating whether the cut end of a microgreen is susceptible to contamination as
observed in lettuce and tomatoes. Sprouted seed production, however, has no cutting step
(United States and Food Drug Administration, 2017a). Therefore, contamination at the cut edge
is one contamination susceptibility of microgreens not shared by sprouted seeds.
Surface characteristics combined with tissue damage of lettuce leaves and other leafy greens may
create opportunities for contamination. For example, Wang et al. (2017) and Gao et al. (2016)
have demonstrated that lettuce leaf surfaces express glycoproteins that are biochemically similar
to histo blood group antigens (HBGA) in mammals and serve as attachment sites for norovirus
capsid proteins. Human noroviruses are the primary cause of foodborne illness associated with
leafy greens (Sivapalasingam et al., 2004; Herman et al., 2015; Bennett et al., 2018). Gao et al.
(2016) demonstrated that enzymatic degradation of red leaf lettuce, Romaine lettuce, and celery
tissue by cellulase R10 increases binding of human norovirus capsid proteins, likely due to
exposing additional binding sites. However, binding of norovirus capsid protein to HBGAs did
not occur with basil, indicating that pathogen attachment may depend at least partially on plant
variety.
Lectins and adhesins on leaf surfaces also act as binding sites for bacteria such as Salmonella and
E. coli O157:H7. These pathogens are implicated in many of the outbreaks traced to spinach and
18
lettuce (Deng and Gibson, 2017). A review by Berger et al. (2010) concluded that plant variety
and bacterial species both play a role in the ability of contaminants to attach to plant surfaces.
Even among Salmonella enterica serovars, they found that there is considerable variation in
attachment ability and mechanism. Major cell components involved in attachment include the
pilus curli, the O antigen capsule, and cellulose synthesis necessary for biofilm formation. E. coli
variants also use curli when attaching to tomatoes, spinach, and alfalfa roots. E. coli attachment
to leafy vegetables is also aided by its filamentous type III secretion system and its flagellum
(Berger et al., 2010; Olaimat and Holley, 2012). Such a phenomenon demonstrated on the leaves
of full sized vegetables suggest that it is likely to occur on microgreen leaves as well, though
more studies are needed to determine the susceptibility of individual microgreen varieties to
particular pathogens.
Hand harvesting and farm worker hygiene
Because microgreens are typically harvested by hand, it is worth considering the risks that
producers themselves contribute through inadequate hygiene. Salmonella is the most common
cause of produce-associated infections, so an extensive body of research has been focused on
understanding how this animal fecal organism finds its way to fresh fruits and vegetables
(Olaimat and Holley, 2012; Waitt et al., 2014). Inadequate worker hygiene is a major
contributing factor to contamination of produce by human pathogens, especially for hand-
harvested crops like strawberries (Moore et al., 2015). Of the pathogens identified in a review by
Todd et al. (2009) of outbreaks involving food workers between 1927 and 2006, Salmonella
species and norovirus were the most prevalent for the bacterial and viral categories, respectively,
for all food vehicles studied. Specifically, in produce, however, Salmonella was only implicated

19
in 4.6% of outbreaks and Shigella was the most commonly implicated pathogen, representing
21.2% of outbreaks involving food handlers. Todd et al. (2009) focused primarily on the service
end of the food continuum, particularly restaurant workers, which made up the majority the
studies reviewed.
Inadequate hygiene practices by farm workers also pose a risk at the production end of the food
continuum. Bartz et al. (2017) conducted a matched-pair epidemiological study of 11 farms and
calculated the odds ratios of the presence of indicator organisms on worker hands to the presence
of indicator organisms on produce. The indicator organisms chosen were total coliforms, E. coli,
Enterococcus, and coliphage and the target produce included cantaloupe, jalapeno peppers, and
tomatoes. When E. coli was found on hands, the handled produce was nine times more likely to
contain E. coli. When coliphage was present on worker hands, the handled produce was eight
times more likely to contain coliphage. Surprisingly, there was no significant relationship
between bacteria or phage in either soil or irrigation water. These data suggest that transfer from
worker hands was the main contributor of contaminants.
When the production environment and harvesting techniques are combined with specific
physiological interactions between produce and pathogens, the risk is compounded. Sprouts, the
agricultural product most closely resembling microgreens, will be described shortly as a perfect
storm of these three factors. Microgreens are similar to high-risk crops such as lettuce, berries,
green onions, melons, sprouts, and tomatoes because they, too, are frequently consumed raw.
Good Agricultural Practices (GAP) and Good Handling Practices (GHP) with respect to personal
20
hygiene and glove use are therefore even more crucial to prevent microgreens from suffering the
same fate as other uncooked produce.
Sprouts: an ideal disease vector
Sprouted seeds are an agricultural product most closely resembling microgreens. These young
germinated seeds are often eaten raw (U.S. Department of Health and Human Services, 2015)
and exemplify the intersection of production, growth, and handling conditions that allow
pathogens to thrive. A search for “sprouts” in the CDC's Food Outbreak Online Database
(FOOD) showed that products such as alfalfa, clover, and bean sprouts have been implicated in
53 outbreaks, 1876 illnesses, 209 hospitalizations, and numerous product recalls between 1998
and 2016 (Table 1). Salmonella enterica, shiga-toxin producing E. coli, L. monocytogenes, and
human norovirus genogroup I were implicated in the 1876 food-borne illnesses from sprouts
between 1998 and 2016, with Salmonella enterica alone responsible for 1675 illnesses (Table 2).
The illnesses associated with norovirus genogroup I were from a single outbreak. In early 2018,
the sandwich franchise Jimmy John's recalled alfalfa sprouts from its 2727 locations due to
patrons in Wisconsin, Minnesota, and Illinois becoming ill with Salmonella serovar Montevideo
that could be traced back to two seed lots from two Minnesota growers (Flynn, 2018).
Interestingly, Salmonella enterica appears to be the cause of more than three quarters of the
reported illnesses resulting from contaminated sprouts (Table 1), and organic soil amendments
may be a contributing factor (Jung et al., 2014). In particular, alfalfa sprouts appear to have been
the most common variety among reported sprout-linked illnesses between 1998 and 2016,
followed by mung bean and clover sprouts. One outbreak (32 illnesses) was traced specifically to
21
alfalfa seeds (Table 3). Alfalfa and clover seeds are produced in large fields primarily for animal
forage, and may be fertilized with manure. A subset of these seeds are sold to sprout producers.
If proper sterilization or heat-pelleting of manure is not performed prior to application, seeds
used for sprouts may be contaminated (Taormina et al., 1999).
Sprouts are produced by soaking seeds and then germinating them in a moist environment for
approximately 5–7 days. Therefore, they may be exposed to temperatures and moisture levels
optimal for the growth of mesophilic bacteria, including many human pathogens. Germination
conditions provide ample time for pathogen proliferation and internalization (Warriner et al.,
2005). Multiple studies have shown that pathogenic bacteria are capable of proliferating in the
sprout germination environment, including enterohemorrhagic E. coli on radish sprouts (Itoh et
al., 1998) and Vibrio cholerae O1, Salmonella Typhi, and Escherichia coli O157:H7 in alfalfa
sprouts (Castro-Rosas and Escartin, 2000). Furthermore, there is evidence that growth of
Salmonella during the sprouting process is capable of leading to outbreaks (Erdozain et al., 2013;
Stewart et al., 2001).
By contrast, microgreens are immature seedlings of edible plants wherein their seeds are soaked
only briefly, if at all, and harvested above the growth media after 10 to 21 days, between the
opening of the cotyledon and the showing of the first set of true leaves (Fig. 2). Both
microgreens and sprouts are often grown in greenhouses, high tunnels, and climate-controlled
buildings. Since sprouted seeds have been implicated in a large number of high profile food-
borne illness outbreaks as well as recalls over the past two decades (Gensheimer and Gubernot,
2016), this has led to the suspicion that microgreens may be similarly susceptible. Indeed, there
22
are enough similarities between microgreens and sprouts to warrant thorough investigation into
this emerging product. So far, there are no reported outbreaks or illnesses associated with
microgreens. However, there have been 7 microgreen product recalls since 2016 due to
contamination by either Salmonella or L. monocytogenes in the finished product as reported by
the FDA Food Recalls, Withdrawals, and Safety Alerts Database (US Food and Drug
Administration, 2016, 2018, 2019) and by the Canadian equivalent (Canadian Food Inspection
Agency, 2018a, 2018b, 2018c). No consumer illnesses were reported; in all cases the
contamination was discovered during routine quality control procedures.
The Produce Safety Rule and Guidance for the Sprout Industry
The Food Safety Modernization Act (FSMA) was signed into law on 2011 as a sweeping
measure to prevent food contamination. The Produce Safety Rule (81 FR 57784) is the section of
the FSMA finalized in November 2015 (U.S. Department of Health and Human Services, 2015)
that focuses on the prevention of contamination before, during, and after the production of fresh
fruits and vegetables typically eaten raw. The Produce Safety Rule contains specific guidelines
for sprouts, but not for microgreens. Requirements for sprouts include routine testing of the
growing environment and agricultural water for the presence of Listeria species, testing each
batch of spent sprout irrigation water or sprouts for E. coli O157:H7, Salmonella species, and
other pathogens when necessary. The rule also requires that proper corrective actions are taken if
contamination is found.
Responses to comments on the Produce Safety Rule (Comments, Sub-part A, pg. 74497) clarify
that microgreens, fresh herbs, and edible flowers are all covered under the Produce Safety Rule
23
Part 112 “Standards for the Growing, Harvesting, Packing, and Holding of Produce for Human
Consumption” that governs all other produce eaten raw. This is because, despite microgreens'
similarities to sprouts, the FDA maintains that microgreens are not sprouts due to their age at
harvest and differences in harvesting practices and are therefore not covered under the sprout
requirements in Part 112 Sub-part M of the rule. However, the FDA encourages producers of
microgreens to voluntarily comply with the sprout guidelines. For microgreen operations that
utilize hydroponics and aquaponics, the FDA recommends that producers comply with the
agricultural water and soil amendment provisions addressed in Part 112, sub-part E and F,
respectively.
Good Agricultural Practices
Good Agricultural Practices (GAPs) and Good Handling Practices (GHPs) are voluntary audits
of on-farm food safety practices that produce growers may undergo in order to demonstrate
compliance with the standards set forth by produce industry guidance documents. Commodity
specific guidelines include the 1998 “Guide to Minimize Microbial Food Safety Hazards for
Fresh Fruits and Vegetables (FDA, 1998),” the updated 2011 “Produce GAPs Harmonized Food
Safety Standard (United States Department of Agriculture, 2018),” and “Compliance with and
Recommendations for Implementation of the Standards for the Growing, Harvesting, Packing,
and Holding of Produce for Human Consumption for Sprout Operations: Guidance for Industry,”
(United States Food and Drug Administration, 2017a, 2017b). These are non-binding
recommendations that assist growers in complying with the Produce Safety Rule. The Produce
Safety Alliance (PSA) and the Sprout Safety Alliance (SSA) exist to help growers comply with
24
the requirements of the Produce Safety Rule by offering training, educational programming, and
assistance with GAP self-audits (Calvin, 2013).
Are commodity-specific guidelines for microgreens needed?
There are presently no commodity specific guidelines for microgreens. It may not be necessary
to establish a separate sub-part to the Produce Safety Rule specifically for microgreens, as many
of the general guidelines are sufficient to address any potential issues related to microgreens.
However, because microgreens share some traits in common with full-sized fresh produce and
other traits in common with sprouts, it may be necessary to develop a guidance for industry to
help microgreens growers navigate and comply with the various sub-parts of Part 112 of the
Produce Safety Rule that apply to them.
Potential Control Points for Microgreens
Microgreens have the potential to become contaminated by pathogens from seed to harvest.
Possible control points on the production continuum are outlined here. Some of these control
points are common to all raw produce, while some are unique to microgreens.
Irrigation Water and Irrigation Methods
Microgreens are often grown in greenhouses, high tunnels, and climate-controlled buildings
where contact with livestock, insects, and wildlife is minimal. Additionally, indoor and
greenhouse operations tend not to use fertilizers, manure or otherwise, because the product is
harvested after only one to three weeks (Treadwell et al., 2010; Xiao, 2013; Xiao et al., 2014b).
Irrigation water, however, is of particular concern when it comes to sprouts and microgreens,
25
especially those grown hydroponically. Studies conducted in the field indicated that norovirus,
for example, can directly contact and attach to vegetables and fruits from experimentally
contaminated irrigation water (Alum et al., 2011; Stine et al., 2005).
The type of irrigation technique affects the risk of contamination. Produce irrigation water
acquires pathogens during transportation through either canals, ditches, or pipes. Outdoor
transportation exposes water to soil bacteria and parasites while pipes expose the water supply to
biofilms. Some types of “sustainable” irrigation systems may compound the risk of microbial
contamination, such as gray-water recycling and rainwater collection tanks. Drip irrigation
reduces the risk of produce contamination compared to overhead spray irrigation due to limiting
exposure of the edible portion of the plants to the water (Painter et al., 2013; Solomon et al.,
2002).
Surface water sources such as nearby rivers, lakes, and streams have been to blame for many
large outbreaks of food-borne illness. In 2011, 390 elementary schools and child care facilities
contracted norovirus from contaminated frozen strawberries imported from China. The
investigators hypothesized that, due to the size of the outbreak, the source may have been
norovirus-contaminated irrigation water (Bernard et al., 2014). A 2012 outbreak of Salmonella
Litchfield in Australia affecting 26 people was traced back to contaminated river water that was
being used to wash papayas. In the United States, an E. coli O157:H7 outbreak in 2006 in
prepackaged spinach affecting 205 people was traced back to contaminated surface water; the
clinical isolate was detected in nearby river water and in cow and pig feces from a nearby farm
(Gelting, 2007). Four outbreaks of acute gastroenteritis associated with norovirus isolates from

26
cabbage kimchi occurred in South Korea between 2008 and 2012 and were traced back to
contaminated irrigation water (Cho et al., 2014).
Since microgreens are grown in trays in greenhouses or on artificially lit shelves indoors,
producers may be more likely to water from municipal sources, groundwater, gray water, or
collected rainwater. A review by Uyttendaele et al. (2015) concluded that municipal water is of
the best microbial quality, followed by groundwater, gray water, and collected rainwater.
Groundwater quality can be compromised, however, if the reservoir is too shallow, if heavy
rainfall floods reservoirs with feces and microorganisms on land, or a nearby septic system or
sewage line leaks. Roof-top collected rainwater may become contaminated by bird droppings
and insects found on rooftops.
Decontamination of the seed
Seed contamination is a well-known problem in the sprout industry. If seeds are contaminated,
pathogens can become internalized from the beginning of the growing process and once
incorporated are very difficult to remove (Wang and Kniel, 2016). Because of this, a significant
body of literature has grown out of efforts to determine effective seed disinfection procedures.
The FDA cites 20,000 ppm calcium hypochlorite as the standard method of chemical disinfection
(US Food and Drug Administration, 1999), though adoption of this practice by growers may vary
widely. Harrison (2017) reported, for example, that many growers selling at farmers' markets had
limited food safety knowledge related to fresh produce, leading to the assumption that
disinfection practices are not standard. Additionally, sprout producers who are seeking organic
certification may not be permitted to use chlorine compounds on their products at levels

27
exceeding the Environmental Protection Agency's standards for drinking water, which are 0.8
ppm (Organic Standards, EPA Water Standards)
A review of sprout seed disinfection techniques by Ding et al. (2013) found that across 44
published articles, 18 of which tested the FDA recommendation of 20,000 ppm calcium
hypochlorite, the standard 10 to 15-minute soak enabled a mean reduction in bacterial load of
3.08 log CFU/g with a standard deviation of 2.03 log CFU/g. The concentrated hypochlorite
treatment had roughly twice the variability of the non-chemical methods such as heat treatment
and irradiation compared in Ding et al. (2013), likely due to slightly differing protocols used by
growers and the physical characteristics of the seed. For example, rough textured or scarified
seeds were more difficult to disinfect than smooth seeds. It was hypothesized that bacteria and
viruses are able to hide in the crevices of the seed surface and evade contact with disinfectants.
Microgreen varieties such as pea shoots and sunflower are smooth in texture, but other varieties
such as chard and beet have a rough, irregular surface (Fig. 3). Therefore, investigations into
seed disinfection strategies for different microgreen varieties may be necessary.
With sprouts and microgreens, germination rate is a critical factor in production. Ding et al.
(2013) demonstrated that physical methods such as heat treatment also boast high log CFU/g
reductions, but it is a balancing act to achieve adequate reduction without compromising
germination rate. High pressure treatment, out of all of the methods surveyed by Ding et al.
(2013), demonstrated the lowest variability (standard deviation=0.94 log CFU/g) and the highest
mean reduction of 5.09 log CFU/g with insignificant effects on seed germination rate. High-
pressure treatment also has the advantage of being amenable to organic certification, though

28
potentially more expensive for small operations than chemical treatments because it requires
special equipment (Wuytack et al., 2003).
Biological control is a relatively new attempt at dealing with seed contamination, though it is
difficult to assess effectiveness of the methods because of the very specific environmental
conditions of each approach. Studies have involved competition by communities of normal flora
(Matos and Garland, 2005) and bacteriophage (Kocharunchitt et al., 2009) to control levels of
unwanted bacteria with some success. There are potential health risks associated with these
methods due to the many unknowns involved, and may be difficult to scale beyond the bench.
The relationship between post-harvest washing, spoilage, and contamination
Since microgreens have a relatively short shelf life of 3-5 days even in refrigeration and are used
in small quantities (Kou et al., 2014), it is important to determine if there is any connection
between produce spoilage and contamination by human pathogens. As stated in a previous
section, plant tissue damage creates opportunities for pathogen attachment or entry. In addition
to damage by human handlers and harvesting tools (Lin and Wei, 1997; Moore et al., 2015; Bartz
et al., 2017), enzymatic digestion by spoilage microorganisms may facilitate contamination. Gao
et al. (2016) demonstrated this possibility in their study on virus attachment to lettuce leaves.
Virus attachment to the leaf surface increased significantly after enzymatic digestion by
cellulase. They also found that virus attachment increased when the leaf cuticle was peeled back,
suggesting that the cuticle offers some protection.

29
Damage may also occur during post-harvest washing. In an effort to determine if post-harvest
calcium chloride wash would have a measurable effect on shelf life of broccoli microgreens, Kou
et al. (2015) found that the washing procedure itself decreased shelf life from 21 days to 14 days
due to mechanical damage during rinsing, spinning, and drying. They also found that chlorine
washes at 50 and 100 ppm were not effective at altering shelf life.
Refrigeration temperatures may also play a role. Kou et al. (2013) found that buckwheat
microgreens stored at 1 °C suffered tissue damage, whereas buckwheat microgreens stored at 5
°C and 10 °C did not. The tissue damage corresponded to a greater increase in aerobic plate
counts (APC) toward the end of the storage period. However, Xiao et al. (2014b) found that
radish microgreens retained their quality best at 1 °C compared to 5 °C and 10ׄ°C. It is possible
that there is a differential tolerance to temperature among microgreen varieties. They also found
that a 100 ppm chlorine wash did not extend shelf life as aerobic mesophilic bacteria (AMB)
increased by almost 4 log CFU by the seventh day of storage.
It appears to be important to prevent the growth of both pathogenic and spoilage related
microorganisms earlier in the production chain, especially since post-harvest washing may cause
tissue damage. Kou et al. (2014) tested the effects of a pre-harvest spray of calcium chloride,
rather than a post-harvest wash. The spray seemed to have a beneficial effect on the post-harvest
quality and shelf life of broccoli microgreens based on reduced tissue electrolyte leakage and
lower microbial growth during storage.

30
Microgreen safety
While there is a growing body of work on the health benefits of microgreens, there are very few
reports on microgreen safety. Only eight reports of specific investigations into food safety risk of
microgreens have been published to date, the first of which was Lee et al. (2009). After washing
Chinese cabbage (Brassica campestris var. narinosa) microgreens in distilled water and two
different concentrations of chlorine (50 ppm and 100 ppm) at two different water temperatures (5
°C and 25 °C), post-storage quality measurements and APC were compared. The data suggest
that both concentrations of chlorinated water reduced APC more effectively than non-chlorinated
water. Warmer wash water appeared to have a slightly stronger effect on reducing APC
compared to cooler wash water. However, by the sixth day of storage, APC had increased from 7
log CFU to greater than 9 log CFU for test groups and controls. Additionally, the authors stated
that as other measures of microgreen quality decreased, APC increased.
Chandra et al. (2012) studied Chinese cabbage microgreens and compared quality measurements,
total coliforms, and APC after washing in four disinfectant mixtures and holding at 5 °C for 9
days. The disinfectant mixtures used were tap water (control), 100 mL/L chlorine, a citric
acid/ascorbic acid mixture (0.25 percent w/v of each), and a 0.50 percent w/v citric acid solution
followed by a 50 percent ethanol spray. The effect of packaging material was also considered.
Two sets of microgreens were treated by the aforementioned methods and then were stored in
either polypropylene or polyethylene containers. In both container types, APC was lower in
microgreens treated with 100 ppm chlorine and the citric acid/ethanol treatment. Similar to Lee
et al. (2009), counts rebounded around the sixth day to a log CFU level exceeding pre-wash
levels.

31
Total coliform counts demonstrated by Chandra et al. (2012) sharply increased over three days in
storage, and then began to slightly decrease after the 9th day. They failed to return to baseline
levels. This pattern was observed regardless of treatment method or storage container, although
the 100 ppm chlorine and citric acid/ethanol spray treatments resulted in overall lower log CFU/g
of coliform bacteria compared to the other treatments for both types of packaging. These results
were reported to be statistically significant at a p-value less than 0.05. The researchers stated that
the reason for this decrease in proliferation is unclear and may be a result of multiple
confounding variables in the storage environment including water content, pH, storage
temperature, and relative humidity. Nevertheless, it can be surmised by these results that none of
the sanitizing treatments tested were able to effectively reduce the log CFU/g of coliform
bacteria on cabbage microgreens sufficiently enough to prevent regrowth.
Xiao et al. (2014) performed several experiments exploring the proliferation of two strains of E.
coli on experimentally contaminated radish seeds. The starting inoculation levels were compared
to the harvest levels of these E. coli strains at both the sprout stage and the microgreen stage. The
microgreen stage had consistently lower counts at harvest relative to the inoculation level, even
though the microgreens and sprouts came from the same batch of contaminated seeds. Watering
overhead or from below made no significant difference in the proliferation of E. coli on the
edible parts of the microgreen; however, the inedible parts showed greater growth that appeared
to correspond with greater levels in the soil.
Xiao et al. (2015) compared the type of growth media on the proliferation of E. coli O157:H7
from seed to harvest of radish microgreens. Radish seeds were inoculated at low and high levels
32
of E. coli and radish microgreens were grown in a peat moss based soil substitute and in a
hydroponic system. Compared to soil-grown microgreens, there was a large, statistically
significant increase in proliferation of E. coli on the hydroponically grown plants. This occurred
on both the edible and inedible plant parts as well as the hydroponic water. The researchers
suggested that there could be competitive microbiota in the germination mix that inhibits the
growth of E. coli compared to the hydroponic media.
These findings suggest that exposure to moisture is a significant contributing factor to the spread
of E. coli in microgreen growing systems. In addition to E. coli cell counts, the researchers also
assessed the spatial distribution of E. coli cells on various parts of the microgreen using a green
fluorescent protein (GFP) labeled E. coli strain viewed with laser confocal scanning microscopy.
Spatial analysis showed that the seed coat was the most densely populated part of the
microgreen, whereas the hypocotyl and cotyledon were much less densely populated.
A comparison of the native microbial populations on different types of growth media was
performed by Di Gioia et al. (2017). They measured AMB, yeast and molds (YM),
Enterobacteriaceae, and E. coli. Their data showed that food-grade plastic mats had the lowest
overall AMB and YM levels, whereas peat had the highest levels. Peat and jute-kenaf grown
microgreens had the highest levels of AMB and YM, and peat had the highest levels of
Enterobacteriaceae. The microgreens grown on textile fibers and food-grade plastic mats had no
detectable levels of Enterobacteriaceae or E. coli in the edible portion of the plant, indicating that
they were not as easily transferred to the edible part of the plant from those media. Conversely,
33
the jute-kenaf fiber growing media did not have detectable levels of Enterobacteriaceae but this
group of bacteria was strongly detected on the microgreens.
Researchers have also investigated the role of contaminated hydroponic nutrient water on the
persistence and transmission of viruses, using murine norovirus (MNV) as a surrogate for human
norovirus, the primary cause of food-borne disease outbreaks in the US. Wang and Kniel (2016)
grew kale and mustard microgreens in a hydroponic system that was artificially contaminated by
3.5 log PFU/mL of MNV on the 8th day of growth. Water and microgreen tissue samples were
collected at 2, 4, 8, and 12 h immediately following inoculation. After day 8, water and
microgreen tissue samples were collected daily until the 12th day. This design enabled
monitoring of detectable levels of virus taken up by the plants in addition to the rate of die-off
toward the end of harvesting.
Virus survival immediately following inoculation remained relatively consistent at ~2 log
plaque-forming units per milliliter of water (PFU/mL) for up to 12 h of sampling. By day 12,
MNV only decreased by around 1 log PFU/sample (statistically significant) in both varieties of
microgreens. This decrease was similar for internalized virus as well as its concentration in the
hydroponic nutrient water. The virus was also detected at around 1–2 log PFU/mL in the
hydroponic water for up to 16 days post-inoculation and contaminated the next crop of
microgreens at detectable levels in both root and shoot tissue. These findings demonstrate that
MNV can persist at detectable levels in hydroponic systems for at least several weeks from an
initial inoculation of 3.5 log PFU/mL. There were no statistically significant differences overall
between kale and mustard.

34
Wright and Holden (2018) studied the colonization of nine varieties of microgreens by shiga-
toxin producing E. coli serovar Sakai (STEC). Experiments were conducted on seeds
contaminated directly at 3 log CFU/g and on seeds grown with contaminated irrigation water at 7
log CFU/g. Varieties tested were amaranth, broccoli, kale, mustard, coriander, rocket, basil,
parsley, and radish. Colonization for eight of the nine microgreen varieties exceeded 8 log
CFU/g of fresh weight. Basil was the only variety to show a final STEC level of less than 8 log
CFU/g with 7.21 log CFU/g of fresh weight. Previous research by Gao et al. (2016) has shown
that basil is also less likely to be colonized by a norovirus surrogate, again pointing to possible
plant variety differences.
Reed et al. (2018) was able to demonstrate differences in colonization between Salmonella
enterica serovars Hartford and Cubana on alfalfa sprouts and Swiss chard microgreens. External
factors tested were growth media, storage time, contamination of either seed or water, and
inoculation level. For sprouts and microgreens grown from contaminated seeds, increasing the
inoculation level from 10 to 100 CFU/g of seed had the most influence on colonization of both
microgreens and sprouts, regardless of serovar. However, for sprouts, increasing storage time
from 7 to 28 days allowed S. enterica levels to decrease by half. For microgreens, Cubana was
less prolific at 10 CFU/g of seed, but was equivalent to Hartford once inoculation was increased
by one order of magnitude. A community analysis demonstrated that the sprout rhizosphere was
more species-rich compared to microgreens. Hydroponic media showed overall greater
colonization by both serovars compared to either soil mixture, which is consistent with previous
research by Xiao et al. (2015) and Wang and Kniel (2016).

35
Future Research
Given what is currently known about bacterial and viral contamination of microgreens, many
questions remain. Sunflower microgreens and pea shoots have not yet been the subject of any
microbiological or viral studies, yet they are popular for producers due to the low cost of seeds,
consistent germination rate, and high average fresh weight (Personal communication with
beginning growers). They are also popular for beginners who may be even less attentive than
established commercial operations to food safety protocols. Reed et al. (2018) and Wang and
Kniel (2016) are so far the only investigators that compared multiple microgreen varieties. These
as well as Gao et al. (2016) suggest that there is a species effect for both contaminant and
product, though the sample sizes were small. Furthermore, most of the research into microgreen
safety has been focused on bacteria, particularly Salmonella spp. and E. coli, likely due to
regulatory requirements and the prevalence of these microbes in food-borne illness outbreaks.
Viral contamination of microgreens should be explored further, in particular the attachment of
norovirus to microgreen leaves, internalization of the virus during the growing process, and
possible prevention measures. Further research on the contributions of hand harvesting versus
cutting are recommended. Only Di Gioia et al. (2017) compared different types of growth media
on contamination risk; these experiments need to be replicated and expanded. Additionally,
earlier papers that measured AMB and coliform levels along with spoilage indicators suggested
that these two factors may have an inverse relationship, though no formal correlation has been
shown. Due to the short shelf life of microgreens and their tendency to be used only in small
quantities, understanding the relationship between spoilage and contamination by pathogens is
important.

36
Conclusion
The limited amount of data available suggests that microgreens may very well be of lower risk
than sprouts in terms of food-borne illness, but the background level of bacteria is greater than
that of conventional vegetables (Chandra et al., 2012; Lee et al., 2009) and is more similar to
sprouts. Hydroponically grown microgreens appear to be much more susceptible to bacterial
colonization compared to any solid media tested (Wang and Kniel, 2016; Xiao et al., 2015).
Spoilage and shelf life may be linked to contamination by pathogens (Gao et al., 2016; Kou et
al., 2013; Kou et al., 2015; Xiao et al., 2014a, 2014b). The variety of microgreen and the serovar
of the contaminant may influence risk. Postharvest washes appear so far to be ineffective and
may actually increase contamination risk due to tissue damage that invites pathogens among
other microorganisms (Kou et al., 2015). Pre-harvest spraying with disinfectants may provide a
valid alternative the post-harvest wash for ameliorating surface contamination. Seed
decontamination appears to be a critical ongoing discussion (Kou et al., 2014).
37
References
Alegbeleye, O., I. Singleton, A. Sant'Ana. 2018. Sources and contamination routes of microbial
pathogens to fresh produce during field cultivation: a review. Food Microbiol. 73:177–208.
https://doi.org/10.1016/j.fm.2018.01.003.
Alum, A., C. Enriquez, and C. P. Gerba. 2011. Impact of drip irrigation method, soil, and virus
type on tomato and cucumber contamination. Food Environ. Virol. 3:78–85. https://
doi.org/10.1007/s12560-011-9060-y.
Aruscavage, D., S. A. Miller, M. L. Ivey, K. Lee, and J. T. Lejeune. 2008. Survival and
dissemination of Escherichia coli O157:H7 on physically and biologically damaged lettuce
plants. J. Food Prot. 71:2384–2388. https://doi.org/10.4315/0362-028X-71. 12.2384.
Bartz, F. E., J. S. Lickness, N. Heredia, A. F. DeAceituno, K. L. Newman, D. W. Hodge, L. A.
Jaykus, S. García, and J. S. Leon. 2017. Contamination of fresh produce by microbial indicators
on farms and in packing facilities: elucidation of environmental routes. Appl. Environ. Microbiol.
83:1–10. https://doi.org/10.1128/AEM.02984-16.
Bennett, S. D., S. V. Sodha, T. L. Ayers, M. F. Lynch, L. H. Gould, and R. V. Tauxe. 2018.
Produce-associated foodborne disease outbreaks, USA, 1998–2013. Epidemiol. Infect.
146:1397–1406. https://doi.org/10.1017/S0950268818001620.
Berger, C. N., S. V. Sodha, R. K. Shaw, P. M. Griffin, D. Pink, P. Hand, and G. Frankel. 2010.
Fresh fruit and vegetables as vehicles for the transmission of human pathogens. Environ.
Microbiol. 12:2385–2397. https://doi.org/10.1111/j.1462-2920.2010. 02297.x.
Bernard, H., M. Faber, H. Wilking, S. Haller, M. Höhle, A. Schielke, T. Ducomble, C. Siffczyk,
S. Merbecks, G. Fricke, O. Hamouda, K. Stark, and D. Werber. 2014. Large multistate outbreak
of norovirus gastroenteritis associated with frozen strawberries, Germany, 2012. Eur. Secur. 19.
https://doi.org/10.2807/1560-7917.ES2014.19.8. 20719.
Calvin, L., 2013. The Food Safety Modernization Act and the Produce Rule. Vegetables and
pulses outlook. USDA Economic Research Service. VGS-353-SA2. March 29, 2013.
https://www.ers.usda.gov/webdocs/publications/39535/41022_vgs353sa2. pdf?v=42125.
Canadian Food Inspection Agency, 2018a. Food Recall Warning - Goodleaf brand Daikon
Radish microgreens recalled due to Listeria monocytogenes. (June 28, 2018). http://
inspection.gc.ca/about-the-cfia/newsroom/food-recall-warnings/complete-listing/ 2018-06-
28/eng/1530237479767/1530237483085.
Canadian Food Inspection Agency, 2018b. Updated Food Recall Warning - Evergreen Herbs
brand Pea Shoots recalled due to Listeria monocytogenes. (June 7, 2018).
http://inspection.gc.ca/about-the-cfia/newsroom/food-recall-warnings/completelisting/2018-06-
07/eng/1528409624622/1528409626775.
Canadian Food Inspection Agency, 2018c. Food Recall Warning - GPM brand Pea Shoots
recalled due to Listeria monocytogenes. (June 7, 2018). http://inspection.gc.ca/ about-the-
cfia/newsroom/food-recall-warnings/complete-listing/2018-06-07/eng/
1528383445910/1528383449409.

38
Castro-Rosas, J., and E. F. Escartin. 2000. Survival and growth of Vibrio cholerae O1,
Salmonella Typhi, and Escherichia coli O157: H7 in alfalfa sprouts. J. Food Sci. 65:162–165.
Chandra, D., J. G. Kim, and Y. P. Kim. 2012. Changes in microbial population and quality of
microgreens treated with different sanitizers and packaging films. Hortic. Environ. Biotechnol.
53:32–40. https://doi.org/10.1007/s13580-012-0075-6.
Cho, H. G., S. G. Lee, W. H. Kim, J. S. Lee, P. H. Park, D. S. Cheon, W. H. Jheong, E. H. Jho, J.
B. Lee, and S. Y. Paik. 2014. Acute gastroenteritis outbreaks associated with ground-waterborne
norovirus in South Korea during 2008–2012. Epidemiol. Infect. 142, 2604–2609.
https://doi.org/10.1017/S0950268814000247.
Crowe, S.J., B. E. Mahon, A. R. Vieira, L. H. Gould. 2015. Vital signs: multistate food- borne
outbreaks - United States, 2010–2014. MMWR 64, 1221–1225. https://doi.
org/10.15585/mmwr.mm6443a4.
Delian, E., A. Chira, L. Bădulescu, and L. Chira, L. 2015. Insights into microgreens physiology.
Horticulture 59:447–454. https://www.cabdirect.org/cabdirect/abstract/ 20153335905.
Deng, W. and K. E. Gibson. 2017. Interaction of microorganisms within leafy green
phyllospheres: where do human noroviruses fit in? Int. J. Food Microbiol. 258:28–37.
https://doi.org/10.1016/j.ijfoodmicro.2017.07.010.
Di Gioia, F., P. De Bellis, C. Mininni, P. Santamaria, and F. Serio, F. 2017. Physicochemical,
agronomical and microbiological evaluation of alternative growing media for the production of
rapini (Brassica rapa L.) microgreens. J. Sci. Food Agric. 97:1212–1219.
https://doi.org/10.1002/jsfa.7852.
Ding, H., T. J. Fu, and M. Smith. 2013. Microbial contamination in sprouts: how effective is
seed disinfection treatment? J. Food Sci. 78:R495–R501. https://doi.org/10.1111/ 1750-
3841.12064.
Erdozain, M.S., K. J. Allen, K. A. Morley, and D. A. Powell. 2013. Failures in sprouts-related
risk communication. Food Control 30:649–656. https://doi.org/10.1016/j.foodcont. 2012.08.022.
European Food Safety Authority, 2013. Scientific opinion on the risk posed by pathogens in food
of non-animal origin. Part 1 (outbreak data analysis and risk ranking of food/ pathogen
combinations). EFSA J. https://doi.org/10.2903/j.efsa.2013.3025.
European Food Safety Authority, 2017. The European Union summary report on trends and
sources of zoonoses, zoonotic agents and food-borne outbreaks in 2016. EFSA J. 15 (12), 5077.
https://doi.org/10.2903/j.efsa.2017.5077.
Flynn, D., 2018. Jimmy Johns pulls sprouts from all 2,727 franchise locations. Food Safety
News. Available at: https://www.foodsafetynews.com/2018/01/jimmy-johns-pulls- sprouts-from-
menu-at-all-2727-franchise-locations/. Date accessed: 6/5/2018
Gao, X., M. A. Esseili, Z. Lu, L. J. Saif, and Q. Wang. 2016. Recognition of histo-blood group
antigen-like carbohydrates in lettuce by human GII.4 norovirus. Appl. Environ. Microbiol.
82:2966–2974. https://doi.org/10.1128/AEM.04096-15.

39
Gelting, R., 2007. Investigation of an Escherichia coli O157:H7 Outbreak Associated With Dole
Pre-packaged Spinach. CDC National Center for Environmental Health, pp. 1–51.
https://www.cdc.gov/nceh/ehs/docs/investigation_of_an_e_coli_outbreak_
associated_with_dole_pre-packaged_spinach.pdf (95899).
Gensheimer, K., and D. Gubernot. 2016. 20 years of sprout-related outbreaks: FDA's
investigative efforts. Open Forum Infect. Dis. 3(1):1438. https://doi.org/10.1093/
ofid/ofw172.1140. (Poster Abstract).
Harrison, J. A. 2017. Potential food safety hazards in farmers’ markets. In: Food Safety for
Farmers Markets: A Guide to Enhancing Safety of Local Foods. Springer International
Publishing, pp. 23–37. https://doi.org/10.1007/978-3-319-66689-1_3.
Herman, K. M., A. J. Hall, and L. H. Gould. 2015. Outbreaks attributed to fresh leafy vegetables,
United States, 1973–2012. Epidemiol. Infect. 143:3011–3021. https://doi.
org/10.1017/S0950268815000047.
Hoffmann, S., B. Devleesschauwer, W. Aspinall, R. Cooke, T. Corrigan, A. Havelaar, F. Angulo,
H. Gibb, M. Kirk, R. Lake, N. Speybroeck, P. Torgerson, T. Hald. 2017. Attribution of global
foodborne disease to specific foods: findings from a World Health Organization structured expert
elicitation. PLoS One 12. https://doi.org/10. 1371/journal.pone.0183641.
Itoh, Y., Y. Sugita-Konishi, F. Kasuga, M. Iwaki, Y. Hara-Kudo, N. Saito, Y. Noguchi, H.
Konuma, and S. Kumagai.1998. Enterohemorrhagic Escherichia coli O157:H7 present in radish
sprouts. Appl. Environ. Microbiol. 64(4):1532–1535. https://www.ncbi.
nlm.nih.gov/pubmed/9546189.
Jung, Y., H. Jang, and K. R. Matthews. 2014. Effect of the food production chain from farm
practices to vegetable processing on outbreak incidence. Microb. Biotechnol. 7:517–527.
https://doi.org/10.1111/1751-7915.12178.
Käferstein, F. K., 2003. In: Unnevehr, L. (Ed.), Food Safety in Food Security and Food Trade,
Food safety as a public health issue for developing countries. International Food Policy Research
Institute, Washington, DC, pp. 4–6. https://ideas.repec.org/p/ fpr/2020br/1002.html.
Kocharunchitt, C., T. Ross, and D. L. McNeil. 2009. Use of bacteriophages as biocontrol agents
to control Salmonella associated with seed sprouts. Int. J. Food Microbiol. 128:453–459.
https://doi.org/10.1016/J.IJFOODMICRO.2008.10.014.
Kou, L., Y. Luo, T. Yang, Z. Xiao, E. R. Turner, G. E. Lester, Q. Wang, and M. J. Camp. 2013.
Postharvest biology, quality and shelf life of buckwheat microgreens. Lebensm. Wiss. Technol.
51:73–78. https://doi.org/10.1016/j.lwt.2012.11.017.
Kou, L., T. Yang, X. Liu, and Y. Luo. 2014. Pre-harvest calcium application increases biomass
and delays senescence of broccoli microgreens. Postharvest Biol. Technol. 87:70–78.
https://doi.org/10.1007/s10499-012-9533-5.
Kou, L., T. Yang, X. Liu, and Y. Luo. 2015. Effects of pre- and postharvest calcium treatments
on shelf life and postharvest quality of broccoli microgreens. Hortic. Sci. 50:1801–1808.
40
Kyriacou, M. C., Y. Rouphael, F. DiGioia, A. Kyratzis, F. Serio, M. Renna, S. De Pascale, P.
Santamaria. 2016. Micro-scale vegetable production and the rise of microgreens. Trends Food
Sci. Technol. 57, 103–115. https://doi.org/10.1016/j.tifs.2016. 09.005.
Lee, J. S., J. Kim, and S. Park. 2009. Effects of chlorine wash on the quality and microbial
population of ‘Tah Tasai’ Chinese cabbage (Brassica campestris var. narinosa) microgreen. Kor.
J. Hortic. Sci. Technol. 27:625–630.
Lin, C. and C. Wei. 1997. Transfer of Salmonella Montevideo onto the interior surfaces of
tomatoes by cutting. J. Food Prot. 60:858–862.
Matos, A. and J. Garland. 2005. Effects of community versus single strain inoculants on the
biocontrol of Salmonella and microbial community dynamics in alfalfa sprouts. J. Food Prot.
68:40–48. https://doi.org/10.4315/0362-028X-68.1.40.
Mir, S. A., M. A. Shah, and M. M. Mir. 2017. Microgreens: production, shelf life, and bioactive
components. Crit. Rev. Food Sci. Nutr. 57, 2730–2736. https://doi.org/10.1080/
10408398.2016.1144557.
Moore, K., A. Shober, G. Hasing, C. Wiese, and N. West. 2015. Importance of hand hygiene
during the harvesting of strawberries. Hortic. Technol. 25(3):261–265.
Olaimat, A. N. and R. A. Holley. 2012. Factors influencing the microbial safety of fresh produce:
a review. Food Microbiol. 32:1–19. https://doi.org/10.1016/j.fm.2012.04. 016.
Painter, J. A., R. M. Hoekstra, T. Ayers, R. V. Tauxe, C. R. Braden, F. J. Angulo, and P. M.
Griffin. 2013. Attribution of foodborne illnesses, hospitalizations, and deaths to food
commodities by using outbreak data, United States, 1998–2008. Emerg. Infect. Dis. 19:407–415.
https://doi.org/10.3201/eid1903.111866.
Reed, E., C. M. Ferreira, R. Bell, E. W. Brown, and J. Zheng. 2018. Plant-microbe and abiotic
factors influencing Salmonella survival and growth on alfalfa sprouts and Swiss chard
microgreens. Appl. Environ. Microbiol. https://doi.org/10.1128/AEM.02814-17
Scallan, E., R. M. Hoekstra, F. J. Angulo, R. V. Tauxe, M. A. Widdowson, S. L. Roy, L. J.
Jones, and P. M. Griffin. 2011. Foodborne illness acquired in the United States-major pathogens.
Emerg. Infect. Dis. 17:7–15. https://doi.org/10.3201/eid1701.P11101.
Sivapalasingam, S., C. Friedman, L. Cohen, and R. Tauxe. 2004. Fresh produce: a growing cause
of outbreaks of foodborne illness in the United States, 1973 through 1997. J. Food Prot.
67:2342–2353. https://doi.org/10.4315/0362-028X-67.10.2342.
Solomon, E. B., C. J. Potenski, and K. R. Matthews. 2002. Effect of irrigation method on
transmission to and persistence of Escherichia coli O157:H7 on lettuce. J. Food Prot. 65:673–
676.
Stewart, D.S., K. F. Reineke, J. M. Ulaszek, and M. L. Tortorello. 2001. Growth of Salmonella
during sprouting of alfalfa seeds associated with salmonellosis outbreaks. J. Food Prot. 64:618–
622

41
Stine, S. W., I. Song, C. Y. Choi, and C. P. Gerba. 2005. Application of microbial risk
assessment to the development of standards for enteric pathogens in water used to irrigate fresh
produce. J. Food Prot. 68:913–918. https://doi.org/10.4315/0362-028X-68.5. 913.
Suslow, T.V. 2003. Key Points of Control and Management for Microbial Food Safety:
Information for Growers, Packers, and Handlers of Fresh-consumed Horticultural Products.
University of California Division of Agriculture and Natural Resources, Davis, CA.
https://doi.org/10.3733/ucanr.8102.
Taormina, P.J., L. R. Beuchat, and L. Slutsker. 1999. Infections associated with eating seed
sprouts: an international concern. Emerg. Infect. Dis. 5:626–634. https://doi.org/10.
3201/eid0505.990503.
Thomas, M.K., R. Murray, L. Flockhart, K. Pintar, F. Pollari, A. Fazil, A. Nesbitt, and B.
Marshall. 2013. Estimates of the burden of foodborne illness in Canada for 30 specified
pathogens and unspecified agents. Foodborne Pathog. Dis. 10:639–648.
https://doi.org/10.1089/fpd.2012.1389.
Todd, E. C. D., J. D. Greig, C. A. Bartleson, B. S. Michaels. 2009. Outbreaks where food
workers have been implicated in the spread of foodborne disease. Part 6. Transmission and
survival of pathogens in the food processing and preparation environment. J. Food Prot. 72:202–
219. https://doi.org/10.4315/0362-028X-72.1. 202.
Treadwell, D. D., R. Hochmuth, L. Landrum, and W. Laughlin. 2010. Microgreens: A New
Specialty Crop. University of Florida IFAS Extension (July, 1–3).
United States Department of Agriculture, 2018. Produce GAPs Harmonized Food Safety
Standard. Version 1.0. Agricultural Marketing Service. January 5, 2018. https://
www.ams.usda.gov/sites/default/files/media/HarmonizedStandard.pdf.
United States Department of Health Human Services, 2015. FSMA Final Rule on Produce
Safety: Standards for the Growing, Harvesting, Packing, and Holding of Produce for Human
Consumption; Final Rule. Federal Register. 80:74353–74568.
United States Food and Drug Administration, 1999. Microbiological safety evaluations and
recommendations on sprouted seed. National Advisory Committee on Microbiological Criteria
for Foods. Int. J. Food Microbiol. 52(3):123–153.
United States Food Drug Administration, 2016. Osage Gardens Inc. recalls Osage Gardens
Organic 2oz microgreens because of possible health risk. Recalls, withdrawals, safety alerts.
Available at: https://www.fda.gov/safety/recalls/ucm524638.htm. Date accessed: 12/5/2018
United States Food Drug Administration, 2017a. Compliance with and recommendations for
implementation of the standards for the growing, harvesting, packing, and holding of produce for
human consumption for sprout operations: Draft Guidance for Industry.
United States Food Drug Administration, 2017b. Chlorofields recalls Asian microgreens because
of possible health risk. Recalls, recalls, withdrawals, safety alerts. Available at: https://
www.fda.gov/safety/recalls/ucm548250.htm. Date Accessed: 12/5/2018
42
United States Food Drug Administration, 2018. Greenbelt Greenhouse Ltd recalls Greenbelt
Microgreens brand microgreens because of possible health risk. Recalls, withdrawals, safety
alerts. https://www.fda.gov/Safety/Recalls/ucm605702.htm.
Uyttendaele, M., L. A. Jaykus, P. Amoah, A. Chiodini, D. Cunliffe, L. Jacxsens, K. Holvoet, L.
Korsten, M. Lau, P. McClure, G. Medema, I. Sampers, and P. R. Jasti. 2015. Microbial hazards
in irrigation water: standards, norms, and testing to manage use of water in fresh produce
primary production. Compr. Rev. Food Sci. Food Saf. 14:336–356. https://doi.org/10.1111/1541-
4337.12133.
Waitt, J. A., D. D. Kuhn, G. E. Welbaum, and M. A. Ponder. 2014. Postharvest transfer and
survival of Salmonella enterica serotype enteritidis on living lettuce. Lett. Appl. Microbiol.
58:95–101. https://doi.org/10.1111/lam.12170.
Wang, Q. and K. E. Kniel. 2016. Survival and transfer of murine norovirus within a hydroponic
system during kale and mustard microgreen harvesting. Appl. Environ. Microbiol. 82:705–713.
https://doi.org/10.1128/AEM.02990-15.
Wang, M., S. Rong, P. Tian, Y. Zhou, S. Guan, Q. Li, and D. Wang. 2017. Bacterial surface-
displayed GII.4 human norovirus capsid proteins bound to HBGA-like molecules in Romaine
lettuce. Front. Microbiol. 8:1–9. https://doi.org/10.3389/fmicb.2017. 00251.
Warriner, K., F. Ibrahim, M. Dickinson, C. Wright, and W. M. Waites. 2005. Seed
decontamination as an intervention step for eliminating Escherichia coli on salad vegetables and
herbs. J. Sci. Food Agric. 85:2307–2313. https://doi.org/10.1002/jsfa.2256.
World Health Organization, 2015. WHO Estimates of the Global Burden of Foodborne Diseases.
Foodborne Disease Burden Epidemiology Reference Group, pp. 1–255.
Wright, K.M. and N. J. Holden. 2018. Quantification and colonization dynamics of Escherichia
coli O157:H7 inoculation of microgreens species and plant growth substrates. Int. J. Food
Microbiol. 273:1–10. https://doi.org/10.1016/j.ijfoodmicro.2018.02.025.
Wuytack, E., A. Diels, K. Meersseman, C. Michiels, 2003. Decontamination of seeds for seed
sprout production by high hydrostatic pressure. J. Food Prot. 66:918–923.
https://doi.org/10.4315/0362-028X-66.6.918.
Xiao, Z., 2013. Nutrition, sensory, quality and safety evaluation of a new specialty produce:
microgreens. In: UMD Digital Repository, pp. 145. https://drum.lib.umd.edu/ handle/1903/14900
(University of Maryland Thesis Dissertation).
Xiao, Z., G. E. Lester, Y. Luo, and Q. Wang. 2012. Assessment of vitamin and carotenoid
concentrations of emerging food products: edible microgreens. J. Agric. Food Chem. 60, 7644–
7651. https://doi.org/10.1021/jf300459b.
Xiao, Z., Y. Luo, G. E. Lester, L. Kou, T. Yang, and Q. Wang. 2014a. Postharvest quality and
shelf life of radish microgreens as impacted by storage temperature, packaging film, and chlorine
wash treatment. Lebensm. Wiss. Technol. 55:551–558. http://doi.org/ 10.1016/j.lwt.2013.09.009.

43
Xiao, Z., X. Nou, Y. Luo, and Q. Wang. 2014b. Comparison of the growth of Escherichia coli
O157: H7 and O104: H4 during sprouting and microgreen production from contaminated radish
seeds. Food Microbiol. 44:60–63. https://doi.org/10.1016/j.fm. 2014.05.015.
Xiao, Z., G. Bauchan, L. Nichols-Russell, Y. Luo, Q. Wang, and X. Nou. 2015. Proliferation of
Escherichia coli o157:h7 in soil-substitute and hydroponic microgreen production systems. J.
Food Prot. 78:1785–1790. https://doi.org/10.4315/0362-028X.JFP-15-063.
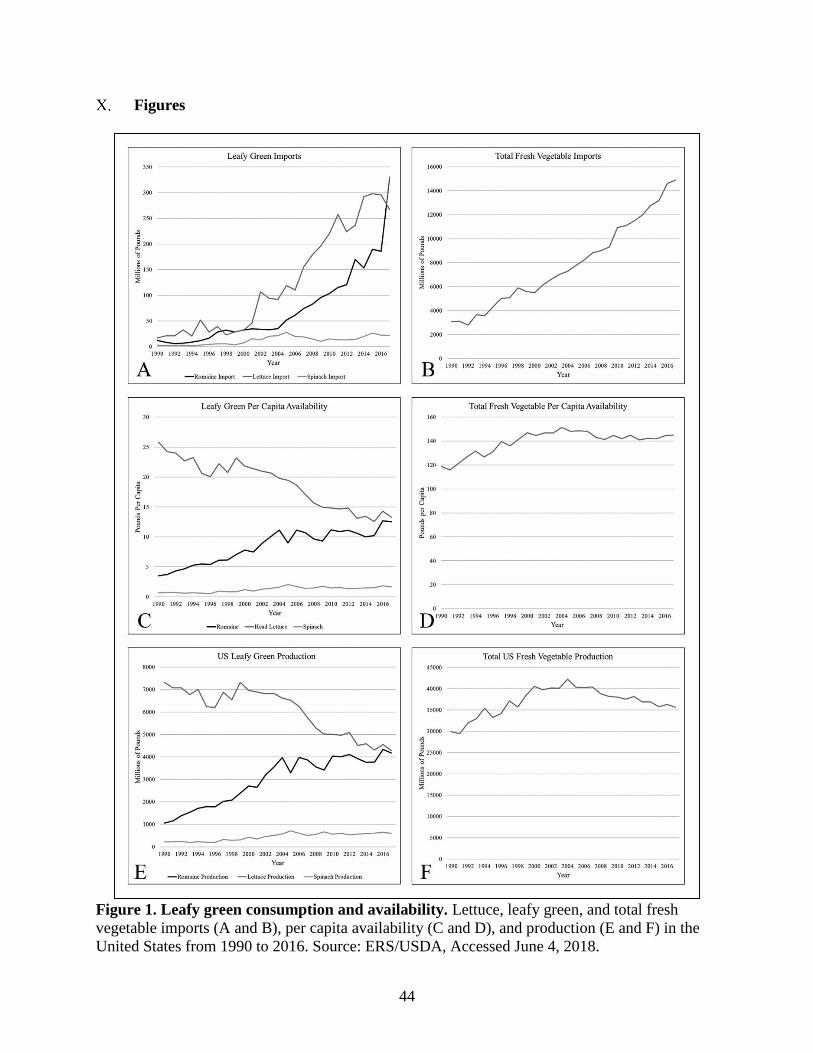
44
Figures
Figure 1. Leafy green consumption and availability. Lettuce, leafy green, and total fresh
vegetable imports (A and B), per capita availability (C and D), and production (E and F) in the
United States from 1990 to 2016. Source: ERS/USDA, Accessed June 4, 2018.

45
Figure 2. Microgreens and sprouts differ by age at harvest. A typical 14-day germination
period for a dicot, using the common garden bean as an example. Germination period for
microgreens and sprouts varies by plant variety.
Figure 3. Differences in seed topography. A) Swiss chard seed 17.5×, Olympus SZ60; B)
sunflower seed, public domain; C) Swiss chard seed 150×, AccuScope 3072/Excelis SMZ143;
D) sunflower seed 150×, AccuScope 3072/Excelis SMZ143.
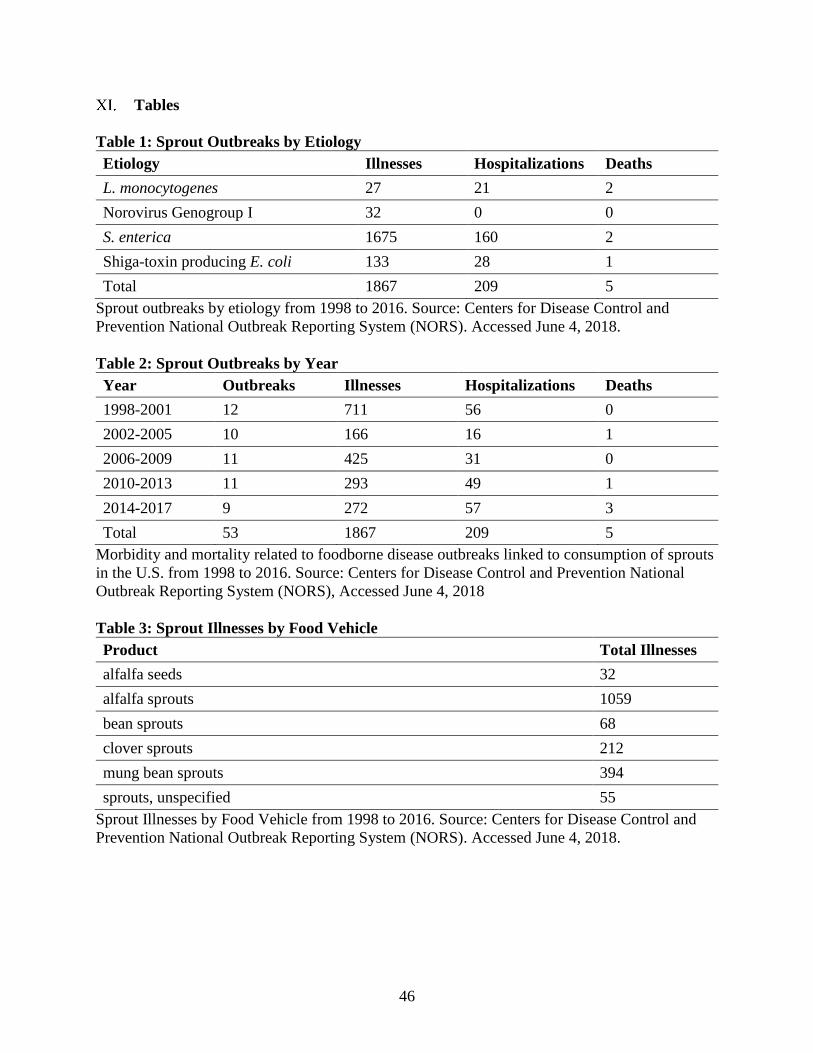
46
Tables
Table 1: Sprout Outbreaks by Etiology
Etiology Illnesses Hospitalizations Deaths
L. monocytogenes 27 21 2
Norovirus Genogroup I 32 0 0
S. enterica 1675 160 2
Shiga-toxin producing E. coli 133 28 1
Total 1867 209 5
Sprout outbreaks by etiology from 1998 to 2016. Source: Centers for Disease Control and
Prevention National Outbreak Reporting System (NORS). Accessed June 4, 2018.
Table 2: Sprout Outbreaks by Year
Year Outbreaks Illnesses Hospitalizations Deaths
1998-2001 12 711 56 0
2002-2005 10 166 16 1
2006-2009 11 425 31 0
2010-2013 11 293 49 1
2014-2017 9 272 57 3
Total 53 1867 209 5
Morbidity and mortality related to foodborne disease outbreaks linked to consumption of sprouts
in the U.S. from 1998 to 2016. Source: Centers for Disease Control and Prevention National
Outbreak Reporting System (NORS), Accessed June 4, 2018
Table 3: Sprout Illnesses by Food Vehicle
Product Total Illnesses
alfalfa seeds 32
alfalfa sprouts 1059
bean sprouts 68
clover sprouts 212
mung bean sprouts 394
sprouts, unspecified 55
Sprout Illnesses by Food Vehicle from 1998 to 2016. Source: Centers for Disease Control and
Prevention National Outbreak Reporting System (NORS). Accessed June 4, 2018.

47
Chapter 2: Characterization of Microgreen Businesses in the United States with Emphasis
on Food Safety
Abstract
Microgreens are an emerging industry about which little is known. This study represents the first
national survey of microgreen growers in the United States. A total of 176 respondents
completed an online survey including questions about farm demographics, growing techniques,
microgreen varieties grown, and relevant farm food safety practices. Microgreen operations
earning less than 10,000 USD/year in microgreen revenue (62%) that produce microgreens in
trays on stacked, artificially lit shelves (40.3%) dominated the response pool. Most farms who
responded to the survey opened after 2010 (75%). These farms primarily grew microgreens using
peat, coco coir, or soil. Sunflower, peas, and radish were the most popular microgreen varieties
produced. It was found that common deficits among microgreen growers include poor routine
documentation, limited growing media and agricultural water testing, and widely variable post-
harvest storage practices. Strengths of the industry include self-reported routine hand-washing
and equipment sanitation, greater average education level, and awareness of food safety training
resources. In addition to supporting training and outreach efforts, this study aims to inform the
research community of growing systems, microgreen varieties, and production practices that
would be relevant for future microgreen food safety studies.
Introduction
Farming systems that present alternatives to traditional field production of fresh produce are on
the rise. The most reliable and recent estimates are between 5-15% of total agricultural
production in developing nations (Zessa et al., 2010). In developed countries such as the United

48
States, the number of farmers markets and community-supported agriculture (CSA)
organizations supplied by small urban producers has grown by more than 50% since the mid-
2000s (Mok et al., 2014). By 2014, consumers in the United States purchased almost 800 million
USD in indoor-grown crops (Lensing, 2018). This increase in popularity is often attributed to
concurrent interests in preventing climate change impacts on farm productivity (McCartney et al.
2018, Gruda et al. 2019), access to fresh food for an increasingly urbanized population (Benke
and Tomkins, 2017; Shamshiri et al. 2018), and for space travel research (Kyriacou et al. 2017,
Zabel et al. 2016). Modern indoor farming was popularized as vertical farming by Despommier
(2013) and has since evolved into a myriad of system types under the umbrella term of
“controlled environment agriculture” (CEA).
While there is a growing body of literature investigating the profitability and productivity of
CEA (Eaves and Eaves, 2018; O’Sullivan et al. 2018, Thomaier et al. 2015, Specht et al. 2014,
Touliatos et al. 2016), less is known about food safety risks related to these production systems
or the crops typically grown within them. For example, microgreens—an emerging raw salad
product produced using CEA—are immature shoots of common vegetables harvested above the
root at 10-20 days old (Kyriacou et al. 2016). Similar to leafy greens, microgreens can be
produced outdoors, fully indoors, or in greenhouses, as well as in hydroponic systems or in soil
or soil-alternative based systems (Kyriacou et al. 2016). And similar to sprouts, they are
harvested at a young age after germinating in a warm, moist environment (Kyriacou et al. 2016).
These characteristics of microgreens make it a target crop for studying the food safety of CEA-
grown produce. Therefore, since microgreen production shares some similarities with sprouts
and leafy greens, they may have similar food safety risks.
49
Sprouted seeds (referred to as ‘sprouts’) are a raw salad crop frequently compared to
microgreens. Sprouts have been implicated in more than 1,800 cases of foodborne illness since
1996, many of which were linked to Salmonella spp. (CDC NORS). Leafy greens are also
frequently associated with foodborne illness, making up approximately 38% of all produce-
associated outbreaks (Bennett et al. 2018). Romaine lettuce grown in the Yuma, AZ region has
been implicated in several high-profile outbreaks of Shiga toxin-producing Escherichia coli
(STEC) since 2018 (Bottichio et al., 2018). While the majority of traceback investigations have
not revealed a causal link, in 8 of 32 outbreak investigations conducted since 1995, improper
post-harvest washing procedures were identified, as well as STEC contamination of irrigation
water and animal excrement found in the growing fields (Kintz et al., 2018). However,
contamination can occur at any point along the production continuum (Olamait et al., 2012).
While there have been no known outbreaks associated with microgreens, there have been
multiple product recalls of microgreens related to Salmonella enterica and Listeria
monocytogenes since 2016 in the United States (US FDA 2016, 2018, and 2019) and Canada
(CFIA 2018a-f, 2019a, and 2019b). This history underscores an urgent need to elucidate
potential risk factors within microgreen production that may render these products susceptible to
contamination and possible foodborne outbreaks as the industry grows.
Regulatory oversight for the safety of produce in the United States falls under the Food and Drug
Administration’s (FDA) Standards for the Growing, Harvesting, Packing, and Holding of
Produce for Human Consumption, 21 CFR Part 112, commonly referred to as the Produce Safety
Rule (PSR). The rule was adopted by the FDA in response to the Food Safety Modernization Act
(FSMA) of 2011. The rule establishes best practices for the prevention of foodborne pathogen
50
contamination of “covered produce,” defined as produce that is typically eaten raw. The PSR
requires that growers meet certain standards for the use of biological soil amendments of animal
origin, worker health and hygiene practices, irrigation water quality, equipment and surface
sanitation practices, and the handling of wild and domesticated animals in the farm environment
(U.S. Department of Health & Human Services, 2015). However, growers who earn less than
25,000 USD in annual produce sales are exempt from the rule, as well as any produce grower
who earns less than 500,000 USD but half or more of all sales of covered produce are direct to
consumers or food retail businesses (U.S. Department of Health & Human Services, 2015).
Understanding the size and other characteristics of microgreen businesses will determine if they
tend to be exempt from the PSR and if common industry practices exist which might be risk
factors for contamination of microgreens with human pathogens.
Furthermore, improved understanding of the farm food safety practices among practitioners of
these unique farming styles, generally categorized as CEA, will assist training and outreach
efforts targeting compliance challenges faced by these businesses. While certain standards put
forth by the PSR invariably apply to all fresh produce growers, such as hygiene and irrigation
water quality, CEA growers may face challenges more similar to packing plants than that of
conventional field growers. There are no established guidelines for the production of
microgreens at a commercial scale, with the exception of a recommendation within the PSR that
microgreen growers voluntarily comply with the sprout recommendations (U.S. Department of
Health & Human Services, 2015). Lastly, laboratory research directly examining food safety
risks of common microgreen production systems should be informed by current industry trends
and practices, which are largely unknown.

51
While multiple surveys have been conducted to assess food safety practices on farms growing
produce typically eaten raw (Parker et al. 2016, Adalja et al. 2018, Cannon et al. 2013, Astill et
al. 2019), little is known about these practices within the emerging microgreen market. Two
previous surveys of aquaponics facilities—a farming style resembling certain types of
microgreen production—assessed only general production methods and demographics with the
primary objective of determining profitability and sustainability of this subset of the indoor
farming industry (Love et al., 2014 and 2015). Unfortunately, farm food safety practices were
not examined. Agrylist, a greenhouse management software company, has conducted one of the
only annual, comprehensive surveys of the indoor farming industry for which data is freely
available (Agrylist 2016 and 2017). However, the survey is conducted for the purposes of market
research, and as such it does not focus on understanding grower compliance with food safety
regulations. It also focuses on all types of produce grown in CEA farms, rather than just
microgreen farms. Given these knowledge deficits, an online survey was designed and
implemented for the purpose of understanding the demographics, farm characteristics, and food
safety practices of microgreen farmers in the United States.
Materials and Methods
Ethics statement
The study was reviewed by The University of Arkansas Institutional Review Board (IRB No:
1809144516) which determined it to be exempt and not human subjects research. The survey
contained a cover page with a description of the research objectives as well as a consent question
that had to be answered before the participant could begin the survey. The survey did not collect
personally identifying information such as farm name, participant name, street address, phone
52
number, or email address. However, the survey did collect the US zip code for each farm in order
to assess geographic distribution of farms surveyed and any regional differences in responses.
Survey development and implementation
We collected 142 complete responses with an additional 34 incomplete responses (total = 176)
between October 1, 2018 and March 30, 2019. Unless otherwise specified, all percentages
reported are calculated with 176 as the denominator. Unanswered questions represent the
response “No response” and are considered in the dataset. The survey was designed and
distributed using the Qualtrics platform (Provo, UT, USA). Participant inclusion criteria required
that respondents sold microgreens to United States customers. Recruitment was conducted within
online communities on social media sites Facebook and Reddit dedicated to microgreen growing
and sales, hydroponic crop production, sustainability, and gardening. Additional respondents
were recruited through email broadcasts on customer lists of a few popular seed and indoor
farming supply companies. Lastly, approximately 80 emails were sent, with follow-up messages
a week later, using the database LocalHarvest.org to search for all farms and CSAs in the United
States that list “microgreens” as one of their available products. To incentivize completion, a
discount coupon was offered from the seed and supply businesses who distributed the survey
link.
Survey Questions
The survey question styles included 44 multiple-choice, 18 multiple-answer, 8 fill-in-the-blank, 1
ranking, 1 short answer, and 1 multiple-choice matrix. Not all questions were asked to all
respondents; the questions viewed were generated based on answers given to previous questions.

53
Questions were grouped by the following topics: farm demographics, product information,
growing system, growing media, irrigation water, seed storage and handling, sanitation and
worker hygiene, post-harvest washing, post-harvest storage, tracking and documentation, food
safety training, and grower education. Following acceptance of the informed consent statement,
growers were asked their country of origin and if they sold microgreens to United States
customers. If the respondent selected “no” to that question, they would be routed to an ending
page telling them that the study being conducted is on microgreen businesses with US customers
only, regardless of farm location.
Validation of the survey instrument was performed by academic as well as industry
professionals. Question wording, appropriateness of questions, survey flow, and coverage of
food safety topics were adjusted based on feedback from an expert in food safety education and
outreach. Significant attention was paid to minimizing the total number of questions, limiting
matrix, fill-in-the-blank, and multiple-response questions, as well as the overall time required to
complete the survey. Following expert evaluation, three graduate students performed a pilot test
of the survey and were provided with pre-determined survey responses designed to guide them
through specific pathways to test reliability. Finally, adjustments were made based on feedback
on the overall survey experience from two microgreen farmers who acted as non-scientific
reviewers. Completion time was estimated by the Qualtrics platform to be 15 minutes or less.
Estimating Total Production
Total microgreen production was standardized to pounds per month, even when respondents
reported their total monthly production in trays, kilograms, or ounces. The conversion factor for
54
the weight of microgreens produced per tray (0.45 pounds per 10”x20” tray) was determined by
using the average of typical yields per 10”x20” tray for seven microgreen varieties (sunflower,
pea shoots, radish, kale, cabbage, amaranth, and basil) as suggested by one of the responding
farms (Personal communication).
Data Analysis
Data from Qualtrics were exported and analyzed in Excel (Microsoft, Redmond, WA, USA) and
the R statistical platform (version 3.6.0) including the packages descr (Aquino, 2018), maps
(Deckmyn, 2018), ggplot2 (Wickham, 2016), and data.table (Dowle and Srinivasan, 2019). Chi-
square tests for independence were performed between categorical variables to determine if
statistically significant relationships exist between key food safety practices and farm
characteristics where the answer type was multiple choice. For comparing numerical to
categorical responses, Kruskal-Wallis tests were used. Kruskal-Wallis is a non-parametric
analysis of variance that is more robust than ANOVA for non-normally distributed datasets
(Kruskal and Wallis, 1952). Because the data were skewed strongly toward smaller, beginning
farms growing microgreens in trays on stacked shelves and the sample sizes of the other groups
were much smaller, improved accuracy of Chi-square tests was attempted by adding a Monte
Carlo simulated p-value to reduce risk of a Type 1 error (Rai et al. 2001).
For multiple-response questions, the large number of possible answer choices (p = 122), and thus
a large number of predictors relative to samples (n = 143), as well as non-normally distributed
data, necessitated the use of the R package glmnet (Friedman et al. 2010). This generalized linear
modeling approach with Lasso was used to determine if linear relationships exist between key

55
food safety practices and selected farm characteristics where multiple responses were given. A
key benefit of Lasso is preventing over-fitting of the data and selecting only the most relevant
predictors for such high-dimensional data.
Results
Demographics
Geographic Distribution
The survey captured growers across the United States (Figure 1). Fewer farms reported Western
US zip codes; however, this regional response rate difference is consistent with a previous
nationwide survey of produce farmers, also showing lower farm density in that region (Adalja et
al. 2018).
Farm Size
Farm size was calculated by yearly revenue from microgreens, monthly microgreen production
output, and by number of employees. Farm size by number of employees is reported in Table 1.
For revenue, respondents were asked “What is your yearly revenue from microgreens?” and were
given the option to choose from five revenue categories or “Prefer not to respond.” There were
71 farms earning less than 5,000 USD/year, 28 farms earning between 5,000-9,999 USD/year, 10
farms earning between 10,000-24,999 USD/year, 9 farms earning between 25,000-49,999
USD/year, and 6 farms earning greater than 50,000 USD/year. 18 farms preferred not to answer,
and 34 farms did not choose a response.
56
Monthly production level was reported in 10”×10” trays, 10”×20” trays, pounds, ounces,
kilograms, or “other.” The values reported by respondents were then standardized to pounds per
month for comparison using the method described previously (Section III,iv). Farms earning less
than 5,000 USD/year in revenue (n = 71) averaged 14.7 ± 18.9 pounds per month, farms earning
between 5,000-9,999 USD/year in revenue (n = 28) averaged 45.20 ± 59.4 pounds per month,
farms earning between 10,000-24,999 USD/year in revenue (n = 10) averaged 97.47 ± 144.4
pounds per month, farms earning between 25,000-49,999 USD/year in revenue (n = 9) averaged
420.39 ± 1,043.4 pounds per month, and farms earning greater than 50,000 USD/year in revenue
(n = 6) averaged 7,629 ± 8,635 pounds per month. The high standard deviations associated with
these production estimates are likely due in some part to the error prone method of standardizing
pounds per tray described previously, and to a lesser extent, due to respondents entering their
total farm production instead of just microgreen production and the differing sample sizes of
each revenue category.
Education and Farming Experience
Growers’ education level was primarily at the bachelor’s level (23.9%) or “some college”
(18.2%). “Some college” does not distinguish between participants who are still in college or
who never completed college. The third most common education level is an associate’s degree,
representing 9.7% of respondents. This rate is similar to the national average, where 33.4% of
US citizens hold a bachelor’s degree (US Census Bureau, 2016).
Most microgreen growers (48.3%) reported having learned to grow microgreens using websites
and online videos. The second most popular method of learning to grow microgreens included

57
“informally from other growers,” (12.5%) “books and magazines,” (9.1%) and “social media
groups” (8%). However, high representation from Internet-learners is possibly due to the
Internet-intensive survey participant recruitment procedures.
The microgreen growers surveyed appeared to be mostly produce farmers, either growing only
microgreens or microgreens along with other plant products. Livestock production on
microgreen farms was less common. Among microgreen growers, 31% of farms produced other
vegetable crops, 2% of farms produced livestock and animal products, 10% of farms produced
both, and 24% of farms produced only microgreens. Thirty-two percent of respondents declined
to answer the question. The most common vegetable crops included produce typically eaten raw
(36.3%) and produce rarely eaten raw (25.5%). The most common animal products include
poultry (8%) and eggs (7.4%).
Most farms who responded are newly opened, with 74% of the farms in the survey opening after
2010, most of which fell into the “Less than $5000/year” revenue category, suggesting that most
of these very small farms are beginners. Interestingly, farms opening after 2010 were more likely
to be raising livestock or animal products (3.1%), or both animal and plant products (13.8%)
compared to those farms that opened before 2010. Of the older farms, 61.5% produced other
plants or crops, and 15% grew only microgreens. This suggests that in addition to beginning
growers, more experienced fresh produce farmers are adopting microgreen production.

58
Produce Safety Rule (PSR) Exemption
The PSR exempts farms earning less than 25,000 USD/year in revenue, as well as farms earning
less than 500,000 USD/year where at least half of sales are direct to customers or food retail
outlets (U.S. Department of Health & Human Services, 2015). However, respondents were only
asked what their yearly revenue was for microgreens. For farms who produced other vegetable
crops, their total produce revenue may exceed the exemption threshold and thus some of these
farms may not be exempt. Furthermore, even farms earning greater than 50,000 USD/year in
microgreen revenue, whether or not they sell other covered produce, may still primarily sell
direct to customers, grocery stores, and restaurants rather than wholesalers and would be exempt.
Therefore, it is possible that nearly all respondents in this survey are exempt from the PSR.
Growing Techniques
Growing Systems
The survey inquired about the system type and location where half or more of the respondent’s
microgreens are produced. System type is defined as the production system design, whether that
is aquaponics, hydroponics, in ground, containers, raised beds, or trays on shelves. System
location refers to the setting where the production takes place, whether that is fully indoors in a
room with opaque walls, such as a storefront, warehouse or residential building; a greenhouse or
hoop house with translucent or transparent walls; or completely outdoors. The most common
combinations were an indoor residential space with trays on stacked shelves (26.7%), a container
farm inside a climate-controlled greenhouse (8.5%), and an indoor commercial space with trays
on stacked shelves (6.8%). All combinations of system type and location are shown in Table 2.
59
Farms earning greater than 50,000 USD/year in microgreen revenue did not use trays on stacked
shelves, whereas at least half of all other revenue categories did. The predominant production
methods in the highest revenue category were unstacked container farms (50%) and hydroponic
systems (16.7%). Hydroponic systems were less common among farms earning less than 25,000
USD/year. Of those growers who preferred not to disclose their yearly microgreen revenue, 17%
used hydroponics and 39% used trays on stacked shelves, possibly suggesting a mixture of high
and low earning farms unwilling to give income information.
Growing Media
Most growers who responded to the survey utilized trays on stacked, artificially lit shelves, while
cultivating in a soil blend or soil substitute, particularly organic soil or peat blended with an
aerator such as perlite and occasionally, a biological soil amendment. The most common types of
media used include peat moss (17.6%), organic soil (15.3%), and coco coir (14.2%). The most
common additives included perlite (31%) and vermiculite (19.3%). Many growers did not report
using any soil amendments (37%). However, the most common were worm castings (8.5%),
green compost (6.2%), food compost (4.5%), and manure (2.3%). One grower used a unique
fertilization mixture containing ingredients such as kelp meal, fossilized bat guano, and aged
forest products.
Participants were also asked how they disposed of their used growing media, and it was found
that a single-use approach with growing media is uncommon. 43.8% of growers reported that
they compost spent media after harvesting microgreens; 5.1% of growers selected “We use it to
grow other plants”; and 1.1% (2 growers) reported that they reuse the media to grow more

60
microgreens. It is unknown what the end use of the composted growing media is for the 43.8%
of growers who produce it, and thus future investigations into this practice may be warranted.
Irrigation Method
Microgreens can be watered by either overhead spray irrigation or by sub-irrigation. Bottom-
watering or drip irrigation, where the water does not touch the microgreens, was reported by
33% of respondents. Overhead watering, where the water does touch the edible portion of the
microgreens, was reported by 23.9% of respondents. This question was left blank by the other
42.6% respondents. Previous microgreen food safety studies comparing the risks of overhead vs.
sub-irrigation are limited, though it has been studied in other leafy greens (Rock et al. 2019).
Neither Işık et al. (2020) nor Xiao et al. (2015) found statistically significant differences in the
transfer of E. coli O157:H7 to microgreens between the two watering methods, while Solomon et
al. (2002) did detect a difference in E. coli O157:H7 transfer to lettuce.
Production Environment
Approximately half of all farms (51.1%) reported monitoring environmental conditions of their
growing space. The average ambient temperature, water temperature, and relative humidity for
each production environment type are shown in Table 3. Non-responses were excluded from this
analysis (69/176). The 33 respondents who reported all three variables were used for this
comparison. By contrast, relative humidity in sprouted seed production environments tend to be
closer to 70% (Xiao et al. 2014). This may indicate a possible difference in food safety risk
between microgreens and sprouted seeds. Studies in other types of covered produce (Stine et al.

61
2005, Tian et al. 2013) indicate the possibility that low relative humidity is generally linked to
pathogen inactivation, though it may ultimately depend on pathogen and produce type.
Agricultural Water
The most common sources of irrigation water include municipal water (32.4%) and well water
(29.5%). Rainwater collection (2.8%), surface water (1.1%) and greywater (0.6%, only one farm)
were also used. The majority of farms did not impose any end-user water treatment beyond what
may be performed at the source, such as at a municipal water treatment plant. Activated charcoal,
reverse osmosis, and sediment filtration were the most commonly used methods among the few
respondents who treated their water. Discussion of water testing and treatment, which are key
food safety practices, can be found in Section V, part ii.
Microgreen Varieties
Sunflower, pea shoots, and radish were the top three most commonly grown microgreens (Table
4). Possible reasons for this preference include ease of cultivation and short seed-to-harvest
period; the low cost of seeds relative to other varieties; and the high fresh weight yield per unit of
tray area, leading these varieties to be the most profitable. Thus, it is critical that microgreen
food safety research focuses on these varieties. So far, no research has been published that
investigates the food safety risk of sunflower and pea shoots. Radish microgreens have appeared
in three studies (Xiao et al. 2014 and 2015, Wright et al. 2018).

62
Key Food Safety Practices
Chi-square tests of association were performed to identify any statistically significant
relationships between farm characteristics and food safety practices that are relevant to the PSR.
Farm characteristics tested included farm size by revenue, farm size by number of employees,
number of employees directly handling microgreens, whether or not the farm has passed a Good
Agricultural Practices (GAP) audit, number of previous food safety trainings taken, last
completed education level, type of production system, and monthly microgreen production in
pounds. These characteristics were tested against the following practices: documentation, water
testing, seed disinfection, hand washing, post-harvest washing, grow media testing, and
sanitation. Table 5 summarizes these relationships. The values for n varied across each
comparison because the statistical tests required exclusion of “NA” values. Sample sizes for each
comparison are cited within the text.
Growing Media Testing
When participants (n = 104) were asked “Do you test your soil or growing media for bacteria?”,
responses included “Yes” (11.5%), “No” (87.5%), and “I don’t know.” (1%). Testing frequency
was reported as follows: 2% of growers tested twice a year, 4% of growers tested 4 times per
year, 2% of growers tested more than 4 times per year, 87.5% of growers did not test growing
media, 4% of growers tested their growing media but did not know how often, and one grower
(1%) did not know if their farm’s growing media was tested for bacteria. Statistically significant
relationships were found between grow media testing at least once per year and both the total
number of employees (p = 0.015) and the total number of employees who directly handle the
microgreens (p = 0.001). This may indicate that larger microgreen operations are better equipped
63
to engage in routine quality assurance procedures such as microbiological testing of media. As
most operations used peat or soil and did not engage in any media testing, it is difficult to
determine, statistically, if type of growing medium influences testing frequency.
Water Testing and Treatment
The only farm characteristic that had a statistically significant relationship with irrigation water
testing at least once per year was the type of production system (p = 0.01). The source of
irrigation water (e.g. municipal, groundwater, surface water, rainwater, etc.) was hypothesized to
be an influencing factor, but was not significant in our data (p = 0.49) as most operations used
either groundwater or a municipal water source. However, linear regression showed that
“collected rainwater” was a negative predictor of water testing (See Section V and Table 2-S1 in
the Appendix), though only 2 growers used it. A summary table of the number of farms in each
testing frequency group by system type are presented in Table 6.
For water treatment, 46.6% of respondents did not treat their water and 35% did not answer the
question (n = 176). The most popular type of water treatment method among those who did treat
their water included activated charcoal filtration (6.2%), a sediment filter (6.2%), and reverse
osmosis (5.1%). Respondents were allowed to choose more than one response for this question,
so percentages will not add up to 100. There were many unique combinations of water treatment
reported by respondents, but the most common combination of water treatment methods was a
sediment filter along with an activated charcoal filter, used by 5 growers. Water treatment by
water source is reported in Table 7.

64
Seed Disinfection
Statistically significant relationships existed between pre-germination seed disinfection and two
farm characteristics: production system type (p = 0.001) and total number of employees (p =
0.011). Interestingly, those farms who did not disinfect their seeds prior to germination had an
average of 29 total employees while farms who did disinfect their seeds averaged 4 total
employees. An in depth survey of 19 food safety experts and 32 produce growers (Parker et al.,
2016) also challenges the assumption that larger farms are more likely to engage in more food
safety practices than smaller farms. The authors found that if a recommended food safety
practice is more challenging to implement on a larger scale, large farms are less likely to do it.
Seed disinfection may be one of those practices.
For growing system type, 40 stacked-tray growers (n = 71) disinfected their seeds, 28 did not,
and 2 did not respond. For all other growing system types combined (n = 47), a greater
proportion of growers did not disinfect their seeds compared to those who did. In particular, 17
out of 22 container farms reported not disinfecting seeds. Among growers of all system types
who reported having a seed disinfection step (n = 49), 42 (85%) used a hydrogen peroxide soak.
Sodium hypochlorite (3 respondents) and vinegar (1 respondent) were also reported.
Harvest, Post-Harvest Washing, and Storage
Post-harvest washing was performed by 34 farms (19.3%) and not performed by 77 farms
(43.8%), while 65 farms did not respond to the question. The most common varieties washed
after harvest were “all varieties” (20 farms, 11.4%), “sunflower” (10 farms, 5.7%), and “radish”
(4 farms, 2%). While these were the most commonly grown varieties, thus most commonly
65
washed, a few respondents noted in the free response “other” field that they only soaked the
larger seeds or those with thick seed coats. There were no significant relationships found
between post-harvest washing of microgreens and any of the farm characteristics tested.
The most common microgreen harvest method is to hand cut with scissors or a knife, a technique
used by 56% of respondents. An additional 21% sold their microgreens as a “living tray.” A
living tray refers to the sale of the microgreens live and unharvested, in their original growing
container. Hand picking and other methods of harvesting were uncommon, and 37% of
participants did not answer the harvest technique question. The most common post-harvest
storage method was in a refrigerator or cooler (52%), while 3% of growers stored their
microgreens at room temperature, and the remaining growers did not respond to this question.
The average refrigerated storage time from harvest to sale for cut microgreens was 14.6 ± 14.1 h
(n = 92), and the average room temperature storage time was 36.8 ± 37 hours (n = 5). For living
tray storage, the average cooler time was 20.7 ± 17.4 hours (n = 7) and room temperature storage
was 18 ± 25 hours (n = 25). Thus, room temperature storage is more common among growers
who sell living trays. Nevertheless, it is concerning that growers who store cut microgreens at
room temperature do so for a longer period of time on average than those who use a cooler and
that storage times among growers suffer from high variability.
Sanitation and Hygiene
Respondents were asked how often they cleaned various food contact surfaces such as tools,
growing trays, preparation tables, and floors (n = 143). Daily cleaning of at least one of these
surfaces was common among respondents (64%). Equipment sanitation is broken down by

66
surface type and frequency in Table 8. There were no statistically significant relationships
between daily sanitation of at least one surface and any of the farm characteristics tested.
Respondents were asked about worker handwashing during production (n = 112). The practice is
common, with 95.5% of respondents reporting “yes” to the question “Do workers routinely wash
their hands during microgreen production?”. When asked which specific production steps
workers routinely washed their hands, 32% reported washing before handling seeds, before
harvesting, and before packaging. Another 20% of farms reported washing at those steps as well
as before watering microgreens. An additional 17% of farms reported washing at all steps as well
as at random times throughout the day. There was a statistically significant relationship between
handwashing and disposable glove use (p = 0.025), where farmers who washed hands routinely
were more likely to also use disposable gloves. However, no other farm characteristics tested
were found to be related to handwashing. Disposable glove use among farms was 32.4%, and the
steps where disposable gloves were most commonly used included during harvest (27.4%) and
packaging (26.7%). An additional 16% of respondents reported using gloves while handling
seeds.
Documentation and Tracking
Respondents were asked to report which farm processes they routinely documented and were
allowed to give more than one answer. Using this input, the number of farm processes
documented was counted, and the assumption was made that a greater number of farm processes
documented implies a greater degree of documentation compliance. “No routine documentation”
was assigned a score of “0”. Statistically significant relationships were found between number of

67
farm processes documented (0-8 processes) and annual microgreen revenue (p = 0.003), passing
a GAP audit (p = 0.001), and number of previous food safety trainings attended (p = 0.001).
A greater proportion of farms earning over 25,000 USD/year had high documentation numbers
compared to farms earning less than the Produce Safety Rule exemption cut-off (Table 9). The
observed relationship between annual microgreen revenue and documentation is consistent with
findings from a previous produce grower survey (Adalja et al. 2018) showing that written
documentation was more prevalent among commercial sized farms.
Additionally, it appears that passing a GAP audit or attending food safety training influences
number of processes documented. A greater proportion of farms with high documentation
numbers (5-8 processes) had previously passed a GAP audit, whereas only one farm who passed
a GAP audit had a documentation number of “1.” Conversely, the majority of farms that had not
pursued or passed a GAP audit documented 4 processes or fewer. Overall, the most common
processes documented (n = 176) include Standard Operating Procedures (26%), Water Testing
(24.4%), Cleaning (23.3%), Employee Food Safety Training (22.7%), Shipping and Receiving
(20.4%), Growth Media Testing (11.4%), and Recalls (8.5%). Further, 22.7% of respondents
reported “No Routine Documentation.”
Multiple Linear Regression of Food Safety Practices
The same seven key food safety practices (documentation, water testing frequency, seed
disinfection, routine hand washing, post-harvest washing of microgreens, growing media testing
frequency, and daily surface sanitation) analyzed by Chi-square tests were also tested by linear
regression, using glmnet with Lasso (α = 1, using cross validation to obtain λmin), against

68
predictors collected from MA questions (certification type, food safety training type, method of
learning to grow microgreens, production of other farm products aside from microgreens,
growing media type, microgreen variety grown, irrigation water source, and water treatment
method). See Data Analysis section for rationale for not testing these responses with Chi-square
tests.
Variation in documentation level (Adjusted R-squared = 0.55) could be negatively predicted by
not having any certifications (such as GAP, third-party sustainability, or certified organic) and by
irrigating with untreated water (regardless of source). Positive predictors of variation in
documentation include passing a GAP audit, a food safety lecture at work, GFSI training, and
having a county health card (Table 10).
Variation in water testing frequency could be predicted (Adjusted R-squared = 0.62) by multiple
categories each for food safety training type, method of learning to grow microgreens, other farm
products produced, growing media type, microgreen variety grown, irrigation water source, and
water treatment method. See Table 2-S1 in the Appendix for individual categories and their
coefficients and p-values. Some variables were unexpected to be predictors of water testing
frequency and may be an artifact of the associations and correlations between predictors.
Survey Limitations
The survey respondents were predominantly very small farms, earning less than 10,000 USD in
annual microgreen revenue. This is likely due to the utilization of online microgreen growing
communities as the primary recruitment strategy, which may be biased toward small-scale and
beginning growers. However, when commercial-scale farms were successfully reached using

69
direct emails, they were often reluctant to answer the majority of the survey questions. Two
farms directly expressed concern about the sharing of trade secrets with potential competitors.
Furthermore, as it is an emerging industry, these data may be reflective of a true greater
proportion of beginning growers to large scale commercial operations. Nevertheless, confidence
in the statistical relationships demonstrated, particularly with the linear regression, is low. This is
because categories did not have equal values of n; data were not normally distributed; and
overall sample sizes in each category were low except for those favoring small, beginning farms
growing microgreens in trays on stacked shelves. Therefore, future surveys should aim for a
larger sample size and targeted recruitment of commercial scale, non-exempt microgreen farms.
Discussion
It may be assumed from these survey results that the microgreen industry is dominated by very
small operations, earning less than 10,000 USD/year in microgreen revenue, though it is possible
a greater number of commercial growers exist who were not interested in responding to the
survey or otherwise not reached by recruitment efforts. Most growers in the < 10,000 USD/year
category produce radish, sunflower, and pea microgreens in peat or soil, using trays on stacked
shelves in artificially lit residential or commercial facilities. Hydroponic microgreen production
and unstacked container farms in greenhouses are also approaches taken, but these systems may
be more common among greater revenue farms.
In terms of key food safety practices, the industry has some strengths and weaknesses.
Microgreen farmers appear generally aware of food safety training opportunities, many of whom
have attended more than one. Routine worker handwashing and equipment sanitation are both

70
relatively common practices, which appears consistent with previous work (Adalja et al. 2018,
Lichtenberg et al. 2016). In terms of the production environment, overall % relative humidity in
the microgreen growing environment may be lower than that of sprouted seeds. Also, the most
common sources of agricultural water used by microgreen growers, municipal water and well
water, are considered as low risk compared to surface water (Alegbeleye et al., 2018). A recent
survey also found that produce growers in general have adopted safer agricultural water sources
(Astill et al. 2019).
Most of the survey respondents do not perform microbiological testing on their growing medium.
However, even though the PSR does not explicitly require microbiological soil testing, the
importance of environmental monitoring of food contact surfaces (Jones et al. 2018) and
preliminary data on differential survival of common foodborne pathogens on soil-free growing
media types (Di Gioia et al. 2017, Wright et al. 2018, and Chapter 3) indicates that the growing
media is not without risk. Testing of growing media is not only uncommon among microgreen
growers, but it appears not to be influenced by any farm characteristics tested. The importance of
soil testing may not be included in requirements for passing a GAP audit nor included in farm
food safety trainings since it is not explicitly required by the PSR. Therefore, if this relationship
is reflective of reality, it is not surprising. Furthermore, the only discussion of growing media in
the PSR is related to the proper use of biological soil amendments of animal origin (US FDA,
2015). Biological soil amendments are used infrequently among microgreen producers, and of
the small number who do, worm castings were mentioned most often. By contrast, two surveys
of field-grown produce farmers (Astill et al. 2019, Adalja et al. 2018) indicated that manure use
is quite common.
71
Routine documentation of farm procedures is also not common, with most farms documenting
one practice or none at all. If genuine, the moderate statistical relationship between
documentation and greater farm revenue, greater numbers of food safety trainings attended, and
passing a food safety audit may suggest that increasing the rate of food safety training of very
small microgreen operations may increase documentation practices. A previous survey found a
similar relationship between revenue on documentation (Adalja et al. 2018) as the present study.
It may be that larger farms have a greater need for documentation, or they have more resources
to implement it. It is worth considering, however, that many of microgreen farms may not
prioritize routine documentation due to being exempt from the PSR.
Microbiological testing of irrigation water is required under the Produce Safety Rule (U.S.
Department of Health & Human Services, 2015). Among microgreen growers surveyed, water
testing appears more common than growing media testing but still uncommon overall.
Hydroponic growers appear to be more likely to test their water four or more times per year
(5/12) compared to tray growers, who test around once per year (18/71). Many respondents did
not answer this question, making it difficult to rely on these percentages. Nevertheless,
regression analysis showed water testing frequency can be positively predicted to some degree
by attending a greater number of food safety trainings. This could be explained as growers who
are more conscientious about food safety issues in general both engage in regular water testing
and attend food safety trainings, or that food safety trainings are at least somewhat effective in
encouraging farmers to test their irrigation water. Water testing becomes an even more important
educational objective when taking into account that the majority of microgreen growers surveyed

72
do not implement any water treatment (or did not respond to the question), such as reverse
osmosis, ultraviolet light, or other filtration method.
Recommendations for training and outreach efforts include greater consideration for the impact
of soil-free growing media on food safety risk; the importance of routine documentation of farm
procedures; irrigation water testing; and proper storage of microgreens prior to sale.
Recommendations for future research include greater consideration for the most commonly
grown varieties of microgreens, differential risk among soil-free growing media and production
system types, and the utility of applying similar seed disinfection practices to microgreen
production presently used for sprouted seeds. Environmental monitoring best practices for
microgreen growers may also be needed if the commercial popularity of CEA-farmed produce
continues to increase.

73
References
Agrilyst, 2017. State of Indoor Farming. Available at: https://artemisag.com/wp-
content/uploads/2019/06/stateofindoorfarming-report-2017.pdf. Date accessed: 10 Oct 2019
Agrilyst, 2016. State of Indoor Farming. Available at: https://artemisag.com/wp-
content/uploads/2019/06/stateofindoorfarming-report-2016.pdf. Date accessed: 10 Oct 2019
Adalja, A. and E. Lichtenberg. 2018. Implementation challenges of the food safety
modernization act: Evidence from a national survey of produce growers. Food Control 89:62–71.
Alegbeleye, O. O., I. Singleton, and A. S. Sant’Ana. 2018. Sources and contamination routes of
microbial pathogens to fresh produce during field cultivation: A review. Food Microbiol.
73:177–208.
Astill, G., T. Minor, and S. Thornsbury. 2019. Changes in U.S. produce grower food safety
practices from 1999 to 2016. Food Control 104:326–332.
Aquino, J., D. Enzmann, M. Schwartz, N. Jain, S. Kraft, S. 2018. descr: Descriptive Statistics.
Benke, K. and B. Tomkins. 2017. Future food-production systems: Vertical farming and
controlled-environment agriculture. Sustain. Sci. Pract. Policy 13:13–26.
Bennett, S. D., S. V. Sodha, T. L. Ayers, M. F. Lynch, L. H. Gould, and R. V. Tauxe, R. V.
2018. Produce-associated foodborne disease outbreaks, USA, 1998–2013. Epidemiol. Infect.
146:1397–1406.
Bottichio, L., A. Keaton, D. Thomas, T. Fulton, A. Tiffany, A. Frick, M. Mattioli, A. Kahler, J.
Murphy, M. Otto, A. Tesfai, A. Fields, K. Kline, J. Fiddner, J. Higa, A. Barnes, F. Arroyo, A.
Salvatierra, A. Holland, W. Taylor, J. Nash, B. M. Morawski, S. Correll, R. Hinnenkamp, J.
Havens, K. Patel, M. N. Schroeder, L. Gladney, H. Martin, L. Whitlock, N. Dowell, C. Newhart,
L. F. Watkins, V. Hill, S. Lance, S. Harris, M. Wise, I. Williams, C. Basler, and L. Gieraltowski.
2019. Shiga Toxin-Producing E. coli Infections Associated with Romaine Lettuce — United
States, 2018. Clin. Infect. Dis. 5:1–30.
Canadian Food Inspection Agency, 2019a. Pousses et Cie brand Mix Spicy Microgreens recalled
due to Listeria monocytogenes. Food Recall Warnings and Allergy Alerts, May 22. Available at:
https://healthycanadians.gc.ca/recall-alert-rappel-avis/inspection/2019/70007r-eng.php. Date
accessed: 7 Feb 2020.
Canadian Food Inspection Agency, 2019b. Food Recall Warning - GPM brand Pea Shoots
recalled due to Listeria monocytogenes. Food Recall Warnings and Allergy Alerts, April 19.
Available at: https://www.inspection.gc.ca/food-recall-warnings-and-allergy-alerts/2019-04-
19/eng/1555725095376/1555725097506. Date accessed: 7 Feb 2020.
Canadian Food Inspection Agency, 2018a. Food Recall Warning - Certain Greenbelt
Microgreens brand microgreens recalled due to Listeria monocytogenes. Food Recall Warnings
and Allergy Alerts, August 25. Available at: https://www.inspection.gc.ca/food-recall-warnings-
and-allergy-alerts/2018-08-25/eng/1535250311816/1535250313826. Date accessed: 7 Feb 2020.
Canadian Food Inspection Agency, 2018b. Lufa Farms Inc. brand Arugula Microgreens recalled
due to Salmonella. Food Recall Warnings and Allergy Alerts, June 29. Available at:

74
https://healthycanadians.gc.ca/recall-alert-rappel-avis/inspection/2018/67156r-eng.php. Date
accessed: 7 Feb 2020.
Canadian Food Inspection Agency, 2018c. Correction - Food Recall Warning - Certain Greenbelt
Microgreens brand microgreens recalled due to Listeria monocytogenes. Food Recall Warnings
and Allergy Alerts, April 30. Available at: https://www.inspection.gc.ca/food-recall-warnings-
and-allergy-alerts/2018-04-30/eng/1525117939283/1525117939782. Date accessed: 7 Feb 2020.
Canadian Food Inspection Agency, 2018d. Food Recall Warning - GPM brand Pea Shoots
recalled due to Listeria monocytogenes. Food Recall Warnings and Allergy Alerts, June 7.
Available at: http://inspection.gc.ca/about-the-cfia/newsroom/food-recall-warnings/complete-
listing/2018-06-07/eng/1528383445910/1528383449409. Date accessed: 7 Feb 2020.
Canadian Food Inspection Agency, 2018e. Food Recall Warning - Goodleaf brand Daikon
Radish microgreens recalled due to Listeria monocytogenes. Food Recall Warnings and Allergy
Alerts, June 28. Available at: http://inspection.gc.ca/about-the-cfia/newsroom/food-recall-
warnings/complete-listing/2018-06-28/eng/1530237479767/1530237483085. Date accessed: 6
Feb 2020.
Canadian Food Inspection Agency, 2018f. Updated Food Recall Warning - Evergreen Herbs
brand Pea Shoots recalled due to Listeria monocytogenes. Food Recall Warnings and Allergy
Alerts, June 7. Available at: http://inspection.gc.ca/about-the-cfia/newsroom/food-recall-
warnings/complete-listing/2018-06-07/eng/1528409624622/1528409626775. Date accessed: 7
Feb 2020.
Cannon, J. L., J. A. Harrison, G. W. Zehnder, R. R. Boyer, M. A. Harrison, and J. W. Gaskin.
2013. Survey of food safety practices on small to medium-sized farms and in farmers’ markets.
J. Food Prot. 76:1989–1993.
Deckmyn, A., R. A. Becker, A. R. Wilks, R. Brownrigg, and P. Minka. 2018. maps: Draw
Geographical Maps.
Despommier, D. 2013. Farming up the city: the rise of urban vertical farms. Trends Biotechnol.
31:388–389.
Di Gioia, F., P. De Bellis, C. Mininni, P. Santamaria, and F. Serio. 2017. Physicochemical,
agronomical and microbiological evaluation of alternative growing media for the production of
rapini (Brassica rapa L.) microgreens. J. Sci. Food Agric. 97: 1212–1219.
Dowle, M., and A. Srinivasan. 2019. data.table: Extension of `data.frame`.
Eaves, J. and S. Eaves. 2018. Comparing the profitability of a greenhouse to a vertical farm in
Quebec. Can. J. Agric. Econ. 66:43–54.
Friedman, J., N. Simon, T. Hastie, and R. Tibshirani. 2011. Regularization Paths for Cox’s
Proportional Hazards Model via Coordinate Descent. J. Stat. Softw. 39:1–13.
Gruda, N., M. Bisbis, and J. Tanny. 2019. Influence of climate change on protected cultivation:
impacts and sustainable adaptation strategies - A review. J. Clean. Prod. 225:481–495.
75
Işık, H., Topalcengiz, Z., Güner, S., Aksoy, A., 2019. Generic and Shiga toxin-producing
Escherichia coli (O157:H7) contamination of lettuce and radish microgreens grown in peat moss
and perlite. Food Control 111:1-6
Jones, S. L., S. C. Ricke, D. K. Roper, and K. E. Gibson. 2018. Swabbing the surface: critical
factors in environmental monitoring and a path towards standardization and improvement. Crit.
Rev. Food Sci. Nutr. 60:225–243.
Kintz, E., L. Byrne, C. Jenkins, N. McCarthy, R. Vivancos, P. Hunter. 2019. Outbreaks of Shiga
toxin–producing Escherichia coli linked to sprouted seeds, salad, and leafy greens: A systematic
review. J. Food Prot. 82:1950–1958.
Kruskal, W. H. and W. A. Wallis. 1952. Use of ranks in one-criterion variance analysis. J. Am.
Stat. Assoc. 47:583–621.
Kyriacou, M. C., S. De Pascale, A. Kyratzis, and Y. Rouphael. 2017. Microgreens as a
component of space life support systems: a cornucopia of functional food. Front. Plant Sci. 8:8–
11.
Kyriacou, M. C., Y. Rouphael, F. Di Gioia, A. Kyratzis, F. Serio, M. Renna, S. De Pascale, and
P. Santamaria. 2016. Micro-scale vegetable production and the rise of microgreens. Trends Food
Sci. Technol. 57:103–115.
Lensing, C. 2018. Controlled Environment Agriculture: Farming for the Future? CoBank ACB,
CoBank’s Knowledge Exchange Division. Available at: https://hortamericas.com/wp-
content/uploads/2018/05/KED-Report-ControlledEnvironment-May2018.pdf. Date accessed: 5
Feb 2020.
Love, D. C., J. P. Fry, L. Genello, E. S. Hill, J. A. Frederick, X. Li, and K. Semmens. 2014. An
international survey of aquaponics practitioners. PLoS One 9:1–10.
Love, D. C., J. P. Fry, X. Li, E. S. Hill, L. Genello, K. Semmens, and R. E. Thompson. 2015.
Commercial aquaponics production and profitability: findings from an international survey.
Aquaculture 435:67–74.
McCartney, L. 2018. Protected agriculture in extreme environments: a review of controlled
environment agriculture in tropical, arid, polar, and urban locations. Appl. Eng. Agric. 34:455–
473.
Mok, H. F., V. G. Williamson, J. R. Grove, K. Burry, S. F. Barker, and A. J. Hamilton. 2014.
Strawberry fields forever? Urban agriculture in developed countries: a review. Agron. Sustain.
Dev. 34:21–43.
Olaimat, A. N. and R. A. Holley. 2012. Factors influencing the microbial safety of fresh produce:
a review. Food Microbiol. 32:1–19.
O’Sullivan, C. A., G. D. Bonnett, C. L. McIntyre, Z. Hochman, and A. P. Wasson. 2019.
Strategies to improve the productivity, product diversity and profitability of urban agriculture.
Agric. Syst. 174:133–144.
Parker, J. S., J. DeNiro, M. L. Ivey, and D. Doohan. 2016. Are small and medium scale produce
farms inherent food safety risks? J. Rural Stud. 44:250–260.

76
Rai, A., A. K. Srivastava, and H. C. Gupta. 2001. Small sample comparison of modified chi-
square test statistics for survey data. Biometrical J. 43:483–495.
Rock, C. M., N. Brassill, J. L. Dery, D. Carr, J. E. McLain, K. R. Bright, and C. P. Gerba. 2019.
Review of water quality criteria for water reuse and risk-based implications for irrigated produce
under the FDA Food Safety Modernization Act, Produce Safety Rule. Environ. Res. 172:616–
629.
Shamshiri, R. R., F. Kalantari, K. C. Ting, K. R. Thorp, I. A. Hameed, C. Weltzien, D. Ahmad,
and Z. Shad. 2018. Advances in greenhouse automation and controlled environment agriculture:
a transition to plant factories and urban agriculture. Int. J. Agric. Biol. Eng. 11:1–22.
Solomon, E. B., C. J. Potenski, and K. R. Matthews. 2002. Effect of irrigation method on
transmission to and persistence of Escherichia coli O157:H7 on lettuce. J. Food Prot. 65:673–6.
Specht, K., R. Siebert, I. Hartmann, U. B. Freisinger, M. Sawicka, A. Werner, S. Thomaier, D.
Henckel, H. Walk, and A. Dierich. 2014. Urban agriculture of the future: an overview of
sustainability aspects of food production in and on buildings. Agric. Human Values 31:33–51.
Stine, S. W., I. Song, C. Y. Choi, C. P. Gerba. 2005. Effect of relative humidity on pre-harvest
survival of bacterial and viral pathogens on the surface of cantaloupe, lettuce, and bell peppers.
J. Food Prot. 68:1352–1358.
Tian, J. Q., Y. M. Bae, and S. Y. Lee. 2013. Survival of foodborne pathogens at different relative
humidities and temperatures and the effect of sanitizers on apples with different surface
conditions. Food Microbiol. 35:21–26.
Thomaier, S., K. Specht, D. Henckel, A. Dierich, R. Siebert, U. B. Freisinger, and M. Sawicka.
2015. Farming in and on urban buildings: Present practice and specific novelties of zero-acreage
farming. Renew. Agric. Food Syst. 30:43–54.
Touliatos, D., I. C. Dodd, and M. McAinsh. 2016. Vertical farming increases lettuce yield per
unit area compared to conventional horizontal hydroponics. Food Energy Secur. 5:184–191.
U.S. Department of Health & Human Services, 2015. FSMA Final Rule on Produce Safety:
Standards for the Growing, Harvesting, Packing, and Holding of Produce for Human
Consumption; Final Rule. Federal Register 80:74353–74568.
United States Census Bureau, 2016. Educational Attainment in the United States. Available at:
https://www.census.gov/data/tables/2018/demo/education-attainment/cps-detailed-tables.html.
Accessed 5 Feb 2020.
United States Food & Drug Administration, 2019. Chlorofields recalls Asian microgreens
because of possible health risk. Recalls, Market Withdrawals, and Safety Alerts. Available at:
https://www.fda.gov/safety/recalls-market-withdrawals-safety-alerts/chlorofields-recalls-asian-
miicrogreens-because-possible-health-risk. Accessed 8 Feb 2020.
United States Food & Drug Administration, 2018. Greenbelt Greenhouse Ltd Recalls Greenbelt
Microgreens brand microgreens because of possible health risk. Recalls, Market Withdrawals,
and Safety Alerts. Available at: https://www.fda.gov/Safety/Recalls/ucm605702.htm. Accessed 8
Feb 2020.
77
United States Food & Drug Administration, 2016. Osage Gardens Inc. recalls Osage Gardens
Organic 2oz microgreens because of possible health risk. Recalls, Market Withdrawals, and
Safety Alerts. Available at: http://wayback.archive-
it.org/7993/20180126102042/https://www.fda.gov/Safety/Recalls/ucm524638.htm. Accessed 31
Dec 2019.
Wickham, H. 2016. ggplot2: Elegant Graphics for Data Analysis. Springer-Verlag, New York,
NY.
Wright, K. M. and H. J. Holden. 2018. Quantification and colonization dynamics of Escherichia
coli O157:H7 inoculation of microgreens species and plant growth substrates. Int. J. Food
Microbiol. 273:1–10.
Xiao, Z., G. Bauchan, L. Nichols-Russell, Y. Luo, Q. Wang, X. Nou. 2015. Proliferation of
Escherichia coli O157:H7 in soil-substitute and hydroponic microgreen production systems. J.
Food Prot. 78:1785–1790.
Xiao, Z., X. Nou, Y. Luo, Q. Wang. 2014. Comparison of the growth of Escherichia coli
O157:H7 and O104:H4 during sprouting and microgreen production from contaminated radish
seeds. Food Microbiol. 44:60–63.
Zabel, P., M. Bamsey, D. Schubert, and M. Tajmar. 2016. Review and analysis of over 40 years
of space plant growth systems. Life Sci. Sp. Res. 10:1–16.
Zezza, A., and L. Tasciotti. 2010. Urban agriculture, poverty, and food security: Empirical
evidence from a sample of developing countries. Food Policy 35:265–273.

78
Figures
Figure 1. Farm geographic distribution by revenue category. The nine farms in the 25,000-
49,999 USD/year category are not shown because none of those farms provided a zip code.

79
Tables
Table 1. Number of farm employees by revenue category
Revenue Avg. # Employees SD n
Less than $5000 7.3 9.1 27
$5000 - $9999 3.7 1.9 19
$10000 - $24999 5.6 6.4 7
$25000 - $49999 3.3 1.5 3
Greater than $50000 127.8 170.7 5
Prefer Not to Answer 141.3 316.0 6
SD = standard deviation, n = total number of respondents that answered the question (NA
responses were omitted)
Table 2. Combinations of System Type and Location
System Location
Aq
uap
on
ics
Con
tain
er
farm
Hyd
rop
on
ics
In g
rou
nd
Rais
ed b
eds
Tra
ys
on
stack
ed
shel
ves
Climate controlled greenhouse 2 15 2 0 1 4
Indoors- commercial 1 1 5 1 0 12
Indoors- residential 0 2 5 1 0 47
Non-climate controlled greenhouse 0 3 0 1 0 7
Outdoors 0 1 0 6 0 1
n = 176, “NA” responses omitted. Shading allows easy visibility of most (darkest) to least
(lightest) common combinations.
Table 3. Environmental Conditions
System Location Water (°C) Air (°C) RH (%) n
Climate controlled greenhouse 18.1 ± 14 20.7 ± 16 65.8 ± 9.7 6
Indoors - commercial 18.9 ± 6.5 20.7 ± 4 60.0 ± 0 3
Indoors - residential 18.5 ± 9.5 22.3 ± 4.5 51.3 ± 12 24
These conditions were reported by microgreen growers who answered all three questions (n =
33).
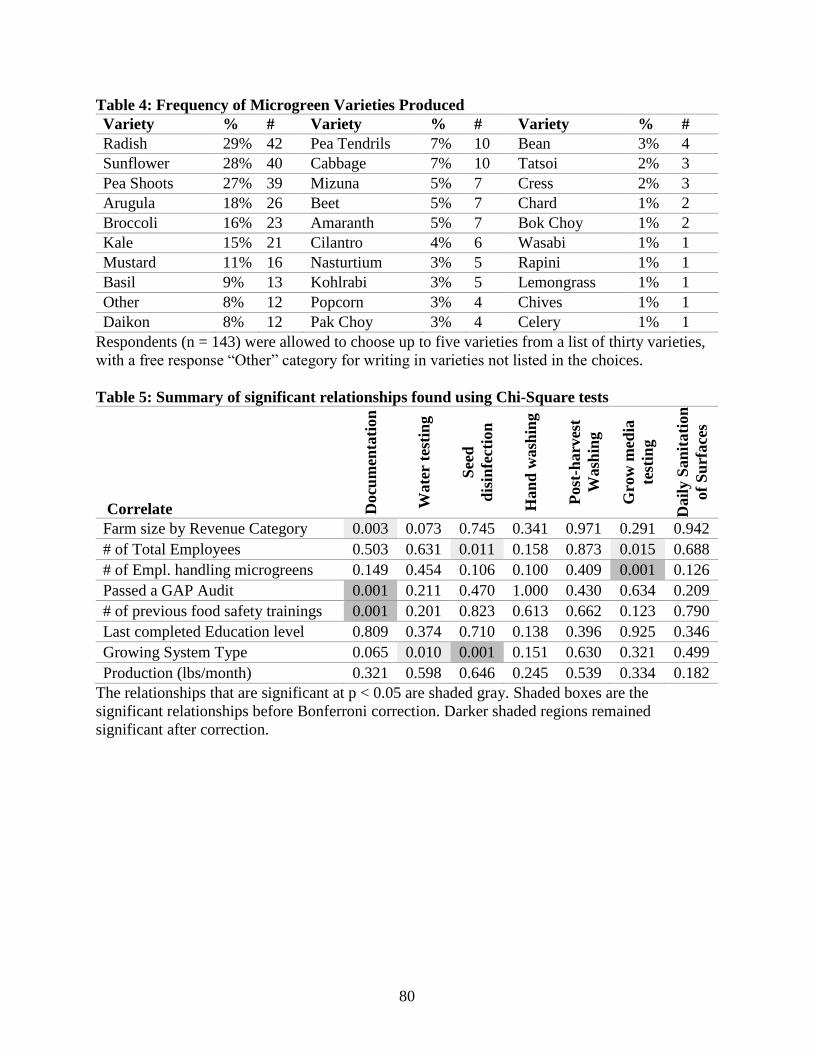
80
Table 4: Frequency of Microgreen Varieties Produced
Variety % # Variety % # Variety % #
Radish 29% 42 Pea Tendrils 7% 10 Bean 3% 4
Sunflower 28% 40 Cabbage 7% 10 Tatsoi 2% 3
Pea Shoots 27% 39 Mizuna 5% 7 Cress 2% 3
Arugula 18% 26 Beet 5% 7 Chard 1% 2
Broccoli 16% 23 Amaranth 5% 7 Bok Choy 1% 2
Kale 15% 21 Cilantro 4% 6 Wasabi 1% 1
Mustard 11% 16 Nasturtium 3% 5 Rapini 1% 1
Basil 9% 13 Kohlrabi 3% 5 Lemongrass 1% 1
Other 8% 12 Popcorn 3% 4 Chives 1% 1
Daikon 8% 12 Pak Choy 3% 4 Celery 1% 1
Respondents (n = 143) were allowed to choose up to five varieties from a list of thirty varieties,
with a free response “Other” category for writing in varieties not listed in the choices.
Table 5: Summary of significant relationships found using Chi-Square tests
Correlate Docu
men
tati
on
Wate
r te
stin
g
See
d
dis
infe
ctio
n
Han
d w
ash
ing
Post
-harv
est
Wash
ing
Gro
w m
edia
test
ing
Dail
y S
an
itati
on
of
Su
rface
s
Farm size by Revenue Category 0.003 0.073 0.745 0.341 0.971 0.291 0.942
# of Total Employees 0.503 0.631 0.011 0.158 0.873 0.015 0.688
# of Empl. handling microgreens 0.149 0.454 0.106 0.100 0.409 0.001 0.126
Passed a GAP Audit 0.001 0.211 0.470 1.000 0.430 0.634 0.209
# of previous food safety trainings 0.001 0.201 0.823 0.613 0.662 0.123 0.790
Last completed Education level 0.809 0.374 0.710 0.138 0.396 0.925 0.346
Growing System Type 0.065 0.010 0.001 0.151 0.630 0.321 0.499
Production (lbs/month) 0.321 0.598 0.646 0.245 0.539 0.334 0.182
The relationships that are significant at p < 0.05 are shaded gray. Shaded boxes are the
significant relationships before Bonferroni correction. Darker shaded regions remained
significant after correction.

81
Table 6. Water testing frequency by system type
System Type Once a year More than once a year No testing
Aquaponics 0 2 0
Unstacked Containers 6 3 3
In Ground 3 1 0
Hydroponics 0 5 0
Raised beds 0 0 1
Trays on shelves 18 8 5
Total responses, n = 118. Non-response values (58/176) have been excluded.
Table 7. Water treatment by water source
Water Treatment Method Municipal
Water Well Water
Collected
Rainwater Other
Activated charcoal filter 1 (0.7%) 6 (4.2%) 4 (2.8%) 0
Chlorine filter 5 (3.5%) 1 (0.7%) 0 0
Lemon juice 1 (0.7%) 0 0 0
Reverse osmosis 5 (3.5%) 3 (2.1%) 1 (0.7%) 1 (0.7%)
Sediment filter 4 (2.8%) 5 (3.5%) 2 (1.4%) 0
Ultraviolet light 4 (2.8%) 3 (2.1%) 1 (0.7%) 0
Water softener 2 (1.4%) 1 (0.7%) 0 0
Untreated 36 (25.1%) 44 (30.7%) 2 (1.4%) 1 (0.7%)
For the irrigation water source question, respondents (n = 143) were allowed to choose more than
one answer so columns and rows totals will not add up to 143. Percentages are calculated out of
143 responses.
Table 8. Frequency of Sanitation of Production Surfaces and Equipment
Frequency Floors Prep Tables Tools Trays
Daily or more 41 (28.6%) 74 (51.7%) 83 (58.0%) 43 (30.0%)
2-4 times a week 34 (23.7%) 22 (15.3%) 15 (10.4%) 18 (12.6%)
Once a week 19 (13.2%) 8 (5.6%) 8 (5.6%) 32 (22.3%)
Once a month 10 (6.9%) 4 (2.8%) 3 (2.1%) 12 (8.4%)
Never 6 (4.2%) 3 (2.1%) 1 (0.7%) 4 (2.8%)
Percentages are calculated out of 143 responses.
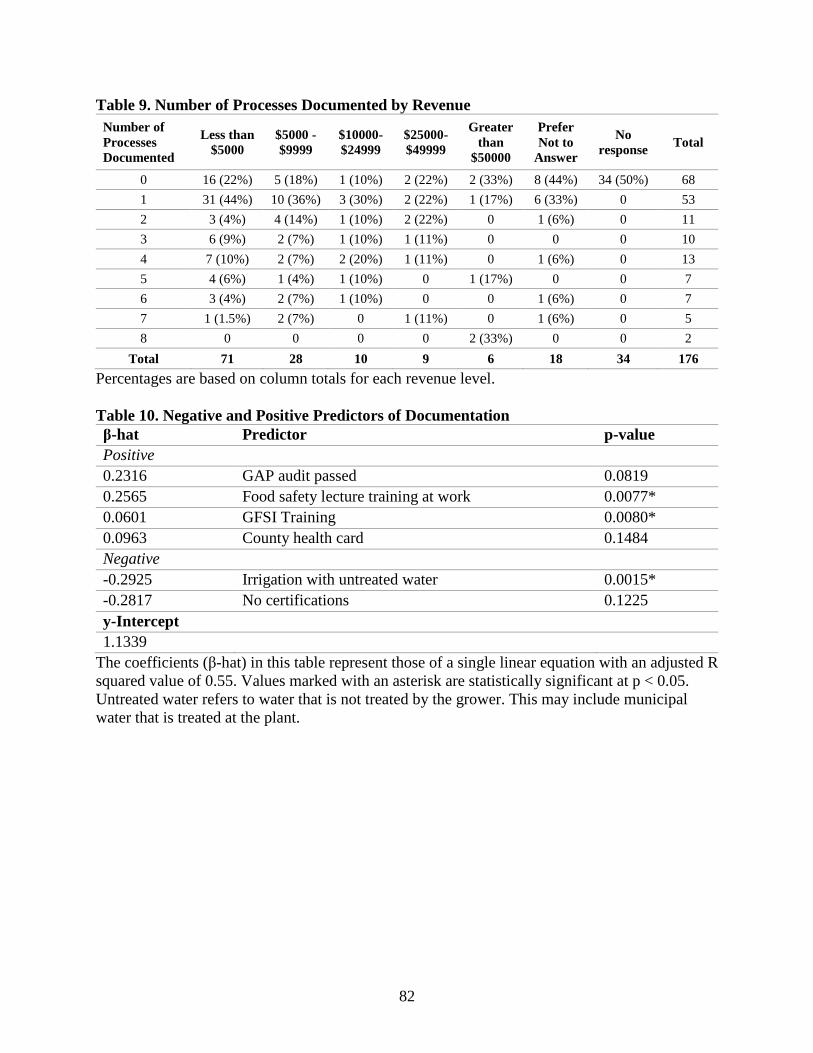
82
Table 9. Number of Processes Documented by Revenue
Number of
Processes
Documented
Less than
$5000
$5000 -
$9999
$10000-
$24999
$25000-
$49999
Greater
than
$50000
Prefer
Not to
Answer
No
response Total
0 16 (22%) 5 (18%) 1 (10%) 2 (22%) 2 (33%) 8 (44%) 34 (50%) 68
1 31 (44%) 10 (36%) 3 (30%) 2 (22%) 1 (17%) 6 (33%) 0 53
2 3 (4%) 4 (14%) 1 (10%) 2 (22%) 0 1 (6%) 0 11
3 6 (9%) 2 (7%) 1 (10%) 1 (11%) 0 0 0 10
4 7 (10%) 2 (7%) 2 (20%) 1 (11%) 0 1 (6%) 0 13
5 4 (6%) 1 (4%) 1 (10%) 0 1 (17%) 0 0 7
6 3 (4%) 2 (7%) 1 (10%) 0 0 1 (6%) 0 7
7 1 (1.5%) 2 (7%) 0 1 (11%) 0 1 (6%) 0 5
8 0 0 0 0 2 (33%) 0 0 2
Total 71 28 10 9 6 18 34 176
Percentages are based on column totals for each revenue level.
Table 10. Negative and Positive Predictors of Documentation
β-hat Predictor p-value
Positive
0.2316 GAP audit passed 0.0819
0.2565 Food safety lecture training at work 0.0077*
0.0601 GFSI Training 0.0080*
0.0963 County health card 0.1484
Negative
-0.2925 Irrigation with untreated water 0.0015*
-0.2817 No certifications 0.1225
y-Intercept
1.1339
The coefficients (β-hat) in this table represent those of a single linear equation with an adjusted R
squared value of 0.55. Values marked with an asterisk are statistically significant at p < 0.05.
Untreated water refers to water that is not treated by the grower. This may include municipal
water that is treated at the plant.
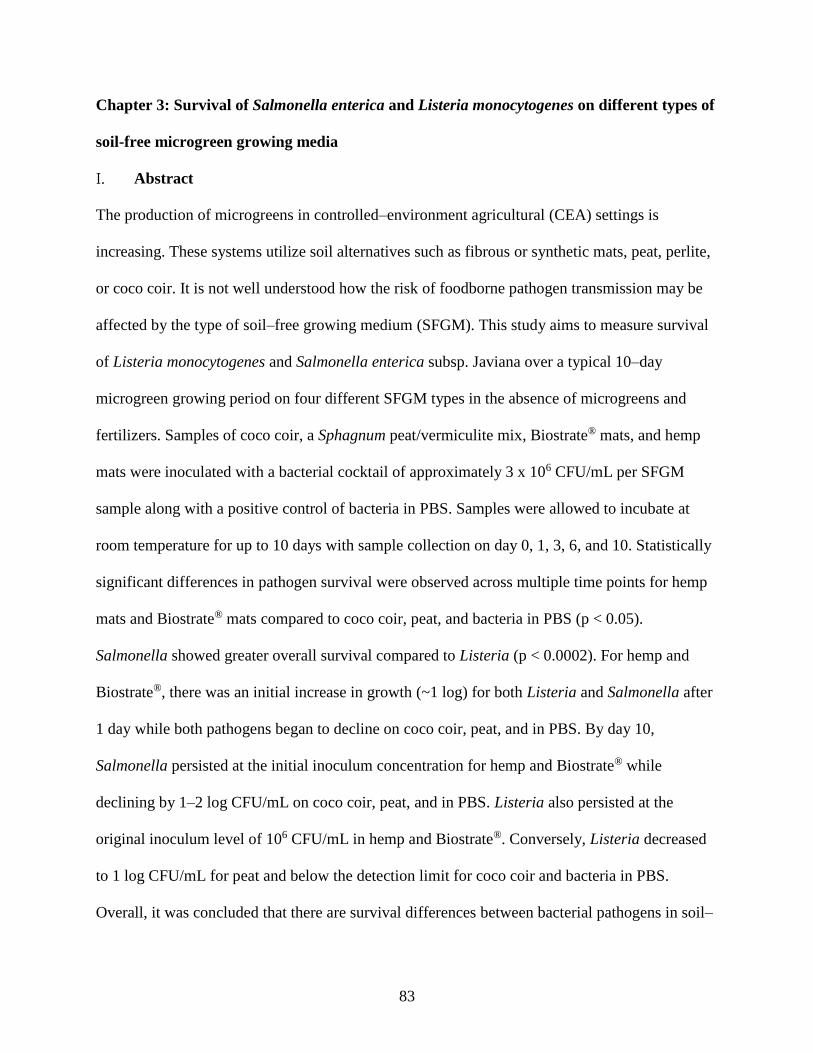
83
Chapter 3: Survival of Salmonella enterica and Listeria monocytogenes on different types of
soil-free microgreen growing media
Abstract
The production of microgreens in controlled–environment agricultural (CEA) settings is
increasing. These systems utilize soil alternatives such as fibrous or synthetic mats, peat, perlite,
or coco coir. It is not well understood how the risk of foodborne pathogen transmission may be
affected by the type of soil–free growing medium (SFGM). This study aims to measure survival
of Listeria monocytogenes and Salmonella enterica subsp. Javiana over a typical 10–day
microgreen growing period on four different SFGM types in the absence of microgreens and
fertilizers. Samples of coco coir, a Sphagnum peat/vermiculite mix, Biostrate® mats, and hemp
mats were inoculated with a bacterial cocktail of approximately 3 x 10⁶ CFU/mL per SFGM
sample along with a positive control of bacteria in PBS. Samples were allowed to incubate at
room temperature for up to 10 days with sample collection on day 0, 1, 3, 6, and 10. Statistically
significant differences in pathogen survival were observed across multiple time points for hemp
mats and Biostrate® mats compared to coco coir, peat, and bacteria in PBS (p < 0.05).
Salmonella showed greater overall survival compared to Listeria (p < 0.0002). For hemp and
Biostrate®, there was an initial increase in growth (~1 log) for both Listeria and Salmonella after
1 day while both pathogens began to decline on coco coir, peat, and in PBS. By day 10,
Salmonella persisted at the initial inoculum concentration for hemp and Biostrate® while
declining by 1–2 log CFU/mL on coco coir, peat, and in PBS. Listeria also persisted at the
original inoculum level of 106 CFU/mL in hemp and Biostrate®. Conversely, Listeria decreased
to 1 log CFU/mL for peat and below the detection limit for coco coir and bacteria in PBS.
Overall, it was concluded that there are survival differences between bacterial pathogens in soil–

84
free microgreen systems, and these survival differences may be further impacted by the specific
SFGM material used.
Introduction
An estimated 9.4 million foodborne illnesses from 31 identified pathogens occur per year in the
United States (Scallan et al., 2011). Human bacterial pathogens, including non–typhoidal
Salmonella and Listeria monocytogenes, are significant contributors to this annual burden of
disease. Approximately 3.6 million (39%) of the estimated 9.4 million illnesses are caused by
bacteria. Non–typhoidal Salmonella is the leading bacterial pathogen, attributed to an estimated
11% of illnesses and 27% of hospitalizations. Furthermore, of the approximately 800 deaths
estimated to occur each year in the US from foodborne bacterial pathogens, non–typhoidal
Salmonella and L. monocytogenes are the top two etiologic agents—with the latter characterized
by a 16% mortality rate (Scallan et al., 2011).
In recent decades, fresh produce has been increasingly implicated in foodborne illness outbreaks
related to Salmonella and L. monocytogenes (Warriner et al., 2009). Data from the US Centers
for Disease Control and Prevention’s (CDC) National Outbreak Reporting System (NORS)
revealed that fruits and vegetables have been implicated in 185 outbreaks (~12,000 illnesses)
caused by Salmonella and Listeria from 1998 to 2017. Produce—typically eaten raw—is
frequently associated with these outbreaks due to a variety of factors including poor worker
hygiene during harvest and packing, cross-contamination from soil amendments (e.g., manure
and compost), and contaminated seeds, irrigation water, or soil (Alegbelye et al., 2018, Gil et al.,
2016, Olamait et al., 2012). Additionally, post–harvest washing of raw produce may have a
85
limited effect due to the tendency of contaminants to become internalized within the plant tissue
during cultivation (Hirneisen et al., 2012).
Produce of particular interest include sprouted seeds (referred to as ‘sprouts’) and leafy greens as
these are frequently implicated in outbreaks. For example, a search for “sprouted seeds” in the
CDC NORS database from 1998–2017, there were 42 Salmonella outbreaks involving sprouts—
a popular raw salad crop that is produced in an environment of high water activity and
temperatures favorable to bacterial growth (US FDA, 2019). Leafy greens have also been
extensively studied due to their frequent involvement in outbreaks (Herman et al., 2015, Self et
al., 2019, Sharapov et al., 2016, Turner et al., 2019). Microgreens, an emerging raw salad crop,
share some traits with both leafy greens and sprouts (Riggio et al., 2018). These immature shoots
of common vegetables are gaining attention as a potential vector for foodborne pathogens
(Riggio et al., 2018). While sprouts germinate for up to 5 days and are consumed whole (i.e.
including the root system), microgreens are grown in soil, soil alternatives, or hydroponic
systems in ways that are similar to controlled environment leafy green production and are
harvested above the root system after 10 to 21 days (Mir et al., 2017). At this time, there have
been no reported outbreaks related to microgreens. However, there have been an increasing
number of microgreen recalls associated with possible L. monocytogenes or Salmonella
contamination. In Canada, 6 of the 7 recalls were due to L. monocytogenes and were classified as
“high risk,” while one was determined to be “moderate risk” and involved Salmonella (CFIA,
2018a-f, CFIA, 2019a and 2019b). In the United States, two recalls also involved L.
monocytogenes (US FDA, 2016 and 2019) and one involved Salmonella (US FDA, 2018).
86
Despite these differences, the microgreen growing environment could also enable the
proliferation of pathogens. At present, there are 9 published studies that have specifically
addressed food safety-related microbiological characteristics of microgreen production
(Bergspica et al. 2020, Chandra et al. 2012, Di Gioia et al., 2017, Isik et al. 2020, Lee et al.,
2009, Reed et al., 2018, Wright and Holden, 2019, Xiao et al., 2014 and 2015). For example, the
behavior of Shiga toxin–producing Escherichia coli (STEC) under microgreen production
conditions revealed that contaminated seeds and growing media could successfully transfer
STEC to the edible product (Xiao et al., 2015). Furthermore, the authors implied that hydroponic
microgreen production might confer a greater transfer risk than the soil–grown counterpart.
Indoor production using potting soil and soil alternatives are popular among microgreen
producers. Examples of soil alternatives include coco coir, peat mixed with perlite or
vermiculite, gravel, sand, and fibrous mats made from textiles, biodegradable felt, hemp, coco
coir, cellulosic materials (Kennedy 2018), wood fiber, and synthetics (Di Gioia et al., 2017,
Sarkar and Majumdar 2018, Wright and Holden, 2018). Microgreens can also be produced
hydroponically, with or without a rooting medium (Weber 2017, 2018). Since soil is an
important source of contamination for field-grown leafy greens (Alegbelye et al., 2018), it is
important to determine if the growing media used in indoor horticulture is a similarly important
contamination route.
Only two previous studies have addressed differential survival of microorganisms on soil–free
growing media (SFGM). Between jute/kenaf, polypropylene, textile fiber mats, and fertilized
peat, it was demonstrated that peat and jute-kenaf mats were associated with the highest numbers
of colony forming units per gram (CFU/g) of background aerobic mesophilic bacteria (AMB),

87
yeasts, and mold compared to textile and polypropylene mats. Furthermore, transfer of
background levels of Enterobacteriaceae and E. coli to microgreens was greater for peat and jute-
kenaf mats compared to the textile and polypropylene mats (Di Gioia et al., 2017). Similarly, a
comparison of three types of felt growing pads (20% rayon/80% polyester, 100% polyester, and
a wool/burlap blend), perlite, and plastic mesh contaminated with STEC in the absence of plants
revealed differences between substrates. However, the only statistically significant difference in
STEC levels was between the polyester pads (8 log CFU/g) and the plastic mesh (5 log CFU/g)
(Wright and Holden, 2018). Thus far, no studies have directly assessed the survival of
Salmonella and L. monocytogenes on SFGM in the absence of confounding influences from
plants or fertilizers.
Therefore, in order to understand how different SFGM materials may influence pathogen transfer
to microgreens, it is necessary first to assess differences in bacterial survival on each SFGM
material. If the bacterial concentration changes over the growing period, this persistence, growth,
or decline may convey an increased or decreased risk of pathogen uptake by the microgreens,
complicating the effect of initial contaminant concentration. The present study was conducted to
determine if four types of SFGM (coco coir, peat/vermiculite, Biostrate® mats, and hemp mats)
showed differential growth support of L. monocytogenes and Salmonella Javiana. It was
hypothesized that the SFGM with the highest carbon and micronutrient content would be most
supportive of bacterial persistence and/or growth.

88
Materials and Methods
Selection and Preparation of SFGM
Due to the wide variety of soil alternatives available, the material choice for this study was based
on our recent survey of microgreen growers (n = 176) who sell in the US (Chapter 2). In our
survey, the most popular growing media for microgreen producers included peat with perlite or
vermiculite, potting soil, coco coir, and various organic fiber pads such as hemp, burlap, and
Biostrate®. Fibrous mats were used in both hydroponic and non–hydroponic production systems.
Thus, a Sphagnum peat and vermiculite mix (hereafter referred to as ‘peat’), coco coir, hemp
fiber mats, and Biostrate® biodegradable fiber mats were chosen for the present study.
SFGM samples included a 3.5-cm square of Biostrate® (Grow-Tech, South Portland, ME, USA)
with an average weight of 0.29 ± 0.06 g; a 2.5-cm square of hemp mat (BioComposites Group,
Alberta, Canada) with an average weight of 1.01 ± 0.16 g; a 5–cm3 sample of coco coir
(UBICON, Woodridge, IL, USA) with an average weight of 1.13 ± 0.11 g; and a 5–cm3 sample
of Jiffy–Mix® Soilless Starter Peat/Vermiculite mix (Harris Seeds, Rochester, NY, USA) with an
average weight of 0.92 ± 0.13g. The weight and volume of each SFGM material was chosen
based on its water retention capacity, which is discussed further in Section Vb.
The water retention capacity of each material was approximated by placing pre-weighed, dry
SFGM in a 10” × 20” germination tray (Harris Seeds, Rochester, NY) with a single hole in the
bottom, resting above a collection beaker. Volumes of distilled water were subsequently added to
each material until excess water began to drain into the beaker. At the completion of drainage,
the water that drained into the beaker was poured into a graduated cylinder to measure the
89
volume of the excess. The excess distilled water was subtracted from the initial volume added to
get an approximate water retention capacity. Results of the water retention determination are in
Table 3-S2 of the Appendix.
Chemical Analysis of SFGM
Each type of SFGM was analyzed at the Fayetteville Agricultural Diagnostic Laboratory at the
University of Arkansas (Fayetteville, AR) for total carbon, total nitrogen, nitrate-nitrogen,
minerals, pH, and electrical conductivity (EC). Peat and coco coir were submitted for analysis in
their original state while Biostrate® and hemp mats were pre-processed using sterile scissors to
shred and homogenize prior to analysis. Biostrate® and hemp were also analyzed for acid
detergent fiber (ADF) including lignin and cellulose, neutral detergent fiber (NDF) including
lignin, cellulose, and hemicellulose, and acid detergent lignin (ADL). Peat and coco coir could
not be analyzed for ADF and NDF due to technical limitations of the methods.
The diagnostic laboratory performed a saturation extract on all four media samples in preparation
for mineral analysis, nitrate nitrogen, and EC. The mineral analysis was performed using the
Melich-3 method by inductively coupled plasma mass spectrometry (ICP) as described in Zhang
et al., (2014). Total nitrogen and carbon were determined by combustion as described in
Campbell et al., (1992), and nitrate nitrogen was determined by UV–Vis spectroscopy as
described in Peters et al., (2003). EC and pH were determined by electrode using the soil EC and
pH methods described in Sikora et al., (2014) and Wang et al., (2014), respectively. The %ADF,
%ADL, and %NDF were determined by the AOAC filter bag method for A200 (AOAC 1990,
Van Soest et al., 1991).

90
Preparation of Bacterial Cultures
Bacteria used in this study include L. monocytogenes (FSL R2–574) isolated from a soft cheese
outbreak and Salmonella enterica subsp. Javiana (ATCC BAA1593) isolated from a tomato
outbreak. L. monocytogenes was streaked for isolation from a glycerol stock on Modified Oxford
Medium (MOX) agar (HiMedia Laboratories, Mumbai, India) with antimicrobial supplement
(BD Difco, Franklin Lakes, NJ, USA) containing colistin sulfate (10 mg/L) and moxalactam (20
mg/L). Similarly, a glycerol stock of S. Javiana streaked on Xylose Lysine Tergitol–4 (XLT4)
agar (Criterion, Philadelphia, PA, USA) with a 4.6 mL/L Tergitol 4 agar supplement (BD Difco).
The inoculated XLT4 and MOX plates were incubated at 37°C for 18 h and 35°C for 24 h,
respectively. A single colony from each plate was transferred to separate 50 mL conical tubes of
10 mL of Brain–Heart Agar Infusion (BHI) broth (BD Difco) for L. monocytogenes and Tryptic
Soy Broth (TSB, BD Difco) for S. Javiana and incubated overnight at 35°C at 120 rpm in a
shaking incubator (Thermo Scientific MaxQ 4000).
Overnight cultures were centrifuged at 4000 × g for 10 min at 10°C to pellet the bacteria. The
pellet was washed twice in 10 mL of sterile phosphate buffered saline (PBS, pH = 7.4) using the
same centrifugation speed and time and then re-suspended in 10 mL of sterile PBS. The bacterial
cocktail was prepared by adding 1 mL each of the prepared cultures into a sterile 15 mL tube and
vortexed briefly at maximum speed. A 10–fold dilution series was prepared, and the cocktail was
enumerated by spread plate on XLT4 and MOX agar and incubated as described previously. The
bacterial cocktail contained approximately 109 CFU/mL each of S. Javiana and L.
monocytogenes and was diluted to a final concentration of 106 CFU/mL in sterile PBS prior to
inoculation of SFGM.
91
Inoculation Method
Two replicates for each SFGM material were inoculated with 3 mL of the bacterial cocktail
while a third was used as an un-inoculated control, spotted with 3 mL of sterile PBS. Additional
tubes were set up as 1) a positive control containing 3 mL of the bacterial cocktail in PBS (106
CFU/mL) but no SFGM, and 2) an un–inoculated control tube containing only 3 mL of sterile
PBS and no SFGM, for a total of 14 tubes. An identical set of 14 tubes was prepared for each
collection day – day 0, day 1, day 3, day 6, and day 10 (see Figure 3-S1 in Appendix). All five
sets of tubes were simultaneously inoculated on day 0. The tubes were incubated at room
temperature on the lab bench with the caps loose to retain moisture but allow for aeration until
sampling at the designated time point.
Recovery of Bacteria from SFGM
Immediately after inoculating all tubes, the day 0 set of tubes was processed for recovery of
bacteria. To elute, each tube was filled with 12 mL of PBS (total = 15 mL) and pulse–vortexed at
maximum speed every 15 s for 1 min. One milliliter of eluent was removed and diluted in a 1:10
dilution series. Peat and coco coir were allowed to settle for 30 s before pipetting the liquid to
avoid particulates clogging the pipette tip. For each dilution level, 100 μL was plated onto
selective agar as described in Section III,, subpart iii. The elution and enumeration processes
were repeated at day 1, 3, 6, and 10 post-inoculation (p.i.).
Recovery Efficiency and Assay Detection Limit
Prior to beginning the experiment, the recovery efficiency of the elution method was determined
by inoculating SFGM samples prepared as described in Section III, i. with a cocktail of S.
92
Javiana and L. monocytogenes at a concentration of 106 CFU/mL inside of sterile 50 mL
centrifuge tubes. The bacterial cocktail was prepared as described previously in Section III, iii.
Bacteria were allowed to acclimate for 1 h at room temperature and then eluted as described in
Section III, v. For the assay detection limit, it was assumed that no fewer than 1 CFU could
theoretically be detected in each 100 μL of eluent plated. Thus, the concentration of the 15-mL
eluent from each SFGM sample must be at least 10 CFU/mL, or 150 CFU per sample, to be
above the limit of detection. For peat and coco coir samples, there was some suspicion that
bacterial attachment to media particles might impact recovery as Salmonella in particular can
interact with soil particles (Turpin et al., 1993). However, recovery of Salmonella from peat was
only somewhat lower than the other SFGM types, and coco coir recovery was the same as for
Biostrate® (Table 3-S3 in the Appendix). Therefore, recovery was not likely to be significantly
impacted by these particulate interactions.
Sanger Sequencing of Isolates
As background microorganisms appeared on SFGM blanks, colonies were picked, and glycerol
stocks were prepared. Molecular biology grade glycerol (MP Biomedicals, Irvine, CA) was
diluted to 50% concentration with sterile Millipore water, and the final 50% glycerol mixture
was filter sterilized through a 0.45–micron syringe filter membrane (Corning, City, State) and
stored at 4°C until use. One colony each from the XLT4 and MOX plates were selected with a
sterile inoculating loop and inoculated into 5 mL of TSB in glass culture tubes and incubated at
37°C for 24 h. Following incubation, 500 μL of the TSB culture was mixed with 500 μL of
sterile 50% glycerol in 2 mL cryogenic tubes and stored at –80°C until further analysis.

93
Amplification of the 16S rRNA Gene by PCR
A single colony from each un-inoculated control plate was chosen and grown to an approximate
concentration of 109 CFU/mL overnight in either BHI if the isolate was found on MOX plates or
TSB if the isolate was found on XLT4 plates. DNA was extracted from liquid cultures using the
Qiagen UltraClean Microbial DNA Kit (Cat. #12224, Qiagen, Valencia, CA) by following the
manufacturer’s instructions and quantified on a NanoDrop 1000 Spectrophotometer (Thermo
Fisher Scientific, Wilmington, Delaware, USA).
Amplicon sequencing of the V4 region of the 16S rRNA gene for each isolate was performed
with the primer set 515F/806R designed by Caporaso et al. (2011) and by following the protocol
by the Earth Microbiome Project (Thompson 2018).
Sequencing and Identification
The resulting PCR products were sequenced using the Sanger method (Sanger et al. 1977) at the
Arizona State Genomics Center (Tempe, AZ, USA). NCBI BLAST was used to determine the
identity of each isolate. Results of BLAST queries are shown in Table 2, and the raw sequence
data are included in Table 3-S7 in the Appendix.
Statistical Analysis
The first and second experiments, which were conducted approximately one month apart but
using an identical protocol, demonstrated unequal variances but equal means both overall and for
each sampling day. Therefore, it was determined that the experiments could be pooled into a
94
single dataset. Day 10 was not included in this comparison because no sampling was performed
on day 10 for Experiment 1. Results of this analysis are available in the Appendix, Table 3-S1.
The R software platform (R Core Development Team, version 3.6.0) was used to perform
statistical analysis along with the library “lsmeans” (Lenth, 2016). To compare mean survival
among SFGM materials, a separate One–Way ANOVA was performed for each sampling day
and pathogen at a 0.05 significance level followed by post-hoc pairwise comparisons using
Tukey’s HSD test (Tukey 1949). Overall, pathogen survival differences were determined by a
student’s t-test at a 0.05 significance level.
Results
Overview
Mean log CFU/mL among SFGM materials for each pathogen at each incubation time were
compared. Relationships and p-values for all SFGM comparisons are reported in Table 3 as well
as Table 3-S3, 3-S4, 3-S5 in the Appendix. Using a separate one–way ANOVA and Tukey HSD
post-hoc comparisons for each sampling day, statistically significant differences were observed
from day 1 through day 10 for L. monocytogenes. Growth dynamics for both pathogens followed
a general pattern of statistically significant increases at 24 h p.i. for Biostrate® and hemp mats,
followed by a decline for all SFGM except for S. Javiana on Biostrate®, which remained at
approximately 106 CFU/mL for the duration of the experiment. No statistically significant
growth occurred on peat, coco coir, and in bacteria in PBS, and instead followed a steady decline
across the 10–day incubation period.

95
Survival of Salmonella Javiana on SFGM
Survival of S. Javiana is shown in Figure 1. At 24 h p.i., the survival of S. Javiana was greater by
0.8 log CFU/mL on hemp than on all other SFGM types, but gradually dropped off over the
study period. In general, peat, coco coir, and PBS showed no significant differences between one
another and remained as such for the duration of the experiment, while Biostrate® and hemp
demonstrated either growth or persistence. At 10 days p.i.—a typical microgreen harvest time
point—survival on Biostrate® was 1.5 log CFU/mL greater than bacteria in PBS, 1.8 log
CFU/mL greater than peat, and 2.2 log CFU/mL greater than coco coir; all differences were
statistically significant. Hemp was significantly greater than peat by 1.1 log CFU/mL and coco
coir by 1.5 log CFU/mL, but was no different from bacteria in PBS. Overall, statistically
significant decreases between day 0 and day 10 occurred on coco coir, peat, and bacteria in PBS,
but initial inoculum levels were maintained for Biostrate® mats and hemp mats (Table 3).
Survival of Listeria monocytogenes on SFGM
Survival of L. monocytogenes is shown in Figure 2. At 24 h p.i., the L. monocytogenes
population increased by 2 log CFU/mL and by 1 log CFU/mL on Biostrate® whereas peat, coco
coir, and the bacteria in the PBS control maintained the original inoculum concentration. On day
3 p.i., survival on Biostrate® and hemp still supported 2 log CFU/mL of bacterial cells compared
to peat and coco coir. L. monocytogenes did not survive well in PBS only, as evidenced by
significant die-off. This decline in numbers continued for peat and coco coir through the sixth
day. On day 10 p.i., survival on both Biostrate® and hemp was approximately 6 log CFU/mL,
similar to the original inoculum. Survival of L. monocytogenes on these media were both more
than 5 log CFU/mL greater than on peat, which was only 1.3 log CFU/mL by the end of the

96
experiment. Bacteria concentrations on coco coir and PBS fell below the assay detection limit
(Table 3).
Pathogen Differences
A student’s t-test indicated that S. Javiana persisted at a greater overall average concentration
(6.35 ± 0.75 log CFU/mL) than L. monocytogenes (5.33 ± 2.28 log CFU/mL) at p = 0.0002. The
increase was 1.02 log CFU/mL with a 95% confidence interval of 0.49 to 1.55 log CFU/mL.
Overall survival differences and the greater variation in L. monocytogenes survival can be
observed in Figures 1 and 2.
Compositional Analysis of SFGM
Biostrate® and hemp contain a greater percentage of organic matter as evidenced by 73.2% lignin
in Biostrate® and 70.9% cellulose in hemp. Biostrate® and hemp have greater quantities of total
carbon, 48.94% and 42.99%, respectively, compared to coco coir and peat, which are both
approximately 12% total carbon. The electrical conductivity of coco coir (1036 µΩ/cm) and peat
(780 µΩ/cm) were greater than Biostrate® (32 µS/cm) and hemp (96 µΩ/cm). Sodium,
potassium, and iron levels were also greater in peat and coco coir compared to Biostrate® and
hemp. The complete compositional analysis of SFGM is shown in Table 1.
Differences in Recovery Efficiency Between Pathogens
Recovery efficiency differed between pathogen species. L. monocytogenes was recovered at a
rate of 75%, and S. Javiana was recovered at a rate of 40% compared to the original inoculum
concentration. Among SFGM, recovery of Gram-negative S. Javiana from peat and hemp were

97
less than for Biostrate® and coco coir. For Gram-positive L. monocytogenes, recovery from peat
was the poorest, but there was less variation in general between SFGM types (Table 3-S3 in the
Appendix).
Background Microorganisms Isolated from SFGM
Seven unknown organisms appeared on the un-inoculated blank SFGM samples, primarily on
hemp, but with one representative each from peat, Biostrate®, and coco coir. The sequences of
the 16S rRNA gene amplicons and the identities of these organisms are shown in Table 2. None
of these background organisms appeared on the inoculated samples or on negative control plates
for the PBS used to prepare suspensions.
Discussion
Differences Between SFGM Materials
The present study investigated differences in survival between two common produce–associated
pathogens (S. Javiana and L. monocytogenes) on four types of SFGM (coco coir, peat, Biostrate®
mats, and hemp mats) to determine if SFGM material influenced pathogen survival
independently of plant roots and fertilizers. The hypothesis was that organic carbon-rich SFGM
would be more supportive of bacterial growth than inorganic or synthetic substrates. Biostrate®
and hemp grow mats, which were greater in total carbon than coco coir and peat, supported the
growth of S. Javiana and L. monocytogenes R2–574, while coco coir and peat did not. Generally,
these results are consistent with previous work indicating that choice of growing medium can
impact microbiological characteristics of soil-free systems (Di Gioia et al., 2017, Grunert et al.,
2016, Koohakan et al., 2004, Macarisin et al., 2013, Reed et al., 2018, Xiao et al., 2015).

98
Di Gioia et al., (2017) demonstrated that peat and polyethylene terephthalate (PET) mats were
positive for Enterobacteriaceae, the family to which Salmonella spp. belongs and an important
hygiene indicator. On peat, 2 log CFU/g was detected at planting, and 5.5 log CFU/g was
recovered from harvested Rapini microgreens. For PET mats, 1 log CFU/g was detected at
planting, but recovery was below the detection limit in harvested microgreens. However, another
type of SFGM tested in this study, jute–kenaf mats, tested negative for Enterobacteriaceae at
planting but revealed nearly 4 log CFU/g in the harvested microgreens. These results suggest that
material type may be more predictive of pathogen transfer than initial contaminant levels.
It is worth noting that while the peat used in Di Gioia et al., (2017) showed growth of
Enterobacteriaceae, the peat in the present study only supported persistence of S. Javiana but not
growth. However, the present study investigated only SFGM, without cultivation of microgreens.
Thus, it is possible that the presence of plant roots contributes to microbial survival in a growing
medium that would otherwise not support microbial growth. Furthermore, Di Gioia and others
(2017) measured background Enterobacteriaceae, a community likely comprised of multiple
genera, which may or may not include any Salmonella subspecies, let alone S. Javiana. Reed et
al. (2018) demonstrated that Salmonella survival may even differ between types of peat as well
as serovar.
Other work, however, is consistent with evidence provided by the present study. Xiao et al.,
(2015) grew radish microgreens in a peat mix and on PET hydroponic growing mats and
observed a ~2 log CFU/g decline in E. coli O157:H7 on peat between planting and harvest from
both 3.7 log CFU/g and 5.7 log CFU/g initial inocula. Furthermore, while Di Gioia et al., (2017)
observed minimal background contamination of PET mats and the lowest bacterial transfer to
99
plants, Xiao et al., (2015) observed a ~2 log CFU/g increase in the surrounding hydroponic
nutrient solution and greater transfer to plants. However, it is difficult to tell if it is the PET mats
or the hydroponic nutrient solution that facilitates pathogen growth in this type of microgreen
cultivation system.
Wright and Holden (2018) reported a plant-free comparison of SFGM using polyester,
polyester/rayon, wool/burlap, perlite, and plastic mesh. These authors demonstrated a 2 to 3 log
CFU/mL increase in STEC after harvest at as many as 19 days (dependent upon microgreen
variety) in all three mat types as well as perlite, while plastic mesh appeared to show no change
in population. These results suggest a difference between organic (fibrous mats) and synthetic
media (plastic), but no difference between inorganic (perlite) and organic media. The present
study did not make any comparisons to synthetic media due to low reported use by our survey
respondents (Chapter 2). However, in light of previous findings demonstrating greater pathogen
transfer risk related to hydroponic nutrient water where synthetic media was used (Xiao et al.,
2015), such an investigation would be useful. In conclusion, peat demonstrates potentially
contradictory results, showing either a 1.5 – 3 log increase in Enterobacteriaceae (Di Gioia et al.,
2017) or a 2 log CFU/g decrease in E. coli O157:H7 as in Xiao et al., (2015) and a 2 log
CFU/mL decrease in S. Javiana in the present study. Perlite appears to support STEC growth
(Wright and Holden, 2018). Importantly, fibrous mats high in organic carbon, such as polyester
or jute-kenaf, appear to support growth of STEC (Wright and Holden, 2018) as well as generic
E. coli and Enterobacteriaceae (Di Gioia et al., 2017). The present study supports these data, as
the fibrous, organic carbon-rich Biostrate® and hemp mats were supportive of the growth of L.
monocytogenes and S. Javiana.
100
Hemp and Biostrate Support Growth of L. monocytogenes
L. monocytogenes survival followed a similar pattern on both hemp and Biostrate®, characterized
by a logarithmic increase during the first day followed by stabilization. The fact that there were
few significant differences among peat, coco coir, and bacteria in PBS indicates that coco coir
and peat do not, on their own, provide nutritional support for the growth of L. monocytogenes.
Analysis of chemical constituents of peat and coco coir, particularly related to total carbon
content, provides some evidence for this assumption.
Most previous work examining Listeria survival in growing media has involved agricultural and
forest-sourced soil (Dowe et al., 1997, Jiang et al., 2004, Locatelli et al., 2013, McLaughlin et
al., 2011, Vivant 2013a & b). It is well known that Listeria species are able to survive in soil due
to their tolerance for a wide range of temperatures and ability to grow under sub-optimal
conditions (Welshimer 1960). It has been demonstrated that L. monocytogenes prefers fertile soil
over clay soils (Welshimer 1960, Locatelli et al., 2013). Listeria is saprophytic (Ivanek et al.,
2006), suggesting that its preference for decaying organic matter indicates potential to survive
better in media of high organic carbon content, such as manure-amended soils (Jiang et al.,
2004). The peat and coco coir used in the present study both had a total carbon content of 12%
compared to the 42% and 49% of Biostrate® and hemp mats, respectively. Total carbon was
measured as carbon dioxide resulting from the combustion of the material, so this does not
necessarily represent total organic carbon, though the high percentages of cellulose and lignin
suggest a high percentage of total organic carbon.

101
In media with low total carbon content (peat and coco coir), there was no discernable growth
observed for L. monocytogenes, but instead an approximate 4 log CFU/mL reduction over 10
days (Figure 2). This reduction is consistent with previous L. monocytogenes survival studies in
soil (McLaughlin et al., 2011) showing that three strains of L. monocytogenes incubated at both
25°C and 30°C in soil samples collected from a forested region in Ireland declined by
approximately 4 log CFU/g over 6 days. Therefore, L. monocytogenes survival in peat and coco
coir may be similar to that of forest soil, though without a complete characterization of soil and
peat using the same analytes, and without directly comparing survival experimentally, the data
are difficult to compare.
Competitive inhibition by diverse communities of native soil microorganisms may contribute to
the suppression of growth for L. monocytogenes (Vivant et al., 2013a,b). McLaughlin et al.,
(2011) observed the growth of 1 log CFU/g after a one–day incubation in sterilized forest soil,
compared to a decline in fresh forest soil. They also showed that a competitive in vitro assay
between aerobic soil isolates and L. monocytogenes resulted in a moderate decline in L.
monocytogenes. A comparison of 100 soil samples across France also demonstrated that soil
microbial communities influenced L. monocytogenes survival in soils (Locatelli et al., 2013). In
the present study, background microorganisms Bacillus cereus, Klebsiella, and Curtobacterium
were detected on hemp mats, where survival was high. Klebsiella was also found on coco coir,
where survival was poor. Enterobacter was found on Biostrate®, where survival was high.
Therefore, these organisms do not appear to affect survival of L. monocytogenes on these SFGM
types. In cases such as coco coir, poor survival may be attributable to other organisms not
recovered or biochemical effects of the media. Survival was also poor on peat, and peat was the
102
only SFGM type where Pseudomonas was recovered. There is some prior evidence that
Pseudomonas may suppress the growth of L. monocytogenes in co-culture (Buchanan and Bagi,
1999).
Moisture level in growing media likely influences L. monocytogenes survival (Dowe et al.,
1997). After one week of exposure to air, moist soil samples inoculated with L. monocytogenes
began to decline in numbers compared to capped samples, indicating that L. monocytogenes will
survive longer in moist environments (McLaughlin et al., 2011). Water retention capacity
differences between SFGM types may contribute to survival differences due to varying
susceptibility to desiccation over time. Biostrate® and hemp mats both had greater water
retention capacities (8.8 mL/g and 10 mL/g, respectively) compared to coco coir and peat (3
mL/g for both), which may have contributed to improved survival of L. monocytogenes on those
media (Table 3-S3 in the Appendix). However, sensitivity to desiccation may be strain specific.
For example, across 8 strains of fish slaughterhouse–associated L. monocytogenes that were
cultured in high and low salt concentrations and allowed to desiccate on stainless steel surfaces,
L. monocytogenes strain EDG was more sensitive to the other seven tested. Interestingly,
survival for all strains was improved when grown in fish juices with high organic matter content
as well as greater NaCl. (Vogel et al., 2010). In the present study, L. monocytogenes survival was
best on SFGM with the highest apparent organic matter as indicated by total carbon and % NDF
(Table 1). Despite peat and coco coir having greater EC (Table 1), and thus greater salt content,
the low organic matter may have been a contributing factor to poorer survival. Drying likely
occurred on all SFGM materials over the duration of the experiment, so it is possible that the
103
greater organic matter present in Biostrate® and hemp mitigated some die–off despite possible
drying.
S. Javiana survived on all SFGM tested
Survival of Salmonella in the soil is a subject of intense study due to its presence in animal
manure fertilizers and its link to outbreaks attributed to contaminated produce. It is well known
to persist in farm environments among livestock, soil, and plants via feed, water, and equipment
(Jacobson et al., 2012). However, studies are lacking that examine factors influencing
Salmonella survival in soil alternatives.
Our results showed that S. Javiana persisted over the 10–day incubation period with values
ranging from 4.6 to 8.2 log CFU/mL depending on the type of SFGM, with hemp mats and
Biostrate® mats providing the most support. Although peat and coco coir showed an approximate
2 log decline over the study period, these data generally indicate that S. Javiana is nutritionally
supported by all four types of SFGM tested in the present study, but was also able to survive
similarly well in PBS alone. Sterile PBS was selected as both the suspension and elution buffer
to ensure that all nutrients potentially supporting bacterial growth would be from the SFGM.
This is consistent with the abundance of data showing robust survival abilities of Salmonella spp.
(Jacobson et al., 2012, Kenyon et al., 2011, Kumar et al., 2018, Rychlik and Barrow 2005,
Semenov et al., 2011, Spector et al., 2012, Stocker and Makela 1986). In general, factors
affecting Salmonella survival in soil include temperature, moisture, soil type, presence of plants,
exposure to ultraviolet light, inoculation level, method of application of bacteria (in experimental
conditions), and protozoan predation (Jacobson et al., 2012). Characteristics that aid in
104
Salmonella survival include biofilm production (Kumar et al., 2018) and the ability to tolerate
both aerobic and anaerobic environments (Semenov et al., 2011).
While it appeared that S. Javiana was able to survive in the presence of all SFGM, only hemp
mats and Biostrate® mats demonstrated statistically significant growth at any time point. Thus, it
may be surmised that hemp and Biostrate® are more nutritive than coco coir and peat. However,
while L. monocytogenes did not survive well in coco coir and peat, with levels of 1 log CFU/mL
or less by day 10, S. Javiana persisted at 4.67 log CFU/mL or greater by day 10, even in bacteria
in PBS. S. Javiana may have been relying upon a survival mechanism adapted for nutrient poor
conditions that is not expressed by L. monocytogenes R–574. For example, S. Typhimurium may
respond to unfavorable conditions by initiating a starvation stress response (SSR) that is specific
to carbon–poor environments, allowing it to become more efficient at using nutrient sources and
initiating other cellular protection mechanisms (Spector & Kenyon 2012). It is not known if S.
Javiana is also capable of SSR.
Study Limitations
Absence of Plant Roots
The present study only observed survival on SFGM alone. Because previous work (DiGioia et
al., 2017, Wright and Holden, 2018, Xiao et al., 2015) performed growing media comparisons in
microgreen production systems, it will be necessary to demonstrate if differences in pathogen
survival on SFGM exist when microgreen roots are present in the medium. The nutrient-rich
microenvironment surrounding plant roots may be taken advantage of by pathogens as well as
native microorganisms associated with the growing medium (Reed et al., 2018).
105
Differing Water Retention Capacities Among SFGM
Peat, coco coir, Biostrate®, and hemp each have different water retention capacities (Table 3-S2
in Appendix) and densities, which complicates determining the appropriate inoculation volume
and sample mass. The water retention capacity was used to determine the appropriate volume of
bacterial cocktail to add to each SFGM sample so that all of the bacteria added would be in
contact with the SFGM material without excess liquid pooling in the bottom of the tube. Sample
mass had to be adjusted so that each sample mass was close to saturation at the same volume,
requiring different sample masses. Because of the differing masses of the samples, a 0.29-g piece
of Biostrate at a 42% total carbon would have provided the inoculum with same total carbon
(0.12 g) as a 1-g sample of peat that was 12% total carbon. Lastly, re-wetting of the growing
media to simulate daily watering during microgreen production was not performed. Thus, the
overall decline observed in both pathogens across all growing media may have been due to
gradual water loss over the 10-day experimental period, and in general, water retention capacity
of SFGM may be a more important survival factor than organic carbon availability. This may be
elucidated by an experiment where one side of the microgreen growing tray is inoculated but left
unplanted during production as watering is routine.
Conclusion
Soil–free growing media used in microgreen production is differentially supportive of both S.
Javiana and L. monocytogenes. Biostrate® and hemp supported growth and persistence, while a
Sphagnum peat/vermiculite mix and coco coir were less supportive. L. monocytogenes, in
particular, showed a significant decline over a 10–day period (~5 log CFU/mL), while S. Javiana
experienced only a small decline (~2 log CFU/mL). However, previous work comparing SFGM
106
susceptibility indicates that the presence of plant roots in the medium may complicate these
differences. To our knowledge, this is the first comparison of survival among SFGM involving a
S. enterica serovar and L. monocytogenes, and the first study comparing coco coir, Biostrate®,
and hemp. Further research to elucidate the role of plant roots on pathogen survival is warranted.
Growers entering the microgreen industry should be aware of potential risks associated with their
choice of horticultural media when designing production systems, as carbon-rich and high water-
retaining grow mats such as those examined in this study may confer increased risk for key
foodborne pathogens.

107
References
Abad, M., P. Noguera, R. Puchades, A. Maquieira, and V. Noguera. 2002. Physico-chemical and
chemical properties of some coconut coir dusts for use as a peat substitute for containerized
ornamental plants. Bioresour. Technol. 82:241–245. https://doi.org/10.1016/S0960-
8524(01)00189-4
Alegbeleye, O.O., L. Singleton, and A. S. Sant’Ana. 2018. Sources and contamination routes of
microbial pathogens to fresh produce during field cultivation: A review. Food Microbiol.
73:177–208. https://doi.org/10.1016/j.fm.2018.01.003
Bergšpica, I., A. Ozola, E. Miltiņa, L. Alksne, L., I. Meistere, A. Cibrovska, and L Grantiņa-
Ieviņa. 2020. Occurrence of pathogenic and potentially pathogenic bacteria in microgreens,
sprouts, and sprouted seeds on retail market in Riga, Latvia. Foodborne Pathog. Dis.
fpd.2019.2733. https://doi.org/10.1089/fpd.2019.2733
Buchanan, R. L. and L. K. Bagi. 1999. Microbial competition: Effect of Pseudomonas
fluorescens on the growth of Listeria monocytogenes. Food Microbiol. 16:523–529.
https://doi.org/10.1006/fmic.1998.0264
Caporaso, J. G., C. L. Lauber, W. A. Walters, D. Berg-Lyons, C. A. Lozupone, P. J. Turnbaugh,
N. Fierer, and R. Knight. 2011. Global patterns of 16S rRNA diversity at a depth of millions of
sequences per sample. Proc. Natl. Acad. Sci. 108:4516–4522.
https://doi.org/10.1073/pnas.1000080107
Canadian Food Inspection Agency, 2019a. Pousses et Cie brand mix Spicy Microgreens recalled
due to Listeria monocytogenes. Food Recall Warnings and Allergy Alerts, May 22. URL:
https://healthycanadians.gc.ca/recall-alert-rappel-avis/inspection/2019/70007r-eng.php. Date
accessed: 2/1/2020.
Canadian Food Inspection Agency, 2019b. Food Recall Warning - GPM brand Pea Shoots
recalled due to Listeria monocytogenes. Food Recall Warnings and Allergy Alerts, April 19.
URL: https://www.inspection.gc.ca/food-recall-warnings-and-allergy-alerts/2019-04-
19/eng/1555725095376/1555725097506. Date accessed: 2/1/2020.
Canadian Food Inspection Agency, 2018a. Food Recall Warning - Certain Greenbelt
Microgreens brand microgreens recalled due to Listeria monocytogenes. Food Recall Warnings
and Allergy Alerts, August 25. URL: https://www.inspection.gc.ca/food-recall-warnings-and-
allergy-alerts/2018-08-25/eng/1535250311816/1535250313826. Date accessed: 2/1/2020
Canadian Food Inspection Agency, 2018b. Lufa Farms Inc. brand Arugula Microgreens recalled
due to Salmonella. Food Recall Warnings and Allergy Alerts, June 29. URL:
https://healthycanadians.gc.ca/recall-alert-rappel-avis/inspection/2018/67156r-eng.php. Date
accessed: 2/1/2020
Canadian Food Inspection Agency, 2018c. Correction - Food Recall Warning - Certain Greenbelt
Microgreens brand microgreens recalled due to Listeria monocytogenes. Food Recall Warnings
and Allergy Alerts, April 30. Date accessed: 2/1/2020
Canadian Food Inspection Agency, 2018d. Food Recall Warning - GPM brand Pea Shoots
recalled due to Listeria monocytogenes. Food Recall Warnings and Allergy Alerts, June 7. URL:
108
http://inspection.gc.ca/about-the-cfia/newsroom/food-recall-warnings/complete-listing/2018-06-
07/eng/1528383445910/1528383449409. Date accessed: 2/1/2020
Canadian Food Inspection Agency, 2018e. Food Recall Warning - Goodleaf brand Daikon
Radish microgreens recalled due to Listeria monocytogenes. Food Recall Warnings and Allergy
Alerts, June 28. URL: http://inspection.gc.ca/about-the-cfia/newsroom/food-recall-
warnings/complete-listing/2018-06-28/eng/1530237479767/1530237483085. Date accessed:
2/1/2020
Canadian Food Inspection Agency, 2018f. Updated Food Recall Warning - Evergreen Herbs
brand Pea Shoots recalled due to Listeria monocytogenes. Food Recall Warnings and Allergy
Alerts, June 7. URL: http://inspection.gc.ca/about-the-cfia/newsroom/food-recall-
warnings/complete-listing/2018-06-07/eng/1528409624622/1528409626775. Date accessed:
2/1/2020
Chandra, D., J. G. Kim, and Y. P. Kim. 2012. Changes in microbial population and quality of
microgreens treated with different sanitizers and packaging films. Hortic. Environ. Biotechnol.
53:32–40. https://doi.org/10.1007/s13580-012-0075-6
Dowe, M. J., E. D. Jackson, J. G. Mori, and C. R. Bell. 1997. Listeria monocytogenes survival in
soil and incidence in agricultural soils. J. Food Prot. 60:1201–1207.
https://doi.org/10.4315/0362-028X-60.10.1201
Gil, M. I., O. J. Caleb, P. V. Mahajan, G. Colelli, H. Izumi, M. Zude, and C. B. Watkins. 2017.
Quality and safety of fresh horticultural commodities: Recent advances and future perspectives.
Food Packag. Shelf Life 14:2–11. https://doi.org/10.1016/j.fpsl.2017.08.001
Grunert, O., E. Hernandez-Sanabria, R. Vilchez-Vargas, R. Jauregui, D. H. Pieper, M. Perneel,
M. C. Van Labeke, D. Reheul, N. Boon. 2016. Mineral and organic growing media have distinct
community structure, stability and functionality in soilless culture systems. Sci. Rep. 6:1–14.
https://doi.org/10.1038/srep18837
Herman, K., A. Hall and L. Gould. 2015. Outbreaks attributed to fresh leafy vegetables, United
States, 1973–2012. Epidemiol. Infect. 143:3011–3021. https://doi.org/10.1007/s11065-015-9294-
9.Functional
Hirneisen, K.A., M. Sharma, and K. E. Kniel. 2012. Human Enteric Pathogen Internalization by
Root Uptake into Food Crops. Foodborne Pathog. Dis. 9:396–405.
https://doi.org/10.1089/fpd.2011.1044
Işık, H., Z. Topalcengiz, S. Güner, and A. Aksoy. 2020. Generic and Shiga toxin-producing
Escherichia coli (O157:H7) contamination of lettuce and radish microgreens grown in peat moss
and perlite. Food Control 111(107079). https://doi.org/10.1016/j.foodcont.2019.107079
Ivanek, R., Y. T. Gröhn, and M. Wiedmann. 2003. Listeria monocytogenes in multiple habitats
and host populations: review of available data for mathematical modeling, in: Encyclopedia of
Physical Science and Technology. Elsevier, pp. 219–230. https://doi.org/10.1016/B0-12-227410-
5/00411-7
Jacobson, A.P., R. Duvall, S. Chirtel, V. S. Gill, H. Wang, T. S. Hammack, and G. Arce. 2016.
Relative effectiveness of selected pre-enrichment media for the detection of Salmonella from

109
leafy green produce and herbs. Food Microbiol. 63:123–128.
https://doi.org/10.1016/j.fm.2016.11.006
Jiang, X., M. Islam, J. Morgan, and M. P. Doyle. 2004. Fate of Listeria monocytogenes in bovine
manure-amended soil. J. Food Prot. 67:1676–1681. https://doi.org/10.4315/0362-028X-
67.8.1676
Jinming, H., and M. Xuehui. 2002. Physical and Chemical Properties of Peat, in: Coal, Oil Shale,
Natural Bitumen, Heavy Oil and Peat. EOLSS Publications, pp. 309–327.
Kennedy, T.S., 2018. Biopolymer-based growth media and methods of making and using same.
US RE46, 716 E.
Khalil, H.P.S.A., M. S. Alwani, A. K. M. Omar. 2006. Chemical composition, anatomy, lignin
distribution, and cell wall structure of Malaysian plant waste fibers. Bio Resour. 1:220–232.
Koohakan, P., H. Ikeda, T. Jeanaksorn, M. Tojo, S. I. Kusakari, K. Okada, and S. Sato. 2004.
Evaluation of the indigenous microorganisms in soilless culture: Occurrence and quantitative
characteristics in the different growing systems. Sci. Hortic. 101:179–188.
https://doi.org/10.1016/j.scienta.2003.09.012
Kumar, G.D., Williams, R.C., Sriranganathan, N., Boyer, R.R., Eifert, J.D., 2018. Survival of
tomato outbreak associated Salmonella serotypes in soil and water and the role of biofilms in
abiotic surface attachment. Foodborne Pathog. Dis. 15, 548–553.
https://doi.org/10.1089/fpd.2017.2416
Lee, J., J. Kim, and S. Park. 2009. Effects of chlorine wash on the quality and microbial
population of _Tah Tasai_ Chinese cabbage microgreens. Korean J. Hortic. 27:625–630.
Lenth, R. 2016. Least-Squares means (version 2.25) R package. Retrieved from https://cran.r-
project.org/web/packages/lsmeans/index.html
Locatelli, A., A. Spor, C. Jolivet, P. Piveteau, and A. Hartmann. 2013. Biotic and abiotic soil
properties influence survival of Listeria monocytogenes in Soil. PLoS One 8, 1–8.
https://doi.org/10.1371/journal.pone.0075969
Macarisin, D., J. Patel, V. K. Sharma. 2014. Role of curli and plant cultivation conditions on
Escherichia coli O157: H7 internalization into spinach grown on hydroponics and in soil. Int. J.
Food Microbiol. 173:48–53. https://doi.org/10.1016/j.ijfoodmicro.2013.12.004
McLaughlin, H. P., P. G. Casey, J. Cotter, C. G. M. Gahan, and C. Hill. 2011. Factors affecting
survival of Listeria monocytogenes and Listeria innocua in soil samples. Arch. Microbiol.
193:775–785. https://doi.org/10.1007/s00203-011-0716-7
Mir, S.A., M. A. Shah, M.A., and M. M. Mir. 2017. Microgreens: production, shelf life, and
bioactive components. Crit. Rev. Food Sci. Nutr. 57:2730–2736.
https://doi.org/10.1080/10408398.2016.1144557
Narender, R. and P. K. Dasan. 2014. Chemical treatments of coir pith: Morphology, chemical
composition, thermal, and water retention behavior. Compos. Part B 56:770–779.
110
Olaimat, A.N. and R. A. Holley. 2012. Factors influencing the microbial safety of fresh produce:
A review. Food Microbiol. 32:1–19. https://doi.org/10.1016/j.fm.2012.04.016
Peano, L., Y. Loerincik, M. Margni, and V. Rossi. 2012. Comparative life cycle assessment of
horticultural growing media based on peat and other growing media constituents. Quantis
Sustain. Counts Rep. 41.
Riggio, G.M., Q. Wang, K. E. Kniel, and K. E. Gibson. 2019. Microgreens—A review of food
safety considerations along the farm to fork continuum. Int. J. Food Microbiol. 290:76–85.
https://doi.org/10.1016/j.ijfoodmicro.2018.09.027
Reed, E., C. M. Ferreira, R. Bell, E. W. Brown, and J. Zheng. 2018. Plant-microbe and abiotic
factors influencing Salmonella survival and growth on alfalfa sprouts and Swiss chard
microgreens. Appl. Environ. Microbiol. 84(9):1-11. https://doi.org/10.1128/AEM.02814-17
Sanger, F., S. Nicklen, and A. R. Coulson. 1977. DNA sequencing with chain-terminating
inhibitors. Proc. Natl. Acad. Sci. USA. 74, 5463–5467.
Sarkar, A. and M. Majumder. 2018. Suitable substrate for crop growth under protected farms –
an assessment. J. Sci. Agric. 2:62. https://doi.org/10.25081/jsa.2018.v2.860
Scallan, E., R. M. Hoekstra, F. J. Angulo, R. V. Tauxe, M. A. Widdowson, S. L. Roy, J. L.
Jones, and P. M. Griffin. 2010. Foodborne Illness Acquired in the United States—Unspecified
Agents. Emerg. Infect. Dis. 17:16–22. https://doi.org/10.3201/eid1701.p21101
Self, J.L., A. Conrad, S. Stroika, A. Jackson, L. Whitlock, K. A. Jackson, J. Beal, A. Wellman,
M. K. Fatica, S. Bidol, P. P. Huth, M. Hamel, K. Franklin, L. Tschetter, C. Kopko, P. Kirsch, M.
E. Wise, and C. Basler. 2019. Multistate outbreak of listeriosis associated with packaged leafy
green salads, United States and Canada, 2015–2016. Emerg. Infect. Dis. 25:1461–1468.
https://doi.org/10.3201/eid2508.180761
Semenov, A. V., L. Van Overbeek, A. J. Termorshuizen, and A. H. C. Van Bruggen. 2011.
Influence of aerobic and anaerobic conditions on survival of Escherichia coli O157:H7 and
Salmonella enterica serovar Typhimurium in Luria-Bertani broth, farm-yard manure and slurry.
J. Environ. Manage. 92, 780–787. https://doi.org/10.1016/j.jenvman.2010.10.031
Sharapov, U.M., A. M. Wendel, J. P. Davis, W. E. Keene, J. Farrar, S. Sodha, E. Hyytia-Trees,
M. Leeper, P. Gerner-Smidt, P. M. Griffin, and C. Braden. 2016. Multistate outbreak of
Escherichia coli o157:h7 infections associated with consumption of fresh spinach: United States,
2006. J. Food Prot. 79:2024–2030. https://doi.org/10.4315/0362-028x.jfp-15-556
Spector, M.P. and W. J. Kenyon. 2012. Resistance and survival strategies of Salmonella enterica
to environmental stresses. Food Res. Int. 45:455–481.
https://doi.org/10.1016/j.foodres.2011.06.056
Thompson, L. 2018. EMP 16S Illumina Amplicon Protocol. Earth Microbiome Project.
https://doi.org/10.17504/protocols.io.nuudeww
Turner, K., C. N. Moua, M. Hajmeer, A. Barnes, M. Needham. 2019. Overview of leafy greens–
related food safety incidents with a California link: 1996 to 2016. J. Food Prot. 82:405–414.
https://doi.org/10.4315/0362-028X.JFP-18-316
111
United States Food Drug Administration, 2016. Osage Gardens Inc. recalls Osage Gardens
Organic 2oz microgreens because of possible health risk. Recalls, withdrawals, safety alerts.
http://wayback.archive-
it.org/7993/20180126102042/https://www.fda.gov/Safety/Recalls/ucm524638.htm. Date
accessed: 12/5/19
United States Food Drug Administration, 2019. Chlorofields recalls Asian microgreens because
of possible health risk. Recalls, recalls, withdrawals, safety alerts.
https://www.fda.gov/safety/recalls-market-withdrawals-safety-alerts/chlorofields-recalls-asian-
miicrogreens-because-possible-health-risk. Date accessed: 12/5/19
United States Food Drug Administration, 2018. Greenbelt Greenhouse Ltd recalls Greenbelt
Microgreens brand microgreens because of possible health risk. Recalls, withdrawals, safety
alerts. https://www.fda.gov/Safety/Recalls/ucm605702.htm. Date accessed: 12/5/19
United States Food and Drug Administration, 2019. Draft guidance for industry: reducing
microbial food safety hazards in the production of seed for sprouting. FDA-2018-D-4534
Vivant, A. L., D. Garmyn, P. A. Maron, V. Nowak, and P. Piveteau. 2013a. Microbial diversity
and structure are drivers of the biological barrier effect against Listeria monocytogenes in soil.
PLoS One 8:1–11. https://doi.org/10.1371/journal.pone.0076991
Vivant, A. L., D. Garmyn, and P. Piveteau. 2013b. Listeria monocytogenes, a down-to-earth
pathogen. Front. Cell. Infect. Microbiol. 4:1–10. https://doi.org/10.3389/fcimb.2013.00087
Vogel, B. F., L. T. Hansen, H. Mordhorst, and L. Gram. 2010. The survival of Listeria
monocytogenes during long term desiccation is facilitated by sodium chloride and organic
material. Int. J. Food Microbiol. 140:192–200. https://doi.org/10.1016/j.ijfoodmicro.2010.03.035
Warriner, K., A. Huber, A. Namvar, W. Fan, and K. Dunfield. 2009. Chapter 4: Recent advances
in the microbial safety of fresh fruits and vegetables. Advances in Food and Nutrition Research.
57:2009, pp. 155–208. https://doi.org/10.1016/S1043-4526(09)57004-0
Weber, C. F. 2017. Nutrient content of cabbage and lettuce microgreens grown on vermicompost
and hydroponic growing pads. J. Hortic. 3. https://doi.org/10.4172/2376-0354.1000190
Weber, C. F. 2017. Broccoli microgreens: a mineral-rich crop that can diversify food systems.
Front. Nutr. 4, 1–9. https://doi.org/10.3389/fnut.2017.0000
Wright, K.M. and N. J. Holden. 2018. Quantification and colonization dynamics of Escherichia
coli O157:H7 inoculation of microgreens species and plant growth substrates. Int. J. Food
Microbiol. 273:1–10. https://doi.org/10.1016/j.ijfoodmicro.2018.02.025
Xiao, Z., G. Bauchan, L. Nichols-Russell, Y. Luo, Q. Wang, and X. Nou. 2015. Proliferation of
Escherichia coli O157:H7 in soil-substitute and hydroponic microgreen production systems. J.
Food Prot. 78:1785–1790. https://doi.org/10.4315/0362-028x.jfp-15-063.
Xiao, Z., X. Nou, Y. Luo, Q. Wang. 2014. Comparison of the growth of Escherichia coli O157:
H7 and O104: H4 during sprouting and microgreen production from contaminated radish seeds.
Food Microbiol. 44:60–63. https://doi.org/10.1016/j.fm.2014.05.015

112
Figures
Figure 1. 10-Day Survival of Salmonella Javiana on SFGM. The lines trace the mean log
CFU/mL of S. Javiana recovered from each type of growing medium (Biostrate®, coco coir,
hemp, peat, and the control) for each collection time. The additional points represent the
individual measurements that make up each mean. Un-inoculated controls did not contain
detectable concentrations of Salmonella and therefore are not shown in the plot.

113
Figure 2. 10-Day Survival of Listeria monocytogenes on SFGM. The lines trace the mean log
CFU/mL of L. monocytogenes recovered from each type of growing medium (Biostrate®, coco
coir, hemp, peat, and the no-media control “Bacteria in PBS”) for each collection time. The
additional points represent the individual measurements that make up each mean. Un-inoculated
controls did not contain detectable concentrations of L. monocytogenes and therefore are not
shown in the plot.
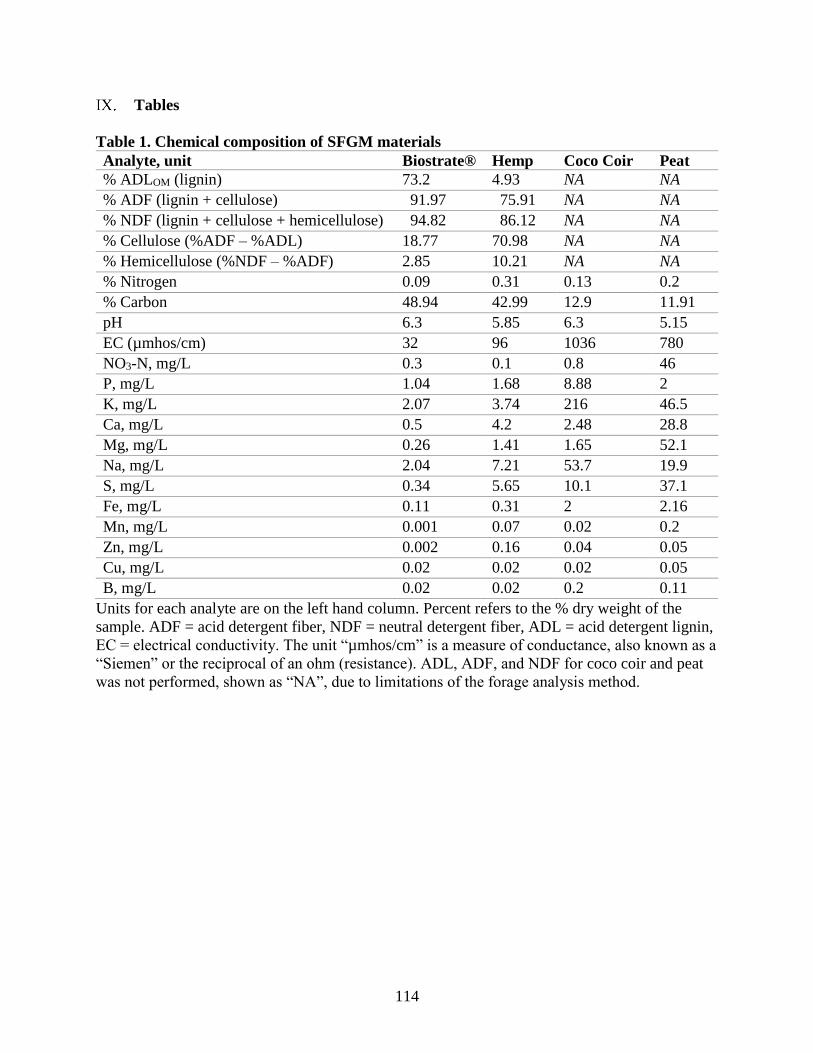
114
Tables
Table 1. Chemical composition of SFGM materials
Analyte, unit Biostrate® Hemp Coco Coir Peat
% ADLOM (lignin) 73.2 4.93 NA NA
% ADF (lignin + cellulose) 91.97 75.91 NA NA
% NDF (lignin + cellulose + hemicellulose) 94.82 86.12 NA NA
% Cellulose (%ADF – %ADL) 18.77 70.98 NA NA
% Hemicellulose (%NDF – %ADF) 2.85 10.21 NA NA
% Nitrogen 0.09 0.31 0.13 0.2
% Carbon 48.94 42.99 12.9 11.91
pH 6.3 5.85 6.3 5.15
EC (µmhos/cm) 32 96 1036 780
NO3-N, mg/L 0.3 0.1 0.8 46
P, mg/L 1.04 1.68 8.88 2
K, mg/L 2.07 3.74 216 46.5
Ca, mg/L 0.5 4.2 2.48 28.8
Mg, mg/L 0.26 1.41 1.65 52.1
Na, mg/L 2.04 7.21 53.7 19.9
S, mg/L 0.34 5.65 10.1 37.1
Fe, mg/L 0.11 0.31 2 2.16
Mn, mg/L 0.001 0.07 0.02 0.2
Zn, mg/L 0.002 0.16 0.04 0.05
Cu, mg/L 0.02 0.02 0.02 0.05
B, mg/L 0.02 0.02 0.2 0.11
Units for each analyte are on the left hand column. Percent refers to the % dry weight of the
sample. ADF = acid detergent fiber, NDF = neutral detergent fiber, ADL = acid detergent lignin,
EC = electrical conductivity. The unit “µmhos/cm” is a measure of conductance, also known as a
“Siemen” or the reciprocal of an ohm (resistance). ADL, ADF, and NDF for coco coir and peat
was not performed, shown as “NA”, due to limitations of the forage analysis method.

115
Table 2. Background Isolates: Colony Morphology, Source, and Identity
# Description SFGM, Plate media Day Genus
1 Large colony, translucent Hemp, XLT4 6 Klebsiella
2 Very small colony, clear Peat, XLT4 6 Pseudomonas
3 Large colony, waxy, white Hemp, XLT4 6 Klebsiella
4 Large colony, white Biostrate®, XLT4 6 Enterobacter
5 Large colony, pale yellow Coir, XLT4 6 Klebsiella
6 Medium-sized colony,
translucent, esculin reaction
Hemp, MOX 6 Bacillus cereus
7 Small colony, weak esculin
reaction, slow growing (~36 h)
Hemp, MOX 1 Curtobacterium
Source includes the SFGM material where the isolate was found and on which type of selective
media, and Day includes the first day where the contaminant appeared. 16S rRNA gene
sequences are provided in the Appendix in Table 3-S7.
Table 3. Survival of S. Javiana and L. monocytogenes at day 10
A. S. Javiana
Material Mean (log CFU/mL) SE Lower CI Upper CI Significance
Coco Coir 4.67 0.175 4.18 5.16 a
Peat 4.99 0.175 4.51 5.48 a
Buffer Only 5.35 0.248 4.67 6.04 ab
Hemp 6.15 0.175 5.66 6.64 bc
Biostrate® 6.86 0.175 6.38 7.35 c
B. L. monocytogenes R2-754
Material Mean (log CFU/mL) SE Lower CI Upper CI Significance
Buffer Only 0.00 0.975 -2.71 2.71 a
Coco Coir 0.00 0.689 -1.91 1.91 a
Peat 1.35 0.689 -0.56 3.26 a
Biostrate® 6.17 0.689 4.26 8.09 b
Hemp 6.75 0.689 4.84 8.66 b
These values represent the mean survival by day 10, a typical microgreen harvest time point.
Values with different letters are significantly different at p < 0.05. The overall significance of the
ANOVA is shown at the bottom. Individual p-values for pairwise comparisons for all sampling
days are available in the Appendix. The significance of the ANOVA for S. Javiana is p = 0.0041
(A), and the significance of the ANOVA for L. monocytogenes is p = 0.0059 (B).
116
Chapter 4: Transfer and survival of Salmonella enterica and Listeria monocytogenes from
soil-free growing media to sunflower microgreens
Abstract
Microgreens are immature shoots of edible plants often eaten as a raw salad green and are
susceptible to contamination by bacterial pathogens commonly associated with produce-borne
illness outbreaks. This study aims to measure survival of Listeria monocytogenes and Salmonella
enterica subsp. Javiana on two types of soil-free growing medium (SFGM) during sunflower
microgreen cultivation, as well as the degree of pathogen transfer to the edible product. S.
Javiana and L. monocytogenes FSL R2-584 were inoculated onto two types of SFGM --
sphagnum peat with vermiculite and Biostrate® biodegradable mats. Following, sunflower
microgreens (Helianthus annuus cultivar Black Oil) were cultivated on half of the inoculated
tray for 10 days, with the other side left unplanted. At harvest, concentrations of the two
pathogens in the growing medium at the start and completion of the growing cycle, as well as in
the harvested microgreens, were determined. Overall, pathogen levels on SFGM declined more
on peat than on Biostrate®, declined more without the presence of microgreen roots than when
the tray was planted, and declined more for L. monocytogenes compared to Salmonella Javiana.
Statistically significant differences were found on Biostrate, where S. Javiana growth was greater
on the planted side of the tray compared to the unplanted side (p = 0.02). There were also
survival differences between the two pathogens. On the unplanted side of Biostrate, there was a
statistically significant difference between L. monocytogenes, which experienced a decline, and
S. Javiana, which experienced growth. These findings indicate that pathogen survival in
microgreen cultivation systems may partially depend on the growing medium chosen. The data
117
also show that the sunflower microgreen root environment may be a source of nutritional support
for these two human pathogens.
Introduction
Microgreens are an emerging raw salad product similar to sprouted seeds and lettuce. However,
while there are similarities, some aspects of microgreen production differ from that of sprouted
seeds (referred to as ‘sprouts’) and lettuce. While sprouts are germinated for 5 days in a warm,
mostly closed, moist environment (US FDA 2017 and 2019), microgreens are germinated for up
to 72 hours in either hydroponic nutrient solution, soil, or a soil-substitute (Muchjajib et al. 2015,
Treadwell et al. 2016, Weber 2017, Di Gioia et al. 2017) and then allowed to grow for 10 to 20
days – approximately during the opening of the cotyledon or the formation of the first set of true
leaves. Lettuce, by contrast, is typically grown in a field or hydroponically and reaches the
mature rosette stage after 90 days (Smith et al. 2011). Produced as a “baby” variety, lettuce may
also be cultivated in container farm greenhouses and harvested at 38 – 43 days (Grahn et al.
2015).
The production environment and conditions under which leafy greens are grown may influence
the plant’s uptake of bacteria, including human pathogens that contribute to produce-associated
foodborne illness (Olaimat et al 2012, Alegbeleye et al. 2018). Approximately 16% of foodborne
illness outbreaks are linked to produce according to the most recent data from 2013, and 37% of
those outbreaks were linked to leafy greens (Bennett et al. 2018). A search for “sprouted seeds”
and “food” in the Centers for Disease Control and Prevention’s National Outbreak Reporting
System (CDC NORS) showed that sprouted seeds alone have been involved in over 1,800
118
foodborne illnesses since the mid-1990s. Microgreens have not yet been responsible for any
known illnesses or outbreaks, but have been implicated in multiple product recalls in the US (US
FDA 2016, 2018, and 2019) and Canada (CFIA 2018a-f, 2019a, and 2019b) due to possible
contamination with Salmonella enterica and Listeria monocytogenes.
Human and plant pathogens alike are known to utilize the plant root system to gain access to
internal plant tissues thus rendering post-harvest washing ineffective (Olaimat et al. 2012,
Bernstein et al. 2016). Therefore, studying aspects of leafy green production that may increase
the risk of contamination via the growing medium is a necessary preventive strategy. Pathogen
uptake into leafy greens from soil has been extensively studied (Warriner et al. 2003, Deering et
al. 2012, Hirneisen et al. 2012, Erickson et al. 2012, 2016, and 2019, Zheng et al. 2013, Zhang et
al. 2015, DiCaprio et al. 2015, Bernstein et al. 2016, Gao et al. 2017, Karanja et al. 2018). In
addition to soil, several studies have explored pathogen uptake by hydroponic crops (DiCaprio et
al. 2012, Hull et al. 2016, Moriarty et al. 2018 and 2019). Review articles on internalization risk
(Hirneisen et al. 2012, Macarisin et al. 2014, Carducci et al. 2015, Riggio et al. 2019) suggest
that pathogen uptake may be affected by a number of factors including pathogen species,
growing medium, and plant variety. Previous work investigating the uptake of foodborne
pathogens in microgreen growing systems have examined soil (Xiao et al. 2014), peat (Xiao et
al. 2015, Di Gioia et al. 2017, Reed et al., 2018) and fibrous mats (Di Gioia et al. 2017, Wright et
al. 2018), and hydroponic nutrient solution (Xiao et al. 2015). Research in this area has been
focused on Escherichia coli, another important foodborne pathogen frequently associated with
outbreaks in leafy greens (Turner et al. 2019). Furthermore, microgreen varieties studied in a
food safety context have included radish (Xiao et al. 2014 and 2015), cabbage (Chandra et al.
119
2012), kale (Wang et al. 2016, Photchanachai et al. 2018), mustard (Wang et al. 2016), Rapini
(Di Gioia et al. 2017), and herb varieties (Wright et al. 2018), but not sunflower microgreens or
pea shoots, which are two of the most commonly grown microgreens (see Chapter 2). To our
knowledge, this is the first microgreen pathogen transfer study involving Salmonella and L.
monocytogenes in sunflower microgreens cultivated in soil-free growing media (SFGM).
Materials and Methods
Preparation of Bacterial Cultures
Bacteria used in this study include L. monocytogenes (FSL R2–574) isolated from a soft cheese
outbreak and Salmonella enterica subsp. Javiana (ATCC BAA1593) isolated from a tomato
outbreak. L. monocytogenes was streaked for isolation from a glycerol stock on Modified Oxford
Medium (MOX) agar (HiMedia Laboratories, Mumbai, India) with antimicrobial supplement
(BD Difco, Franklin Lakes, NJ, USA) containing colistin sulfate (10 mg/L) and moxalactam (20
mg/L). Similarly, a glycerol stock of S. Javiana streaked on Xylose Lysine Tergitol–4 (XLT4)
agar (Criterion, Philadelphia, PA, USA) with a 4.6 mL/L Tergitol 4 agar supplement (BD Difco).
The inoculated XLT4 and MOX plates were incubated at 37°C for 18 h and 35°C for 24 h,
respectively. A single colony from each plate was transferred to separate 50 mL conical tubes of
10 mL of Brain–Heart Agar Infusion (BHI) broth (BD Difco) for L. monocytogenes and Tryptic
Soy Broth (TSB, BD Difco) for S. Javiana and incubated overnight at 35°C at 120 rpm in a
shaking incubator (Thermo Scientific MaxQ 4000).
Overnight cultures were centrifuged at 4000 × g for 10 min at 10°C to pellet the bacteria. The
pellet was washed twice in 10 mL of sterile phosphate buffered saline (PBS, pH = 7.4) using the

120
same centrifugation speed and time and then re-suspended in 10 mL of sterile PBS. A bacterial
cocktail of both pathogens was prepared by adding 1 mL each of the prepared cultures into a
sterile 15 mL tube and vortexing briefly at maximum speed. A 10–fold dilution series was
prepared by placing 100 μL of culture into 900 μL of PBS. The cocktail was enumerated by
spreading 100 μL of each dilution on either XLT4 and MOX agar plates and incubated as
described previously. The bacterial cocktail contained approximately 109 CFU/mL each of S.
Javiana and L. monocytogenes and was diluted to a final concentration of 106 CFU/mL in sterile
PBS prior to inoculation of SFGM.
Preparing the Microgreen Trays
Two types of SFGM, Biostrate® 185 Felt Sheets (Harris Seeds, Catalog #41461-00-00-833,
Rochester, NY) and a peat/vermiculite blend (Soilless Jiffy-Mix, Harris Seeds, Catalog #04035-
00-00-900, Rochester, NY), were chosen for this study. Biostrate® is used in hydroponic
microgreen production, while peat is a common choice for stacked shelf systems. Prior to adding
grow media, each empty tray was disinfected with 70% ethanol and allowed to air dry in a UV-
light treated biosafety cabinet. Following, the appropriate amount of SFGM was weighed into
each tray using sterile containers. Each peat tray contained 600 g peat that was moistened with
1000 mL of sterile distilled water. Each Biostrate® tray contained one ~20g Biostrate® mat that
was moistened with 400 mL of sterile distilled water. Two trays of each SFGM were set aside for
inoculation while two trays of each type of SFGM were covered and used as un-inoculated
controls.
121
Inoculation of Growing Media
Inside the biosafety cabinet, each non-blank microgreen tray was inoculated with 50 mL of a 106
CFU/mL cocktail of the two target organisms. To inoculate, a 50 mL serological pipette was
filled with the cocktail and dripped across the peat or Biostrate® in a zig-zag motion from the top
of the tray to the bottom. This resulted in approximately 5 mL of cocktail spread across the tray
every 2 in (5 cm) as measured on the long edge of the tray. The un-inoculated trays were treated
with 50 mL of only PBS using the same method. After inoculation, but before planting, a
sampling procedure to obtain initial bacterial counts was carried out as described in Section v.
Microgreen Cultivation
Approximately 70 grams of organic sunflower seeds (Helianthus annuus cultivar Black Oil, Cat#
2160SG, Johnny’s Seeds, Maine, USA) for each tray were soaked in 500 mL of sterile distilled
water in a foil-covered beaker for 6 hours prior to planting. At the time of planting, each beaker
of soaked seeds was strained through an autoclaved metal strainer to remove excess water.
Following, seeds were poured from the strainer and, with a gloved hand disinfected with 70%
ethanol, spread evenly over half of the tray, attempting to avoid clumping of seeds. Gloves were
changed between trays. The other half of the tray was left unplanted to compare survival of
microorganisms on the SFGM with and without the presence of microgreen roots. Un-inoculated
trays were planted and sampled first to avoid accidental cross-contamination.
Microgreen germination and growth were carried out in a climate controlled room with an
ambient temperature held between 68°F - 72°F (20 - 22°C) and a relative humidity level of
approximately 70%. After planting, each tray was covered with a second germination tray,
122
disinfected with 70% ethanol, and overturned to form a lid so that germination would take place
in near darkness. Twice per day, the lids were lifted, and seeds were misted with sterile distilled
water to keep them moist through the germination process. After 72 hours, the covers were
removed, and the lights were turned on. The photoperiod was 18 hours on and 6 hours off, using
three GrowBright 4-foot T5 6400K (5000 lumens) Compact Fluorescent Lamps (HTG Supply,
Pennsylvania, USA) per shelf. The microgreen trays were positioned approximately 10” (25 cm)
from the lights. The blank trays were grown on a separate but identically constructed shelf above
the inoculated trays in order to prevent accidental cross-contamination during watering. Watering
was performed using an overhead pouring method for all four trays. From day 3 until day 10,
every 24 hours, the Biostrate® trays were watered with 200 mL of sterile distilled water and the
peat trays were watered with 400 mL of sterile distilled water. To evenly distribute the water
across the trays, each tray was carefully tilted back and forth four times after watering.
Harvesting and Sampling
SFGM
Before spreading the seeds over the growing media, initial SFGM samples were collected to
verify the initial concentration that could be recovered using our elution method. From each
inoculated tray, six total samples were collected. Three were collected from the unplanted side
and three from the planted side (outer edge, middle, and inner edge for each). On the un-
inoculated trays, only two samples were taken from each side (middle and outer edge). A
sampling diagram is available in the Appendix (Figure 4-S1). Sampling of Biostrate® was
conducted by lifting the mat with sterile forceps, removing a 2.5 cm2 piece of media with sterile
scissors, and placing it inside a sterile 50-mL centrifuge tube. Sampling of peat trays was

123
conducted by removing approximately 5-mL samples of peat using a sterile metal scoop and
placing these samples inside a 50-mL centrifuge tube. At harvest, this sampling method was
repeated. When sampling the planted side of each tray, attempts were made to remove as much
root tissue from the mat as possible, but some was inevitably left behind as the root system is
often deeply embedded in the media. Since the grow media samples were wet as a result of
bacterial elution, a dry weight was obtained after the plate assay by pouring off excess liquid and
allowing the media samples to dehydrate at 80°C for 16 hours. Then, each dehydrated media
sample was weighed, and weights were recorded for later CFU/g calculations.
Microgreens
In locations near where SFGM was sampled, 5 – 7 microgreens (approximately 2-3 grams of
microgreens per sample) were held with sterile forceps and then cut 1 cm above the root system
using sterile scissors and placed into stomacher bags. After sampling, each bag of microgreens
was weighed, and the actual sample weight determined by subtracting the weight of an empty
bag. These sample fresh weights were recorded for later CFU/g calculations.
Elution and Recovery
SFGM
To elute, each tube was filled with 10 mL of 1X PBS (pH = 7.5) and pulse–vortexed at
maximum speed every 15 s for 1 min. One milliliter of eluent was removed using a 1-mL
serological pipette and diluted in a 1:10 dilution series. Peat was allowed to settle briefly (~10 s)
before pipetting the liquid to avoid particulates clogging the pipette tip (further discussed in
Section V, part iii, subpart b). The serological pipette allowed improved aspiration of the peat

124
eluent because of the larger opening compared to a 1-mL micropipette tip, minimizing loss of
microorganisms that may have attached to the peat particulates. The dilutions for each sample
were plated and enumerated as described previously.
Microgreens
To elute, each stomacher bag was filled with 10 mL of PBS and stomached for 3 minutes on 240
rpm (Stomacher 400 Circulator; Seward, Worthing, United Kingdom). To further assist
homogenization of the microgreen tissue (~ 2.5 g per bag), manual crushing was performed for
another 5 minutes after stomaching, until the buffer became green and turbid and all stem and
leaf material was broken into very small pieces. The resulting liquid (~7-9 mL) was pipetted into
a 15 mL conical tube and the stomacher bag was discarded. The eluent was then diluted in a 10-
fold dilution series and plated as described previously (Section III, i.)
Statistical Analysis
The R software platform (R Core Development Team, version 3.6.0) was used to perform
statistical analysis along with the library “emmeans” (Lenth 2019) and “ggplot2” (Wickham
2016). Pathogen concentrations expressed as log CFU/g of S. Javiana and L. monocytogenes
were considered to be separate responses. After determining the existence of slight but
statistically significant differences in starting inoculum levels, the growth of S. Javiana and L.
monocytogenes were calculated instead as the difference between harvest and initial. Positive
values represent growth, and negative values represent decline. A separate two-way ANOVA
was conducted for each pathogen, and then pathogen differences were assessed by a separate
three-factor ANOVA. Microgreens were assessed independently from SFGM, in their own set of
125
ANOVA tests, since pathogen levels were obtained using different extraction methods that
demonstrated different recovery efficiencies.
Results
Salmonella Javiana survival and transfer to sunflower microgreens
Absolute measurements of mean log CFU/g of Salmonella Javiana recovered from SFGM and
microgreens at planting (“Initial”) and harvest are shown in Figure 1. A two-way ANOVA
revealed no statistically significant differences in Salmonella Javiana levels recovered from
Biostrate®-grown microgreens and peat-grown microgreens. The mean concentration in
Biostrate®-grown microgreens was 5.45 ± 0.83, while that of peat-grown microgreens was 3.58 ±
1.11 (Table 1) (p = 0.076). Within each set of SFGM conditions, there were no statistically
significant differences in pathogen growth/decline from planting to harvest when comparing
planted (-0.77 ± 0.72 log CFU/g) and unplanted (-1.33 ± 0.43 log CFU/g) sides of the peat tray
(p = 0.44) (Table 1). However, statistically significant differences were found on Biostrate®.
Over the 10-day growing period, the planted side showed a 2.69 ± 0.07 log CFU/g increase and
the unplanted side showed an increase of 1.30 ± 0.22 log CFU/g (p = 0.019).
L. monocytogenes survival and transfer to sunflower microgreens
Absolute measurements of mean log CFU/g of L. monocytogenes recovered from SFGM and
microgreens at planting and harvest are shown in Figure 2. A two-way ANOVA revealed no
statistically significant differences between relevant variables (Table 2). Biostrate®-grown
microgreens incurred a 4.21 ± 1.84 log CFU/g uptake while peat-grown microgreens incurred a
2.27 ± 0.67 log CFU/g uptake (p = 0.16). The planted side of Biostrate® experienced only a 0.23
126
± 0.66 log CFU/g increase in growth over the 10-day period, while the unplanted side of
Biostrate® incurred a decline of 2.26 ± 0.73 log CFU/g (p = 0.064). The planted side of peat
showed a decline of 1.89 ± 1.56 log CFU/g, while the unplanted side showed a decline of 3.27 ±
0.78 log CFU/g (p = 0.39).
Between-pathogen differences
Results of a three-factor ANOVA (Table 3, Table S3) show that the microgreen pathogen levels
recovered were neither significantly different for L. monocytogenes and S. Javiana overall (p =
0.11), nor for microgreens grown in Biostrate® (p = 0.60) or peat (p = 0.56). Despite the lack of
statistical significance, a possible interaction effect was observed where S. Javiana levels in both
types of microgreens were greater than those in L. monocytogenes by approximately 1 log
CFU/g. There was a statistically significant difference between L. monocytogenes and S. Javiana
on the unplanted side of the Biostrate® trays (p = 0.0008), where a 2.26 ± 0.73 log CFU/g decline
in L. monocytogenes was observed, and S. Javiana experienced a 1.3 ± 0.23 log CFU/g increase.
The planted side of Biostrate® also showed statistically significant differences in a pattern similar
to the unplanted side (p = 0.021). For peat, there was no difference between the planted and
unplanted sides for either bacterium, and all SFGM conditions experienced a decline. However,
it is worth noting that the greater declines were observed with L. monocytogenes in general, as
well as on peat over Biostrate, and on unplanted trays over planted trays.
127
Discussion
Pathogen Transfer to Microgreens
Biostrate® mats appear to support overall survival for both Salmonella Javiana and L.
monocytogenes compared to peat. Both pathogens appeared to increase in concentration over the
10-day microgreen production cycle on Biostrate® and showed an overall decline on peat. These
results are consistent with previous work in our lab (refer to Chapter 3) and are generally
supported by findings of Di Gioia et al. (2017), Reed et al. (2018), Wright et al. (2018), and Xiao
et al. (2015) that demonstrate differential pathogen survival across multiple types of microgreen
growing media, with and without roots present.
While the overall concentration of L. monocytogenes and S. Javiana recovered from the
Biostrate®-grown microgreens generally appeared greater than peat-grown microgreens by 2 log
CFU/g, the difference was not statistically significant. The initial inoculum level on Biostrate®
was 1 log CFU/g greater than on peat due to limitations of the experimental methods (Section V,
iii, c) and is likely a major contributor to the 2 log CFU/g difference. Therefore, if pathogens
experienced a decline on peat and growth on Biostrate®, but resulted in similarly contaminated
microgreens, this may indicate that 1) pathogens on peat did not decline to low enough numbers
to prevent a detectable level in microgreens and 2) perhaps uptake occurred early, during or just
after germination, when differences in starting inocula on the media were more similar than they
were at harvest. However, research on E. coli O157:H7 and Salmonella enterica (Bernstein et al.
2007, Brandl et al. 2008, Pu et al. 2009, Kroupitski et al. 2019) has shown that pathogen
colonization of leafy greens is not always found to be related to plant age, and when a
relationship is found, colonization favors developmental stages beyond leaf emergence. For the

128
first assumption, repeating this study with both low and high inocula may elucidate the minimum
level of SFGM contamination required for a detectable transfer.
The Presence of Roots on SFGM
Salmonella Javiana
Salmonella Javiana experienced an overall increase between planting and harvest on Biostrate®
and an overall decline in concentration on peat, indicating that peat may be less nutritionally
supportive or that organisms endemic to peat may suppress the growth of Salmonella Javiana
(Table 1). In general, the presence of plant roots appeared to aid in the survival of Salmonella
Javiana, with the planted side of each media type showing an overall greater level at harvest
regardless of whether there was an overall decline or an overall increase in bacterial titer across
the growing period (Figure 1). Ongeng et al. (2011) found similar results with S. Typhimurium in
field-grown cabbage, where the levels of bacteria in manure-amended bulk soil were lower than
the levels in the cabbage plant rhizosphere after being irrigated with contaminated water.
Similarly, S. Typhimurium declined in soil but persisted for up to 4 weeks in the rhizosphere of
parsley spray-irrigated with water inoculated at 8.5 log CFU/mL, 7.5 log CFU/ml, and 6.5 log
CFU/mL. (Kisluk and Yaron, 2012).
Listeria monocytogenes R2-574
In general, the presence of plant roots aided in the survival of L. monocytogenes on both SFGM
types. The declines in growth observed seemed only to be abated on the planted side of
Biostrate®. Under that condition, L. monocytogenes levels maintained their initial concentration,
but did not increase (Figure 2). Though it appears that the beneficial effect of microgreen roots is

129
more pronounced on Biostrate® than it is on peat, once corrected for initial inoculum
concentration, that difference was not statistically significant (Table 2). These results may be
somewhat supported by Jablasone et al. (2004), which found that L. monocytogenes persistence
in the rhizosphere was different only in lettuce, where co-inoculating with root-associated isolate
Enterobacter cloacae reduced L. monocytogenes levels by approximately 1 log. While more
research is needed, L. monocytogenes survival may be impacted by differences in plant
rhizosphere more than Salmonella, possibly due to suppression by endemic root bacteria.
Between-Pathogens
The most important questions to address in the between-pathogen comparisons are 1) whether
Salmonella Javiana and L. monocytogenes are impacted differently by the presence of roots on
different types of SFGM and 2) if the microgreens produced are differentially contaminated. For
the first question, we ask if there is a larger difference in one pathogen over another between
initial and harvest on the planted side compared to the unplanted side. On the planted side of
Biostrate®, the change in Salmonella Javiana levels was 2.47 log greater than for L.
monocytogenes and 3.56 log greater on the unplanted side of Biostrate®. It appears that the
survival of Salmonella is aided by microgreen roots to a greater degree than for L.
monocytogenes on this media type. For the second question, since there were no statistically
significant differences in recovery from microgreens by SFGM type, it is unsurprising that there
were also no between-pathogen differences in transfer to microgreens.
From a practical standpoint, it may seem irrelevant to compare survival of pathogens on SFGM
with and without microgreens, as the transfer of pathogens to the edible product is of greatest

130
concern for industry. However, any differences in survival on SFGM with and without plant
roots suggest the possibility that the rhizosphere composition plays a role in the survival of
foodborne pathogens in indoor microgreen cultivation systems. Root exudates specific to plant
varieties, as well as the organisms belonging to the root microbiome, may enhance or suppress
the growth of Salmonella spp., L. monocytogenes, and other major foodborne pathogens. For
example, in a comparison of L. monocytogenes (NCTC 13372) and E. coli O157:H7
internalization between lettuce, cultivated rocket, wild rocket, corn salad, and basil,
internalization of both pathogens occurred in the salad products but not in basil or in the basil
growing medium. The authors suggest that basil may produce root exudates that limit the growth
of these organisms (Chitarra et al. 2014). Therefore, it may be possible to identify greater risk
microgreen varieties and the SFGM types that, upon interaction with those microgreens, worsen
or mitigate pathogen transfer.
Study Limitations
Differing recovery efficiency of microgreens and SFGM
Preliminary tests of cut microgreens and SFGM samples that were surface-inoculated with a
known quantity of bacteria revealed that pathogen recovery from microgreens (10-2) is an order
of magnitude less than recovery from SFGM (10-1). Due to these differences, separate statistical
analyses were used for SFGM levels and microgreen levels.
Bacterial interaction with peat particles
For peat samples, there was some suspicion that bacterial attachment to media particles might
impact recovery as Salmonella in particular is known to interact with soil particles (Turpin et al.,

131
1993). However, recovery of Salmonella from peat was only somewhat lower than for Biostrate®
(Chapter 3 Appendix), but still within the same order of magnitude. Therefore, recovery was not
likely to be significantly impacted by these interactions.
Inoculation Technique
Attempting to inoculate SFGM so that the concentration is the same regardless of thickness and
density is error-prone. The method chosen for this study was chosen for its simplicity, as it
ensures an equal number of cells per tray. Upon initial sampling, it was found that peat log
CFU/g measurements were about 1 log lower than for Biostrate®. It may be assumed that this
means fewer bacterial cells are accessing the microgreen roots in peat than in Biostrate®.
However, this is not known. When laid in its tray at the appropriate depth, peat is several times
thicker than the Biostrate® mats. The precise degree of this difference is difficult to measure due
to variation in how densely packed the peat is, so attempting to add different concentrations of
bacteria to each media type in order to achieve the same per-gram concentration may not be
successful. Any unseen impact of adding a different number of cells per tray for each media type
may be worsened by the effect of watering, which may unevenly redistribute cells around the
tray during the growing process. Furthermore, the assumption that peat microgreen roots are
accessing fewer cells does not account for cell motility that may allow the bacteria to migrate
toward the plant roots in search of nutrients. Therefore, it is recommended that a future
investigation compare inoculation strategies to determine the least biased method of testing
pathogen uptake between different types of soil-free growing media of varying volumes and
densities.

132
Conclusion
Under the microgreen cultivation conditions used in the present study, there were no statistically
significant differences in pathogen-specific and SFGM-specific levels of the target pathogens
transferred to indoor, tray-cultivated sunflower microgreens after 10 days of growth. While
Salmonella Javiana was able to grow to high levels on Biostrate®, it experienced a decline on
peat, and L. monocytogenes declined on both media types. Despite these differences, it appeared
not to impact transfer to microgreens. The decline observed for both pathogens was greater on
unplanted media than on planted media, indicating that the root microenvironment may play a
role in the survival of human pathogens if the growing medium becomes contaminated.
Salmonella Javiana appeared to benefit slightly more from the presence of plant roots than L.
monocytogenes, but only on Biostrate®. These findings raise important questions about the
impact of features such as the root microbiome and root exudates that are specific to plant
varieties, and the interaction effects of the root and SFGM microbial communities on the
suppression of human pathogens in indoor microgreen cultivation.

133
References
Alegbeleye, O.O., I. Singleton, and A. S. Sant’Ana. 2018. Sources and contamination routes of
microbial pathogens to fresh produce during field cultivation: A review. Food Microbiol.
73:177–208. https://doi.org/10.1016/j.fm.2018.01.003
Bernstein, N., S. Sela, and S. Neder-Lavon. 2016. Assessment of contamination potential of
lettuce by Salmonella enterica serovar Newport added to the plant growing medium. J. Food
Prot. 70:1717–1722. https://doi.org/10.4315/0362-028x-70.7.1717
Bernstein, N., S. Sela, R. Pinto, and M. Ioffe. 2016. Evidence for internalization of Escherichia
coli into the aerial parts of maize via the root system. J. Food Prot. 70:471–475.
https://doi.org/10.4315/0362-028x-70.2.471
Brandl, M.T., and R. Amundson. 2008. Leaf age as a risk factor in contamination of lettuce with
Escherichia coli O157:H7 and Salmonella enterica. Appl. Environ. Microbiol. 74:2298–2306.
https://doi.org/10.1128/AEM.02459-07
Canadian Food Inspection Agency, 2019a. Pousses et Cie brand mix Spicy Microgreens recalled
due to Listeria monocytogenes. Food Recall Warnings and Allergy Alerts, May 22. URL:
https://healthycanadians.gc.ca/recall-alert-rappel-avis/inspection/2019/70007r-eng.php. Date
accessed: 2/7/2020.
Canadian Food Inspection Agency, 2019b. Food Recall Warning - GPM brand Pea Shoots
recalled due to Listeria monocytogenes. Food Recall Warnings and Allergy Alerts, April 19.
URL: https://www.inspection.gc.ca/food-recall-warnings-and-allergy-alerts/2019-04-
19/eng/1555725095376/1555725097506. Date accessed: 2/7/2020.
Canadian Food Inspection Agency, 2018a. Food Recall Warning - Certain Greenbelt
Microgreens brand microgreens recalled due to Listeria monocytogenes. Food Recall Warnings
and Allergy Alerts, August 25. URL: https://www.inspection.gc.ca/food-recall-warnings-and-
allergy-alerts/2018-08-25/eng/1535250311816/1535250313826. Date accessed: 2/7/2020
Canadian Food Inspection Agency, 2018b. Lufa Farms Inc. brand Arugula Microgreens recalled
due to Salmonella. Food Recall Warnings and Allergy Alerts, June 29. URL:
https://healthycanadians.gc.ca/recall-alert-rappel-avis/inspection/2018/67156r-eng.php. Date
accessed: 2/7/2020
Canadian Food Inspection Agency, 2018c. Correction - Food Recall Warning - Certain Greenbelt
Microgreens brand microgreens recalled due to Listeria monocytogenes. Food Recall Warnings
and Allergy Alerts, April 30. Date accessed: 2/7/2020
Canadian Food Inspection Agency, 2018d. Food Recall Warning - GPM brand Pea Shoots
recalled due to Listeria monocytogenes. Food Recall Warnings and Allergy Alerts, June 7. URL:
http://inspection.gc.ca/about-the-cfia/newsroom/food-recall-warnings/complete-listing/2018-06-
07/eng/1528383445910/1528383449409. Date accessed: 2/7/2020

134
Canadian Food Inspection Agency, 2018e. Food Recall Warning - Goodleaf brand Daikon
Radish microgreens recalled due to Listeria monocytogenes. Food Recall Warnings and Allergy
Alerts, June 28. URL: http://inspection.gc.ca/about-the-cfia/newsroom/food-recall-
warnings/complete-listing/2018-06-28/eng/1530237479767/1530237483085. Date accessed:
2/7/2020
Canadian Food Inspection Agency, 2018f. Updated Food Recall Warning - Evergreen Herbs
brand Pea Shoots recalled due to Listeria monocytogenes. Food Recall Warnings and Allergy
Alerts, June 7. URL: http://inspection.gc.ca/about-the-cfia/newsroom/food-recall-
warnings/complete-listing/2018-06-07/eng/1528409624622/1528409626775. Date accessed:
2/7/2020
Carducci, A., E. Caponi, A. Ciurli, and M. Verani. 2015. Possible internalization of an
enterovirus in hydroponically grown lettuce. Int. J. Environ. Res. Public Health 12:8214–8227.
https://doi.org/10.3390/ijerph120708214
Chandra, D., J. G. Kim, and Y. P. Kim. 2012. Changes in microbial population and quality of
microgreens treated with different sanitizers and packaging films. Hortic. Environ. Biotechnol.
53:32–40. https://doi.org/10.1007/s13580-012-0075-6
Chitarra, W., L. Decastelli, A. Garibaldi, and M. L. Gullino. 2014. Potential uptake of
Escherichia coli O157:H7 and Listeria monocytogenes from growth substrate into leaves of salad
plants and basil grown in soil irrigated with contaminated water. Int. J. Food Microbiol.
189:139–145. https://doi.org/10.1016/j.ijfoodmicro.2014.08.003
Deering, A.J., L. J. Mauer, and R. E. Pruitt. 2012. Internalization of E. coli O157:H7 and
Salmonella spp. in plants: A review. Food Res. Int. 45:567–575.
https://doi.org/10.1016/j.foodres.2011.06.058
DiGioia, F., P. De Bellis, C. Mininni, P. Santamaria, and F. Serio, F. 2017. Physicochemical,
agronomical and microbiological evaluation of alternative growing media for the production of
rapini (Brassica rapa L.) microgreens. J. Sci. Food Agric. 97:1212–1219.
https://doi.org/10.1002/jsfa.7852
DiCaprio, E., Y. Ma, A. Purgianto, J. Hughes, and J. Li. 2012. Internalization and dissemination
of human norovirus and animal caliciviruses in hydroponically grown romaine lettuce. Appl.
Environ. Microbiol. 78:6143–6152. https://doi.org/10.1128/AEM.01081-12
DiCaprio, E., A. Purgianto, and J. Li. 2015. Effects of abiotic and biotic stresses on the
internalization and dissemination of human norovirus surrogates in growing romaine lettuce.
Appl. Environ. Microbiol. 81:4791–4800. https://doi.org/10.1128/aem.00650-15
Erickson, M.C. 2012. Internalization of fresh produce by foodborne pathogens. Annu. Rev. Food
Sci. Technol. 3:283–310. https://doi.org/10.1146/annurev-food-022811-101211
Erickson, M.C., J. Y. Liao, A. S. Payton, P. W. Cook, H. C. Den Bakker, J. Bautista, and J. C. D.
Pérez. 2019. Pre-harvest internalization and surface survival of Salmonella and Escherichia coli
O157:H7 sprayed onto different lettuce cultivars under field and growth chamber conditions. Int.
J. Food Microbiol. 291:197–204. https://doi.org/10.1016/j.ijfoodmicro.2018.12.001
135
Erickson, M.C., V. H. Phelan, L. R. Beuchat, L. Ma, G. Zhang, and M. P. Doyle. 2016. Lack of
internalization of Escherichia coli O157:H7 in lettuce (Lactuca sativa L.) after leaf surface and
soil inoculation. J. Food Prot. 72:2028–2037. https://doi.org/10.4315/0362-028x-72.10.2028
Esseili, M.A., Q. Wang, Z. Zhang, and L. J. Saif. 2012. Internalization of sapovirus, a surrogate
for norovirus, in romaine lettuce and the effect of lettuce latex on virus infectivity. Appl.
Environ. Microbiol. 78:6271–6279. https://doi.org/10.1128/aem.01295-12
Franz, E., A. A. Visser, A. S. Van Diepeningen, M. M. Klerks, A. J. Termorshuizen, and A. H.
C. van Bruggen. 2007. Quantification of contamination of lettuce by GFP-expressing
Escherichia coli O157:H7 and Salmonella enterica serovar Typhimurium. Food Microbiol.
24:106–112. https://doi.org/10.1016/j.fm.2006.03.002
Gao, G., E. DiCaprio, H. Chambers, J. Li, and Z. Yang. 2017. Internalization and dissemination
of human norovirus and Tulane virus in fresh produce is plant dependent. Food Microbiol.
69:25–32. https://doi.org/10.1016/j.fm.2017.07.015
Grahn, C.M., C. Benedict, T. Thornton, C. Miles. 2015. Production of baby-leaf salad greens in
the spring and fall seasons of Northwest Washington. HortScience 50:1467–1471.
https://doi.org/10.21273/hortsci.50.10.1467
Hirneisen, K.A., M. Sharma, K. E. Kniel. 2012. Human enteric pathogen internalization by root
uptake into food crops. Foodborne Pathog. Dis. 9:396–405.
https://doi.org/10.1089/fpd.2011.1044
Hull, A.E., D. T. Ingram, M. Sharma, P. D. Millner, J. R. Patel, X. Wang, and M. S.
Donnenberg. 2016. A novel approach to investigate the uptake and internalization of Escherichia
coli O157:H7 in spinach cultivated in soil and hydroponic medium. J. Food Prot. 72:1513–1520.
https://doi.org/10.4315/0362-028x-72.7.1513
Wei, J., Y. Jin. T. Sims, and K. E. Kniel. 2010. Manure- and biosolids-resident murine norovirus
1 attachment to and internalization by romaine lettuce. Appl. Environ. Microbiol. 76:578–583.
https://doi.org/10.1128/AEM.02088-09
Karanja, N.K., P. B. Gathura, G. Nduhiu, M. M. Gicheru, W. T. Githinji, and A. Nordin. 2018.
Internalization of enteropathogenic human bacteria in lettuce and coriander plant tissue. ISABB J.
Heal. Environ. Sci. 5:28–32. https://doi.org/10.5897/isaab-jhe2018.0043
Kisluk, G. and S. Yaron. 2012. Presence and persistence of salmonella enterica serotype
typhimurium in the phyllosphere and rhizosphere of spray-irrigated parsley. Appl. Environ.
Microbiol. 78:4030–4036. https://doi.org/10.1128/AEM.00087-12
Kou, L., T. Yang, X. Liu, and Y. Luo. 2015. Effects of pre- and postharvest calcium treatments
on shelf life and postharvest quality of broccoli microgreens. HortScience 50:1801–1808.
Kroupitski, Y., R. Gollop, E. Belausov, R. Pinto, and S. Sela. 2019. Salmonella enterica growth
conditions influence lettuce leaf internalization. Front. Microbiol. 10:1–11.
https://doi.org/10.3389/fmicb.2019.00639
Macarisin, D., J. Patel, and V. K. Sharma. 2014. Role of curli and plant cultivation conditions on
Escherichia coli O157: H7 internalization into spinach grown on hydroponics and in soil. Int. J.
Food Microbiol. 173:48–53. https://doi.org/10.1016/j.ijfoodmicro.2013.12.004
136
Moriarty, M.J., K. Semmens, G. K. Bissonnette, and J. Jaczynski, J. 2018. Inactivation with UV-
radiation and internalization assessment of coliforms and Escherichia coli in aquaponically
grown lettuce. LWT - Food Sci. Technol. 89:624–630. https://doi.org/10.1016/j.lwt.2017.11.038
Moriarty, M.J., K. Semmens, G. K. Bissonnette, and J. Jaczynski. 2019. Internalization
assessment of E. coli O157:H7 in hydroponically grown lettuce. LWT - Food Sci. Technol
100:183–188. https://doi.org/10.1016/j.lwt.2018.10.060
Muchjajib, U., S. Muchjajib, S. Suknikom, and J. Butsai. 2015. Evaluation of organic media
alternatives for the production of microgreens in Thailand. Acta Hortic. 1102:157–162.
https://doi.org/10.17660/ActaHortic.2015.1102.19
Olaimat, A.N. and R. A. Holley. 2012. Factors influencing the microbial safety of fresh produce:
A review. Food Microbiol. 32:1–19. https://doi.org/10.1016/j.fm.2012.04.016
Ongeng, D., C. Muyanja, J. Ryckeboer, A. H. Geeraerd, and D. Springael. 2011. Rhizosphere
effect on survival of Escherichia coli O157:H7 and Salmonella enterica serovar Typhimurium in
manure-amended soil during cabbage (Brassica oleracea) cultivation under tropical field
conditions in Sub-Saharan Africa. Int. J. Food Microbiol. 149:133–142.
https://doi.org/10.1016/j.ijfoodmicro.2011.06.009
Pu, S., J. C. Beaulieu, W. Prinyawiwatkul, and B. Ge. 2009. Effects of plant maturity and growth
media bacterial inoculum level on the surface contamination and internalization of Escherichia
coli O157:H7 in growing spinach leaves. J. Food Prot. 72:2313–2320.
https://doi.org/10.4315/0362-028X-72.11.2313
Reed, E., C. M. Ferreira, R. Bell, E. W. Brown, and J. Zheng. 2018. Plant-microbe and abiotic
factors influencing Salmonella survival and growth on alfalfa sprouts and Swiss chard
microgreens. Appl. Environ. Microbiol. 84. https://doi.org/10.1128/AEM.02814-17
Smith, R., M. Cahn, O. Daugovish, S. Koike, E. Natwick, H. Smith, K. Subbarao, E. Takele, and
T. Turini. 2011. Leaf Lettuce Production in California (Publication 7216), University of
California Agriculture and Natural Resources. The Regents of the University of California
Agriculture and Natural Resources, Richmond, CA.
Treadwell, D., R. Hochmuth, L. Landrum, and W. Laughlin. 2016. Microgreens: A New
Specialty Crop. Hortic. Sci. 1–3.
Turner, K., C. N. Moua, M. Hajmeer, A. Barnes, and M. Needham. 2019. Overview of leafy
greens–related food safety incidents with a California link: 1996 to 2016. J. Food Prot. 82:405–
414. https://doi.org/10.4315/0362-028X.JFP-18-316
Turpin, P.E., K. A. Maycroft, C. L. Rowlands, and E. M. H. Wellington. 1993. An ion‐exchange
based extraction method for the detection of Salmonellas in soil. J. Appl. Bacteriol. 74:181–190.
https://doi.org/10.1111/j.1365-2672.1993.tb03013.x
United States Food & Drug Administration, 2015. FSMA Final Rule on Produce Safety:
Standards for the growing, harvesting, packing, and holding of produce for human consumption;
Final Rule. Fed. Regist. 80, 74353–74568. https://doi.org/10.1007/s13398-014-0173-7.2

137
United States Food & Drug Administration, 2019. Draft Guidance for Industry: Reducing
Microbial Food Safety Hazards in the Production of Seed for Sprouting | FDA 1–7.
United States Food & Drug Administration, 2017. Compliance with and recommendations for
implementation of the standards for the growing, harvesting, packing, and holding of produce for
human consumption for sprout operations: Draft Guidance for Industry. FDA-2017-D-0175
United States Food Drug Administration, 2016. Osage Gardens Inc. recalls Osage Gardens
Organic 2oz microgreens because of possible health risk. Recalls, withdrawals, safety alerts.
http://wayback.archive-
it.org/7993/20180126102042/https://www.fda.gov/Safety/Recalls/ucm524638.htm. Date
accessed: 2/7/19
United States Food Drug Administration, 2018. Greenbelt Greenhouse Ltd recalls Greenbelt
Microgreens brand microgreens because of possible health risk. Recalls, withdrawals, safety
alerts. https://www.fda.gov/Safety/Recalls/ucm605702.htm. Date accessed: 2/7/19
United States Food Drug Administration, 2019. Chlorofields recalls Asian microgreens because
of possible health risk. Recalls, recalls, withdrawals, safety alerts.
https://www.fda.gov/safety/recalls-market-withdrawals-safety-alerts/chlorofields-recalls-asian-
miicrogreens-because-possible-health-risk. Date accessed: 2/7/19
Wang, Q., Z. Xiao, E. E. Codling, G. E. Lester, X. Nou, and Y. Luo. 2016. Microgreens of
Brassicaceae: Mineral composition and content of 30 varieties. J. Food Compos. Anal. 49:87–93.
https://doi.org/10.1016/j.jfca.2016.04.006
Warriner, K., F. Ibrahim, W. M. Waites, M. Dickinson, and C. Wright. 2003. Internalization of
human pathogens within growing salad vegetables. Biotechnol. Genet. Eng. Rev. 20:117–136.
https://doi.org/10.1080/02648725.2003.10648040
Weber, C.F., 2017. Nutrient content of cabbage and lettuce microgreens grown on vermicompost
and hydroponic growing pads. J. Hortic. 3. https://doi.org/10.4172/2376-0354.1000190
Weber, C.F., 2017. Broccoli microgreens: a mineral-rich crop that can diversify food systems.
Front. Nutr. 4:1–9. https://doi.org/10.3389/fnut.2017.00007
Wei, J., Y. Jin, T. Sims, and K. E. Kniel. 2011. Internalization of murine norovirus I by Lactuca
sativa during irrigation. Appl. Environ. Microbiol. 77:2508–2512.
https://doi.org/10.1128/aem.02701-10
Wright, K. M. and N. J. Holden. 2018. Quantification and colonization dynamics of Escherichia
coli O157:H7 inoculation of microgreens species and plant growth substrates. Int. J. Food
Microbiol. 273:1–10. https://doi.org/10.1016/j.ijfoodmicro.2018.02.025
Xiao, Z., G. Bauchan, L. Nichols-Russell, Y. Luo, Q. Wang, and X. Nou. 2015. Proliferation of
Escherichia coli O157:H7 in soil-substitute and hydroponic microgreen production systems. J.
Food Prot. 78, 1785–1790. https://doi.org/10.4315/0362-028x.jfp-15-063
Xiao, Z., X. Nou, Y. Luo, and Q. Wang. 2014. Comparison of the growth of Escherichia coli
O157: H7 and O104: H4 during sprouting and microgreen production from contaminated radish
seeds. Food Microbiol. 44:60–63. https://doi.org/10.1016/j.fm.2014.05.015

138
Zhang, Y., J. B. Sallach, L. Hodges, D. D. Snow, S. L. Bartelt-Hunt, K. M. Eskridge, and X. Li.
2016. Effects of soil texture and drought stress on the uptake of antibiotics and the internalization
of Salmonella in lettuce following wastewater irrigation. Environ. Pollut. 208:523–531.
https://doi.org/10.1016/j.envpol.2015.10.025
Zheng, J., S. Allard, S. Reynolds, P. Millner, G. Arce, R. J. Blodgett, and E. W. Brown. 2013.
Colonization and internalization of Salmonella enterica in tomato plants. Appl. Environ.
Microbiol. 79:2494–2502. https://doi.org/10.1128/AEM.03704-12
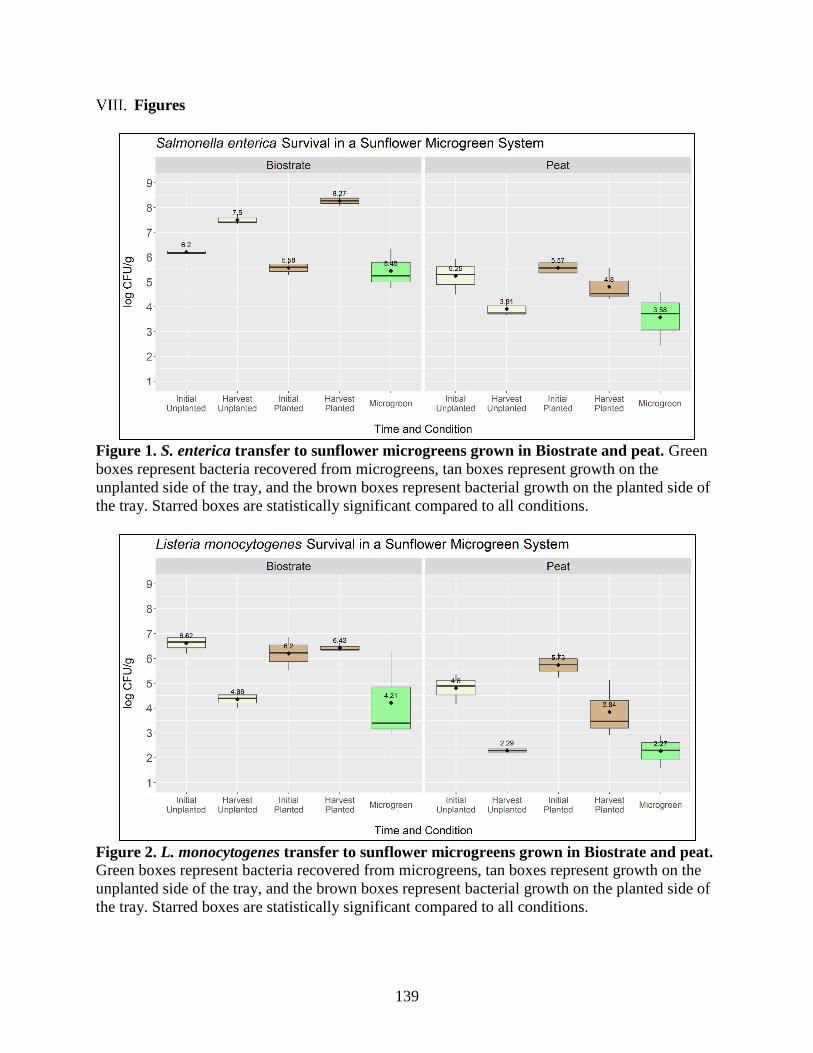
139
Figures
Figure 1. S. enterica transfer to sunflower microgreens grown in Biostrate and peat. Green
boxes represent bacteria recovered from microgreens, tan boxes represent growth on the
unplanted side of the tray, and the brown boxes represent bacterial growth on the planted side of
the tray. Starred boxes are statistically significant compared to all conditions.
Figure 2. L. monocytogenes transfer to sunflower microgreens grown in Biostrate and peat.
Green boxes represent bacteria recovered from microgreens, tan boxes represent growth on the
unplanted side of the tray, and the brown boxes represent bacterial growth on the planted side of
the tray. Starred boxes are statistically significant compared to all conditions.
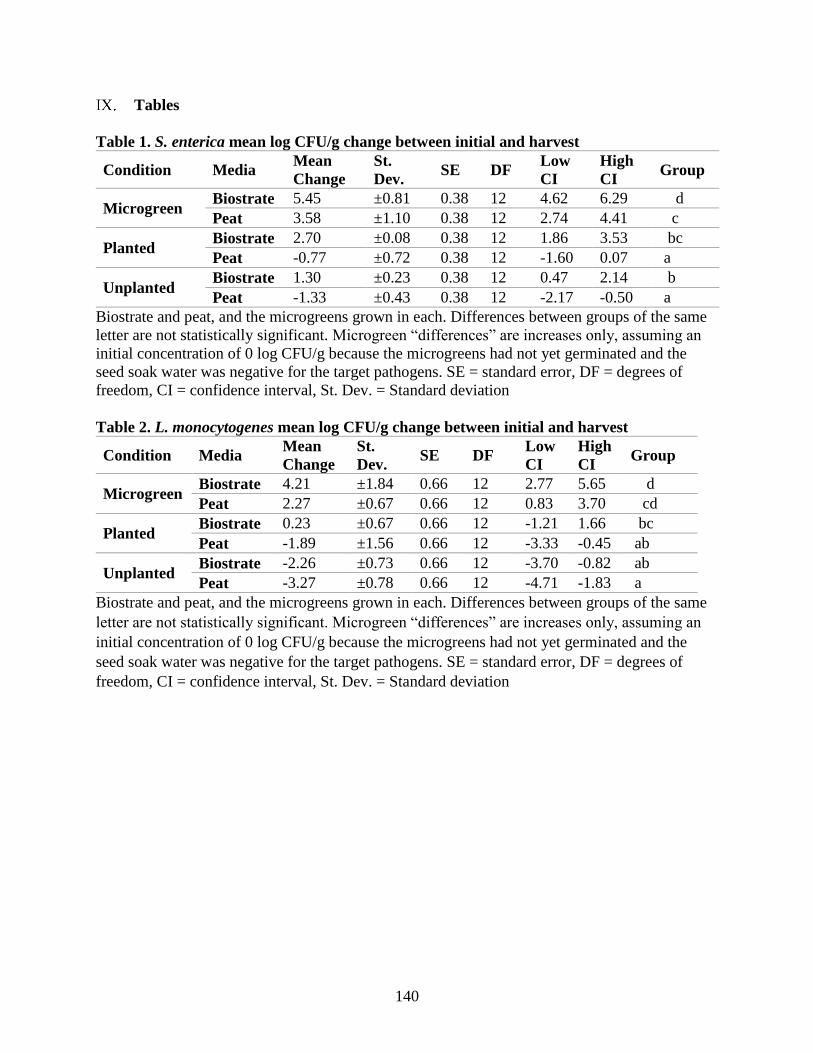
140
Tables
Table 1. S. enterica mean log CFU/g change between initial and harvest
Condition Media Mean
Change
St.
Dev. SE DF
Low
CI
High
CI Group
Microgreen Biostrate 5.45 ±0.81 0.38 12 4.62 6.29 d
Peat 3.58 ±1.10 0.38 12 2.74 4.41 c
Planted Biostrate 2.70 ±0.08 0.38 12 1.86 3.53 bc
Peat -0.77 ±0.72 0.38 12 -1.60 0.07 a
Unplanted Biostrate 1.30 ±0.23 0.38 12 0.47 2.14 b
Peat -1.33 ±0.43 0.38 12 -2.17 -0.50 a
Biostrate and peat, and the microgreens grown in each. Differences between groups of the same
letter are not statistically significant. Microgreen “differences” are increases only, assuming an
initial concentration of 0 log CFU/g because the microgreens had not yet germinated and the
seed soak water was negative for the target pathogens. SE = standard error, DF = degrees of
freedom, CI = confidence interval, St. Dev. = Standard deviation
Table 2. L. monocytogenes mean log CFU/g change between initial and harvest
Condition Media Mean
Change
St.
Dev. SE DF
Low
CI
High
CI Group
Microgreen Biostrate 4.21 ±1.84 0.66 12 2.77 5.65 d
Peat 2.27 ±0.67 0.66 12 0.83 3.70 cd
Planted Biostrate 0.23 ±0.67 0.66 12 -1.21 1.66 bc
Peat -1.89 ±1.56 0.66 12 -3.33 -0.45 ab
Unplanted Biostrate -2.26 ±0.73 0.66 12 -3.70 -0.82 ab
Peat -3.27 ±0.78 0.66 12 -4.71 -1.83 a
Biostrate and peat, and the microgreens grown in each. Differences between groups of the same
letter are not statistically significant. Microgreen “differences” are increases only, assuming an
initial concentration of 0 log CFU/g because the microgreens had not yet germinated and the
seed soak water was negative for the target pathogens. SE = standard error, DF = degrees of
freedom, CI = confidence interval, St. Dev. = Standard deviation
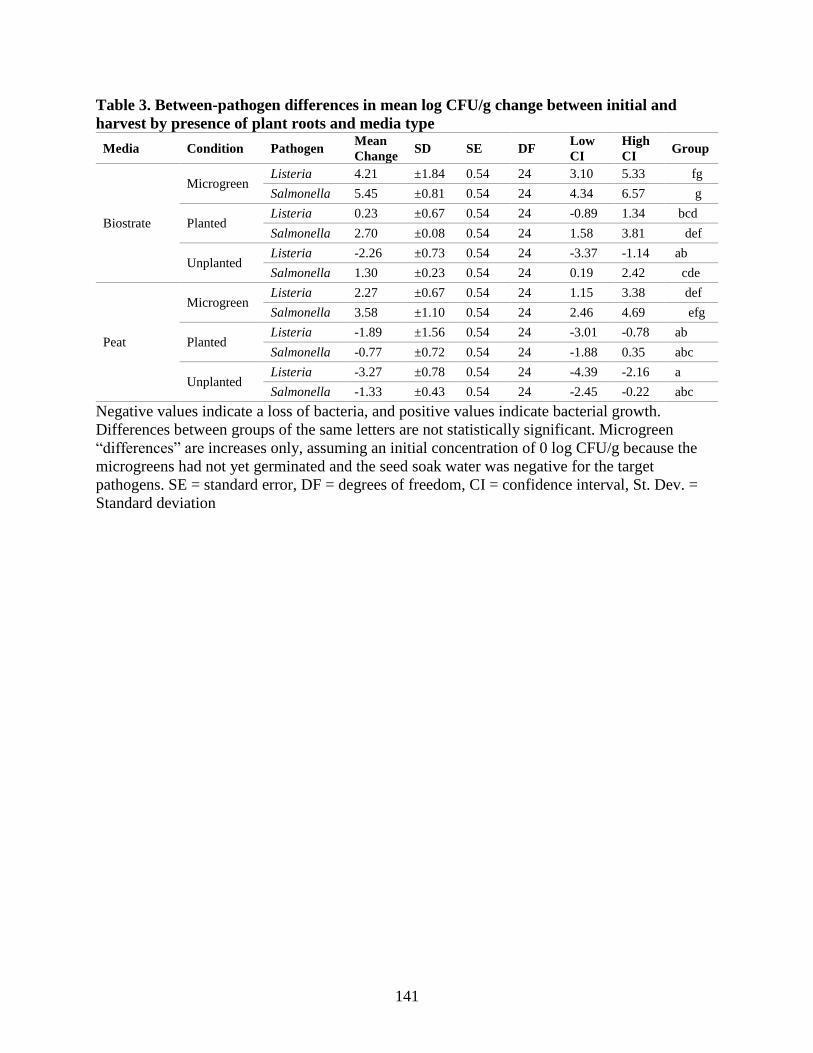
141
Table 3. Between-pathogen differences in mean log CFU/g change between initial and
harvest by presence of plant roots and media type
Media Condition Pathogen Mean
Change SD SE DF
Low
CI
High
CI Group
Biostrate
Microgreen Listeria 4.21 ±1.84 0.54 24 3.10 5.33 fg
Salmonella 5.45 ±0.81 0.54 24 4.34 6.57 g
Planted Listeria 0.23 ±0.67 0.54 24 -0.89 1.34 bcd
Salmonella 2.70 ±0.08 0.54 24 1.58 3.81 def
Unplanted Listeria -2.26 ±0.73 0.54 24 -3.37 -1.14 ab
Salmonella 1.30 ±0.23 0.54 24 0.19 2.42 cde
Peat
Microgreen Listeria 2.27 ±0.67 0.54 24 1.15 3.38 def
Salmonella 3.58 ±1.10 0.54 24 2.46 4.69 efg
Planted Listeria -1.89 ±1.56 0.54 24 -3.01 -0.78 ab
Salmonella -0.77 ±0.72 0.54 24 -1.88 0.35 abc
Unplanted Listeria -3.27 ±0.78 0.54 24 -4.39 -2.16 a
Salmonella -1.33 ±0.43 0.54 24 -2.45 -0.22 abc
Negative values indicate a loss of bacteria, and positive values indicate bacterial growth.
Differences between groups of the same letters are not statistically significant. Microgreen
“differences” are increases only, assuming an initial concentration of 0 log CFU/g because the
microgreens had not yet germinated and the seed soak water was negative for the target
pathogens. SE = standard error, DF = degrees of freedom, CI = confidence interval, St. Dev. =
Standard deviation

142
Chapter 5: Conclusion and Future Research Directions
As microgreen food safety, and food safety of indoor agriculture in general, is a relatively new
area of research, many open questions remain. The present work has demonstrated that there is a
deficit of research studying sunflower microgreens—the most common variety grown—and that
trays of some type of particulate growing media such as soil or peat, stacked on artificially lit
shelves is the most common microgreen production system for very small microgreen farms. In
these systems, we have demonstrated that there is a difference in survival of L. monocytogenes
R2-574 and S. enterica Javiana on four types of soil-free growing media and that survival of both
pathogens is enhanced by the microgreen root environment. Further work will investigate
differences between sunflower microgreens and pea shoot microgreens.
The conclusions presented in this thesis have allowed the identification of three broad areas of
microgreen food safety to address: operational effects, biological effects, and compliance.
Operational effects can be described as features of microgreen production over which the
operator has some manner of control, and if food safety risks are found, these practices can
theoretically be modified or abandoned. Biological effects are risks inherent to the system, such
as resistance or susceptibility of certain microgreen varieties, seed varieties, and growing media
to pathogen contamination, immutable environmental conditions, and fitness of target pathogens.
Compliance refers to farmer ability and desire to adhere to food safety regulatory requirements
and any best practices for microgreen production that may be determined.

143
Operational Effects
Does sub-irrigation decrease contamination risk of the edible product?
Sub-irrigation has been studied in microgreens twice (Xiao et al., 2015, Işik et al., 2020), with
mixed results. Both studies utilized E. coli O157:H7 and radish microgreens. Xiao et al. (2015)
found that sub-irrigation and overhead spray irrigation conferred no statistically significant
difference in transfer to the edible portion of the microgreen for both low (3.7 log CFU/g) and
high (5.6 log CFU/g) inoculation levels, despite greater levels in the growing media and inedible
portion for sub-irrigation under both inoculation levels (p < 0.05). Isik et al. (2020) also found no
statistically significant differences in concentration in the edible portion between both watering
methods, but did not differentiate between edible, inedible, and growing media levels.
Furthermore, while Xiao and colleagues (2015) contaminated the irrigation water, Işık and
colleagues contaminated the growing media. Future work comparing multiple microgreen
varieties and contamination routes would provide clarity to this comparison.
Is the widely used hydrogen peroxide method effective against seed contaminants?
Previous work testing hydrogen peroxide as a seed disinfection method has been performed in
the past using sprout production as the model system (Beuchat, 1997, Hong and Kang, 2016).
Beuchat found that a 6% v/v hydrogen peroxide solution was effective at achieving a 3 log
reduction in Salmonella populations, and Hong and Kang (2016) found that a 24-h dry heat
treatment followed by 2% v/v hydrogen peroxide soak for 10 minutes reduced Salmonella
Typhimurium by 1.66 log CFU/g, compared to 0.26 log CFU/g from dry heat alone. Further,
these treatments improved germination by approximately 10%. The only study in microgreens
examined the utility of a foliar spray to assess possible damage to leaves in systems that use

144
hydrogen peroxide to disinfect recirculating hydroponic nutrient water (Eicher-Sodo et al.,
2019).
What is the impact of soaking and post-harvest washing on sunflower and peas?
Non-disinfection soaking of seeds appears uncommon among microgreen producers with the
exception of sunflower, peas, and potentially other larger seed types or those with thick seed
coats (see Chapter 2). It is unknown if soaking these varieties renders them more susceptible to
pathogen contamination throughout the growing cycle or if moisture from routine watering
ultimately provides enough moisture for pathogen growth where soaking makes no difference in
levels in the edible part of the microgreen. As soaking seeds tends to shorten the germination
time, a side by side comparison of soaked and unsoaked microgreens in various contamination
scenarios would have to account for the longer growing time of the unsoaked seeds. Longer
exposure to pathogens may independently contribute to greater levels at harvest.
Is there a difference in risk between microgreens sold cut versus “living trays”?
Previous work on tomato stem scars (Lin and Wei, 2016), cantaloupe rind (Ukuku and Sapers,
2016), and apple wounds (Janisiewicz et al., 1999) lends to the assumption that fresh-cut
microgreens bear a greater risk than “living trays” -- microgreens sold in containers with the
roots still attached to the growing media. Xiao et al. (2015) showed greater contaminant levels
nearer to the cut end of the microgreen. Furthermore, mitigating contamination of cut tissue is
not straightforward, and it appears that post-harvest wash water is a key route of contamination.
However, depending on the type of growing media used, selling living trays may simply confer
different risks than cut microgreens, such as introducing organisms found on growing media to a

145
food production environment such as a restaurant kitchen. As well, if post-harvest wash water is
a key route of contamination in the fresh-cut industry, and many microgreen varieties are not
washed at harvest (Chapter 2), then fresh-cut may be less risky than living trays if only for
certain types of microgreens. Different production methods and microgreen varieties should be
compared to better answer this question.
Biological effects
Are some microgreen varieties at greater risk of contamination than others?
So far, possible differences in susceptibility to pathogen colonization have been found between
microgreen varieties. Wright and Holden, (2018) found that basil had statistically significantly
less colonization by STEC than other microgreen varieties, the rest of which were not different
from one another. Reed et al. (2018) found that the ability of S. enterica to grow on sprouting
alfalfa seeds was affected by seed storage time, but this was not the case for Swiss chard
microgreens. Thus, a variety-associated difference in risk may exist. Future work will involve
comparing sunflower microgreens to pea shoot microgreens. These two varieties are popular
among beginning growers (Chapter 2), are often soaked to enhance germination, and have the
same seed to harvest time. Thus, they are optimal for a first step at elucidating variety-specific
effects and have also not previously been studied.
Do soil-free media types transfer pathogens more or less than soil?
The present work only compared soil-free growing media types, but no comparison was made to
soil. The reason for this is that “soil” is not a homogeneous substance, and choosing the type of
soil to use as a basis for comparison is difficult. Thus, future work comparing organic,
146
conventional, potting soil, fertilized potting soil, outdoor collected soil from fields, forests, and
peri-urban land may be necessary to determine the optimal reference soil. Previous work
studying the survival of L. monocytogenes described in Chapter 3 (Dowe et al., 1997, Ivanek et
al. 2003, Locatelli et al. 2013, McLaughlin et al., 2011, Vivant et al., 2013a,b) spans a wide
variety of soil types, though it is likely the optimal choice will be sourced from a potting soil
manufacturer or from a leafy green production field.
Are container systems more or less risky than hydroponic?
Two studies have compared microgreens grown in a hydroponic system compared to a non-
hydroponic soil-free system (Xiao et al. 2014, Wright and Holden, 2018). Further, a review of
different hydroponic system configurations and potential food safety risks concluded that the
data is presently insufficient to determine differential risks, as most studies utilized laboratory
scale hydroponic systems that cannot be adequately compared to “real life” systems (Riggio et
al., 2019).
Are there different risks between indoor, greenhouse, and outdoor systems?
The indoor agriculture microbiome has yet to be adequately characterized. There is some
evidence that humans are a main driver of the indoor microbiome (Berg et al. 2014), which
presents some concern for crop production. As the indoor microbiome has also been found to be
less diverse than outdoor environments (Berg et al. 2014, Stamper et al., 2016), this lack of
biological diversity may increase the likelihood of pathogen colonization (Vivant et al., 2013).
Furthermore, viruses for which humans are the only known reservoir, such as norovirus, a
leading cause of foodborne illness linked to leafy greens (Herman et al., 2015), may persist on
147
indoor surfaces including hydroponic systems (Wang and Kniel, 2016) for extended periods of
time. Norovirus has not yet been studied in soil-free microgreen production systems, and since
norovirus testing is not routinely performed in environmental monitoring schemes (Rönnqvist et
al., 2013), understanding the risk of transfer of this key pathogen to the edible product is
warranted.
Compliance
What factors influence non-compliance with food safety regulatory requirements?
Survey data has demonstrated that small scale and “sustainable” farmers struggle to maintain the
food safety practices recommended by the Produce Safety Rule (Adalja et al., 2018, Harrison et
al., 2013). Areas of concern include documentation, microbiological testing of water and
growing media, employee hygiene, surface and container sanitation, and routine inspections.
Chapter 2 outlines some possible factors contributing to non-compliance. However, a larger
sample size and more diverse respondents may be necessarily to provide an adequate dataset for
regression analyses and other tests of association between behaviors.
Is a microgreen guidance for industry, separate from sprout guidance, necessary?
It seems necessary to develop guidance for industry that is separate from that of sprouted seeds,
as microgreens are not similar enough to sprouts for all of the sprout recommendations to apply.
While sprouts are submerged in a moist environment for 5 days, microgreen seeds are only
soaked and germinated in an environment similar to sprout production for less than 24 hours.
Furthermore, the edible portion of the microgreen lives above the soil line, whereas sprouts have
no inedible parts. Exposure to a pathogen-friendly environment is thus somewhat different

148
between these two crops. Further, as microgreens may have a seed to harvest time of up to three
times that of sprouts, pathogen growth dynamics will thus be different. Chapter 3 and 4 show
that the highest pathogen levels occur within the first 3 days of growth and decreases beyond that
window. Microgreens are also produced in a wide variety of system types, whereas sprout
production is less diverse. Therefore, guidance for industry should take into account best
practices for each method and the relative risk among methods.
A Path Forward for Microgreen Producers
The frequency of microgreen recalls is increasing, most of which are associated with L.
monocytogenes, and as the industry grows, the risk of an outbreak in microgreens increases.
Future investigations into these recalls should include assessments of the production system,
particularly with respect to water and growing media, to determine any common traits among the
companies implicated. These investigations may be important for guiding future research as well
as best practices as new producers enter the industry.

149
References
Adalja, A., and E. Lichtenberg. 2018. Implementation challenges of the food safety
modernization act: Evidence from a national survey of produce growers. Food Control 89, 62–
71. https://doi.org/10.1016/j.foodcont.2018.01.024
Berg, G., A. Mahnert, and C. Moissl-Eichinger. 2014. Beneficial effects of plant-associated
microbes on indoor microbiomes and human health? Front. Microbiol. 5:1–5.
https://doi.org/10.3389/fmicb.2014.00015
Dowe, M.J., E. D. Jackson, J. G. Mori, and C. R. Bell. 1997. Listeria monocytogenes survival in
soil and incidence in agricultural soils. J. Food Prot. 60:1201–1207.
https://doi.org/10.4315/0362-028X-60.10.1201
Harrison, J.A., J. Gaskin, M. A. Harrison, J. L. Cannon, R. R. Boyer, and G. W. Zehnder. 2013.
Survey of food safety practices on small to medium-sized farms and in farmers markets. J. Food
Prot. 76:1989–1993. https://doi.org/10.4315/0362-028x.jfp-13-158
Herman, K., A. Hall, and L. Gould. 2015. Outbreaks attributed to fresh leafy vegetables, United
States, 1973–2012. Epidemiol. Infect. 143:3011–3021. https://doi.org/10.1007/s11065-015-9294-
9.Functional
Hong, E.J. and D. H. Kang. 2016. Effect of sequential dry heat and hydrogen peroxide treatment
on inactivation of Salmonella Typhimurium on alfalfa seeds and seeds germination. Food
Microbiol. 53:9–14. https://doi.org/10.1016/j.fm.2015.08.002
Işık, H., Z. Topalcengiz, S. Güner, and A. Aksoy. 2020. Generic and Shiga toxin-producing
Escherichia coli (O157:H7) contamination of lettuce and radish microgreens grown in peat moss
and perlite. Food Control 111:1070–1079. https://doi.org/10.1016/j.foodcont.2019.107079
Ivanek, R., Y. T. Gröhn, and M. Wiedmann. 2003. Listeria monocytogenes in multiple habitats
and host populations: review of available data for mathematical modeling. Encyclopedia of
Physical Science and Technology, 219–230. https://doi.org/10.1016/B0-12-227410-5/00411-7
Janisiewicz, W.J., W. S. Conway, M. W. Brown, G. M. Sapers, P. Fratamico, and R. L.
Buchanan. 1999. Fate of Escherichia coli O157:H7 on fresh-cut apple tissue and its potential for
transmission by fruit flies. Appl. Environ. Microbiol. 65:1–5.
Lee, J., J. Kim, and S. Park. 2009. Effects of chlorine wash on the quality and microbial
population of Tah Tasai Chinese cabbage microgreens. Korean J. Hortic. 27:625–630.
Lin, C.M., and C. I. Wei. 2016. Transfer of Salmonella Montevideo onto the interior surfaces of
tomatoes by cutting. J. Food Prot. 60:858–862. https://doi.org/10.4315/0362-028x-60.7.858
Locatelli, A., A. Spor, C. Jolivet, P. Piveteau, and A. Hartmann. 2013. Biotic and abiotic soil
properties influence survival of Listeria monocytogenes in Soil. PLoS One 8:1–8.
https://doi.org/10.1371/journal.pone.0075969
McLaughlin, H.P., P. G. Casey, J. Cotter, C. G. M. Gahan, and C. Hill. 2011. Factors affecting
survival of Listeria monocytogenes and Listeria innocua in soil samples. Arch. Microbiol.
193:775–785. https://doi.org/10.1007/s00203-011-0716-7

150
Riggio, G., S. Jones, and K. E. Gibson. 2019. Risk of human pathogen internalization in leafy
vegetables during lab-scale hydroponic cultivation. Horticulturae 5(25):1-22
https://doi.org/10.3390/horticulturae5010025
Rönnqvist, M., M. Rättö, P. Tuominen, S. Salo, and L. Maunula. 2013. Swabs as a tool for
monitoring the presence of norovirus on environmental surfaces in the food industry. J. Food
Prot. 76:1421–1428. https://doi.org/10.4315/0362-028X.JFP-12-371
Stamper, C. E., A. J. Hoisington, O. M. Gomez, A. L. Halweg-Edwards, D. G. Smith, K. L.
Bates, K. A. Kinney, T. T. Postolache, L. A. Brenner, G. A. W. Rook, and C. A. Lowry. 2016.
The microbiome of the built environment and human behavior: implications for emotional health
and well-being in postmodern western societies. Int. Rev. Neurobiol. 131:289–323.
https://doi.org/10.1016/bs.irn.2016.07.006
Ukuku, D. O., and G. M. Sapers. 2001. Effect of sanitizer treatments on Salmonella Stanley
attached to the surface of cantaloupe and cell transfer to fresh-cut tissues during cutting
practices. J. Food Prot. 64:1286–1291. https://doi.org/10.4315/0362-028X-64.9.1286
Vivant, A. L., D. Garmyn, P. A. Maron, V. Nowak, and P. Piveteau, P., 2013. Microbial
diversity and structure are drivers of the biological barrier effect against Listeria monocytogenes
in Soil. PLoS One 8:1–11. https://doi.org/10.1371/journal.pone.0076991
Vivant, A. L., D. Garmyn, and P. Piveteau. 2013. Listeria monocytogenes, a down-to-earth
pathogen. Front. Cell. Infect. Microbiol. 4:1–10. https://doi.org/10.3389/fcimb.2013.00087
Xiao, Z., G. Bauchan, L. Nichols-Russell, Y. Luo, Q. Wang, and X. Nou, X. 2015. Proliferation
of Escherichia coli O157:H7 in soil-substitute and hydroponic microgreen production systems. J.
Food Prot. 78:1785–1790. https://doi.org/10.4315/0362-028x.jfp-15-063
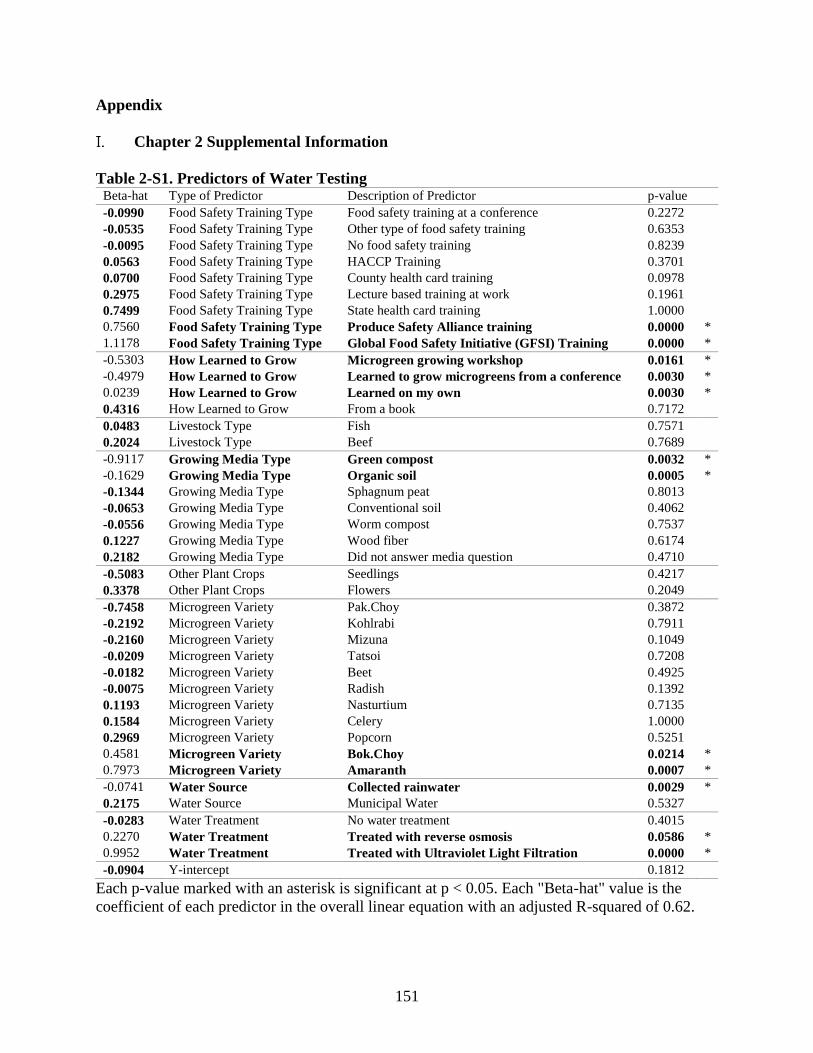
151
Appendix
Chapter 2 Supplemental Information
Table 2-S1. Predictors of Water Testing Beta-hat Type of Predictor Description of Predictor p-value
-0.0990 Food Safety Training Type Food safety training at a conference 0.2272
-0.0535 Food Safety Training Type Other type of food safety training 0.6353
-0.0095 Food Safety Training Type No food safety training 0.8239
0.0563 Food Safety Training Type HACCP Training 0.3701
0.0700 Food Safety Training Type County health card training 0.0978
0.2975 Food Safety Training Type Lecture based training at work 0.1961
0.7499 Food Safety Training Type State health card training 1.0000
0.7560 Food Safety Training Type Produce Safety Alliance training 0.0000 *
1.1178 Food Safety Training Type Global Food Safety Initiative (GFSI) Training 0.0000 *
-0.5303 How Learned to Grow Microgreen growing workshop 0.0161 *
-0.4979 How Learned to Grow Learned to grow microgreens from a conference 0.0030 *
0.0239 How Learned to Grow Learned on my own 0.0030 *
0.4316 How Learned to Grow From a book 0.7172
0.0483 Livestock Type Fish 0.7571
0.2024 Livestock Type Beef 0.7689
-0.9117 Growing Media Type Green compost 0.0032 *
-0.1629 Growing Media Type Organic soil 0.0005 *
-0.1344 Growing Media Type Sphagnum peat 0.8013
-0.0653 Growing Media Type Conventional soil 0.4062
-0.0556 Growing Media Type Worm compost 0.7537
0.1227 Growing Media Type Wood fiber 0.6174
0.2182 Growing Media Type Did not answer media question 0.4710
-0.5083 Other Plant Crops Seedlings 0.4217
0.3378 Other Plant Crops Flowers 0.2049
-0.7458 Microgreen Variety Pak.Choy 0.3872
-0.2192 Microgreen Variety Kohlrabi 0.7911
-0.2160 Microgreen Variety Mizuna 0.1049
-0.0209 Microgreen Variety Tatsoi 0.7208
-0.0182 Microgreen Variety Beet 0.4925
-0.0075 Microgreen Variety Radish 0.1392
0.1193 Microgreen Variety Nasturtium 0.7135
0.1584 Microgreen Variety Celery 1.0000
0.2969 Microgreen Variety Popcorn 0.5251
0.4581 Microgreen Variety Bok.Choy 0.0214 *
0.7973 Microgreen Variety Amaranth 0.0007 *
-0.0741 Water Source Collected rainwater 0.0029 *
0.2175 Water Source Municipal Water 0.5327
-0.0283 Water Treatment No water treatment 0.4015
0.2270 Water Treatment Treated with reverse osmosis 0.0586 *
0.9952 Water Treatment Treated with Ultraviolet Light Filtration 0.0000 *
-0.0904 Y-intercept 0.1812
Each p-value marked with an asterisk is significant at p < 0.05. Each "Beta-hat" value is the
coefficient of each predictor in the overall linear equation with an adjusted R-squared of 0.62.

152
Chapter 3 Supplemental Information
Figure 3-S1. Experimental Set-Up. All tubes were inoculated at the same time from the same
cocktail. H1, H2: Hemp replicates. HB: Hemp blank inoculated with sterile PBS only. B1, B2:
Biostrate® replicates. BB: Biostrate® blank inoculated with sterile PBS only. C1, C2: Coco Coir
replicates. CB: Coco coir blank inoculated with sterile PBS only. P1, P2: Peat replicates. PB:
Peat blank inoculated with sterile PBS only. Pos: 106 CFU/mL bacterial cocktail in sterile PBS.
Neg: the sterile PBS solution used to suspend the cocktail and to inoculate the blanks.
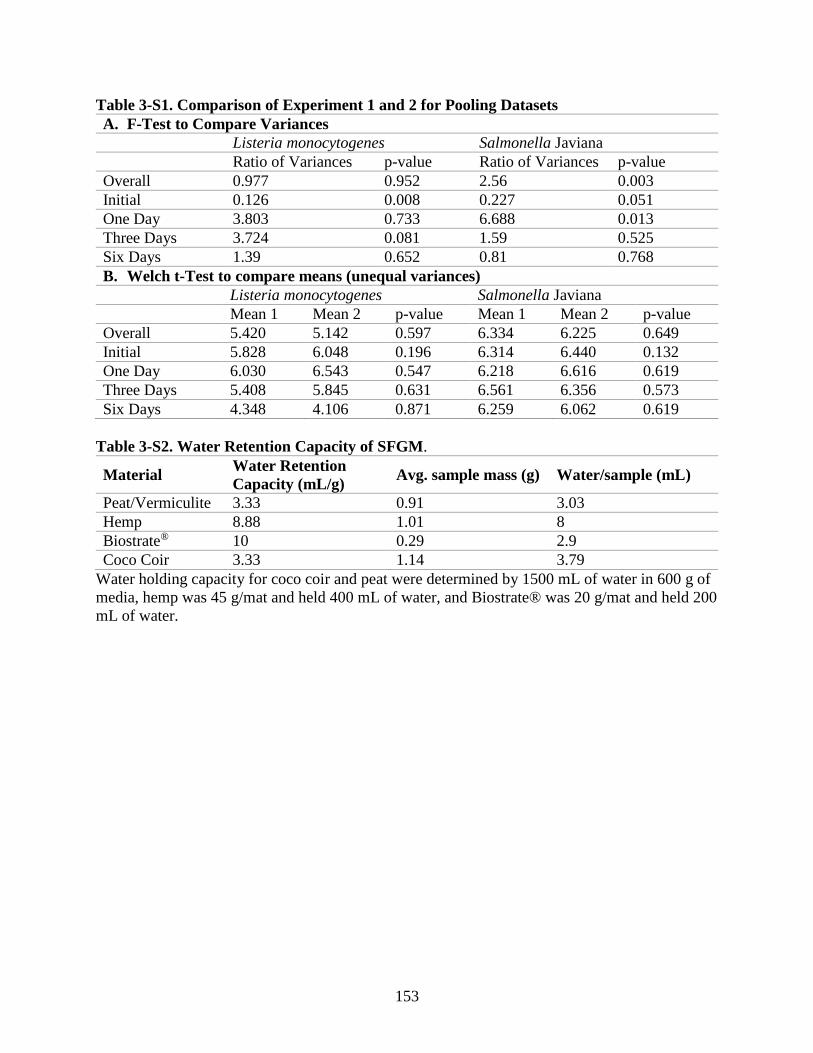
153
Table 3-S1. Comparison of Experiment 1 and 2 for Pooling Datasets
A. F-Test to Compare Variances
Listeria monocytogenes Salmonella Javiana
Ratio of Variances p-value Ratio of Variances p-value
Overall 0.977 0.952 2.56 0.003
Initial 0.126 0.008 0.227 0.051
One Day 3.803 0.733 6.688 0.013
Three Days 3.724 0.081 1.59 0.525
Six Days 1.39 0.652 0.81 0.768
B. Welch t-Test to compare means (unequal variances)
Listeria monocytogenes Salmonella Javiana
Mean 1 Mean 2 p-value Mean 1 Mean 2 p-value
Overall 5.420 5.142 0.597 6.334 6.225 0.649
Initial 5.828 6.048 0.196 6.314 6.440 0.132
One Day 6.030 6.543 0.547 6.218 6.616 0.619
Three Days 5.408 5.845 0.631 6.561 6.356 0.573
Six Days 4.348 4.106 0.871 6.259 6.062 0.619
Table 3-S2. Water Retention Capacity of SFGM.
Material Water Retention
Capacity (mL/g) Avg. sample mass (g) Water/sample (mL)
Peat/Vermiculite 3.33 0.91 3.03
Hemp 8.88 1.01 8
Biostrate® 10 0.29 2.9
Coco Coir 3.33 1.14 3.79
Water holding capacity for coco coir and peat were determined by 1500 mL of water in 600 g of
media, hemp was 45 g/mat and held 400 mL of water, and Biostrate® was 20 g/mat and held 200
mL of water.
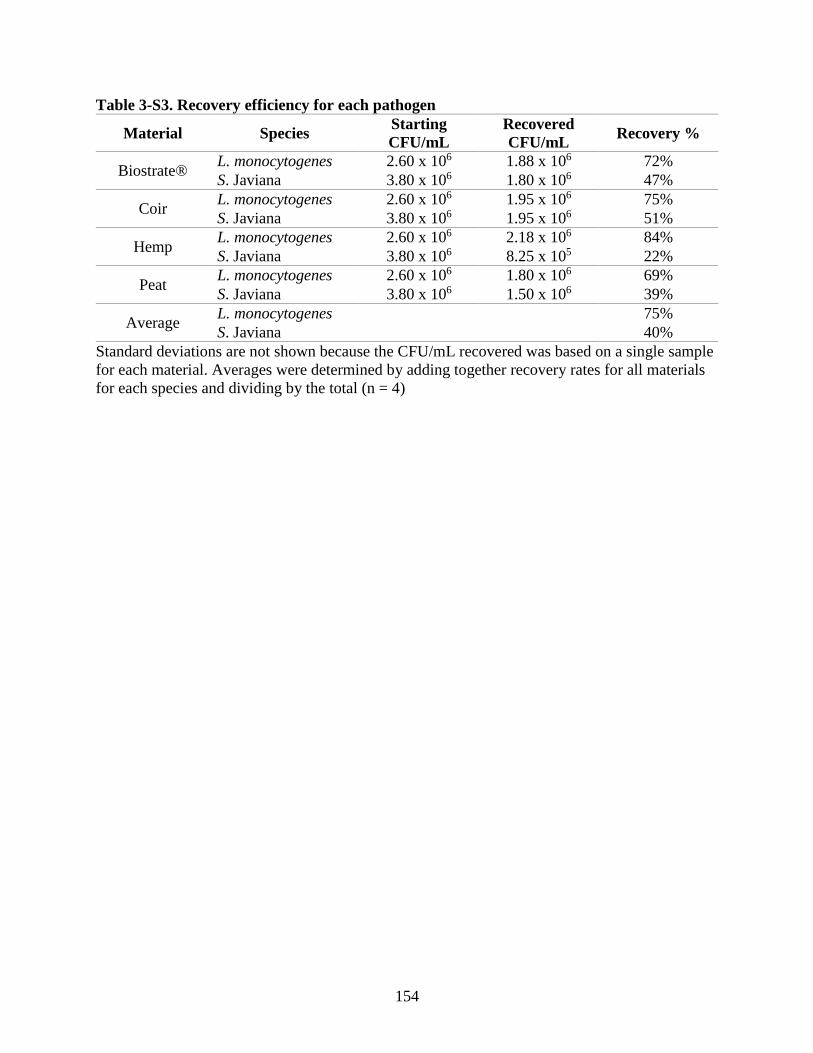
154
Table 3-S3. Recovery efficiency for each pathogen
Material Species Starting
CFU/mL
Recovered
CFU/mL Recovery %
Biostrate® L. monocytogenes 2.60 x 10⁶ 1.88 x 10⁶ 72%
S. Javiana 3.80 x 10⁶ 1.80 x 10⁶ 47%
Coir L. monocytogenes 2.60 x 10⁶ 1.95 x 10⁶ 75%
S. Javiana 3.80 x 10⁶ 1.95 x 10⁶ 51%
Hemp L. monocytogenes 2.60 x 10⁶ 2.18 x 10⁶ 84%
S. Javiana 3.80 x 10⁶ 8.25 x 10⁵ 22%
Peat L. monocytogenes 2.60 x 10⁶ 1.80 x 10⁶ 69%
S. Javiana 3.80 x 10⁶ 1.50 x 10⁶ 39%
Average L. monocytogenes 75%
S. Javiana 40%
Standard deviations are not shown because the CFU/mL recovered was based on a single sample
for each material. Averages were determined by adding together recovery rates for all materials
for each species and dividing by the total (n = 4)
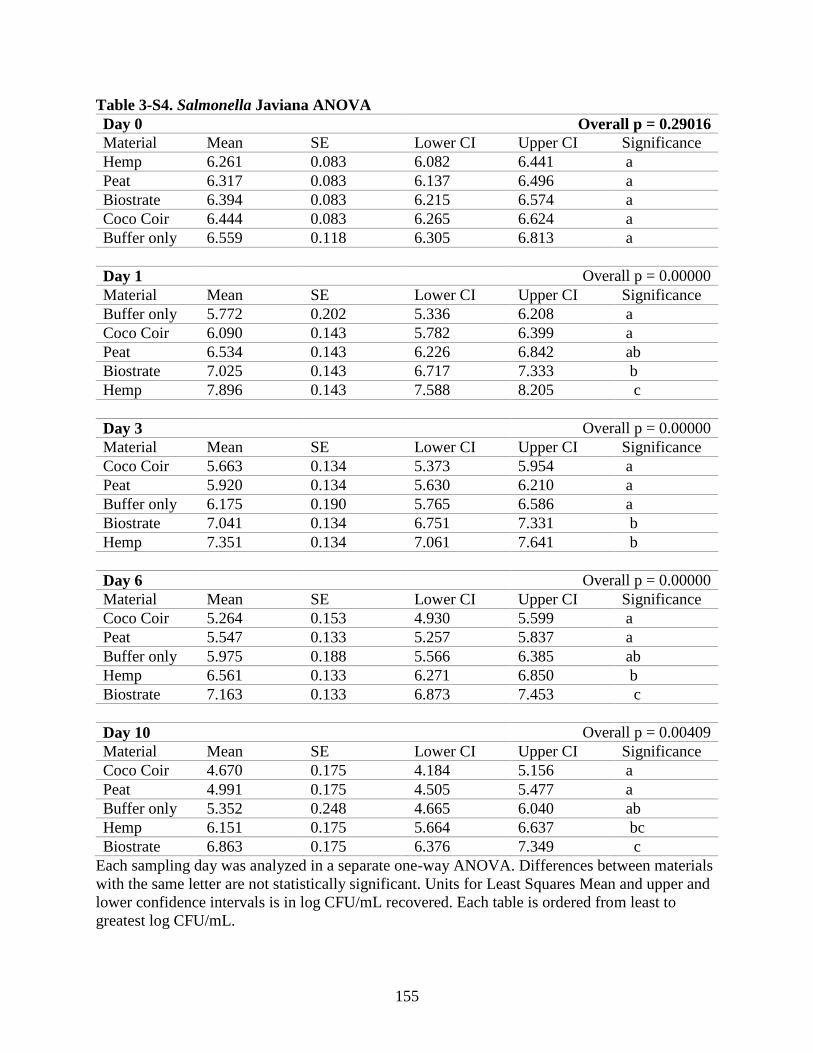
155
Table 3-S4. Salmonella Javiana ANOVA
Day 0 Overall p = 0.29016
Material Mean SE Lower CI Upper CI Significance
Hemp 6.261 0.083 6.082 6.441 a
Peat 6.317 0.083 6.137 6.496 a
Biostrate 6.394 0.083 6.215 6.574 a
Coco Coir 6.444 0.083 6.265 6.624 a
Buffer only 6.559 0.118 6.305 6.813 a
Day 1 Overall p = 0.00000
Material Mean SE Lower CI Upper CI Significance
Buffer only 5.772 0.202 5.336 6.208 a
Coco Coir 6.090 0.143 5.782 6.399 a
Peat 6.534 0.143 6.226 6.842 ab
Biostrate 7.025 0.143 6.717 7.333 b
Hemp 7.896 0.143 7.588 8.205 c
Day 3 Overall p = 0.00000
Material Mean SE Lower CI Upper CI Significance
Coco Coir 5.663 0.134 5.373 5.954 a
Peat 5.920 0.134 5.630 6.210 a
Buffer only 6.175 0.190 5.765 6.586 a
Biostrate 7.041 0.134 6.751 7.331 b
Hemp 7.351 0.134 7.061 7.641 b
Day 6 Overall p = 0.00000
Material Mean SE Lower CI Upper CI Significance
Coco Coir 5.264 0.153 4.930 5.599 a
Peat 5.547 0.133 5.257 5.837 a
Buffer only 5.975 0.188 5.566 6.385 ab
Hemp 6.561 0.133 6.271 6.850 b
Biostrate 7.163 0.133 6.873 7.453 c
Day 10 Overall p = 0.00409
Material Mean SE Lower CI Upper CI Significance
Coco Coir 4.670 0.175 4.184 5.156 a
Peat 4.991 0.175 4.505 5.477 a
Buffer only 5.352 0.248 4.665 6.040 ab
Hemp 6.151 0.175 5.664 6.637 bc
Biostrate 6.863 0.175 6.376 7.349 c
Each sampling day was analyzed in a separate one-way ANOVA. Differences between materials
with the same letter are not statistically significant. Units for Least Squares Mean and upper and
lower confidence intervals is in log CFU/mL recovered. Each table is ordered from least to
greatest log CFU/mL.
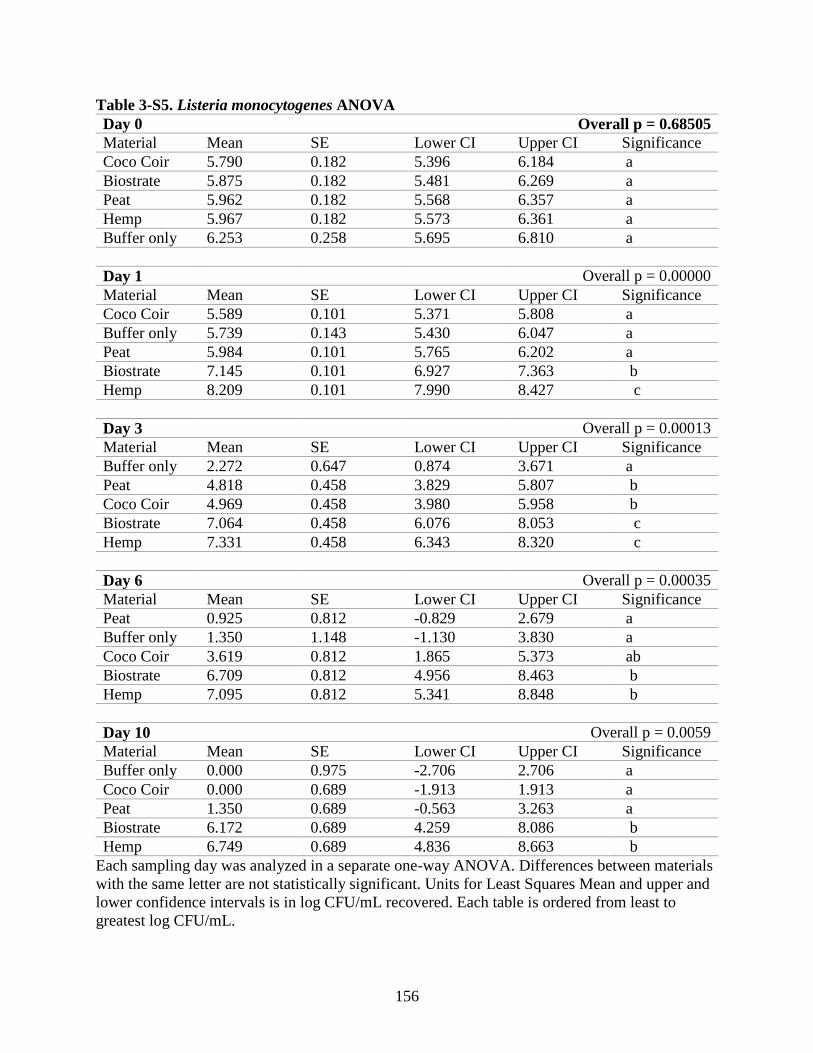
156
Table 3-S5. Listeria monocytogenes ANOVA
Day 0 Overall p = 0.68505
Material Mean SE Lower CI Upper CI Significance
Coco Coir 5.790 0.182 5.396 6.184 a
Biostrate 5.875 0.182 5.481 6.269 a
Peat 5.962 0.182 5.568 6.357 a
Hemp 5.967 0.182 5.573 6.361 a
Buffer only 6.253 0.258 5.695 6.810 a
Day 1 Overall p = 0.00000
Material Mean SE Lower CI Upper CI Significance
Coco Coir 5.589 0.101 5.371 5.808 a
Buffer only 5.739 0.143 5.430 6.047 a
Peat 5.984 0.101 5.765 6.202 a
Biostrate 7.145 0.101 6.927 7.363 b
Hemp 8.209 0.101 7.990 8.427 c
Day 3 Overall p = 0.00013
Material Mean SE Lower CI Upper CI Significance
Buffer only 2.272 0.647 0.874 3.671 a
Peat 4.818 0.458 3.829 5.807 b
Coco Coir 4.969 0.458 3.980 5.958 b
Biostrate 7.064 0.458 6.076 8.053 c
Hemp 7.331 0.458 6.343 8.320 c
Day 6 Overall p = 0.00035
Material Mean SE Lower CI Upper CI Significance
Peat 0.925 0.812 -0.829 2.679 a
Buffer only 1.350 1.148 -1.130 3.830 a
Coco Coir 3.619 0.812 1.865 5.373 ab
Biostrate 6.709 0.812 4.956 8.463 b
Hemp 7.095 0.812 5.341 8.848 b
Day 10 Overall p = 0.0059
Material Mean SE Lower CI Upper CI Significance
Buffer only 0.000 0.975 -2.706 2.706 a
Coco Coir 0.000 0.689 -1.913 1.913 a
Peat 1.350 0.689 -0.563 3.263 a
Biostrate 6.172 0.689 4.259 8.086 b
Hemp 6.749 0.689 4.836 8.663 b
Each sampling day was analyzed in a separate one-way ANOVA. Differences between materials
with the same letter are not statistically significant. Units for Least Squares Mean and upper and
lower confidence intervals is in log CFU/mL recovered. Each table is ordered from least to
greatest log CFU/mL.

157
Table 3-S6. Pairwise Comparisons from the Tukey HSD post-hoc analysis. A. Listeria monocytogenes
Pair Day 0 Day 1 Day 3 Day 6 Day 10
Biostrate-Buffer Only 0.754 0.000 0.000 0.015 0.030
Coco Coir- Buffer Only 0.602 0.909 0.032 0.514 1.000
Hemp- Buffer Only 0.890 0.000 0.000 0.009 0.022
Peat- Buffer Only 0.885 0.638 0.045 0.998 0.787
Coco Coir-Biostrate 0.997 0.000 0.043 0.110 0.015
Hemp-Biostrate 0.996 0.000 0.993 0.997 0.969
Peat-Biostrate 0.997 0.000 0.028 0.002 0.035
Hemp-Coco Coir 0.957 0.000 0.020 0.062 0.011
Peat-Coco Coir 0.960 0.098 0.999 0.191 0.666
Peat-Hemp 1.000 0.000 0.013 0.001 0.024
B. Salmonella Javiana
Pair Day 0 Day 1 Day 3 Day 6 Day 10
Biostrate-Buffer Only 0.782 0.002 0.018 0.002 0.034
Coco Coir- Buffer Only 0.927 0.702 0.240 0.077 0.320
Hemp- Buffer Only 0.289 0.000 0.002 0.145 0.225
Peat- Buffer Only 0.475 0.056 0.805 0.387 0.759
Coco Coir-Biostrate 0.992 0.004 0.000 0.000 0.004
Hemp-Biostrate 0.786 0.006 0.505 0.049 0.181
Peat-Biostrate 0.961 0.167 0.000 0.000 0.008
Hemp-Coco Coir 0.545 0.000 0.000 0.000 0.018
Peat-Coco Coir 0.810 0.240 0.667 0.643 0.709
Peat-Hemp 0.989 0.000 0.000 0.001 0.042
Individual p-values for each pair of SFGM at each time point for both pathogens. Bold values are
statistically significant at p < 0.05.
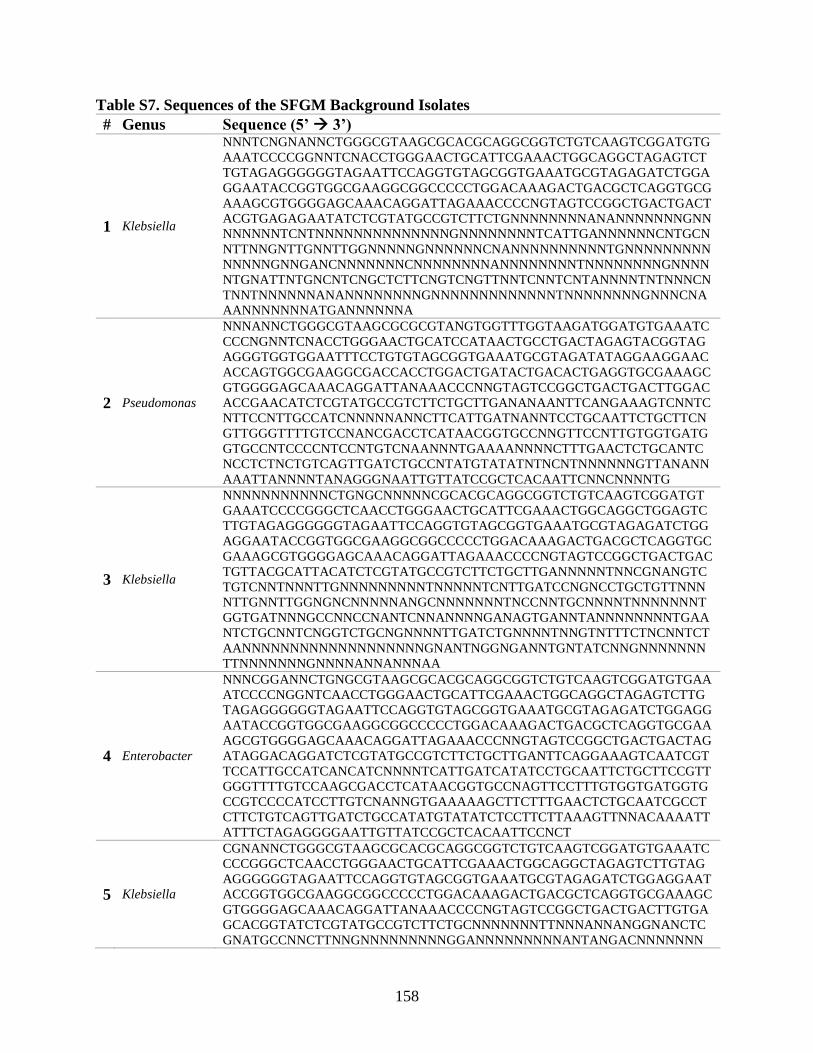
158
Table S7. Sequences of the SFGM Background Isolates
# Genus Sequence (5’ 3’)
1 Klebsiella
NNNTCNGNANNCTGGGCGTAAGCGCACGCAGGCGGTCTGTCAAGTCGGATGTG
AAATCCCCGGNNTCNACCTGGGAACTGCATTCGAAACTGGCAGGCTAGAGTCT
TGTAGAGGGGGGTAGAATTCCAGGTGTAGCGGTGAAATGCGTAGAGATCTGGA
GGAATACCGGTGGCGAAGGCGGCCCCCTGGACAAAGACTGACGCTCAGGTGCG
AAAGCGTGGGGAGCAAACAGGATTAGAAACCCCNGTAGTCCGGCTGACTGACT
ACGTGAGAGAATATCTCGTATGCCGTCTTCTGNNNNNNNNANANNNNNNNGNN
NNNNNNTCNTNNNNNNNNNNNNNNGNNNNNNNNTCATTGANNNNNNCNTGCN
NTTNNGNTTGNNTTGGNNNNNGNNNNNNCNANNNNNNNNNNTGNNNNNNNNN
NNNNNGNNGANCNNNNNNNCNNNNNNNNANNNNNNNNTNNNNNNNNGNNNN
NTGNATTNTGNCNTCNGCTCTTCNGTCNGTTNNTCNNTCNTANNNNTNTNNNCN
TNNTNNNNNNANANNNNNNNNGNNNNNNNNNNNNNTNNNNNNNNGNNNCNA
AANNNNNNNATGANNNNNNA
2 Pseudomonas
NNNANNCTGGGCGTAAGCGCGCGTANGTGGTTTGGTAAGATGGATGTGAAATC
CCCNGNNTCNACCTGGGAACTGCATCCATAACTGCCTGACTAGAGTACGGTAG
AGGGTGGTGGAATTTCCTGTGTAGCGGTGAAATGCGTAGATATAGGAAGGAAC
ACCAGTGGCGAAGGCGACCACCTGGACTGATACTGACACTGAGGTGCGAAAGC
GTGGGGAGCAAACAGGATTANAAACCCNNGTAGTCCGGCTGACTGACTTGGAC
ACCGAACATCTCGTATGCCGTCTTCTGCTTGANANAANTTCANGAAAGTCNNTC
NTTCCNTTGCCATCNNNNNANNCTTCATTGATNANNTCCTGCAATTCTGCTTCN
GTTGGGTTTTGTCCNANCGACCTCATAACGGTGCCNNGTTCCNTTGTGGTGATG
GTGCCNTCCCCNTCCNTGTCNAANNNTGAAAANNNNCTTTGAACTCTGCANTC
NCCTCTNCTGTCAGTTGATCTGCCNTATGTATATNTNCNTNNNNNNGTTANANN
AAATTANNNNTANAGGGNAATTGTTATCCGCTCACAATTCNNCNNNNTG
3 Klebsiella
NNNNNNNNNNNCTGNGCNNNNNCGCACGCAGGCGGTCTGTCAAGTCGGATGT
GAAATCCCCGGGCTCAACCTGGGAACTGCATTCGAAACTGGCAGGCTGGAGTC
TTGTAGAGGGGGGTAGAATTCCAGGTGTAGCGGTGAAATGCGTAGAGATCTGG
AGGAATACCGGTGGCGAAGGCGGCCCCCTGGACAAAGACTGACGCTCAGGTGC
GAAAGCGTGGGGAGCAAACAGGATTAGAAACCCCNGTAGTCCGGCTGACTGAC
TGTTACGCATTACATCTCGTATGCCGTCTTCTGCTTGANNNNNTNNCGNANGTC
TGTCNNTNNNTTGNNNNNNNNNTNNNNNTCNTTGATCCNGNCCTGCTGTTNNN
NTTGNNTTGGNGNCNNNNNANGCNNNNNNNTNCCNNTGCNNNNTNNNNNNNT
GGTGATNNNGCCNNCCNANTCNNANNNNGANAGTGANNTANNNNNNNNTGAA
NTCTGCNNTCNGGTCTGCNGNNNNTTGATCTGNNNNTNNGTNTTTCTNCNNTCT
AANNNNNNNNNNNNNNNNNNNGNANTNGGNGANNTGNTATCNNGNNNNNNN
TTNNNNNNNGNNNNANNANNNAA
4 Enterobacter
NNNCGGANNCTGNGCGTAAGCGCACGCAGGCGGTCTGTCAAGTCGGATGTGAA
ATCCCCNGGNTCAACCTGGGAACTGCATTCGAAACTGGCAGGCTAGAGTCTTG
TAGAGGGGGGTAGAATTCCAGGTGTAGCGGTGAAATGCGTAGAGATCTGGAGG
AATACCGGTGGCGAAGGCGGCCCCCTGGACAAAGACTGACGCTCAGGTGCGAA
AGCGTGGGGAGCAAACAGGATTAGAAACCCNNGTAGTCCGGCTGACTGACTAG
ATAGGACAGGATCTCGTATGCCGTCTTCTGCTTGANTTCAGGAAAGTCAATCGT
TCCATTGCCATCANCATCNNNNTCATTGATCATATCCTGCAATTCTGCTTCCGTT
GGGTTTTGTCCAAGCGACCTCATAACGGTGCCNAGTTCCTTTGTGGTGATGGTG
CCGTCCCCATCCTTGTCNANNGTGAAAAAGCTTCTTTGAACTCTGCAATCGCCT
CTTCTGTCAGTTGATCTGCCATATGTATATCTCCTTCTTAAAGTTNNACAAAATT
ATTTCTAGAGGGGAATTGTTATCCGCTCACAATTCCNCT
5 Klebsiella
CGNANNCTGGGCGTAAGCGCACGCAGGCGGTCTGTCAAGTCGGATGTGAAATC
CCCGGGCTCAACCTGGGAACTGCATTCGAAACTGGCAGGCTAGAGTCTTGTAG
AGGGGGGTAGAATTCCAGGTGTAGCGGTGAAATGCGTAGAGATCTGGAGGAAT
ACCGGTGGCGAAGGCGGCCCCCTGGACAAAGACTGACGCTCAGGTGCGAAAGC
GTGGGGAGCAAACAGGATTANAAACCCCNGTAGTCCGGCTGACTGACTTGTGA
GCACGGTATCTCGTATGCCGTCTTCTGCNNNNNNNTTNNNANNANGGNANCTC
GNATGCCNNCTTNNGNNNNNNNNNGGANNNNNNNNNANTANGACNNNNNNN
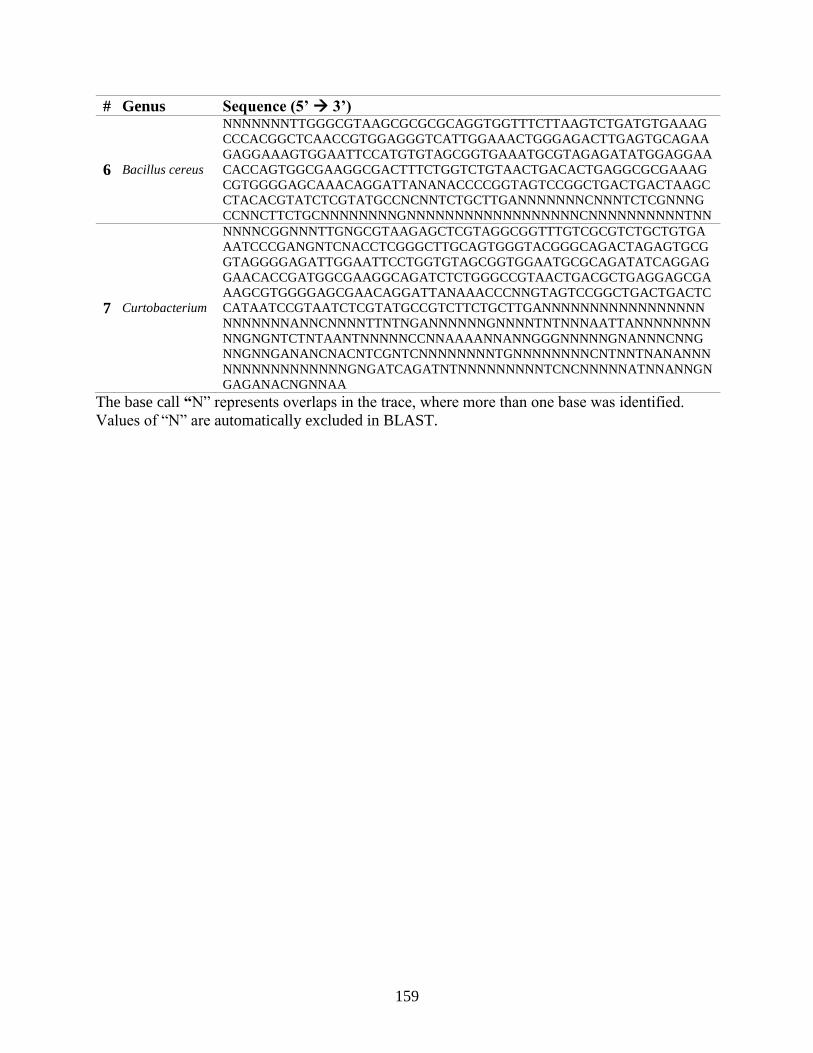
159
# Genus Sequence (5’ 3’)
6 Bacillus cereus
NNNNNNNTTGGGCGTAAGCGCGCGCAGGTGGTTTCTTAAGTCTGATGTGAAAG
CCCACGGCTCAACCGTGGAGGGTCATTGGAAACTGGGAGACTTGAGTGCAGAA
GAGGAAAGTGGAATTCCATGTGTAGCGGTGAAATGCGTAGAGATATGGAGGAA
CACCAGTGGCGAAGGCGACTTTCTGGTCTGTAACTGACACTGAGGCGCGAAAG
CGTGGGGAGCAAACAGGATTANANACCCCGGTAGTCCGGCTGACTGACTAAGC
CTACACGTATCTCGTATGCCNCNNTCTGCTTGANNNNNNNCNNNTCTCGNNNG
CCNNCTTCTGCNNNNNNNNGNNNNNNNNNNNNNNNNNNCNNNNNNNNNNTNN
7 Curtobacterium
NNNNCGGNNNTTGNGCGTAAGAGCTCGTAGGCGGTTTGTCGCGTCTGCTGTGA
AATCCCGANGNTCNACCTCGGGCTTGCAGTGGGTACGGGCAGACTAGAGTGCG
GTAGGGGAGATTGGAATTCCTGGTGTAGCGGTGGAATGCGCAGATATCAGGAG
GAACACCGATGGCGAAGGCAGATCTCTGGGCCGTAACTGACGCTGAGGAGCGA
AAGCGTGGGGAGCGAACAGGATTANAAACCCNNGTAGTCCGGCTGACTGACTC
CATAATCCGTAATCTCGTATGCCGTCTTCTGCTTGANNNNNNNNNNNNNNNNN
NNNNNNNANNCNNNNTTNTNGANNNNNNGNNNNTNTNNNAATTANNNNNNNN
NNGNGNTCTNTAANTNNNNNCCNNAAAANNANNGGGNNNNNGNANNNCNNG
NNGNNGANANCNACNTCGNTCNNNNNNNNTGNNNNNNNNCNTNNTNANANNN
NNNNNNNNNNNNNGNGATCAGATNTNNNNNNNNNTCNCNNNNNATNNANNGN
GAGANACNGNNAA
The base call “N” represents overlaps in the trace, where more than one base was identified.
Values of “N” are automatically excluded in BLAST.
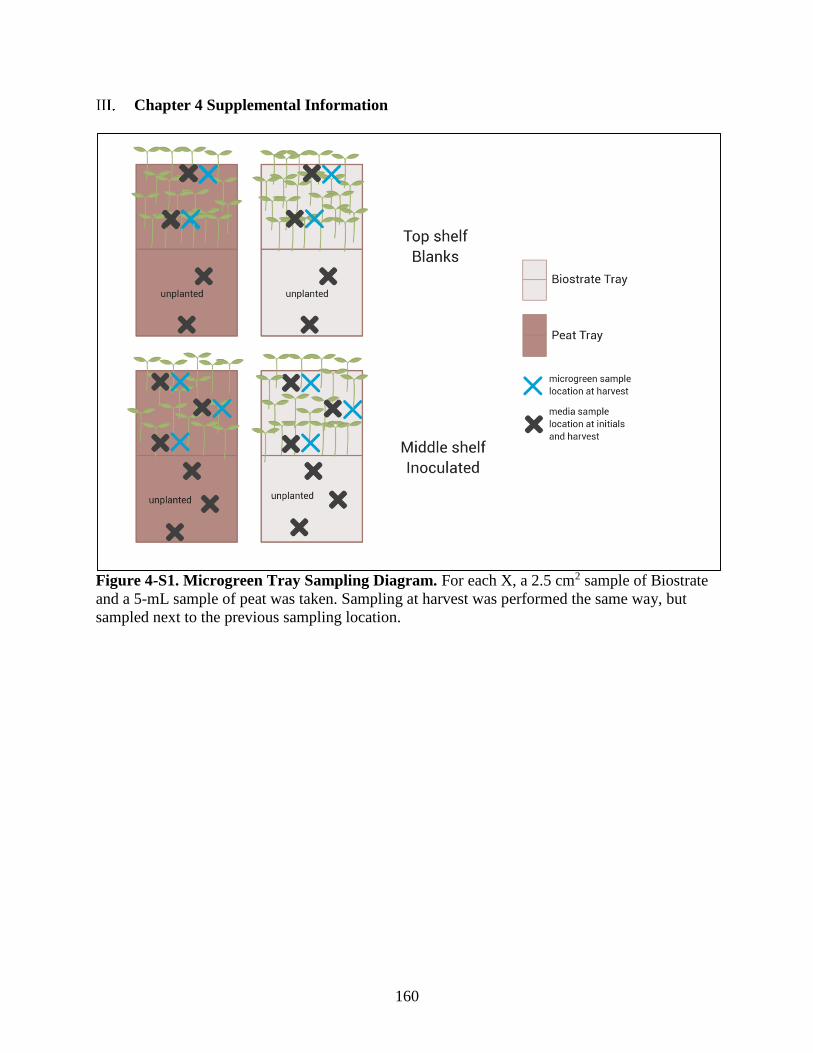
160
Chapter 4 Supplemental Information
Figure 4-S1. Microgreen Tray Sampling Diagram. For each X, a 2.5 cm2 sample of Biostrate
and a 5-mL sample of peat was taken. Sampling at harvest was performed the same way, but
sampled next to the previous sampling location.
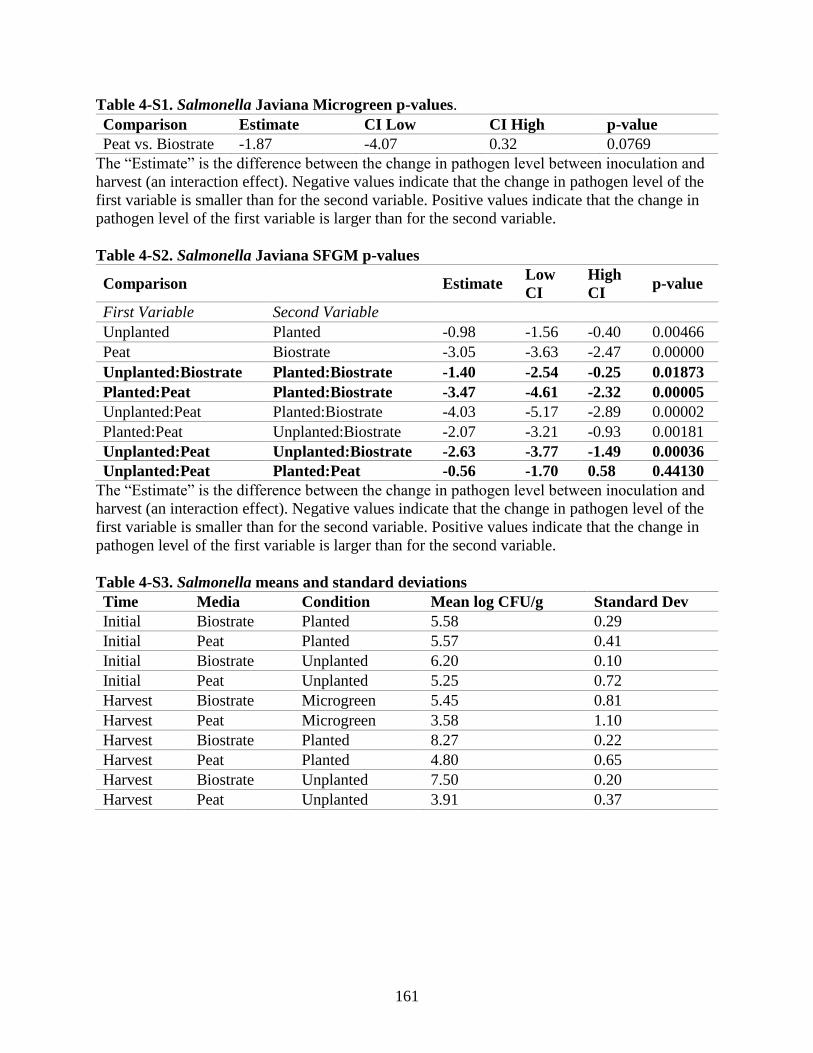
161
Table 4-S1. Salmonella Javiana Microgreen p-values.
Comparison Estimate CI Low CI High p-value
Peat vs. Biostrate -1.87 -4.07 0.32 0.0769
The “Estimate” is the difference between the change in pathogen level between inoculation and
harvest (an interaction effect). Negative values indicate that the change in pathogen level of the
first variable is smaller than for the second variable. Positive values indicate that the change in
pathogen level of the first variable is larger than for the second variable.
Table 4-S2. Salmonella Javiana SFGM p-values
Comparison Estimate Low
CI
High
CI p-value
First Variable Second Variable
Unplanted Planted -0.98 -1.56 -0.40 0.00466
Peat Biostrate -3.05 -3.63 -2.47 0.00000
Unplanted:Biostrate Planted:Biostrate -1.40 -2.54 -0.25 0.01873
Planted:Peat Planted:Biostrate -3.47 -4.61 -2.32 0.00005
Unplanted:Peat Planted:Biostrate -4.03 -5.17 -2.89 0.00002
Planted:Peat Unplanted:Biostrate -2.07 -3.21 -0.93 0.00181
Unplanted:Peat Unplanted:Biostrate -2.63 -3.77 -1.49 0.00036
Unplanted:Peat Planted:Peat -0.56 -1.70 0.58 0.44130
The “Estimate” is the difference between the change in pathogen level between inoculation and
harvest (an interaction effect). Negative values indicate that the change in pathogen level of the
first variable is smaller than for the second variable. Positive values indicate that the change in
pathogen level of the first variable is larger than for the second variable.
Table 4-S3. Salmonella means and standard deviations
Time Media Condition Mean log CFU/g Standard Dev
Initial Biostrate Planted 5.58 0.29
Initial Peat Planted 5.57 0.41
Initial Biostrate Unplanted 6.20 0.10
Initial Peat Unplanted 5.25 0.72
Harvest Biostrate Microgreen 5.45 0.81
Harvest Peat Microgreen 3.58 1.10
Harvest Biostrate Planted 8.27 0.22
Harvest Peat Planted 4.80 0.65
Harvest Biostrate Unplanted 7.50 0.20
Harvest Peat Unplanted 3.91 0.37
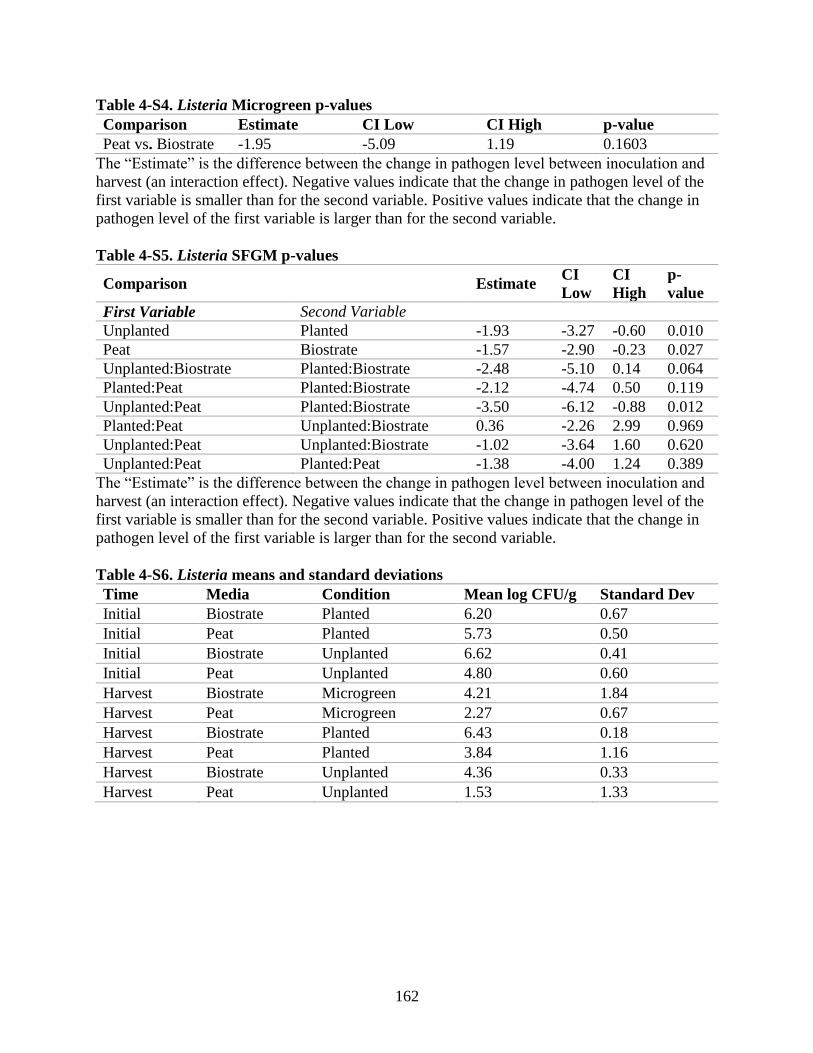
162
Table 4-S4. Listeria Microgreen p-values
Comparison Estimate CI Low CI High p-value
Peat vs. Biostrate -1.95 -5.09 1.19 0.1603
The “Estimate” is the difference between the change in pathogen level between inoculation and
harvest (an interaction effect). Negative values indicate that the change in pathogen level of the
first variable is smaller than for the second variable. Positive values indicate that the change in
pathogen level of the first variable is larger than for the second variable.
Table 4-S5. Listeria SFGM p-values
Comparison Estimate CI
Low
CI
High
p-
value
First Variable Second Variable
Unplanted Planted -1.93 -3.27 -0.60 0.010
Peat Biostrate -1.57 -2.90 -0.23 0.027
Unplanted:Biostrate Planted:Biostrate -2.48 -5.10 0.14 0.064
Planted:Peat Planted:Biostrate -2.12 -4.74 0.50 0.119
Unplanted:Peat Planted:Biostrate -3.50 -6.12 -0.88 0.012
Planted:Peat Unplanted:Biostrate 0.36 -2.26 2.99 0.969
Unplanted:Peat Unplanted:Biostrate -1.02 -3.64 1.60 0.620
Unplanted:Peat Planted:Peat -1.38 -4.00 1.24 0.389
The “Estimate” is the difference between the change in pathogen level between inoculation and
harvest (an interaction effect). Negative values indicate that the change in pathogen level of the
first variable is smaller than for the second variable. Positive values indicate that the change in
pathogen level of the first variable is larger than for the second variable.
Table 4-S6. Listeria means and standard deviations
Time Media Condition Mean log CFU/g Standard Dev
Initial Biostrate Planted 6.20 0.67
Initial Peat Planted 5.73 0.50
Initial Biostrate Unplanted 6.62 0.41
Initial Peat Unplanted 4.80 0.60
Harvest Biostrate Microgreen 4.21 1.84
Harvest Peat Microgreen 2.27 0.67
Harvest Biostrate Planted 6.43 0.18
Harvest Peat Planted 3.84 1.16
Harvest Biostrate Unplanted 4.36 0.33
Harvest Peat Unplanted 1.53 1.33

163
Table 4-S7. Between-Pathogen Microgreen p-values
Comparison Estimate CI Low CI High p-value
Salmonella-Listeria 1.28 -0.32 2.87 0.1017
Peat-Biostrate -1.91 -3.50 -0.32 0.0244
Salmonella:Biostrate-Listeria:Biostrate 1.24 -1.89 4.37 0.6040
Listeria:Peat-Listeria:Biostrate -1.95 -5.07 1.18 0.2660
Salmonella:Peat-Listeria:Biostrate -0.63 -3.76 2.49 0.9125
Listeria:Peat-Salmonella:Biostrate -3.19 -6.31 -0.06 0.0458
Salmonella:Peat-Salmonella:Biostrate -1.87 -5.00 1.25 0.2922
Salmonella:Peat-Listeria:Peat 1.31 -1.81 4.44 0.5634
Table 4-S8. Between-Pathogen SFGM p-values Comparison Est. CI Low CI Hi p-value
First variable Second variable
Salmonella Listeria 2.27 1.6 2.94 0.0000
Unplanted Planted -1.46 -2.12 -0.79 0.0003
Peat Biostrate -2.31 -2.98 -1.64 0.0000
Salmonella:Planted Listeria:Planted 1.8 0.52 3.07 0.0049
Listeria:Unplanted Listeria:Planted -1.93 -3.21 -0.65 0.0026
Salmonella:Unplanted Listeria:Planted 0.82 -0.46 2.09 0.2955
Listeria:Unplanted Salmonella:Planted -3.73 -5 -2.45 0.0000
Salmonella:Unplanted Salmonella:Planted -0.98 -2.26 0.3 0.1673
Salmonella:Unplanted Listeria:Unplanted 2.75 1.47 4.03 0.0001
Salmonella:Biostrate Listeria:Biostrate 3.01 1.74 4.29 0.0000
Listeria:Peat Listeria:Biostrate -1.57 -2.84 -0.29 0.0139
Salmonella:Peat Listeria:Biostrate -0.04 -1.31 1.24 0.9998
Listeria:Peat Salmonella:Biostrate -4.58 -5.86 -3.3 0.0000
Salmonella:Peat Salmonella:Biostrate -3.05 -4.33 -1.77 0.0000
Salmonella:Peat Listeria:Peat 1.53 0.25 2.81 0.0163
Unplanted:Biostrate Planted:Biostrate -1.94 -3.22 -0.66 0.0025
Planted:Peat Planted:Biostrate -2.79 -4.07 -1.51 0.0001
Unplanted:Peat Planted:Biostrate -3.76 -5.04 -2.49 0.0000
Planted:Peat Unplanted:Biostrate -0.85 -2.13 0.42 0.2629
Unplanted:Peat Unplanted:Biostrate -1.82 -3.1 -0.55 0.0043
Unplanted:Peat Planted:Peat -0.97 -2.25 0.31 0.1719
Salmonella:Planted:Biostrate Listeria:Planted:Biostrate 2.47 0.29 4.66 0.0211
Listeria:Unplanted:Biostrate Listeria:Planted:Biostrate -2.48 -4.67 -0.3 0.0204
Salmonella:Unplanted:Biostrate Listeria:Planted:Biostrate 1.08 -1.11 3.26 0.6857
Listeria:Planted:Peat Listeria:Planted:Biostrate -2.12 -4.3 0.07 0.0612
Salmonella:Planted:Peat Listeria:Planted:Biostrate -0.99 -3.18 1.19 0.7574
Listeria:Unplanted:Peat Listeria:Planted:Biostrate -3.5 -5.68 -1.31 0.0009
Salmonella:Unplanted:Peat Listeria:Planted:Biostrate -1.56 -3.74 0.63 0.2758
Listeria:Unplanted:Biostrate Salmonella:Planted:Biostrate -4.95 -7.14 -2.77 0.0000
Salmonella:Unplanted:Biostrate Salmonella:Planted:Biostrate -1.4 -3.58 0.79 0.3947
Listeria:Planted:Peat Salmonella:Planted:Biostrate -4.59 -6.77 -2.4 0.0000
Salmonella:Planted:Peat Salmonella:Planted:Biostrate -3.47 -5.65 -1.28 0.0010
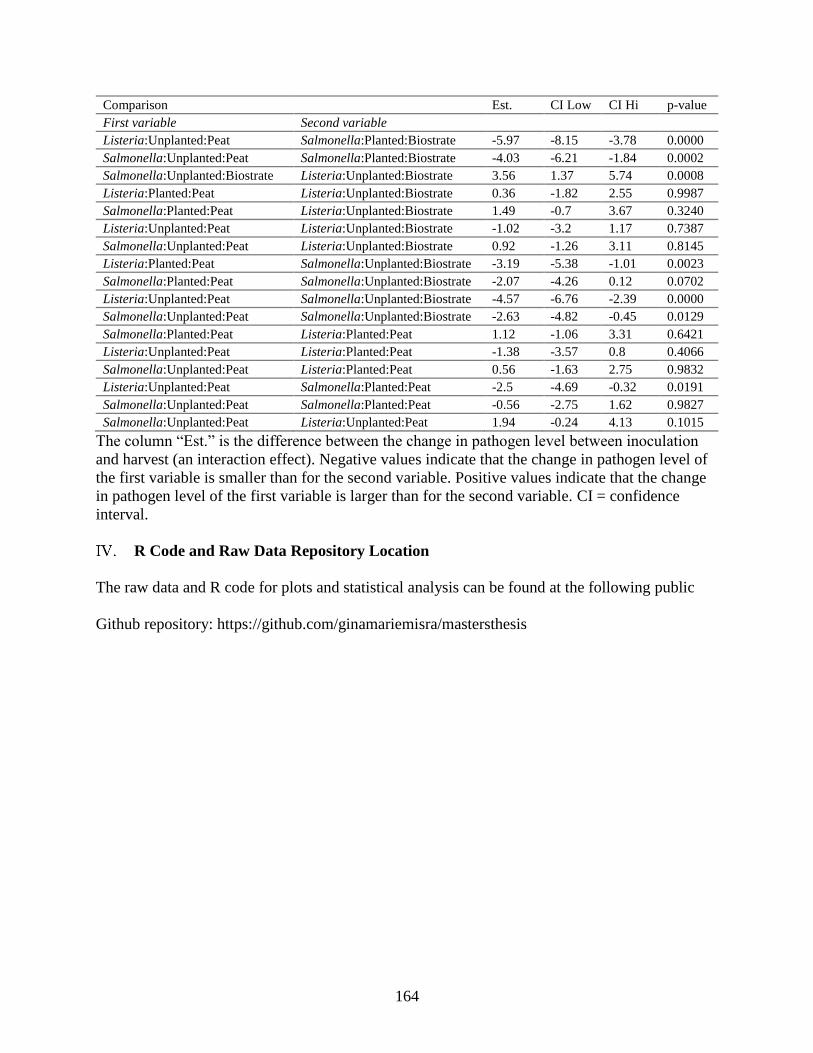
164
Comparison Est. CI Low CI Hi p-value
First variable Second variable
Listeria:Unplanted:Peat Salmonella:Planted:Biostrate -5.97 -8.15 -3.78 0.0000
Salmonella:Unplanted:Peat Salmonella:Planted:Biostrate -4.03 -6.21 -1.84 0.0002
Salmonella:Unplanted:Biostrate Listeria:Unplanted:Biostrate 3.56 1.37 5.74 0.0008
Listeria:Planted:Peat Listeria:Unplanted:Biostrate 0.36 -1.82 2.55 0.9987
Salmonella:Planted:Peat Listeria:Unplanted:Biostrate 1.49 -0.7 3.67 0.3240
Listeria:Unplanted:Peat Listeria:Unplanted:Biostrate -1.02 -3.2 1.17 0.7387
Salmonella:Unplanted:Peat Listeria:Unplanted:Biostrate 0.92 -1.26 3.11 0.8145
Listeria:Planted:Peat Salmonella:Unplanted:Biostrate -3.19 -5.38 -1.01 0.0023
Salmonella:Planted:Peat Salmonella:Unplanted:Biostrate -2.07 -4.26 0.12 0.0702
Listeria:Unplanted:Peat Salmonella:Unplanted:Biostrate -4.57 -6.76 -2.39 0.0000
Salmonella:Unplanted:Peat Salmonella:Unplanted:Biostrate -2.63 -4.82 -0.45 0.0129
Salmonella:Planted:Peat Listeria:Planted:Peat 1.12 -1.06 3.31 0.6421
Listeria:Unplanted:Peat Listeria:Planted:Peat -1.38 -3.57 0.8 0.4066
Salmonella:Unplanted:Peat Listeria:Planted:Peat 0.56 -1.63 2.75 0.9832
Listeria:Unplanted:Peat Salmonella:Planted:Peat -2.5 -4.69 -0.32 0.0191
Salmonella:Unplanted:Peat Salmonella:Planted:Peat -0.56 -2.75 1.62 0.9827
Salmonella:Unplanted:Peat Listeria:Unplanted:Peat 1.94 -0.24 4.13 0.1015
The column “Est.” is the difference between the change in pathogen level between inoculation
and harvest (an interaction effect). Negative values indicate that the change in pathogen level of
the first variable is smaller than for the second variable. Positive values indicate that the change
in pathogen level of the first variable is larger than for the second variable. CI = confidence
interval.
R Code and Raw Data Repository Location
The raw data and R code for plots and statistical analysis can be found at the following public
Github repository: https://github.com/ginamariemisra/mastersthesis