Embed Size (px)
Citation preview

8/8/2019 Food Security and MDG
http://slidepdf.com/reader/full/food-security-and-mdg 1/43
The State of
Food Insecurity in the World
2004
monitoring progress
towards the World Food Summit and
Millennium Development Goals

8/8/2019 Food Security and MDG
http://slidepdf.com/reader/full/food-security-and-mdg 2/43
Acknowledgements
This sixth edition of The State of Food
Insecurity in the World (SOFI) wasprepared as a collaborative effort withinFAO led by the Economic and Social
Department (ES).
Overall leadership was provided byHartwig de Haen, Assistant Director-General, ES, assisted by KostasStamoulis, Chief of the AgriculturalSector in Economic DevelopmentService, who served as the chair ofthe core technical team. Valuableconceptual and editorial assistancewas provided by Andrew Marx ofKnowledgeView Ltd.
Other members of the core technical
team in the ES Department were: JelleBruinsma, Global Perspectives StudyUnit; Randy Stringer, Agricultural andDevelopment Economics Division;Ali Arslan Gurkan, Commodities andTrade Division; Prakash Shetty, Foodand Nutrition Division; Jorge Mernies,Statistics Division.
The following FAO staff providedtechnical contributions: JosefSchmidhuber, Global Perspectives StudyUnit (ES); Jennifer Nyberg, Office of the
Assistant Director-General (ES); CinziaCerri, Haluk Kasnakoglu, SeevalingumRamasawmy and Ricardo Sibrian,Statistics Division (ES); Luca Alinovi,Sumiter Broca, Gero Carletto, BenjaminDavis, Margarita Flores, AmdetsionGebre-Michael, Guenter Hemrich,Naoko Horii, Madelon Meijer and PrabhuPingali, Agricultural and DevelopmentEconomics Division (ES); Terri Ballard,Gina Kennedy and Guy Nantel, NutritionDivision (ES); Maarten Immink andJenny Riches, FIVIMS CoordinationUnit (ES); Concepción Calpe and Henri
Josserand, Commodities and TradeDivision (ES); Lavinia Gasperini andEster Zulberti, Research, Extensionand Training Division (SD); AndrewMacMillan, Field Operations Division(TC).
The key estimates on food consumption
and undernourishment used in SOFI2004 were produced by the Basic DataBranch and the Statistical AnalysisService of the FAO Statistics Division
respectively.
FAO extends special thanks to the teamof Banson, Cambridge, UK, for design,layout, editorial support and preparationof graphic material.
The Editorial Production and DesignGroup of the Information Division, GI,was responsible for language editingservices, editorial quality controland production. Translations wereprovided by the Translation Group of theConference, Council and Protocol Affairs
Division, GI.
Published in 2004 by theFood and Agriculture Organization of the United Nations
Viale delle Terme di Caracalla, 00100 Rome, Italy
The designations employed and the presentation of the materialin this information product do not imply the expression of anyopinion whatsoever on the part of the Food and AgricultureOrganization of the United Nations concerning the legal or
development status of any country, territory, city or area or ofits boundaries, or concerning the delimitation of its frontiers orboundaries.
The mention or omission of specific companies, their productsor brand names does not imply any endorsement or judgementby the Food and Agriculture Organization of the United Nations.
All rights reserved. Reproduction and dissemination ofmaterial in this information product for education or othernon-commercial purposes are authorized without any priorwritten permission from the copyright holders provided thesource is fully acknowledged. Reproduction of material in thisinformation product for resale or other commercial purposes is
prohibited without written permission of the copyright holders.
Applications for such permission should be addressed to theChief, Publishing Management Service, Information Division,
FAO, Viale delle Terme di Caracalla, 00100 Rome, Italy or bye-mail to [email protected].
© FAO 2004
ISBN 92-5-105178-X
Printed in Italy
Photographs
As cover (left to right): Thi ha Thein Nyan/UNEP/Topham;Claudio Marcozzi/UNEP/Topham; Felix O Granmakou/UNEP/Topham.

8/8/2019 Food Security and MDG
http://slidepdf.com/reader/full/food-security-and-mdg 3/43
The State of
Food Insecurity in the World
2004
monitoring progresstowards the World Food Summit and
Millennium Development Goals

8/8/2019 Food Security and MDG
http://slidepdf.com/reader/full/food-security-and-mdg 4/43The State of Food Insecurity in the World 2004
The State of Food Insecurity in the
World 2004 reports on progressand setbacks in efforts to reach
the goal set by the World Food Summit(WFS) in 1996 – to halve the number ofchronically hungry people in the world
by the year 2015.The first section of the report, Under-
nourishment around the world, presents
the latest estimates of the number ofundernourished people along with pre-liminary calculations of the heavy eco-nomic burden imposed by hunger andmalnutrition.
This year’s Special feature focuses on
the impact that the rapid growth of citiesand incomes in developing countries hashad on hunger and food security.
The Towards the Summit commit-
ments section presents examples ofissues and actions that are essential tofulfilling the commitments in the WFSPlan of Action and related MillenniumDevelopment Goals.
Tables provide detailed indicators ofthe status and progress of developingcountries and countries in transition.
About this report
Food Insecurity and Vulnerability Information and Mapping Systems
It hardly seems that a year has gone by since I sat down towrite the introduction for The State of Food Insecurity in the
World 2003 . Time passes by so quickly for many of us. But forhundreds of millions of hungry people who must worry aboutwhere their next meal will come from, this has been anotherlong, painful year. In this publication we see that the number ofhungry people remains intolerably high, progress in reachingthem unconscionably slow and the costs in ruined lives andwasted resources incalculably large. For those children andadults who were reached, we may have made a life-changingdifference. But the lives of far too many others continue to beplagued by hunger and poverty.
In last year’s report, I mentioned the external assessmentof the Inter-Agency Working Group on FIVIMS (IAWG-FIVIMS)that was under way at that time. The assessment pulled nopunches. While noting some very positive initiatives and results,it concluded that FIVIMS had failed to live up to its true potential.Our membership pledged to find new ways of working together
to meet a need that remains even more urgent today than whenFIVIMS was created. At our annual meeting in April 2004, weagreed on a new organizational structure. We are currentlydefining our business plan for the future, and, in particular,identifying high-priority areas of activity for the next two years.
Our goal remains unchanged – to help countries establishquality food insecurity information systems that will provide thetimely information needed both to formulate effective policiesand programmes and to monitor progress in achieving global,national and local goals. We need to go beyond making a worldof difference in the lives of a few hungry people to making a dif-ferent world – a world where the scourge of hunger is confinedto the annals of the past.
Lynn R Brown (World Bank)Chair, IAWG-FIVIMS
IAWG-FIVIMS membership
Bilateral aid and technical agenciesAustralian Agency for International Development (AusAID)Canadian International Development Agency (CIDA)EuropeAid Co-operation Office (EuropeAid)German Agency for Technical Cooperation (GTZ)
United Kingdom Department for International Development (DFID)United States Agency for International Development (USAID)United States Department of Agriculture (USDA)
United Nations and Bretton Woods agenciesFood and Agriculture Organization of the United Nations (FAO)International Fund for Agricultural Development (IFAD)International Labour Organization (ILO)United Nations Department of Economic and Social Affairs (UNDESA)Office for the Coordination of Humanitarian Affairs (OCHA)United Nations Development Programme (UNDP)United Nations Environment Programme (UNEP)United Nations Children’s Fund (UNICEF)United Nations Population Fund (UNFPA)World Bank (WB)World Food Programme (WFP)
World Health Organization (WHO)World Meteorological Organization (WMO)United Nations System Standing Committee on Nutrition (SCN)
International agricultural research organizationsConsultative Group on International Agricultural Research (CGIAR)International Food Policy Research Institute (IFPRI)International Service for National Agricultural Research (ISNAR)International Center for Tropical Agriculture (CIAT)
International non-governmental organizationsHelen Keller International (HKI)The Rockefeller FoundationSave the Children Fund UK (SCFUK)World Resources Institute (WRI)
Regional organizations
Southern African Development Community (SADC)Permanent Interstate Committee for Drought Control in the Sahel (CILSS)

8/8/2019 Food Security and MDG
http://slidepdf.com/reader/full/food-security-and-mdg 5/43The State of Food Insecurity in the World 2004 3
Contents
4 Foreword
Towards the World Food Summit target: confronting the
crippling costs of hunger
6 Undernourishment around the world
6 Counting the hungry: latest estimates
8 The human costs of hunger: millions of lives destroyed by
death and disability
11 The economic costs of hunger: billions in lost productivity,
earnings and consumption
14 Measuring hunger: improving estimates to target more
effective action
16 Hunger hotspots
18 Special feature
18 Globalization, urbanization and changing food systems
in developing countries
20 The impact of changing food systems on small farmers in developing countries
22 The changing profile of hunger and malnutrition
24 Towards the Summit commitments
24 Acting to combat hunger
26 Factoring the resilience of food systems and communities
into the response to protracted crises
28 Education for rural people and food security
30 Rice and food security
32 The way ahead: scaling up action to scale down hunger
34 Tables
40 Sources

8/8/2019 Food Security and MDG
http://slidepdf.com/reader/full/food-security-and-mdg 6/43The State of Food Insecurity in the World 2004
Foreword
Towards the World Food Summit target:confronting the crippling costs of hunger
As we approach the mid-termreview of progress towards theWorld Food Summit (WFS) goal,
FAO’s latest report on the state of foodinsecurity in the world highlights threeirrefutable facts and three inescapable
conclusions:Fact number one: to date, efforts to
reduce chronic hunger in the developingworld have fallen far short of the pacerequired to cut the number of hungrypeople by half no later than the year2015 (see graph). We must do better.
Fact number two: despite slow andfaltering progress on a global scale, nu-merous countries in all regions of thedeveloping world have proven that suc-cess is possible. More than 30 countries,
with a total population of over 2.2 billionpeople, have reduced the prevalence ofundernourishment by 25 percent andhave made significant progress towardsreducing the number of hungry people byhalf by the year 2015. We can do better.
Fact number three: the costs of nottaking immediate and strenuous actionto reduce hunger at comparable ratesworldwide are staggering. This is thecentral message I would like to conveyto readers of this report. Every yearthat hunger continues at present levels
costs more than 5 million children theirlives and costs developing countries bil-lions of dollars in lost productivity andearnings. The costs of interventions thatcould sharply reduce hunger are trivialin comparison. We cannot afford not todo better.
We MUST do better
According to FAO’s latest estimates thenumber of hungry people in the develop-
ing world has declined by only 9 millionsince the WFS baseline period, despitecommitments made. More alarming
still, the number has actually increasedover the most recent five years for whichnumbers are available. In three of thefour developing regions, more peoplewere undernourished in 2000–2002 thanhad been the case in 1995–1997. Only
Latin America and the Caribbean regis-tered a modest reduction in the numberof hungry people.
We CAN do better
More than 30 countries, representingnearly half the population of the devel-oping world, have provided both proofthat rapid progress is possible andlessons in how that progress can beachieved.
This successful group of countries isstriking for several reasons. Every de-veloping region is represented, not onlythose whose rapid economic growthhas been widely touted. Asia accountsfor by far the largest drop in the numberof hungry people. But sub-SaharanAfrica boasts the most countries thathave brought the prevalence of hungerdown by 25 percent or more, althoughoften from very high levels at the outset.
Among the African countries areseveral that demonstrate another key
lesson – that war and civil conflict mustbe regarded as major causes not onlyof short-term food emergencies butof widespread chronic hunger. Severalcountries that have recently emergedfrom the nightmare of conflict figureprominently among those that haveregistered steady progress since theWFS as well as those that have scoredrapid gains over the past five years.
Many of the countries that haveachieved rapid progress in reducing
hunger have something else in common– significantly better than average ag-ricultural growth. Within the group of
more than 30 countries that are on trackto reach the WFS goal, agricultural GDPincreased at an average annual rate of3.2 percent, almost one full percent-age point faster than for the developingcountries as a whole.
Several of these countries havealso led the way in implementing atwin-track strategy to attack hunger– strengthening social safety nets to putfood on the tables of those who need itmost on the one hand, while attackingthe root causes of hunger with initiativesto stimulate food production, increaseemployability and reduce poverty onthe other.
In certain cases, as Brazil’s ZeroHunger Programme has demonstrated
by buying food for school lunch pro-grammes and other food safety netsfrom local small and medium-sizedfarms, the two tracks can be broughttogether in a virtuous circle of betterdiets, increased food availability, risingincomes and improved food security.
We cannot afford not to do better
In moral terms, just stating the factthat one child dies every five secondsas a result of hunger and malnutrition
should be enough to prove that we can-not afford to allow the scourge of hun-ger to continue. Case closed.
In economic terms the case is morecomplex but no less cogent. Every childwhose physical and mental develop-ment is stunted by hunger and mal-nutrition stands to lose 5 to 10 percentin lifetime earnings. On a global scale,every year that hunger persists at cur-rent levels causes deaths and disabilitythat will cost developing countries future
productivity with a present discountedvalue of US$500 billion or more.
This crushing economic burden is

8/8/2019 Food Security and MDG
http://slidepdf.com/reader/full/food-security-and-mdg 7/43The State of Food Insecurity in the World 2004 5
borne by those who can afford it least,by people struggling to eke out a livingon less than a dollar a day, by countrieswhose economies and developmentefforts are slowed or stalled by lack ofproductivity and resources.
Studies by the Academy for Educa-tional Development cited in this reportsuggest that 15 countries in Africa andLatin America could reduce protein-energy malnutrition by half betweennow and 2015 at a cost of just US$25million per year. Over a ten-year period,that investment would pay for targetedinterventions that would save the livesof almost 900 000 children and yieldlong-term gains in productivity worthmore than US$1 billion.
FAO’s own estimates of the costsand benefits of action to acceler-ate progress towards the WFS goalsuggest that US$24 billion a year inpublic investment, associated with ad-ditional private investment, would leadto a boost in annual GDP amounting toUS$120 billion as a result of longer andhealthier lives.
Simply stated, the question is notwhether we can afford to take the urgentand immediate action needed to reachand surpass the WFS goal. The question
is whether we can afford not to. And theanswer is an emphatic, resounding no.
The hungry cannot wait. And neithercan the rest of the human family.
Jacques DioufFAO Director-General
Costs – increasedpublic investment
Benefits –increased GDP
Estimated costs and benefits of increasedpublic investment required to accelerate thereduction of hunger and reach the WFS target,2002–2015
Payoff for progress
Source: FAO
US$ billions
0
500
1 000
1 500
2 000
Number of undernourished in more than 30countries that have made significant progresstowards the WFS target
Profile of progress
Source: FAO
Millions
Range around estimates forWFS baseline period
Range around 50% reductionfrom WFS baseline
Point estimates
200
150
100
50
0
500
300
400
350
250
450
1980 1990 2000 2010 2020
Number of undernourished in the developing world: observed and
projected ranges compared with the World Food Summit target
Source: FAO
700
900 900
800
700
600
500
400
800
600
500
400
300300
1 000 1 000
Millions Millions
19701965 19801975 1985 1990 1995 2000 2005 2010 2015 2020
On track
Range around the point estimatesreported at the WFS
Range for the year of the WFS (1996)
WFS target
Point estimates prepared in 2004

8/8/2019 Food Security and MDG
http://slidepdf.com/reader/full/food-security-and-mdg 8/43The State of Food Insecurity in the World 2004
FAO estimates that 852 millionpeople worldwide were under-nourished in 2000–2002. This fig-
ure includes 815 million in developingcountries, 28 million in the countries intransition and 9 million in the industri-
alized countries.The number of undernourished peo-
ple in developing countries decreasedby only 9 million during the decadefollowing the World Food Summit base-line period of 1990–1992. During thesecond half of the decade, the numberof chronically hungry in developingcountries increased at a rate of almost4 million per year, wiping out two thirdsof the reduction of 27 million achievedduring the previous five years.
The reversal during the second halfof the decade resulted mainly fromchanges in China and India. China hadregistered dramatic progress duringthe first half of the decade, reducing thenumber of undernourished by almost 50million. During the same period, Indiapared the number of undernourished by13 million. Gains in these two countriesdrove the global totals down, despitethe fact that the number of under-nourished in the rest of the developing
world increased by 34 million. Duringthe second half of the decade, however,progress slowed in China, where the
number of undernourished fell by only4 million. In India the number increasedby 18 million.
The news is not all bad, however. Justas gains in China and India outweighedsetbacks elsewhere during the firsthalf of the decade, the slowdown in thetwo Asian giants masked significantimprovements in trends for the rest ofthe developing world. After climbing ata rate of almost 7 million per year, thenumber of undernourished in develop-
ing countries other than China and Indiaessentially held steady during the sec-ond half of the decade. And the propor-
tion of people who were undernourisheddeclined from 20 percent to 18 percent.Encouragingly, the most pronounced
change in trends took place in sub- Saharan Africa. Between 1995–1997 and2000–2002, the rate of increase in thenumber of undernourished slowed from5 million per year to 1 million per year.And the proportion of undernourishedin the region fell from 36 percent, whereit had hovered since 1990-1992, to 33percent.
Undernourishment around the world
Counting the hungry: latest estimates
M e x i c o
K u w a i t
A l g e r i a
I n
d o n e s i a
M
y a n m a r
G a b o n
M
a u r i t i u s
M
o r o c c o
J o r d a n
B r a z i l
N i g e r i a
J a m a i c a
G u y a n a
M a
u r i t a n i a
C h i n a
E l S
a l v a d o r
S u r i n a m e
T r i n i d a d a n d
T o b a g o
L e s o t h o
C o l o m b i a
P e r u
G h a n a
P a r a g u a y
C ô t e
d ’ I v o i r e
B e n i n
N e p a l
V e
n e z u e l a
V
i e t N a m
U g a n d a
S w
a z i l a n d
B u r k i n a F a s o
T u n i s i a
L i b y a n A r a b J a m
a h i r i y a
R e p . o
f K o r e a
A r
g e n t i n a
U n i t e d A r a b E m i r a t e s
M
a l a y s i a
C u b a
L
e b a n o n
T u r k e y
C o s t a R i c a
C h i l e
E
c u a d o r
U
r u g u a y
I r a n ,
I s l a m i c
R e p .
o f
S a u d i A r a b i a
E g y p t
S y r i a n A r
a b R e p .
2.5–4%undernourished
5–19%undernourished
Proportions of undernourished in developing countries, 1990–1992 and 2000–2002
The graph does not show four countries for which there were insufficient data
for the years 2000–2002: Afghanistan, Iraq, Papua New Guinea and Somalia
< 2.5%undernourished
80
60
40
20
0%
Undernourishment in the countries in transition
The number of undernourished in the
countries in transition has risen from 23
million to 28 million since the break-up of
the former Soviet Union, Czechoslovakiaand Yugoslavia in 1991–1993. Most of the
increase and the bulk of undernourished
are in the countries of the Commonwealth
of Independent States (CIS), where the
proportion has increased from 7 percent to
9 percent.
1993–19952000–2002
CIS
BalticStates
EasternEurope
0 2 4 6 8 10% undernourished
Undernourished in the countries in
transition
Source: FAO

8/8/2019 Food Security and MDG
http://slidepdf.com/reader/full/food-security-and-mdg 9/43The State of Food Insecurity in the World 2004 7
* 1993–1995 for countries in transition Source: FAO
Countries intransition
Near East/North Africa
Latin America/Caribbean
Asia/Pacific
Sub-SaharanAfrica
0 10 20 30 40% undernourished
D e m .
P e o p l e ’ s R e p . o f K o r e a
Y e m e n
R w a n d a
M a d
a g a s c a r
C o n g o
A n g o l a
C e n t r a l A f r i c
a n R e p .
U n i t e d R e p .
o f T
a n z a n i a
Z i m b a b w e
L i b e r i a
H a i t i
E
t h i o p i a *
M o z a
m b i q u e
Z a m b i a
S i e r r
a L e o n e
B u r u n d i
D e m .
R e p .
o f t h e C o n g o
E r i t r e a *
T
h a i l a n d
P
a k i s t a n
I n d i a
B o l i v i a
L a o P e o p l e ’ s D e
m .
R e p .
P h i l i p p i n e s
S r i L a n k a
N a m i b i a
H o n d u r a s
G u a t e m a l a
S e n e g a l
D o m i n i c
a n R e p .
P a n a m a
C a
m e r o o n
G u i n e a
T o g o
S u d a n
G a m b i a
M
o n g o l i a
N i c a r a g u a
M a l i
B a n
g l a d e s h
B o t s w a n a
C a
m b o d i a
K e n y a
M a l a w i
C h a d
N i g e r
Source: FAO
S o u r c e : F A O
Proportion undernourished by
region
Changes in numbers of undernourished in developing subregions
80
60
40
20
0%
20–34%undernourished
35%undernourished
Grey bars: 1990–1992 Coloured bars: 2000–2002 Countries grouped by prevalence of undernourishment in 2000–2002
* Ethiopia and Eritrea were not separate entities in 1990–1992
Changes in proportion of undernourished in developing subregions
1990–1992 to 1995–1997 (percentage points)
ChinaIndia
Southeast AsiaWest Africa
South AmericaSouthern Africa
East AfricaNorth Africa
North AmericaOther South AsiaCentral America
CaribbeanNear East
Other East AsiaCentral Africa
–5 0 5 10 15 20
Reduction(progress)
Increase(setback)
1995–1997 to 2000–2002 (percentage points)
-10 –5 0 5Source: FAO
Undernourished 2000–2002(millions)
Countries intransition 28
Near East/
North Africa 39
Latin America/Caribbean 53
Sub-SaharanAfrica 204
Industrializedcountries 9
India221
China142
Asia/Pacific*156
Developingcountries: 815WORLD: 852
1990–1992 to 1995–1997 (millions)
ChinaIndia
Southeast AsiaSouth America
West AfricaNorth Africa
North AmericaCentral America
CaribbeanSouthern AfricaOther East Asia
Other South AsiaNear EastEast Africa
Central Africa
–50 –40 –30 –20 –10 0 10 20
Reduction(progress)
Increase(setback)
–10 0 10 20
1995–1997 to 2000–2002 (millions)
1990–1992*2000–2002
* excl. China and India Source: FAO

8/8/2019 Food Security and MDG
http://slidepdf.com/reader/full/food-security-and-mdg 10/43The State of Food Insecurity in the World 2004
Hunger and malnutrition inflictheavy costs on individuals andhouseholds, communities and
nations. Undernourishment and defi-ciencies in essential vitamins and min-erals cost more than 5 million children
their lives every year, cost householdsin the developing world more than 220million years of productive life fromfamily members whose lives are cutshort or impaired by disabilities relatedto malnutrition, and cost developingcountries billions of dollars in lost pro-ductivity and consumption.
The vicious cycle of deprivation
Every year, more than 20 million low
birthweight (LBW) babies are born inthe developing world. In some coun-tries, including India and Bangladesh,more than 30 percent of all children areborn underweight.
From the moment of birth, the scales
are tipped against them. LBW babiesface increased risk of dying in infancy,of stunted physical and cognitive growthduring childhood, of reduced workingcapacity and earnings as adults and, iffemale, of giving birth to LBW babies
themselves (see diagram).Compared with normal babies, the
risk of neonatal death is four timeshigher for infants who weigh less than2.5 kilograms at birth and 18 timeshigher for those who weigh less than 2.0kilograms. LBW babies also suffer sig-nificantly higher rates of malnutritionand stunting later in childhood and asadults. A study in Guatemala found thatby the time they reached adolescenceLBW boys were 6.3 centimetres shorter
and 3.8 kilograms lighter than normal,while girls lost 3.8 centimetres in heightand 5.6 kilograms in weight.
Almost one third of all children indeveloping countries are stunted, withheights that fall far enough below the
normal range for their age to signalchronic undernutrition. Stunting, likeLBW, has been linked to increased ill-ness and death, to reduced cognitiveability and school attendance in child-hood and to lower productivity and life-
time earnings in adults.When stunting occurs during the
first five years of life, the damage tophysical and cognitive development isusually irreversible (see graph). Thecosts in blighted health and opportu-nities extend not only throughout thevictim’s lifetime but on to the next gen-eration, as malnourished mothers givebirth to LBW babies. Maternal stuntingis one of the strongest predictors forgiving birth to a low birthweight infant,
along with underweight and low weightgain during pregnancy.Undernourishment and stunting fre-
quently overlap with vitamin and min-eral deficiencies that afflict nearly 2billion people worldwide. Even when
Undernourishment around the world
The human costs of hunger: millions of livesdestroyed by death and disability
Impact of hunger and malnutrition throughout the life cycle
Highermortality rate Impaired mental
development Increased riskof adult chronicdisease
Untimely/inadequateweaning
Frequentinfection
Inadequatefood, healthand care
Reducedmentalcapacity
Inadequatefood, healthand care
Reduced physical capacityand fat-free mass
Inadequate food,health and care
Higher maternalmortality
Inadequatefood, health
and care
Inadequatecatch-up
growthInadequatefoetalnutrition
BABYlow
birthweight
CHILDstunted
ADOLESCENTstunted
PREGNANCYlow weight
gain
OLDER PEOPLEmalnourished
WOMANmalnourished
Reduced capacityto care for child
Source: Seres, ACC/SCN Source: Martorell, Khan and Schroeder
Persistence of stunting fromchildhood into adulthood
Stunting at age fiveMild Moderate Severe
0
-5
-10
-15
-20
-25
GuatemalaMaleFemale
IndiaMaleFemale
C e n t i m e t r e s b e l o w n o r m a l a t a g e 1 8

8/8/2019 Food Security and MDG
http://slidepdf.com/reader/full/food-security-and-mdg 11/43
8/8/2019 Food Security and MDG
http://slidepdf.com/reader/full/food-security-and-mdg 12/43The State of Food Insecurity in the World 2004
by diarrhoea, pneumonia and malaria inhigh-mortality developing countries canbe attributed to underweight. When theimpact of micronutrient deficiencies isadded, the proportion of DALYs fromthese diseases attributable to malnutri-
tion rises to between 60 and 80 percent(see graph).
As might be expected, underweightand micronutrient deficiencies ranklower as risk factors for death and dis-ability in more advanced developingcountries with lower mortality rates.But nutrition-related conditions still
dominate the list of risk factors. Amonglow-mortality developing countries – agroup that includes China, several othercountries in Asia and most of SouthAmerica – underweight and iron defi-ciency remain among the top ten risk
factors. They are joined on the list byoverweight and a number of other diet-related risks that contribute to non-communicable chronic diseases such asischaemic heart disease, high bloodpressure and diabetes.
These chronic diseases are generallyassociated not with hunger but with
overnutrition. A growing body of evi-dence suggests, however, that low birth-weight and undernutrition early in lifeincrease the risk of obesity and diet-related diseases in adulthood (see alsopage 23). In China, more than 30 per-
cent of diabetes and around 10 percentof both strokes and coronary heartdisease are estimated to be caused bychildhood undernutrition (see graph).
Overall, not including their contribu-tion to adult chronic diseases, child-hood and maternal undernutrition areestimated to cost more than 220 millionDALYs in developing countries. Whenother nutrition-related risk factors aretaken into account, the toll rises to al-most 340 million DALYs, fully one half of
all DALYs in the developing world.That total represents a loss of pro-ductivity equivalent to having a disasterkill or disable the entire population of acountry larger than the United Statesof America. It also highlights the im-measurable suffering that the ongoingdisaster of world hunger inflicts onmillions of households and the crush-ing economic burden it imposes oncountries throughout the developingworld.
Chronic diseases and childhood
undernutrition, China and Sri
Lanka
Coronaryheart
disease
Diabetes
Stroke
0 10 20 30 40 % of chronic disease due to
childhood undernutrition
Source: Popkin, Horton and KimSource: WHO
Nutritional risk factors for childhood and childbirth in developing countries
with high mortality rates, 2000
Diarrhoeal diseases
Lower respiratory infections
Malaria
Measles
Maternal mortality
0 20 40 60 80 100% of DALYs attributable to malnutrition
Source: WHO
Global DALYs attributed to nutrition-related risk factors, 2000
Underweight (1, 1*)
Unsafe water/sanitation** (6, 3)
Iron deficiency (9, 6)
Overweight (10)
Zinc deficiency (11, 5)
Low fruit/vegetable intake (12)
Vitamin A deficiency (13, 7)
Physical inactivity (14)
0 30 60 90 120 150Attributable DALYs (millions)
Developing countries with high mortalityDeveloping countries with low mortalityDeveloped countries
* rank among risk factors worldwide and indeveloping countries with high mortality** includes inadequate hygiene
UnderweightVitamin A deficiencyZinc deficiencyIron deficiency
ChinaSri Lanka
Undernourishment around the world

8/8/2019 Food Security and MDG
http://slidepdf.com/reader/full/food-security-and-mdg 13/43The State of Food Insecurity in the World 2004 11
Estimating the millions of humanlives cut short or scarred by dis-ability leaves no doubt that hun-
ger is morally unacceptable. Calcu-lating the value of lost productivity indollars suggests that allowing hunger
to persist is simply unaffordable, notonly to the victims themselves but tothe economic development and pros-perity of the nations in which they live.
The costs of hunger to society comein several distinct forms. Perhaps themost obvious are the direct costs ofdealing with the damage it causes.These include the medical costs oftreating both the problem pregnanciesand deliveries of anaemic, underweightmothers and the severe and frequent
illnesses of children whose lives arethreatened by malaria, pneumonia, di-arrhoea or measles because their bod-ies and immune systems have beenweakened by hunger.
A very rough estimate, apportioningmedical expenditures in developingcountries based on the proportion ofdisability-adjusted life years ( DALYs)attributed to child and maternal under-
nutrition, suggests that these directcosts add up to around US$30 billionper year – over five times the amountcommitted so far to the Global Fund toFight AIDS, Tuberculosis and Malaria.
These direct costs are dwarfed by
the indirect costs of lost productivityand income caused by premature death,disability, absenteeism and lower edu-cational and occupational opportunities.Provisional estimates suggest thatthese indirect costs range into the hun-dreds of billions of dollars.
Both the direct and indirect costsrepresent the price of complacency,of allowing widespread hunger topersist. Both are unacceptably high,not only in absolute terms but in com-
parison with estimates of a third typeof costs – the costs of interventionsthat could be taken to prevent andeliminate hunger and malnutrition.Numerous studies suggest that everydollar invested in well-targeted inter-ventions to reduce undernourishmentand micronutrient deficiencies canyield from five times to over 20 timesas much in benefits.
Lifetime costs of childhood hunger
Estimates of the indirect costs of hungerare generally based on studies that havemeasured the impact of specific formsof malnutrition on physical and mental
development and have established cor-relations with reduced productivity andearnings (see chart). These studies haveshown, for example, that: Stunted adults are less productive
and earn lower wages in manuallabour. Low birthweight (LBW) andprotein-energy malnutrition (PEM)cause stunting. Every year of missed schooling duringchildhood cuts deeply into lifetimeearnings. LBW, stunting and micro-
nutrient deficiencies have all beenassociated with reduced school atten-dance. One study that closely moni-tored children affected by a droughtin Zimbabwe found that malnutritionduring critical months of developmentcost children an average of 4.6 cen-timetres in stature and almost a yearin the classroom. Those seeminglysmall losses in height and educationtranslated into estimated losses of 12percent in lifetime earnings. Reduced cognitive ability, measur-
able in lower scores on IQ tests, leadsto reduced productivity and earnings.Iodine deficiency, which affects anestimated 13 percent of the world’spopulation, has been associated withlosses of 10 to 15 points on IQ testsand 10 percent in productivity.
Combining these findings with availabledata on the prevalence of various formsof malnutrition in populations makesit possible to construct provisional esti-mates of the costs of hunger on national
and global scales.A thorough review of the available
evidence, for example, indicates that
The economic costs of hunger: billions in lostproductivity, earnings and consumption
Source: Alderman and Behrman; Horton and Ross; Horton
Impact of various forms of malnutrition on productivity and lifetime earnings
Form of malnutrition
Low birthweight(LBW)
Protein-energymalnutrition (PEM)
Iodine deficiency
Iron deficiency
0 5 10 15 20
with moderatestunting
with severestunting
heavy manual labourlight manual labour
Estimated loss of productivity or earnings (%)
Losses associated withimpact on:
productivity in manuallabourcognitive development
8/8/2019 Food Security and MDG
http://slidepdf.com/reader/full/food-security-and-mdg 14/43The State of Food Insecurity in the World 2004
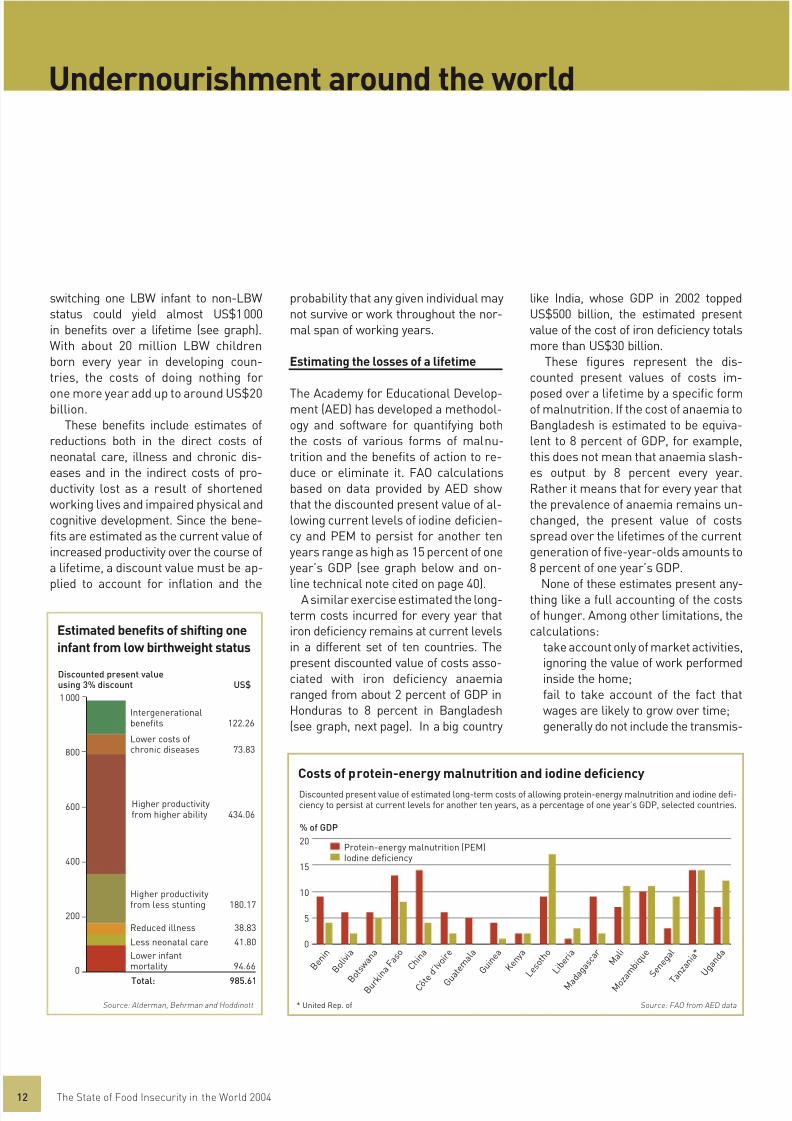
switching one LBW infant to non-LBWstatus could yield almost US$1 000in benefits over a lifetime (see graph).With about 20 million LBW childrenborn every year in developing coun-tries, the costs of doing nothing for
one more year add up to around US$20billion.
These benefits include estimates ofreductions both in the direct costs ofneonatal care, illness and chronic dis-eases and in the indirect costs of pro-ductivity lost as a result of shortenedworking lives and impaired physical andcognitive development. Since the bene-fits are estimated as the current value ofincreased productivity over the course ofa lifetime, a discount value must be ap-
plied to account for inflation and the
probability that any given individual maynot survive or work throughout the nor-mal span of working years.
Estimating the losses of a lifetime
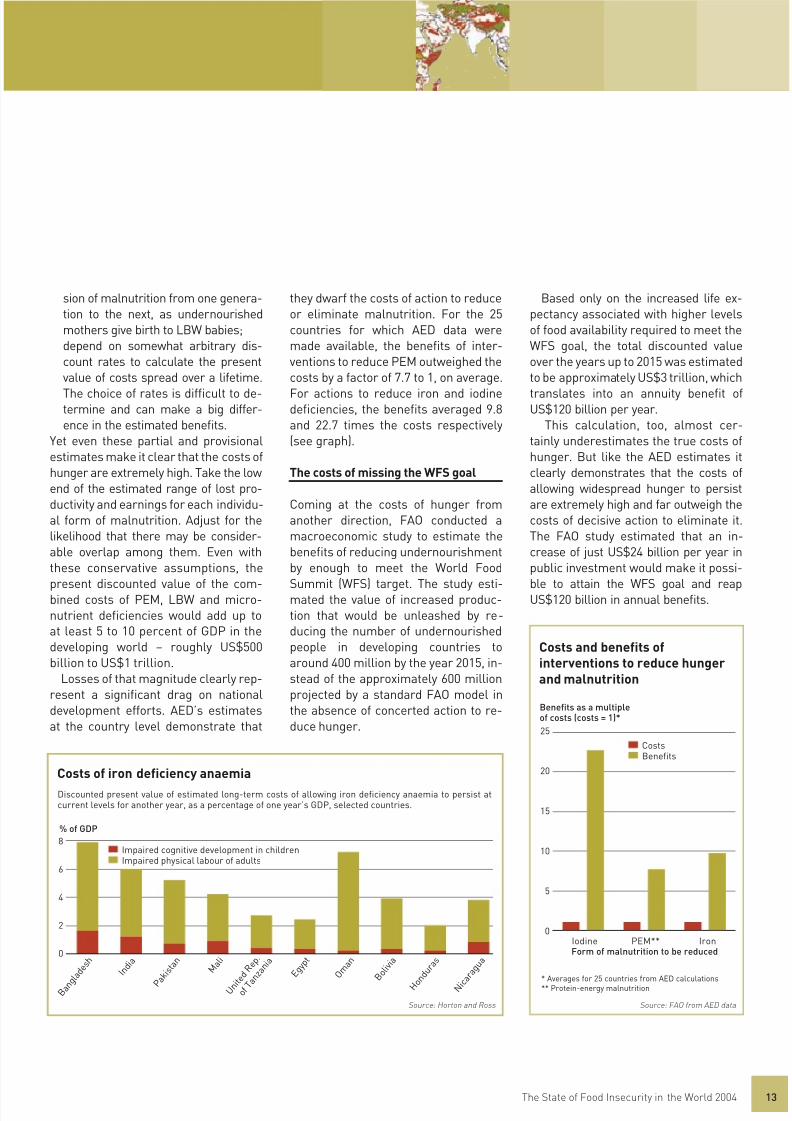
The Academy for Educational Develop-ment (AED) has developed a methodol-ogy and software for quantifying boththe costs of various forms of malnu-trition and the benefits of action to re-duce or eliminate it. FAO calculationsbased on data provided by AED showthat the discounted present value of al-lowing current levels of iodine deficien-cy and PEM to persist for another tenyears range as high as 15 percent of oneyear’s GDP (see graph below and on-
line technical note cited on page 40).A similar exercise estimated the long-term costs incurred for every year thatiron deficiency remains at current levelsin a different set of ten countries. Thepresent discounted value of costs asso-ciated with iron deficiency anaemiaranged from about 2 percent of GDP inHonduras to 8 percent in Bangladesh(see graph, next page). In a big country
like India, whose GDP in 2002 toppedUS$500 billion, the estimated presentvalue of the cost of iron deficiency totalsmore than US$30 billion.
These figures represent the dis-counted present values of costs im-
posed over a lifetime by a specific formof malnutrition. If the cost of anaemia toBangladesh is estimated to be equiva-lent to 8 percent of GDP, for example,this does not mean that anaemia slash-es output by 8 percent every year.Rather it means that for every year thatthe prevalence of anaemia remains un-changed, the present value of costsspread over the lifetimes of the currentgeneration of five-year-olds amounts to8 percent of one year’s GDP.
None of these estimates present any-thing like a full accounting of the costsof hunger. Among other limitations, thecalculations:
take account only of market activities,ignoring the value of work performedinside the home;fail to take account of the fact thatwages are likely to grow over time;generally do not include the transmis-
Costs of protein-energy malnutrition and iodine deficiency
20
15
10
5
0
* United Rep. of Source: FAO from AED data
B e n i n
B o l i v i a
B o t s w a n a
B u r k i n a F a s o
C h i n a
C ô t e
d ’ I v o i r e
G u a t e m a l a
G u i n e a
K e n y a
L e s o t h o
L i b e r i a
M a d
a g a s c a r
M a l i
M o z a m b i q u e
S e n e g a l
T a n z a n i a *
U g a n d a
Protein-energy malnutrition (PEM)Iodine deficiency
% of GDP
Undernourishment around the world
Source: Alderman, Behrman and Hoddinott
Estimated benefits of shifting one
infant from low birthweight status
Lower infantmortality 94.66
Lower costs ofchronic diseases 73.83
Higher productivityfrom higher ability 434.06
Higher productivityfrom less stunting 180.17
Less neonatal care 41.80
Intergenerationalbenefits 122.26
Reduced illness 38.83
Total: 985.61
1 000
800
600
400
200
0
Discounted present valueusing 3% discount US$
Discounted present value of estimated long-term costs of allowing protein-energy malnutrition and iodine defi-ciency to persist at current levels for another ten years, as a percentage of one year’s GDP, selected countries.
8/8/2019 Food Security and MDG
http://slidepdf.com/reader/full/food-security-and-mdg 15/43The State of Food Insecurity in the World 2004 13
sion of malnutrition from one genera-tion to the next, as undernourishedmothers give birth to LBW babies;depend on somewhat arbitrary dis-count rates to calculate the presentvalue of costs spread over a lifetime.
The choice of rates is difficult to de-termine and can make a big differ-ence in the estimated benefits.
Yet even these partial and provisionalestimates make it clear that the costs ofhunger are extremely high. Take the lowend of the estimated range of lost pro-ductivity and earnings for each individu-al form of malnutrition. Adjust for thelikelihood that there may be consider-able overlap among them. Even withthese conservative assumptions, the
present discounted value of the com-bined costs of PEM, LBW and micro-nutrient deficiencies would add up toat least 5 to 10 percent of GDP in thedeveloping world – roughly US$500billion to US$1 trillion.
Losses of that magnitude clearly rep-resent a significant drag on nationaldevelopment efforts. AED’s estimatesat the country level demonstrate that
they dwarf the costs of action to reduceor eliminate malnutrition. For the 25countries for which AED data weremade available, the benefits of inter-ventions to reduce PEM outweighed thecosts by a factor of 7.7 to 1, on average.
For actions to reduce iron and iodinedeficiencies, the benefits averaged 9.8and 22.7 times the costs respectively(see graph).
The costs of missing the WFS goal
Coming at the costs of hunger fromanother direction, FAO conducted amacroeconomic study to estimate thebenefits of reducing undernourishmentby enough to meet the World Food
Summit (WFS) target. The study esti-mated the value of increased produc-tion that would be unleashed by re-ducing the number of undernourishedpeople in developing countries toaround 400 million by the year 2015, in-stead of the approximately 600 millionprojected by a standard FAO model inthe absence of concerted action to re-duce hunger.
Based only on the increased life ex-pectancy associated with higher levelsof food availability required to meet theWFS goal, the total discounted valueover the years up to 2015 was estimatedto be approximately US$3 trillion, which
translates into an annuity benefit ofUS$120 billion per year.
This calculation, too, almost cer-tainly underestimates the true costs ofhunger. But like the AED estimates itclearly demonstrates that the costs ofallowing widespread hunger to persistare extremely high and far outweigh thecosts of decisive action to eliminate it.The FAO study estimated that an in-crease of just US$24 billion per year inpublic investment would make it possi-
ble to attain the WFS goal and reapUS$120 billion in annual benefits.
Source: Horton and Ross
Costs of iron deficiency anaemia
Impaired cognitive development in childrenImpaired physical labour of adults
B a n g l a d e s h
I n d i a
P a k i s t a n
M a l i
U n i t e d R e p .
o f T a n
z a n i a
E g y p t
O m a n
B
o l i v i a
H o n d u r a s
N i c a r a g u a
% of GDP
Discounted present value of estimated long-term costs of allowing iron deficiency anaemia to persist atcurrent levels for another year, as a percentage of one year’s GDP, selected countries.
8
6
4
2
0
Source: FAO from AED data
Costs and benefits ofinterventions to reduce hungerand malnutrition
25
20
15
10
5
0Iodine PEM** IronForm of malnutrition to be reduced
Benefits as a multipleof costs (costs = 1)*
* Averages for 25 countries from AED calculations** Protein-energy malnutrition
CostsBenefits

8/8/2019 Food Security and MDG
http://slidepdf.com/reader/full/food-security-and-mdg 16/43The State of Food Insecurity in the World 2004
FAO’s estimates of the number ofundernourished people in theworld are the most closely fol-
lowed and widely cited element of The
State of Food Insecurity in the World.News reports invariably headline the
latest figures as a gauge of progresstowards the targets set by the WorldFood Summit and the MillenniumDevelopment Goals – to reduce hungerby half by the year 2015.
Given the attention focused on theseannual estimates, it is not surprisingthat the methodology employed to cal-culate them has been subject to closescrutiny and debate. Experts within andoutside FAO have pointed out limita-tions in both the underlying data and
FAO’s methods of analysing them.In 2002, FAO hosted an InternationalScientific Symposium to review differ-ent methods of measuring food depri-vation and undernutrition and identifyways to improve FAO’s estimates. Sincethen, FAO has taken action both toimprove its own methodology and tovalidate alternative, complementaryapproaches.
Measuring food deprivation
FAO’s estimates are essentially a mea-sure of food deprivation based on calcu-lation of three key parameters for eachcountry: the average amount of foodavailable per person, the level of in-equality in access to that food and theminimum number of calories requiredfor an average person.
Average food availability comes from“food balance sheets” compiled by FAOevery year by tallying how much of eachfood commodity the country produces,
imports and withdraws from stocks,subtracting the amounts that were ex-ported, wasted, fed to livestock or used
for other non-food purposes, and divid-ing the caloric equivalent of all the foodavailable for human consumption by thetotal population to come up with an av-erage daily food intake or dietary energysupply (DES).
Data from household surveys areused to derive a “coefficient of varia-tion” to account for the degree of in-equality in access to food. Similarly,since a large adult needs almost twiceas many calories as a three-year-oldchild, the minimum requirement perperson for each country takes into ac-count its mix of age, gender and bodysizes. FAO reports the proportion of thepopulation whose daily food consump-tion falls below that minimum daily re-
quirement as undernourished.FAO’s method of estimating fooddeprivation offers several advantages.In particular, it relies on data that areavailable from most countries in moreor less the same form and can be up-dated regularly. This allows compari-sons across countries and over time.
But the FAO methodology also suffersfrom several obvious limitations. Forone thing, the estimates it producesare only as reliable and accurate as thedata used to calculate the food balance
sheets, levels of inequality and dailyenergy requirement cut-off points. Formany countries, the reliability of theunderlying food balance sheet data andmeasures of inequality is uncertain. Arelatively small variation in just one ofthese parameters can make a big dif-ference in a country’s estimated level ofhunger (see graph).
Furthermore, estimates based onnational production and trade figurescannot be used to pinpoint where hun-
ger has become increasingly concen-trated in specific geographic areas andsocio-economic groups.
Other approaches and dimensions
Many of the proposals to improve theFAO estimates put forward at the Sym-posium called for increased reliance ondata obtained from household budget
surveys. Such surveys, which are avail-able from an increasing number of de-veloping countries, provide data that canbe used to calculate two of the parame-ters used in FAO’s estimates – daily foodintake and the degree of inequality inaccess to food. They can also be used tomeasure other dimensions of hungerand food insecurity, including poor dietquality and vulnerability to food depriva-tion, and to monitor them over timewithin different areas and population
groups.Surveys also suffer from certainweaknesses. Data are not collectedregularly in all countries. Even wherethey are, the surveys are usually updat-ed only once every three to five yearsand the results are often not compara-ble across countries or even from one
Measuring hunger: improving estimatesto target more effective action
Source: FAO
Impact of mean food consumption
and inequality of access to food on
estimates of undernourishment
70
60
50
40
30
20
10
01 700 2 040 2 450 2 940
Mean food consumption (kcal/person/day)
% undernourished
Coefficient of variation for dietary energyconsumption distribution
Undernourishment around the world
0.20 0.24 0.29 0.35higher number = greater inequality

8/8/2019 Food Security and MDG
http://slidepdf.com/reader/full/food-security-and-mdg 17/43The State of Food Insecurity in the World 2004 15
survey to the next. This limits their val-ue for monitoring national and globaltrends annually.
Nutritional status can be impairednot only by lack of food but by frequentillness, poor sanitation and other condi-
tions that prevent people from gettingfull nutritional benefit from their food.FAO’s estimates of undernourishmentmeasure only food deprivation. Otherindicators, such as the proportion ofchildren who are stunted (short for theirage) or underweight capture all the di-mensions that affect nutritional status.Most countries regularly collect suchanthropometric data, though only everyfew years and only for children.
Although the prevalence of stunting or
underweight rarely matches the level ofundernourishment, the relative magni-tude and overall trends generally coin-cide (see graph). Anthropometric dataare extremely valuable for highlightingtrends and evaluating interventionsamong particularly vulnerable groups,such as children and pregnant women.
Strengthening monitoring efforts
Since the Symposium, FAO has workedwith more than 50 countries to improvetheir ability to apply FAO’s methodologyto measure food deprivation for specific
population groups. The mean of foodconsumption that is one of the keyparameters in FAO’s estimates can bederived either from national food bal-ance sheets or from household budgetsurveys. In calculating the estimatesgiven in this report, FAO relies on foodbalance sheets as the only way to obtainconsistent global and regional coverageon a regular basis. When it comes totargeting geographical areas or popula-tion groups within countries, however,
the FAO methodology can be appliedusing figures for both food consumptionand inequality of access taken fromhousehold survey data.
By taking this approach, countrieshave been able to use data collectedfrom household income and expendituresurveys to estimate levels of hunger
within particular geographical areas,such as urban and rural residentialareas or ecological zones, or amongsocio-economic groups, defined by suchthings as the level of household incomeor the main occupation and economic
activity (see graph).FAO estimates have always relied on
household budget survey data to derivea coefficient of variation for inequality inaccess to food. But they have applieda single coefficient across the entiretime series for each country, leading tocriticism that they fail to account forchanges in equality over time. Since theSymposium, FAO has responded to thisby conducting a review of trends in in -equality in developing countries. Results
show that inequality has decreased in28 of the 38 countries for which datafrom at least two reliable and compara-ble surveys were available. Once com-parable trend data become more widelyavailable they will be introduced intoFAO’s estimates of undernourishment.
The emerging expert consensus isthat no one indicator can capture allaspects of hunger and food insecurity.Instead, a variety of methods can pro-vide a suite of indicators that measurethe different dimensions of food insecu-
rity, both at the global level and withincountries.
Considerable progress has beenmade towards creating such a suite.FAO and the World Bank have workedtogether, for example, to build data setsthat integrate information on food depri-vation, income, food consumption andanthropometry. As more such effortsbear fruit, they will improve ability tomonitor progress towards achieving theWorld Food Summit target and Millen-
nium Development Goals and to tailorand focus actions urgently needed toaccelerate that progress.
Source: FAO; UNICEF
Regional trends in under-
nourishment and underweight,
1990–1992 to 2000–2002
%
1990 2000 1990 2000 1990 2000 1990 2000
Sub- Asia/ Latin NearSaharan Pacific America/ East/
Africa Caribbean NorthAfrica
40
30
20
10
0
Source: FAO
Undernourishment in urban and
rural China during the 1990s
% undernourished30
25
20
15
10
5
0Nationwide Urban Rural
UndernourishedChild underweight
Proportion of Distribution oftotal population undernourished
Urban Urban
Rural Rural
26% 43%
74% 57%

8/8/2019 Food Security and MDG
http://slidepdf.com/reader/full/food-security-and-mdg 18/43The State of Food Insecurity in the World 2004
Undernourishment around the world
Hunger hotspots
As of July 2004, 35 countries facedfood crises requiring emergencyassistance. Neither the number
of crises nor their locations differedmarkedly from the situation reportedin The State of Food Insecurity in the
World 2003. Most of the crises wereconcentrated in Africa and were causedby drought, conflict or a combination ofthe two (see map). Almost all had per-sisted over a prolonged period, with anaverage duration of nine years.
In East Africa alone, the food securityof over 13 million people was threatenedby a combination of erratic rains and theimpact of recent and ongoing conflicts.Escalating civil conflict in the Darfurregion of the Sudan uprooted more
than a million people from their homesand fields, precipitating a major crisis.Elsewhere in the subregion, recurrentdrought caused crop failures and heavylivestock losses in parts of Ethiopia,Eritrea, Somalia, Uganda and Kenya.
Trends in locations and causes
The number of food emergencies hasbeen rising over the past two decades,from an average of 15 per year duringthe 1980s to more than 30 per year
since the turn of the millennium. Mostof this increase has taken place inAfrica, where the average number offood emergencies each year has almosttripled (see graph).
The balance of causes of food emer-gencies has also shifted over time. Since1992, the proportion of emergenciesthat can be attributed mainly to humancauses, such as conflict or economicfailures, has more than doubled, risingfrom around 15 percent to more than 35
percent (see graph).In many cases, natural and human-induced factors reinforce each other.Such complex crises tend to be themost severe and prolonged. Between1986 and 2004, 18 countries were “incrisis” more than half of the time. Waror economic and social disruptionscaused or compounded the crises in all18 (see graph, facing page). These coun-tries also offer evidence that frequentand prolonged crises cause widespreadchronic undernourishment. FAO’s lat-
est estimates list 13 of the 18 countriesamong those where more than 35 per-cent of the population goes hungry.
Monitoring hunger “hotspots”
In order to identify and monitor potentialhunger “hotspots”, both the specifics oflocations and the complexities of causesof food emergencies must be taken intoaccount. Tracking weather conditionsand crop prospects in regions regu-
larly buffeted by monsoons, droughtsand other recurring weather patternsis relatively straightforward. The task
Food emergencies and their causes, 2003–2004
Source: FAO
Conflict (13)
Past conflict (6)
Economic problems (2)
Refugees (1)
Mainly human-induced (22) Mainly natural (18)
Weather (mainly
drought,18)
Note: stripes indicate a
combination of causes
Food emergencies by region
1986–1990
1991–1995
1996–2000
2001–2004
0 5 10 15 20 25 30 35Average number of food emergencies
Sub-SaharanAfrica
Asia/PacificEurope
Latin America/Caribbean
Near East/North Africa
Source: FAO Source: FAO
Primary causes of food crises
1986–1991
1992–2004
0 20 40 60 80 100% of crises
Human-induced (mainly conflict)
Natural (mainly drought)Mixed
Primary cause

8/8/2019 Food Security and MDG
http://slidepdf.com/reader/full/food-security-and-mdg 19/43The State of Food Insecurity in the World 2004 17
of identifying potential human-inducedand complex emergencies is muchmore difficult, requiring an ongoingassessment of many different environ-mental, economic, social and politicalindicators. Once a food emergency has
been identified, monitoring can providethe information needed to tailor effec-tive relief and rehabilitation measures.
Many countries that are plaguedby unfavourable weather but enjoyrelatively stable economies and govern-ments have implemented crisis preven-tion and mitigation programmes andestablished effective channels for reliefand rehabilitation efforts. But when acountry has also been battered by con-flict or economic collapse, programmes
and infrastructure for prevention, reliefand rehabilitation are usually disruptedor destroyed.
As the continent with the highestnumber and proportion of countries fac-ing food crises, Africa provides a goodillustration, especially if one analyses
differences among the continent’s sub-regions.
East Africa, for example, not onlyexperienced several of the most severecrises during 2003–2004 but includessix countries that have been in crisis
more than half the time since 1986.The subregion suffers from frequentdroughts and occasional torrential rainsand floods. But the East African coun-tries that have suffered the most dev-astating and persistent crises are thosethat have been stricken by conflict. Thehumanitarian crisis in Darfur, for exam-ple, engulfed an area that had generallyenjoyed good rains and crops. The crisiswas triggered by conflict that drove anestimated 1.2 million people from their
homes and prevented them from tend-ing their fields and herds.The Sudan and other East African
countries are less vulnerable to weatherconditions than the neighbouring Sahel,where the single annual growing seasonreceives an average of only 575 milli-
metres of rainfall in good years and isplagued with frequent droughts.
Sahel countries have been relativelyfree of conflict, however. And after aseries of devastating droughts, theyhave integrated the unpredictability and
volatility of weather conditions into theiragricultural and trade policies and farm-ing systems. As a result, these countriestend to fall into crisis less often thancountries elsewhere on the continent.When crises do occur they tend to beless severe and far shorter. Since themid-1980s, the longest emergenciesin the Sahel lasted an average of oneyear. In East Africa, the average wasmore than 11 years (see graph).
Taking account of such differences
in underlying causes of hunger andpoverty and in countries’ vulnerability tonatural disasters and human-inducedcrises is essential both for monitor-ing potential hunger hotspots and forresponding effectively when crises doerupt.
Frequency and primary causes of chronic food emergency, 1986–2004
Angola
Ethiopia
SomaliaSudan
MozambiqueAfghanistan
HaitiLiberia
Sierra LeoneIraq
MongoliaDem. Rep. of the Congo
BurundiEritrea
Tajikistan
RwandaGeorgia
Armenia
Countries in crisis more than 50% of the time
Source: FAO Source: FAO
Sahel Central East Southern
Africa Africa Africa
Duration of longest crises in
African countries, 1986–2004
12
10
8
6
4
2
0
Subregional average (years)
Principal causes of food emergency
0 50 60 70 80 90 100% of reporting periods “in crisis”
Current orpast conflict
Economicproblems
Weather(mainlydrought)

8/8/2019 Food Security and MDG
http://slidepdf.com/reader/full/food-security-and-mdg 20/43The State of Food Insecurity in the World 2004
With more than 800 million peo-ple in developing countries stillsuffering from chronic under-
nutrition, hunger and food security willremain the top priority for food policyfor many years to come. But profound
demographic and economic changesare rapidly transforming food systemsand the scope and nature of nutritionalchallenges.
Although the pace of change var-ies considerably from region to re-gion, common trends can be identi-fied throughout the developing world.Population is becoming increasinglyurban. Average incomes and calorieintake are rising. Commodity and foodprices are falling. An increasingly in-
tegrated world trade environment andimproved transportation facilities arespurring a greater concentration ofthe food industry and a convergence ofdietary patterns and preferences.
Rapid growth of cities and incomes
According to the latest UN estimates,almost all of the world’s population
growth between 2000 and 2030 willbe concentrated in urban areas in de-veloping countries. If present trendscontinue, urban population will equalrural population around 2017. By 2030,almost 60 percent of the people in devel-
oping countries will live in cities.As economic development fuels ur-
ban growth it is also driving per capitaincomes higher. And the proportion ofpeople living in extreme poverty andhunger is slowly shrinking. The latestprojections by the World Bank showincome per person in the developingcountries growing at an annual rate of3.4 percent for the period 2006–2015,twice the 1.7 percent registered duringthe 1990s.
Over the same time period, theaverage daily caloric intake in develop-ing countries is expected to increaseby nearly 200 kilocalories (see graph).The largest gains are projected in sub-Saharan Africa and South Asia, althoughthe pace of progress in these regionsis still likely to fall below what wouldbe needed to reach the World FoodSummit goal.
Convergence in diets
The combination of growing cities andrising incomes has contributed to sig-nificant changes, not only in the aver-age number of calories that people in
developing countries consume, but inthe foods that make up their diet.
As total caloric intake has increased,so has the proportion of those caloriesderived from vegetable oils, meat, sugarand wheat. To a large extent this reflectsthe preferences of consumers whoserising incomes allow them to purchasemore expensive and more highly valuedfoods.
Other contributing factors include thesteep decline in prices and rapid growth
in imports of wheat and other commodi-ties produced in temperate zones andexported mainly by the industrializedcountries. Net imports of these com-modities by developing countries haveincreased by a factor of 13 over the past40 years, and are expected to grow byanother 345 percent by the year 2030,offering further evidence of changes infood systems and dietary preferences.
Special feature
Globalization, urbanization and changing foodsystems in developing countries
Average daily caloric intake by
region, 1997–2030
3 500
3 000
2 500
2 000
1 500
1 000
500
0Sub- Near Latin South East
Saharan East/ America/ Asia AsiaAfrica North Caribbean
Africa
Kcal/capita
Source: FAO
Urbanization in developing
countries, 1960–2030
4.5
4.0
3.5
3.0
2.5
2.0
1.5
1.0
01960 1980 2000 2020
Population (billions)
Changes in GDP per capita by
region, 1980–2015
8
6
4
2
0
-2Sub- Near Latin South East
Saharan East/ America/ Asia AsiaAfrica North Caribbean
Africa
GDP/capita, average annual change (%)
Source: World Bank
1980s1990s2001–20052006–2015
1997–1999 20152030
Source: UN
Rural
Urban
Projected

8/8/2019 Food Security and MDG
http://slidepdf.com/reader/full/food-security-and-mdg 21/43The State of Food Insecurity in the World 2004 19
Nutrition experts identify two distincttrends fuelled by these changes: dietaryconvergence and dietary adaptation.Dietary convergence refers to the in- creasing similarity in diets worldwide.It is characterized by a greater reliance
on a narrow base of staple grains (wheatand rice), increased consumption ofmeat, dairy products, edible oil, saltand sugar, and lower intake of dietaryfibre (see graph). Dietary adaptation, onthe other hand, reflects the rapid paceand time pressures of urban lifestyles.In households where both parents of-ten commute long distances and worklong hours, consumers eat more mealsoutside the home and purchase morebrand-name processed foods.
Concentration of food processing andretail trade
The trends towards dietary convergenceand adaptation have also been fuelled bythe increasing concentration of food pro-cessing and retail trade. Latin Americaand Asia, the regions where these trendshave been most pronounced, have expe-
rienced explosive growth both in invest-ments by transnational food corpora-tions and in the proportion of food soldthrough supermarkets.
In the decade 1988–1997, foreigndirect investment in the food industry
increased from US$743 million to morethan US$2.1 billion in Asia and fromUS$222 million to US$3.3 billion in LatinAmerica, outstripping by far the level ofinvestments in agriculture (see graph).
Over roughly the same period, theshare of food sales made through su-permarkets more than doubled both inLatin America and in East and South-east Asia (see graph, next page). In LatinAmerica, supermarkets increased theirshare of retail food sales by almost as
much in one decade as it took them50 years to do in the United States ofAmerica. In the larger and wealthiercountries that account for three quar-ters of the Latin American economy, theshare of supermarkets increased fromabout 15–20 percent in 1990 to 60 per-cent in 2000. In Asia, the supermarketboom started later but took off evenmore quickly. In just two years, from
1999 to 2001, the share of supermarketsin sales of packaged and processed foodin urban China increased by more than50 percent.
Transnational food companies playeda big part in this supermarket boom
as well. Between 1980 and 2001, eachof the five largest global supermarketchains (all based in Europe or the UnitedStates) expanded the number of coun-tries where it operated by at least 270percent (see graph). The rapid growthand increasing concentration of super-markets are among the most visiblecauses and consequences of the trans-formation and consolidation of globalfood systems – the entire chain fromagricultural production through trade,
processing, retail and consumption.These changes have profound implica-tions for the food security and nutrition-al well-being of people at both ends ofthe chain, from farmers who must adaptto the requirements and standards ofchanging markets to urban consumerswho depend increasingly on processedfoods and meals purchased from streetvendors and fast food restaurants.
Foreign investment in agriculture
and the food industry, 1988–1997
3 500
3 000
2 500
2 000
1 500
1 000
500
01988 1997 1988 1997 1988 1997
Sub-Saharan Asia/ Latin America/Africa Pacific Caribbean
US$ (millions)
Source: FAO
Global expansion of transnational
supermarkets, 1980–2001
35
30
25
20
15
10
5
0
Number of countries where operating
AgricultureFood, beverages andtobacco
C a r r e f o
u r
( F r a n c e )
A
h o l d
( N e t h
e r l a n d s )
M
e t r o
( G e r m a n
y )
W a l m
a r t
( U S A )
T e s c o
( U K )
19802001
Changing diets in developing
countries, 1964–1966 to 2030
1964–1966 1997–1999 2030
Kcal/capita/day
Source: FAO
3 000
2 500
2 000
1 500
1 000
500
0
Other
Wheat
Rice
Other cereals
Vegetable oils
SugarMeatRoots/tubersPulses
Source: UK Food Group

8/8/2019 Food Security and MDG
http://slidepdf.com/reader/full/food-security-and-mdg 22/43The State of Food Insecurity in the World 2004
Changes in food markets, fuelledby the rapid growth of cities andincomes, have major implica-
tions for the food security of millionsof people who are neither urban noraffluent – the small farmers and land-
less labourers in rural areas who makeup the vast majority of the world’schronically hungry population. For thesehouseholds, the globalization of foodindustries and the expansion of super-markets present both an opportunity toreach lucrative new markets and a sub-stantial risk of increased marginaliza-tion and even deeper poverty.
Over recent decades, a handful ofvertically integrated, transnational cor-porations have gained increasing con-
trol over the global trade, processingand sales of food. The 30 largest super-market chains now account for aboutone third of food sales worldwide. InSouth America and East Asia, the super-market share of retail food sales hasballooned from less than 20 percent tomore than 50 percent over the past de-cade (see graph). And the biggestchains, most of them owned by multi-national giants, now control 65 to 95
percent of supermarket sales in LatinAmerica (see graph).
Opportunities and risks
The increasing dominance of super-
markets has yielded greater consumerchoice, more convenience, lower pricesand higher food quality and safety forurban consumers. It has also led toconsolidated supply chains in whichbuyers for a handful of giant food pro-cessors and retailers wield increasingpower to set standards, prices and de-livery schedules.
The globalization of supermarketprocurement has created unprecedent-ed opportunities for some farmers in
developing countries. In Kenya, for ex-ample, exports of fresh fruits, vegeta-bles and cut flowers for sale in Europeansupermarkets have soared to more thanUS$300 million per year. Smallholderswho grow for the export market enjoysignificantly higher incomes than non-participating households. A recent studyfound that if non-participating ruralhouseholds were able to take up grow-ing horticultural crops for export, their
poverty rate would decrease by approxi-mately 25 percent (see graph).
But as the scale of Kenya’s exportshas grown, the share produced bysmallholders has dwindled. Before thehorticultural export boom in the 1990s,
smallholders produced 70 percent ofvegetables and fruits shipped fromKenya. By the end of the 1990s, 40 per-cent of the produce was grown on farmsowned or leased directly by importersin the developed countries and another42 percent on large commercial farms.Smallholders produced just 18 percent.
The rise of supermarkets in develop-ing countries has created a domesticsector with centralized procurementand high-quality standards that has
quickly outgrown the export market inmost countries. Latin American super-markets, for example, now buy 2.5 timesmore fresh fruit and vegetables fromlocal farmers than the region exports tothe rest of the world. Like their counter-parts in the industrialized countries,domestic supermarket chains are shift-ing towards contracts with a limitednumber of suppliers who can meet theirrequirements (see graph, next page).
Special feature
The impact of changing food systems on small farmersin developing countries
Horticultural exports and povertyreduction, Kenya
* Headcount of households for which food
expenditures are insufficient to meet therecommended daily food allowance
Source: McCulloch and Ota
Supermarket share of retail foodsales
0 10 20 30 40 50 60
Central America
South America
Southeast Asia
East Asia*
Central Europe
South Africa
Kenya
Zimbabwe
China (urban)0 20 40 60
Concentration of supermarketsector in Latin America
0
0
0
0
0
0100
80
60
40
20
0
Sales of 10 biggest chains as % ofsupermarket sales
Source: Faigenbaum* excl. China Source: Reardon et al.
1992 2002
M e x i c o
A r g e n t i
n a
C o l o m b
i a
B r a z i l
C h i l e
Non-participating household
Simulation of switching to become a:
contract farm worker
participating smallholder
0 20 40 60 80 100Household food poverty (%)*

8/8/2019 Food Security and MDG
http://slidepdf.com/reader/full/food-security-and-mdg 23/43The State of Food Insecurity in the World 2004 21
Carrefour, the world’s largest super-market chain, has set up its own, hugedistribution centre in São Paulo, Brazil,serving a market of more than 50 mil-lion consumers. Carrefour buys melonsfrom just three growers in northeast
Brazil to supply all its Brazilian storesand to ship to distribution centres in21 countries.
Small dairy farmers in Brazil havealso borne the brunt of consolidation.Between 1997 and 2001, more than75 000 Brazilian dairy farmers were“delisted” by the 12 largest milk proces-sors (see graph). Most presumably wentout of business. Similar consolidationhas been taking place at an even morerapid rate in Asia. In less than five years,
Thailand’s leading supermarket chainpared its list of vegetable suppliers from250 down to just 10.
Smallholders face many obstacles to joining the ranks of preferred suppliersfor supermarkets. Meeting standardsfor quality and reliability may requiresubstantial investments in irrigation,greenhouses, trucks, cooling sheds andpacking technology. Supermarket tran-saction costs may be significantly higher
for negotiating and managing contractswith small producers.
Empowering small producers
Smallholders who have succeeded as
suppliers for supermarkets have gener-ally overcome these obstacles by forgingcooperatives or enrolling in outgrowerschemes. Often they have benefitedinitially from information, training andstart-up funds provided by public andprivate sector development initiatives.
In Zambia, for example, a consortiumof government and industry organiza-tions helped forge a partnership thatincluded government ministries, thecountry’s largest supermarket chain,
suppliers of farm inputs, and the poorfarming community of Luangeni. Theproject enabled the farmers in Luangenito begin supplying high-quality vegeta-bles for Shoprite. Participating farmersreported both substantially higher in-comes and improved nutrition.
A number of farmer cooperativeshave broken into lucrative and dynamicniche markets by obtaining certificationfor their produce as “organic”, “fair
trade” and “environmentally friendly”.Such products command a premiumprice and bring higher returns tofarmers. For small producers, organicfarming offers the added benefits ofreduced dependence on purchased in-
puts like pesticides and fertilizer andincreased use of low-cost labour.
The Del Cabo cooperative in Mexico,for example, has thrived by supplyingorganic cherry tomatoes to supermar-kets in the United States. Since it wasfounded in the mid-1980s, the coopera-tive has grown to include 250 familyfarms, many of them smaller than 2hectares. Average income in the coop-erative has increased from US$3 000 tomore than US$20 000.
Certified products generally com-mand better market access in the in-dustrialized countries. They may wellenjoy similar advantages in local super-markets as consumers become moredemanding about food quality, safetyand sustainability. But the certificationprocess itself is costly and may presenta major obstacle to small producers,who often lack access to the credit, in-formation and training they would needto enter these niche markets.
As supermarkets expand their mar-
ket from the wealthy elite in the citiesout to middle and working class neigh-bourhoods and towns throughout thecountry, one Central American super-market chain has estimated that only17 percent of the population is beyondtheir reach. That 17 percent is charac-terized as the poorest, rural segmentof the population. Smallholders whofail to gain a foothold in this globalizedmarketplace risk finding themselvesconsigned to a permanently margin-
alized minority, excluded from the foodsystem both as producers and asconsumers.
Number and size of suppliers totop 12 Brazilian milk processors
200
150
100
50
0
Source: www.terraviva.com.br
Number of suppliers (‘000)Litres/day/farmer
Sources of supplies for a Kenyansupermarket, 1997–2008
Small Medium/ Brokers Imports
farmers largefarmers
% of supplies
80
60
40
20
0
Source: Neven and Reardon
199720032008
1997 1998 1999 2000 2001

8/8/2019 Food Security and MDG
http://slidepdf.com/reader/full/food-security-and-mdg 24/43The State of Food Insecurity in the World 2004
Rising incomes and falling levelsof hunger and malnutrition havegenerally been associated with
the rapid growth of cities in the devel-oping world. But although the propor-tion of people who go hungry usually
remains lower in cities, the numbersof poor and hungry city dwellers areclimbing rapidly along with the totalurban population.
A study by the International FoodPolicy Research Institute (IFPRI) anal-ysed trends in urban poverty and mal-nutrition in 14 developing countriesbetween 1985 and 1996. In a majorityof these countries the number of un-derweight children living in urban areasis rising, and at a more rapid rate than
in rural areas. In 11 of the 14 countries,the share of urban children amongunderweight preschoolers nationwidealso increased (see graph).
More than 40 percent of all urbanresidents in developing countries live inslums. That means around 950 millionpeople lack one or more of such basicservices as access to sufficient livingspace, clean water and improved sani-
tation facilities. Many also lack accessto adequate food, even though the urbanpoor in many developing countriesspend 60 percent or more of their totalexpenditures on food. In India 36 per-cent of urban children are stunted and
38 percent are underweight.A recent FAO study compared levels
of stunting in urban and rural areas inAngola, the Central African Republic andSenegal. Although overall prevalence ofstunting was higher in rural areas, theprevalence was essentially the same inurban and rural areas when economicstatus was considered (see graph).
Changing lifestyles, changing diets
Urbanization and the globalization offood systems are redrawing not only themap but the profile of hunger and mal-nutrition in developing countries.
For the developing world as a whole,per capita consumption of vegetableoils and of animal source foods such asmeat, dairy, eggs and fish doubled be-tween 1961 and 2000. Where the paceof urban growth and rising incomes has
accelerated, so have dietary changes. InChina, the proportion of urban adultsconsuming high-fat diets, in which morethan 30 percent of calories come fromfat, shot up from 33 to 61 percent in justsix years between 1991 and 1997.
Changes in the composition of dietsand increased consumption of pro-cessed foods have been spurred bychanging lifestyles and the rapid growthof fast food outlets and supermarketchains. In 1987, Kentucky Fried Chicken(KFC) opened the first foreign-ownedfast food restaurant in Beijing. Fifteenyears later, KFC boasts more than 600stores in China and total fast food salestop US$24 billion a year.
The urban poor may not be able to
afford fast food restaurants, but they doshare in the lifestyle and dietary chang-es brought on by urbanization. In citiesfrom Bangkok to Bamako, poor peopleoften buy more than half their mealsfrom street food vendors. A study inAccra, Ghana, found that the poorest cityresidents spend 40 percent of their foodbudget and 25 percent of their total ex-penditures on street foods (see graph).
Trends in urban malnutrition,
selected developing countries
1985 1987 1989 1991 1993 1995
*United Rep. of Source: IFPRI
Stunting by residence and wealth,
three African countries
0
0
0
0
0
0100
80
60
40
20
0
% stunted
Source: FAO
UrbanRural
Special feature
The changing profile of hunger and malnutrition
Food and street food as shares of
expenditure, Accra, Ghana
70
60
50
40
30
20
10
0
% of total expenditure
Source: IFPRI
Underweight children in urbanareas as % of total
60
50
40
30
20
10
0
Brazil
PhilippinesMauritania
PeruZambia
EgyptNigeria
Honduras
Madagascar
Tanzania*Bangladesh
Uganda ChinaMalawi Q1 Q2 Q3 Q4 Q5
Wealth index quintilepoorest wealthiest
On foodOn street food
Q1 Q2 Q3 Q4 Q5
Expenditure quintilepoorest wealthiest
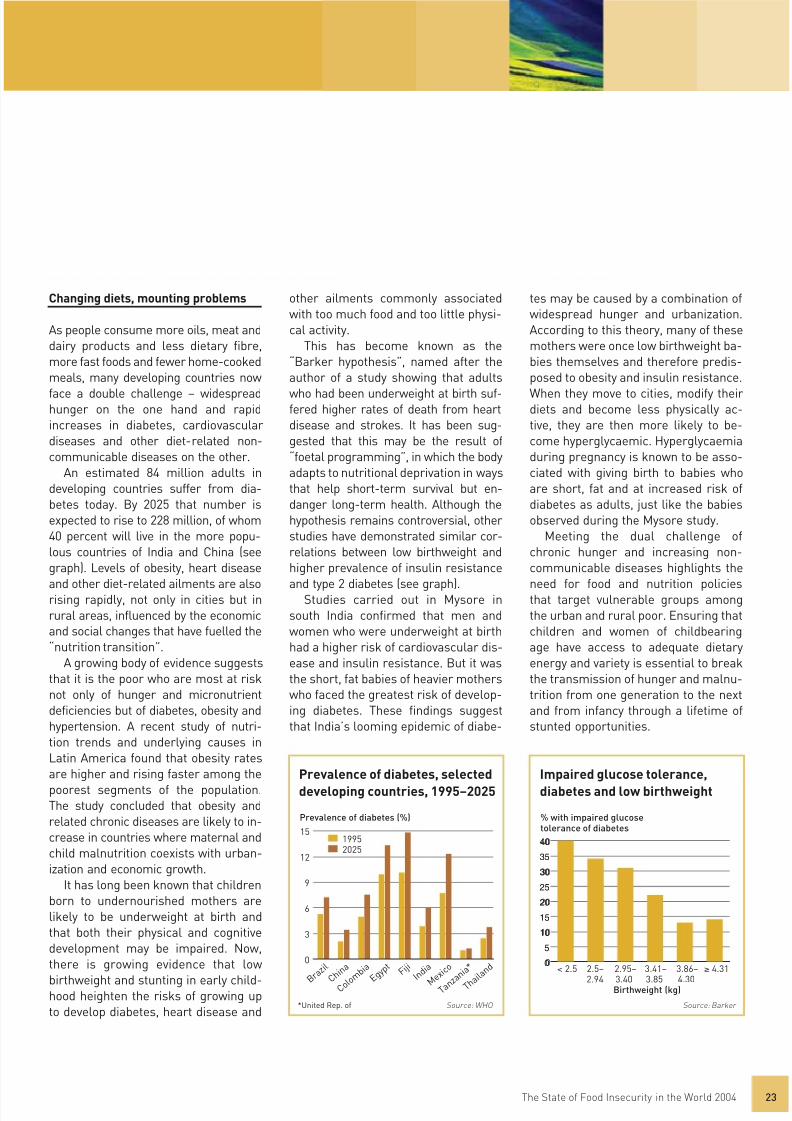
8/8/2019 Food Security and MDG
http://slidepdf.com/reader/full/food-security-and-mdg 25/43The State of Food Insecurity in the World 2004 23
Changing diets, mounting problems
As people consume more oils, meat anddairy products and less dietary fibre,more fast foods and fewer home-cookedmeals, many developing countries now
face a double challenge – widespreadhunger on the one hand and rapidincreases in diabetes, cardiovasculardiseases and other diet-related non-communicable diseases on the other.
An estimated 84 million adults indeveloping countries suffer from dia-betes today. By 2025 that number isexpected to rise to 228 million, of whom40 percent will live in the more popu-lous countries of India and China (seegraph). Levels of obesity, heart disease
and other diet-related ailments are alsorising rapidly, not only in cities but inrural areas, influenced by the economicand social changes that have fuelled the“nutrition transition”.
A growing body of evidence suggeststhat it is the poor who are most at risknot only of hunger and micronutrientdeficiencies but of diabetes, obesity andhypertension. A recent study of nutri-tion trends and underlying causes inLatin America found that obesity ratesare higher and rising faster among the
poorest segments of the population.The study concluded that obesity andrelated chronic diseases are likely to in-crease in countries where maternal andchild malnutrition coexists with urban-ization and economic growth.
It has long been known that childrenborn to undernourished mothers arelikely to be underweight at birth andthat both their physical and cognitivedevelopment may be impaired. Now,there is growing evidence that low
birthweight and stunting in early child-hood heighten the risks of growing upto develop diabetes, heart disease and
other ailments commonly associatedwith too much food and too little physi-cal activity.
This has become known as the“Barker hypothesis”, named after theauthor of a study showing that adults
who had been underweight at birth suf-fered higher rates of death from heartdisease and strokes. It has been sug-gested that this may be the result of“foetal programming”, in which the bodyadapts to nutritional deprivation in waysthat help short-term survival but en-danger long-term health. Although thehypothesis remains controversial, otherstudies have demonstrated similar cor-relations between low birthweight andhigher prevalence of insulin resistance
and type 2 diabetes (see graph).Studies carried out in Mysore insouth India confirmed that men andwomen who were underweight at birthhad a higher risk of cardiovascular dis-ease and insulin resistance. But it wasthe short, fat babies of heavier motherswho faced the greatest risk of develop-ing diabetes. These findings suggestthat India’s looming epidemic of diabe-
tes may be caused by a combination ofwidespread hunger and urbanization.According to this theory, many of thesemothers were once low birthweight ba-bies themselves and therefore predis-posed to obesity and insulin resistance.
When they move to cities, modify theirdiets and become less physically ac-tive, they are then more likely to be-come hyperglycaemic. Hyperglycaemiaduring pregnancy is known to be asso-ciated with giving birth to babies whoare short, fat and at increased risk ofdiabetes as adults, just like the babiesobserved during the Mysore study.
Meeting the dual challenge ofchronic hunger and increasing non-communicable diseases highlights the
need for food and nutrition policiesthat target vulnerable groups amongthe urban and rural poor. Ensuring thatchildren and women of childbearingage have access to adequate dietaryenergy and variety is essential to breakthe transmission of hunger and malnu-trition from one generation to the nextand from infancy through a lifetime ofstunted opportunities.
Prevalence of diabetes, selected
developing countries, 1995–2025
Prevalence of diabetes (%)
15
12
9
6
3
0
*United Rep. of Source: WHO
19952025
Impaired glucose tolerance,
diabetes and low birthweight
0
5
10
15
20
25
30
35
4040
30
20
10
0
Source: Barker
< 2.5 2.5– 2.95– 3.41– 3.86– 4.31
2.94 3.40 3.85 4.30Birthweight (kg) B r a z i l
C h i n
a
C o l o m
b i a
E g y p
t F i j i
I n d i a
M e x i c
o
T a n z a n i a *
T h a i l a n
d
% with impaired glucosetolerance of diabetes

8/8/2019 Food Security and MDG
http://slidepdf.com/reader/full/food-security-and-mdg 26/43The State of Food Insecurity in the World 2004
India’s “White Revolution”
Continuing rapid growth in India’sdairy sector has spurred such signi-ficant gains in alleviating poverty andimproving nutrition that it has been
dubbed the “White Revolution”. Milkproduction in India has risen from lessthan 30 million tonnes in 1980 to around87 million in 2003 (see graph). India nowranks as the world’s biggest milk pro-ducer. Despite rapid population growth,availability per person increased fromless than 50 kilocalories per day in 1980to 80 kilocalories per day in 2000.
The increased availability of milkrepresents an important improvementin nutrition, particularly in a country
where many people are vegetarians anddepend on dairy products for most ofthe animal protein in their diets.
Producing milk has boosted the in-comes of an estimated 80 to 100 millionfamilies. The vast majority are marginal
and small farmers, whose plots are of-ten too small to support their families,and landless labourers who depend oncommon grazing lands and forests forfodder. More than 70 percent of India’smilk is produced by households whoown only one or two milk animals.
On average, dairy production pro-vides around one quarter of the incomeof rural households. But it is far moreimportant than that for the poor andfor women, who carry out more than
90 percent of activities related to careand management of dairy animals. Inlandless households, dairy productionaccounts for more than half of house-hold income, compared with less than20 percent for large farmers.
The key to smallholder dairy pro-duction and India’s White Revolutionhas been the growth of a nationwidenetwork of dairy cooperatives. The co- operative approach started successfullyas a local initiative in Anand, Gujarat,half a century ago. Since 1970 it has
been replicated all across India througha three-phase programme known asOperation Flood, backed by the IndianGovernment, the Anand Milk UnionLimited, FAO and the World Bank. By2002, more than 11.2 million house-holds were participating in 101 000village dairy cooperatives (see graph).
The importance of dairy products inIndian diets has grown along with milkproduction and incomes. Between 1970and 2000, the proportion of total food
expenditures spent on milk and dairyproducts in rural areas increased from10 percent to 15 percent.
Although Operation Flood has cometo an end, India’s dairy production isexpected to triple by the year 2020. Withgovernment policies that facilitate ruralcredit and provide essential supportservices to promote milk produc tion
by poor rural households, the WhiteRevolution will continue to play a sig-nificant role in reducing poverty andhunger in India.
Right to food gains support
After more than a year of work, anIntergovernmental Working Group wasexpected to complete a set of voluntaryguidelines for the progressive realizationof the right to adequate food in time to
submit them to the September 2004session of FAO’s Committee on WorldFood Security. The guidelines will serveas a practical tool in national efforts toimplement the right to food.
In the meantime, numerous coun-tries have pressed ahead with mea-sures to transform the right to foodfrom a statement of principle to anenforceable right.
South Africa is the most advancedcountry in this regard. The right to foodis enshrined in the post-apartheid con-
stitution adopted in 1996, which placesan obligation on the state to ensure thateveryone has access to adequate foodat all times. The South African Govern-ment has taken further steps towardsclarifying and fulfilling this obligation bydrafting comprehensive legislation onfood issues, in the form of the NationalFood Security Draft Bill. Both India andUganda have also recently upgradedthe right to food from a directive prin-ciple to a legally “justiciable” right.
In India, non-governmental orga-nizations have succeeded in bringingviolations of the right to food to court.
Towards the Summit commitments
Acting to combat hunger
Source: FAOSTAT
Milk production in India,
1980–2003
Million tonnes
100
80
60
40
20
01980 1985 1990 1995 2000 2003
Source: FAO
Growth of Indian dairy
cooperatives, 1970–2002
12
10
8
6
4
2
01970– 1980– 1990– 2000–1971 1981 1991 2001
Cooperatives (10 000s)
Members (millions)

8/8/2019 Food Security and MDG
http://slidepdf.com/reader/full/food-security-and-mdg 27/43The State of Food Insecurity in the World 2004 25
The People’s Union for Civil Liberties,for example, claimed that the publicfood distribution system is not workingin some districts and that no attemptshave been made to prevent hunger-related deaths. Although the Supreme
Court has not yet reached a final judgement on the case, it has issued“interim orders” directing the govern-ment to introduce midday meals for allprimary schools, provide 35 kilogramsof grain per month to 15 million desti-tute households and double the fundingfor India’s largest rural employmentprogramme.
Judicial processes can be slow andexpensive. In some countries, quasi- judicial mechanisms are being used
to claim the right to food. In Brazil,for example, public prosecutors in theMinistério Público (Public Ministry) caninitiate civil suits against any person orentity, including government agencies,“for the protection of public and socialpatrimony, of the environment and of
other diffuse and collective interests”.Since the 1988 Constitution broadenedthe scope for these “public civil suits”,public prosecutors have used themincreasingly to press for rights such asthe right to food that might be derived
from the constitutional right to “edu-cation, health, work, leisure, security,social welfare, maternity protection andchildhood”. Indeed a survey of attitudesamong public prosecutors found thatthey believe the Public Ministry can con-tribute more than any other institutionor sector to broadening and consolida-ting such “diffuse and collective rights”(see graph).
Hunger Task Force promotes action
Both the UN’s Millennium Develop-ment Goals and the Rome Declarationapproved by heads of state and gov-ernment at the World Food Summitpledge to reduce hunger by half bythe year 2015. The United NationsMillennium Project has established aspecial “Hunger Task Force” to promoteimmediate action towards achiev-ing that goal. The Task Force includesexperts on nutrition, agriculture, en- vironmental sustainability, research,
capacity building, business and com-munications, drawn from a wide rangeof public and private institutions.
The Task Force has carried outresearch to identify more preciselywho and where hungry people are.A set of maps highlights the world’s“hunger hotspots” and has been usedto help define general typologies ofhunger. Based on available informa-tion, the Task Force has concluded thatabout half of the world’s hungry people
are from smallholder farming commu-nities, another 20 percent are rurallandless and about 10 percent live in
communities whose livelihoods dependon herding, fishing or forest resources.The remaining 20 percent live in cities(see graph).
Within these communities, hungerdisproportionately affects the most
vulnerable groups, including childrenunder the age of five, women of child-bearing age and mothers of babies,the sick and the infirm. The TaskForce has called for urgent, adequatelyfunded programmes to improve peri-natal health and nutrition servicesand to get food to the needy. It isalso emphasizing the need to renewand increase support for smallholderfarming, with special attention given toimproving soil fertility, water manage-
ment, improved seeds and a completerestoration and overhaul of extensionservices. All of the recommendationsfrom the Hunger Task Force focus oninvestment in poor people and the in-frastructure and services they need toescape from the cycle of abject povertyand hunger. Following early action in anumber of countries in Africa, the TaskForce intends to put a price tag on theinvestments that are needed and tocall upon the United Nations and itsmember countries to make the nec-
essary funds available.
Source: Arantes
Public Ministry
Society
Other agencies
Press
Lawyers
Judiciary branch
Trade unions
Churches
Legislative branch
Executive branch
0 20 40 60 80 100Proportion of public prosecutors who
believe that the contributionis high or very high (%)
Source: Hunger Task Force
Smallholder farmers 50%
Urbanpoor20%
Rurallandless
20%
Pastoralists, fishers,forest-dependent 10%
Who the hungry are
Views of members of Public
Ministry on contributions to
collective rights, Brazil
Bodies contributingto collective rights

8/8/2019 Food Security and MDG
http://slidepdf.com/reader/full/food-security-and-mdg 28/43The State of Food Insecurity in the World 2004
More than 45 million people wereaffected by the 21 most serioushumanitarian crises in 2003.
Most of these crises have persisted formany years, often triggered by armedconflict and compounded by drought,
floods and the effects of the AIDSpandemic (see map). Protracted crisesdisrupt food production and underminefood security as they drive people fromtheir homes, strike at the foundationsof their livelihoods and erode the socialfabric of families, communities andcountries.
Frequently, however, farmers andcommunities show remarkable resil-ience in the face of such disasters. AsAngola neared the end of almost three
decades of civil war, for example, abroad review of agricultural recoveryand development options reported thatin many areas traditional village institu-tions remained largely intact, demon-strating a sustained capacity to manageland allocation and small-scale irriga-tion systems. In a war-torn area of SriLanka, a case study found that farmers
in one Tamil village had been forced toabandon traditional paddy cultivationin the lowlands. But they succeeded inearning considerable cash by growingrainfed crops in the nearby hills and en-gaging in wage labour. Similar evidence
of both destruction and resilience hasbeen cited in reports from other coun-tries ravaged by war, natural disastersand HIV/AIDS.
In recent years, recognition hasgrown that responses to chronic andprotracted crises must go beyond therepeated mobilization of emergencysupport when humanitarian conditionsdeteriorate. Relief and rehabilitationefforts are far more effective if theybuild on the foundations of resilience
rather than relying exclusively on injec-tions of external inputs, technology andinstitutions.
Resilience, relief and rehabilitation
Studies have identified several keys tothe resilience of farming systems andcommunities. And emergency relief
and rehabilitation programmes haveachieved notable success by building onthese foundations.
Strengthening diversity: communi-ties that cultivate a variety of crops,raise livestock and engage in other
food- and income-generating activitiescan often adjust and survive when foodproduction and social institutions aredisrupted. In the drought-prone west-ern Sudan, for example, communitiestraditionally devoted most of their landto crops and allocated only a smallportion for grazing livestock. Food andincome from their herds helped themsurvive the increasingly frequent yearswhen drought destroyed their crops.To enhance their capacity to cope with
recurring crises, a project was designedto build on this diversity by encouraginga significant shift of resources fromcropping to grazing. At the conclusionof the project, the proportion of landallocated for grazing had increasedfrom less than 30 percent to more than80 percent (see graph, next page). Theshift in land use was accompanied by awide range of other activities, includingrehabilitation of rangelands, improvedaccess to credit and improved vet-erinary services, all of which fostered
greater diversity, increased resilienceand improved food security.
Supporting local institutions: duringprotracted crises, government andmarket institutions often collapse,leaving communities to fend forthemselves. Their ability to do so oftenhinges on the strength and adaptabilityof traditional support networks andcommunities. Local seed marketshave been recognized as responsiveinstitutions that can fuel both resilience
during crises and rehabilitationafterwards. Agencies engaged inemergency relief have found that
Towards the Summit commitments
Factoring the resilience of food systems andcommunities into the response to protracted crises
Location and duration of protracted food emergencies, 2004
Source: FAO
Consecutive years including 2004
5–8 years 12–14 years
9–11 years > 15 years
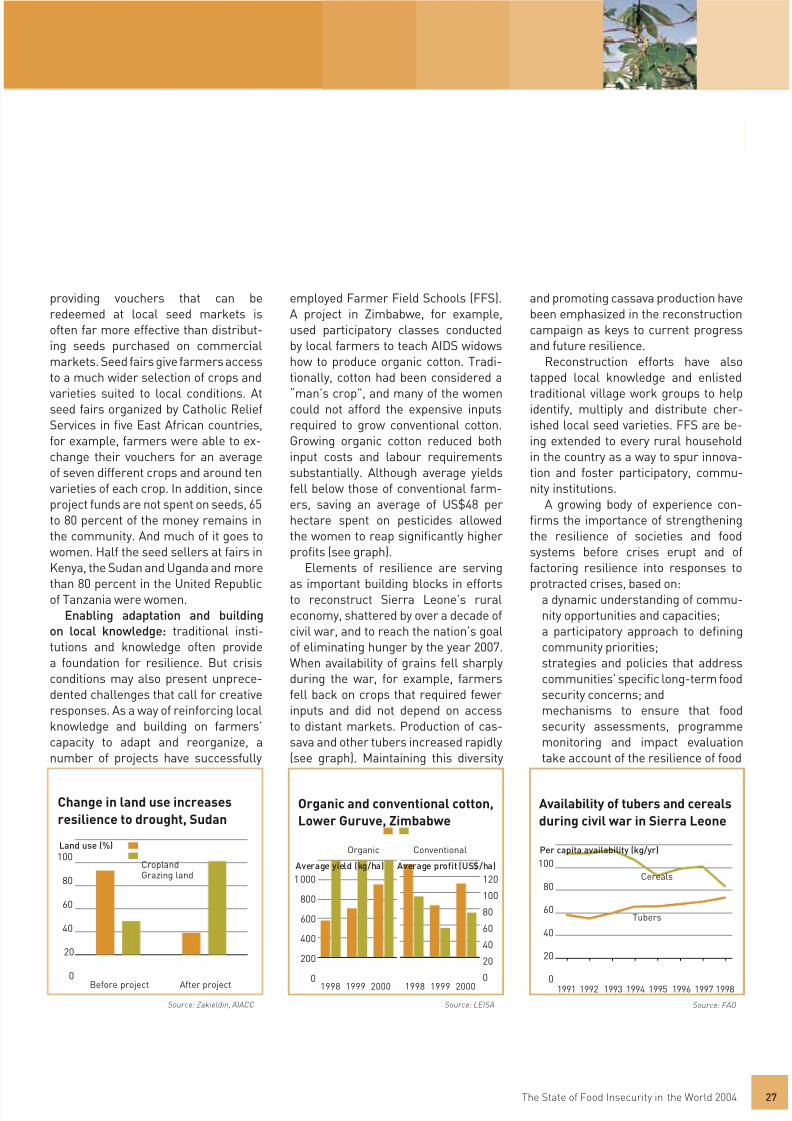
8/8/2019 Food Security and MDG
http://slidepdf.com/reader/full/food-security-and-mdg 29/43The State of Food Insecurity in the World 2004 27
providing vouchers that can beredeemed at local seed markets isoften far more effective than distribut-ing seeds purchased on commercialmarkets. Seed fairs give farmers accessto a much wider selection of crops and
varieties suited to local conditions. Atseed fairs organized by Catholic ReliefServices in five East African countries,for example, farmers were able to ex-change their vouchers for an averageof seven different crops and around tenvarieties of each crop. In addition, sinceproject funds are not spent on seeds, 65to 80 percent of the money remains inthe community. And much of it goes towomen. Half the seed sellers at fairs inKenya, the Sudan and Uganda and more
than 80 percent in the United Republicof Tanzania were women.Enabling adaptation and building
on local knowledge: traditional insti-tutions and knowledge often providea foundation for resilience. But crisisconditions may also present unprece-dented challenges that call for creativeresponses. As a way of reinforcing localknowledge and building on farmers’capacity to adapt and reorganize, anumber of projects have successfully
employed Farmer Field Schools (FFS).A project in Zimbabwe, for example,used participatory classes conductedby local farmers to teach AIDS widowshow to produce organic cotton. Tradi-tionally, cotton had been considered a
“man’s crop”, and many of the womencould not afford the expensive inputsrequired to grow conventional cotton.Growing organic cotton reduced bothinput costs and labour requirementssubstantially. Although average yieldsfell below those of conventional farm-ers, saving an average of US$48 perhectare spent on pesticides allowedthe women to reap significantly higherprofits (see graph).
Elements of resilience are serving
as important building blocks in effortsto reconstruct Sierra Leone’s ruraleconomy, shattered by over a decade ofcivil war, and to reach the nation’s goalof eliminating hunger by the year 2007.When availability of grains fell sharplyduring the war, for example, farmersfell back on crops that required fewerinputs and did not depend on accessto distant markets. Production of cas-sava and other tubers increased rapidly(see graph). Maintaining this diversity
and promoting cassava production havebeen emphasized in the reconstructioncampaign as keys to current progressand future resilience.
Reconstruction efforts have alsotapped local knowledge and enlisted
traditional village work groups to helpidentify, multiply and distribute cher-ished local seed varieties. FFS are be-ing extended to every rural householdin the country as a way to spur innova-tion and foster participatory, commu-nity institutions.
A growing body of experience con-firms the importance of strengtheningthe resilience of societies and foodsystems before crises erupt and offactoring resilience into responses to
protracted crises, based on: a dynamic understanding of commu-nity opportunities and capacities;a participatory approach to definingcommunity priorities;strategies and policies that addresscommunities’ specific long-term foodsecurity concerns; andmechanisms to ensure that foodsecurity assessments, programmemonitoring and impact evaluationtake account of the resilience of food
Source: Zakieldin, AIACC
Change in land use increases
resilience to drought, Sudan
Land use (%)100
80
60
40
20
0 Before project After project
Source: FAO
Availability of tubers and cereals
during civil war in Sierra Leone
Source: LEISA
1 000
800
600
400
200
0 1998 1999 2000
Organic and conventional cotton,
Lower Guruve, Zimbabwe
Conventional
1998 1999 2000
120
100
80
60
40
20
0
Average yield (kg/ha) Average profit (US$/ha)
Organic
100
80
60
40
20
0 1991 1992 1993 1994 1995 1996 1997 1998
Per capita availability (kg/yr)
Cereals
Tubers
CroplandGrazing land

8/8/2019 Food Security and MDG
http://slidepdf.com/reader/full/food-security-and-mdg 30/43The State of Food Insecurity in the World 2004
The vast majority of the world’s852 million chronically under-nourished people live in rural
areas in the developing world. So domost of the 860 million illiterate adults(a majority of whom are women) and the
130 million children (mainly girls) whodo not go to school. The fact that hun-ger, illiteracy and lack of schooling af-fect many of the same areas and peopleis no coincidence. Nor does it merelyreflect the fact that both hunger and
lack of education are facets of extremepoverty. Hunger, malnutrition and foodinsecurity erode cognitive abilities andreduce school attendance. Conversely,illiteracy and lack of education reduceearning capacity and contribute directly
to hunger and poverty.School attendance and literacy rates
are particularly low for women andgirls in rural areas (see graph). In 50developing countries for which data areavailable, primary school attendance
for rural girls averaged only 58 percent,compared to 63 percent for rural boysand over 75 percent for urban children.As a result, around two thirds of theilliterate people in the developing worldare women and the gender gap is sig-
nificantly larger in rural areas.Hunger and malnutrition deter chil-
dren from going to school and stunttheir learning capacity when they doattend. A study in rural Pakistan foundthat a relatively minor improvementin nutrition would increase the likeli-hood of starting school by 4 percentfor boys and 19 percent for girls. Lowbirthweight, protein energy malnutri-tion, iron deficiency anaemia and iodinedeficiency have all been linked to cogni-
tive deficiencies that reduce children’sability to learn. Iodine deficiency, forexample, affects an estimated 1.6 bil-lion people worldwide and has beenassociated with an average 13.5 pointreduction in IQ for a population.
Lack of education reduces producti-vity and earning capacity and increasesvulnerability to hunger and extremepoverty. Research shows that a farmerwith four years of elementary edu cationis, on average, 8.7 percent more produc-tive than a farmer with no education.
When complementary inputs such asfertilizers, new seeds or farm machineryare available, the productivity increaserises to 13 percent.
Improving education to feed bothminds and bodies
Improving education can be one of themost effective ways to reduce hungerand malnutrition. Malnutrition ratesdecline with increased literacy, espe-
cially female literacy. Higher rates ofliteracy among rural women are alsoassociated with increased enrolment of
Towards the Summit commitments
Education for rural people and food security
Correspondence of high rates of illiteracy and undernourishment
Source: USAID DHS
100
80
60
40
20
0
Female Male Female MaleUrban Rural
% literacy
Rural and urban literacy, 1990–
1995 (22 countries)
Adult illiteracy > 30%
Undernourishment > 20%
Adult illiteracy > 30% and undernourishment > 20% Source: FAO
Source: FAO
80
60
40
20
00–19% 20–34% 35%
Underweight rural children under5 years old
% literacy Female Male
Literacy and prevalence of rural
child undernutrition

8/8/2019 Food Security and MDG
http://slidepdf.com/reader/full/food-security-and-mdg 31/43The State of Food Insecurity in the World 2004 29
girls in primary school and lower ratesof malnutrition (see graph).
Education is also the front lineagainst HIV/AIDS. A recent study inUganda found that people who fin-ished primary school were only half as
likely to contract HIV – and those witha secondary education only 15 percentas likely – as those who received littleor no schooling.
The Indian state of Kerala is oftencited as a prime example of the virtuouscircle of benefits from investments ineducation and nutrition. Since shortlyafter independence, successive govern-ments in Kerala have made educationa top priority. Special attention has beengiven to girls and women in rural areas.
The investment has paid off. AlthoughKerala is not one of India’s wealthierstates, it ranks first in female literacyand school enrolment by a wide margin.Kerala also boasts the lowest rate ofmalnutrition among children and aninfant mortality rate that is a fifth of thatof the country as a whole (see graph).
A number of countries have recog-nized the importance of education forrural people and adopted policies to
make it more accessible and relevant.Almost half of the rural schools inColombia, for example, have adoptedthe Escuela Nueva (New School) model.These schools emphasize participatorylearning and employ a curriculum that
combines core national content withlocal modules relevant to the cultureand needs of rural people. Communitiesand parents are actively engaged in theschools. Drop-out rates are far lowerand third-grade scores in Spanish andmathematics are significantly higherthan in traditional schools.
The Indian state of Madhya Pradeshpledged to build a primary schoolbuilding within 90 days for any ruralcommunity that provided space and
hired a qualified teacher. Today, allchildren of primary school age in thestate are enrolled in school.
Programmes that take direct aimsimultaneously at lack of educationand malnutrition have achieved notablegains in several countries.
In Bangladesh’s Food for Educationprogramme, families receive food if theysend their children to school instead ofputting them to work. After eight years,
an evaluation by the International FoodPolicy Research Institute found gains inboth education and nutrition. Primaryschool attendance had increased, es-pecially for girls. School absences anddrop-out rates had declined. And calorie
and protein consumption among parti-cipating families had risen significantly.
Mexico’s Programa de Educación,Salud y Alimentación (PROGRESA) pro-vides cash transfers to more than 2.6million poor, rural families as long asthey send their children to school.Benefits are higher for older childrenand for girls, who are more likely to dropout prior to secondary school. The pro-gramme also provides nutritional sup-plements for infants and small children
in participating families.After its first three years in operation,enrolment for the critical transitionyear from primary to secondary schoolincreased by 20 percent for girls and10 percent for boys. Simulation of theimpact over a longer period shows that,on average, children would complete0.6 more grades in school and 19percent more of them would attendsome secondary grades (see graph).
Source: UNDP; Govt. of India Planning Commission
Rural education and nutrition inKerala and India as a whole
Rural areas
Femaleliteracy
Femaleenrolment
Childunderweight
Infantmortality*
0 20 40 60 80 100 %
* Infant mortality = per 1000 live births
Kerala India With PROGRESA
Without PROGRESA
Source: Behrman, Sengupta and Todd
PROGRESA impact on enrolmentSimulated distribution at age 14
40
30
20
10
0
Primary Grade Grade Grade Gradeonly 7 8 9 10
Proportion atgrade level (%)
Without PROGRESAWith PROGRESA
Source: UNICEF; WHO; UNESCO; FAO
Girls enrolled in schoolChildren underweight
100
80
60
40
20
0 < 50% 50–79% 80%
Rural female literacy
%
* 18 countries grouped by female literacy
Child undernutrition and ruralnet enrolment for girls*
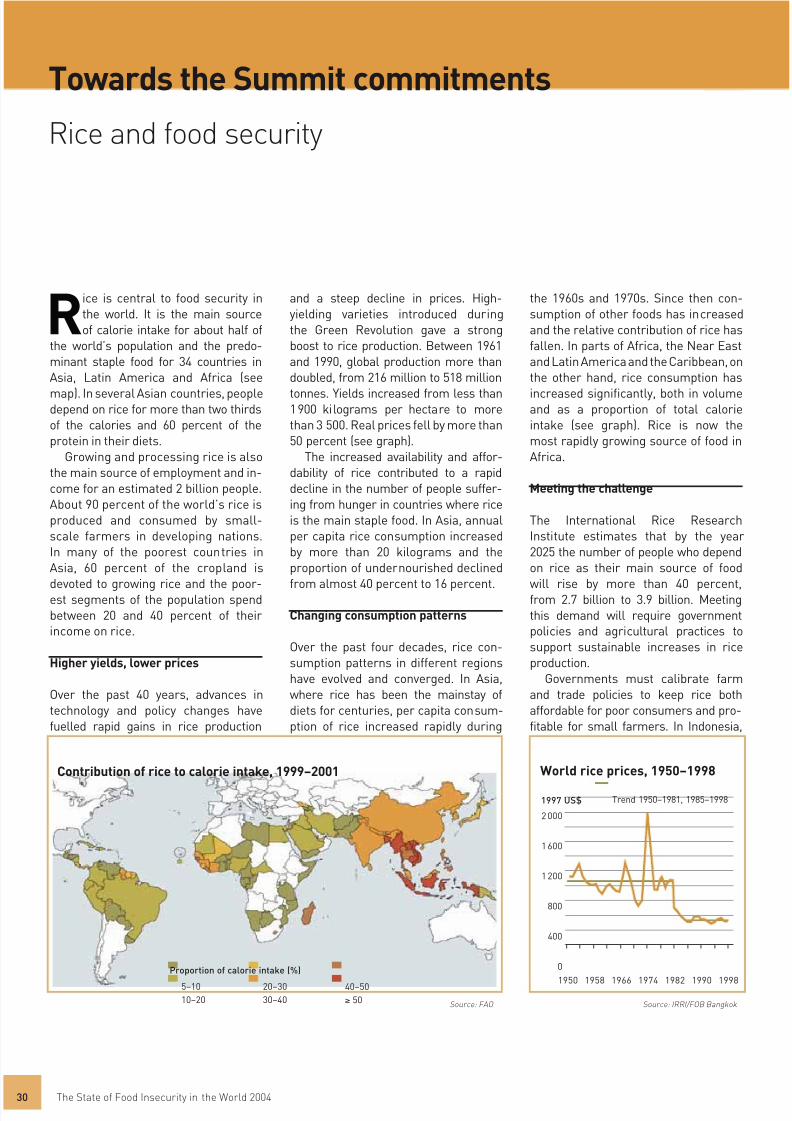
8/8/2019 Food Security and MDG
http://slidepdf.com/reader/full/food-security-and-mdg 32/43The State of Food Insecurity in the World 2004
Rice is central to food security inthe world. It is the main sourceof calorie intake for about half of
the world’s population and the predo-minant staple food for 34 countries inAsia, Latin America and Africa (see
map). In several Asian countries, peopledepend on rice for more than two thirdsof the calories and 60 percent of theprotein in their diets.
Growing and processing rice is alsothe main source of employment and in-come for an estimated 2 billion people.About 90 percent of the world’s rice isproduced and consumed by small-scale farmers in developing nations.In many of the poorest countries inAsia, 60 percent of the cropland is
devoted to growing rice and the poor-est segments of the population spendbetween 20 and 40 percent of theirincome on rice.
Higher yields, lower prices
Over the past 40 years, advances intechnology and policy changes havefuelled rapid gains in rice production
and a steep decline in prices. High-yielding varieties introduced duringthe Green Revolution gave a strongboost to rice production. Between 1961and 1990, global production more thandoubled, from 216 million to 518 million
tonnes. Yields increased from less than1 900 kilograms per hectare to morethan 3 500. Real prices fell by more than50 percent (see graph).
The increased availability and affor-dability of rice contributed to a rapiddecline in the number of people suffer-ing from hunger in countries where riceis the main staple food. In Asia, annualper capita rice consumption increasedby more than 20 kilograms and theproportion of undernourished declined
from almost 40 percent to 16 percent.
Changing consumption patterns
Over the past four decades, rice con-sumption patterns in different regionshave evolved and converged. In Asia,where rice has been the mainstay ofdiets for centuries, per capita consum-ption of rice increased rapidly during
the 1960s and 1970s. Since then con-sumption of other foods has increasedand the relative contribution of rice hasfallen. In parts of Africa, the Near Eastand Latin America and the Caribbean, onthe other hand, rice consumption has
increased significantly, both in volumeand as a proportion of total calorieintake (see graph). Rice is now themost rapidly growing source of food inAfrica.
Meeting the challenge
The International Rice ResearchInstitute estimates that by the year2025 the number of people who dependon rice as their main source of food
will rise by more than 40 percent,from 2.7 billion to 3.9 billion. Meetingthis demand will require governmentpolicies and agricultural practices tosupport sustainable increases in riceproduction.
Governments must calibrate farmand trade policies to keep rice bothaffordable for poor consumers and pro-fitable for small farmers. In Indonesia,
Towards the Summit commitments
Rice and food security
Source: IRRI/FOB Bangkok
World rice prices, 1950–1998
2 000
1 600
1 200
800
400
0
1950 1958 1966 1974 1982 1990 1998
Contribution of rice to calorie intake, 1999–2001
40–50
50
20–30
30–40
5–10
10–20
Proportion of calorie intake (%)
Source: FAO
Trend 1950–1981, 1985–19981997 US$
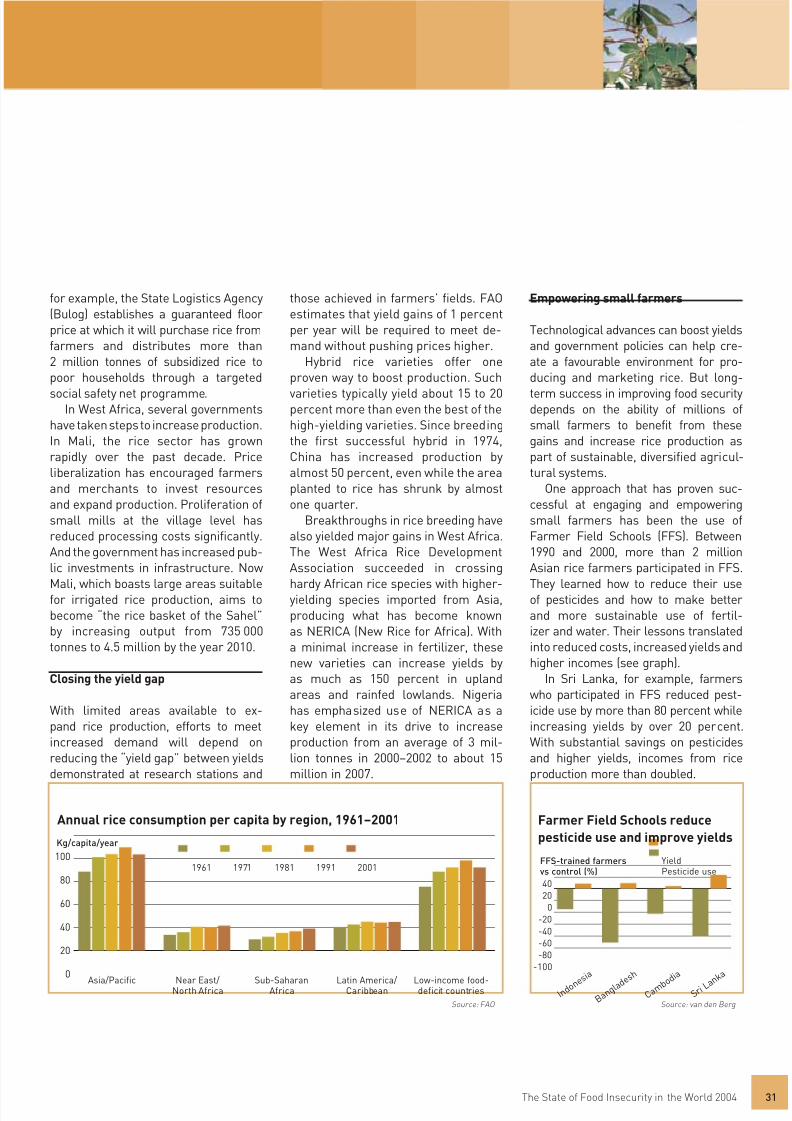
8/8/2019 Food Security and MDG
http://slidepdf.com/reader/full/food-security-and-mdg 33/43The State of Food Insecurity in the World 2004 31
for example, the State Logistics Agency(Bulog) establishes a guaranteed floorprice at which it will purchase rice fromfarmers and distributes more than2 million tonnes of subsidized rice topoor households through a targeted
social safety net programme.In West Africa, several governments
have taken steps to increase production.In Mali, the rice sector has grownrapidly over the past decade. Priceliberalization has encouraged farmersand merchants to invest resourcesand expand production. Proliferation ofsmall mills at the village level hasreduced processing costs significantly.And the government has increased pub- lic investments in infrastructure. Now
Mali, which boasts large areas suitablefor irrigated rice production, aims tobecome “the rice basket of the Sahel”by increasing output from 735 000tonnes to 4.5 million by the year 2010.
Closing the yield gap
With limited areas available to ex-pand rice production, efforts to meetincreased demand will depend onreducing the “yield gap” between yieldsdemonstrated at research stations and
those achieved in farmers’ fields. FAOestimates that yield gains of 1 percentper year will be required to meet de-mand without pushing prices higher.
Hybrid rice varieties offer oneproven way to boost production. Such
varieties typically yield about 15 to 20percent more than even the best of thehigh-yielding varieties. Since breedingthe first successful hybrid in 1974,China has increased production byalmost 50 percent, even while the areaplanted to rice has shrunk by almostone quarter.
Breakthroughs in rice breeding havealso yielded major gains in West Africa.The West Africa Rice DevelopmentAssociation succeeded in crossing
hardy African rice species with higher-yielding species imported from Asia,producing what has become knownas NERICA (New Rice for Africa). Witha minimal increase in fertilizer, thesenew varieties can increase yields byas much as 150 percent in uplandareas and rainfed lowlands. Nigeriahas empha sized use of NERICA as akey element in its drive to increaseproduction from an average of 3 mil-lion tonnes in 2000–2002 to about 15million in 2007.
Empowering small farmers
Technological advances can boost yieldsand government policies can help cre-ate a favourable environment for pro-ducing and marketing rice. But long-
term success in improving food securitydepends on the ability of millions ofsmall farmers to benefit from thesegains and increase rice production aspart of sustainable, diversified agricul-tural systems.
One approach that has proven suc-cessful at engaging and empoweringsmall farmers has been the use ofFarmer Field Schools (FFS). Between1990 and 2000, more than 2 millionAsian rice farmers participated in FFS.
They learned how to reduce their useof pesticides and how to make betterand more sustainable use of fertil-izer and water. Their lessons translatedinto reduced costs, increased yields andhigher incomes (see graph).
In Sri Lanka, for example, farmerswho participated in FFS reduced pest-icide use by more than 80 percent whileincreasing yields by over 20 percent.With substantial savings on pesticidesand higher yields, incomes from riceproduction more than doubled.
Source: van den Berg
Farmer Field Schools reduce
pesticide use and improve yields
4020
0-20
-40-60-80
-100
YieldPesticide use
FFS-trained farmersvs control (%)
Asia/Pacific Near East/ Sub-Saharan Latin America/ Low-income food-North Africa Africa Caribbean deficit countries
Kg/capita/year
1961 1971 1981 1991 2001100
80
60
40
20
0
Source: FAO
Annual rice consumption per capita by region, 1961–2001
I n d o n e s
i a
B a n g
l a d e s h
C a m b o d
i a
S r i L a n k
a

8/8/2019 Food Security and MDG
http://slidepdf.com/reader/full/food-security-and-mdg 34/43The State of Food Insecurity in the World 2004
The time that is left to reach theWorld Food Summit (WFS) goalis getting short. The distance to
be travelled remains long. It is time tostep up the pace, to start acting aggres-sively on what we know can and must
be done.Although progress has lagged so far,
the WFS target is both attainable andaffordable. We have ample evidence thatrapid progress can be made by applyinga twin-track strategy that attacks boththe causes and the consequences ofextreme poverty and hunger (see dia-gram). Track one includes interventionsto improve food availability and incomesfor the poor by enhancing their produc-tive activities. Track two features tar-
geted programmes that give the mostneedy families direct and immediateaccess to food.
To meet the WFS goal, we mustnow translate the twin-track approachinto large-scale programmes that canbe adopted in countries where hungeris widespread and resources are ex-tremely limited.
This means that within the twin-trackframework we must give priority overthe next ten years to actions that willhave the most immediate impact on thefood security of millions of vulnerablepeople. Where resources are scarce,
we must focus on low-cost approachesthat empower small-scale farmersto raise production in ways that willenhance food consumption for theirfamilies and communities. At the sametime, we must rapidly expand targetedsafety nets.
Improve the productivity, nutrition andlivelihoods of the poor
The vast majority of the world’s hungry
people live in rural areas and depend onagriculture both for their incomes andtheir food. Even modest gains in outputby very large numbers of small farmers,when translated into improved diets,would have a major impact in reducingrural hunger and poverty.
Improving the productivity of smallfarmers has a ripple effect that spreads
benefits throughout poor rural com-munities. When small farmers havemore money to spend, they tend tospend it locally on labour-intensivegoods and services that come fromthe rural non-farm sector, boosting
the incomes of the rural population asa whole, including landless labourerswho make up a large proportion of thehungry and poor in many countries.
Strengthen safety nets and transferprogrammes
With the need so urgent and the timeso short, the quickest way to reducehunger may often be to provide directassistance to the neediest households
to ensure that they can put food ontheir tables. In order to make a largeand enduring dent in hunger, we mustscale up safety net and cash transferprogrammes and make sure that theytarget the most vulnerable groups,including pregnant and nursing moth-ers, infants and small children, schoolchildren, unemployed urban youth and
Towards the Summit commitments
The way ahead: scaling up actionto scale down hunger
Track 1 – strengthen productivity and incomes
Low-cost, simple technology(water management, use of green manures,
crop rotation, agroforestry)
Improved irrigation and soil fertility
Natural resource management(including forestry and fisheries)
Market and private sector development
Food safety and quality
Agricultural research, extension and training
Linkages – maximizing synergy
Alliances against hunger
Primary health care, reproductive healthand HIV/AIDS prevention
Legal reforms (including the Right to Food)
Asset redistribution (including land reform)
Education for rural people, especially women
Clean drinking water
Support to rural organizations
Local food procurement for safety nets
World Food Summit Goal
Track 2 – provide direct access to food
Mother and infant feeding(including nutritional supplements)
School meals and school gardens
Unemployment and pension benefits
Food-for-work and food-for-education
Targeted conditional cash transfers
Soup kitchens and factory canteens
Food banks
Emergency rations
Accelerating a twin-track strategy to eliminate hunger
Rural infrastructure (roads, electricity, etc.)
Source: FAO

8/8/2019 Food Security and MDG
http://slidepdf.com/reader/full/food-security-and-mdg 35/43The State of Food Insecurity in the World 2004 33
the elderly, disabled and sick, includingpeople living with HIV/AIDS.
Safety nets can also be woven withstrands that contribute to develop-mental goals. Food banks and schoolfeeding programmes can often be de-
signed to boost incomes, improve foodsecurity and stimulate development invulnerable rural communities by buyingfood locally from small-scale farmers.Similarly, programmes that provide foodto people who attend education andtraining programmes can improve boththeir nutritional status and their em-ployment prospects.
Empower rural communities
Rural communities themselves are of-ten best able to diagnose the local rootcauses of chronic hunger and to iden-tify solutions that will benefit the mostcommunity members with the least re-liance on external resources.
Experience has shown that FarmerField Schools (FFS) and similar ap-proaches to adult education and com-munity empowerment can help farmers
increase production and improve target-ing of social safety nets.
Sierra Leone has made FFS a key el-ement in mobilizing a community-baseddrive to eradicate hunger within fiveyears. By September 2006, more than
200 000 of the country’s 450 000 farm-ers are expected to have been enrolledin self-financing FFS focusing on foodsecurity (see graph).
Scale up funding and commitment
Scaling up direct actions to reach theWFS goal, while simultaneously increas-ing long-term investments in sustainableagriculture and rural development, willalso require scaling up resources and
political commitment. Fortunately sev-eral countries have taken the lead inmobilizing political will and pressing forinnovative funding mechanisms.
Calling hunger “the worst of allweapons of mass destruction”, Presi-dent Luiz Inácio Lula da Silva of Brazilhas proposed taxes on the internationalarms trade and on some financial trans-actions carried out in “fiscal paradises”.
The Presidents of Chile, France andSpain and UN Secretary-General KofiAnnan have joined President Lula toforge the “Quintet against Hunger”,which is considering a variety of alterna-tive funding mechanisms.
The United Kingdom has proposedone such mechanism – an Interna-tional Finance Facility (IFF) designed“to ‘frontload’ aid to help meet the Mil-lennium Development Goals”. The IFFwould use bonds backed by long-termcommitments from donor countries toprovide US$50 billion a year in develop-ment assistance to the world’s poorestcountries up to 2015 (see diagram).
On 20 September 2004, more than100 countries participated in a one-day
World Leaders Summit on Hunger heldat UN Headquarters in New York. At itsconclusion, they endorsed a campaignto raise an additional US$50 billion ayear to fight hunger and declared:
“The greatest scandal is not that hun-ger exists but that it persists even whenwe have the means to eliminate it. It istime to take action.
“Hunger cannot wait.”
Structure of the International Finance Facility
INTERNATIONALFINANCE FACILITY
(IFF)
Donor countries International capital markets
Approved disbursementmechanism
Approved disbursementmechanism
Approved disbursementmechanism
Recipient countries
Donors
A
B
C
Source: HM Treasury/DFID
Bonds
0
50
100
150
200
End2003*
July2004
Sept.2004
Sept.2006
(projected)* < 100 trainers
Number of farmers trained (thousands)
Scaling up Farmer Field Schools
in Sierra Leone
Source: FAO

8/8/2019 Food Security and MDG
http://slidepdf.com/reader/full/food-security-and-mdg 36/43The State of Food Insecurity in the World 2004
Tables
DEVELOPING WORLD 4 058.7 4 431.1 4 796.7 823.8 796.7 814.6 20 18 17
ASIA AND THE PACIFIC* 2 815.2 3 039.5 3 256.1 569.2 509.5 519.0 20 17 16
EAST ASIA 1 241.5 1 307.2 1 364.5 198.8 155.1 151.7 16 12 11
China [3] 1 175.7 1 237.8 1 292.5 193.5 145.6 142.1 16 12 11
Dem. People’s Rep. of Korea [5] 20.3 21.6 22.4 3.7 7.6 8.1 18 35 36
Mongolia [4] 2.3 2.4 2.5 0.8 1.1 0.7 34 46 28
Rep. of Korea [1] 43.3 45.4 47.1 0.8 0.8 0.7 — — —
SOUTHEAST ASIA 444.2 484.7 522.8 78.4 66.3 65.5 18 14 13
Cambodia [4] 10.1 11.8 13.5 4.3 5.2 4.4 43 44 33
Indonesia [3] 185.2 200.1 214.3 16.4 11.2 12.6 9 6 6
Lao People’s Dem. Rep. [4] 4.2 4.8 5.4 1.2 1.3 1.2 29 28 22
Malaysia [1] 18.3 20.9 23.5 0.5 0.5 0.6 3 — —
Myanmar [3] 41.2 44.8 48.2 4.0 3.2 2.8 10 7 6
Philippines [4] 62.5 69.9 77.1 16.2 16.3 17.2 26 23 22
Thailand [4] 55.1 58.5 61.6 15.2 12.0 12.2 28 20 20
Viet Nam [3] 67.5 74.0 79.2 20.6 16.7 14.7 31 23 19
SOUTH ASIA 1 125.3 1 242.7 1 363.3 291.3 287.3 301.1 26 23 22
Bangladesh [4] 112.1 126.3 140.9 39.2 50.4 42.5 35 40 30
India [4] 863.3 948.6 1 033.3 215.8 203.0 221.1 25 21 21
Nepal [3] 19.1 21.4 24.1 3.9 5.6 4.0 20 26 17
Pakistan [4] 113.7 128.4 146.3 27.7 23.8 29.3 24 19 20
Sri Lanka [4] 17.0 17.9 18.8 4.8 4.6 4.1 28 26 22
LATIN AMERICA AND THE CARIBBEAN 443.4 482.5 521.2 59.5 54.8 52.9 13 11 10NORTH AMERICA 84.8 92.7 100.5 4.6 5.0 5.2 5 5 5
Mexico [3] 84.8 92.7 100.5 4.6 5.0 5.2 5 5 5
CENTRAL AMERICA 28.8 32.7 36.9 5.0 6.5 7.4 17 20 20
Costa Rica [2] 3.2 3.6 4.0 0.2 0.2 0.2 6 5 4
El Salvador [3] 5.2 5.8 6.3 0.6 0.8 0.7 12 14 11
Guatemala [4] 9.0 10.3 11.7 1.4 2.2 2.8 16 21 24
Honduras [4] 5.0 5.8 6.6 1.1 1.2 1.5 23 21 22
Nicaragua [4] 3.9 4.6 5.2 1.2 1.5 1.4 30 33 27
Panama [4] 2.5 2.7 3.0 0.5 0.6 0.8 21 23 26
THE CARIBBEAN 28.5 30.2 31.7 7.8 8.9 6.7 27 30 21
Cuba [2] 10.7 11.0 11.2 0.8 1.9 0.4 8 18 3
Dominican Rep. [4] 7.2 7.8 8.5 1.9 2.0 2.1 27 26 25
Haiti [5] 7.0 7.6 8.1 4.6 4.5 3.8 65 59 47Jamaica [3] 2.4 2.5 2.6 0.3 0.3 0.3 14 11 10
Trinidad and Tobago [3] 1.2 1.3 1.3 0.2 0.2 0.2 13 15 12
SOUTH AMERICA 301.3 327.0 352.2 42.0 34.4 33.6 14 11 10
Argentina [1] 33.0 35.2 37.5 0.7 0.4 0.6 — — —
Bolivia [4] 6.8 7.6 8.5 1.9 1.9 1.8 28 25 21
Brazil [3] 151.2 162.8 174.0 18.5 16.5 15.6 12 10 9
Chile [2] 13.3 14.4 15.4 1.1 0.7 0.6 8 5 4
Colombia [3] 35.7 39.3 42.8 6.1 5.1 5.7 17 13 13
Ecuador [2] 10.5 11.6 12.6 0.9 0.6 0.6 8 5 4
Guyana [3] 0.7 0.7 0.8 0.2 0.1 0.1 21 12 9
Paraguay [3] 4.3 5.0 5.6 0.8 0.7 0.8 18 13 14
Peru [3] 22.2 24.3 26.4 9.3 4.6 3.4 42 19 13
Suriname [3] 0.4 0.4 0.4 0.1 0.0 0.0 13 10 11Uruguay [2] 3.1 3.2 3.4 0.2 0.1 0.1 6 4 4
Venezuela [3] 20.0 22.4 24.8 2.3 3.5 4.3 11 16 17
Table 1. PREVALENCE OF UNDERNOURISHMENT in developing countries and countries in transition
DEVELOPING WORLD Total population Number of people undernourished Proportion of undernourished
Region/subregion/country in total population[undernourishment category] 1990–1992 1995–1997 2000–2002 1990–1992 1995–1997 2000–2002 1990–1992 1995–1997 2000–2002
millions millions %

8/8/2019 Food Security and MDG
http://slidepdf.com/reader/full/food-security-and-mdg 37/43The State of Food Insecurity in the World 2004 35
NEAR EAST AND NORTH AFRICA* 322.8 362.6 399.4 24.8 34.9 39.2 8 10 10
NEAR EAST* 202.5 230.2 255.0 19.4 29.2 33.1 10 13 13
Iran, Islamic Rep. of [2] 58.0 63.3 67.3 2.1 2.1 2.7 4 3 4
Jordan [3] 3.4 4.4 5.2 0.1 0.3 0.4 4 7 7
Kuwait [3] 2.1 1.8 2.3 0.5 0.1 0.1 23 5 5
Lebanon [2] 2.8 3.2 3.5 0.1 0.1 0.1 — 3 3
Saudi Arabia [2] 17.1 19.5 22.8 0.7 0.8 0.8 4 4 3
Syrian Arab Rep. [2] 13.1 15.0 17.0 0.7 0.6 0.6 5 4 4
Turkey [2] 58.7 64.1 69.3 1.0 1.5 1.8 — — 3
United Arab Emirates [1] 2.1 2.6 2.9 0.1 0.1 0.1 4 — —
Yemen [5] 12.5 15.7 18.7 4.2 5.7 6.7 34 36 36
NORTH AFRICA 120.4 132.4 144.4 5.4 5.7 6.1 4 4 4
Algeria [3] 25.6 28.4 30.8 1.3 1.7 1.7 5 6 5
Egypt [2] 57.0 62.8 69.1 2.5 2.2 2.4 4 3 3
Libyan Arab Jamahiriya [1] 4.4 4.8 5.3 0.0 0.0 0.0 — — —
Morocco [3] 25.0 27.3 29.6 1.5 1.7 2.0 6 6 7
Tunisia [1] 8.4 9.1 9.6 0.1 0.1 0.1 — — —
SUB-SAHARAN AFRICA* 477.3 546.4 620.0 170.4 197.4 203.5 36 36 33
CENTRAL AFRICA 63.4 73.6 82.0 22.7 38.8 45.2 36 53 55
Cameroon [4] 12.0 13.8 15.4 4.0 4.6 3.9 33 33 25
Central African Rep. [5] 3.0 3.4 3.8 1.5 1.7 1.6 50 51 43
Chad [4] 6.0 6.9 8.1 3.5 3.4 2.7 58 49 34
Congo [5] 2.6 3.0 3.5 1.4 1.8 1.3 54 59 37
Dem. Rep. of the Congo [5] 38.8 45.3 49.9 12.2 27.2 35.5 32 60 71Gabon [3] 1.0 1.1 1.3 0.1 0.1 0.1 10 8 6
EAST AFRICA* 167.8 190.8 217.7 76.4 88.7 86.2 46 46 40
Burundi [5] 5.7 6.1 6.4 2.7 3.8 4.4 48 63 68
Eritrea [5]** na 3.3 3.9 na 2.2 2.8 na 68 73
Ethiopia [5]** na 59.0 67.3 na 35.8 31.3 na 61 46
Kenya [4] 24.4 28.1 31.1 10.7 10.8 10.3 44 38 33
Rwanda [5] 6.4 5.5 8.0 2.8 2.8 3.0 44 52 37
Sudan [4] 25.5 28.7 32.2 8.0 6.6 8.5 32 23 27
Uganda [3] 17.9 20.9 24.2 4.2 5.4 4.6 24 26 19
United Rep. of Tanzania [5] 27.0 31.7 35.6 9.9 15.8 15.6 37 50 44
SOUTHERN AFRICA 71.0 80.6 90.1 34.1 36.5 35.7 48 45 40
Angola [5] 9.6 11.2 12.8 5.6 5.4 5.1 58 49 40
Botswana [4] 1.4 1.6 1.7 0.3 0.4 0.6 23 27 32Lesotho [3] 1.6 1.7 1.8 0.3 0.2 0.2 17 14 12
Madagascar [5] 12.3 14.2 16.4 4.3 5.7 6.0 35 40 37
Malawi [4] 9.6 10.3 11.6 4.8 4.1 3.8 50 40 33
Mauritius [3] 1.1 1.1 1.2 0.1 0.1 0.1 6 6 6
Mozambique [5] 13.9 16.4 18.2 9.2 9.5 8.5 66 58 47
Namibia [4] 1.5 1.7 1.9 0.5 0.6 0.4 35 36 22
Swaziland [3] 0.9 1.0 1.1 0.1 0.2 0.2 14 23 19
Zambia [5] 8.4 9.6 10.6 4.0 4.6 5.2 48 48 49
Zimbabwe [5] 10.7 11.9 12.7 4.9 5.6 5.6 45 47 44
WEST AFRICA 175.1 201.4 230.3 37.2 33.5 36.4 21 17 16
Benin [3] 4.8 5.6 6.4 1.0 0.9 0.9 20 17 15
Burkina Faso [3] 9.2 10.6 12.3 1.9 2.0 2.3 21 19 19
Côte d’Ivoire [3] 12.9 14.7 16.1 2.3 2.3 2.2 18 16 14Gambia [4] 1.0 1.2 1.4 0.2 0.4 0.4 22 31 27
Ghana [3] 15.7 17.9 20.0 5.8 3.2 2.5 37 18 13
Table 1 cont. PREVALENCE OF UNDERNOURISHMENT in developing countries and countries in transition
DEVELOPING WORLD Total population Number of people undernourished Proportion of undernourished
Region/subregion/country in total population[undernourishment category] 1990–1992 1995–1997 2000–2002 1990–1992 1995–1997 2000–2002 1990–1992 1995–1997 2000–2002
millions millions %

8/8/2019 Food Security and MDG
http://slidepdf.com/reader/full/food-security-and-mdg 38/43The State of Food Insecurity in the World 2004
Tables
Guinea [4] 6.4 7.5 8.2 2.5 2.3 2.1 39 31 26
Liberia [5] 2.1 2.3 3.1 0.7 1.0 1.4 34 42 46
Mali [4] 9.3 10.6 12.3 2.7 3.4 3.6 29 32 29
Mauritania [3] 2.1 2.4 2.7 0.3 0.3 0.3 15 11 10
Niger [4] 7.9 9.4 11.1 3.2 3.9 3.8 41 42 34
Nigeria [3] 88.7 102.7 117.8 11.8 8.9 11.0 13 9 9
Senegal [4] 7.5 8.5 9.6 1.8 2.2 2.3 23 25 24
Sierra Leone [5] 4.1 4.1 4.6 1.9 1.8 2.3 46 44 50
Togo [4] 3.5 4.0 4.7 1.2 1.0 1.2 33 25 26
Table 1 cont. PREVALENCE OF UNDERNOURISHMENT in developing countries and countries in transition
DEVELOPING WORLD Total population Number of people undernourished Proportion of undernourished
Region/subregion/country in total population[undernourishment category] 1990–1992 1995–1997 2000–2002 1990–1992 1995–1997 2000–2002 1990–1992 1995–1997 2000–2002
millions millions %
COUNTRIES IN TRANSITION Total population Number of people undernourished Proportion of undernourished
Region/subregion/country in total population
[undernourishment category] 1993–1995 2000–2002 1993–1995 2000–2002 1993–1995 2000–2002millions millions %
COUNTRIES IN TRANSITION 413.6 409.8 23.3 28.3 6 7
COMMONWEALTH OF INDEPENDENT STATES 284.5 281.7 19.0 24.1 7 9
Armenia [4] 3.4 3.1 1.8 1.1 52 34
Azerbaijan [3] 7.7 8.2 2.6 1.2 34 15
Belarus [1] 10.3 10.0 0.1 0.2 — —
Georgia [4] 5.4 5.2 2.1 1.4 39 27
Kazakhstan [3] 16.7 15.5 0.2 2.0 — 13
Kyrgyzstan [3] 4.5 5.0 0.9 0.3 21 6
Rep. of Moldova [3] 4.4 4.3 0.2 0.5 5 11
Russian Fed. [2] 148.4 144.9 6.4 5.2 4 4
Tajikistan [5] 5.7 6.1 1.2 3.7 21 61
Turkmenistan [3] 4.1 4.7 0.5 0.4 13 9
Ukraine [2] 51.7 49.3 1.2 1.5 — 3
Uzbekistan [4] 22.3 25.3 1.7 6.6 8 26
BALTIC STATES 7.6 7.2 0.4 0.2 5 2
Estonia [3] 1.5 1.4 0.1 0.1 9 5
Latvia [2] 2.5 2.4 0.1 0.1 3 4
Lithuania [1] 3.6 3.5 0.2 0.0 4 —
EASTERN EUROPE 121.4 120.9 3.9 4.0 3 3
Albania [3] 3.2 3.1 0.2 0.2 5 6
Bosnia and Herzegovina [3] 3.6 4.1 0.3 0.3 9 8
Bulgaria [3] 8.5 8.0 0.7 0.8 8 11
Croatia [3] 4.5 4.4 0.7 0.3 16 7
Czech Rep. [1] 10.3 10.3 0.2 0.2 — —
Hungary [1] 10.2 10.0 0.1 0.0 — —
TFYR Macedonia [3] 2.0 2.0 0.3 0.2 15 11
Poland [1] 38.5 38.6 0.3 0.3 — —
Romania [1] 22.8 22.4 0.4 0.2 — —
Serbia and Montenegro [3] 10.5 10.5 0.5 1.1 5 11
Slovakia [3] 5.3 5.4 0.2 0.3 4 5
Slovenia [1] 2.0 2.0 0.1 0.0 3 —
For notes on Table 1, please see page 39.
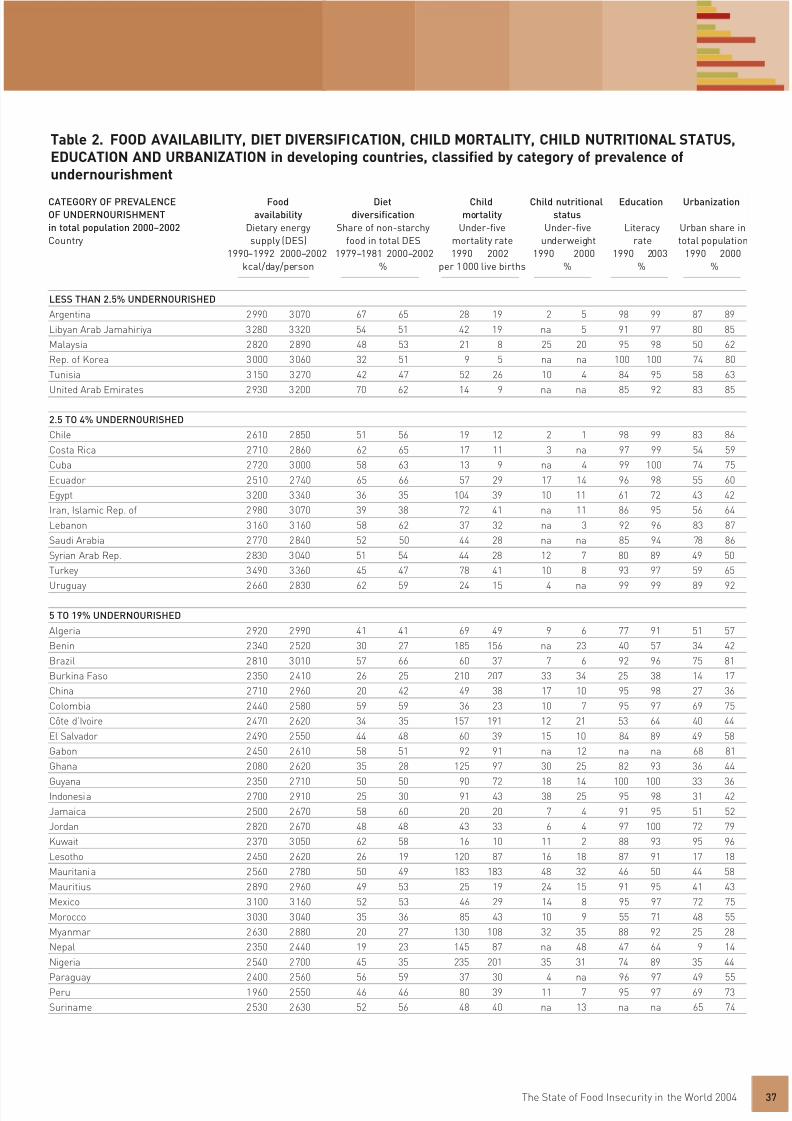
8/8/2019 Food Security and MDG
http://slidepdf.com/reader/full/food-security-and-mdg 39/43

8/8/2019 Food Security and MDG
http://slidepdf.com/reader/full/food-security-and-mdg 40/43The State of Food Insecurity in the World 2004
Tables
Swaziland 2 460 2 360 45 53 110 149 na 10 85 92 23 23
Trinidad and Tobago 2 640 2 730 59 62 24 20 7 6 100 100 69 74
Uganda 2 270 2 360 52 55 160 141 23 23 70 81 11 12
Venezuela 2 460 2 350 63 60 27 22 8 4 96 98 84 87
Viet Nam 2 180 2 530 16 28 53 26 41 34 94 96 20 24
20 TO 34% UNDERNOURISHEDBangladesh 2 070 2 190 15 16 144 73 66 48 42 50 20 23
Bolivia 2 110 2 250 52 50 120 71 11 8 93 97 56 62
Botswana 2 260 2 160 45 51 58 110 na 13 83 90 42 50
Cambodia 1 870 2 060 12 22 115 138 na 45 74 81 13 17
Cameroon 2 110 2 260 45 43 139 166 15 23 81 92 40 49
Chad 1 780 2 150 34 42 203 200 na 28 48 71 21 24
Dominican Rep. 2 260 2 320 65 67 65 38 10 5 88 92 55 58
Gambia 2 370 2 270 36 47 154 126 na 17 42 62 25 26
Guatemala 2 350 2 190 40 48 82 49 33 24 73 81 41 45
Guinea 2 110 2 380 40 40 240 165 24 23 na na 25 33
Honduras 2 310 2 350 46 54 59 42 18 17 80 86 40 44
India 2 370 2 420 32 39 123 90 56 47 64 75 26 28
Kenya 1 920 2 110 36 46 97 122 23 21 90 96 25 36Lao People’s Dem. Rep. 2 110 2 290 14 23 163 100 44 40 70 80 15 19
Malawi 1 880 2 150 29 24 241 182 28 25 63 73 12 15
Mali 2 220 2 200 30 28 250 222 31 33 28 39 24 30
Mongolia 2 070 2 240 52 53 104 71 12 13 99 99 57 57
Namibia 2 060 2 270 42 40 84 67 26 na 87 93 27 31
Nicaragua 2 220 2 280 52 49 68 41 11 10 68 73 53 56
Niger 2 020 2 130 28 26 320 264 43 40 17 25 16 21
Pakistan 2 300 2 430 42 47 130 104 40 38 47 60 31 33
Panama 2 320 2 240 61 61 34 25 na 8 95 97 54 56
Philippines 2 260 2 380 41 44 63 37 34 32 97 99 49 59
Senegal 2 280 2 280 34 39 148 138 22 23 40 54 40 47
Sri Lanka 2 230 2 390 42 45 23 19 37 33 95 97 21 21
Sudan 2 160 2 260 50 47 120 94 34 41 65 80 27 36
Thailand 2 250 2 450 33 50 40 28 25 18 98 99 29 31
Togo 2 150 2 300 22 23 152 141 25 25 64 78 29 33
35% OR MORE UNDERNOURISHED
Angola 1 780 2 040 40 32 260 260 na 31 na na 26 33
Burundi 1 900 1 640 56 48 190 190 38 45 52 67 6 9
Central African Rep. 1 870 1 980 34 43 180 180 27 24 52 71 37 41
Congo 1 860 2 090 34 37 110 108 24 na 93 98 48 52
Dem. People’s Rep. of Korea 2 450 2 140 34 36 55 55 na 28 na na 58 60
Dem. Rep. of the Congo 2 170 1 630 28 24 205 205 na 31 69 85 28 30
Eritrea na 1 520 na 25 147 89 41 40 61 73 16 19
Ethiopia na 1 840 na 20 204 171 46 47 43 59 13 15
Haiti 1 780 2 080 49 45 150 123 27 17 55 67 29 36
Liberia 2 210 1 990 27 36 235 235 na 27 57 72 42 45
Table 2 cont. FOOD AVAILABILITY, DIET DIVERSIFICATION, CHILD MORTALITY, CHILD NUTRITIONALSTATUS, EDUCATION AND URBANIZATION in developing countries, classified by category of prevalence ofundernourishment
CATEGORY OF PREVALENCE Food Diet Child Child nutritional Education Urbanization
OF UNDERNOURISHMENT availability diversification mortality status
in total population 2000–2002 Dietary energy Share of non-starchy Under-five Under-five Literacy Urban share in
Country supply (DES) food in total DES mortality rate underweight rate total population
1990–1992 2000–2002 1979–1981 2000–2002 1990 2002 1990 2000 1990 2003 1990 2000
kcal/day/person % per 1 000 live births % % %

8/8/2019 Food Security and MDG
http://slidepdf.com/reader/full/food-security-and-mdg 41/43The State of Food Insecurity in the World 2004 39
Table 2 cont. FOOD AVAILABILITY, DIET DIVERSIFICATION, CHILD MORTALITY, CHILD NUTRITIONALSTATUS, EDUCATION AND URBANIZATION in developing countries, classified by category of prevalence ofundernourishment
Madagascar 2 080 2 060 27 23 168 135 41 40 72 82 24 26
Mozambique 1 740 2 030 25 25 240 205 na 26 49 64 21 32
Rwanda 1 950 2 050 50 44 173 203 29 24 73 86 5 14
Sierra Leone 1 990 1 930 40 36 302 284 29 27 na na 30 37
United Rep. of Tanzania 2 050 1 960 31 29 163 165 29 29 83 92 22 32
Yemen 2 040 2 040 34 34 142 114 30 46 50 69 21 25
Zambia 1 930 1 900 23 23 180 182 21 28 81 90 39 35Zimbabwe 1 970 2 020 34 44 80 123 12 13 94 98 29 34
CATEGORY OF PREVALENCE Food Diet Child Child nutritional Education Urbanization
OF UNDERNOURISHMENT availability diversification mortality status
in total population 2000–2002 Dietary energy Share of non-starchy Under-five Under-five Literacy Urban share in
Country supply (DES) food in total DES mortality rate underweight rate total population
1990–1992 2000–2002 1979–1981 2000–2002 1990 2002 1990 2000 1990 2003 1990 2000
kcal/day/person % per 1 000 live births % % %
NOTES TO TABLE 2
Non-starchy food: all food sources for DES, except cereals and roots and
tubers.
Under-five mortality rate: probability that a newborn baby will die before
reaching age five, if subject to current age-specific mortality rates. The
probability is expressed as a rate per 1 000 live births.
Under-five underweight: proportion of children under the age of five whose
weight falls below the mean weight-for-age by two standard deviations or
more. Dates of the surveys vary. For each country, data were included for
the year closest to 1990 from the decade 1985–1994 and for the most recent
year from the decade 1995–2004.
Literacy rate: The percentage of persons aged between 15 and 24 who
can, with understanding, both read and write a short simple statement oneveryday life.
Urbanization: Percentage of population at mid-year residing in urban areas.
KEY
na data not available
SOURCES
Category of undernourishment, food availability and diet diversification: FAO
Child mortality: UNICEF
Child nutritional status: WHO
Education: UNESCO
Urbanization: UN Population Division: UN Population Prospects, 2003
revision
NOTES TO TABLE 1
Countries revise their official statistics regularly for the past as well as
the present. The same holds for population data of the UN. Whenever
this happens, FAO revises its estimates of undernourishment accordingly.
Therefore users are advised to refer to changes of estimates over time only
within the same SOFI publication and refrain from comparing data publishedin editions for different years.
Figures following country name refer to the prevalence categories
(proportion of the population undernourished in 2000–2002):
[1] < 2.5% undernourished
[2] 2.5–4% undernourished
[3] 5–19% undernourished
[4] 20–34% undernourished
[5] 35% undernourished
Table does not list countries for which there were insufficient data.
* Although not listed separately, provisional estimates for Afghanistan, Iraq,
Papua New Guinea and Somalia have been included in the relevant regional
aggregates.
** Eritrea and Ethiopia were not separate entities in 1990–1992 but estimates
of the number and proportion of undernourished in the former Ethiopia PDR
are included in regional and subregional aggregates for that period.
KEY
— proportion less than 2.5% undernourished
na data not available
0.0 zero or less than half the unit shown
SOURCES
Total population: UN Population Prospects, 2002 revision
Undernourishment: FAO estimates

8/8/2019 Food Security and MDG
http://slidepdf.com/reader/full/food-security-and-mdg 42/43

8/8/2019 Food Security and MDG
http://slidepdf.com/reader/full/food-security-and-mdg 43/43
The State of
Food Insecurity in the World
The sixth edition of The State of Food Insecurity in the World reports that the
number of chronically hungry people in the developing world has fallen by
only 9 million since the World Food Summit baseline period of 1990–1992. The
conclusion is inescapable – we must do better.
Looking at the impressive progress that more than 30 countries in all
developing regions have made in reducing hunger, the report highlights another
clear and compelling lesson – we can do better.
And for the first time, The State of Food Insecurity in the World 2004 presents
provisional estimates of the staggering costs that hunger inflicts on households
and nations – the millions of lives ravaged by premature death and disability,
the billions of dollars in lost productivity and earnings. On both moral and
pragmatic grounds, these estimates lead to one more unavoidable conclusion
– we cannot afford not to do better.
The report also includes a special feature examining the impact that the rapid
growth of cities and incomes in developing countries and the globalization of the
food industry have had on hunger, food security and nutrition.
The State of Food Insecurity in the World 2004 concludes with an urgent appeal
to scale up action, resources and commitment in order to achieve the World
Food Summit goal. That goal of cutting the number of hungry people in half
by the year 2015 can still be reached if we just focus our efforts over the next
ten years on simple, low-cost, targeted actions that will improve food security
quickly for very large numbers of people.
Hunger cannot wait.
ISBN 92-5-105178-X