Embed Size (px)
Citation preview

Coordination meeting for statisticians on tracking and monitoring food security in the Arab Region
DR. RAMI ZURAYK
Food Security monitoring framework :
Suite of indicators, dashboard, case study
UN House –Beirut26th June 2019

Outline:1 - Indicators:
• Definition
• Method of measurement
• Justification, Arab relevance and link to regional strategies
• Link to SDGs
• Source
• Normalization
2 – Interpreting those indicators: The Donut
• Algeria: case study with trends and policy guidance

1- Indicators
Core
Availability
Access
Utilization
Stability
1-DEFINITION
2-METHOD OF MEASUREMENT
3-JUSTIFICATION, ARAB RELEVANCE AND LINK TO REGIONAL STRATEGIES
4-LINK TO SDGs
5-DATA SOURCE
6-NORMALIZATION

1.1: Core Indicators – CO1: Prevalence of Undernourishment (PoU)
DEFINITION:An estimate of the proportion of the populationwhose habitual food consumption is insufficient to providethe dietary energy levels that are required to maintain a normal active and healthy life
METHOD OF MEASUREMENT:The FAO measure of food deprivation, which is referred to as the prevalence of undernourishment, is based on a comparison of usual food consumption expressed in terms of dietary energy (kcal) with certain energy requirement norms. The part of the population with food consumption below the energy requirement norms. The part of the population with food consumption below the energy requirement norm is considered undernourished ("underfed").
Justification, Arab relevance, link to regional strategies:Undernourishment is closely linked to food availability and access, therefore, issues within those two pillars will be directly reflected in this indicator and thus, in the overall food security status of the country. It is linked to a number of illnesses, mortality and childhood metabolic imprinting leading to long term developmental impacts and intergenerational cycle of malnutrition. Therefore, monitoring undernourishment is crucial for tracking food security performance globally and more specifically in the Arab region in the light of recent and ongoing conflicts and protracted crisis.Strategies: Arab Regional Strategy for Sustainable Consumption and Production (En) (ASCP) and the Arab Strategy for Agricultural Development (En) (ASAD).
LINK TO SDGs:This indicator was selected as it is directly related to SDG 2, more precisely to measure progress towards target 2.1. It is also connected to other targets and goals which are implicitly mentioning undernourishment, such as for example target 2.2.It was selected as an ex-post Tier 1 indicator, which informs states about the outcomes of food insecurity based on measured data.
DATA SOURCE:
World Bank
NORMALIZATION:PoU was normalized on a scale from 0 to 10, with 2.5 and 50 as maximum and minimum respectively; as 50% is the threshold to famine - Reversed indicator.
CO1

1.1: Core Indicators – CO2: Prevalence of severe Food Insecurity
DEFINITION:This indicator is used to estimate the percentage of individuals in the population who have experienced food insecurity at severe levels. Severe food insecurity is characterized by feeling hungry but not eating, or not eating for an entire day, due to lack of money or other resources
METHOD OF MEASUREMENT:This FAO-developed indicator consists of an-8 questions questionnaire that investigates people’s experience of access to adequate food
Justification, Arab relevance, link to regional strategies:The inability to access food results in a series of experiences and conditions that are fairly common across cultures and socio-economic contexts and that range from being concerned about the ability to obtain enough food, to the need to compromise on the quality or the diversity of food consumed, to being forced to reduce the intake of food by cutting portion sizes or skippingmeals, up to the extreme condition of feeling hungry and not having means to access any food for a whole day. Therefore, thisindicator intimately relates to the four pillars of food security and is crucial for tracking food security performance in the Arab region in the light of recent and ongoing conflicts and protracted crisis, and to assess whether food is distributed fairly across the local populationStrategies: Arab Reg Strategy for Sustainable Consumption and Production (En) (ASCP) and the Arab Strategy for Agricultural Development (En) (ASAD).
LINK TO SDGs:This indicator was selected as it one of the SDG 2 indicators where it is used to track progress towards target 2.1. It is also connected to other targets and goals which implicitly mention undernourishment, such as for example target 2.2. This core indicator was selected as an ex-post Tier 1 indicator, which informs states about the outcomes of food insecurity based on measured data.
DATA SOURCE:The category “severe food insecurity” was selected because it was the only one for which data was available. FIES data can be found on FAOSTAT and it was also extracted from the FAO 2018 “Regional overview of food security and nutrition in the Near East and North Africa”.
NORMALIZATION:70.6 and 0.6 as minimums and maximums respectively - Reversed indicator, with 0.6 (0% of the population has experienced food insecurity) representing best case scenario with a score of 10, and 70.6 (100% of the population has experienced food insecurity) as the worst-case scenario with a score of 0.
CO2

1.1: Core Indicators – CO3: Prevalence of Obesity
DEFINITION:Abnormal or excessive fat accumulation that may impair health. Body Mass Index (BMI) is a simple index of weight-for-height that is commonly used to classify overweight and obesity in adults. It is defined as a weight in kilograms divided by the square of height in meters (kg/m2).
METHOD OF MEASUREMENT:Obesity is defined as having a BMI equal or greater than 30. Therefore, this indicator reveals the percentage of individuals in the population reaching or surpassing this BMI.
Justification, Arab relevance, link to regional strategies:The nutrition dimensions of food security are now fully recognized. Obesity is due overconsumption of calories leading to a large number of illnesses and non-communicable diseases. It impedes economic participation and growth as well as environmental sustainability. Obesity can also be related to a deficient diet. Low income groups can suffer from obesity due to overconsumption of cheap, unhealthy foods, especially in the absence of healthy food alternatives. This indicator was specifically selected in this framework because obesity rates in the Arab region are escalating at alarming rates becoming the highest in the world with nearly one quarter of the population being obese (Arab Horizon, 2017). This calls for urgent monitoring actions, and as current foodconsumption patterns are still transitioning towards westernized habits, obesity rates are projected to further increase. Strategies: Arab Reg Strategy for Sustainable Cons and Prod (En) (ASCP) and the Arab Strategy for Agricultural Development (En) (ASAD).
LINK TO SDGs:There is no direct mention of “obesity” in the SDGs, but as it is related to food consumption quality and patterns leading to the widespread increase of non-communicable diseases, it’s related to the SDGs through Goal 3 more specifically target 3.4 “By 2030, reduce by one third premature mortality from non-communicable diseases through prevention and treatment and promote mental health and well-being”. Obesity was selected as it is the outcome of food access and food utilization, thus being an ex-post indicator.
DATA SOURCE:
FAOSTAT
NORMALIZATION:58.5 and 1.3 as minimums and maximums respectively. It was computed as a reversed indicator, with 1.3 (0% of the population is obese) representing best case scenario with a score of 10, and 58.5 (100% of the population is obese) the worst case scenario with a score of 0.
CO3

1.2: Availability– AV1: Primary wheat yield as a percentage of potentially
achievable yield
DEFINITION:reflects the wheat yield gap, one of the major limiting factors for food availability from national sources. It was developed by ESCWA in consultations with national and international experts for the specific purpose of this monitoring framework. Unlike the remaining indicators, it is not associated with a metadata page but needs to be calculated from various sources. It shows the recorded primary cereal yield as a percentage of a country’s potentially achievable yield, to assess if countries are reaching their production potential
METHOD OF MEASUREMENT: Uses data on potentially achievable wheat yield from Mueller et al, 2012, a paper in Nature. The actually achieved wheat yield, extracted from FAOSTAT is then used to calculate the percentage, using the following formula :
X= =100∗ 𝐴𝑐ℎ𝑖𝑒𝑣𝑒𝑑 𝑦𝑖𝑒𝑙𝑑 / 𝑃𝑜𝑡𝑒𝑛𝑡𝑖𝑎𝑙𝑙𝑦 𝑎𝑐ℎ𝑖𝑒𝑣𝑎𝑏𝑙𝑒 𝑦𝑖𝑒𝑙𝑑
Justification, Arab relevance, link to regional strategies:Closing the primary wheat yield gap would contribute to higher availability of food, both for direct human consumption and asinputs to livestock production (as hay). Reducing this yield gap will decrease food import dependency. This indicator is particularly relevant to the Arab region as wheat is the staple food in the MENA region, accounting for some 37% of total food supply (Solh, 2013). The region is also one of the largest cereal importers in the world. Thus, it is highly vulnerable to fluctuations in international commodity markets, as was seen during the 2008 food crisis when global wheat availability decreased and prices spiked. Additionally, production policies are currently aimed at boosting yields and local production. Therefore, monitoring this indictor is crucial. Strategies: Arab Regional Strategy for Sustainable Consumption and Production (En) (ASCP), the Arab Strategy for Agricultural Development (En) (ASAD), the Arab Strategy for Water Security in the Arab Region (En) (ASWS) and the Arab Food Emergency Programme (Ar) (AFEP)
LINK TO SDGs:This indicator is directly related to SDG 2, specifically to target 2.3
DATA SOURCE:
Muller et al, 2012, and FAOSTAT
NORMALIZATION:This indicator was normalized on a scale from 0 to 10, with 28 and 142 as minimums and maximums respectively. Here, 28% (where the country is not achieving any of its potential) representing the worst case scenario with a score of 0, and 142% (where the country is achieving its full potential) the best case scenario with a score of 10.
AV1

1.2: Availability– AV2: Agriculture orientation index for government expenditures
(AOI)
DEFINITION:The Agriculture Orientation Index (AOI) for Government Expenditures is defined as the Agriculture share of Government Expenditure, divided by the Agriculture value added share of GDP, where Agriculture refers to the agriculture, forestry, fishing and hunting sector
METHOD OF MEASUREMENT:The measure is a currency-free index, calculated as the ratio of these two shares An AOI greater than 1 reflects a higher orientation towards the agriculture sector, which receives a higher share of government spending relative to its contribution to economic value-added. An AOI less than 1 reflects a lower orientation to agriculture, while an AOI equal to 1 reflects neutrality in a government’s orientation to the agriculture sector. Therefore, the best-case scenario would be when both numerator and denominator are proportionally scaled, as the closer the ratio is to 1, the wiser the investments are.
Justification, Arab relevance, link to regional strategies:Increased investments in the agriculture sector include soil improvement and erosion control, better water use practices, animaland livestock health training and management, implementation of forestry projects among others. It would boost food availability through increased sector efficiency and productivity while supporting local farmers and income growth, thus enhancing their foodaccessibility capacity and overall wellbeing. It can also help embed ecological practices and reduce the environmental impact ofagriculture through Good Agricultural Practices (GAP). Additionally, increased local production would decrease reliance on food imports.
Strategies: Arab Regional Strategy for Sustainable Consumption and Production (En) (ASCP), the Arab Strategy for Water Security in the Arab Region (En) (ASWS), the Arab Food Emergency Programme (Ar) (AFEP), the Arab Fisheries Strategy (Ar) (AFS) the Arab Strategy for Agricultural Development (En) (ASAD), and the Pan Arab RE Strategy (En) (ARES).
LINK TO SDGs:This indicator was selected as it is closely related to SDG2, more specifically Target 2.a “Increase investment, including through enhanced international cooperation, in rural infrastructure, agricultural research and extension services, technology development and plant and livestock gene banks in order to enhance agricultural productive capacity in developing countries, in particular least developed countries
DATA SOURCE:
FAOSTAT
NORMALIZATION:For scaling of this indicator, it was agreed to convert the numbers to a first scale based on their distance from the mean (1, in this case; refer to first paragraph). And the worst-case scenario was taken as one unit away from 1 (i.e. 0, or 2, which mean either 0 investments or investments that are double the agriculture value added share of GDP). But given that we have to choose only one minimum and one maximum, all numbers that are between 1 and 2 (i.e. 1 unit higher than 1) were subtracted from 2, in order to place them between 0 and 1. This allowed for setting a maximum (best) as 1, and a minimum (worse) as 0. To do so, the following “ifs” formula was used, with X being the original value: X=Ifs (logical test 1, value if true 1, [logical test 2, value if true 2]) X=Ifs (AV2≤1, AV2, [AV2>1, ABS(X-2)]) In simpler terms, if the raw value X was lower than 1 (between 0 and 1), it can be used as is and rescaled to 0-10; however, if X was higher than 1 (between 1 and 2), 2 was subtracted from X, and the result’s absolute value was taken to be rescaled again to 0-10. On that note, any number that was bigger than 2 was being treated as being equal to 2, as this is not a recommended investment strategy.
Min=0.02Max=8.5Not reversed
AV2

1.2: Availability– AV3: Food losses (as a percent of total food available)
DEFINITION:“Amount of the commodity in question lost through wastage (waste) during the year at all stages between the level at which production is recorded and the household, i.e. storage and transportation. Losses occurring before and during harvest are excluded. Waste from both edible and inedible parts of the commodity occurring in the household is also excluded. Quantities lost during the transformation of primary commodities into processed products are taken into account in the assessment of respective extraction/conversion rates. Distribution wastes tend to be considerable in countries with hot humid climate, difficult transportation and inadequate storage or processing facilities. This applies to the more perishable foodstuffs, andespecially to those which have to be transported or stored for a long time in a tropical climate. Waste is often estimated as a fixed percentage of availability, the latter being defined as production plus imports plus stock withdrawals”
METHOD OF MEASUREMENT:The amount of total food available was first calculated based on data from FAOSTAT’s food balance sheets for each individual country in a specific year, according to the following formula:
Available food = Imports + Production – Exports
To define the losses with upper and lower bounds (i.e. maximum and minimum), the losses are converted to percentages of the available quantity of food using the following formula:
𝑋=100∗𝑙𝑜𝑠𝑠𝑒𝑠 / 𝐴𝑣𝑎𝑖𝑙𝑎𝑏𝑙𝑒 𝑓𝑜𝑜𝑑, where losses and available food are in tons
Justification, Arab relevance, link to regional strategies:Food losses impact food availability, access, and utilization, and it is of particular concern in the Arab region. Deficient practices and infrastructure in production and imports are responsible for the region’s high rates of losses (Arab Horizon, 2017). Also, high food losses lead to an increased waste and usage of already scarce natural resources.
Strategies: Arab Strategy for Agricultural Development (En) (ASAD), the Arab Reg Strategy for Sustainable Consumption and Production (En) (ASCP), the Arab Food Emergency Programme (Ar) (AFEP), the Arab Strategy for Water Security in the Arab Region (En) (ASWS), the UNCCD 2018-2030 Strategic Framework (En) (UNCCD) and the Arab Fisheries Strategy (Ar) (AFS).
LINK TO SDGs:This indicator is listed in the SDGs in Goal 12, more precisely in Target 12.3: “By 2030, halve per capita global food waste at the retail and consumer levels and reduce food losses along production and supply chains, including post-harvest losses”
DATA SOURCE:
FAO FOOD BALANCE SHEET
NORMALIZATION:This number is limited between 0% and 41.3%; i.e. either a country does not waste any of its food (X=0%; equivalent to 10 on the 0-10 scale, which is the best scenario), or it wastes all of its available food (X=41.3%; equivalent to 0 on the 0-10 scale, which is the worst scenario). This is a reversed indicator given that the larger the losses, the worse the situation. Min=41.3, Max= 0=0
AV3

1.2: Availability– AV4: Average dietary energy supply adequacy
DEFINITION:The indicator expresses the Dietary Energy Supply (DES) as a percentage of the Average Dietary Energy Requirement (ADER).
METHOD OF MEASUREMENT:Each country's or region's average supply of calories for food consumption is normalized by the average dietary energy requirement estimated for its population to provide an index of adequacy of the food supply in terms of caloriesThe definition was copied as is from the indicator’s metadata
Justification, Arab relevance, link to regional strategies:This indicator reflects the adequacy of the supplied dietary energy at the national level and therefore, food availability in terms of quantity. The quantity of food provided should fulfill the energy needs of the population to allow a healthy development.
Strategies : Arab Regional Strategy for Sustainable Consumption and Production (En) (ASCP), and the Arab Strategy for Agricultural Development (En) (ASAD
LINK TO SDGs:This indicator is implicitly linked to SDG2, and has a direct effect on food security as it reflects if the supplied food satisfies the population’s caloric needs.
DATA SOURCE:
FAO FOOD BALANCE SHEET
NORMALIZATION:As recommended by FAO, this indicator was normalized on a 0-10 scale, using the mean of the lowest global values during the evaluated period (2010-present) as a minimum value and the mean of the highest global values during the evaluated period (2010-present) as a maximum value. MIN: 81%, MAX: 155%
AV4

1.2: Availability– AV5: Cereal import dependency ratio
DEFINITION:The cereal imports dependency ratio tells how much of the available domestic food supply of cereals has been imported and how much comes from the country's own production
METHOD OF MEASUREMENT:The indicator is calculated in three year averages, from 1990-92 to 2009-11, to reduce the impact of possible errors in estimated production and trade, due to the difficulties in properly accounting of stock variations in major food.It is computed as:
(Cereal imports - cereal exports) / (cereal production + cereal imports - cereal exports) * 100
Given this formula the indicator assumes only values lower or equal to 100. Negative values indicate that the country is a net exporter of cereals.
Justification, Arab relevance, link to regional strategies: As m
As mentioned in AV1, cereals are the main source of energy globally and specifically in the Arab region, and they constitute thebulk of the food imports. This indicator provides a measure of the dependence of a country or region from cereal imports. Thegreater the indicator, the higher the dependence hence higher vulnerability to global price shocks. The Arab region relies heavily on cereal imports to cater for its needs; which increases food availability as the region’s yields are relatively low. This renders the region very vulnerable to international price shocks and to conflicts.
LINK TO SDGs:This indicator is directly related to SDG 2, as increased cereal availability through imports can contribute to ending hunger when local production can’t cope with local demand
DATA SOURCE:
FAOSTAT
NORMALIZATION:It was normalized on a 0-10 scale with 100 and -187.5 as maximums and minimums. This is a reversible indicator given that the larger the value, the worse the situation.
AV5

1.2: Availability– AV6: Share of water resources used in agriculture, out of total
renewable water resources
DEFINITION:This indicator represents the ratio of water withdrawn for agriculture to the total renewable water resources. Therefore, it provides information about the sustainable use of water in food production
METHOD OF MEASUREMENT:This indicator was calculated using the following formula:
𝑋=100∗𝐴𝑔𝑟𝑖𝑐𝑢𝑙𝑡𝑢𝑟𝑎𝑙 𝑤𝑎𝑡𝑒𝑟 𝑤𝑖𝑡ℎ𝑑𝑟a𝑤𝑎𝑙 / 𝑇𝑜𝑡𝑎𝑙 𝑟𝑒𝑛𝑒𝑤𝑎𝑏𝑙𝑒 𝑤𝑎𝑡𝑒𝑟 𝑟𝑒𝑠𝑜𝑢𝑟𝑐𝑒𝑠
Justification, Arab relevance, link to regional strategies:Water is crucial for crop production and food availability. The region suffers from renewable water resources scarcity, and unsustainable agricultural practices with increased demand on food leading to an overexploitation of freshwater resources. Renewable water resources availability is increasingly critical for food security, as decreased capacity to produce affects availability and access, and increases reliance on food imports.
LINK TO SDGs:This indicator was selected due to its direct or indirect relation to SDG 2, SDG 6, SDG 12 and SDG 15, as water usage is connected to agricultural practices, natural resource use, sustainable production and ecosystem health and desertification.
DATA SOURCE:
AQUASTAT
NORMALIZATION:It was normalized on a 0-10 scale with 0.1 and 107 as maximums and minimums – Reversed indicator
AV6

1.3: Access – AC1: Poverty headcount ratio
DEFINITION:National poverty headcount ratio is the percentage of population living under the national poverty lines. National estimates are founded on population-weighted subgroup assessments from household surveys.
METHOD OF MEASUREMENT:The World Bank has intended to apply a joint standard in measuring extreme poverty, as alterations in the cost of living across the world grow, the international poverty line has to be intermittently updated using new PPP price data to reflect the changes. The $3.20 poverty line is resultant from typical national poverty lines in countries classified as Lower Middle Income. In the monitoring framework $3.20 will be used as a poverty cutoff figure, because the data is more relevant to the current situation in Arab countries than $1.9 a day
Justification, Arab relevance, link to regional strategies:Poverty is a main determinant of economic access to food. The poverty headcount ratio was selected as an indicator to assess thepoverty level in Arab countries, which in turn will help monitor accessibility to food and thus food security.
Strategies: Arab Strategy for Agriculture Development and Arab Regional Strategy for sustainable Cons and Prod.
LINK TO SDGs:This indicator is related to SDG 1Target 1.1: By 2030, eradicate extreme poverty for all people everywhere, currently measured as people living on less than $1.25 a day Target 1.2: By 2030, reduce at least by half the proportion of men, women and children of all ages living in poverty in all its dimensions according to national definitionsTarget 8.5: By 2030, achieve full and productive employment and decent work for all women and men, including for young people and persons with disabilities, and equal pay for work of equal value
DATA SOURCE:
World Bank
NORMALIZATION:Poverty headcount ratio was normalized on a scale from 0 to 10, with 0 and 91.3 as maximum and minimum respectively. It was computed as a reversed indicator, with 0 (0% of the population living below the poverty headcount ratio) representing best case scenario represented with a score of 10, and 91.3% the worst case scenario represented with a score of 0
AC1

1.3: Access – AC2: Share of food consumption expenditure in total
consumption expenditure
DEFINITION:Food consumption expenditure refers to the monetary value of acquired food, purchased and non-purchased, including non-alcoholic and alcoholic beverages as well as food expenses on away from home consumption in bars, restaurants, food courts, work canteens, street vendors, etc
METHOD OF MEASUREMENT:This indicator is calculated with data from Household Consumption and Expenditure Surveys (HCES) that comprise the monetary value of household consumption disaggregated into food and non-food items. The portion of household spending on food is equal to:
𝐸𝑥𝑝𝑒𝑛𝑑𝑖𝑡𝑢𝑟𝑒 𝑜𝑛 𝐹𝑜𝑜𝑑
𝑇𝑜𝑡𝑎𝑙 𝐸𝑥𝑝𝑒𝑛𝑑𝑖𝑡𝑢𝑟𝑒x 100
The monetary value of non-purchased items, comprising consumption from own production and in-kind payments and transfers, must be calculated from available price information
Justification, Arab relevance, link to regional strategies:Share of food consumption expenditure in total household consumption expenditure is an indicator that allows us to assess howaffordable it is for people to access food, and how food secure a household is. Spending money on food is a fundamental requirement for survival, hence the share of money spent on food implies its affordability. The more vulnerable a household is, the larger is the share of household income spent on food, however, when income rises, expenditure on food increases and expenditure on other things increases even more, reducing the share of total income spent on food, indicating easier food accessibility. Strategies: Arab DRR strategy and Arab strategy for Agriculture Development
LINK TO SDGs:This indicators is related to target 1.5: By 2030, build the resilience of the poor and those in vulnerable situations and reduce their exposure and vulnerability to climate-related extreme events and other economic, social and environmental shocks and disasters. It is also related to target 2.c Adopt measures to ensure the proper functioning of food commodity markets and their derivatives and facilitate timely access to market information, including on food reserves, in order to help limit extreme food price volatility. Related as well to target 8.5 by 2030, achieve full and productive employment and decent work for all women and men, including for young people and persons with disabilities, and equal pay for work of equal value
DATA SOURCE:
FAO
NORMALIZATION:The share of food consumption expenditure in total household consumption expenditure was normalized on a scale from 0 to 10, with 0 and 100 as maximum and minimum respectively. It was computed as a reversed indicator, with the minimum data series value being 100 (implying a worst case scenario) and the maximum 0 meaning the lower the share of food expenditure of total household expenditure is, the better the situation
AC2

1.3: Access – AC3: Unemployment rate
DEFINITION:Unemployment rate is the percentage of unemployed people in the labor force based on age and sex. Data on unemployment rate can also be segregated into males and females, this segregation will further allow us to monitor unemployment and food security not just on the individual level but also on gender basis
METHOD OF MEASUREMENT:Unemployment rate is calculated by dividing the number of unemployed people by the total number of people in the labor force. Labor force implying the total number of employed and unemployed persons within a defined age category, for this framework the age group selected was 25 years and above.
Justification, Arab relevance, link to regional strategies:According to ILO unemployment rate is rising with young people being disproportionately affected by working poverty. The ArabStates have the highest unemployment rate in the world, with huge gender gaps and elevated working poverty rates. Unemployment rate by sex and age is a critical indicator that allows us to monitor source of income within the Arab population, in order to monitor food access and thus food security.
Strategies: Arab Strategy for Agriculture Development (ASAD), Arab DRR Strategy (ADRR), Arab Regional Strategy for Sustainable Cons and Prod (ASCP), Arab strategy for Water Security in the Arab Region (ASWS), Arab food Emergency Program (AFEP)
LINK TO SDGs:This indicator is related to targets:
1.1 By 2030, eradicate extreme poverty for all people everywhere, currently measured as people living on less than $1.25 a day1.2 By 2030, reduce at least by half the proportion of men, women and children of all ages living in poverty in all its dimensions according to national definitions
1.5 By 2030, build the resilience of the poor and those in vulnerable situations and reduce their exposure and vulnerability to climate-related extreme events and other economic, social and environmental shocks and disasters2.1 By 2030, end hunger and ensure access by all people, in particular the poor and people in vulnerable situations, including infants, to safe, nutritious and sufficient food all year round8.10 Strengthen the capacity of domestic financial institutions to encourage and expand access to banking, insurance and financial services for all
DATA SOURCE:
World Bank
NORMALIZATION:Unemployment was normalized on a scale from 0 to 10, with 0.3 and 29.3 as maximum and minimum respectively. It was computed as a reversed indicator, with the minimum data series value being 29.3 (implying a worst case scenario) and the maximum 0.3 meaning the lower the unemployment rate, the better the situation
AC3

1.3: Access – AC4: Logistics performance Index
DEFINITION:Logistics Performance Index overall score echoes insights of a country's logistics founded on efficiency of customs clearance process, quality of trade- and transport-related infrastructure, ease of arranging competitively priced shipments, quality of logistics services, ability to track and trace shipments, and frequency with which deliveries reach the consignee within the scheduled time. The index ranges from 1 to 5, with a higher score representing better performance.
METHOD OF MEASUREMENT:Data from the Logistics Performance Index surveys are conducted by the World Bank in partnership with academic and international institutions, private companies and individuals engaged in international logistics. Respondents appraise eight economies on six main dimensions scaled from 1 (worst) to 5 (best). The economies are selected based on the most important export and import markets of the respondent's country. Scores for the six areas are averaged across all respondents and aggregated to a single score using principal components analysis.
Justification, Arab relevance, link to regional strategies:The logistics performance index is a tool created to assist countries in identifying the challenges and opportunities they face in their performance on trade logistics and where to adopt strategies to improve this performance. This indicator facilitates the monitoring of food security by looking at the quality of trade and transport related infrastructure, which directly relates to the access of food within a country through safe roads and strong infrastructure.
Strategies: the Arab DRR Strategy (Ar) (ADRR), UNCCD 2018-2030 Strategic Framework (En) (UNCCD), Arab Strategy for Agricultural Development (En) (ASAD) and Arab Reg Strategy for Sustainable Cons and Prod (En) (ASCP)
LINK TO SDGs:This indicator reflects SDG 1.3, 2.1 and 2.a
DATA SOURCE:
World Bank
NORMALIZATION:The logistics performance index was normalized on a scale from 0 to 10, with 1.3 and 4.1 as minimum and maximum respectively. The minimum data series value is 1.3 indicating a bad performance and the max data series value is 4.1 indicating the best performance.
AC4
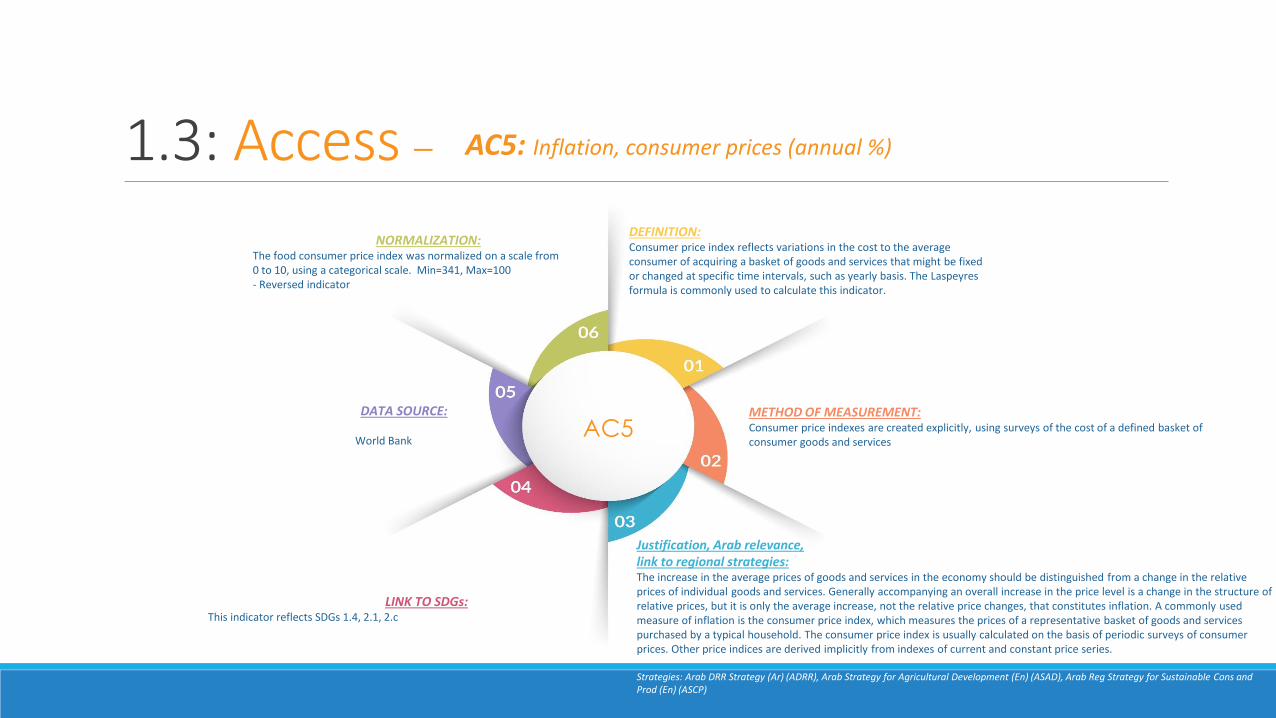
1.3: Access – AC5: Inflation, consumer prices (annual %)
DEFINITION:Consumer price index reflects variations in the cost to the average consumer of acquiring a basket of goods and services that might be fixed or changed at specific time intervals, such as yearly basis. The Laspeyresformula is commonly used to calculate this indicator.
METHOD OF MEASUREMENT:Consumer price indexes are created explicitly, using surveys of the cost of a defined basket of consumer goods and services
Justification, Arab relevance, link to regional strategies:The increase in the average prices of goods and services in the economy should be distinguished from a change in the relativeprices of individual goods and services. Generally accompanying an overall increase in the price level is a change in the structure of relative prices, but it is only the average increase, not the relative price changes, that constitutes inflation. A commonly used measure of inflation is the consumer price index, which measures the prices of a representative basket of goods and services purchased by a typical household. The consumer price index is usually calculated on the basis of periodic surveys of consumerprices. Other price indices are derived implicitly from indexes of current and constant price series.
Strategies: Arab DRR Strategy (Ar) (ADRR), Arab Strategy for Agricultural Development (En) (ASAD), Arab Reg Strategy for Sustainable Cons and Prod (En) (ASCP)
LINK TO SDGs:This indicator reflects SDGs 1.4, 2.1, 2.c
DATA SOURCE:
World Bank
NORMALIZATION:The food consumer price index was normalized on a scale from 0 to 10, using a categorical scale. Min=341, Max=100- Reversed indicator
AC5

1.4: Utilization – UT1: Proportion of population using at least basic drinking water
services
DEFINITION:This indicator encompasses both people using basic water services as well as those using safely managed water services. Basic drinking water services is defined as drinking water from an improved source, provided collection time is not more than 30 minutes for a round trip. Improved water sources include piped water, boreholes or tube wells, protected dug wells, protected springs, and packaged or delivered water
METHOD OF MEASUREMENT:The aggregates are computed using a weighted population average, and only if at least 65% of the data are available
Justification, Arab relevance, link to regional strategies:Access to clean and safely managed water is a determinant factor of safe agriculture and consumption practices. Access to safe water is also a key determinant of food security as clean water prevents nutritional diseases and infections, and therefore reduces the incidence of illnesses that can hinder the absorption of nutrients and debilitate the workforce involved in food production.Access to safe water is associated with poverty reduction and socio economic development. It is crucial to monitor this indicator in the Arab region, as the WHO/UNICEF Joint Monitoring Programme for Water Supply, Sanitation and Hygiene for March 2018 showed that 51 million people in the Arab Region lacked a basic drinking water service in 2015, 73% of whom live in rural areas.
Strategies: Arab Strategy for Agricultural Development (En) (ASAD), the Arab Health and Environment Strategy (Ar) (AHES), the Arab Regional Strategy for Sustainable Consumption and Production (En) (ASCP) and the Arab Strategy for Water Security in the Arab Region (En) (ASWS).
LINK TO SDGs:This indicator is included in SDG6, more specifically in targets 6.1 “By 2030, achieve universal and equitable access to safe and affordable drinking water for all” and 6.3 “By 2030, improve water quality by reducing pollution, eliminating dumping and minimizing release of hazardous chemicals and materials, halving the proportion of untreated wastewater and substantially increasing recycling and safe reuse globally”.
DATA SOURCE:
World Bank
NORMALIZATION:This indicator was normalized on a 0-10 scale with 18.1 and 100 as minimums and maximums respectively. 0% represents the worst case scenario where 18.1% (scaled to 0) of the population is using safely managed drinking water services, and 100% means that the whole population is using safely managed drinking water services (scaled to 10).
UT1

1.4: Utilization – UT2: Proportion of population using at least basic sanitation services
DEFINITION:This indicator is defined as “The percentage of people using at least basic sanitation services, that is, improved sanitationfacilities that are not shared with other households. This indicator encompasses both people using basic sanitation services as well as those using safely managed sanitation services. Improved sanitation facilities include flush/pour flush to piped sewer systems, septic tanks or pit latrines; ventilated improved pit latrines, compositing toilets or pit latrines with slabs.
METHOD OF MEASUREMENT:The aggregates are computed using a weighted population average, and only if at least 65% of the data are available.
Justification, Arab relevance, link to regional strategies:Access to sanitation facilities prevents the widespread of microbiological diseases and the contamination of surrounding water resources. It is a determinant factor of food security as it prevents the spread of nutritional diseases and infections, allowing for healthy human as well as economic development. It is relevant to the Arab region, as the WHO/UNICEF Joint Monitoring Programme for Water Supply, Sanitation and Hygiene for March 2018 showed that 74 million people in the Arab Region lacked a basic sanitation service in 2015, 25 million of whom practice open defecationStrategies: Arab Strategy for Agricultural Development (En) (ASAD), the Arab Health and Environment Strategy (Ar) (AHES), the Arab Regional Strategy for Sustainable Consumption and Production (En) (ASCP) and the Arab Strategy for Water Security in the Arab Region (En) (ASWS).
LINK TO SDGs:This indicator is included in SDG6, in addition to also being related to target 6.2 “By 2030, achieve access to adequate and equitable sanitation and hygiene for all and end open defecation, paying special attention to the needs of women and girls and those in vulnerable situations”.
DATA SOURCE:
World Bank
NORMALIZATION:This indicator was normalized on a 0-10 scale with 5.7 and 100 as minimums and maximums respectively. 0% represents the worst case scenario where 5.7% (scaled to 0) of the population is using safely managed sanitation services, and 100% means that the whole population is using safely managed sanitation services (scaled to 10).
UT2

1.4: Utilization – UT3: Percentage of children under 5 years of age affected by stunting
DEFINITION:Child stunting refers to a child who is too short for his or her age and is the result of chronic or recurrent malnutrition. Stunting is (height-for-age <-2 standard deviation from the median of the World Health Organization (WHO) Child Growth Standards) among children under 5 years of age
METHOD OF MEASUREMENT:Percentage of children aged <5 years stunted for age = (number of children aged 0-5 years that fall below minus two standard deviations from the median height-for-age of the WHO Child Growth Standards / total number of children aged 0-5 years that were measured) * 100. Children’s weight and height are measured using standard technology, e.g. children less than 24 months are measured lying down, while standing height is measured for children 24 months and older. The data sources include national nutrition surveys, any other nationally-representative population-based surveys with nutrition modules, and national surveillance systems.
Justification, Arab relevance, link to regional strategies:Child growth is the most widely used indicator of nutritional status in a community and is internationally recognized as an important public-health indicator for monitoring health in populations. In addition, children who suffer from growth retardation as a result of poor diets and/or recurrent infections tend to have a greater risk of suffering illness and death. The percentage ofchildren with low height-for-age reflects the cumulative effects of under-nutrition and infections since birth, and even before birth. This measure, therefore, should be interpreted as an indication of poor environmental conditions and/or long-term restriction of a child`s growth potential. Hence, stunting is a direct result of inadequate nutrition and poor food security levels.. This indicator is relevant to the Arab region especially in light of current conflicts, as Yemen has extremely high rates of stunting, along with other LDCs in the region such as Comoros, Somalia and Djibouti. Additionally, the already existing rates of stunting in Syria have likely worsened in recent years Strategies :Arab Regional Strategy for Sustainable Consumption and Production (En) (ASCP) and the Arab Strategy for Agricultural Development (En) (ASAD).
LINK TO SDGs:This indicator is directly related to SDG 2 more specifically to target 2.2 “by 2030 end all forms of malnutrition, including achieving by 2025 the internationally agreed targets on stunting and wasting in children under five years of age, and address the nutritional needs of adolescent girls, pregnant and lactating women, and older persons.
DATA SOURCE:
World Bank
NORMALIZATION:This indicator was normalized on a 0 to 10 scale, with the mean of global minimums in the studied period (2010-present) (52%, best case scenario) and the mean of global maximums in the studied period (2010-present (4.1%, worst case scenario) as maximum and minimum respectively. It is a reversed indicator as the smaller the value the better the performance
UT3

1.4: Utilization – UT4: Percentage of children under 5 years of age affected by wasting
DEFINITION:Child wasting refers to a child who is too thin for his or her height and is the result of recent rapid weight loss or the failure to gain weight. It is the proportion of children under five whose weight for height is more than two standard deviations below the median for the international reference population ages 0-59 months
METHOD OF MEASUREMENT:The percentage of children aged <5 years suffering from wasting = (number of children aged 0-5 years that fall below minus two standard deviations from the median weight-for-height of the WHO Child Growth Standards / total number of children aged 0-5 years that were measured) * 100. Children’s weight and height are measured using standard techniques, e.g. children less than 24 months are measured lying down, while standing height is measured for children 24 months and older. The data sources include national nutrition surveys, any other nationally-representative population-based surveys with nutrition modules, and national surveillance systems.
Justification, Arab relevance, link to regional strategies:Undernourished children have lower resistance to infection and are more likely to die from common childhood ailments such as diarrheal diseases and respiratory infections. Frequent illness saps the nutritional status of those who survive, locking them into a vicious cycle of recurring sickness and faltering growth (UNICEF, childinfo.org). This indicator is particularly relevant to the Arab region especially in light of current conflicts.
Strategies : Arab Reg Strategy for Sustainable Cons and Prod (En) (ASCP) and the Arab Strategy for Agricultural Development (En) (ASAD).
LINK TO SDGs:This indicator is directly related to SDG 2 more specifically to target 2.2 “by 2030 end all forms of malnutrition, including achieving by 2025 the internationally agreed targets on stunting and wasting in children under five years of age, and address the nutritional needs of adolescent girls, pregnant and lactating women, and older persons”.
DATA SOURCE:
World Bank
NORMALIZATION:This indicator was normalized on a 0 to 10 scale, with the mean of global minimums in the studied period (2010-present) (22.7%, best case scenario) and the mean of global maximums in the studied period (2010-present (0.7%, worst case scenario) as maximum and minimum respectively. It is a reversed indicator as the smaller the value the better.
UT4

1.4: Utilization – UT5: Prevalence of anemia among women of reproductive age (15-49
years)
DEFINITION:Prevalence of anemia among women of reproductive age refers to the combined prevalence of both non-pregnant with haemoglobin levels below 12 g/dL and pregnant women with haemoglobin levels below 11 g/dL
METHOD OF MEASUREMENT:It is the weighted average of both non-pregnant with haemoglobin levels below 12 g/dL and pregnant women with haemoglobin levels below 11 g/dL
Justification, Arab relevance, link to regional strategies:Iron deficiency anemia is a problem of serious public health significance, given its impact on psychological and physical development, behavior and work performance. It is the most common nutritional disorder in the world as mentioned by the WHO. This is a gender specific indicator as it reflects women’s health and access to nutritious food, as it is crucial to their reproductive capacities. Increased prevalence of anemia among women of reproductive age indicates inadequate intake of micronutrients, hence, anemia is representative of the food security situation.
Strategies: Arab Regional Strategy for Sustainable Consumption and Production (En) (ASCP), and the Arab Strategy for Agricultural Development (En) (ASAD).
LINK TO SDGs:This indicator is related to SDG 2 and SDG 3, as micronutrient deficiencies occur from poor food diversity resulting in poor health and pregnancy status
DATA SOURCE:
World Bank
NORMALIZATION:This indicator was normalized on a 0 to 10 scale, with 8.1 % (best case scenario where 0% of the children under 5 are wasted) and 70% (worst case scenario) as maximums and minimums respectively. It is a reversed indicator as the smaller the value the better.
UT5

1.5: Stability – ST1 : Climate change vulnerability index
DEFINITION:The climate change vulnerability index reflects the relative standing of several countries taking into consideration three major impacts of climate change: weather related disasters; sea level rise; and loss of agriculture productivity.
METHOD OF MEASUREMENT:
Justification, Arab relevance, link to regional strategies:This indicator was selected among others, to monitor the stability of food security in the Arab region. Climate change can have major impact on food security of a certain country, by affecting its agriculture productivity, thus implying its food availability, but can as well impact the stability of food supply within and between Arab countries. This is why this indicator is crucial to the monitoring of food security in the respective countries. Strategies: Arab Health and Environment Strategy (Ar) (AHES), Arab Strategy for Water Security in the Arab Region (En) (ASWS), Arab workplan to deal with climate change issues (Ar) (AWCCI), Arab Strategy for Agricultural Development (En) (ASAD), Arab Food Emergency Programme (Ar) (AFEP)
LINK TO SDGs:This indicators is also related to the following targets of the SDGs: 12.2 By 2030, achieve the sustainable management and efficient use of natural resources13.3 Improve education, awareness-raising and human and institutional capacity on climate change mitigation, adaptation, impact reduction and early warning15.3 By 2030, combat desertification, restore degraded land and soil, including land affected by desertification, drought and floods, and strive to achieve a land degradation-neutral world
DATA SOURCE:
Data for climate change vulnerability index was collected
from http://projects.hcss.nl/monitor/70/
NORMALIZATION:
Climate change vulnerability index was normalized on a scale from 0 to 10, with 0 and 0.5 as maximum and minimum respectively. It was computed as a reversed indicator, with the minimum data series value being 0 (implying a best case scenario) and the maximum 0.5 meaning the higher the climate change vulnerability index, the worse the situation
ST1

1.5: Stability – ST2 : Food price anomalies
DEFINITION:Indicator for food price anomalies measures the number of “Price Anomalies” that happen on a given food commodity price series over a certain period of time
METHOD OF MEASUREMENT:
Justification, Arab relevance, link to regional strategies:Food price anomalies indicator was selected in order to be able to monitor the status of food security in a given country in terms of food commodities and their monetary price. This measure ensures the appropriate functioning of the food commodity markets and their derivatives, as well as facilitates timely access to information on markets, including food reserves, in order to limit extreme food price volatility which in turns leads to a less stable food security. Strategies: Arab DRR Strategy (Ar) (ADRR) and the Arab Strategy for Agricultural Development (En) (ASAD)
LINK TO SDGs:This indicator is the target 2.c.1 of 2030 Agenda; to adopt measures to ensure the proper functioning of food commodity markets and their derivatives and facilitate timely access to market information, including on food reserves, in order to help limit extreme food price volatility
DATA SOURCE:
UNSTAT
NORMALIZATION:A categorical scale is used for this indicator to reflect the values, as follows:It should be also noted that this is a reversible indicator, which further clarifies the inverted choice of the values of the categorical scale.Min=1.9Max=-1.7
ST2

1.5: Stability – ST3 : Political stability and absence of violence
DEFINITION:Political stability and absence of violence measures insights of the likelihood that the government will be destabilized or overthrown by unconstitutional or violent means, including politically-motivated violence and terrorism
METHOD OF MEASUREMENT:
Justification, Arab relevance, link to regional strategies:Food security status of a given country can be distraught by its political instability and conflicts, as it can be both a cause and a consequence of those crises. As much as the Arab region is concerned, food insecurity seem to be the consequence of conflicts. This indicator was selected for monitoring food security status in the region because famine and severe food insecurity that is prevalent in some Arab countries is mainly due to war and conflicts, thus political stability and absence of violence is a good indicator for monitoring how food insecurity can be affected by this instability. Strategies: Arab DRR Strategy (Ar) (ADRR), Arab Strategy for Agricultural Development (En) (ASAD), Arab Reg Strategy for Sustainable Cons and Prod (En) (ASCP)
LINK TO SDGs:partly reflects the following SGDs:1.2 By 2030, reduce at least by half the proportion of men, women and children of all ages living in poverty in all its dimensions according to national definitions1.5 By 2030, build the resilience of the poor and those in vulnerable situations and reduce their exposure and vulnerability to climate-related extreme events and other economic, social and environmental shocks and disasters2.b Correct and prevent trade restrictions and distortions in world agricultural markets, including through the parallel elimination of all forms of agricultural export subsidies and all export measures with equivalent effect, in accordance with the mandate of the Doha Development Round2.c Adopt measures to ensure the proper functioning of food commodity markets and their derivatives and facilitate timely access to market information, including on food reserves, in order to help limit extreme food price volatility
DATA SOURCE:
World Bank
NORMALIZATION:Data on political stability was normalized on a scale from 0 to 10, with 100 and 0 as maximum and minimum respectively. The minimum data series value is 0 (implying a worst-case scenario) and the maximum 100 meaning the higher the political stability and absence of violence the better the situation is.
ST3

1.5: Stability – ST4 : Per capita food production variability
DEFINITION:Per capita food production variability corresponds to the variability of the "food net per capita production value in constant 2004-2006 international $" as circulated in FAOSTAT. This indicator compares the variations of the per capita food production across countries and time
METHOD OF MEASUREMENT:
Justification, Arab relevance, link to regional strategies:Per capita food production variability is an important indicator that helps monitoring food security by tracking the changes in food production of a certain country compared with a constant value from 2004-2006. This indicator will determine how stable and reliable food production in a certain country which in turns plays a critical role in its food security status.
Strategies: Arab Regional Strategy for Sustainable Cons and Prod (En) (ASCP), Arab Strategy for Agricultural Development (En) (ASAD), Arab Strategy for Water Security in the Arab Region (En) (ASWS), Arab Food Emergency Program (Ar) (AFEP), UNCCD 2018-2030 Strategic Framework (En) (UNCCD) and Arab Fisheries Strategy (Ar) (AFS).
LINK TO SDGs:This indicator partly reflects the following SGDs:2.1 By 2030, end hunger and ensure access by all people, in particular the poor and people in vulnerable situations, including infants, to safe, nutritious and sufficient food all year round2.4 By 2030, ensure sustainable food production systems and implement resilient agricultural practices that increase productivity and production, that help maintain ecosystems, that strengthen capacity for adaptation to climate change, extreme weather, drought, flooding and other disasters and that progressively improve land and soil quality2.c Adopt measures to ensure the proper functioning of food commodity markets and their derivatives and facilitate timely access to market information, including on food reserves, in order to help limit extreme food price volatility
DATA SOURCE:
FAOSTAT
NORMALIZATION:Per capita food production variability was normalized on a scale from 0 to 10, with 0.5 and 80.1 as maximum and minimum respectively. The maximum data series value is 0.5 implying a best case scenario where there is less variability and shocks, and the minimum data value is the highest number achieved in the world during that time period, implicating a worst case scenario with high variability in food production and shocks -Reversed indicator
ST4

1.5: Stability – ST5 : Per capita food supply variability
DEFINITION:Per capita food supply variability corresponds to the variability of the "food supply in kcal/caput/day" as per FAOSTAT. This indicator uses data on dietary energy supply from Food Balance Sheet (FBS) to measure annual fluctuations in the per capita food supply (kcal), represented as the standard deviation over the previous five years per capita food supply. Variability in food supply is a result of instability in supply, trade, consumption, and storage, in addition to changes in government policies such as trade restrictions, taxes and subsidies, stockholding, and public distribution.
METHOD OF MEASUREMENT:
Justification, Arab relevance, link to regional strategies:Per capita food supply variability is an important indicator that helps monitoring food security by tracking the changes in foodsupply of a certain country compared with a constant value from 2004-2006. This indicator will determine how stable and reliablefood production in a certain country which in turns plays a critical role in its food security status.
Strategies: Arab Regional Strategy for Sustainable Cons and Prod (En) (ASCP), Arab Strategy for Agricultural Development (En) (ASAD), Arab Strategy for Water Security in the Arab Region (En) (ASWS), Arab Food Emergency Program (Ar) (AFEP), UNCCD 2018-2030 Strategic Framework (En) (UNCCD) and Arab Fisheries Strategy (Ar) (AFS)
LINK TO SDGs:This indicator is related to the following targets of the SDGs: 2.1 By 2030, end hunger and ensure access by all people, in particular the poor and people in vulnerable situations, including infants, to safe, nutritious and sufficient food all year round2.4 By 2030, ensure sustainable food production systems and implement resilient agricultural practices that increase productivity and production, that help maintain ecosystems, that strengthen capacity for adaptation to climate change, extreme weather, drought, flooding and other disasters and that progressively improve land and soil quality2.b Correct and prevent trade restrictions and distortions in world agricultural markets, including through the parallel elimination of all forms of agricultural export subsidies and all export measures with equivalent effect, in accordance with the mandate of the Doha Development Round2.c Adopt measures to ensure the proper functioning of food commodity markets and their derivatives and facilitate timely access to market information, including on food reserves, in order to help limit extreme food price volatility
DATA SOURCE:
FAOSTAT
NORMALIZATION:Per capita food supply variability was normalized on a scale from 0 to 10. The minimum data series value is 120 implying a best case scenario where there is less variability and shocks, and the maximum data value 4 is the highest number achieved in the world during that time period, implicating a worst case scenario with high variability in food production and shocks
ST5

2- INTERPRETATION: The donut Outline of each country profile:
• General Introduction: background information on the country (geographical location, land and water, GDP…) A box highlights local events that can affect food security at national level.
• Food security general information: Quick update on national food security status inspired from available
literature
• Tables and Graphics: Table showing the raw data of 2010 and latest available year, with the trend, and the donut
• Snapshot –Core indicators : The first step to analyze is to assess the core indicators, as they reflect the outcomes of food security. It also gives a quick idea of potential problems (such as under nutrition therefore low food supply/access, or over nutrition from increased supply/access, or both, or others)
• 4 pillars of food security: Analyzing the performance and trend based on 2010 and latest data
• What can the framework tell us about food security in country X: identify areas that need improvement

1- General introduction
2- INTERPRETATION – ALGERIA country profile case study
Algeria’s economy was essentially agricultural until its independence in the early 1960s. It is now mainly based on petroleum product export following the discovery of oil and gas, and is classified as having undergone a high-level rural transformation. Per capita GDP stands at about 4,800$ with the share of agriculture in total GDP standing at about 12 % (2017 estimates)1. Algeria is heavily dependent on food imports and as a result falls in oil and gas prices affect greatly living standards particularly those of the poorest.
Although Algeria is the largest country in Africa by land mass, it is dominated by the extensive Sahara Desert while the narrow coastal zone is the most economically active. Agricultural land, which comprises arable land and land under permanent crops and pastures, constituted 17% in 2016 with arable land (land under temporary crops, temporary meadows and land temporarily fallow) representing only 3% . The per capita food production index has marginally increased between 2010 and 2016 from about 120 to 124 with a pick at about 140 in 2013
The country is water-thirsty as per capita renewable water availability is less than 300 cubic meters per capita per year, meaning that Algeria is well below the absolute water scarcity threshold of 500 cubic meter per capita per year
The country’s population (40.4 million as of 2016) is concentrated in the narrow coastal strip bordering the Mediterranean Sea. Algeria has experienced fast-paced urbanization, with 71.9% of the inhabitants categorized as urban in 2017, up from 52% in 1990. Poverty is decreasing and is mostly a rural phenomenon though unemployment is above 10% . The agriculture sector employs more than one fifth of the labor force

2- Food security general information
2- INTERPRETATION – ALGERIA country profile case study
Algeria is a major food importer, and its economy is dependent on global oil prices. Low oil prices during the past years have contributed to deepening the budget deficit to 15% (2016 figure).
The country has also accumulated a food import bill of $8.43 billion during the same year. Wheat is the main staple, with an average consumption of 193 kg per person per year, more than twice the United States (85 kg) consumption. Algeria’s self sufficiency ratio (SSR) for wheat is 30 compared to NENA’s average of 46, and the country imports close to 70% of its needs.
Food also accounts for 26% of the households’ expenses
The country is also home to 173,000 Sahrawi refugees since 1975 (see box 1.)
Box 1. Algeria’s Sahrawi Refugees
Over 170,000 Sahrawi refugees have been living in Algeria since 1975, mostly located in refugee camps in the desert region of Tindouf, in the South West of the country where livelihood opportunities are lacking. Their food security and nutrition status are poor and they depend almost entirely on the World Food Program for food assistance. In 2018, surveys show that only 12% of the population is food secure. Vulnerability to food insecurity affected 58% while 30% were food insecure. A 2016 nutrition survey indicated that, while the situation was improving compared to previous year, food security and nutrition, especially of women and children, remains precarious: Prevalence of anemia is 45.2% among women of reproductive age and 38.7% among children (6-59 months). Chronic malnutrition affects 19% of children between 6 and 59 months old. The World Food Program is attempting to address various pillars of food security. Fish farming and hydroponic projects complement the small desert garden plots that were started in the late 1980’s. There are also efforts to address the long lead times required for specialized nutritious foods. A nutrition survey is planned for 2019 for the purpose of improving the population’s nutritional status

3- Tables and graphics – Raw data+Trend , Donut
2- INTERPRETATION – ALGERIA country profile case study


4- Food security snapshot: Core indicators
2- INTERPRETATION – ALGERIA country profile case study
The Prevalence of Undernourishment has decreased from 6.3% in 2010 to 4.7% in 2016. It was 10.7% in 2000. It is lower than the World’s figure for 2017 (10.9%), as well as for the Near East and North Africa (NENA, 11.3%) and the Maghreb (5.2%)
Obesity increased sharply over that same period from 17% in 2000, to 23% in 2010 and 27.4% in 2016. Although this is close to the NENA average (26.7%), this is still below the world average (39%). It is worth noting that the obesity rate in Algeria is much more prevalent among women (34.9%) than men (19.9%)
Prevalence of food insecurity (measured by the FIES.) was 8.3 for the period 2015-2017, slightly lower than the value for 2014-2016 (8.5). The prevalence of severe food insecurity in 2015-2017 was 11.3 for NENA and 7.8% for the Maghreb region
CO1 CO2 CO3
CO1: PoUCO2: Severe food insecurity
CO3: Obesity

5- Interpretation of the 4 pillars – Availability
2- INTERPRETATION – ALGERIA country profile case study
Average wheat yield is low when compared with the potential achievable for Algeria in the year 2000. Potential wheat yield for Algeria was estimated at 4.29 tons/hectare in 2010 while current yield stands at 1.27 tons/hectare. However, the harvest for the year 2018 reached record levels (6 million tons, 60% above the previous 5-years average, GIEWS, FAO, 20184 ) indicating potential improvement over the years. Annual cereal yields have more than doubled from 0.62 t/ha in the period 1961-1965 to 1.32 t/ha in the period 2013-2017 and wheat made up 22% of the total harvested area in 2016
The inability of production to meet growing local demand combined with a transition in food consumption patterns towards a western-style diet 5 renders Algeria heavily dependent on food imports and highly vulnerable to global markets as indicated by the large cereal import dependency ratio (72%).
However, the food import bill is set to decrease in 2018-2019. The value of food imports over total merchandise exports has dropped from 15% in 1999-2001 to 11% in 2011-2013. In 2016, Algeria dedicated 4.8% of its GDP to food imports compared to 5.22% in 2015. This is a significant increase from 2010 and 2012, when Algeria dedicated 3.33% and 4% of its GDP to food imports. Algeria’s oil economy explains the fact that agricultural imports as a share of the value of merchandise exports for 2011-2013 was 15%, in the low range compared to other NENA countries
The agriculture orientation index was 0.39 in 2010. The closer this ratio is to 1, the larger the public investment in agriculture. There is no published data for more recent years.
AV1
AV2
Food losses account for 7% and 6% for 2010 and 2013 respectively. Those losses are comparable to those of other Arab countries, as the lowest available value is 0.54% for Djibouti in 2013 and the highest is 10.42% for the United Arab Emirates in the same year.
AV3
A rise in the average dietary energy supply adequacy (ADESA) from 135% to 143% between 2010 and 2016 indicates greater food availability but is also associated with a larger import bill
AV4
AV5
Algeria is currently withdrawing 42.65% of its total renewable water resources for agriculture purposes, which is unsustainable in a country where annual renewable water per capita is well below the scarcity limit of 1000m3 .
AV6
AV1: Cereal yield as % of achievable
AV2: AOI
AV3: Food loss AV4: ADESA
AV5: cereal import dependency ratio
AV6: Water in agriculture

5- Interpretation of the 4 pillars – Access
2- INTERPRETATION – ALGERIA country profile case study
The poverty headcount ratio in Algeria was 3.9% in 2011 (latest available figures, baseline 3.2$/day). It reflects a good condition compared to other MENA countries.
The low logistics performance index indicates physical hindrances to the access to food, especially in remote areas.
Expenses on food constituted 43% of total household expenditures in 2018. This is associated with an increased food inflation of 4% in 2018 accompanying an increase in the annualized rate of general price inflation from 2% in early 2018 to 6% in mid 2018, reflecting taxes imposed to offset the decline in oil prices
AC1
AC2
The official unemployment rate among the population aged 25 years and above was 9.3% in 2017. This has implications on income and poverty. Women’s unemployment at 18.1 is more than double that of the men’s (7.1%).
AC3
AC4
The country’s high dependency on imports constrains proper economical food accessibility due to high price inflations.
AC5
AC1: PovertyAC2:Foodconsumption expenditure
AC3: Unemployment
AC4: Logistics
AC5: Inflation

5- Interpretation of the 4 pillars – Utilization
2- INTERPRETATION – ALGERIA country profile case study
Algeria scores well on the proportion of population using safely managed sanitation services (87.5% in 2015).
Anemia among women of reproductive age is relatively high with a percentage of 35.7% in 2016, on par with the average value for NENA and the Maghreb, after it had declined to 33.5% in 2010. This is cause for concern.
Data is lacking regarding the proportion of population using safely managed drinking services.
UT2UT1The percentage of children aged 5 years or below affected by stunting has decreased from 23.6% in 2000 to 11.7% in 2012 indicating successful policies promoting food security and nutrition. This value is considered to be medium-low on the WHO scale
Wasting figures are in the low range but appear to have marginally increased during the same period from 3.1% to 4.1%. It still is in the “low” rank according to the WHO scale . It is interesting to note that the percent of overweight children stood at 12.4% in 2013, among the top 4 of the NENA countries for which data is available (NENA is 9.1%, FAO, 2019). This is considered as a “high” value on the WHO scale. Thus malnutrition in children has evolved from undernourishment to over nourishment.
UT1: Basic drinkingUT2: Basic sanitation
UT3: Stunting UT4: Wasting
UT5: Anemia
UT3 UT5
UT4

5- Interpretation of the 4 pillars – Stability
2- INTERPRETATION – ALGERIA country profile case study
The political stability is average according to both FAO and World Bank indices (WB index is -0.97 for 2017 (best is +2.5, worst is -2.5).
Currently, no data is available to assess the impact of food price anomalies on food security
The low climate change vulnerability index indicates that the country is experiencing little impact from climate change, though this vulnerability is assessed in terms of increased in weather-related disasters, sea levels rise and loss of agricultural productivity.
ST3ST1
Per capita food production and supply variability have good scores in general.
ST1: Climate change vulnerability
ST2: Food priceanomalies
ST3: Political stability
ST4: Food production variability
ST5: Food supply variability
ST4-ST5ST2 ST3

6- What can the framework tell us about Food Security in Algeria?
2- INTERPRETATION – ALGERIA country profile case study
• The core indicators show that Algeria is typical of countries in transition that have access to sufficient finances to ensure the purchase of sufficient amounts of food. This is evidenced by the core indicators: the country is doing well in terms of undernourishment and food insecurity but not on obesity, specifically women’s obesity. However, there are areas of improvement that can be addressed in order to improve the monitoring of the determinants of food security and to enhance the food and nutrition security status.
• The first issue is one of data: data is not available for wheat yield and wheat yield gap, share of food consumption in total expenditure, share of water resources used in agriculture, agriculture orientation index for government expenditures and food price anomalies. This is crucial knowledge needed to strengthen the sustainability of Algeria’s food system and its food security and nutrition.
• If the state’s approach is geared towards enhancing local production in order to buffer external shocks, then the current investment in agriculture needs to be increased.
• Policies towards the improvement of diets and the control of the rapidly increasing rates of obesity are recommended.
• The issue of food losses and wastes requires commitment to monitoring and action.
• With a logistics score of 3-4, physical food access in remote areas should be addressed. It is likely that rural regions suffer from delays and limited supplies similar to those of the Sahrawi refugees.
• Sanitations services have improved but more effort is needed to achieve full coverage.
• The status of women in the workforce, as well as their vulnerability to anemia and the decline in their nutritional status is a pressing issue that needs urgent action.
• Climate change variability undermines the 4 pillars of food security, hence, efforts towards mitigating climate change should still be implemented to prevent the aggravation of national food security status.
• Finally, the Sahrawi refugees are a vulnerable population that is marginalized. Their nutritional status is poorer than that of the Algerian population. It is recommended to deploy efforts to address local food production and lead times for special foods in order to facilitate WFP’s activities.

Thank you