Embed Size (px)
DESCRIPTION
Food Webs: More questions than answers. Indirect Effects in Food Webs: Insights from studies of species removals. What happens to elk if you remove wolves? What happens to grass if you remove elk?. Indirect Effects in Food Webs (Sih et al., 1985). - PowerPoint PPT Presentation
Citation preview

Food Webs and Trophic Cascades

Indirect Effects in Food Webs: Insights from studies of species removals
• What happens to elk if you remove wolves?
• What happens to grass if you remove elk?

Indirect Effects in Food Webs(Sih et al., 1985)
• Surveyed results of 100 experimental studies of predation
• In 66% of cases species removal had the “expected” result
• In 33% of cases, however, species removal had “unexpected” results
Why do we get unexpected results?

Indirect Effects can yield unexpected results
WARNING: In only the very simplest of systems can we predict the impact of species removals or additions!!!

Stability of Food Webs
(N=.025/km2)
(N=2.1/km2)
(N=0.2/km2)
(N=1.1/km2)
(N=200.1/km2)(N=800.1/km2)
(N=5800.1/km2)Disturbance
(N=.025/km2)
(N=2.1/km2)
(N=0.2/km2)
(N=0.1/km2)
(N=200.1/km2)(N=800.1/km2)
(N=5800.1/km2)
(N=5.1/km2)
(N=0.3/km2)
(N=1800.1/km2)
STABLE
UNSTABLE
What determines stability?

The role of complexity in stability
• MacArthur (1955) argued that increasing the complexity (number of species) in a food web would increase its stability
• His logic was based on the idea that increasing complexity increases redundancy
Stable to removal of lower trophic levels
Unstable to removal of lower trophic levels

Stability of Food Webs
• May (1972) developed mathematical models to investigate MacArthur’s ideas
• These models were based on the following parameters:1. The number of interacting species, S2. The fraction of all possible species pairs that interact directly, “connectance”, C3. The effect of species i’s density on species j’s growth rate βij
In this example:
S = 6C = 6/(6 choose 2) = 6/15

Stability of Food Webs• May (1972) then drew β values at random
• Found that communities would be stable only if:
1SC
β is the average magnitude of interaction strengths
within the web
Contradicts MacArthur’s ideas. As S and C increase, both of which measure complexity, stability goes down!
For the most part, subsequent theoretical studies qualitatively support May’s result
What about empirical studies?

An experimental test of complexity-stability theory(McNaughton, 1977)
• Established species poor and species rich plots
• “Disturbed” plots by either a) adding nutrients or b) allowing grazing
• Both types of disturbance led to significant decreases in species diversity in species rich plots but not species poor plots
Supports May’s theoretical prediction

An experimental test of complexity-stability theory(Frank and McNaughton, 1991)
• Studied 8 grassland communities in Yellowstone NP over the course of a severe drought
• Estimated species composition before and after drought
• Found that more diverse communities were MORE resistant to disturbance
Contradicts May’s theoretical prediction

Moving from random to real networks(Yodzis 1981)
Why are real networks more stable than random networks?
• May’s result relies on the distribution of βij being random
• Yodzis estimated the distribution of βij for real networks
• These real networks were much more stable than May’s random networks!

Characterizing real food websPaine (1992)
• Studied the distribution of βij in real communities
• Found that most interactions are WEAK and POSITIVE

Weak interactions and food web stability
• Weak interactions stabilize food webs, by preventing propagation of disturbance

In 1955 MacArthur proposed that more complex communities should be more stable to perturbations because they have more redundancy in terms of trophic linkages between species. In 1972, May developed a mathematical model of MacArthur's idea and showed that a community would be stable to perturbations only if:
Where S is the number of species, C is the connectance, and β is the average magnitude of interaction strengths within the web. A (15pts). Does May’s result support MacArthur’s claim? Why or why not? B (10pts). What are the values of S and C for the community shown below?
C (15pts). If β = .35, would the community shown above be stable using May’s mathematical criterion?
1SC
Practice Question

Structure of Food Webs: Food chain length
• This food web has a maximum food chain length of 4
• The majority of food webs studied have between 2 and 5 levels
• Why are there not food webs with more levels?

The energy flow hypothesis
Theory • The sun provides a fixed amount of
energy input
• Each trophic level above autotroph successfully incorporates only 1-30% of this energy
• Consequently, there may simply not be enough energy to support additional trophic levels
Empirical StudiesFood chains are no longer in tropical than presumably less productive temperate regions
Energy flow hypothesis not supported
No strong support for other hypotheses
40kj/km2
10kj/km2
2.5kj/km2
0.6kj/km2
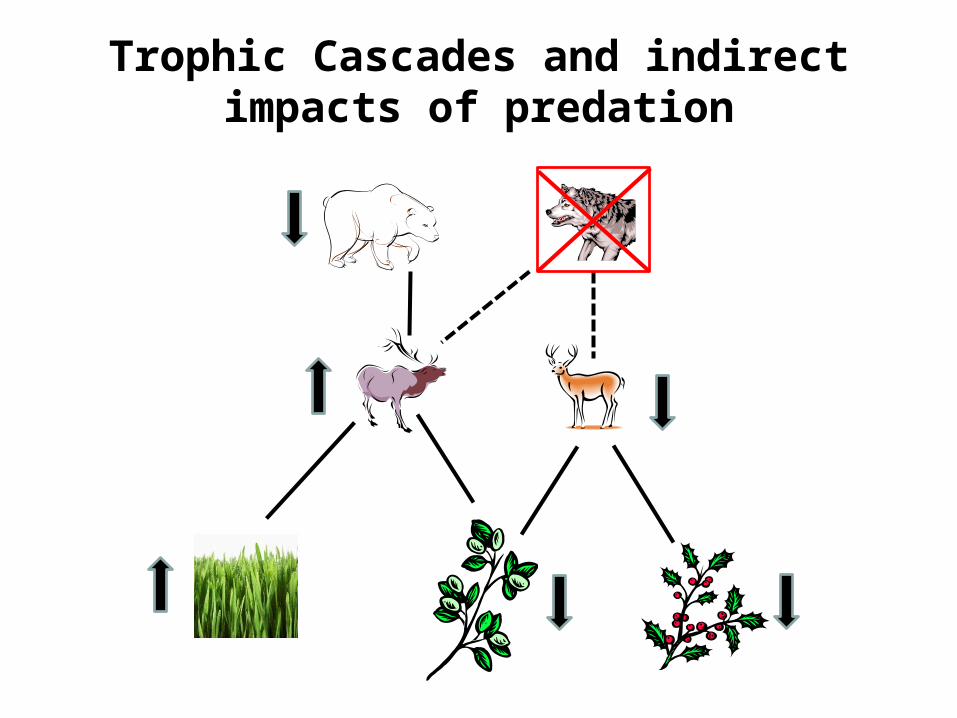
Trophic Cascades and indirect impacts of predation

Trophic Cascades
Trophic Cascade – Indirect effects of carnivores on plant populations or the progression of indirect effects by predators across successively lower trophic levels

Aspen in Yellowstone National Park
• Historically, aspen covered 4–6% of the northern range of Yellowstone National Park
• Aspen are clonal with stands consisting of genetically identical individuals produced as suckers
• From 1930 on aspen recruitment in YNP ceased, except in sites protected from browsing.
Why are Aspen declining in Yellowstone National Park?
• Aspen now cover only 1%

Interactions between elk and aspen
Elk eat the bark of aspen trees which can stress the plant and facilitate invasion by
pathogenic fungi

Interactions between elk and aspen
• Elk eat aspen suckers
• Elk eat juvenile aspen
• Together, this may inhibit recruitment and stand replacement

Wolves, Elk, and Aspen, a historical correlation
Dates Wolf events Aspen events
1914-1926Wolves extirpated
from YNP
1930Aspen overstory
regeneration ceases
1995Wolves
reintroduced
≈2000
Some Aspen stands in riparian
areas begin to recover
Could wolf reintroduction have played a role?

Wolf reintroduction
• Wolves were reintroduced into YNP in 1995
• By the end of 1998, 112 wolves lived in 11 packs in the greater Yellowstone ecosystem

Impacts of wolf reintroduction on aspen
• Established permanent plots in aspen stands in 1999
• Chose plots with aspen stands in high and low wolf-use areas
• Recorded number of elk pellet groups, aspen sucker heights and the percentage of suckers being browsed

Impacts of wolf reintroduction on aspen
• Found significant differences in elk pellet groups
• Found significant differences in aspen sucker heights
Argued the data suggest high wolf-use causes a shift in elk habitat use and
a subsequent recovery of aspen

Elk behavioral change?
• Studied movement patterns of 13 female elk using data from radio collars
• Measured local wolf activity
• Measured local habitat characteristics

Elk behavioral change?
• In the presence of wolves, elk moved toward forested areas
• In the absence of wolves, elk moved toward aspen stands
• Suggests wolves alter elk behavior in a way that reduces impacts on aspen

Other indirect impacts of wolf reintroduction
Wolf reintroduction appears to be driving complex trophic cascades

Alternative explanations
• Increased aspen recruitment in riparian areas may be the result of climate change and altered snow melt patterns
• Wolf impacts on elk behavior may not be strong enough to save aspen
• Suggest that wolves are likely to save aspen only if they further reduce elk population size as grazing remains too intense for aspen regeneration
• We need replicated studies to tease these potential impacts apart
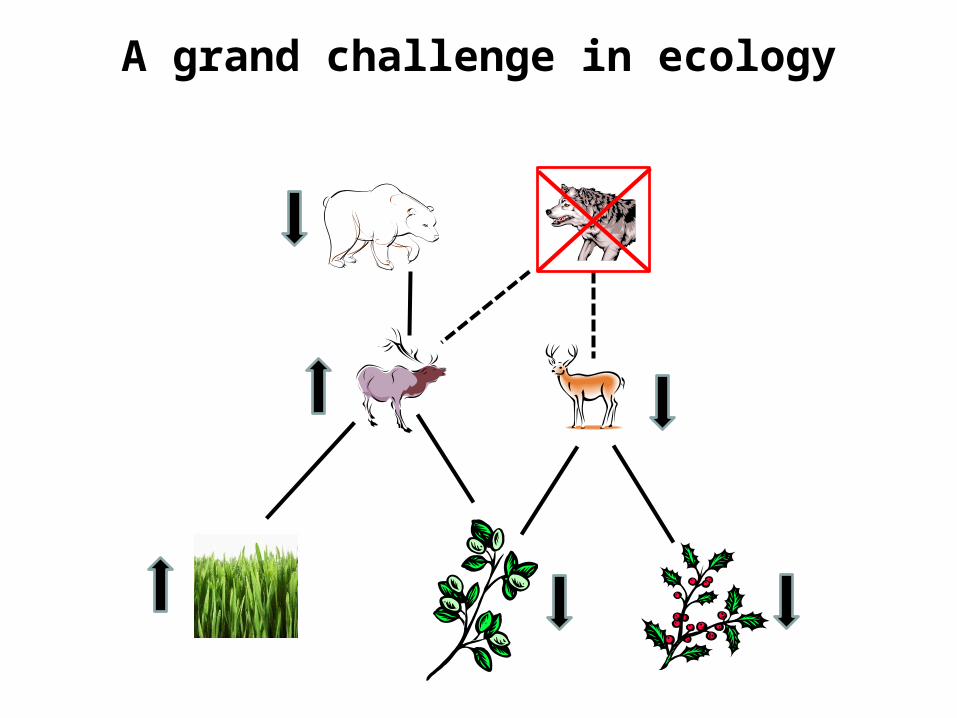
A grand challenge in ecology