Embed Size (px)
Citation preview

1
Ranking Walkable Urbanism in America’s Largest Metros • 2016
By Christopher B. Leinberger & Michael RodriguezThe George Washington University School of Business

The Center for Real Estate and Urban Analysis

3
I. EXECUTIVE SUMMARY . . . . . . . . . . . . . . . . . . . . . . . . . . . . . . . . . . . . 4
II. INTRODUCTION & METHODOLOGY . . . . . . . . . . . . . . . . . . . . . . . . 5
(Walkable) Urban Rebound . . . . . . . . . . . . . . . . . . . . . . . . . . . . . . . . . . . . . 6
Form Meets Function . . . . . . . . . . . . . . . . . . . . . . . . . . . . . . . . . . . . . . . . . 7
Methodology . . . . . . . . . . . . . . . . . . . . . . . . . . . . . . . . . . . . . . . . . . . . . . . . 8
III. METROPOLITAN RANKINGS . . . . . . . . . . . . . . . . . . . . . . . . . . . . . . . 11
Where the WalkUPs Are . . . . . . . . . . . . . . . . . . . . . . . . . . . . . . . . . . . . . . . 12
Current Walkable Urbanism in the 30 Largest Metros . . . . . . . . . . . . . . . . . 14
Current Ranking . . . . . . . . . . . . . . . . . . . . . . . . . . . . . . . . . . . . . . . . . . . . . 15
Forward-Looking Indicators . . . . . . . . . . . . . . . . . . . . . . . . . . . . . . . . . . . . 18
Development Momentum Ranking . . . . . . . . . . . . . . . . . . . . . . . . . . . . . . . 22
Development Momentum in Individual Metro Areas . . . . . . . . . . . . . . . . . 24
IV. SOCIAL EQUITY RANKINGS . . . . . . . . . . . . . . . . . . . . . . . . . . . . . . . . 25
WalkUPs & Social Equity . . . . . . . . . . . . . . . . . . . . . . . . . . . . . . . . . . . . . . 26
Social Equity Ranking . . . . . . . . . . . . . . . . . . . . . . . . . . . . . . . . . . . . . . . . . 27
V. CORRELATIONS & FINDINGS . . . . . . . . . . . . . . . . . . . . . . . . . . . . . . 29
WalkUPs, Education & GDP per Capita . . . . . . . . . . . . . . . . . . . . . . . . . . . 30
VI. CONCLUSIONS & FURTHER STUDY . . . . . . . . . . . . . . . . . . . . . . . . . 33
VII. APPENDICES . . . . . . . . . . . . . . . . . . . . . . . . . . . . . . . . . . . . . . . . . . . . . 36
Endnotes . . . . . . . . . . . . . . . . . . . . . . . . . . . . . . . . . . . . . . . . . . . . . . . . . . 37
Acknowledgments . . . . . . . . . . . . . . . . . . . . . . . . . . . . . . . . . . . . . . . . . . . . 39
Table of Contents
2016

4 Foot Traffic Ahead: Ranking Walkable Urbanism in America’s Largest Metros • 2016 © The George Washington University School of Business 2016
KEY FINDINGS There are 619 regionally significant, walkable urban places—referred to as WalkUPs—in the 30 largest U .S . metropolitan areas . These 30 metros represent 46 percent of the national population (145 million of the 314 million national population) and 54 percent of the national GDP .
The 30 metros are ranked on the current percent-age of occupied walkable urban office, retail, and multi-family rental square feet in their WalkUPs, compared to the balance of occupied square foot-age in the metro area . The six metros with the most walkable urban space in WalkUPs are, in rank order, New York City, Washington, DC, Boston, Chicago, San Francisco, and Seattle .
ECONOMIC PERFORMANCE:There are substantial and growing rental rate premi-ums for walkable urban office (90 percent), retail (71 percent), and rental multi-family (66 percent) over drivable sub-urban products . Combined, these three product types have a 74 percent rental premium1 over drivable sub-urban .
Walkable urban market share growth in office and multi-family rental has increased in all 30 of the larg-est metros between 2010-2015, while drivablesub-urban locations have lost market share . The market share growth for 27 of the 30 metros is two times their market share in 2010 . This is of the same or greater magnitude as the market share gains of drivable sub-urban development during its boom years in the 1980s, but in the reverse direction .
Indicators of potential future WalkUP performance show that many of the metros ranked highest for current walkable urbanism are also found at the top of our Development Momentum Ranking—namely, the metros of New York City, Boston, Seattle, and Washington, DC . This indicates that these metros will continue to build on their already high WalkUP market shares and rent premiums .
There are also some surprising metros in this top tier of Development Momentum rankings, including Detroit, Phoenix, and Los Angeles .
The most walkable urban metro areas have a sub-stantially greater educated workforce, as measured by college graduates over 25 years of age, and
Executive SummaryThe end of sprawl is in sight. The nation’s largest metropolitan areas are focusing on building walkable urban development.
For perhaps the first time in 60 years, walkable urban places (WalkUPs) in all 30 of the largest metros are gaining market share over their drivable sub-urban competition—and showing substantially higher rental premiums.
This research shows that metros with the highest levels of walkable urbanism are also the most educated and wealthy (as measured by GDP per capita)— and, surprisingly, the most socially equitable.
substantially higher GDP per capita . These relation-ships are correlations, and determining the causal relationships requires further research to prove .
Walkable urban development describes trends re-sulting from both revitalization of the central city and urbanization of the suburbs . For nearly all metros, the future urbanization of the suburbs holds the greatest opportunity; metro Washington, DC, serves as a mod-el, splitting its WalkUPs relatively evenly between its central city (53 percent) and its suburbs (47 percent) .
SOCIAL EQUITY PERFORMANCE:The national concern about social equity has been exacerbated by the very rent premiums highlighted above, referred to as gentrification . Counter-intuitive- ly, measurement of moderate-income household (80 percent of AMI) spending on housing and transpor-tation, as well as access to employment, shows that the most walkable urban metros are also the most socially equitable . The reason for this is that low cost transportation costs and better access to employ-ment offset the higher costs of housing . This finding underscores for the need for continued, and aggres-sive, development of attainable housing solutions .

5
INTRODUCTION & METHODOLOGY

6 Foot Traffic Ahead: Ranking Walkable Urbanism in America’s Largest Metros • 2016 © The George Washington University School of Business 2016
walkable urban metros, 81 percent of 2010-2015 office and rental multi-family absorption by square footage is now walkable urban . Walkable urban products in WalkUPs generate substantial rental premiums, suggesting pent-up demand for more walkable urban development .
Walkable urbanism could provide the same met-ro-level economic base in the 21st century economy that drivable sub-urbanism did in the mid-to-late 20th century . However, this growth will not be real-ized without appropriate infrastructure, zoning, and financing mechanisms at the federal, state, and local levels .
Both development forms, drivable sub-urban and walkable urban, are now viable in most of the 30 largest U .S . metropolitan areas . However, these two forms are fundamentally different, requiring land ac-quisition, zoning, construction, financing, marketing, and management .
(Walkable) Urban ReboundWalkable urbanism development is now propelling real estategrowth in office, retail, and multi-family rental product types from arental premium and absorption basis in the largest 30 U.S. metros.
Since the mid-20th century, metropolitan areas in the United States have been generally divided into two categories: “central city” and “suburban” .2 The new 21st-century development patterns suggest this former dichotomy is less meaningful; we need more salient categories to examine and understand contemporary and future metropolitan development in the United States .
The more useful dichotomy to understand metro-politan3 America is “walkable urban” and “drivable sub-urban” development . Both types of develop-ment can occur in either a metro’s central city or in the metro’s suburban area .
DRIVABLE SUB-URBAN vs WALKABLE URBAN DEVELOPMENTDuring the second half of the 20th century, the now- familiar drivable sub-urban approach dominated real estate development .
Drivable sub-urban is characterized by:
• Historically low-density development (generally 0 .05 to 0 .4 floor area ratio or FAR)
• Segregated real-estate product types (different real estate product types generally separated from one another)
• Standardized product types that, aside from superficial architecture, are similar throughout the country
• Cars and trucks as the predominant transporta-tion mode .
This has been referred to as sprawl .
Most real estate developers and investors, govern-ment regulators, and financiers have well understood this model, turning it into a successful formula and economic driver throughout the mid- to late-20th century . In addition to real estate, this model fueled demand for automobiles, drove road construction, and supported the finance, insurance, and oil indus-tries . In short, this development model provided a solid foundation for the U .S . economy for the majori-ty of the 20th century .
By the mid-1990s, the redevelopment of center cities and suburban town centers, accompanied by the New Urbanism movement, demonstrated there was revived demand for walkable urbanism, the dominant development form before the early 20th century .
Walkable urban development includes:
• Substantially higher densities (1 .0 to 40 FAR, though mostly in the 1 .0 to 4 .0 range)
• Mixed-use real-estate products, or the adjacent spatial mix of products
• Emerging “new” product types, such as rental apartments over a ground-floor grocery store
• Multiple transportation options, such as bus, rail, bicycle, and pedestrian-friendly sidewalks, as well as motor vehicles, that connect to the greater metro area . Within the boundaries of the WalkUP itself, most destinations are within walking dis-tance .
As this survey shows, and previous metro-level re-search demonstrates,4 walkable urban development appears to be a rising, or even dominant, factor in real estate development . In the most highly ranked
Introduction & Methodology

7
Local serving locations, frequently called bedroom communities, are predominantly residential with complementary commercial development, such as grocery and drug stores; doctor, dentist, bank branches and realtor offices; and community-cen-tric civic services, such as primary and secondary schools, and police and fire stations .
Generally speaking, metropolitan area household inhabitants earn their livings in regionally significant locations, and they live their lives outside of work in local-serving places . There are many exceptions to this spatial division of working and living as more people opt to work at home and/or live in regionally significant places, but generally it applies .
Combining the two forms (drivable sub-urban and walkable urban) and the two functions (regionally significant and local serving) of metropolitan land use results in a simple four-cell matrix . This Form/Function Matrix, shown at the left, defines the land-use options available for any metropolitan area . This matrix includes an estimate of the percentage range of metropolitan land use for each of the four types, based upon previous GWU research at the metropol-itan level .5
This research focuses on regionally significant, walkable urban places, referred to as “WalkUPs,” which is in the upper left hand corner of the Form/Function Matrix .
Understanding 21st-century metropolitan land use options.
Introduction & Methodology
Real estate professionals often categorize metropoli-tan land use into two economic functions: regionally significant or local serving .
Regionally significant locations, which the brokerage community refers to as “sub-markets,” have concen-
trations of employment (particularly in base/export or regional-serving businesses and jobs), and can include civic centers, higher education facilities, major medical centers, and regional retail establish-ments, as well as one-of-a-kind cultural, entertain-ment, or sports assets .
Form Meets Function
REGIONALLY SIGNIFICANT LOCAL SERVING
WALKABLE URBAN
WALKUP (Walkable Urban Place)
WALKABLENEIGHBORHOOD
• Office Space ≥ 1.4M sq ft• -OR- • Retail Space ≥ 340,000 sq ft
• WalkScore ≥ 70.5
• Avg intersection density ≥ • 100 per sq mile
• WalkScore ≥ 65
• Avg intersection density ≥ • 100 per sq mile
DRIVABLE SUB-URBAN
DRIVABLEEDGE CITY
DRIVABLE SUB-DIVISION
• Office Space ≥ 1.4M sq ft• -OR- • Retail Space ≥ 340,000 sq ft
• All land not allocated to other• categories
Form / Funct ion Matrix :Metropol i tan Land Use Options in the U.S.

8 Foot Traffic Ahead: Ranking Walkable Urbanism in America’s Largest Metros • 2016 © The George Washington University School of Business 2016
Introduction & Methodology
MethodologyTo rank the country’s 30 largest metropolitan areas on current and forward-looking indicators of walkable urbanism, we began with identifying the geographic boundaries of each metro’s regionally significant walkable urban places and then quantified economic performance and social equity.
Data Sources:
Office, Retail & Multi-Family Data:
CoStar, the leading provider of office, retail, and multi-
family rental data in the U.S. (www .walkscore .com)
Housing & Transportation Affordability Index:
Center for Neighborhood Technology
(www .cnt .org/tools)
Walkability:Walk Score index
(www .walkscore .com)
Educational Attainment& Population Data:
U.S. Census Bureau American Community Survey 2014
(www .census .gov)
Per Capita GDP:U.S. Bureau of Economic
Analysis 2014(www .bea .gov/regional)
Geographic Definitions:Maponics® Neighborhood
Boundaries (www .maponics .com)
Walkable vs. Drivable Environments:10
Satellite and Google Maps® and Google Earth® aerials
WalkUP Definitions:Further refinement aided by place management organi-
zation boundaries (business improvement districts, official
government districts, etc.) and ground truthing survey of local
experts in real-estate market
This study determined the geographic locations and size of region-ally significant walkable urban places (WalkUPs) in the country’s 30 largest metropolitan areas . Each is ranked from greatest to least percentage of occupied walkable urban development by square footage of office, retail, and multi-family rental real estate products . We then evaluated these WalkUPs compared to the rest of the met-ro area on economic and social equity metrics .
These rankings update findings from a 2007 Brookings Institution report6 and the first George Washington University Foot Traffic Ahead report7 published in 2014 . Many methodological adjust-ments have been made since 2007, as well as minor database differences between 2014 and 2016 . The major methodology changes in this report are the addition of (1) multi-family rental, one of the most robust products developed during this real estate cycle, and (2) social equity, which addresses one of the major real estate and urban issues of our time . However, there are general similarities in the methodologies for the 2014 and 2016 publica-tions, which indicate accelerating market and social trends toward increased walkable urbanism .
FINDING THE WALKUPS
The methodology to identify WalkUPs in the 30 largest metros is based on Brookings research.8 This methodology defines the form and function of WalkUPs and creates a ranking system using two metrics: (1) real estate economic performance and (2) social equity performance.
WalkUPs are defined as having the following characteristics:
• OFFICE & RETAIL SPACE
• Office: ≥1 .4 million square feet
and/or
• Retail: ≥ 340,000 square feet
• WALK SCORE:9 Value ≥ 70 at the most walkable intersection
RANKING THE METROS
This report provides three distinct rankings of the 30 largest metropolitan areas in the U.S.:
• CURRENT RANKING: Based upon the total metro inventory of the following in 2015:
• Office
• Retail
• Multi-Family Rental
• DEVELOPMENT MOMENTUM RANKING: Based upon the change in WalkUP market share of a metro area’s total invento-ry of the following:
• Office: ∆ in share from Q1 2010 to Q4 2015
• Multi-Family Rental: ∆ in share from Q1 2010 to Q4 2015
• SOCIAL EQUITY RANKINGS:
• Housing & Transportation (H+T)® Affordability Index: Housing and transportation costs as a percent of a moder-ate household income (households at 80 percent of area median income) based on the most recently available data for 2014 from Center for Neighborhood Technology
• CNT’s Employment Access Index: Measure of the number of jobs located near a resident
In previous WalkUP Wake-Up Call research of individual metropolitan areas—Washington, DC; Atlanta; Boston; and seven Michigan met-ros including Detroit—we assessed all real-estate product types. Due to resource constraints in assessing a larger set of metros, we use office, retail, and multi-family rentals as an imperfect, albeit instructive, proxy for all development trends.

9
Categories of WalkUPs:
Introduction & Methodology
1. Downtown: The traditional center of a metro’s central city . Occasionally there are
Secondary and Tertiary Downtowns .
2. Downtown Adjacent: WalkUPs that cluster around the
central city Downtown .
3. Urban Commercial: Former local-serving commercial districts in
decline during the late 20th century, recently revitalized as regionally significant WalkUPs .
4. Urban University: Places where institutions of higher learning
have embraced, and are integrated with, their community .
5. Innovation Districts: Places where the knowledge-based innovation
economy is focused (research, tech-transfer, startups, corporate facilities, etc .), many times
growing out of Urban University WalkUPs .
6. Suburban Town Center: Eighteenth and 19th-century towns
eventually swallowed by larger metro areas and recently revitalized .
7. Redeveloped Drivable Sub-urban: Places originally developed as strip
commercial and/or regional malls that have since urbanized .
8. Greenfield or Brownfield: WalkUPs developed on undeveloped land
or reclaimed land, mainly former industrial uses .
Examples: All Traditional Downtowns St. Paul metro Minneapolis-St. Paul Tacoma metro SeattleBrooklyn, Newark, and Jersey City metro New York City
Examples: Dupont Circle metro Washington, DC Capitol Hill metro Seattle Little Tokyo metro Los Angeles
Examples: Columbia Heights metro Washington, DC Lincoln Park metro Chicago Melrose metro Los Angeles
Examples: Westwood (UCLA) metro Los Angeles University District (University of Washington) metro Seattle Morningside Heights (Columbia University) metro New York City
Examples: University City metro Philadelphia South Lake Union metro Seattle Cortex metro St. Louis
Examples: Evanston metro Chicago Bellevue metro Seattle Pasadena metro Los Angeles
Examples: Belmar metro Denver Tysons metro Washington, DC Perimeter Center metro Atlanta
Examples: Reston Town Center metro Washington, DC Atlantic Station metro Atlanta Country Club Plaza metro Kansas City
Our previous research determined that there are eight types of WalkUPs.11
Using the 20th-century, center-city/suburbs dichotomy, the first five types of WalkUPs tend to locate in a metro’s central city. The last three tend to occur in a metro’s suburban areas.
Generally found in CENTER CITIES
Generally found in SUBURBS
Walkable urban development is not simply a phenomenon of revitalization
in central cities, but also a trend of urbanizing suburbs.

10 Foot Traffic Ahead: Ranking Walkable Urbanism in America’s Largest Metros • 2016 © The George Washington University School of Business 2016

11
METROPOLITAN RANKINGS

12 Foot Traffic Ahead: Ranking Walkable Urbanism in America’s Largest Metros • 2016 © The George Washington University School of Business 2016
Where the WalkUPs AreThis study identifies WalkUPs in the 30 largest metros—and then ranks those metros according to their current walkable urbanism and their momentum toward future walkable urban development.
Defining the WalkUPs in each of the 30 largest metro-politan areas yielded 619 WalkUPs (20 .6 per metro), although the number of WalkUPs in a given metro area ranged considerably . Metro New York contains 67 WalkUPs, while metro San Antonio has only two .
The 30 largest U .S . metropolitan areas have a population of 145 million people—46 percent of the total U .S . population .12 According to the Bureau of Economic Research, these 30 metros accounted for nearly 54 percent of U .S . real gross domestic product (GDP)13 in 2014 .
SMALL SIZE, BIG BENEFITSWithin these metro areas, WalkUPs occupy a very small portion of total land . In-depth WalkUP Wake- Up Call research of the metropolitan areas of Wash-ington, DC, Atlanta, Boston, and Detroit shows that WalkUPs account for between 0 .55 and 1 .2 percent of all land within these metros . There is little reason to expect much higher percentages in the other 26 of the 30 largest metros . However, it is probable that some have even lower percentages of walkable urban land, especially among metros toward the bottom of our current walkable urban ranking .
In defining the geographic boundaries of WalkUPs, we find their small geographic size delivers outsized economic benefits . In the 2012 WalkUP Wake-UP Call analysis of metro Washington, DC, the 44 WalkUPs on average each occupied 408 acres—or approxi-mately 17,500 acres in total .14 The 2015 analysis of metro Boston found that each of its 54 WalkUPs oc-cupied 337 acres on average, approximately 19,200 acres in total .15 During the current real estate cycle, the Boston WalkUPs, which occupy 1 .2 percent of
the metro area’s total acreage, absorbed 93 percent of metro-area office and multi-family rental square footage from 2010 to 2014 .
Even in metro Atlanta, known for the past generation as the “poster child of sprawl,” WalkUPs account for just under one percent of total metro land mass . Metro Atlanta’s 27 WalkUPs occupy an average of 374 acres each—or approximately 10,000 acres in
total . Together, these WalkUPs absorbed 49 percent of the metro area’s office and multi-family rental square footage between 2009 and 2013, the period studied in our in-depth WalkUP Wake-Up Call analy-sis of Atlanta .16
It should be noted that both our Foot Traffic Ahead and in-depth, metro-specific WalkUP Wake-Up Call analyses do not account for a metro area’s owner-us-er space . Owner-user space is generally real estate owned and occupied by a business, government institution, or nonprofit organization and its em-ployees . Many public, nonprofit, and private sector organizations own and occupy their own real estate; examples include Federal and state governments, universities and colleges, and medical centers, as
well as corporate factories and offices . Owner-user space contains a large, but unknown, percentage of the real estate and employment in a metropolitan area . Because no regional or national database of owner-occupied space exists, as much as an estimat-ed 30 to 40 percent of employment space cannot be located, measured, and included in our analyses . This omission represents a gap in all studies of metropoli-tan development patterns, including this one .
WalkUPs occupy approximately one percent of the metropolitan land mass, but account for the majority of office and multi-family rental development
in many of the largest 30 metro areas.
Metropolitan Rankings

13
Metropolitan Rankings
Share of Total U.S. Populat ion in the30 Largest Metropol i tan Areas
Share of Total U.S. GDP Generated in the 30 Largest Metropol i tan Areas
SHARE IN TOP 30 METROPOLITAN AREAS
SHARE IN REST OF THE U .S .
46%
54%54%
46%

14 Foot Traffic Ahead: Ranking Walkable Urbanism in America’s Largest Metros • 2016 © The George Washington University School of Business 2016
Current Walkable Urbanism in the 30 Largest MetrosThis study identifies WalkUPs in the 30 largest metros and then ranks each metro according to current levels of walkable urbanism.
This research ranks the current relative walkable urbanism of each metro area . These rankings are based on the current percentage of office, retail, and multi-fami-ly rental occupied space located in each metro area’s WalkUPs in 2015 . This ranking reflects the total inventory of these three real estate product types, which has been built up over decades of development . Thus, each metro’s ranking is dramatically influenced by its past development patterns—which were overwhelmingly drivable sub-urban in character during the late 20th century .
The Current Ranking table ranks the metro areas and organizes them into four categories of Walkable Urbanism:
• LEVEL 1: Highest (6 metros)
• LEVEL 2: Upper Middle (7 metros)
• LEVEL 3: Lower Middle (10 metros)
• LEVEL 4: Lowest (7 metros)
The question of how many WalkUPs a metropolitan area can support is important for future infrastructure and investment decisions . On average, there are 311,365 people per WalkUP in the largest 30 metros, ranging from 93,254 people per WalkUP in metro Boston to 1,051,022 people per WalkUP in metro Phoenix . Our ongoing research has led us to conclude that Washington, DC, ought to be the nation’s model for walkable urban development . Using metro Washington, DC, as a benchmark, the populations of the 30 largest metros could support an additional 645 WalkUPs to match its 114,487 person-per-WalkUP density .
Today, the vast majority of existing WalkUP office, retail, and multi-family rental space is concentrated in the central cities of the largest 30 metros . However, in two of the top-three-ranked walkable urban metros—Boston and Washington, DC—half of their occupied WalkUP space is located in suburban jurisdictions . This development pattern makes Boston and Washington, DC, more likely models for future walkable urban development . In first-ranked New York City, the vast majority of walkable urban space is on Manhattan Island (0 .3 percent of the met-ro’s land mass)—a uniquely dense, almost unachievable development pattern for any other metro . Metro economic development agencies should focus their future efforts on development of WalkUPs in urbanizing suburban places as well as in center cities .
This report understates the economic difference between office, retail, and multi-family rental space located in walkable urban places versus drivable sub-urban areas . The limitations of existing datasets at the national level result in smaller-than-actual economic premiums for walkable urban real estate .
Our overly conservative assessment of WalkUP economic performance is due to two methodological factors:
Only by engaging in in-depth, metro-level research can these methodological issues be addressed.
Why Our Estimates Are Conservative
Rent per square foot is an imperfect measurement of real estate economics.
This analysis uses rent per square foot to demonstrate real estate economics . A more precise metric would be valu-ation per square foot, which is used by real estate investors to determine if an investment is viable .
Valuation-per-square-foot calculations require knowledge of capitalization rates (“cap rates”) . After deducting op-erating costs (generally 30 percent for gross rents for an office building), the cap rate is applied to determine value per square foot .
To illustrate, our 2015 WalkUP Wake-Up Call: Boston analysis17 found a substantial cap rate premium for walkable urban space . Using Cushman & Wakefield data, WalkUP office cap rates were found to be 4 .5 percent ver-sus 6 .5 percent for drivable sub-urban office (mathematically, as cap rates go down, real estate valuation goes up and vice versa) . This 41 percent walkable urban cap rate premium compounds the already substantial Boston WalkUP office rental premium, valuing the true walkable urban pre-mium significantly higher than when measured by rental rates alone .
Rent prices for real estate product outside of defined WalkUP areas are inflated.
Walkable urban development takes place in regionally significant WalkUPs—which are the focus of this research—as well as in local-serving walkable neighborhoods (see table on page 7) .
Determining the locations and exis-tence of local serving, walkable urban places is only possible when conduct-ing in-depth analysis at the metro level, as in our WalkUP Wake-Up Call analyses . Because local-serving walk-able neighborhoods are outside the scope of this study, this report lumps their rent price data in with a metro’s drivable sub-urban areas .
The multi-family rental product type has had particularly substantial devel-opment in this cycle in both WalkUPs and local-serving walkable urban places . Thus, the presumable price premiums for multi-family rental space in local serving walkable neighbor-hoods have been combined with pric-es for drivable sub-urban multi-family . The result: an under-reported WalkUP price premium due to exaggerated multi-family rental rates outside of WalkUP areas .
Metropolitan Rankings

15
WALKABLE URBANISM OF THE 30 LARGEST U.S. METROPOLITANS:
RANK METRO AREA# OF
WALKUPS
POPULATIONOFFICE, RETAIL & MULTI-FAMILY RENTAL
OCCUPIED SPACE
Total in Metro Area Per WalkUP
Rank (Pop .per WalkUP)
% Office Located in WalkUPs
% Retail Located in WalkUPs
% Multi-Family Located in WalkUPs
% Total Located in WalkUPs
1 New York City 67 20,942,101 312,569 21 55% 13% 39% 38%
2 Washington, DC 44 5,037,427 114,487 2 53% 20% 23% 33%
3 Boston 54 5,035,729 93,254 1 45% 17% 31% 32%
4 Chicago 38 8,509,657 223,938 13 43% 15% 33% 30%
5 San Francisco Bay 56 7,360,487 131,437 4 37% 21% 19% 25%
6 Seattle 25 3,810,651 152,426 6 42% 12% 17% 22%
7 Portland 16 2,017,438 126,090 3 39% 15% 12% 19%
8 Pittsburgh 11 2,575,124 234,102 15 35% 6% 15% 18%
9 Denver 18 2,962,508 164,584 7 29% 8% 15% 17%
10 Philadelphia 17 5,302,186 311,893 20 25% 10% 14% 17%
11 Atlanta 27 5,020,710 185,952 10 33% 9% 11% 16%
12 Charlotte 8 1,340,886 167,611 8 26% 8% 12% 15%
13 Minneapolis-St. Paul 11 2,920,637 265,512 17 30% 6% 10% 15%
14 Cleveland 10 2,064,517 206,452 11 36% 5% 7% 14%
15 St. Louis 10 2,580,896 258,090 16 26% 4% 9% 12%
16 Kansas City 9 1,928,582 214,287 12 25% 6% 6% 12%
17 Los Angeles 53 18,413,866 347,431 22 23% 7% 8% 11%
18 Cincinnati 7 2,007,335 286,762 18 27% 6% 5% 11%
19 Baltimore 15 2,704,957 180,330 9 18% 9% 8% 11%
20 Houston 16 6,175,417 385,964 24 29% 6% 4% 11%
21 Detroit 32 4,706,797 147,087 5 22% 6% 7% 10%
22 Miami 20 5,771,020 288,551 19 18% 8% 8% 10%
23 Sacramento 6 2,328,199 388,033 25 22% 5% 4% 9%
24 San Diego 14 3,183,143 227,367 14 13% 7% 6% 7%
25 Dallas 18 6,694,445 371,914 23 10% 9% 5% 7%
26 Las Vegas 2 2,014,260 1,007,130 29 7% 8% 3% 5%
27 Tampa 6 3,326,846 554,474 26 11% 2% 2% 4%
28 San Antonio 2 1,863,530 931,765 28 10% 3% 1% 3%
29 Phoenix 4 4,204,089 1,051,022 30 11% 1% 1% 3%
30 Orlando 3 1,921,825 640,608 27 11% 1% 2% 3%
Metropolitan areas are ranked according to their current levels of walkable urbanism.
The walkable urbanism of each metro is determined to be the share of office, retail, and multi-family rental occupied space located in its WalkUPs in 2015.
Rankings are divided into four levels of walkable urbanism, which are described on the following pages.
LEVEL 1:HIGHEST WALKABLE URBANISM
LEVEL 2:UPPER-MIDDLE WALKABLE URBANISM
LEVEL 3:LOWER-MIDDLE WALKABLE URBANISM
LEVEL 4:LOWEST WALKABLE URBANISM
KEY:
Levels of Current Walkable Urbanism
Metropolitan Rankings
Current Ranking

16 Foot Traffic Ahead: Ranking Walkable Urbanism in America’s Largest Metros • 2016 © The George Washington University School of Business 2016
Metropolitan Rankings
New York CityWashington, DC
BostonChicago
San Francisco BaySeattle
PortlandPittsburgh
DenverPhiladelphia
AtlantaCharlotte
Minneapolis-St. Paul
6Number of Metros
284Total WalkUPs
46%Share of All WalkUPs
in Top 30 Metros
22-38%Range of Metro
Office, Retail & Multi-Family Rental Space Located
in WalkUPs
7Number of Metros
108Total WalkUPs
17%Share of All WalkUPs
in Top 30 Metros
15-19%Range of Metro
Office, Retail & Multi-Family Rental Space Located
in WalkUPs
LEVEL 2:UPPER-MIDDLE WALKABLE URBANISM
The metros in this group have the vast majority of their walkable urban office, retail, and multi-family rental space in their central cities (83 percent to 99 percent), which indicates walkable urbanism has not progressed into their suburbs .
The rankings of Pittsburgh and Philadelphia, the two older industrial metros in this category, reflect their histories as central city concentrations of walk-able urbanism as well as their spirited revitalization efforts, generally led by university and medical center Innovations Districts .
This group of upper-middle ranked metros also includes the rising walkable urban “stars” of metro Portland and Denver, as well as Atlanta, Charlotte, and Minneapolis-St . Paul . Many of these metros have significantly expanded their rail transit sys-tems, which has given rise to more transit-oriented WalkUPs .
LEVEL 1:HIGHEST WALKABLE URBANISM Metro New York City ranks first, in contrast to the 2014 Foot Traffic Ahead report,18 which ranked Washington, DC, as the most walkable urban met-ro area in the country . This is due to the inclusion of rental multi-family in this analysis (metro New York City has almost 39 percent of its multi-family rental in WalkUPs, compared to 23 percent in met-ro Washington, DC) . However, the vast majority (94 percent) of metro New York City’s WalkUP office, retail, and multi-family rental space is in its central city, while metro Washington, DC’s WalkUP square footage is more balanced between its central city (53 percent) and suburbs (47 percent) . Metro Bos-ton, ranked third, has also experienced urbaniza-tion of its suburbs, primarily in Cambridge, as well as redevelopment of its central city, which results in its high ranking .
Metro New York City has a well-deserved repu-tation for walkability, but that reputation is based mainly on New York City itself rather than the greater metro area . More than 94 percent of regionally significant walkable urban office, retail, and multi-family rental space in the metro area is located within New York City limits . And most of this walkable urbanism—80 percent of the metro total—is on Manhattan Island, which accounts for only eight percent of the metro region’s 21-million population and 0 .3 percent of its land mass . This means that much of the metro area outside the city limits is not well served by WalkUPs . Visitors to Manhattan have the illusion that all of metro New York City is highly walkable urban, which it is not .

17
Metropolitan Rankings
ClevelandSt. Louis
Kansas CityLos Angeles
CincinnatiBaltimore
HoustonDetroitMiami
Sacramento
10Number of Metros
178Total WalkUPs
29%Share of All WalkUPs
in Top 30 Metros
9-14%Range of Metro
Office, Retail & Multi-Family Rental Space Located
in WalkUPs
LEVEL 4: LOWEST WALKABLE URBANISM
Historically, extreme drivable sub-urban develop-ment has characterized low-ranked Tampa and Phoenix . However, in metro Phoenix there has been surprising recent growth of walkable urban-ism in both downtown Phoenix and Tempe, princi-pally due to the explosive growth of Arizona State University and the new rail transit line that serves as a “horizontal elevator” between the two . Metro Tampa has also seen growth in walkable urbanism, particularly in downtown Tampa and Ybor City, which are connected by a new streetcar, as well as in downtown St . Petersburg .
LEVEL 3:LOWER-MIDDLE WALKABLE URBANISM
This level divides into two sub-groups: Northern metros (plus Sacramento) and Sunbelt metros . The Northern metros of Cleveland, St . Louis, Kansas City, Cincinnati, Baltimore, and Detroit, plus Sacramento, have struggled to introduce walkable urbanism into their metro areas . Much of this lag is due to a historic lack of rail transit infrastructure, though all now have rail systems in early stages of development . They are also handicapped by local consumer perceptions that walkable urbanism, especially rail-based, transit-oriented development, is not compatible with their traditions . Even so, as a group they are achieving modest walkable urban rental premiums, which indicate there is a pent- up demand .
The three metros that are nearly synonymous with drivable sub-urbanism—metro Los Angeles, Houston, and Miami—show some particularly inter-esting trends . These three metros are achieving more substantial price premiums for occupied office, retail, and multi-family rental space in WalkUPs—48 percent in metro Houston, 74 percent in metro Miami, and 52 percent in metro Los Ange-les . It is not a coincidence that these three metros have made substantial investments in rail transit over the past decade—in particular Los Angeles, which has made the largest investment in new rail transit in the country .
San DiegoDallas
Las VegasTampa
San AntonioPhoenixOrlando
7Number of Metros
49Total WalkUPs
8%Share of All WalkUPs
in Top 30 Metros
3-7%Range of Metro
Office, Retail & Multi-Family Rental Space Located
in WalkUPs

18 Foot Traffic Ahead: Ranking Walkable Urbanism in America’s Largest Metros • 2016 © The George Washington University School of Business 2016
METRO AREA
FAIR SHARE INDEX
METRO AREA
FAIR SHARE INDEX
RANKFSI
2010-2015RANK
FSI2010-2015
Detroit 1 5 .05 Cincinnati 16 2 .75
Phoenix 2 4 .24 Minneapolis-St. Paul 17 2 .74
St. Louis 3 3 .98 Charlotte 18 2 .72
Cleveland 4 3 .78 Chicago 19 2 .66
Los Angeles 5 3 .44 Portland 20 2 .58
Atlanta 6 3 .27 Denver 21 2 .56
Tampa 7 3 .21 Philadelphia 22 2 .54
San Diego 8 3 .07 Dallas 23 2 .36
Baltimore 9 3 .04 Orlando 24 2 .27
Seattle 10 3 .04 Miami 25 2 .14
New York City 11 3 .02 Sacramento 26 2 .08
Kansas City 12 2 .94 Houston 27 1 .81
Boston 13 2 .89 San Francisco Bay 28 1 .77
Washington, DC 14 2 .79 San Antonio 29 1 .22
Pittsburgh 15 2 .78 Las Vegas 30 1 .11
The six metros most highly ranked for current walkable urbanism (New York City, Washington, DC, Boston, Chicago, San Francisco Bay, and Seattle), highlighted in the table below, all fall in the middle range of positive FSIs (1 .77 to 3 .02), with an average FSI of 2 .75 . These values are impressive given the large absolute base of walkable urban product in these metros . The fact that metro New York City has walkable urban growth that is three times faster than it did in 2010 is remarkable .
These high FSIs could mean we are witnessing the reversal of drivable sub-urban office and multi-family rental sprawl . This shift is especially dominant in the metros that already rank highest for current walkable urbanism .
Forward-Looking IndicatorsDetermining the future of walkable urbanism involves using forward- looking indicators, such as Fair Share Index, rent premiums, absorption,and urbanization of suburbs.
FAIR SHARE INDEX (FSI)The FSI measures the marginal market share increase or decrease for net absorp-tion of real estate for a given time period, compared to market share at the begin-ning of that time period . For this analysis, we measure market share increase from 2010 through 2015 against the base year 2010, near the start of the current real estate cycle . Because the FSI measures marginal change in market share against a base year, it shows which places are relatively growing or relatively shrinking . An FSI of more than 1 .0 indicates a place is gaining market share over its 2010 base; an FSI between 0 .0 and 1 .0 indicates positive absorption, but a loss of market share; and a negative FSI indicates both loss of market share and negative absorption .
For the FSI analysis in this report, we used office and multi-family rental space . We elected to drop retail from this calculation, since retail absorption data has become an unclear indicator of walkable urban future development trends due to significant retail industry disruptions . This includes competition from online re-tailers such as Amazon, the shift of sales from retailers’ brick-and-mortar stores to their online sites, the decline of big-box retailers and department stores, and the possible decline in retail sale feet per capita . These structural changes to the retail product type make its use as an indicator of future development trends unclear .
The late 20th century saw the domination of drivable sub-urban development . During this time, historic WalkUPs, which were generally center city downtowns and suburban downtowns, lost market share in virtually every metro area in the country . Between 1950 and 2000, historic WalkUPs had observed FSI values of less than 1 .0, generally falling between 0 .4 and 0 .6—a clear indication that they were losing market share to drivable sub-urban development .
This situation has been reversed in all of the 30 largest metropolitan areas . FSI findings in this report indicate that WalkUPs in all 30 metropolitan areas gained market share, probably for the first time in over 60 years . For the period 2010 to 2015, all 30 metros had FSI values greater than 1 .0; values range from 1 .11 for Las Vegas to a whopping 5 .05 for Detroit . This means that development of office and multi-family rental space in WalkUPs is gaining market share, while drivable sub-urban locations are losing market share .
Metropolitan Rankings

19
METRO AREA
WALKUP ABSORPTION
METRO AREA
WALKUP ABSORPTION
RANK% SHARE
2010-2015RANK
% SHARE2010-2015
New York City 1 115% Charlotte 16 39%
Boston 2 93% Los Angeles 17 38%
Washington, DC 3 91% Kansas City 18 35%
Chicago 4 79% Baltimore 19 32%
Seattle 5 63% Cincinnati 20 30%
Cleveland 6 54% San Diego 21 23%
Pittsburgh 7 51% Miami 22 21%
Portland 8 50% Houston 23 20%
Detroit 9 49% Sacramento 24 20%
Atlanta 10 49% Dallas 25 17%
St. Louis 11 48% Phoenix 26 13%
San Francisco Bay 12 44% Tampa 27 11%
Philadelphia 13 42% Orlando 28 8%
Denver 14 42% Las Vegas 29 5%
Minneapolis-St. Paul 15 40% San Antonio 30 5%
SHARE OF METRO WALKUP OFFICE & MULTI-FAMILY RENTAL ABSORPTIONThis metric shows the WalkUP office and rental multi-family absorption in each metro area for 2010-2015 . The eight metros highlighted below had 50 percent or more of their absorption in WalkUPs . An additional three were close behind in the 48 to 49 percent range . The six metros that ranked as having the highest levels of current walkable urbanism (indicated below in green) have a weighted average of 92 percent of office and multi-family rental absorption in WalkUPs during the 2010-2015 period . Metro New York City drivable sub-urban office and multi-family rental absolutely lost occupied space from 2010-2015 .
As explained on page 14 in the sidebar “Why Our Estimates Are Conservative,” these values lump local serving walkable urban absorption (which consists princi-pally of multi-family rental), in with the drivable sub-urban category, so walkable urban absorption measures are under-estimated .
These high FSIs could mean we are witnessing the reversal of drivable sub-urban office and multi-family rental sprawl.
This shift is especially dominant in the metros that already rank highest for current walkable urbanism.
Metropolitan Rankings

20 Foot Traffic Ahead: Ranking Walkable Urbanism in America’s Largest Metros • 2016 © The George Washington University School of Business 2016
METRO AREA
WALKUP RENT PREMIUM
METRO AREA
WALKUP RENT PREMIUM
RANK % PREMIUM Q4 2015 RANK
% PREMIUMQ4 2015
New York City 1 191% San Antonio 16 47%
Seattle 2 97% San Diego 17 41%
Boston 3 96% Portland 18 40%
Chicago 4 77% Las Vegas 19 39%
Miami 5 74% Denver 20 35%
Washington, DC 6 66% Tampa 21 32%
Philadelphia 7 63% Minneapolis-St. Paul 22 30%
San Francisco Bay 8 58% Pittsburgh 23 30%
Phoenix 9 57% Detroit 24 29%
Orlando 10 55% Sacramento 25 29%
Atlanta 11 53% Cleveland 26 24%
Los Angeles 12 52% Cincinnati 27 23%
Charlotte 13 50% St. Louis 28 21%
Dallas 14 49% Kansas City 29 12%
Houston 15 48% Baltimore 30 4%
METRO AREA
WALKUP RENT PREMIUM
METRO AREA
WALKUP RENT PREMIUM
RANK% CHANGE2010-2015
RANK% CHANGE2010-2015
New York City 1 66% San Diego 16 9%
Seattle 2 53% San Francisco Bay 17 9%
Boston 3 41% Los Angeles 18 6%
Miami 4 36% Portland 19 4%
San Antonio 5 22% Denver 20 3%
Chicago 6 21% Cincinnati 21 3%
Detroit 7 17% Dallas 22 1%
Minneapolis-St. Paul 8 15% Pittsburgh 23 0%
Charlotte 9 15% Orlando 24 -4%
Philadelphia 10 15% Kansas City 25 -4%
St. Louis 11 13% Tampa 26 -6%
Cleveland 12 13% Houston 27 -7%
Phoenix 13 12% Baltimore 28 -9%
Sacramento 14 12% Atlanta 29 -11%
Washington, DC 15 10% Las Vegas 30 -26%
CHANGE IN RENT-PER-SQUARE-FOOT PREMIUMA measure of the change of the rate of growth, this metric examines increases or decreases in WalkUP rent premiums for office, retail, and multi-family rental be-tween the first quarter of 2010 and fourth quarter of 2015 . The six metros ranked highest for current walkable urbanism—New York City, Washington, DC, Boston, Chicago, San Francisco Bay, and Seattle—together experienced a 34 percentage point increase in rent premium . Leading this group is metro New York City, which jumped from a 124 percent rent-per-square-foot premium for office, retail, and multi-family rental in the first quarter of 2010 to a 191 percent premium at the end of 2015—an increase of 66 percentage points, or a rate over the six years of 8 .9 percent points annually .
While all 30 metros exhibit walkable urban rent premiums in 2015, seven metros, highlighted below, experienced a decline in the size of their premiums over the last five years . All but one of these seven metros ranked as having low walkable urbanism . The exception is metro Atlanta, which ranked in the upper-middle level for current walkable urbanism . Though it has seen a loss of 11 percentage points in its WalkUP rent premium from 2010 to 2015, this premium is still a considerable 53 percent over drivable sub-urban products for 2015 .
CURRENT RENT-PER-SQUARE-FOOT WALKUP PREMIUMThis metric measures current rent premiums for office, retail, and multi-family rental as of fourth quarter 2015 . Relative to their drivable sub-urban areas, all 30 metros had positive average rent premiums for walkable urban real estate prod-ucts . The top eight metros listed below, and highlighted, contain the six highest- ranked metros for current walkable urbanism (indicated in green) . Together, these six metros have a 125 percent WalkUP rental premium, meaning rents in their WalkUPs are, on average, more than double what they are in drivable sub-urban locations . Metro New York City has a staggering 191 percent (nearly three times) rent premium over drivable sub-urban products .
Metropolitan Rankings

21
METRO AREA
WALKUP SPACE IN SUBURBS
METRO AREA
WALKUP SPACE IN SUBURBS
RANK% SHAREQ1 2010
RANK% SHAREQ1 2010
Las Vegas 1 53% Portland 16 13%
Washington, DC 2 49% San Diego 17 12%
Houston 3 48% Denver 18 11%
Miami 4 46% San Francisco Bay 19 11%
Boston 5 41% Dallas 20 10%
Phoenix 6 40% Orlando 21 9%
Los Angeles 7 38% Cleveland 22 7%
Atlanta 8 32% Chicago 23 7%
Detroit 9 29% New York City 24 6%
St. Louis 10 26% Tampa 25 6%
Baltimore 11 22% Sacramento 26 3%
Kansas City 12 18% Pittsburgh 27 1%
Seattle 13 17% Minneapolis-St. Paul 28 1%
Charlotte 14 17% Cincinnati 29 0%
Philadelphia 15 16% San Antonio 30 0%
SHARE OF OFFICE & RENTAL MULTI-FAMILY IN THE SUBURBSThe walkable urban trend is about the redevelopment of the central city and the urbanization of the suburbs . However, to date, most metros have a very small share of their walkable urban office, retail, and multi-family rental development in their suburbs . There is a proven market for urbanizing suburban living, as shown by the success of WalkUPs such as Reston Town Center (metro Washington, DC), Bellevue (metro Seattle), and Kendall Square (metro Boston) . Focusing predom-inantly on the redevelopment of the central city misses segments of the market that want walkable urbanism closer to suburban households and businesses .
The ten metros that rank as having the greatest share of WalkUPs in their suburbs include metros that have rail infrastructure from a century ago, even if that rail was ripped out in the 1960s and recently replaced . The revitalization of suburban town centers originally built around and linked by rail transit, such as downtown Ft . Lauderdale (metro Miami), Pasadena (metro Los Angeles), and Evanston (metro Chicago), is now common . These areas were initially laid out to be pedestrian friendly and to benefit from proximity to rail transit .
The outlier in this group is metro Las Vegas . With only two WalkUPs, and one of those—the Strip—just outside the central city, its rank as number one in terms of share of WalkUP space in suburbs should be viewed as a statistical fluke .
For metro areas that rank low on this metric, but highly in our ranking for current walkable urbanism, there is tremendous upside potential in urbanizing their suburbs . These metros, which are highlighted in the table, include New York City, Philadelphia, Minneapolis-St . Paul, and Chicago—all older metros that share NIMBY (“not in my backyard”) opposition to density in their suburbs, even around existing rail stations surrounded by surface parking lots . However, there are signs this opposition is fading, especially in the suburbs of metro New York City . If this opposition can be overcome, these metro areas will accrue great economic, social equity, and environmental benefits .
Metropolitan Rankings

22 Foot Traffic Ahead: Ranking Walkable Urbanism in America’s Largest Metros • 2016 © The George Washington University School of Business 2016
WALKABLE URBANISM OF THE 30 LARGEST U.S. METROPOLITANS:
Development Momentum RankingRANK METRO AREA
FAIR SHARE INDEX
2010-2015
Share of WalkUP Absorption
2010-2015
Share of WalkUP Space
in Suburbs
Q1 2010
WALKUP RENT PREMIUMS COMPOSITE DIRECTIONAL
INDEXCurrent
Premium Q4 2015
Change in Premium
Q1 2010-Q4 2015
1 New York City 3 .02 115% 6% 191% 66% 0.75
2 Boston 2 .89 93% 41% 96% 41% 0.60
3 Detroit 5 .05 49% 29% 29% 17% 0.57
4 Seattle 3 .04 63% 17% 97% 53% 0.56
5 Phoenix 4 .24 13% 40% 57% 12% 0.53
6 Washington, DC 2 .79 91% 49% 66% 10% 0.51
7 Los Angeles 3 .44 38% 38% 52% 6% 0.47
8 St. Louis 3 .98 48% 26% 21% 13% 0.46
9 Miami 2 .14 21% 46% 74% 36% 0.45
10 Chicago 2 .66 79% 7% 77% 21% 0.44
11 Atlanta 3 .27 49% 32% 53% -11% 0.43
12 Cleveland 3 .78 54% 7% 24% 13% 0.42
13 Philadelphia 2 .54 42% 16% 63% 15% 0.39
14 Charlotte 2 .72 39% 17% 50% 15% 0.38
15 San Diego 3 .07 23% 12% 41% 9% 0.36
16 Portland 2 .58 50% 13% 40% 4% 0.34
17 Minneapolis-St. Paul 2 .74 40% 1% 30% 15% 0.32
18 Denver 2 .56 42% 11% 35% 3% 0.32
19 Tampa 3 .21 11% 6% 32% -6% 0.32
20 Houston 1 .81 20% 48% 48% -7% 0.32
21 Pittsburgh 2 .78 51% 1% 30% 0% 0.31
22 Kansas City 2 .94 35% 18% 12% -4% 0.31
23 Baltimore 3 .04 32% 22% 4% -9% 0.30
24 San Francisco Bay 1 .77 44% 11% 58% 9% 0.30
25 Dallas 2 .36 17% 10% 49% 1% 0.30
26 Cincinnati 2 .75 30% 0% 23% 3% 0.28
27 Orlando 2 .27 8% 9% 55% -4% 0.28
28 Sacramento 2 .08 20% 3% 29% 12% 0.25
29 Las Vegas 1 .11 5% 53% 39% -26% 0.21
30 San Antonio 1 .22 5% 0% 47% 22% 0.21
A Composite Directional Index was developed to rank the 30 largest metros on the momentum of their walkable urban development. This metric indi-cates how walkable or sprawling their future development is likely to be.
This Index is a blend of the following trend metrics, weighted as noted:Office & Multi-Family Space Absorption:
30%: Fair Share Index (FSI)
20%: Share of Regional Office & Multi- Family Space Absorption in WalkUPs
Central City vs. Suburban Balance:
10%: Share of Total Metro WalkUP Office & Retail Space Located in Suburbs
WalkUP Rent Premiums:
20%: Current WalkUP Office, Retail & Multi-Family Rent Premiums
20%: Change in WalkUP Office, Retail & Multi-Family Rent Premiums
Explanations of each metric are summarized on the next page.
LEVEL 1:HIGH DEVELOPMENT MOMENTUM for FUTURE WALKABLE URBANISM
LEVEL 2:MIDDLE DEVELOPMENT MOMENTUM for FUTURE WALKABLE URBANISM
LEVEL 3:LOW DEVELOPMENT MOMENTUM for FUTURE WALKABLE URBANISM
KEY: Levels of Walkable Urban Development Momentum
Metropolitan Rankings

23
OFFICE & MULTI-FAMILY SPACE ABSORPTION• Fair Share Index (FSI) WalkUPs’ share of the regional office and multi-family rental space absorption for a
set of recent years divided by WalkUPs’ market share of the office and multi-family inventory at the beginning of that time period. For this analysis, we analyzed net office and multi-family market absorption for 2010 through 2015 .
FSI values indicate the following:
• FSI > 1.0 A metro’s WalkUPs have gained market share
• 0.0 ≤ FSI ≤ 1.0 A metro’s WalkUPs have lost market share but have positive absorption
• FSI < 0.0 A metro’s WalkUPs have lost of market share and have negative absorption
From the 1950s through the early 21st century, WalkUPs in virtually every metro area in the country lost office market share due to the dominance of drivable sub-urban land development . Select market research indicates that during these decades, the FSI for office space in WalkUPs generally ranged between 0 .4 and 0 .6, and was consis-tently less than 1 .0 . This study shows that this situation has reversed in the country’s 30 largest metros .
• Share of Regional Office & Multi-Family Space Absorption in WalkUPs WalkUPs’ share of regional office and multi-family rental space absorption from
2010 through 2015. This metric differs from the FSI described above in that it is not relative to market share in a base year; rather, it indicates share of the total regional net office absorption over the study period .
CENTRAL CITY VS. SUBURBAN BALANCE• Share of Total Metro WalkUP Office & Multi-Family Space
Located in Suburban WalkUPs The share of a metro’s total WalkUP office and multi-family rental space located in
suburban WalkUPs versus central city WalkUPs. In most metros ranked highly for walkable urbanism, the large majority of office and multi-family development has occurred in the central cities . However, focusing only on redevelopment in down-town areas misses segments of the market that demand walkable urbanism in their suburbs . Increasing suburban urbanism portends future growth of WalkUPs .
WALKUP RENT PREMIUMS• Current WalkUP Rent Premiums The 2015 premium, or discount, for office, retail, and multi-family rents per square
foot in WalkUPs, as compared to the average in drivable sub-urban areas. Price premiums indicate pent-up demand for a product, in this case office, retail, and multi-family living space in walkable urban locations .
• Change in WalkUP Rent Premiums The increase or decrease in rent premiums for office, retail, and multi-family living
space in WalkUPs between the first quarter of 2010 and the fourth quarter of 2015 .
Summary of Trend Metrics Used in Development Momentum Ranking
COMPOSITE DIRECTIONAL INDEXThe trend metrics above were blended into one index to rank the 30 metros
according to how walkable or sprawling their future development is likely to be .
LEVEL 1:HIGH DEVELOPMENT MOMENTUM for WALKABLE URBANISM The seven metros with the highest level of walkable urban development momentum have absorbed a weighted average of 79 percent of all office and multi-family rental occupied space in their metro areas between 2010 and 2015 . In top-ranked metro New York City, walkable urban absorption was 115 percent, while occupied drivable sub-urban space shrank in absolute terms . WalkUPs in this group of top-seven metros are substantially gaining market share over drivable sub-urban locations; on average, their WalkUPs are growing at 3 .3 times the rate they did in 2010 . These aggressive market share gains are even higher than the gains of drivable sub-urban Edge Cities during the 1980s—only now the trend has reversed . Walkable urban office, retail, and multi-family rental space in these seven metros commands an average premi-um of 125 percent . And the peak has not yet been reached: since 2010, these premiums have risen by 41 percent .
Not surprisingly, the metros of New York, Boston, Seattle, and Washington, DC, rank in the highest group for both current walkable urbanism and walkable urban development momentum . A little more surprising, however, is that the metros of Detroit, Los Angeles, and Phoenix appear just as likely to experience a boom in walkable urbanism . For decades, these three metros sprawled faster than most other metros . But since 2010, their development patterns have experienced a fundamental shift from drivable sub-urban to walkable urban, evidenced by WalkUP market share gains (office and multi-family rental FSIs) since 2010 of 3 .44 in Los Angeles, 4 .24 in Phoenix, and a remarkable 5 .05 in metro Detroit .
While metro Detroit experienced the most substantial and well-publicized economic decline over the past decade, its future walkable urban growth is ex-ceptionally promising . It has also experienced some of the fastest GDP and job growth of all 30 metros . Much of this growth has occurred in revived WalkUPs like downtown and Midtown Detroit, as well as in urbanizing suburbs like Ann Arbor, Birmingham, and Royal Oak .
LEVEL 3: LOW DEVELOPMENT MOMENTUM for WALKABLE URBANISM It is a positive sign that even these five metros, which are at the bottom of our de-velopment momentum ranking, are all gaining market share for walkable urban office and multi-family rental space by a factor of nearly two; together, their weighted average FSI is 1 .9 .
The greatest opportunity for these metros is to expand the urbanization of their suburbs, while continuing the redevelopment of their center cities . Their walkable urban rent premiums are a healthy 39 percent over drivable sub-urban locations .
Metropolitan Rankings

24 Foot Traffic Ahead: Ranking Walkable Urbanism in America’s Largest Metros • 2016 © The George Washington University School of Business 2016
firms have helped Houston and Dallas generate the sixth- and seventh-highest real GDP per capita of the largest 30 metros in the country .
But as sprawling, car-based metros with top-ten levels of GDP per capita, Houston and Dallas should be considered exceptions that prove the rule . The oil and gas industries provide a unique foundation to their economies that will not be replicated in other metros . Yet, both metros are achieving high FSIs, indicating strong walkable urban market share capture, and significant rental rate premiums .
Additionally, metro Dallas has been building one of the largest new light rail systems in the country, sec-ond only to metro Los Angeles—a solid effort toward future walkable urban development .
Portland: Though widely known for its walkable urbanism, rail transit, and bikeability, 87 percent of metro Port-land’s walkable urbanism is in its center city . Though Orenco Station is a national model of greenfield transit-oriented development, Portland has experi-enced little urbanization in its suburbs . The metro area continues to build drivable sub-urban patterns, in spite of an urban growth boundary meant to dis-courage sprawl .
Philadelphia: Similar to Chicago, Philadelphia’s walkable urban growth has occurred almost exclusively in its central city, where a remarkable renaissance has occurred . While urbanizing suburbs present an opportunity to realize more WalkUPs, massive NIMBY (not-in-my-backyard) opposition and a poorly maintained commuter rail system create challenges .
Metropolitan Rankings
Chicago: While highly ranked (#4) for its current walkable urban development, nearly all of this development is located in its central city . Confining walkable urban development to the city of Chicago also limits the market for walkable urbanism, as many households and businesses would not consider a location in the city . Chicago’s greatest opportunity is to urbanize its suburbs . To date, the 388 local jurisdictions in the Chicago metro that control land use have many times stifled urbanization of the suburbs . If continued, this opposition may drive development to other metro areas, hindering growth and leaving a significant portion of market demand unsatisfied .
Atlanta: Atlanta’s FSI of 3 .27 indicates remarkable market share gain of walkable urban office and multi-family rental growth in 2010-2015 . However, this growth started from a very low base, as it follows a half centu-ry of predominantly drivable sub-urban development . Our 2013 WalkUP Wake-Up Call: Atlanta analysis showed that Atlanta had turned the corner on sprawl in this real estate cycle, while another study showed the metro has the most sprawling development of all major U .S . metro areas . Both are true: One study is future oriented, while the other reflects the past .
Denver: While metro Denver’s impressive FSI of 2 .56 points to future walkable urbanism market share gains, the WalkUP rental premium of only 35 percent has remained flat over the past six years, and most of the walkable urban development has been within the central city . The expansion of the light rail system will certainly help urbanize the suburbs in the years to come .
Tampa: One of the most sprawling metro areas in the coun-try, Tampa continues to rank near the bottom of our Foot Traffic Ahead rankings . However, an extremely high FSI of 3 .21—though, like Atlanta, from an ex-tremely low base—shows signs of change .
Los Angeles and Miami: These two long-time, car-dominated metros have some important history in common: both were founded as rail-served places . Metro Miami’s original rail system, and much of the initial development in downtown Miami and Palm Beach, was built by Henry Flagler in the late 19th and early 20th centuries . Likewise, Henry Huntington was primarily responsible for the metro Los Angeles Pacific Electric Railway, as well as substantial real estate development . The downtowns they founded, as well as many other surrounding towns, were oriented around and linked by the rail lines . Though the walkable urbanism of both downtowns basically collapsed during the late 20th century, their fortunes have now reversed . Their average FSI of 3 .08 in this real estate cycle indicates a strong shift back to walkable urban development . This shift is not only present in their center cities; roughly 40 percent of walkable urban development is taking place in their suburban downtowns . History is repeating itself .
Houston and Dallas: These two metros are the great exception to the walkable urban trend, but things are changing deep in the heart of Texas . Given their histories as oil- and gas-based metro economies, their moderate-to-low walkable urbanism rankings for both current and de-velopment momentum are fitting . The recent influx of major corporate headquarter locations and high-tech
Development Momentum in Individual Metro Areas
Comments on
What does walkable urban development mean for the future of these metro areas?

25
SOCIAL EQUITY RANKINGS
26 Foot Traffic Ahead: Ranking Walkable Urbanism in America’s Largest Metros • 2016 © The George Washington University School of Business 2016
Social Equity Rankings
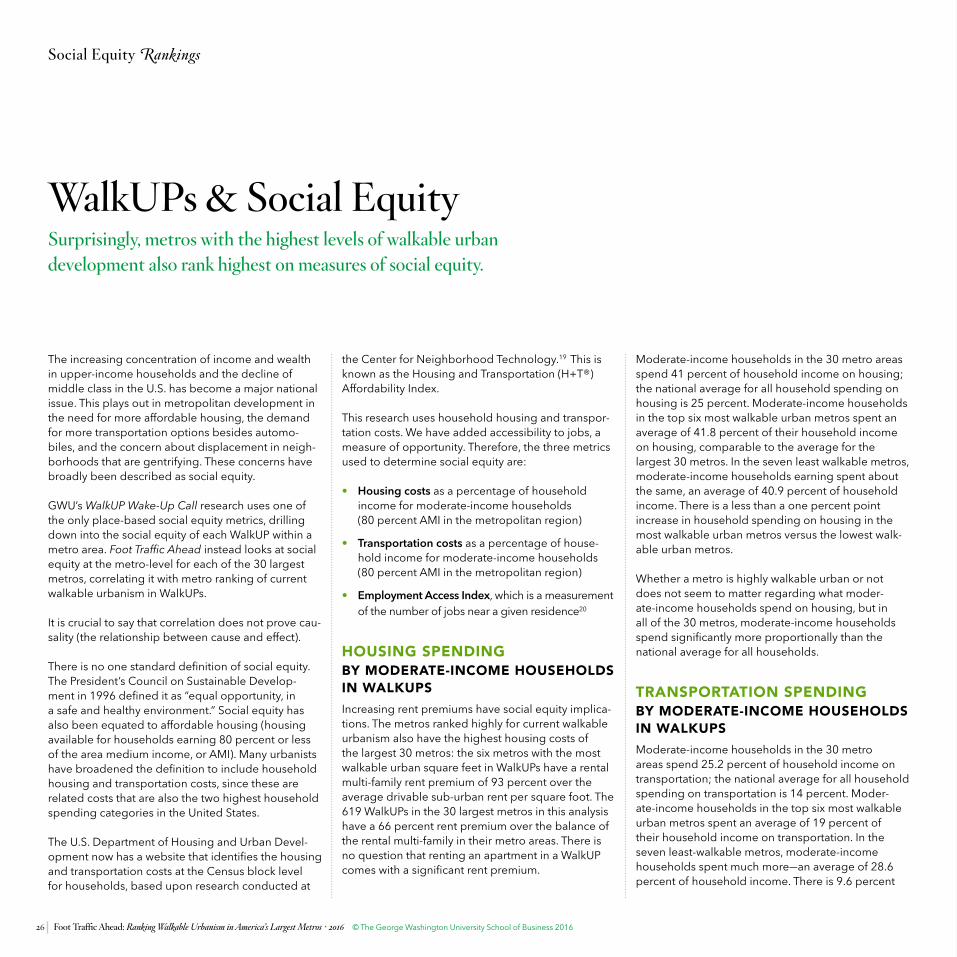
The increasing concentration of income and wealth in upper-income households and the decline of middle class in the U .S . has become a major national issue . This plays out in metropolitan development in the need for more affordable housing, the demand for more transportation options besides automo-biles, and the concern about displacement in neigh-borhoods that are gentrifying . These concerns have broadly been described as social equity .
GWU’s WalkUP Wake-Up Call research uses one of the only place-based social equity metrics, drilling down into the social equity of each WalkUP within a metro area . Foot Traffic Ahead instead looks at social equity at the metro-level for each of the 30 largest metros, correlating it with metro ranking of current walkable urbanism in WalkUPs .
It is crucial to say that correlation does not prove cau-sality (the relationship between cause and effect) .
There is no one standard definition of social equity . The President’s Council on Sustainable Develop-ment in 1996 defined it as “equal opportunity, in a safe and healthy environment .” Social equity has also been equated to affordable housing (housing available for households earning 80 percent or less of the area medium income, or AMI) . Many urbanists have broadened the definition to include household housing and transportation costs, since these are related costs that are also the two highest household spending categories in the United States .
The U .S . Department of Housing and Urban Devel-opment now has a website that identifies the housing and transportation costs at the Census block level for households, based upon research conducted at
the Center for Neighborhood Technology .19 This is known as the Housing and Transportation (H+T®)Affordability Index .
This research uses household housing and transpor-tation costs . We have added accessibility to jobs, a measure of opportunity . Therefore, the three metrics used to determine social equity are:
• Housing costs as a percentage of household income for moderate-income households (80 percent AMI in the metropolitan region)
• Transportation costs as a percentage of house-hold income for moderate-income households (80 percent AMI in the metropolitan region)
• Employment Access Index, which is a measurement of the number of jobs near a given residence20
HOUSING SPENDING BY MODERATE-INCOME HOUSEHOLDS IN WALKUPS
Increasing rent premiums have social equity implica-tions . The metros ranked highly for current walkable urbanism also have the highest housing costs of the largest 30 metros: the six metros with the most walkable urban square feet in WalkUPs have a rental multi-family rent premium of 93 percent over the average drivable sub-urban rent per square foot . The 619 WalkUPs in the 30 largest metros in this analysis have a 66 percent rent premium over the balance of the rental multi-family in their metro areas . There is no question that renting an apartment in a WalkUP comes with a significant rent premium .
Moderate-income households in the 30 metro areas spend 41 percent of household income on housing; the national average for all household spending on housing is 25 percent . Moderate-income households in the top six most walkable urban metros spent an average of 41 .8 percent of their household income on housing, comparable to the average for the largest 30 metros . In the seven least walkable metros, moderate-income households earning spent about the same, an average of 40 .9 percent of household income . There is a less than a one percent point increase in household spending on housing in the most walkable urban metros versus the lowest walk-able urban metros .
Whether a metro is highly walkable urban or not does not seem to matter regarding what moder-ate-income households spend on housing, but in all of the 30 metros, moderate-income households spend significantly more proportionally than the national average for all households .
TRANSPORTATION SPENDING BY MODERATE-INCOME HOUSEHOLDS IN WALKUPS Moderate-income households in the 30 metro areas spend 25 .2 percent of household income on transportation; the national average for all household spending on transportation is 14 percent . Moder-ate-income households in the top six most walkable urban metros spent an average of 19 percent of their household income on transportation . In the seven least-walkable metros, moderate-income households spent much more—an average of 28 .6 percent of household income . There is 9 .6 percent
WalkUPs & Social EquitySurprisingly, metros with the highest levels of walkable urbandevelopment also rank highest on measures of social equity.

27
Social Equity Rankings
RANK: SOCIAL EQUITY
METRO AREA
Rank:CURRENT
WALKABLE URBANISM
HOUSING COST
% of Income
TRANSPORTATION COST
% of Income
EMPLOYMENT ACCESS INDEX
COMBINED SOCIAL
EQUITY INDEX(0-100)
1 New York City 1 47% 17% 133,481 86
2 Washington, DC 2 36% 17% 56,897 83
3 Boston 3 41% 19% 58,263 75
4 San Francisco Bay 5 42% 19% 52,591 73
5 Minneapolis-St. Paul 13 35% 23% 35,897 74
6 Baltimore 19 38% 21% 33,915 72
7 Chicago 4 43% 23% 54,570 69
8 Philadelphia 10 41% 22% 44,846 70
9 Denver 9 37% 23% 35,350 71
10 Seattle 6 40% 23% 33,061 68
11 Los Angeles 17 47% 26% 57,284 64
12 Houston 20 36% 27% 32,294 69
13 Dallas 25 37% 27% 29,140 68
14 San Antonio 28 35% 29% 26,700 69
15 Portland 7 40% 25% 32,268 66
16 Pittsburgh 8 34% 30% 21,419 68
17 St. Louis 15 36% 28% 21,200 66
18 Kansas City 16 35% 28% 16,798 67
19 Cincinnati 18 35% 29% 18,689 67
20 Las Vegas 26 40% 29% 32,895 64
21 Phoenix 29 39% 29% 28,747 64
22 Atlanta 11 39% 28% 23,268 64
23 San Diego 24 46% 25% 29,922 60
24 Cleveland 14 39% 29% 23,009 63
25 Detroit 21 40% 29% 24,467 63
26 Sacramento 23 43% 27% 24,045 60
27 Charlotte 12 39% 30% 20,627 62
28 Miami 22 52% 28% 32,561 55
29 Tampa 27 44% 30% 19,205 57
30 Orlando 30 45% 31% 22,320 56
WALKABLE URBANISM OF THE 30 LARGEST U.S. METROPOLITANS:
Social Equity Rankingpoint increase in household spending on transportation in the lowest walkable urban metros versus the highest walkable urban metros . Moderate-income households spend signifi-cantly less in highly walkable urban metros, undoubtedly due to less spending—and less reliance—on automobiles, though it is higher than the national average for all households .
EMPLOYMENT ACCESSIBILITY MODERATE-INCOME HOUSEHOLDS IN WALKUPS The CNT’s Employment Accessibility Index measures the num-ber of jobs accessible within a given distance to a residence . Access to a robust job market can help employees to optimize earnings, match their skill sets to jobs, and minimize unem-ployment . High job density near a household will offer greater employment opportunities .
Moderate-income households in the top six most walkable urban metros have access to an average of 85,861 jobs . Met-ropolitan New York City has the highest Employment Access Index, standing out at 133,481 jobs for 80 percent AMI house-holds, compared to the next largest city by this measure, metro Boston, at 58,263 jobs . In the seven least walkable metros, moderate-income households have access to an average of 29,903 jobs . This is over a three-fold increase for those mod-erate-income households living in the highest walkable urban metros as compared to the least walkable urban metros .
Moderate-income households in highly walkable urban metros have substantially greater access to employment opportunities .
CONCLUSIONS This research has reached the counterintuitive conclusion that metro areas with the highest walkable urban rankings have the highest social equity performance, as measured by moder-ate-income household spending on housing and transporta-tion and access to employment . Of the top-ten metro regions ranked by social equity, eight also ranked in the the top ten for current walkable urbanism . The most walkable urban metros also have the most social equity .
Moderate-income households in the high-ranked walkable urban metros have (1) the lowest transportation costs due to having less expensive alternatives to evermore-costly cars and trucks, and (2) have greater employment accessibility due to increased density and transit accessibility to these jobs . These two measures balance the higher costs of housing in the most walkable urban metros .

28 Foot Traffic Ahead: Ranking Walkable Urbanism in America’s Largest Metros • 2016 © The George Washington University School of Business 2016
10%
Walk able Urbanism & Socia l Equity of the 30 Largest U.S. Metros :Scatterplot Showing the Relationship Between
Current Rankings v s . Soc ia l Equity Rankings
Current Ranking% of Metro R eg i on’ s O ff i ce , R eta i l & Mult i -Fa mi ly Spa ce i n Wa lkUPs
So
cial
Eq
uit
y In
dex
(1-1
00)
5%0% 10% 15% 20% 25% 30% 35% 40% 45% 50%
100
75
80
85
90
95
70
65
60
55
50
45
40
35
30
1
2
4
3
5
6
7
10
8
12
13
14
1516
17
18
19
20
21
22
2324
25
26
27
28
29
30
11
9
ID# METROPOLITAN
1 New York City
2 Washington, DC
3 Boston
4 Chicago
5 San Francisco Bay
6 Seattle
7 Portland
8 Pittsburgh
9 Denver
10 Philadelphia
11 Atlanta
12 Charlotte13 Minneapolis-St . Paul
14 Cleveland
15 St . Louis
16 Kansas City
17 Los Angeles
18 Cincinnati
19 Baltimore
20 Houston
21 Detroit
22 Miami
23 Sacramento
24 San Diego
25 Dallas
26 Las Vegas
27 Tampa
28 San Antonio
29 Phoenix
30 Orlando
LEVELS OF CURRENT WALKABLE URBANISM
LEVEL 1: HIGHEST WALKABLE URBANISM
LEVEL 2: UPPER-MIDDLE WALKABLE URBANISM
LEVEL 3: LOWER-MIDDLE WALKABLE URBANISM
LEVEL 4: LOWEST WALKABLE URBANISM
This scatterplot of the relative Current Walkable Urban Rankings and the Social Equity Rankings shows the desired direction any metropolitan area would want to go —toward the upper-right hand corner of the chart where a metro area has both high walkable urbanism and high social equity .
y =123.13(x2) + 10.87x + 61.78
R2= 0.60

29
CORRELATIONS & FINDINGS

30 Foot Traffic Ahead: Ranking Walkable Urbanism in America’s Largest Metros • 2016 © The George Washington University School of Business 2016
CURRENT WALKABLE URBANISM WEALTH EDUCATION LEVEL
RANK METRO AREA% of Office, Retail & Multi-Family Space Located in WalkUPs
Metro GDP per Capita (2014)
(Chained 2009 Dollars)
Rank: GDP
% of Population 25 & Over with
Bachelors Degree
Rank:Education
1 New York City 38% $70,830 5 37% 8
2 Washington, DC 33% $72,191 4 51% 1
3 Boston 32% $74,746 3 42% 3
4 Chicago 30% $58,375 14 37% 12
5 San Francisco Bay 25% $80,643 1 43% 2
6 Seattle 22% $75,874 2 38% 7
7 Portland 19% $64,991 8 37% 10
8 Pittsburgh 18% $52,961 19 30% 21
9 Denver 17% $61,903 10 42% 4
10 Philadelphia 17% $59,240 12 35% 15
11 Atlanta 16% $53,104 18 37% 9
12 Charlotte 15% $55,114 16 38% 6
13 Minneapolis-St. Paul 15% $62,054 9 41% 5
14 Cleveland 14% $32,122 30 29% 26
15 St. Louis 12% $48,885 22 33% 16
16 Kansas City 12% $54,123 17 35% 14
17 Los Angeles 11% $60,148 11 29% 27
18 Cincinnati 11% $51,768 20 32% 18
19 Baltimore 11% $57,291 15 37% 11
20 Houston 11% $70,097 6 30% 19
21 Detroit 10% $51,171 21 30% 20
22 Miami 10% $46,104 23 29% 25
23 Sacramento 9% $46,012 24 30% 22
24 San Diego 7% $58,540 13 35% 13
25 Dallas 7% $66,168 7 32% 17
26 Las Vegas 5% $41,807 27 22% 30
27 Tampa 4% $40,468 29 27% 29
28 San Antonio 3% $41,109 28 27% 28
29 Phoenix 3% $44,102 26 29% 24
30 Orlando 3% $46,001 25 30% 23
WalkUPs, Education & GDP per CapitaCorrelations and findings indicate that walkable urban development, education, and economic vitality are linked...somehow.
There is a significant positive correlation between a metro’s current walkable urbanism and the higher education of its work-force . Even more compelling is the high degree of correlation between walkable urbanism and metropolitan GDP per capita .
A regression analysis comparing the metro rankings for current walkable urbanism and educational attainment (as measured by the percentage of the metro’s population age 25 or older with at least a Bachelor’s degree) shows a strong positive correlation (R2 = 0 .55) . The scatterplot at the top of page 31 shows this correlation, along with the logarithmic line of best fit .
There is a proven causal connection between the education of the metropolitan workforce and GDP per capita .21 Given the correlation between educational attainment and walkable urbanism, it is not surprising that there is also a strong correla-tion between a metro area’s current walkable urban ranking and its per capita GDP . The six highest-ranked walkable urban metropolitan areas have an average GDP per capita of $72,110, and the seven lowest-ranked walkable urban metros have an average GDP per capita of $48,313 . A regression analysis com-paring walkable urbanism and GDP per capita shows a positive correlation (R2 = 0 .49) using a polynomial line of best fit . The scatterplot in at the bottom of page 31 shows this correlation .
There is a 49 percent GDP per capita “premium” in the most highly walkable urban metros over the least walkable urban metros . This is a similar to the per capita GDP ratio between Germany and countries like Russia, Latvia, and Croatia .
This research does not indicate whether walkable urbanism causes highly educated people to move to or stay in metro areas, or whether metro areas become more walkable urban because of their higher-educated inhabitants . Previous research suggest that educated people prefer walkable urban places . Richard Florida calls walkability a “magnet for the creative class,” and a recent study by Wisconsin PIRG finds that more than 80
Correlations & Findings

31
Corre lat ion :Walkable Urbanism & Educat ion of Metro Region Populat ion
15%
20%
25%
30%
35%
40%
45%
50%
55%
0% 5% 10% 15% 20% 25% 30% 35%
% o
f M
etro
Pop
ulat
ion
Age
25
amd
Ove
r w
ith
a B
ache
lor’
s D
egre
e or
Hig
her
% o f Metro Regio n ’ s Off i ce , Retai l & Mult i-Family Space in WalkUPs
40%
y=0.655 ln(x) + 0.4797
R2= 0.55
Correlations & Findings
Corre lat ion :Walkable Urbanism & Per Capita GDP of Metro Regions
(2014 per capita GDP, chained 2009 dollars)
$0
$10k
$20k
$30k
$40k
$50k
$60k
$70k
$90k
$80k
0% 5% 10% 15% 20% 25% 30% 35%
Met
ro p
er C
apit
a G
DP
% o f Metro Region ’ s Off i ce , Retai l & M ult i- Family S p ac e in W alk UPs
40%
DALLASHOUSTON
y = -172,930x 2 + 154,095x + 39,162
R2= 0.49
percent of college students think having transportation options other than driving is either somewhat or very important in where they choose to live .22 This is further bolstered by research in ag-glomeration economies, which suggests that productivity rises with density .23
Using both educational attainment and walkable urbanism together in a multiple regression analysis explains 59 percent of the variation in per capita GDP among the 30 largest metros . This correlation is only slightly stronger than the correlation between educational attainment and per capita GDP . This finding suggests that walkable urbanism’s positive correlation with per capita GDP may be due to its association with educated people . At the very least, these relationships establish that metro areas with wealthy, educated residents tend to be walkable, the exceptions being metro Dallas and Houston (discussed below) .
Additional evidence of this link is established when considering walkable urbanism and people with graduate degrees (master’s, doctoral, or professional) . Using the percent of the population over age 25 with a graduate degree, the original correlation (R2 = 0 .55) increases (R2 = 0 .65), indicating not only a relation-ship between walkable urbanism and education, but that the relationship is even stronger with higher levels of education .
When the metros Dallas and Houston are excluded from the datasets, analysis shows an even stronger correlation between walkable urbanism and higher education . These two metros can be seen in the scatterplot as outliers, ranking in the low-er-middle in terms of walkable urbanism (x-axis), but higher in per-capita GDP (y-axis) . This is likely due to their economies being bolstered by oil and natural gas industries, though both economies have become much more diversified in recent decades . With these two metros removed from the analysis, the correlation between walkable urbanism and GDP per capita of the remaining 28 metros increases to an R2 of 0 .61, compared to 0 .49 when all 30 metros are included .
This study recognizes that not all variables have been consid- ered in this analysis, and that a broader longitudinal study could illustrate these effects across time . Nonetheless, these results provide additional circumstantial evidence that supports walkable urbanism’s positive contribution to metropolitan economic performance .

32 Foot Traffic Ahead: Ranking Walkable Urbanism in America’s Largest Metros • 2016 © The George Washington University School of Business 2016

33
CONCLUSIONS & FURTHER STUDY

34 Foot Traffic Ahead: Ranking Walkable Urbanism in America’s Largest Metros • 2016 © The George Washington University School of Business 2016
Conclusions & Further StudyGrowth in market share in walkable urban income products, at the expense of drivable sub-urban, is occurring in all metros examined— rapidly in some, and tentatively in others.
This study has examined the current state of walk-able urbanism (Current Rankings), trends pointing to future walkable urbanism (Development Momentum Rankings), social equity correlations with walkable urbanism (Social Equity Rankings), and correlations between walkable urbanism and education as well as GDP per capita .
Overall, the research has shown market share growth in walkable urbanism for income products in all 30 of the largest 30 U .S . metros, as well as positive impacts on social equity, the education of the workforce, and GDP per capita . In addition, there are substantial rental premiums on a per square foot basis .
There is also a need to more deeply understand the role of walkable urbanism in addressing social equity challenges . The counterintuitive conclusion of this research is that increased walkable urban develop-ment in the 30 largest metros also increases social equity by the measures we employed, though the obvious multi-family rental premiums demonstrated in this study have to be addressed through conscious attainable housing programs .
Drivable sub-urban development has characterized U .S . metropolitan growth since 1946—a structural shift from the walkable urban pattern that dominated development prior to the 1930s (during the years surrounding and just following the Great Depression, buildings permits were down by 60 percent (1930 and 1945) from what they had been in the 1920s) . The data presented in this report suggests another structural shift is now taking place; walkable urban development has returned, occurring in some metros more quickly and in some more slowly . Our analysis shows that walkable urbanism has gained market
share in the office, retail, and multi-family rental prod-uct types over drivable sub-urban, possibly for the first time in 60 to 70 years .
The U .S . metropolitan landscape will likely continue to trend towards walkable urbanism, with real estate indicators positively trending towards this pattern of urban development . Previous WalkUP Wake-Up Call reports have demonstrated this phenomenon for the metropolitan areas of Atlanta, Boston, Washington, DC, and Detroit . Bolstered with the new data in this study, we suggest that the U .S . is undergoing a signif-icant shift in growth patterns .
A paradigm-shifting share of office and multi-fam-ily rental absorption in this real estate cycle (2010 through 2015) has taken place in WalkUPs . WalkUPs continue to outpace drivable sub-urban locations by measures of absorption and experience strong rental premiums . This is despite the fact that WalkUPs occu-py a small portion of a metro’s land mass—generally somewhere between 0 .5 to 1 .2 percent .
We present these results with a few caveats . First, this analysis is limited to rental office, retail, and multi-family space as reported by CoStar™ . An analysis of for-sale housing is needed to further confirm the results of our analysis .
Secondly, owner-user space is not included in the data set of our analysis, although our hypothesis is that its inclusion would probably further under-score a trend towards a preference for WalkUPs . Core Values, a survey conducted in 2015 by GW, Smart Growth America, and Cushman & Wakefield, sought the motivations behind the relocations of 500 corporate offices to walkable urban locations .24
The top two reasons cited were (1) to recruit talent-ed Millennials and (2) to brand the company as a 21st-century, knowledge-based business .
Recent major corporate relocations include:
• General Electric’s announced move to the Boston downtown adjacent Seaport District
• Marriott’s announced plans to move to a walkable urban, transit-served location in metro Washing-ton, DC
• Capital One Bank’s new headquarters adjacent to the Tysons heavy rail station
These illustrate that large corporations, which own a large portion of owner-occupied space, have a preference for walkable urban locations .
Finally, this analysis does not mean that sprawl will vanish from the American metropolitan landscape, especially since most buildings have a 40-year plus life before they are either rehabilitated or torn down . Instead, this report suggests a change in trends that will take decades to play out; in a good year, only two percent is added to the current real estate inventory . And this inventory is the result of more than 60 years of drivable sub-urban development . The current real estate cycle, which started in 2010, serves as a watershed moment that marks a definite, but gradual shift to walkable urban development . Every region in the U .S . still continues some level of sub-urban development, particularly on the met-ropolitan periphery where land prices are lowest . Construction of fringe metro drivable sub-urban, for-sale housing in particular has not ceased, though it is getting harder for conventional builders to make their financial models work . Drivable sub-urban,
Conclusions & Further Study

35
Conclusions & Further Study
for-sale housing was the most negatively affected real estate product during the 2007-2009 housing and real estate crisis, and most of the remaining “under-water” housing inventory is in fringe drivable sub-urban locations .
It should also be noted that metro Dallas and Houston are still push-ing their drivable sub-urban boundaries—further to the north in Dallas and both northwest and west in Houston—though, even in these two metros, walkable urban development is gaining market share over drivable sub-urban competition .
While some metro areas rank highly in walkable urbanism, and will continue to benefit from continued WalkUP development, the overall national trend largely depends on what happens in the middle- and lower-ranked metro areas . Will these metros continue to build predominantly drivable sub-urban, or will they follow the path of the highly ranked walkable urban metros? To what extent will these met-ros move toward urbanizing their sub-urban areas?
Based on Development Momentum rankings, this analysis predicts the following low-to-middle ranked metros will accelerate their evolu-tion in a walkable urban manner:
• Detroit
• Phoenix
• Los Angeles
• St . Louis
• Miami
• Atlanta
• Cleveland
With their histories of drivable sub-urban development, and reli-ance on automobiles and trucks, metros with low walkable urbanism generally resist walkable urban development . These metros, however, display indications of movement towards walkable urbanism based on the data in this analysis and because of local support for walkable urbanism, including developers, neighborhood activists, and elected leaders . Nonetheless, dominant infrastructure, zoning, and land-use subsidies for many metros will continue to favor drivable sub-urban development in lower-ranked metros . It is possible for them to catch on to what we see as a national trend towards walkable urbanism, and to do so requires the advocacy, place management, policy tools, and transportation infrastructure necessary to support the future form of American urban development .
Future ResearchFurther study should include an analysis the following topics:
• Favored Quarter: The vast majority of growth in regionally significant development in the late 20th century occurred in a metropolitan’s “favored quarter,” an area of concentrated upper-middle–class housing separated from concentrated minority housing . Further research could explore to what extent favored quarter development influ-ences future development in highly walkable urban metros, especially the social equity implications of separating job opportunities from low income households .
• Attainable Housing: There is a crucial need to determine how best to develop attainable housing in WalkUPs . Federal, state, and local government programs are important, but far more is needed . Place management and community development organizations need to mobilize to resources for intentional attainable housing programs .
• Rail Transit: Many different modes of rail and high-capacity bus transit (heavy, light, and com-muter rail; streetcar; and bus rapid transit) influence future walkable urbanism . Future research should explore the different economic performance of WalkUPs served by the various types of transit, while accounting for the substantially differ-ent capital and operating costs of each type .
• Place Management Organizations: Place management organizations can take the form of public, private, non-profit, or mixed entities that promote development, support local services (like trash pick-up, trolley buses, and branding), and actively manage the place’s brand identity . Often known as “Business Improvement Districts,” national examples include the Times Square Alliance (New York City), the Buckhead Community Improvement District (Atlanta), and the Golden Triangle Business Improvement District (Washing-ton, DC) . Further research could establish the link between place management and the performance of individual WalkUPs .
• Local Serving Walkable Urban Places: This study focused on the 619 WalkUPs, regionally significant walkable urban places where the wealth of the metro area is primarily created . More research is needed on local serving walkable urban places . The metro Boston WalkUP Wake-Up Call showed that in addition to the 1 .2 percent of the metro land occupied by 57 WalkUPs, local serving walkable urban neighborhoods make up another 4 .4 percent of metro land . This total of 5 .6 percent of metro land that is walkable urban is home to over 40 percent of the metro’s residents and jobs .
• Owner-User Space: Understanding the size, location, and impact of owner-user office, industrial, sports, education, and medical space would fill in a major gap in knowledge about the built environment . Currently, the amount of space in this large category of land use is unknown .

36 Foot Traffic Ahead: Ranking Walkable Urbanism in America’s Largest Metros • 2016 © The George Washington University School of Business 2016
APPENDICES
Pho
to c
our
tesy
of
Mic
hig
an M
unic
ipal
Lea
gue

37
Endnotes
1. Weighted average of office, retail, and multi- family rental . Weighted by total occupied space of each type (sq . ft .) in the respective metro .
2. For further reading on defining central city and suburbs, see: Forsythe, A . (2012) . Defining sub-urbs . Journal of Planning Literature, 27(3); Hall, P . G ., & Pain, K . (2006) .
3. The definition of “metropolitan area” is based on the metropolitan area definitions in use by the Metropolitan Planning Organization pertaining to each metro . Exceptions include: Boston (MPAC region, plus Massachusetts towns served by the MBTA); Miami (BMPO, MDMPO, and PBMPO); New York City (Regional Plan Association region); Philadelphia (DVRPC region, less Mercer County, NJ, assigned to New York City region); Portland (Metro and RTC) . Metropolitan definitions as used in this report will differ from U .S . Census definitions for Metropolitan Statistical Area (MSA) .
4. For previous George Washington University re-search, see http://business .gwu .edu/about-us/research/center-for-real-estate-urban-analysis/research/walkable-urban-places-research/ .
5. Ibid . Figures in table refer to Boston analysis .
6. Leinberger, C . (2007) . “Footloose and Fancy Free: A Field Survey of Walkable Urban Places in the Top 30 U .S . Metropolitan Areas .” Paper prepared for The Brookings Institution . Retrieved from www .brookings .edu/research/papers/2007/12/1128-walkableurbanism- leinberger .
7. Leinberger, Christopher B . and Lynch, Patrick, Foot Traffic Ahead: Ranking Walkable Urbanism
in America’s 30 Largest Metros, June 2014 . http://business .gwu .edu/wp-content/up-loads/2016/02/CREUA_Foot-Traffic-Ahead .pdf .
8. Leinberger, C . and Alfonzo, M . “Walk this way: The economic promise of walkable places in metropolitan Washington, DC .” The Brookings Institution . Available at www .brookings .edu/research/papers/2012/05/25-walkable-places- leinberger .
9. WalkScore® is the most common ranking of walkability available . WalkScore assigns every address and many neighborhoods a score from 0 to 100 . This score reflects a pedestrian’s ability to reach a variety of daily destinations within walking distance . For full methodology, see www .walkscore .com/methodology .shtml .
10. Defining the boundaries of a place is not an exact science . Even among locals, substantial disagreement exists about where one place ends and another begins . Given these limita-tions, the definition of WalkUPs will continue to evolve . Nonetheless, this study represents the most comprehensive identification of such places to date .
11. For previous George Washington University research, see http://business .gwu .edu/about-us/research/center-for-real-estate-urban-analy-sis/research/walkable-urban-places-research/ . For Innovation Districts, see http://www .brook-ings .edu/research/opinions/2014/11/12-ur-ban-innovation-districts-katz-wagner .
12. 2014 American Community Survey .
13. U .S . Bureau of Economic Analysis, “Table 1 .1 .5 . Real Gross Domestic Product, Chained Dollars, Billions of chained 2009 dollars, 2014,”; “Real
GDP by metropolitan area, chained 2009 dol-lars, 2014); Accessed May 24, 2016 .
14. Leinberger, Christopher B ., DC: The WalkUP Wake-Up Call:, The Nation’s Capital As a Model for Walkable Urban Places, September 2012 . http://business .gwu .edu/wp-content/up-loads/2016/02/CREUA_DC-Walkupd .pdf .
15. Leinberger, Christopher B . and Lynch, Patrick, The WalkUP Wake-Up Call: Boston, March 2015 . http://business .gwu .edu/wp-content/uploads/2016/02/CREUA_Walkup-Wake-Up-Call-Bostonb .pdf .
16. Leinberger, Christopher B . and Austin, Mason, The WalkUP Wake-Up Call: Atlanta, The Poster Child of Sprawl Builds a Walkable Urban Future, October 2013 . http://business .gwu .edu/wp-content/uploads/2016/02/CREUA_Walk-UP-Atlanta-2013 .pdf .
17. Leinberger, Christopher B . and Lynch, Patrick, The WalkUP Wake-Up Call: Boston, March 2015 . http://business .gwu .edu/wp-content/uploads/2016/02/CREUA_Walkup-Wake-Up-Call-Bostonb .pdf .
18. Leinberger, Christopher B . and Lynch, Patrick, Foot Traffic Ahead: Ranking Walkable Urbanism in America’s 30 Largest Metros, June 2014 . http://business .gwu .edu/wp-content/up-loads/2016/02/CREUA_Foot-Traffic-Ahead .pdf .
19. U .S . Department of Housing and Urban Development Location Affordability Portal, http://www .locationaffordability .info/
20. As defined by CNT: “Employment Access Index is a weighted measure developed by CNT to estimate both the quantity of and residents’
Appendices

38 Foot Traffic Ahead: Ranking Walkable Urbanism in America’s Largest Metros • 2016 © The George Washington University School of Business 2016
access to the jobs in a region . It is calculated using an inverse-square law to model total access to jobs in the metropolitan area by using the sum of the number of jobs divided by the square of the distance to those jobs .” Therefore, jobs closest to a residence are weighed stron-ger than jobs further away . Generally speaking, this index measures the number of jobs within approximately 10 miles to a residence . For more information, see http://htaindex .cnt .org/about/ .
21. Barro, R . (2001), Education and Economic Growth, In: Helliwell JF The Contribution of Hu-man and Social Capital to Sustained Economic Growth and Well-Being . OECD ; 2001 .; Barro, R . (2001) . Human Capital and Growth . The American Economic Review, 91(2), 12-17 .
22. Florida, Richard . “Why Walkable Cities Aren’t Always the Ones You’d Think .” The Atlantic Citylab, October 13, 2011 . http://www .citylab .com/commute/2011/10/why-walkable-cities- arent-always-the-ones-you-think/279/; and http://www .wispirg .org/news/wip/new-survey-wisconsin-brain-drain-partly-because-youth-seek-alternatives-driving .
23. Edward L . Glaeser & Joshua D . Gottlieb, 2009 . “The Wealth of Cities: Agglomeration Econ-omies and Spatial Equilibrium in the United States,” Journal of Economic Literature, Amer-ican Economic Association, vol . 47(4), pages 983-1028 .
24. http://business .gwu .edu/wp-content/uploads/2015/06/Why-American-Compa-nies-are-Moving-Downtown .pdf
Appendices

39
Bruce Griesenbeck • SacramentoPres Kabacoff • New OrleansMichael Lander • MinneapolisRobert Lang • Las VegasMarco Li Mandri • San DiegoGregg Logan • Orlando James McCandless • DenverMike McKeever • SacrametoEd McKinney • CharlotteArrie Mitchell • Dallas-Ft. WorthAndrea Mrzlak • DenverJoe Nickol • CincinnatiSean Northrup • IndianapolisBen Ranney • ChicagoGraham Smith • Kansas CityDennis Strait • Kansas CityAndy Taft • Dallas-Ft. WorthDavid Taylor • TampaMike Zeller • Kansas City
Hon . Henry Cisneros • San AntonioDennis Allen • PortlandKatrina Bayer • HoustonAlan Billingsley • San FranciscoChris Brewster • Kansas CityDrew Brown • PhoenixShea Byers • DallasDon Carter • PittsburghDavid Crossley • HoustonMidori Dillon • SeattleAndres Duany • MiamiJason Duckworth • PhiladelphiaBob Eury • HoustonMark Falcone • DenverBill Fulton • HoustonShima Hamidi • Dallas-Ft. WorthJohn Hempelmann • SeattleBob Gardner • Los AngelesPaul Glastris • St. Louis
Acknowledgments
THANKS TO:
Co-StarCenter for Neighborhood TechnologyMaponicsWalkScoreChristine Patton of Patton CreativeLOCUS, a project of Smart Growth America
METRO-AREA PARTNERS:

40 Foot Traffic Ahead: Ranking Walkable Urbanism in America’s Largest Metros • 2016 © The George Washington University School of Business 2016
The Center for Real Estate and Urban Analysis