Embed Size (px)
Citation preview

Foothill Transit AgencyBattery Electric Bus Progress ReportData Period Focus: Jan. 2018 through Jun. 2018
Leslie Eudy and Matthew JeffersSeptember 2018
NREL/PR-5400-72207

NREL | 2
Table of ContentsIntroduction………………………………………………………….3Results Summary…………………………………………………. 4Fleet Profile……………………………………………………....... 8Evaluation Buses Specification…………………………….. 9Infrastructure Description……………………………………. 11Data Summary………………………………………………..…….12
Route Assignments………………………….………….14Fleet Mileage Accumulation……………….……… 15Availability Analysis……………………………………. 18Fuel Economy and Cost Analysis………………... 25Reliability – Miles Between Roadcall…………..31Maintenance Cost Analysis………………………… 33
Contacts………………………………………………………………. 45Acronyms and Abbreviations................................... 46Appendix: Fleet Summary Statistics……………….……. 48

NREL | 3
Introduction
This report summarizes results of a battery electric bus (BEB) evaluation at Foothill Transit, located in the San Gabriel Valley area of Los Angeles. Foothill Transit is collaborating with the California Air Resources Board and the U.S. Department of Energy’s National Renewable Energy Laboratory (NREL) to evaluate the buses in revenue service. The focus of this evaluation is to compare the performance and the operating costs of the BEBs to that of conventional technology buses and to track progress over time. Previous reports documented results from April 2014 through December 2017.1,2,3 This report extends the data analysis through June 2018. NREL plans to publish progress reports on the Foothill Transit fleet every six months through 2020.
1 Foothill Transit Battery Electric Bus Demonstration Results, NREL/TP-5400-65274, https://www.nrel.gov/docs/fy17osti/65274.pdf.2 Foothill Transit Battery Electric Bus Demonstration Results: Second Report, NREL/TP-5400-67698, https://www.nrel.gov/docs/fy17osti/67698.pdf.3 Foothill Transit Agency Battery Electric Bus Progress Report: Data Period Focus: Jan. 2017 through Dec. 2017, NREL/PR-5400-71292, www.nrel.gov/docs/fy18osti/71292.pdf

NREL | 4
Results Summary
Bus fleets: This evaluation includes 12 Proterra 35-ft fast charge buses (BEB 35FC), two Proterra 40-ft Catalyst fast charge buses (BEB 40FC), and eight NABI 42-ft compressed natural gas (CNG) buses.
Bus use: The BEBs are operated on a 16-mile route that circles through the Pomona Transit Center (PTC) for charging. The average speed for this route is 10.6 mph. The CNG buses are randomly dispatched on all routes out of the operations facility, including higher speed commuter routes. The average speed for the CNG buses is 17.6 mph. This difference in duty cycle has an impact on the comparison of mileage, fuel economy, and costs per mile between fleets.
Fuel economy: BEB efficiency in the first half of 2018 was 2.11 kWh/mi (17.86 mpdge) for the BEB 35FC fleet, 2.14 kWh/mi (17.61 mpdge) for the BEB 40FC fleet, and 3.82 mpgge (4.27 mpdge) for the CNG bus fleet. The BEB fuel economy is approximately 4 times higher than that of the CNG buses as they are currently operated by Foothill Transit. NREL collected data on CNG buses operating on Line 291 that showed an average fuel economy of 2.1 mpdge (see previous report for details). The BEB fuel efficiency is 8 times higher than that of the CNG buses in the same service.

NREL | 5
Results Summary (continued)
Fuel cost: Based on energy purchased in 2018, the BEB fleet cost $0.41/mi (at $0.19/kWh) and the CNG fleet cost $0.20/mi (at $0.90/gge). To compare cost between buses in the same service, NREL estimated the cost per mile for the CNG buses if operated only on Line 291. The lower fuel economy would increase the cost of the CNG buses to an overall average of $0.51/mi, which is slightly higher than the cost of the BEB fleet.
Availability: 2018 availability was 74.2% for the BEB 35FC buses, 83.5% for the BEB 40FC buses, and 96.3% for the CNG buses. The majority of unavailable time for the BEBs was due to general bus related problems. Issues with the low-voltage batteries had an impact on BEB availability. Other downtime resulted from issues with components such as: transmission, air compressor, DC-DC converter, air conditioning, and the energy storage system.

NREL | 6
Results Summary (continued)
Maintenance cost: Cost to maintain the buses in 2018 was $0.71/mi for the BEB 35FC buses, $0.29/mi for the BEB 40FC buses, and $0.24/mi for the CNG buses. The BEB 35FC bus cost has increased over what was reported previously. Several factors contributed to the high cost for the BEBs:
• The BEB 35FC buses are now past the warranty period for some components resulting in higher parts cost.
• All maintenance has been transitioned to onsite contractor staff, resulting in increased labor hours for training and troubleshooting as the staff become more familiar with systems and components. This is expected to drop as the learning curve improves for the maintenance staff.

NREL | 7
Results Summary (continued)
• Foothill Transit is experiencing continued issues with the low-voltage batteries. Despite the maintenance contractor switching to a better performing battery, the batteries are still failing prematurely. One issue is that the accessories (farebox, cameras) continually draw power from these batteries. In some cases, the operators are not turning off the switches, which allows the accessories to continue to draw power. Because this issue is not related to the BEB system, NREL has provided the costs with and without the low-voltage battery replacement costs.
• Total maintenance cost without low-voltage battery costs was $0.61/mi for the BEB 35FC buses and $0.24/mi for the BEB 40FC buses.
• Future analysis: NREL will continue to collect data on the two existing BEB fleets in comparison to the CNG baseline fleet, and will add data from a fleet of 40-ft Proterra Catalyst E2 extended range buses. Future analyses will also investigate the difference in cost for brake relines between bus types.

NREL | 8
Fleet ProfileFoothill Transit serves a 327-square-mile area covering the San Gabriel and Pomona Valley region of Los Angeles County. Foothill Transit’s administrative office is located in West Covina, California. Foothill Transit is governed by a Joint Powers Authority of 22 member-cities and the County of Los Angeles.
Foothill Transit operates 36 local and express routes including commuter runs to downtown Los Angeles. The current bus fleet consists of 343 CNG buses and 16 BEBs.

NREL | 9
Evaluation Buses: SpecificationsVehicle System BEB 35FC BEB 40FC CNG
Number of buses 12 2 8Bus manufacturer/model Proterra/BE35 Proterra/Catalyst Fast Charge NABI/BRT-07.03Model year 2014 2016 2014Bus purchase costa $904,490 $879,845 $575,000Length/width/height 35 ft/102 in./129 in. 42.5 ft/102 in./134 in. 42 ft/102 in./137 in.GVWR/curb weight 37,320 lb/27,680 lb 39,050 lb/27,000 lb 42,540 lb/33,880 lb
Wheelbase 237 in. 296 in. 308 in.
Passenger capacity35 seats, 2 wheelchair positions, 18 standees
40 seats, 2 wheelchair positions, 18 standees
38 seats, 2 wheelchair positions, 10 standees
Motor or enginePermanent magnet, UQM,
PP220 Permanent magnet, UQM,
PP220CNG engine, Cummins, 8.9 ISL G
Rated power 220 kW peak (295 hp) 220 kW peak (295 hp) 280 hp @ 2,200 rpm
Energy storage (BEB)Fuel capacity (CNG)
Lithium-titanate batteries, Altairnano, TerraVolt 368 volts, 88 kWh total energy
Lithium-titanate batteries, Toshiba, TerraVolt 331 volts,
106 kWh total energy
7 Type IV cylinders, 22,204 scfat 3,600 psi
Accessories Electric Electric MechanicalEmissions equipment N/A N/A 3-way catalystTransmission/retarder Regenerative braking Regenerative braking N/Aa Includes amenities such as painting of bus and livery, surveillance system, PA system, radio, safety vision monitor.

NREL | 10
Evaluation BusesBEB 35FC BEB 40FC
CNG
Photo by Leslie Eudy, NREL
Photo by Leslie Eudy, NREL Photo courtesy of Foothill Transit

NREL | 11
Infrastructure DescriptionFoothill worked with the City of Pomona to establish an on-route fast charging station at the Pomona Transit Center (PTC). The station features two Eaton chargers in a climate controlled building with charge heads (right photo) positioned on either side (left photo). The two chargers operate as separate units with a dedicated control system for each. A common communication network serves both units with sensors to detect which charge head a bus is approaching to enable proper bus-to-charger communication for docking. The system is designed to fully charge a bus in under 10 minutes. For Foothill’s Line 291, typical charge times are around 7 minutes including docking time. Foothill built a layover time into the schedule to allow enough time for charging. Software controls prevent charging from surpassing the kWh limit that results in high demand charges.
Photos by Leslie Eudy, NREL
NREL | 12
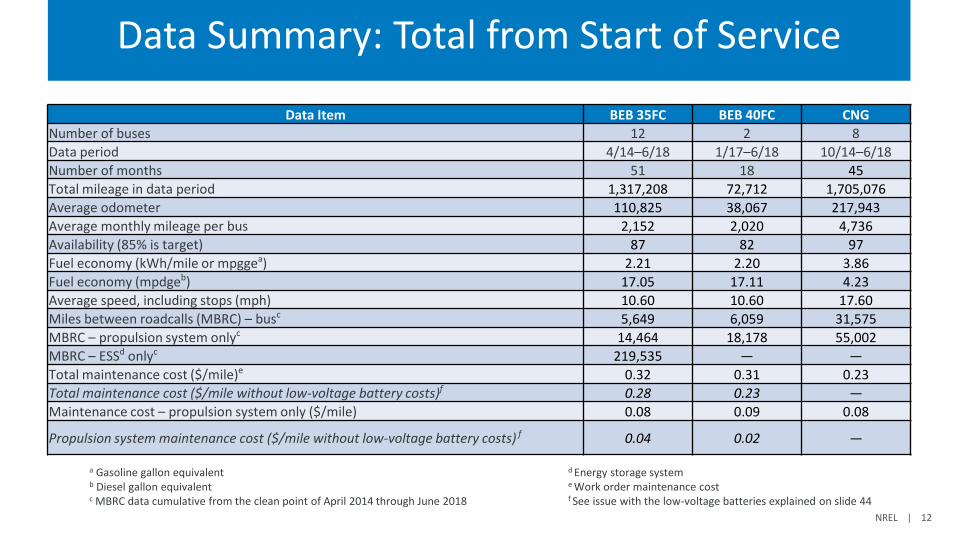
Data Summary: Total from Start of Service
a Gasoline gallon equivalent d Energy storage system b Diesel gallon equivalent e Work order maintenance costc MBRC data cumulative from the clean point of April 2014 through June 2018 f See issue with the low-voltage batteries explained on slide 44
Data Item BEB 35FC BEB 40FC CNGNumber of buses 12 2 8Data period 4/14–6/18 1/17–6/18 10/14–6/18Number of months 51 18 45Total mileage in data period 1,317,208 72,712 1,705,076Average odometer 110,825 38,067 217,943Average monthly mileage per bus 2,152 2,020 4,736Availability (85% is target) 87 82 97Fuel economy (kWh/mile or mpggea) 2.21 2.20 3.86Fuel economy (mpdgeb) 17.05 17.11 4.23Average speed, including stops (mph) 10.60 10.60 17.60Miles between roadcalls (MBRC) – busc 5,649 6,059 31,575MBRC – propulsion system onlyc 14,464 18,178 55,002MBRC – ESSd onlyc 219,535 — —Total maintenance cost ($/mile)e 0.32 0.31 0.23Total maintenance cost ($/mile without low-voltage battery costs)f 0.28 0.23 —Maintenance cost – propulsion system only ($/mile) 0.08 0.09 0.08
Propulsion system maintenance cost ($/mile without low-voltage battery costs) f 0.04 0.02 —

NREL | 13
Data Summary: Jan–Jun 2018
a Gasoline gallon equivalent d Energy storage systemb Diesel gallon equivalent e Work order maintenance costc MBRC data cumulative from the clean point of April 2014 through June 2018 f See issue with the low-voltage batteries explained on slide 44
Data Item BEB 35FC BEB 40FC CNGNumber of buses 12 2 8Data period 1/18–6/18 1/18–6/18 1/18–6/18Number of months 6 6 6Total mileage in data period 144,116 25,125 235,197Average odometer 110,825 38,067 217,943Average monthly mileage per bus 2,002 2,094 4,900Availability (85% is target) 74 83 96Fuel economy (kWh/mile or mpggea) 2.11 2.14 3.82Fuel economy (mpdgeb) 17.86 17.61 4.27Average speed, including stops (mph) 10.60 10.60 17.60Miles between roadcalls (MBRC) – busc 5,649 6,059 31,575MBRC – propulsion system onlyc 14,464 18,178 55,002MBRC – ESSd onlyc 219,535 — —Total maintenance cost ($/mile)e 0.71 0.29 0.24Total maintenance cost ($/mile without low-voltage battery costs)f 0.61 0.24 —Maintenance cost – propulsion system only ($/mile) 0.30 0.06 0.09
Propulsion system maintenance cost ($/mile without low-voltage battery costs) f 0.20 0.00 —

NREL | 14
Route AssignmentsFoothill Transit uses the BEB 35FC buses to fully electrify Line 291, which requires seven buses during peak hours. Line 291 is a 16.1-mile route between La Verne and Pomona that loops through the PTC in both directions. The average speed for the route is 10.6 mph. The agency adjusted the schedule to accommodate time for charging the buses. The additional buses are used as spares to allow for maintenance downtime and also as fill-in buses for other appropriate routes that go through the PTC, such as Line 855. The two 40-ft buses (BEB 40FC) are also used on these routes. In October 2017, Line 855 was eliminated. From that period on, the buses were only operated on Line 291.
The CNG buses are randomly dispatched on all routes out of Pomona Operations including commuter routes. Average speed for Pomona Operations as a whole is 17.6 mph.
Image courtesy of Foothill Transit

NREL | 15
BEB Fleet Total Miles
Apr-1
4M
ay-1
4Ju
n-14
Jul-1
4Au
g-14
Sep-
14O
ct-1
4N
ov-1
4D
ec-1
4Ja
n-15
Feb-
15M
ar-1
5Ap
r-15
May
-15
Jun-
15Ju
l-15
Aug-
15Se
p-15
Oct
-15
Nov
-15
Dec
-15
Jan-
16Fe
b-16
Mar
-16
Apr-1
6M
ay-1
6Ju
n-16
Jul-1
6Au
g-16
Sep-
16O
ct-1
6N
ov-1
6D
ec-1
6Ja
n-17
Feb-
17M
ar-1
7Ap
r-17
May
-17
Jun-
17Ju
l-17
Aug-
17Se
p-17
Oct
-17
Nov
-17
Dec
-17
Jan-
18Fe
b-18
Mar
-18
Apr-1
8M
ay-1
8Ju
n-18
Month
0
250,000
500,000
750,000
1,000,000
1,250,000
1,500,000
Cum
ulat
ive
Mile
s
0
25,000
50,000
75,000
100,000
125,000
150,000
Cum
ulat
ive
Hou
rs
BEB 35FC fleet average speed = 8.4 mph
BEB 40FC fleet average speed = 8.4 mph
• Combined totals for 12 BEB 35FC buses and two BEB 40FC buses

NREL | 16
Fleet Average Monthly Miles by Bus: Jan–Jun 2018
Bus ID Miles Months Average Monthly Mileage
2200 30,190 6 5,0322201 29,565 6 4,9282202 27,063 6 4,5112203 30,127 6 5,0212204 29,038 6 4,8402205 31,336 6 5,2232206 29,210 6 4,8682207 28,668 6 4,778
CNG Total 235,197 48 4,900
Bus ID Miles Months Average Monthly Mileage
2004 13,735 6 2,2892005 14,550 6 2,4252006 15,505 6 2,5842007 14,904 6 2,4842008 13,163 6 2,1942009 12,913 6 2,1522010 5,739 6 9572011 12,024 6 2,0042012 14,268 6 2,3782013 4,979 6 8302014 16,666 6 2,7782015 5,670 6 945
BEB 35FC Total 144,116 72 2,0022016 12,833 6 2,1392017 12,292 6 2,049
BEB 40FC Total 25,125 12 2,094
The average monthly operating mileage per bus for the BEBs is less than half that of the CNG buses. This is a result of the planned operation of the buses, in which the CNG buses accumulate miles faster than the BEBs do, and does not indicate a specific limitation of the technology.

NREL | 17
Fleet Average Monthly Miles
Apr-1
4
May
-14
Jun-
14
Jul-1
4
Aug-
14
Sep-
14
Oct
-14
Nov
-14
Dec
-14
Jan-
15
Feb-
15
Mar
-15
Apr-1
5
May
-15
Jun-
15
Jul-1
5
Aug-
15
Sep-
15
Oct
-15
Nov
-15
Dec
-15
Jan-
16
Feb-
16
Mar
-16
Apr-1
6
May
-16
Jun-
16
Jul-1
6
Aug-
16
Sep-
16
Oct
-16
Nov
-16
Dec
-16
Jan-
17
Feb-
17
Mar
-17
Apr-1
7
May
-17
Jun-
17
Jul-1
7
Aug-
17
Sep-
17
Oct
-17
Nov
-17
Dec
-17
Jan-
18
Feb-
18
Mar
-18
Apr-1
8
May
-18
Jun-
18
Aver
age
Month
0
1,000
2,000
3,000
4,000
5,000
6,000
Aver
age
Mon
thly
Mile
s (m
i/bus
)
BEB 35FC Fleet BEB 40FC Fleet CNG Fleet
4,179
2,0202,152
• Average monthly mileage shown for entire data period

NREL | 18
Availability AnalysisAvailability, which is a measure of reliability, is presented as the percentage of days the buses are actually available out of days that the buses are planned for passenger service. Buses available for service may have been used in passenger service, training, or special events, or they may have been available but just not used. Buses unavailable for service may have had issues with the propulsion system (energy storage system, electric drive system), general bus maintenance, or issues with the charging system. Accidents are removed from the data—the bus is considered “not planned” during the repair time.
The data presented are based on availability for morning pull-out and don’t necessarily reflect all-day availability. Transit agencies typically have a target of 85% availability for their fleets to allow for time to handle scheduled and unscheduled maintenance. For the Foothill Transit fleet, the buses are planned to operate every day, including weekends. For Foothill Transit, the source for availability data is garage activity sheets for the Pomona Operations, which list each bus that is not available for morning pull-out and provide a general reason for unavailability. These activity sheets are for the facility as a whole and include the BEBs as well as the CNG buses. The garage activity sheets are typically available for weekdays.
NREL presents availability as a monthly average trend and as overall availability. Unavailable time is separated into several categories to show the primary reason for downtime.

NREL | 19
Availability Summary: Jan–Jun 2018Category BEB 35FC
# DaysBEB 35FC
%BEB 40FC
# Days BEB 40FC % CNG# Days
CNG %
Planned work days 1,334 224 892Days available 990 74.2 187 83.5 859 96.3
Unavailable 344 25.8 37 16.5 33 3.7
ESS 41 3.1 6 2.7 — —
CNG engine — — — — 15 1.7
Electric drive 48 3.6 0 0.0 — —Charging issues 18 1.3 0 0.0 — —Preventive maintenance 3 0.2 0 0.0 4 0.4General bus maintenance 175 13.1 23 10.3 5 0.6Transmission 59 4.4 8 3.6 9 1.0
• The per-bus availability for the BEBs ranged from a low of 48% to a high of 94%• The majority of unavailable time for the BEBs was attributed to general bus maintenance• Issues with the low-voltage batteries lowered availability for the BEBs• The majority of unavailable time for the CNG buses was attributed to engine issues

NREL | 20
Monthly Availability: BEB 35FCAp
r-14
May
-14
Jun-
14Ju
l-14
Aug-
14
Sep-
14O
ct-1
4
Nov
-14
Dec
-14
Jan-
15
Feb-
15M
ar-1
5
Apr-1
5M
ay-1
5
Jun-
15Ju
l-15
Aug-
15
Sep-
15O
ct-1
5
Nov
-15
Dec
-15
Jan-
16
Feb-
16M
ar-1
6
Apr-1
6M
ay-1
6
Jun-
16Ju
l-16
Aug-
16
Sep-
16O
ct-1
6
Nov
-16
Dec
-16
Jan-
17
Feb-
17M
ar-1
7
Apr-1
7M
ay-1
7
Jun-
17Ju
l-17
Aug-
17
Sep-
17O
ct-1
7
Nov
-17
Dec
-17
Jan-
18
Feb-
18M
ar-1
8
Apr-1
8M
ay-1
8
Jun-
18
Month
50
60
70
80
90
100
Flee
t Ava
ilabi
lity
(%)
0
10
20
30
40
50
60
Num
ber o
f Day
s U
nava
ilabl
e
• The green line tracks the average monthly availability for the BEB 35FC fleet• The stacked bars provide the number of unavailable days each month separated by six categories• Low-voltage batteries fall into the Bus Maintenance category

NREL | 21
Monthly Availability: BEB 40FCAp
r-14
May
-14
Jun-
14Ju
l-14
Aug-
14
Sep-
14O
ct-1
4
Nov
-14
Dec
-14
Jan-
15
Feb-
15M
ar-1
5
Apr-1
5M
ay-1
5
Jun-
15Ju
l-15
Aug-
15
Sep-
15O
ct-1
5
Nov
-15
Dec
-15
Jan-
16
Feb-
16M
ar-1
6
Apr-1
6M
ay-1
6
Jun-
16Ju
l-16
Aug-
16
Sep-
16O
ct-1
6
Nov
-16
Dec
-16
Jan-
17
Feb-
17M
ar-1
7
Apr-1
7M
ay-1
7
Jun-
17Ju
l-17
Aug-
17
Sep-
17O
ct-1
7
Nov
-17
Dec
-17
Jan-
18
Feb-
18M
ar-1
8
Apr-1
8M
ay-1
8
Jun-
18
Month
50
60
70
80
90
100
Flee
t Ava
ilabi
lity
(%)
0
10
20
30
40
50
60
Num
ber o
f Day
s U
nava
ilabl
e
• The blue line tracks the average monthly availability for the BEB 40FC fleet• The stacked bars provide the number of unavailable days each month separated by six categories• Issues with the low-voltage battery during August 2017 lowered the availability

NREL | 22
Monthly Availability: CNGAp
r-14
May
-14
Jun-
14Ju
l-14
Aug-
14
Sep-
14O
ct-1
4
Nov
-14
Dec
-14
Jan-
15
Feb-
15M
ar-1
5
Apr-1
5M
ay-1
5
Jun-
15Ju
l-15
Aug-
15
Sep-
15O
ct-1
5
Nov
-15
Dec
-15
Jan-
16
Feb-
16M
ar-1
6
Apr-1
6M
ay-1
6
Jun-
16Ju
l-16
Aug-
16
Sep-
16O
ct-1
6
Nov
-16
Dec
-16
Jan-
17
Feb-
17M
ar-1
7
Apr-1
7M
ay-1
7
Jun-
17Ju
l-17
Aug-
17
Sep-
17O
ct-1
7
Nov
-17
Dec
-17
Jan-
18
Feb-
18M
ar-1
8
Apr-1
8M
ay-1
8
Jun-
18
Month
50
60
70
80
90
100
Flee
t Ava
ilabi
lity
(%)
0
10
20
30
40
50
60
Num
ber o
f Day
s U
nava
ilabl
e
• The blue line tracks the average monthly availability for the CNG fleet• The stacked bars provide the number of unavailable days each month separated by four categories

NREL | 23
Overall Fleet Availability: Full Data PeriodBEB 35FC Fleet
87.4%
6.9%2.6%
1.4%1.1%
CNG Fleet
96.7%
1.1%1.2%
13%13%13%13%13%13%13%13%
Bus
Available
General
MaintenancePM
Electric
DriveESS
Charging
IssuesTrans. Engine
BEB 40FC Fleet
82.0%
15.3%
1.4%
Date Range: Apr 2014 - Jun 2018
Days Planned: 13,115
Date Range: Jan 2017 - Jun 2018
Days Planned: 635
Date Range: Oct 2014 - Jun 2018
Days Planned: 6,301
Data labels omitted for pie slices representing < 1.0%

NREL | 24
Overall Fleet Availability: Jan–Jun 2018BEB 35FC Fleet
74.2%
13.1%
3.6%3.1%
1.3%4.4%
CNG Fleet
96.3%
1.0%1.7%
13%13%13%13%13%13%13%13%
Bus
Available
General
MaintenancePM
Electric
DriveESS
Charging
IssuesTrans. Engine
BEB 40FC Fleet
83.5%
10.3%2.7%3.6%
Date Range: Jan 2018 - Jun 2018
Days Planned: 1,334
Date Range: Jan 2018 - Jun 2018
Days Planned: 224
Date Range: Jan 2018 - Jun 2018
Days Planned: 892
Data labels omitted for pie slices representing < 1.0%

NREL | 25
Fuel Economy AnalysisProterra records and stores data—including total electrical energy used (kWh), number of charges, and miles driven—on each of the buses. These data were provided to NREL for calculating efficiency of the buses in kWh per mile. Foothill Transit’s CNG buses are typically fueled once each day. Foothill Transit provided individual fueling records for the CNG buses. CNG is typically tracked in units of gasoline gallon equivalent (gge).
To compare the BEBs to the baseline buses, NREL converted the electrical energy from kWh to diesel gallon equivalent (dge) and converted the CNG fuel energy from gge to dge using the following conversion factors.
Energy content of fuel• Electricity: 3,414 Btu/kWh• CNG: 112,114 Btu/gge (LHV)• Diesel: 128,488 Btu/dge (LHV)
Conversion factors • Electrical energy to dge: 37.64 kWh/dge • CNG fuel energy to dge: 1.15 gge/dge
Btu: British thermal units; LHV: lower heating value

NREL | 26
Fuel Economy by Bus: Jan–Jun 2018
Bus ID Miles CNG (gge) mi/gge
Diesel gallon equiv.
Fuel economy (mpdge)
2200 26,305 7,026.3 3.74 6,288.6 4.182201 24,996 6,772.4 3.69 6,061.3 4.122202 24,762 6,034.1 4.10 5,400.5 4.592203 25,508 6,527.8 3.91 5,842.3 4.372204 24,884 6,640.0 3.75 5,942.8 4.192205 27,034 6,949.0 3.89 6,219.3 4.352206 22,097 6,127.6 3.61 5,484.2 4.032207 23,852 6,073.1 3.93 5,435.5 4.39
CNG Total 199,438 52,150.3 3.82 46,674.5 4.27
Bus ID Miles Energya
(kWh) kWh/miDiesel gallon equiv.
Fuel economy (mpdge)
2004 11,756 25,409.7 2.16 675.1 17.412005 6,643 14,162.4 2.13 376.3 17.652006 9,980 21,181.5 2.12 562.7 17.742007 8,720 17,748.3 2.04 471.5 18.492008 12,097 26,791.3 2.21 711.8 16.992009 4,071 8,117.9 1.99 215.7 18.882010 3,858 8,114.8 2.10 215.6 17.892011 3,758 7,216.0 1.92 191.7 19.602012 12,324 25,060.1 2.03 665.8 18.512013 3,199 6,471.4 2.02 171.9 18.602014 7,756 16,716.9 2.16 444.1 17.462015 2,791 6,271.5 2.25 166.6 16.75
BEB 35FC Total 86,952 183,261.7 2.11 4,868.8 17.86
2016 5,702 11,842.3 2.08 314.6 18.122017 5,058 11,161.0 2.21 296.5 17.06
BEB 40FC Total 10,760 23,003.3 2.14 611.1 17.61
• The BEB fuel economy is 4 times higher than that of the CNG buses, as operated on current routes.
• Previous testing showed the CNG buses had a fuel economy around 2.1 mpdge on Line 291, which is 8 times lower than that of the BEBs.
a Total energy consumed by the bus, does not include losses during charging

NREL | 27
Fleet Average Monthly Fuel EconomyAp
r-14
May
-14
Jun-
14Ju
l-14
Aug-
14
Sep-
14O
ct-1
4
Nov
-14
Dec
-14
Jan-
15
Feb-
15M
ar-1
5
Apr-1
5M
ay-1
5
Jun-
15Ju
l-15
Aug-
15
Sep-
15O
ct-1
5
Nov
-15
Dec
-15
Jan-
16
Feb-
16M
ar-1
6
Apr-1
6M
ay-1
6
Jun-
16Ju
l-16
Aug-
16
Sep-
16O
ct-1
6
Nov
-16
Dec
-16
Jan-
17
Feb-
17M
ar-1
7
Apr-1
7M
ay-1
7
Jun-
17Ju
l-17
Aug-
17
Sep-
17O
ct-1
7
Nov
-17
Dec
-17
Jan-
18
Feb-
18M
ar-1
8
Apr-1
8M
ay-1
8
Jun-
18
Aver
age
Month
0
5
10
15
20
25
Fuel
Eco
nom
y (m
pdge
)
0
20
40
60
80
100
Aver
age
Hig
h Te
mpe
ratu
re (
° F)
17.017.1
4.4
Overall 2018Bus kWh/mi, mpgge mpdge kWh/mi, mpgge mpdge
BEB 35FC 2.21 17.05 2.11 17.86BEB 40FC 2.20 17.11 2.14 17.61CNG 3.86 4.23 3.82 4.27

NREL | 28
TOU-GS-1-A TOU-EV-4Ap
r-14
May
-14
Jun-
14
Jul-1
4
Aug-
14
Sep-
14
Oct
-14
Nov
-14
Dec
-14
Jan-
15
Feb-
15M
ar-1
5
Apr-1
5
May
-15
Jun-
15
Jul-1
5
Aug-
15
Sep-
15
Oct
-15
Nov
-15
Dec
-15
Jan-
16
Feb-
16
Mar
-16
Apr-1
6
May
-16
Jun-
16
Jul-1
6
Aug-
16
Sep-
16
Oct
-16
Nov
-16
Dec
-16
Jan-
17
Feb-
17M
ar-1
7
Apr-1
7
May
-17
Jun-
17
Jul-1
7
Aug-
17
Sep-
17
Oct
-17
Nov
-17
Dec
-17
Jan-
18
Feb-
18M
ar-1
8
Apr-1
8
May
-18
Jun-
18
Month
$0.00
$0.05
$0.10
$0.15
$0.20
$0.25
$0.30
Elec
trici
ty C
ost p
er k
Wh
($/k
Wh)
On-Peak 1 Mid-Peak 1 Off-Peak 1 Demand 2 Taxes, Fees & Credits 3
1. On-Peak, Mid-Peak, and Off-Peak charge categories include respective costs for delivery and generation
2. Rate structure changed from TOU-GS-1-A to TOU-EV-4 February 2016, introducing demand charges
3. 'Taxes, Fees & Credits' category includes all remaining utility bill items (positive & negative charges)
Monthly Electric Utility Costs
• Data are based on utility billing periods, not calendar months• Seasonal rates apply: average summer rate (Jun–Sep): $0.21/kWh; average winter rate (Oct–May): $0.16/kWh• Average rate under TOU-GS-1-A rate structure: $0.17/kWh; average rate under TOU-EV-4 rate structure: $0.18/kWh• Average rate for 2018: $0.18/kWh

NREL | 29
Monthly Average Fuel Price
Apr-1
4
May
-14
Jun-
14
Jul-1
4
Aug-
14
Sep-
14
Oct
-14
Nov
-14
Dec
-14
Jan-
15
Feb-
15
Mar
-15
Apr-1
5
May
-15
Jun-
15
Jul-1
5
Aug-
15
Sep-
15
Oct
-15
Nov
-15
Dec
-15
Jan-
16
Feb-
16
Mar
-16
Apr-1
6
May
-16
Jun-
16
Jul-1
6
Aug-
16
Sep-
16
Oct
-16
Nov
-16
Dec
-16
Jan-
17
Feb-
17
Mar
-17
Apr-1
7
May
-17
Jun-
17
Jul-1
7
Aug-
17
Sep-
17
Oct
-17
Nov
-17
Dec
-17
Jan-
18
Feb-
18
Mar
-18
Apr-1
8
May
-18
Jun-
18
Month
$0.00
$1.00
$2.00
$3.00
$4.00
$5.00
$6.00
$7.00
$8.00
$9.00
$10.00
Aver
age
Fuel
Pric
e ($
/dge
)
0
10
20
30
40
50
60
70
80
90
100
Aver
age
Hig
h Te
mpe
ratu
re (
° F)
• Electricity prices vary seasonally; CNG prices are consistent throughout the year• CNG cost includes price of fuel, transmission, and operations and maintenance cost for station• On average, electricity cost is more than six times the cost of CNG

NREL | 30
Fuel Cost Per Mile
Average Service Speed
(mph)
Fuel Economy(mpdge)
Overall $/mi
2018 $/mi
BEB 35FC 10.6 17.05 0.44 0.41BEB 40FC 10.6 17.11 0.44 0.41CNG 17.6 4.23 0.22 0.20CNG on Line 291 10.6 2.09 0.51 0.51
The operating duty cycle of a bus has a significant effect on fuel economy and therefore cost. Earlier in the evaluation, NREL collected drive cycle data on a selection of CNG buses that were operated on a variety of Foothill Transit routes including Line 291. On Line 291, the average fuel economy for the CNG buses was 2.09 mpdge.
During 2018, Foothill Transit paid an average of $0.90/gge for CNG. The average cost of electricity during 2018 was $0.18/kWh. The table provides the cost per mile for the BEBs and CNG buses as used by the fleet and estimates the cost per mile of the CNG buses if they were only operated on Line 291. The lower fuel economy would increase the CNG fuel cost to an average of $0.51/mi, which is slightly higher than that of the BEBs.

NREL | 31
Roadcall AnalysisA roadcall or revenue vehicle system failure is defined as a failure of an in-service bus that causes the bus to be replaced on route or causes a significant delay in schedule. If the problem with the bus can be repaired during a layover and the schedule is kept, this is not considered a roadcall. The analysis described here includes only roadcalls that were caused by “chargeable” failures. Chargeable roadcalls include systems that can physically disable the bus from operating on route, such as interlocks (doors, air system), engine, or things that are deemed to be safety issues if operation of the bus continues. They do not include roadcalls for things such as problems with radios, fareboxes, or destination signs.
The transit industry measures reliability as mean distance between failures, also documented as miles between roadcalls (MBRC). NREL tracks MBRC by total bus roadcalls, propulsion-related roadcalls, and ESS-related roadcalls (for electric buses). Total bus roadcalls include all chargeable roadcalls. Propulsion-related roadcalls is a subset of total roadcalls and includes all roadcalls due to propulsion-related systems including the battery system (or engine for a conventional bus), electric drive, fuel, exhaust, air intake, cooling, non-lighting electrical, and transmission systems. The ESS-related roadcalls, a subset of the propulsion-related roadcalls, and MBRC are included for the BEBs.

NREL | 32
Cumulative MBRC
• The upper chart shows cumulative MBRC for all chargeable roadcalls• The lower chart shows MBRC for propulsion-related roadcalls• The ESS-related MBRC for the BEB 35FC fleet is 219,535• No ESS-related roadcalls have been recorded for the BEB 40FC fleet
0
10,000
20,000
30,000
40,000
50,000
60,000
4,000
5,6536,059
31,172BEB 35FC
BEB 40FC
CNG
Ultimate Target
Total Bus MBRCO
ct-1
4N
ov-1
4D
ec-1
4Ja
n-15
Feb-
15M
ar-1
5Ap
r-15
May
-15
Jun-
15Ju
l-15
Aug-
15Se
p-15
Oct
-15
Nov
-15
Dec
-15
Jan-
16Fe
b-16
Mar
-16
Apr-1
6M
ay-1
6Ju
n-16
Jul-1
6Au
g-16
Sep-
16O
ct-1
6N
ov-1
6D
ec-1
6Ja
n-17
Feb-
17M
ar-1
7Ap
r-17
May
-17
Jun-
17Ju
l-17
Aug-
17Se
p-17
Oct
-17
Nov
-17
Dec
-17
Jan-
18Fe
b-18
Mar
-18
Apr-1
8M
ay-1
8Ju
n-18
Month
0
20,000
40,000
60,000
80,000
100,000
120,000
14,47518,178
54,300BEB 35FC
BEB 40FC
CNG
Propulsion MBRC
Mile
s Be
twee
n R
oadc
all (
MBR
C)

NREL | 33
Maintenance AnalysisNREL collects all work orders for the evaluation buses to calculate a maintenance cost per mile. Costs for accident-related repair, which are extremely variable from bus to bus, were eliminated from the analysis. Warranty costs are not included in the cost-per-mile calculations because those costs are covered in the capital cost of the buses. For consistency, NREL uses a constant $50 per hour labor rate. This does not reflect an average rate for Foothill Transit. Cost per mile is calculated as follows:
Cost per mile = [(labor hours * 50) + parts cost)] / mileage
NREL calculates total cost per mile, scheduled maintenance cost per mile, and unscheduled maintenance cost per mile. NREL also categorizes maintenance cost by system to provide insight into what systems have the most costs for each technology. The work orders are coded using vehicle maintenance reporting standards (VMRS) developed by the American Trucking Association to aid the industry in tracking equipment and maintenance using a common standard.
The propulsion system costs are of particular interest. Propulsion-related vehicle systems include the exhaust, fuel, engine, battery modules, electric propulsion, air intake, cooling, non-lighting electrical, and transmission systems. These systems have been separated to highlight maintenance costs most directly affected by the advanced propulsion system changes for the buses.

NREL | 34
Maintenance Analysis Results: Jan–Jun 2018
Bus ID Mileage Parts ($) Labor Hours
Total Cost
($/mi)
Scheduled Cost
($/mi)
Unscheduled Cost
($/mi)2200 30,190 $2,054.98 63.9 $0.17 $0.09 $0.092201 29,565 $2,735.64 75.0 $0.22 $0.10 $0.122202 27,063 $3,158.48 77.8 $0.26 $0.11 $0.162203 30,127 $2,597.30 78.8 $0.22 $0.09 $0.122204 29,038 $5,121.51 90.5 $0.33 $0.08 $0.252205 31,336 $2,505.18 64.0 $0.18 $0.07 $0.122206 29,210 $2,596.06 79.5 $0.22 $0.08 $0.152207 28,668 $5,249.22 102.4 $0.36 $0.10 $0.27CNG Fleet 235,197 $26,018.37 631.9 $0.24 $0.09 $0.16
Bus ID Mileage Parts ($) Labor Hours
Total Cost
($/mi)
Scheduled Cost
($/mi)
Unscheduled Cost
($/mi)2004 13,735 $7,873.93 68.5 $0.82 $0.08 $0.742005 14,550 $1,309.42 49.1 $0.26 $0.08 $0.182006 15,505 $1,731.20 96.3 $0.42 $0.08 $0.342007 14,904 $2,321.59 84.1 $0.44 $0.07 $0.362008 13,163 $19,789.76 96.5 $1.87 $0.07 $1.802009 12,913 $2,278.16 61.4 $0.41 $0.10 $0.322010 5,739 $1,372.09 93.8 $1.06 $0.18 $0.882011 12,024 $7,557.65 67.5 $0.91 $0.07 $0.842012 14,268 $3,382.74 84.4 $0.53 $0.07 $0.462013 4,979 $3,657.77 80.2 $1.54 $0.14 $1.402014 16,666 $2,830.62 78.4 $0.41 $0.08 $0.332015 5,670 $1,744.50 80.8 $1.02 $0.11 $0.91
BEB 35FC Fleet 144,116 $55,849.43 940.8 $0.71 $0.09 $0.63
2016 12,833 $483.42 60.3 $0.27 $0.10 $0.172017 12,292 $696.29 63.0 $0.31 $0.08 $0.24
BEB 40FC Fleet 25,125 $1,179.71 123.3 $0.29 $0.09 $0.20
Reasons for cost increase over previous report (BEB 35FC: $0.41/mi, BEB 40FC: $0.32/mi):• Issues with the low-voltage batteries• Issues with the bus air compressor • Replacement of one DC-DC converter• Maintenance being transferred from OEM to
contractor, which results in more labor hours• Warranty ended for some systems
OEM: original equipment manufacturer

NREL | 35
Monthly Scheduled and Unscheduled Maintenance Cost: BEB 35FC
• The warranty period has ended and transit staff are handling most of the maintenance work• Issues with the low-voltage batteries continue to result in increasing costs

NREL | 36
Monthly Scheduled and Unscheduled Maintenance Cost: BEB 40FC
• Issues with the low-voltage batteries resulted in costs that were higher than expected• Because the fleet consists of only two buses, the cost per mile is more sensitive to cost increases

NREL | 37
Monthly Scheduled and Unscheduled Maintenance Cost: CNG
• Higher scheduled costs during July 2015 and April 2016 are caused by multiple buses reaching the mileage target for a major preventive maintenance (PM)

NREL | 38
System
BEB 35FC BEB 40FC CNG
Cost per Mile ($)
Percent of Total
(%)
Cost per Mile ($)
Percent of Total
(%)
Cost per Mile ($)
Percent of Total
(%)Cab, body, and accessories 0.109 15 0.062 21 0.038 16Propulsion-related 0.299 42 0.057 19 0.084 34PMI 0.085 12 0.090 31 0.067 27Brakes 0.002 0 0.000 0 0.020 8Frame, steering, and suspension 0.022 3 0.000 0 0.011 5HVAC 0.010 1 0.010 3 0.012 5Lighting 0.013 2 0.006 2 0.004 2Axles, wheels, and drive shaft 0.000 0 0.000 0 0.001 0Air, general 0.156 22 0.042 15 0.001 0Tires 0.018 3 0.026 9 0.006 3Towing charges 0.000 0 0.000 0 0.000 0Total 0.71 100 0.29 100 0.24 100Total w/o low-voltage battery costs 0.61 0.24 –
Maintenance Cost per Mile by System: Jan–Jun 2018
• Propulsion-related repairs for the BEBs: low-voltage batteries, battery equalizer, cooling system, DC-DC converter
• Overall cost per mile without low-voltage battery costs for the BEB 35FC buses was 2.9 times higher than the CNG bus cost; cost for the BEB 40FC buses was the same as the CNG bus cost
Color coding:Highest cost
Second highest cost
Third highest cost

NREL | 39
Maintenance Cost by System: BEB 35FC Fleet
• Costs for the BEB 35FC fleet continue to increase since the warranty ended and transit staff are learning to repair all systems
• The primary driver for the higher propulsion-related cost was issues with the low-voltage batteries
Apr-1
4M
ay-1
4Ju
n-14
Jul-1
4Au
g-14
Sep-
14O
ct-1
4N
ov-1
4D
ec-1
4Ja
n-15
Feb-
15M
ar-1
5Ap
r-15
May
-15
Jun-
15Ju
l-15
Aug-
15Se
p-15
Oct
-15
Nov
-15
Dec
-15
Jan-
16Fe
b-16
Mar
-16
Apr-1
6M
ay-1
6Ju
n-16
Jul-1
6Au
g-16
Sep-
16O
ct-1
6N
ov-1
6D
ec-1
6Ja
n-17
Feb-
17M
ar-1
7Ap
r-17
May
-17
Jun-
17Ju
l-17
Aug-
17Se
p-17
Oct
-17
Nov
-17
Dec
-17
Jan-
18Fe
b-18
Mar
-18
Apr-1
8M
ay-1
8Ju
n-18
Month
$0.00
$0.15
$0.30
$0.45
$0.60
$0.75
$0.90
$1.05
$1.20
$1.35
$1.50
Mai
nten
ance
Cos
t per
Mile
($/m
i)
Towing charges
Tires
General air system repairs
Axles, wheels, and drive shaft
Lighting
HVAC
Frame, steering, and suspension
Brakes
PMI
Propulsion-related
Cab, body, and accessories
BEB 35FC Fleet - VMRS Categories

NREL | 40
Maintenance Cost by System: BEB 40FC Fleet
• The high propulsion cost during August 2017 was primarily due to the low-voltage battery issue, including four battery changeouts for one bus
• Because the fleet consists of only two buses, the cost per mile is more sensitive to cost increases
Apr-1
4M
ay-1
4Ju
n-14
Jul-1
4Au
g-14
Sep-
14O
ct-1
4N
ov-1
4D
ec-1
4Ja
n-15
Feb-
15M
ar-1
5Ap
r-15
May
-15
Jun-
15Ju
l-15
Aug-
15Se
p-15
Oct
-15
Nov
-15
Dec
-15
Jan-
16Fe
b-16
Mar
-16
Apr-1
6M
ay-1
6Ju
n-16
Jul-1
6Au
g-16
Sep-
16O
ct-1
6N
ov-1
6D
ec-1
6Ja
n-17
Feb-
17M
ar-1
7Ap
r-17
May
-17
Jun-
17Ju
l-17
Aug-
17Se
p-17
Oct
-17
Nov
-17
Dec
-17
Jan-
18Fe
b-18
Mar
-18
Apr-1
8M
ay-1
8Ju
n-18
Month
$0.00
$0.15
$0.30
$0.45
$0.60
$0.75
$0.90
$1.05
$1.20
$1.35
$1.50
Mai
nten
ance
Cos
t per
Mile
($/m
i)
Towing charges
Tires
General air system repairs
Axles, wheels, and drive shaft
Lighting
HVAC
Frame, steering, and suspension
Brakes
PMI
Propulsion-related
Cab, body, and accessories
BEB 40FC Fleet - VMRS Categories

NREL | 41
Maintenance Cost by System: CNG Fleet
• CNG bus maintenance cost shows an increase over time as the buses age and pass the warranty period• During the high-cost months, multiple buses reached the mileage for a major PM
Apr-1
4M
ay-1
4Ju
n-14
Jul-1
4Au
g-14
Sep-
14O
ct-1
4N
ov-1
4D
ec-1
4Ja
n-15
Feb-
15M
ar-1
5Ap
r-15
May
-15
Jun-
15Ju
l-15
Aug-
15Se
p-15
Oct
-15
Nov
-15
Dec
-15
Jan-
16Fe
b-16
Mar
-16
Apr-1
6M
ay-1
6Ju
n-16
Jul-1
6Au
g-16
Sep-
16O
ct-1
6N
ov-1
6D
ec-1
6Ja
n-17
Feb-
17M
ar-1
7Ap
r-17
May
-17
Jun-
17Ju
l-17
Aug-
17Se
p-17
Oct
-17
Nov
-17
Dec
-17
Jan-
18Fe
b-18
Mar
-18
Apr-1
8M
ay-1
8Ju
n-18
Month
$0.00
$0.15
$0.30
$0.45
$0.60
$0.75
$0.90
$1.05
$1.20
$1.35
$1.50
Mai
nten
ance
Cos
t per
Mile
($/m
i)
Towing charges
Tires
General air system repairs
Axles, wheels, and drive shaft
Lighting
HVAC
Frame, steering, and suspension
Brakes
PMI
Propulsion-related
Cab, body, and accessories
CNG Fleet - VMRS Categories

NREL | 42
Propulsion-Related Maintenance Costs by Subsystem: Jan–Jun 2018
Maintenance System BEB 35FC BEB 40FC CNGMileage 144,116 25,125 235,197
Total Propulsion-Related Systems(Roll-Up of All Systems)
Parts cost ($) 26,875.43 836.71 12,530.16Labor hours 326.4 11.8 146.5Total cost ($) 43,192.93 1,424.21 19,855.16Total cost ($) per mileWithout battery changeouts
0.3000.200
0.0570.000
0.084
Exhaust System Repairs
Parts cost ($) 0.00 0.00 0.00Labor hours 0.0 0.0 1.0Total cost ($) 0.00 0.00 50.00Total cost ($) per mile 0.000 0.000 0.000
Fuel System Repairs
Parts cost ($) 0.00 0.00 395.32Labor hours 3.0 0.0 0.3Total cost ($) 150.00 0.00 407.82Total cost ($) per mile 0.001 0.000 0.002
Powerplant System Repairs (Energy Storage System for BEBs)
Parts cost ($) 0.00 0.00 3,567.51Labor hours 6.5 0.0 53.8Total cost ($) 325.00 0.00 6,255.01Total cost ($) per mile 0.002 0.000 0.027
Electric Propulsion System Repairs
Parts cost ($) 12,966.00 0.00 0.00Labor hours 70.3 0.0 0.0Total cost ($) 16,478.50 0.00 0.00Total cost ($) per mile 0.114 0.000 0.000

NREL | 43
Propulsion-Related Maintenance Costs by Subsystem: Jan–Jun 2018
Maintenance System BEB 35FC BEB 40FC CNG
Non-Lighting Electrical System Repairs (General Electrical, Charging, Cranking, Ignition)
Parts cost ($) 12,881.87 836.71 5,016.52Labor hours 165.6 11.8 36.8Total cost ($) 21,161.87 1,424.21 6,854.02Total cost ($) per mile 0.147 0.057 0.029
Air Intake System Repairs
Parts cost ($) 15.27 0.00 1,545.47Labor hours 0.0 0.0 0.0Total cost ($) 15.27 0.00 1,545.47Total cost ($) per mile 0.000 0.000 0.007
Cooling System Repairs
Parts cost ($) 302.29 0.00 1,343.44Labor hours 16.0 0.0 39.3Total cost ($) 1,102.29 0.00 3,305.94Total cost ($) per mile 0.008 0.000 0.014
Transmission System Repairs
Parts cost ($) 710.00 0.00 661.90Labor hours 65.0 0.0 15.5Total cost ($) 3,960.00 0.00 1,436.90Total cost ($) per mile 0.027 0.000 0.006
Hydraulic System Repairs
Parts cost ($) 0.00 0.00 0.00Labor hours 0.0 0.0 0.0Total cost ($) 0.00 0.00 0.00Total cost ($) per mile 0.000 0.000 0.000

NREL | 44
Maintenance Challenges
Foothill Transit continues to have issues with the low-voltage batteries. Despite the maintenance contractor switching to a better performing battery, the batteries are still failing prematurely. One issue is that the accessories (farebox, cameras) continually draw power from these batteries. In some cases, the operators are not turning off the master switch, which allows the accessories to continue to draw power. Because this issue is not related to the BEB system, NREL has provided the costs with and without the low-voltage battery replacement costs.
The agency also experienced several failed air compressors. This component is part of the general bus system. This could be due to incomplete preventive maintenance, which can result in failure.
NREL | 45
Contacts
NRELLeslie EudyPhone: 303-275-4412Email: [email protected]
Foothill Transit Roland CorderoPhone: 626-931-7246Email: [email protected]
California Air Resources BoardYachun ChowPhone: 919-322-7450Email: [email protected]
ProterraMike FinnernPhone: 864-214-0393Email: [email protected]

NREL | 46
Acronyms and Abbreviations
BEB battery electric busBtu British thermal unitCNG compressed natural gasdge diesel gallon equivalentESS energy storage systemFC fast chargeft feetgge gasoline gallon equivalentGVWR gross vehicle weight ratinghp horsepowerHVAC heating, ventilation, and air
conditioningin. incheskW kilowatts
kWh kilowatt hourslb poundsLHV lower heating valueMBRC miles between roadcallsmi milesmpdge miles per diesel gallon equivalentmpgge miles per gasoline gallon equivalentmph miles per hourNREL National Renewable Energy
LaboratoryPM preventive maintenancePMI preventive maintenance inspectionPTC Pomona Transit Center

NREL | 47
Acknowledgments
Produced under direction of the California Air Resources Board by the National Renewable Energy Laboratory (NREL) under Work for Others Agreement number FIA-17-1847.

Appendix:Fleet Summary Statistics

NREL | 49
Fleet Summary StatisticsBEB 35FC All Data
BEB 35FC Data Period
BEB 40FC All Data
BEB 40FC Data Period
CNG All Data
CNG Data Period
Number of vehicles 12 12 2 2 8 8Period used for fuel and oil analysis 4/14–6/18 1/16–6/18 1/17–6/18 1/16–6/18 10/14–6/18 1/16–6/18Total number of months in period 51 6 18 6 45 6Fuel and oil analysis base fleet mileage 1,260,044 86,952 40,624 10,760 1,536,521 199,438Period used for maintenance analysis 1/15–6/18 1/18–6/18 1/17–6/18 1/18–6/18 10/14–6/18 1/18–6/18Total number of months in period 42 6 18 6 45 6Maintenance analysis base fleet mileage 1,120,629 144,116 72,712 25,125 1,705,076 235,197Availability 87 74 82 83 97 96Fleet fuel/energy usage in BEB kWh/CNG gge 2,738,775.6 183,261.7 89,209.6 23,003.3 397,647.3 52,150.3Roadcalls 233 30 12 5 54 6Total MBRC 5,653 4,804 6,059 5,025 31,575 39,200Propulsion roadcalls 91 20 4 2 31 5Propulsion MBRC 14,475 7,206 18,178 12,563 55,002 47,039Fleet kWh/mile (BEB) or miles/gge (CNG) 2.21 2.11 2.20 2.14 3.86 3.82Representative fleet MPG (energy equiv) 17.05 17.86 17.11 17.61 4.23 4.27Energy cost per kWh/ CNG cost per gge 0.18 0.18 0.19 0.18 0.95 0.90Fuel cost per mile 0.44 0.41 0.44 0.41 0.22 0.20Total scheduled repair cost per mile 0.08 0.09 0.08 0.09 0.12 0.09Total unscheduled repair cost per mile 0.24 0.63 0.23 0.20 0.11 0.16Total maintenance cost per mile 0.32 0.71 0.31 0.29 0.23 0.24Total operating cost per mile 0.76 1.13 0.76 0.71 0.45 0.44

NREL | 50
Maintenance Cost SummaryMaintenance Cost Summary
Propulsion System Maintenance Cost SummaryBEB 35FC All Data
BEB 35FC Data Period
BEB 40FC All Data
BEB 40FC Data Period
CNG All Data
CNG Data Period
Total Engine/Fuel-Related Systems (ATA VMRS 27, 30, 31, 32, 33, 41, 42, 43, 44, 45, 46, 65)Parts cost 57,551.84 26,875.43 5,018.52 836.71 99,986.36 30,261.89Labor hours 662.69 326.35 36.19 11.75 685.12 227.27Average labor cost 33,134.50 16,317.50 1,809.50 587.50 34,256.00 11,363.50Total cost (for system) 90,686.34 43,192.93 6,828.02 1,424.21 134,242.36 41,625.39Total cost (for system) per bus 7,557.20 3,599.41 3,414.01 712.11 16,780.30 5,203.17Total cost (for system) per mile
without low-voltage battery cost0.0810.041
0.3000.201
0.0940.016
0.0570.000 0.079 0.093
BEB 35FC All Data
BEB 35FC Data Period
BEB 40FC All Data
BEB 40FC Data Period
CNG All Data
CNG Data Period
Fleet mileage 1,120,629 144,116 72,712 25,125 1,705,076 235,197Total parts cost 158,878.74 55,849.43 7,870.76 1,179.71 195,033.16 26,018.37Total labor hours 3,934.4 940.8 296.1 123.3 3,861.8 631.8Average labor cost (@ $50.00 per hour) 196,721.00 47,037.50 14,803.50 6,162.50 193,087.50 31,590.00Total maintenance cost 355,599.74 102,886.93 22,674.26 7,342.21 388,120.66 57,608.37Total maintenance cost per bus 29,633.31 8,573.91 1,889.52 611.85 48,515.08 7,201.05Total maintenance cost per mile
without low-voltage battery cost0.320.28
0.710.61
0.310.23
0.290.24 0.23 0.24

NREL | 51
Maintenance Cost by Vehicle System BEB 35FC All Data
BEB 35FC Data Period
BEB 40FC All Data
BEB 40FC Data Period
CNG All Data
CNG Data Period
Exhaust System Repairs (ATA VMRS 43)Parts cost 0.00 0.00 0.00 0.00 2,450.67 2,293.47Labor hours 0.0 0.0 0.0 0.0 19.4 16.9Average labor cost 0.00 0.00 0.00 0.00 967.50 842.50Total cost (for system) 0.00 0.00 0.00 0.00 3,418.17 3,135.97Total cost (for system) per bus 0.00 0.00 0.00 0.00 427.27 392.00Total cost (for system) per mile 0.000 0.000 0.000 0.000 0.002 0.007Fuel System Repairs (ATA VMRS 44)Parts cost 0.00 0.00 0.00 0.00 2,312.29 1,364.40Labor hours 3.0 3.0 0.0 0.0 36.9 11.4Average labor cost 150.00 150.00 0.00 0.00 1,842.50 570.00Total cost (for system) 150.00 150.00 0.00 0.00 4,154.79 1,934.40Total cost (for system) per bus 12.50 12.50 0.00 0.00 519.35 241.80Total cost (for system) per mile 0.000 0.001 0.000 0.000 0.002 0.004Power Plant (Engine) Repairs (ATA VMRS 45)Parts cost 1,428.22 0.00 0.00 0.00 45,826.40 10,324.02Labor hours 30.9 6.5 0.0 0.0 162.6 19.6Average labor cost 1,542.50 325.00 0.00 0.00 8,131.50 979.00Total cost (for system) 2,970.72 325.00 0.00 0.00 53,957.90 11,303.02Total cost (for system) per bus 247.56 27.08 0.00 0.00 6,744.74 1,412.88Total cost (for system) per mile 0.003 0.002 0.000 0.000 0.032 0.025

NREL | 52
Maintenance Cost by Vehicle System BEB 35FC All Data
BEB 35FC Data Period
BEB 40FC All Data
BEB 40FC Data Period
CNG All Data
CNG Data Period
Electric Propulsion Repairs (ATA VMRS 46)Parts cost 15,277.45 12,966.00 0.00 0.00 0.00 0.00Labor hours 115.6 70.3 0.0 0.0 0.0 0.0Average labor cost 5,778.50 3,512.50 0.00 0.00 0.00 0.00Total cost (for system) 21,055.95 16,478.50 0.00 0.00 0.00 0.00Total cost (for system) per bus 1,754.66 1,373.21 0.00 0.00 0.00 0.00Total cost (for system) per mile 0.019 0.114 0.000 0.000 0.000 0.000Electrical System Repairs (ATA VMRS 30-Electrical General, 31-Charging, 32-Cranking, 33-Ignition)Parts cost 38,785.90 12,881.87 5,018.52 836.71 16,019.30 5,078.01Labor hours 375.4 165.6 35.2 11.8 225.6 109.2Average labor cost 18,771.00 8,280.00 1,759.50 587.50 11,278.50 5,461.00Total cost (for system) 57,556.90 21,161.87 6,778.02 1,424.21 27,297.80 10,539.01Total cost (for system) per bus 4,796.41 1,763.49 3,389.01 712.11 3,412.23 1,317.38Total cost (for system) per mile 0.051 0.147 0.093 0.057 0.016 0.023Air Intake System Repairs (ATA VMRS 41)Parts cost 15.27 15.27 0.00 0.00 17,845.35 4,242.09Labor hours 3.9 0.0 0.0 0.0 1.8 1.0Average labor cost 195.00 0.00 0.00 0.00 87.50 50.00Total cost (for system) 210.27 15.27 0.00 0.00 17,932.85 4,292.09Total cost (for system) per bus 17.52 1.27 0.00 0.00 2,241.61 536.51Total cost (for system) per mile 0.000 0.000 0.000 0.000 0.011 0.010
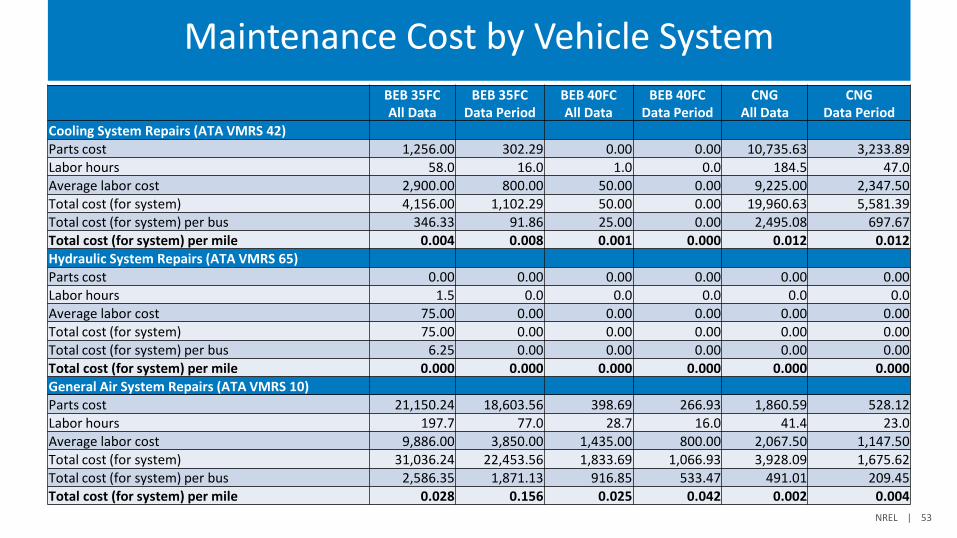
NREL | 53
Maintenance Cost by Vehicle System BEB 35FC All Data
BEB 35FC Data Period
BEB 40FC All Data
BEB 40FC Data Period
CNG All Data
CNG Data Period
Cooling System Repairs (ATA VMRS 42)Parts cost 1,256.00 302.29 0.00 0.00 10,735.63 3,233.89Labor hours 58.0 16.0 1.0 0.0 184.5 47.0Average labor cost 2,900.00 800.00 50.00 0.00 9,225.00 2,347.50Total cost (for system) 4,156.00 1,102.29 50.00 0.00 19,960.63 5,581.39Total cost (for system) per bus 346.33 91.86 25.00 0.00 2,495.08 697.67Total cost (for system) per mile 0.004 0.008 0.001 0.000 0.012 0.012Hydraulic System Repairs (ATA VMRS 65)Parts cost 0.00 0.00 0.00 0.00 0.00 0.00Labor hours 1.5 0.0 0.0 0.0 0.0 0.0Average labor cost 75.00 0.00 0.00 0.00 0.00 0.00Total cost (for system) 75.00 0.00 0.00 0.00 0.00 0.00Total cost (for system) per bus 6.25 0.00 0.00 0.00 0.00 0.00Total cost (for system) per mile 0.000 0.000 0.000 0.000 0.000 0.000General Air System Repairs (ATA VMRS 10)Parts cost 21,150.24 18,603.56 398.69 266.93 1,860.59 528.12Labor hours 197.7 77.0 28.7 16.0 41.4 23.0Average labor cost 9,886.00 3,850.00 1,435.00 800.00 2,067.50 1,147.50Total cost (for system) 31,036.24 22,453.56 1,833.69 1,066.93 3,928.09 1,675.62Total cost (for system) per bus 2,586.35 1,871.13 916.85 533.47 491.01 209.45Total cost (for system) per mile 0.028 0.156 0.025 0.042 0.002 0.004

NREL | 54
Maintenance Cost by Vehicle System BEB 35FC All Data
BEB 35FC Data Period
BEB 40FC All Data
BEB 40FC Data Period
CNG All Data
CNG Data Period
Brake System Repairs (ATA VMRS 13)Parts cost 1,528.23 0.00 0.00 0.00 9,555.68 4,135.78Labor hours 57.9 5.0 0.0 0.0 92.0 51.8Average labor cost 2,893.50 250.00 0.00 0.00 4,597.50 2,587.50Total cost (for system) 4,421.73 250.00 0.00 0.00 14,153.18 6,723.28Total cost (for system) per bus 368.48 20.83 0.00 0.00 1,769.15 840.41Total cost (for system) per mile 0.004 0.002 0.000 0.000 0.008 0.015Transmission Repairs (ATA VMRS 27)Parts cost 789.00 710.00 0.00 0.00 4,796.73 3,726.01Labor hours 74.5 65.0 0.0 0.0 54.5 22.3Average labor cost 3,722.50 3,250.00 0.00 0.00 2,723.50 1,113.50Total cost (for system) 4,511.50 3,960.00 0.00 0.00 7,520.23 4,839.51Total cost (for system) per bus 375.96 330.00 0.00 0.00 940.03 604.94Total cost (for system) per mile 0.004 0.027 0.000 0.000 0.004 0.011Inspections Only—No Parts Replacements (101)Parts cost 0.00 0.00 0.00 0.00 0.00 0.00Labor hours 1680.8 244.5 112.7 45.0 2019.6 584.1Average labor cost 84,040.00 12,222.50 5,636.00 2,250.00 100,979.00 29,204.00Total cost (for system) 84,040.00 12,222.50 5,636.00 2,250.00 100,979.00 29,204.00Total cost (for system) per bus 7,003.33 1,018.54 2,818.00 1,125.00 12,622.38 3,650.50Total cost (for system) per mile 0.075 0.085 0.078 0.090 0.059 0.065

NREL | 55
Maintenance Cost by Vehicle System BEB 35FC All Data
BEB 35FC Data Period
BEB 40FC All Data
BEB 40FC Data Period
CNG All Data
CNG Data Period
Cab, Body, and Accessories Systems Repairs (ATA VMRS 02-Cab and Sheet Metal, 50-Accessories, 71-Body)Parts cost 17,461.30 8,321.04 1,200.08 0.00 31,490.79 10,359.19Labor hours 874.8 147.9 88.8 31.0 703.9 220.9Average labor cost 43,741.00 7,392.50 4,441.50 1,550.00 35,194.50 11,047.00Total cost (for system) 61,202.30 15,713.54 5,641.58 1,550.00 66,685.29 21,406.19Total cost (for system) per bus 5,100.19 1,309.46 2,820.79 775.00 8,335.66 2,675.77Total cost (for system) per mile 0.055 0.109 0.078 0.062 0.039 0.048HVAC System Repairs (ATA VMRS 01)Parts cost 1,023.79 573.59 76.07 76.07 6,969.72 492.63Labor hours 43.6 16.0 3.5 3.5 64.3 7.1Average labor cost 2,177.50 800.00 175.00 175.00 3,212.50 355.00Total cost (for system) 3,201.29 1,373.59 251.07 251.07 10,182.22 847.63Total cost (for system) per bus 266.77 114.47 125.54 125.54 1,272.78 105.95Total cost (for system) per mile 0.003 0.010 0.003 0.010 0.006 0.002Lighting System Repairs (ATA VMRS 34)Parts cost 2,514.73 473.63 0.00 0.00 417.25 232.40Labor hours 116.3 27.7 4.0 3.0 29.5 13.5Average labor cost 5,812.50 1,385.00 200.00 150.00 1,472.50 675.00Total cost (for system) 8,327.23 1,858.63 200.00 150.00 1,889.75 907.40Total cost (for system) per bus 693.94 154.89 100.00 75.00 236.22 113.43Total cost (for system) per mile 0.007 0.013 0.003 0.006 0.001 0.002

NREL | 56
Maintenance Cost by Vehicle System BEB 35FC All Data
BEB 35FC Data Period
BEB 40FC All Data
BEB 40FC Data Period
CNG All Data
CNG Data Period
Frame, Steering, and Suspension Repairs (ATA VMRS 14-Frame, 15-Steering, 16-Suspension)Parts cost 1,554.68 1,002.18 0.00 0.00 7,286.47 5,000.13Labor hours 71.5 43.4 0.0 0.0 64.1 41.9Average labor cost 3,574.00 2,170.00 0.00 0.00 3,203.50 2,093.50Total cost (for system) 5,128.68 3,172.18 0.00 0.00 10,489.97 7,093.63Total cost (for system) per bus 427.39 264.35 0.00 0.00 1,311.25 886.70Total cost (for system) per mile 0.005 0.022 0.000 0.000 0.006 0.016Axle, Wheel, and Drive Shaft Repairs (ATA VMRS 11-Front Axle, 18-Wheels, 22-Rear Axle, 24-Drive Shaft)Parts cost 1,665.40 0.00 0.00 0.00 20,300.62 4,457.44Labor hours 7.0 0.0 0.0 0.0 12.0 2.0Average labor cost 350.00 0.00 0.00 0.00 600.00 100.00Total cost (for system) 2,015.40 0.00 0.00 0.00 20,900.62 4,557.44Total cost (for system) per bus 167.95 0.00 0.00 0.00 2,612.58 569.68Total cost (for system) per mile 0.002 0.000 0.000 0.000 0.012 0.010Tire Repairs (ATA VMRS 17)Parts cost 48,143.53 0.00 892.40 0.00 15,327.68 4,604.76Labor hours 222.2 53.0 22.1 13.0 149.1 64.2Average labor cost 11,112.00 2,650.00 1,106.50 650.00 7,454.50 3,209.50Total cost (for system) 59,255.53 2,650.00 1,998.90 650.00 22,782.18 7,814.26Total cost (for system) per bus 4,937.96 220.83 999.45 325.00 2,847.77 976.78Total cost (for system) per mile 0.053 0.018 0.027 0.026 0.013 0.017

NREL | 57
Maintenance Cost by Vehicle System
BEB 35FC All Data
BEB 35FC Data Period
BEB 40FC All Data
BEB 40FC Data Period
CNG All Data
CNG Data Period
Towing ChargesCharge 6,285.00 0.00 285.00 0.00 1,838.00 635.00Labor hours 0.00 0.00 0.00 0.00 1.0 0.0Average labor cost 0.00 0.00 0.00 0.00 50.00 0.00Total cost (for system) 6,285.00 0.00 285.00 0.00 1,888.00 635.00Total cost (for system) per bus 523.75 0.00 142.50 0.00 236.00 79.38Total cost (for system) per mile 0.006 0.000 0.004 0.000 0.001 0.001

NREL | 58
Fleet Summary Statistics: SI UnitsBEB 35FC All Data
BEB 35FC Data Period
BEB 40FC All Data
BEB 40FC Data Period
CNG All Data
CNG Data Period
Number of vehicles 12 12 2 2 8 8Period used for fuel and oil analysis 4/14–6/18 1/18–6/18 1/17–6/18 1/18–6/18 10/14–6/18 1/18–6/18Total number of months in period 51 6 18 6 45 6Fuel and oil analysis base fleet kilometers 1,996,407 139,932 65,376 17,316 2,472,723 320,956Period used for maintenance analysis 1/15–6/18 1/18–6/18 1/17–6/18 1/18–6/18 10/14–6/18 1/18–6/18Total number of months in period 42 6 18 6 45 6Maintenance analysis base fleet kilometers 1,571,503 231,926 117,015 40,434 2,743,979 378,503Average monthly kilometers per vehicle 3,581 3,221 3,584 3,369 7,622 7,885Availability 87 74 81 83 97 96Fleet fuel/energy usage in kWh (BEB)/gge (CNG) 2,738,775.6 183,261.7 89,209.6 23,003.3 1,505,258.9 197,410.4Roadcalls 233 30 12 5 54 6Total KBRC 9,091 7,731 9,751 8,087 50,814 63,084Propulsion roadcalls 91 20 4 2 31 5Propulsion KBRC 23,277 11,596 29,254 20,217 88,515 75,701Representative fleet kg/100km (energy equiv.) 13.77 13.15 13.70 13.34 54.48 55.05Energy cost per kWh/CNG cost per gge 0.18 0.18 0.19 0.18 0.25 0.24Fuel cost per kilometer 0.28 0.26 0.28 0.26 0.15 0.15Total scheduled repair cost per km 0.05 0.05 0.05 0.06 0.07 0.05Total unscheduled repair cost per km 0.15 0.39 0.15 0.13 0.07 0.10Total maintenance cost per km 0.20 0.44 0.19 0.18 0.14 0.15Total operating cost per km 0.47 0.70 0.47 0.44 0.29 0.30

NREL | 59
Maintenance Cost Summary: SI Units
BEB 35FC All Data
BEB 35FC Data Period
BEB 40FC All Data
BEB 40FC Data Period
CNG All Data
CNG Data Period
Fleet kilometers 1,803,429 231,926 117,015 40,434 2,743,979 378,503Total parts cost 158,878.74 55,849.43 7,870.76 1,179.71 195,033.16 26,018.37Total labor hours 3,934.4 940.8 296.1 123.3 3,861.8 631.8Average labor cost (@ $50.00 per hour) 196,721.00 47,037.50 14,803.50 6,162.50 193,087.50 31,590.00Total maintenance cost 355,599.74 102,886.93 22,674.26 7,342.21 388,120.66 57,608.37Total maintenance cost per bus 29,633.31 8,573.91 1,889.52 611.85 48,515.08 7,201.05Total maintenance cost per kmwithout low-voltage battery cost
0.200.17
0.440.38
0.190.15
0.180.15
0.14—
0.15—
Maintenance Cost Summary

www.nrel.gov
NREL/PR-5400-72207
This work was authored by the National Renewable Energy Laboratory, managed and operated by Alliance for Sustainable Energy, LLC, for the U.S. Department of Energy (DOE) under Contract No. DE-AC36-08GO28308. Funding provided by the California Air Resources Board. The views expressed in the article do not necessarily represent the views of the DOE or the U.S. Government. The U.S. Government retains and the publisher, by accepting the article for publication, acknowledges that the U.S. Government retains a nonexclusive, paid-up, irrevocable, worldwide license to publish or reproduce the published form of this work, or allow others to do so, for U.S. Government purposes.