Embed Size (px)
Citation preview

Footprint
Reducing Risks by Setting Measurable
TargetsDr. Mathis Wackernagel
www.FootprintNetwork.org

Metabolism like a cow
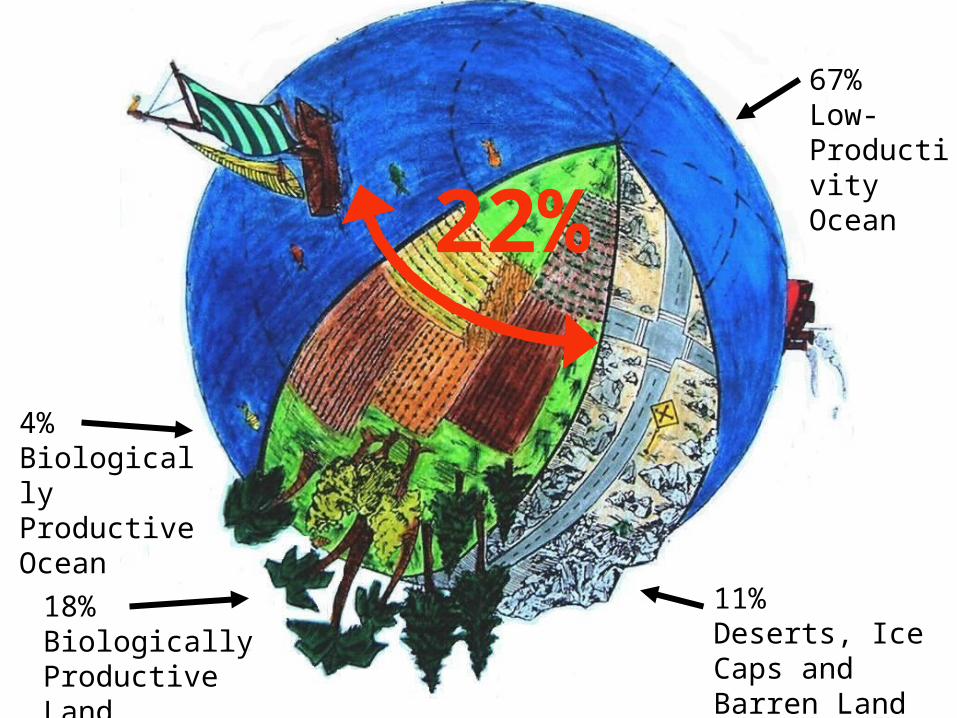
Bioproductive segments
18% Biologically Productive Land
11%Deserts, Ice Caps and Barren Land
67% Low-ProductivityOcean
4%BiologicallyProductive Ocean
Bioproductive Segments
22%
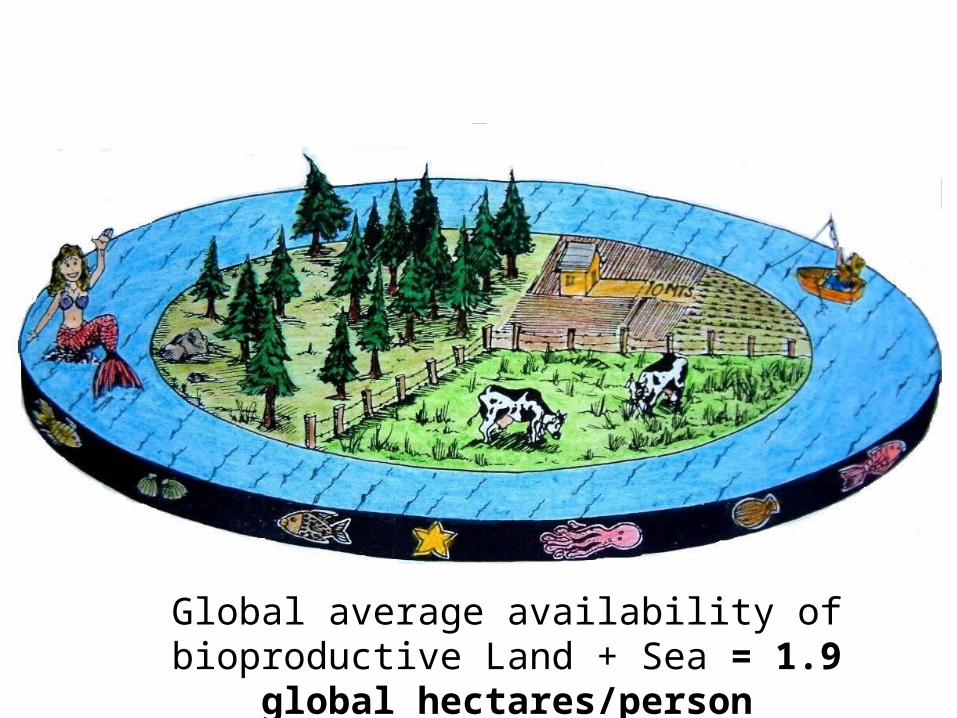
Personal planetoid
Global average availability of bioproductive Land + Sea = 1.9 global hectares/person

Footprint components
Fossil Fuel Built-up Waste Food Fibres absorption

Ecological Demand (Ecological Footprint) Ecological Supply (Biocapacity)
Footprint Areas for: Biocapacity Areas:
Growing Crops 0.53 Crop land 0.53
Grazing Animals 0.12 Grazing land 0.27
Settlements & infrastructure0.10 Built-up area 0.10
Producing timber & fuelwood0.33 Forest 0.86
Absorbing excess CO2 1.07
Harvesting Fish 0.14 Fishing Grounds 0.14
Total Global Demand2.29 Total Global Supply1.90
Global Footprint Accounts
(in global hectares/person, 1999 data)
Demand
Exceeds
Supply
By
20%
>
Global Footprint
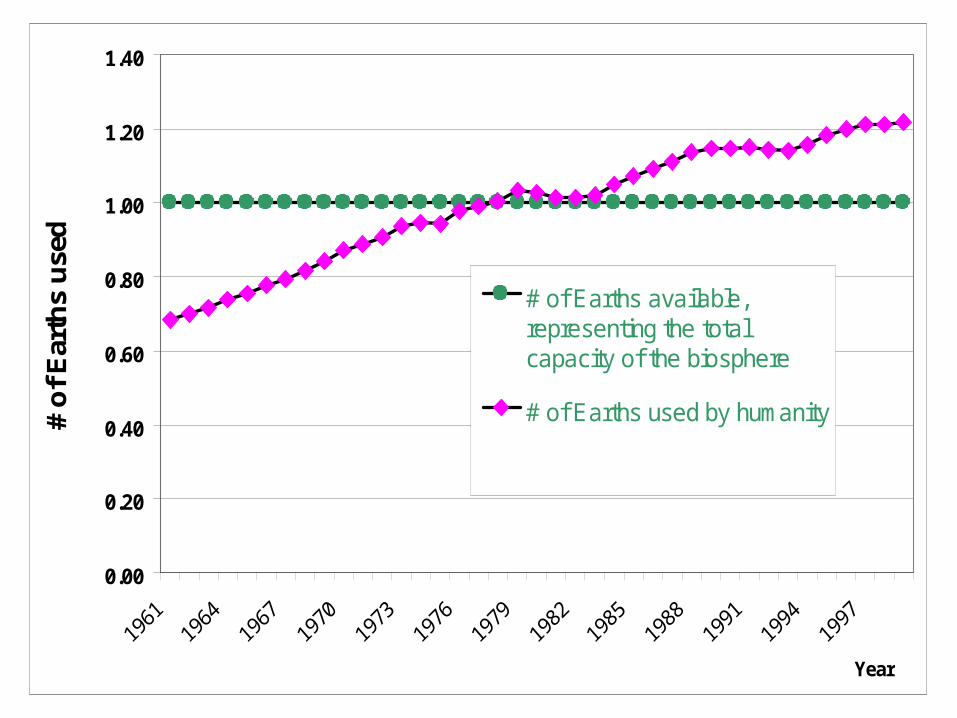
Footprint time series
Footprint time series
0.00
0.20
0.40
0.60
0.80
1.00
1.20
1.40
Year
# o
f E
arth
s u
sed
# of Earths available,representing the totalcapacity of the biosphere
# of Earths used by humanity
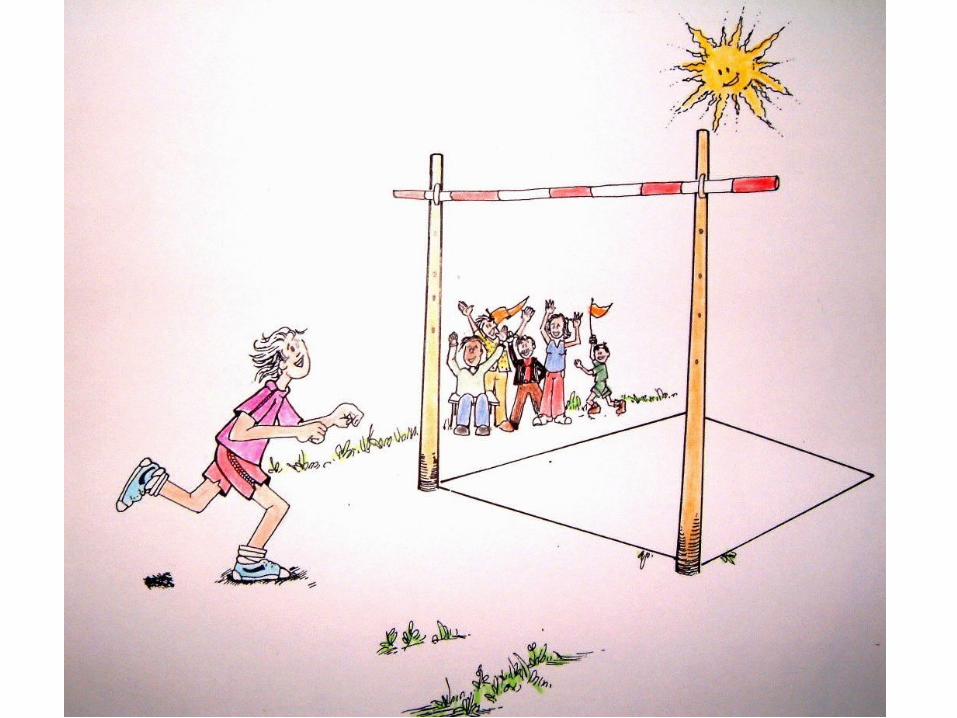
Target

Median Scenario (UN/IPCC/FAO)
0
1
2
1960 1980 2000 2020 2040 2060 2080 2100
nu
mb
er
of
pla
ne
ts
total EF
fossil EFcomponent
FAO/UNmedian EF forfuture

EF Used for Scenario Analysis
0
1
2
1960 1980 2000 2020 2040 2060 2080 2100
past Footprint
FAO/UN median EF for future
"E.O. Wilson" scenario
Mid century scenario
"Brundtland" scenario
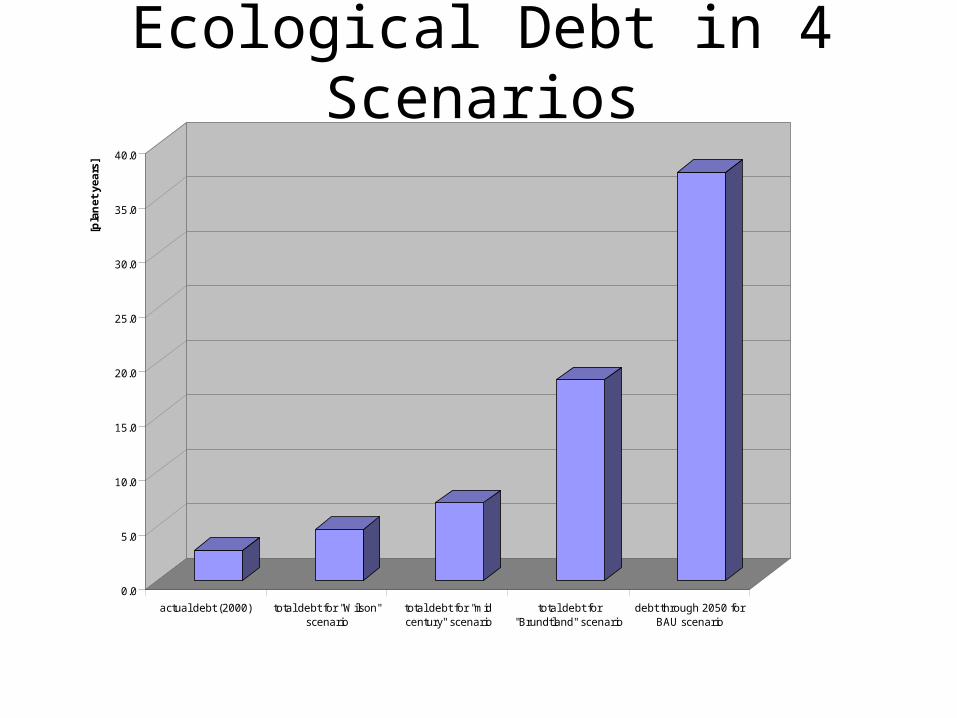
Ecological Debt in 4 Scenarios
0.0
5.0
10.0
15.0
20.0
25.0
30.0
35.0
40.0
[pla
ne
t y
ea
rs]
actual debt (2000) total debt for "Wilson"scenario
total debt for "midcentury" scenario
total debt for"Brundtland" scenario
debt through 2050 forBAU scenario

“Shrink & Share” by Region
0
1
2
1960 1980 2000 2020 2040 2060 2080 2100
nu
mb
er o
f p
lan
ets
global past
ASIA-PACIFIC
NORTH AMERICA
WESTERN EUROPE
CENTRAL AND EASTERNEUROPE
LATIN AMERICA AND THECARIBBEAN
AFRICA
MIDDLE EAST ANDCENTRAL ASIA

Implications for continents?
0%
20%
40%
60%
80%
100%
120%
140%
160%
180%
2000 2020 2040 2060 2080 2100 2120
ASIA-PACIFIC
NORTH AMERICA
WESTERN EUROPE
CENTRAL AND EASTERNEUROPE
LATIN AMERICA AND THECARIBBEAN
AFRICA
MIDDLE EAST AND CENTRALASIA
WORLD OR GLOBAL OVERALL TREND
What Does this Open up?
• Accounting leads to accountability
• Targets informed by risks associated with different scenarios
• 2 simple choices: integrating climate change and biocapacity
• Performance measure