Embed Size (px)
Citation preview
For Cash and Future Considerations:Ontario Universities and
Public-Private Partnerships
ISBN: 0-88627-327-7 September 2003
CAW 567
By Heather-jane Robertson,David McGrane and Erika Shaker

Contents
Executive Summary ............................................................................................................................................................. 2
Introduction .......................................................................................................................................................................... 4
Defining PPPs ....................................................................................................................................................................... 6
Spin and Substance ............................................................................................................................................................. 8
Marketing PPPs .................................................................................................................................................................. 10
PPPs and Infrastructure .................................................................................................................................................... 12
The Politics of Depoliticization ........................................................................................................................................ 15
Tales from Generation 1 .................................................................................................................................................. 17
Why PPPs Cost More ........................................................................................................................................................ 19
Power and PPPs .................................................................................................................................................................22
Diminished Accountability ...............................................................................................................................................23
PPPs and the Politics of Ontario .....................................................................................................................................25
The Intellectual Infrastructure .........................................................................................................................................27
PPPs and the Ontario University Sector .......................................................................................................................30
Higher Learning Inc. ..........................................................................................................................................................33
Privatizing the Ontario University Sector Via PPPs .....................................................................................................34
Conclusion ..........................................................................................................................................................................44
Recommendations ............................................................................................................................................................45
Endnotes ............................................................................................................................................................................. 46
Appendix 1 ......................................................................................................................................................................... 50
Appendix 2 ..........................................................................................................................................................................52
Appendix 3 ..........................................................................................................................................................................53
Appendix 4 ......................................................................................................................................................................... 54

Public-Private-Partnerships (known asPPPs or P3s) are heralded as an innovativeapproach to the provision of a wide rangeof public goods and services, inherently gen-erating an array of “win-win” benefits. Butwhether viewed through the lens of finan-cial cost, accountability, quality of service,community engagement or corporate influ-ence over public policy, the intensificationof the interdependence of corporate andpolitical interests that result from PPPs un-dermine the public good.
For Cash and Future Considerations exam-ines the growing presence of PPPs withinseveral sectors and jurisdictions. It explorestheir impact in Ontario, with particular at-tention to education in general and the uni-versity sector in particular.
Within the university sector, the develop-ment and reinforcement of PPPs is facilitatedthrough a number of Ontario governmentinitiatives: SuperBuild, the Ontario Researchand Development Challenge Fund(ORDCF), the Access to Opportunities Fund(ATOP), the Ontario Innovation Trust (OIT)and the Ontario Centres of Excellence (OCE).All serve to direct public funding towardsspecific research initiatives and programs, inmany cases necessitating matching privatefunding. In some cases, research only quali-fies for public funding once private sectorfunding has been secured.
Examination of funding sources for re-search and building infrastructure con-ducted by Ontario’s universities illustratesthe degree to which targeted research fund-ing is reinforcing massive inequities betweeninstitutions, between departments, and be-
tween students. There is a clear hierarchy infunding, not just of the type of research butof the infrastructure priorities as well.
SuperBuild funding clearly is directed to-wards the infrastructure of specific pro-grams, and to those students enrolled there.In 1999-2000, 40% of students were enrolledin Humanities and Social Sciences, but re-ceived only 3% of SuperBuild funds and0.8% of private sector funds while the 24%of students in Engineering, Computer sci-ence and Business received 51%ofSuperBuild funds and 62% of private sectorfunds. Fine arts (2% SuperBuild, 1.8% pri-vate sector), Education (0% SuperBuild, 0%private sector), and Libraries (0.14%SuperBuild, 19% private sector) are clearlynot high on the Ontario government’s pri-ority list of infrastructure development.
It is not just in infrastructure that PPPsare prevalent; research and development arealso desirable targets—but here, too, we seevast and growing inequities. The 58% of stu-dents at Ontario’s seven best-endowed uni-versities received almost 92% of provincialsponsored research funding, while 42% ofstudents at the 10 smaller institutions re-ceived 8%. Clearly, some institutions are bet-ter positioned to attract sponsored researchfunding from any source, public or private—but this inherently reinforces inequities be-tween the “have” and “have not” institu-tions. And, clearly, this pattern is only en-hanced through PPPs as public money isevermore closely tied to private or “alterna-tive” funding sources.
Furthermore, certain types of research areclearly more “desirable” to potential private
Executive Summary
2 Canadian Centre for Policy Alternatives

sector sponsors, particularly if the researchis seen to have direct and immediate com-mercial application. Disturbingly, there is anappalling lack of information detailing thefull amount of funding, per corporation andper research project, particularly when theability of a university to conduct independ-ent research is involved. Much greater trans-parency is vital to understanding the degreeto which university research is currently ormay be accountable to “the economic devel-opment of Ontario through directed re-search, commercialization of technology, andtraining for highly qualified personnel” ingeneral, or private funders with no account-ability to the public.
The convergence of increased student de-mand due to the double cohort, a rapidlydecaying infrastructure, an accumulateddebt, levels of underfunding that risk com-promising educational quality, an aging pro-fessoriate among other factors have in-creased the university sector’s vulnerabilityto quick-fix solutions. However, Public-Pri-vate Partnerships provide no solution to
these problems, most of them the result ofdeliberate financial decisions. Disguised asprograms to facilitate research, infrastructuredevelopment, faculty retention or general-ized excellence, these arrangements entrenchinequality among institutions, predictablyprivileging technology and science disci-plines over the liberal arts programs inwhich the vast majority of Ontario studentsare enrolled. These vehicles of PPPs havebegun to transform public-serving univer-sities into contracted-out centres for private-sector R & D initiatives.
When universities come to be viewed aslittle more than vehicles of productivity, thepublic loses sight of the contribution ofhigher education to personal and societaladvancement. Increasingly, a universityeducation is viewed as a strategic personalinvestment, the kind that society has littledesire to underwrite. As knowledge and itsacquisition become commodified, the pub-lic reduces its expectation that it can turn tothe university for a perspective that is notcorrupted by commercial interests.
For Cash and Future Considerations 3

4 Canadian Centre for Policy Alternatives
There is no clear evidence from experiencethat the investment which is socially ad-vantageous coincides with that which is themost profitable.
John Maynard Keynes1
The conventional method of financingpublic endeavours in Ontario is undergoingrapid and substantive reform. Public-PrivatePartnerships, or PPPs, may be relatively newto Ontario, but the approach is hardly origi-nal. It has been borrowed from the most ag-gressively neo-conservative states uponwhich Ontario models itself. Ontario’s cur-rent government is determined to pursuesuch arrangements despite compelling evi-dence of their serious shortcomings.
When a government denies the inherenttension between private and public interests,it virtually guarantees that private interestswill prevail. PPPs reflect and foster a dan-gerous degree of public confusion over therelationship between public and privatespheres. Yet the words “dangerous” and“PPPs” are rarely linked; the official lan-guage of PPPs is intentionally soothing andreassuring. After all, surely “partners” sharea common goal, have nothing to gain byweakening the other, and necessarily suc-ceed or fail together. All for one, and one forall. True partners are invested equally, andshare both the risks and rewards.
The purpose of this paper is to demon-strate that since PPPs manifest none of thesecharacteristics of partnership, deceit and dis-tortion are built into their very foundation.PPPs not only skew concepts of the publicgood and public priorities, they waste hu-
man and financial resources, often on a re-markable and indefensible scale. In a mixedeconomic system such as Canada’s, publicpolicy is rarely entirely independent of cor-porate interest, but neither has it been ut-terly dependent on private sector approval.
PPPs transform the public-private dialec-tic into a one-way dependency. Limitingpublic works to those ventures that accom-modate corporate ambitions is problematicin all sectors, but absolutely disastrous foruniversities whose existence is predicated onautonomy, and safeguarded by a broad pub-lic recognition of the need to protect thatautonomy. PPPs are changing Ontario’s uni-versities in ways that contradict the prefer-ences and judgements of the faculty, stu-dents, and citizens affected by them, anderode the public’s understanding of the veryrole of universities in modern society. Un-checked, PPPs will compromise universities,undo many of their accomplishments andmortgage their future “for cash and futureconsiderations.”
Curiously, despite being the excuse forand the vehicle of what one critic describedas “a rip-off, a steal, a plunder, a legalizedmugging, piracy, licensed theft, a diabolicalliberty, a huge scam, a cheat, a snatch and aswindle”2—and this in the Financial Times—PPPs are outside the vocabulary and belowthe political radar of most Canadians, eventhose who pride themselves on possessingconsiderable familiarity with neo-conserva-tive tactics. We hope to interrupt public com-placency by exploring the state of PPPs inOntario with a particular focus on their im-pact on the university sector in this province.
Introduction
For Cash and Future Considerations 5
This paper draws on the analyses and ex-periences of other sectors and other juris-dictions with PPPs, and identifies some ofthe short- and long-term consequences ofabandoning public policy to the pursuit ofpartnerships. It will conclude that tradingoff public policy in exchange for cash and
future considerations is not only bad eco-nomic policy, it threatens to narrowOntarians’ future policy options to thosethat provide the private sector with thegreatest role and the greatest reward. Nosector will be more damaged by such limi-tations than universities.

6 Canadian Centre for Policy Alternatives
Perhaps PPPs are best defined as a form ofneo-mercantilism.
Christopher Sheil3
PPPs have come to dominate a substan-tial portion of government activity in On-tario and yet managed to remain surpris-ingly invisible. Even among the relativelysmall proportion of the population most in-terested in policy issues, PPPs have not beenidentified as a significant departure frompractice, nor as a particular threat to policyautonomy. The fog of acronyms associatedwith PPPs can be somewhat overwhelming,but effective opponents need a sense of theirmultiple incarnations and the terminologyPPPs have spawned. It is necessary but notsufficient to recognize that PPPs are a gen-eral problem; unlocking their complexitymust precede efforts to discredit them.
But this goal, in turn, requires pinningthem down. In the UK, PPPs are referred toas PFI, or Private Finance Initiatives. InCanada, P3 is used at least as commonly asPPP, the latter a term also used in Australia.According to the Canadian Council [in fa-vour of] Public-Private Partnerships(CCPPP), in the United States the all-purposeterm “privatization” tends to be applied toall types of PPPs, which suggests either afailure to discern structural differencesamong models or else an admirable degreeof honesty on the part of Americans.
Among those Canadians who recognizethe term, PPPs are most frequently associ-ated with “leaseback” arrangements. In thistype of PPP, public funds, and sometimes
user fees, are paid to the private partner overan extended period, in exchange for the pub-lic’s partial or exclusive use of some type ofprivately-financed (and sometimes privatelyowned and operated) infrastructure facility:a hospital, a road, or a school. The status ofthe ownership of the asset at the end of thelease period is subject to the terms of theagreement. In some ways, leasebacks resem-ble automobile leasing. Lease-payers pick upall the responsibilities of ownership, butnone of its privileges.
But leasebacks are just one of many typesof PPPs, and not all deals involve infrastruc-ture. Types of PPPs tend to be identified byinsiders through a particular set of acronymsthat spell out the extent of the private sec-tor’s role: DBO stands for Develop-Build-Operate; BOOT stands for Build-Own-Op-erate-Transfer, and so forth. Certain types aremost problematic because of the degree towhich they waste public finances; in othercases the predominant risk is the impact ofthe private sector acquiring excessive influ-ence on public policies, or the purposes thatpublic spaces serve. Still other PPPs endan-ger public services whose fragile (and con-testable) protection from the scope of GATS(the General Agreement on Trade in Serv-ices) depends on ensuring that these serv-ices are not “co-delivered” by the privatesector.4 Some of these hazards are built intothe essence of PPPs, some arise because ofthe nature of the sector involved, while stillother hazards are the unhappy consequenceof the terms and conditions of the specificdeal in question.
Defining PPPs

For Cash and Future Considerations 7
Critics will be most effective when theycan refine their general critique of PPPs toaddress the specific problems associatedwith each type. Whether the consequencesto the public are overspending,underdelivering, compromising public pur-poses, or making a formerly public service
more private, the template for each critiqueshould be an assessment of the relative pro-portion of risk and reward that both sectorscan reasonably anticipate. This assessment,in turn, rests on appreciating the fundamen-tal dynamics of PPPs.

8 Canadian Centre for Policy Alternatives
We should drop the language of partner-ship in the public interest. Let’s simply callthese deals Private Involvement ininfraStructure Service. At the least, this de-scription would supply an acronym to re-mind us of what now needs to be takenout of the latest policies.
Kenneth Davidson5
At first, the abbreviation PPP referred to“Private-Public Partnerships,” but ratherquickly the order of the first two words wasinverted in an apparent attempt to re-brandPPPs as driven primarily by public ratherthan private interests. This is characteristicof the PPP “movement,” as it calls itself, andan example of the effort to get the public tofocus on the spin rather than the substance.Obviously the “partnership” concept isquestionable, but so is the use of the term“public.” The public can hardly be said tobe party to any partnership, arrangement,or contract (let alone movement) whoseterms are secret. Most PPPs are more accu-rately described as “government-private sec-tor deals” (GPSD’s?); although this phraselacks the alliterative advantage of PPPs, it israther too transparent.
Those who promote PPPs tend to infusetheir discussions with the aggressive win-win language of business best-sellersmerged with the hype of advertisers. Whenjournalist Murray Dobbin attended a PPPconference in Vancouver, he wrote that hecould have acquired an entirely new vocabu-lary:
There were times when I felt I was at ameeting of the Shriners or some other se-cret society. The P3 priesthood even makesup its own language, with several promot-ers talking about the need for the“incentivization” of businesses to get in-volved, and how to “incent” business andgovernment into embracing P3s…6
The (sold out) event that Mr. Dobbin at-tended was held in Vancouver, where theelection of the unabashedly privatization-friendly Campbell government has spikedPPP excitement. The conference was spon-sored by the Canadian Council for Public-Private Partnerships (CCPPP), an influentiallobby group whose purpose is to promotePPPs on behalf of its membership, whichincludes corporations as well as certain pro-vincial ministries and federal departments.7
CCPPP avoids using derivations of the word“incentive” in its definition of PPP, which itcalls: “cooperative ventures between thepublic and private sectors, built on the ex-pertise of each partner, that best meet clearlydefined public needs through the appropri-ate allocation of resources, risks, and re-wards.”8
Critics have not yet adopted a commondefinition of PPPs, but the authors of thispaper suggest a provisional version that situ-ates PPPs as purposeful mechanisms of neo-conservativeism:
PPPs refer to the systematic replacementof public funding, services and purposes by
Spin and Substance
For Cash and Future Considerations 9
private funding, services and purposes. Thegoal of PPPs is to secure an illegitimate de-gree of private benefit at low risk in such away that governments gain political advan-tage. Public welfare is compromised as a re-sult.
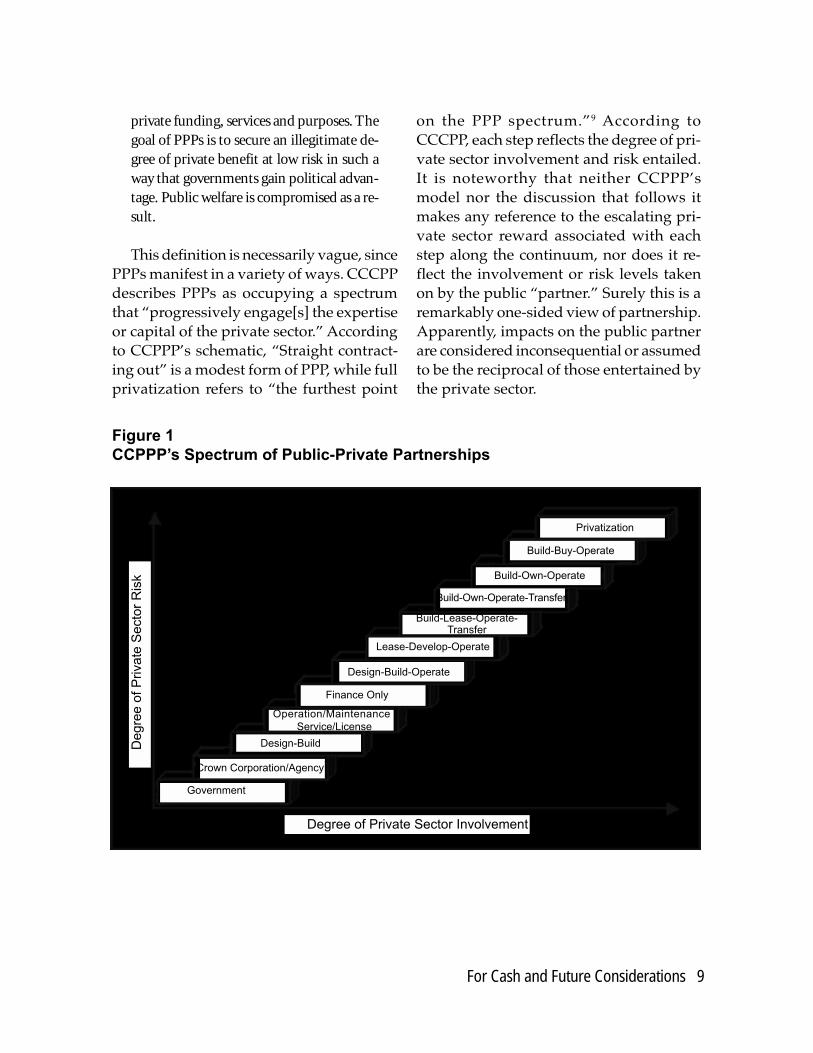
This definition is necessarily vague, sincePPPs manifest in a variety of ways. CCCPPdescribes PPPs as occupying a spectrumthat “progressively engage[s] the expertiseor capital of the private sector.” Accordingto CCPPP’s schematic, “Straight contract-ing out” is a modest form of PPP, while fullprivatization refers to “the furthest point
on the PPP spectrum.”9 According toCCCPP, each step reflects the degree of pri-vate sector involvement and risk entailed.It is noteworthy that neither CCPPP’smodel nor the discussion that follows itmakes any reference to the escalating pri-vate sector reward associated with eachstep along the continuum, nor does it re-flect the involvement or risk levels takenon by the public “partner.” Surely this is aremarkably one-sided view of partnership.Apparently, impacts on the public partnerare considered inconsequential or assumedto be the reciprocal of those entertained bythe private sector.
Figure 1CCPPP’s Spectrum of Public-Private Partnerships
Government
Crown Corporation/Agency
Design-Build
Operation/MaintenanceService/License
Finance Only
Design-Build-Operate
Lease-Develop-Operate
Build-Lease-Operate-Transfer
Build-Own-Operate-Transfer
Build-Own-Operate
Build-Buy-Operate
Privatization
Degre
e o
f P
rivate
Secto
r R
isk
Degree of Private Sector Involvement
10 Canadian Centre for Policy Alternatives
Deep opposition to privatization in thecommunity poses a challenge to organiza-tions with an interest in touting PPPs. Inresponse to this challenge a significant pub-lic relations industry now exists to sell PPPsto a cynical public. When confronted withcommunity opposition, some privatepartners….have gone so far as to contractwith consultants who specialize in turninglocal hostility into viable support….In es-sence, overcoming local opposition is a costof doing business in making public-privatepartnerships work.11
John Spoehr
Critics of PPPs contend that this partner-ship continuum merely identifies the pro-gression of privatization, a word that rarelyappears in pro-PPP discourse outside theU.S., perhaps for good reason. As Austral-ian economist Christopher Sheil observes,“given its unpopularity, our politicians havesimply removed the word; they havescrubbed out ‘privatization’ and replaced itwith a new descriptor called ‘partnership,’and continued to advance their privatizationpolicies under this new banner.”12 It is justas important for critics to insist that PPPs benamed as a means of privatization as it isfor proponents to avoid the term. As withmany current contests for public opinion,sometimes the winner is the one who con-trols the language of the debate.
But the real marketing battle is oversubtext, because the marketing of perspec-tives depends more on implicit than explicitclaims. Advocates of PPPs nurture the per-
spective that “partnership” with the privatesector guarantees higher quality goods andservices at a lower cost and in a more timelyway than publicly-delivered goods and serv-ices. This premise, in turn, rests on the as-sumption that the private sector is better-managed, more cost-conscious and can de-liver a superior product in less time than thepublic sector. The public sector is perceivedas burdened by regulation, having a convo-luted and bureaucratized decision-makingprocess, suffering political interference witha labour force made expensive by unioniza-tion and having a culture of indolence andincompetence. Whether asserted or merelyimplied, this rationale exploits (and pro-motes) public antipathy towards govern-ment and trades on the entrepreneurial in-genuity, accountability, and integrity allegedto characterize the private sector. One mightexpect this argument from the private sec-tor, but as CCPPP points out, the scheme isvery much dependent on governments,rather than the private sector, becomingPPPs most enthusiastic advocate.
Obviously, it is in the private sector’s in-terest to ensure that the mystique surround-ing its virtues permeates a culture that mightotherwise question the benefits of neo-conservativeism. Thomas Frank calls the ef-fects of this propaganda “marketpopulism.”13 It is also in the élite’s interestto maintain the illusion that a growing de-pendence on the private sector is a matter ofprudent choice rather than the inevitableconsequence of public policy that restrictsall other options. Failures of neo-
Marketing PPPs

For Cash and Future Considerations 11
conservativeism must be cast as the conse-quences of “not going far enough” along thepath to the free market, that place where allour problems will be resolved. Proponentssuggest that class consensus has beenachieved:
At present, almost all élite Americans, withcorporate chiefs and fashionable economistsin the lead, are utterly convinced that theyhave discovered the winning formula foreconomic success—the only formula—goodfor every country, rich or poor, good for all
individuals willing and able to heed the mes-sage, and, of course, good for élite Ameri-cans: PRIVATIZATION + DEREGULA-TION + GLOBALIZATION = TURBO-CAPITALISM = PROSPERITY.14
Only blind faith in this formula can ex-plain support for PPPs extending beyond the“partners” who need only believe that oneway or another they will be enriched by thetransaction. A closer examination of whowins and who loses when the “partners”take on pent-up public demand for infra-structure illustrates what is at stake.

12 Canadian Centre for Policy Alternatives
The demand for infrastructure (schools,hospitals, highways, etc.) cuts across all sec-tors of public services, and providing it hasalways entailed significant public expense.However, in addition to being increasinglyexpensive, the state of the nation’s infrastruc-ture file is increasingly politically dangerous.After all, when the public’s infrastructureneeds are not met, voters blame the govern-ment in power. If meeting these needs is seenas contributing to higher taxes or risking adeficit, voters will still blame the government.From the perspective of politicians, finding away to meet the public’s demands for infra-structure at less expense is a significant pri-ority. This reality has not been lost on the pri-vate sector, which is quite willing to help gov-ernments out of this bind—for a price.
Providing new infrastructure ordinarilyentails significant short-term capital coststhat are financed through governments’ op-erating budgets. Appropriately managed,this is good public policy for several reasons,including efficiency. Governments can bor-row at advantageous rates, pay on time forservices provided by contractors selectedthrough a competitive tendering process,and anticipate problems that may add tocosts. Depending on the type of project, pub-lic servants can provide appropriate degreesof hands-on expertise and oversight in de-termining project specifications, carrying outcontract negotiations, supervising progressand ensuring regulatory compliance. Gov-ernment officials can apply a variety of re-wards and sanctions (regarding completiondates, for example) that encourage efficiency.Public expenditures are kept under control
because as “general contractors,” there is noincentive for governments to spend morethan necessary on infrastructure in general,or on any specific project. It is not in the gov-ernment’s interest to inflate its costs by tak-ing longer than necessary to repay associ-ated debt. Poor project management risksnegative political consequences that govern-ments seek to avoid.
This conventional approach to buildingor renewing infrastructure also benefits theprivate sector, which acquires engineering,construction, and related contracts, as wellas the workforce, whether employed by theprivate or public sector. In effect, the tradi-tional model is a “partnership” in the sensethat neither sector can prosper for long atthe other’s expense. If government refusesto offer sufficient financial incentives, firmscan choose not to bid for contracts. If theprivate sector seeks an unreasonable profitmargin, government can look to anothersource. While recognizing that this model israrely perfectly executed, in the main, it hassuccessfully provided the infrastructure thatis necessary for delivering public services.Its chief advantage is that it contains built-in disincentives for either side to gouge theother. The principle of transparency—al-though again, occasionally honoured morein the breach rather than in the observance—provides a reasonable measure of public ac-countability. Either partner’s failure to dis-charge its role competently entails conse-quences, whether financial or electoral. Bothin theory and in practice, this process meetsfinancial, public interest, and accountabilitycriteria.
PPPs and Infrastructure

For Cash and Future Considerations 13
But PPPs make “partner interest” moreimportant that public interest. PPPs prom-ise to take the political risk out of infrastruc-ture by hiding its true costs through the idi-osyncrasies of accounting practices. Whengovernments spend or borrow to finance in-frastructure construction, amounts involvedare recorded as capital costs, and borrow-ing for this purpose is deemed debt. But if agovernment contracts with a private sourceto raise money or finance the costs incurred,these amounts are treated differently withinpublic accounts. Typically, the governmentpays down its “brokered” debt through alease, an amount that is treated as an oper-ating expense. This allows government toreduce the appearance of debt and spreadit over time, and to avoid recording whatwould have been the entire capital cost—ofbuilding a new school, for example—as amuch more manageable monthly lease. Fol-lowing accounting principles, this amountis treated as an operating cost. This is re-ferred to as “off-book” accounting. The op-tics of off-book accounting have lured manypoliticians into supporting PPPs, althoughas Sheil points out, whether such liabilitiesare entered into the public accounts as ex-penses or as debt, “all the fiscal characteris-tics of the PPPs are exactly the same as pub-lic debt, except these funds are more expen-sive and less flexible.”15
He also points out that recently disgracedU.S.-based company Enron, too, called itsdeals “partnerships” and made extensiveuse of off-book accounting practices.16
As any credit card user knows, payingless every month always means payingmore later, and reduces future spendingflexibility. Every card user knows that he orshe is not making the most efficient use ofpersonal resources, but (as record levels ofconsumer debt will attest) not all financial
decisions are rational ones. The politicalappeal of deferring (and consequently in-flating) the costs of infrastructure financinghave proven to be unbearably tempting togovernments elected on promises to restrainspending and still provide services. It willsurprise no one to be reminded that politi-cal time frames are remarkably short. Thistype of PPP helps governments maintain theillusion of fiscal prudence, and can evenpave the way for further tax cuts. These taxcuts generate more pressure on budgets, si-multaneously eroding public services andproviding fertile ground for the next waveof privatization that promises service im-provement.
The root of the private sector’s enthusi-asm for infrastructure PPPs is equallystraightforward: They are a great way tomake money at very low risk to investors.
The predictability of a stable relationshipbetween the cost of an investment and therevenue that it will generate is very attrac-tive to investors. When demand for a prod-uct or service depends on consumer prefer-ences and economic factors that exist out-side the enterprise, revenues fluctuate andprofits can be compromised, so investorsdemand a premium rate of return in ex-change for assuming this risk. PPPs are“low-risk” because estimating the revenuestream generated by operating a prison ismore exact than estimating the revenue froma shopping mall, a coffee shop, or an air-line. Demand is remarkably steady; neitherprisons nor schools go out of business withany regularity and even during a recession,demand for prisons, schools, libraries, andso forth is relatively constant, while (underthe right conditions) costs can be contained.In general, only change in public policy in-fluences PPP revenue streams, and poli-cies—“right-to-work” legislation, for exam-

14 Canadian Centre for Policy Alternatives
ple—can drive down costs. PPPs are extraor-dinarily low risk investments.
But profitability can be enhanced with theright mix of public policies. Making prisons“better” has little impact on attracting moreinmates, but lobbying for automatic sentenc-ing and longer terms increases demand.Housing inmates under more punitive andovercrowded conditions while providingthem with less access to education and re-habilitation improves the corporate bottomline. This explains why corporations en-gaged in “prison partnerships” lobby so vig-orously for so-called “prison reform.”
The chance for the private sector to ex-ploit or “scaffold” the existing physical, so-cial and human infrastructure that has cre-ated public services—at public expense,and for public purposes—is itself a lucra-
tive opportunity that can be enjoyed at lowrisk. In pursuing its own self interest, theprivate sector will naturally seek additionalconcessions from governments as the priceof “partnering” them out of their difficul-ties.
In the long run, however, it is the privatesector ’s positioning to shape corporate-friendly public policies, and to influencepublic opinion about these policies that maycombine to be the most potent impact ofPPPs. It would be extraordinarily naïve toexpect the private sector not to take full ad-vantage of weakened or ambitious govern-ments increasingly dependent on carvingout more and more agreements. And equallynaïve to ignore their appreciation of the linkbetween public opinion and opportunitiesto help the rich get richer.
For Cash and Future Considerations 15
In order to create more PPP-friendly atti-tudes among the public, neo-conservativegovernments and the private sector have, ineffect, created a partnership to sell partner-ships. This united marketing team pitches apotentially persuasive message, one that isnot limited to PPPs. Both parties are equallyeager to shift public opinion and publicpolicy towards the increased acceptance ofthe conditions that characterize PPPs, in-cluding user fees, the tiering of service, re-duced protection for low-wage earners, alimited role for government, etc. Both gov-ernments and private sector parties areequally invested in making PPPs synony-mous with innovative, win-win solutionsthat provide better and more timely servicesat lower public cost. It isn’t coincidental thatPPPs are often introduced in association withpent-up needs often hyped as “crises.” It iseasier to win support for privately-operatedMRI clinics when waiting lists are growing.
It is in the private sector’s interest to ex-pand partnerships into more sectors, andmore deeply into those sectors experiment-ing with PPPs, i.e. to move more quicklyalong CCPPP’s privatization continuum. Butfor this to occur at an escalating rate, Cana-dians’ strong views on keeping the “public”in education, health care and other serviceswill have to change, according to the CCPPP,which contends that this attachment springsfrom unwarranted fears about PPPs, andCanada’s “political culture”:
Those opposed to public-private partner-ships most often cite the loss of public con-trol that occurs when a private sector com-
pany is involved in financing, building, ordelivering public services. Compared toother countries with vibrant P3 activity, thepolitical culture of Canada is often seen asa barrier to further progress on P3s. Espe-cially in such areas as healthcare and whendelivering such “public goods” as water, Ca-nadians remain suspect of partnerships thatput “shareholder” value above public inter-est. Public-private partnerships are oftenseen by organized labour as resulting in jobloss, poor quality and lack of oversight.These objections are overstated and oftenmisrepresent fact-based research in thisfield.17
This defence of PPPs is telling in severalrespects. By placing “public good” in quo-tation marks when it refers to water, isCCPPP suggesting that water is only a “so-called” public good rather than an actualpublic good? Which part of Canada’s politi-cal culture is hostile to P3s—the part that hasthe temerity to think that public interestshould eclipse shareholder value? How verytwentieth century! The opposition to PPPsis credited exclusively to “organized labour,”an interest group that allegedly prefers “non-fact-based research.” Note that “organizedcapital” doesn’t say what the facts are, justthat critics are wrong.
Again, according to CCPPP, if Canadians’suspicions about PPPs cannot be put to rest,perhaps they can be made moot by position-ing PPPs as unavoidable or inevitable. Justas Canadians grudgingly acquiesced whenthey were told that there was no alternativeto slashing social programs in order to slay
The Politics of Depoliticization

16 Canadian Centre for Policy Alternatives
the deficit, they are now being told that thechoice is between no new infrastructure orPPP infrastructure; no services or privatizedservices. This approach tends to mute gen-eral criticism, and the apparent lack of op-position can be spun as consent. As CCPPP’sCynthia Robertson claims in her modestly-titled presentation World in Review, one ofthe outcomes attributable to the PPP is that“Relationships between the private and pub-lic sectors [are] becoming ‘apolitical,’ [i.e.]supported by all parties.”18
Reflecting on more than a decade of theselling of PFI/PPPs, John Spoehr et al. zeroin on this strategy of depoliticization.
The focus on the practical, efficiency andvalue for money of PFI/PPP projects is atrap. The advocates of PFI/PPP need to nar-row the debate as much as possible to ex-clude discussion about principles, ideology,and political beliefs. They want to confinethe debate to the “business” of how serv-ices are provided, in effect depoliticizingpublic services. This sidesteps crucial issuesabout democratic accountability, the limi-tations of government by contract, socialneed, and service quality.19
If PPPs are to be countered effectively, acritique that addresses their political andstructural deficiencies must be added to aneconomic critique. Opponents have tendedto take aim at the financial weaknesses ofPPPs, but this strategy may need rethinkingon several fronts. Much of the most usefulfinancial data is difficult to obtain because itis (conveniently) considered proprietary cor-porate information. In circumstances wherefinancial information has come to light, it hastended to be forensic and after-the-fact, pen-etrating public consciousness well after com-mitments have been signed and promisesmade. It is almost impossible to win an ar-gument based on costs projected severaldecades into the future; such debates candeteriorate into a battle of accountants’ as-sumptions, and the public loses interest.Even being able to demonstrate that similarPPP projects have been profligate with pub-lic money isn’t a particularly powerful ar-gument when proponents need merely claimto have learned from previous errors thatwill never be repeated. It is common, in fact,for PPP proponents to talk about “Genera-tion 2” or “Generation 3” partnerships whenconfronted by the evidence of the failure ofprojects already completed—all of which arealleged to belong to Generation 1.
For Cash and Future Considerations 17
A consideration of one set of Generation1 projects illustrates two linked PPP prob-lems. First, many of the worst outcomes ofPPPs are those that are unanticipated. Un-fortunately, unanticipated problems builtinto contracts can be just as severe—and justas binding—as the anticipated type. Sec-ondly, these PPPs demonstrate just howmuch the public interest can be compro-mised when governments come to see them-selves as the “partners” of business. ThisGeneration 1 case study reinforces the needto engage with the public on many differentlevels—political, legal, financial, and com-munity—to reverse the momentum of PPPs.And it suggests that sometimes help arrivesfrom unexpected sources. This is an abbre-viated version of the story of Nova Scotia’sexperiment with PPP schools.20
Facing intense pressure to renew its crum-bling school infrastructure without raisingtaxes, in 1997 the Liberal government of theday hastily signed long-term, PPP agree-ments with private developers. In CCPPPterms, this project was quite far along theprivatization continuum, since each schoolwas to continue to be corporate-owned,largely corporate-managed, and despitehefty lease payments from the province, thebuildings would continue to be used by theowners for largely unrestricted purposes,while the leasers’ rights were strictly limited.The first Nova Scotian PPP school attractedconsiderable interest, and in 1998, it waseven awarded first prize in CCPPP’s “infra-structure” category recognizing outstandingPPP ventures. For a while, everyone washappy, especially the developers, until the
scrutiny began with the opposition askingsome difficult questions:
The scheme could have continued indefi-nitely, had it not been for a scathing assess-ment by the provincial auditor, who con-cluded (in more refined terms) that thepublic was being hosed by greedy develop-ers and a government desperate to improvethe optics on the state of the public purse.Nova Scotians would be paying at least $1million more for each school that had beenconstructed as a P3 than if it had been builtin the conventional manner—and muchgreater savings could have resulted fromrenovating existing buildings.21
Both the government and the developersattempted (unsuccessfully) to shield theterms of the leases from public view by cit-ing the sanctity of proprietary corporate in-formation. Little wonder that the partnerswere nervous: CBC reported that over the20-year duration of the lease, the provincewould pay $47 million for a school that costonly $27 million to build, putting $20 mil-lion of scarce public money into the handsof private investors. Alongside allegationsthat some high-profile Liberal supporterswere implicated in a series of land flips re-lated to school construction, the uproar overPPP schools helped defeat the government.Although in 2000 the new Conservative pre-mier declared a moratorium on planningmore PPP schools, Nova Scotians remainbound by the terms of 39 such agreements.
As these school PPPs projects have pro-ceeded, it has become clear to everyone in-
Tales from Generation 1
18 Canadian Centre for Policy Alternatives
volved that the woes associated with PPPschools are not limited to their exorbitantcost.
It seemed that schools were being locatedwhere developers already owned property,not where the need was greatest. The pri-vate sector showed a distinct preference forbuilding in upscale suburbs, allegedly toincrease demand for home construction onadjacent land owned by the developers thatwere part of the consortium.
Developers had been explicitly exemptedfrom any legal or financial liability forshoddy school construction, or even faultywiring or plumbing. The public componentof the partnership assumed all the risk, theprivate sector all the benefits. The publicpartner was responsible for operating costs,ongoing capital improvements and mainte-nance, and technology upgrading costs.
Because developers had everything togain and nothing to lose by building pala-tial schools—after all, their profit marginswould expand proportionately—no expensewas spared. One school included an orchard,an amphitheatre, two soccer fields, air con-ditioning and two sets of shades for the win-dows. The community school down the roadheld a bake sale to help buy drapes for thebare windows and fix a leaking roof. Soonthat community was demanding its own P3school as well.
Other problems with P3s revealed them-selves only gradually. Only new school con-struction, not renovation, unleashed themagic of P3s, so existing schools were al-lowed to run down. Both the governmentand developers were anxious to get moreinfluential (i.e. wealthy) Nova Scotians onside, so the needs of inner cities and ruralareas were ignored in favour of more afflu-ent areas. In order to use all the shiny tech-nology wired into each school, owners be-
gan trying to influence which teachers andadministrators would be assigned to theirschools. They pressured school boards topick up the cost of “training” teachers tobecome heavy users of the technology. Andbecause they owned the schools, develop-ers allocated prime space in the buildings tocorporate offices and fast food franchises. InJanuary, 2003, an arbitrator ruled that theprivate owners of P3 schools had the rightto demand a percentage of the take from on-site school fund-raising.22 The ownerswanted a chunk of every chocolate bar sold.
Worse yet, developer-owners ensured thatthe terms of their leases severely limited theuse of the facilities after hours, during week-ends and summer holidays. Now neither stu-dents nor the public has any right to theirschools after hours unless they pay for theprivilege. At $75 per hour, the drama clubcan’t afford to rehearse. Community groups,even parent councils are billed for everymeeting. Yet some of the schools are quitebusy after hours, even if the Boy Scout troopcan no longer afford to meet there. The en-terprising developer-owners use the schools’facilities to run technology training courses,using equipment and facilities whose main-tenance and upkeep are the sole responsibil-ity of the public.
When their Auditor-General, with helpfrom the CBC, blew the whistle on the fi-nances of PPP schools, Nova Scotians becamemore familiar with “off-book” accounting.But as those who lived (or followed) this sagadiscovered, the true off-book costs are notlimited to those that are financial. The coststo communities, democracy, and accountabil-ity as a result of favouring private profit overpublic interest are incurred not just becauseof the terms of a particular deal. The prob-lems are intrinsic and structural to PPPs, cut-ting across all sectors and all projects.
For Cash and Future Considerations 19
If the problems associated with PPPs wereexclusively financial, there would be suffi-cient evidence to dismiss them as poor pub-lic policy. While PPPs may differ in detailand substance each project shares a commonmeans of making profit: Charging substan-tially more than it costs to deliver the prod-uct or service; driving down quality; cuttingthe costs of production, usually by reducingstaff or salaries. The ways to profit vary lit-tle, whether the “partnership” consists ofcontracting out janitorial services, buildinga hospital, or running a for-profit jail.
The involvement of the private sector asa “partner,” rather than merely as a provider,influences all cost variables, but to an un-certain degree. It would be convenient if crit-ics could confidently assert that all PPPs cost20% more than necessary, or even that a par-ticular project, such as a hospital, could bebuilt for $X million less if it was not built asa leaseback. Unfortunately, measuring thecost gap between private and public provi-sion is an inexact calculation, and all suchnumbers should be treated as estimates thathave incorporated a particular set of as-sumptions, especially when the full disclo-sure of the specific terms of agreements areroutinely withheld. Nor is it safe to assumethat the cost of one project predicts the costof subsequent projects, even of the same typeor between the same partners. Governmentsfacing an impending election may cut hasty(and expensive) deals in order to promise a“deliverable” to the public. Investors maybe prepared to accept a low return on invest-ment in order to get “a foot in the door” that
promises enhanced profits to be extractedfrom future projects.
In addition, there are many significant fi-nancial costs that are impossible to calculatewith any certainty. What is the true cost ofpaying lower wages to employees? or build-ing another highway rather than encourag-ing the use of in public transit? What is thetrue cost of treating water as a commercialcommodity? or of abandoning the precau-tionary principle in food inspection? Thesegaps in information render any financial cal-culations that claim to be exact or compara-tive highly suspect, and explains, in part,why opponents of PPPs are encouraged toavoid “playing the numbers game” whenchallenging a particular project. At the sametime, it has been extraordinarily helpfulwhen a “disinterested” source, such as NovaScotia’s auditor general, has contended thata PPP has squandered public dollars.
Organizations opposing PPP must con-sider their strategic options in the face ofthese dynamics. To this point, most attemptsto expose infrastructure PPP have concen-trated on their value-for-moneyvulnerabilities. The Canadian Health Coali-tion, NUPGE, CUPE websites, and othersrecount anecdotes and examples of PPP-in-duced waste.
Though restricting a PPP critique to finan-cial issues is difficult, nonetheless, it is rea-sonable that economic issues should be partof most PPP challenges. For this strategy tohave the maximum impact, the public fi-nance analysis must be made simple andaccessible. The following examples of the
Why PPPs Cost More

20 Canadian Centre for Policy Alternatives
ways that PPPs waste public money requiresonly a rudimentary grasp of financial mat-ters:• Paying twice: The terms of most PPP
agreements are not parallel to the termsof a mortgage, in which the mortgageeeventually owns the property on whichhe or she has been making payments,with interest. Many PPP arrangementsare “leases” rather than mortgages. Nomatter how much the public borrowerhas paid by instalment, either ownershipof the facility is never transferred, or elsethe leaser is required to purchase the fa-cility at the end of the term, irrespectiveof its condition or changing public pri-orities.
• Paying inflated interest rates: Using theprivate sector to finance public invest-ments is indefensibly expensive. Govern-ments can raise necessary funds to fi-nance infrastructure projects at very ad-vantageous interest rates. Consortia ofprivate interests pay a premium to raisecash from banks, private funders andeven pension funds. Taxpayers and citi-zens pay substantially more to financethese projects than if they had been pub-licly financed—thus enriching the rela-tively small proportion of the public witha direct interest in the stock market.
• Making profit the old-fashioned way:Profit is maximized by cutting costs, re-ducing the quality and range of services,and by charging premium fees. PPPs cansucceed only if they promise a superiorrate of return on investment, often in-cluding tax-break “incentives” that fur-ther drain public coffers. Most publicservices, including health care and edu-cation, are labour-intensive, makingprofit in these sectors means cutting em-ployees and their salaries.23
• Subsidizing monopolies: Most infra-structure projects are by definition mo-nopolies, or at least category exclusives:there will be only one Confederationbridge joining P.E.I. to New Brunswick,and prisons don’t “compete” for custom-ers. However, as private rather than“public” monopolies, they are outsidethe information and accountability loopthat Canadians associate with publicservices. When private monopolies raiseuser fees (for using a bridge or highway,for example) the public has little recoursesince it can’t benefit from the price-mod-erating effects of competition.
• The price of advice: Consultants, lobby-ists, and lawyers who claim PPP exper-tise find their services in growing de-mand. For example, compared with theconventional method of government-tendered construction projects, PPPs re-quire whole contingents of “experts” ad-vising both parties. Expertise that onceresided within various ministries hasbeen lost through downsizing, some ofthe same individuals are rehired, at muchgreater expense, to act as project consult-ants. Whether hired by the private orpublic partner, the costs of these advis-ers and experts is inevitably added to theprice the public pays.
• Bells and whistles: As illustrated byNova Scotia’s PPP schools, the privatepartner stands to gain opportunities (andprofit) when communities become con-vinced that they require new facilitieswith more high-end features, and that“renovation” (or patience) just isn’t anoption. As the capital costs for any ven-ture increase, the proportional profit in-creases accordingly.
• Exaggerating problems, limiting solu-tions: Just as those in favour of a greater

For Cash and Future Considerations 21
role for the private sector in health caredelivery have been prone to exaggeratethe “crisis” in health care, and the invest-ment industry tends to exaggerate thevulnerability of public pension funds, sothe development business (and ancillaryservices) gain from exaggerating publicproblems and governments’ inability todeal with them. For example, CCPPP iseager to draw attention to problems as-sociated with infrastructure, fromcrowded schools and hospitals to theproductivity-associated costs of crowdedfreeways. When building more infra-structure is positioned as the solution tothese problems, more creative, environ-mentally-responsible and economically-sustainable options are overlooked.Building and leasing hospitals is consid-erably more profitable than promotingwellness and healthy lifestyles.
• Subsidizing hypocrisy: Many of thosewho track the ascendancy of PPPs pointto the sources and consequences of po-litical and legislative constraints on gov-ernments’ financing options. Anythingthat restricts governments’ ability to in-cur a deficit, borrow or raise taxes forcesthem towards private financing as theonly option available to them. BecausePPP commits future governments to
costs or leases generated to meet currentneeds, it adds to the constraints that sub-sequent governments must accommo-date, thus further restricting govern-ments’ policy options. The idea that defi-cits are never justifiable directly benefitsthe private sector, despite its own reli-ance on borrowing and its dependencyon types of consumer debt.
• The price of expediency: One of the moredifficult-to-quantify costs is what pre-mium, if any, the public partner pays toget the project off the ground in a timelymanner, particularly if the governmentis seen as being “over a barrel.” The pri-vate partner is often in a position to ben-efit financially from opportunities to ex-ploit the political considerations thatmotivate governments to engage in high-profile PPPs in the first place. Rather re-markably, in its haste to announce thefirst school PPP project, the new build-ing was actually under construction be-fore the terms of the agreement had beenfinalized (which may, or may not, explainthe national honours this project receivedfrom CCPPP.) The costly and bungledprivatization of Ontario Hydro illustratesthe problems that can arise from the hasteof attempting to make political mileageout of privatizing a public service.
22 Canadian Centre for Policy Alternatives
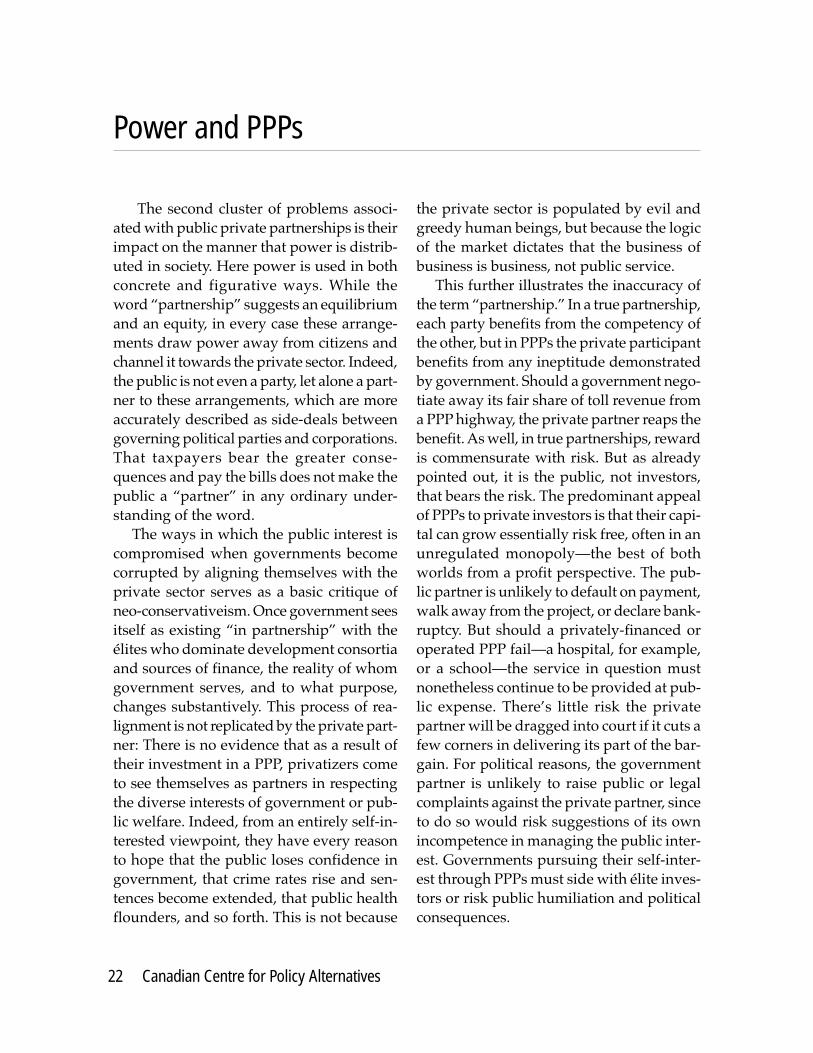
The second cluster of problems associ-ated with public private partnerships is theirimpact on the manner that power is distrib-uted in society. Here power is used in bothconcrete and figurative ways. While theword “partnership” suggests an equilibriumand an equity, in every case these arrange-ments draw power away from citizens andchannel it towards the private sector. Indeed,the public is not even a party, let alone a part-ner to these arrangements, which are moreaccurately described as side-deals betweengoverning political parties and corporations.That taxpayers bear the greater conse-quences and pay the bills does not make thepublic a “partner” in any ordinary under-standing of the word.
The ways in which the public interest iscompromised when governments becomecorrupted by aligning themselves with theprivate sector serves as a basic critique ofneo-conservativeism. Once government seesitself as existing “in partnership” with theélites who dominate development consortiaand sources of finance, the reality of whomgovernment serves, and to what purpose,changes substantively. This process of rea-lignment is not replicated by the private part-ner: There is no evidence that as a result oftheir investment in a PPP, privatizers cometo see themselves as partners in respectingthe diverse interests of government or pub-lic welfare. Indeed, from an entirely self-in-terested viewpoint, they have every reasonto hope that the public loses confidence ingovernment, that crime rates rise and sen-tences become extended, that public healthflounders, and so forth. This is not because
the private sector is populated by evil andgreedy human beings, but because the logicof the market dictates that the business ofbusiness is business, not public service.
This further illustrates the inaccuracy ofthe term “partnership.” In a true partnership,each party benefits from the competency ofthe other, but in PPPs the private participantbenefits from any ineptitude demonstratedby government. Should a government nego-tiate away its fair share of toll revenue froma PPP highway, the private partner reaps thebenefit. As well, in true partnerships, rewardis commensurate with risk. But as alreadypointed out, it is the public, not investors,that bears the risk. The predominant appealof PPPs to private investors is that their capi-tal can grow essentially risk free, often in anunregulated monopoly—the best of bothworlds from a profit perspective. The pub-lic partner is unlikely to default on payment,walk away from the project, or declare bank-ruptcy. But should a privately-financed oroperated PPP fail—a hospital, for example,or a school—the service in question mustnonetheless continue to be provided at pub-lic expense. There’s little risk the privatepartner will be dragged into court if it cuts afew corners in delivering its part of the bar-gain. For political reasons, the governmentpartner is unlikely to raise public or legalcomplaints against the private partner, sinceto do so would risk suggestions of its ownincompetence in managing the public inter-est. Governments pursuing their self-inter-est through PPPs must side with élite inves-tors or risk public humiliation and politicalconsequences.
Power and PPPs

For Cash and Future Considerations 23
The inflated cost of PPPs and the inher-ent shift in power they leverage could beconsidered “structural faults” embedded inPPPs. While conditions in the deals can in-tensify their impact, structural problems bydefinition cannot be eliminated. A thirdstructural fault of PPPs is their distortion ofaccountability. In general terms, within abusiness partnership, in addition to the sepa-rate accountabilities of each partner to itsprincipals and investors, each partner takeson reciprocal obligations to the other.
In a PPP, the private sector partner canbe held accountable for its decisions and per-formance by individual investors or share-holders. As recent headlines attest, this gen-eral exercise may be subject to manipulation,but at least the legitimacy of the principle of“shareholder accountability” is acknowl-edged, and nothing forbids a disgruntledindividual shareholder from selling off hisor her shares. But is there a parallel account-ability that constrains the public partner?While it might be argued that citizens makeup the “shareholder” class that can hold thegovernment accountable for all aspects ofeach PPP, in the real world of citizenship thisis an untenable responsibility. That is, it’sunlikely most citizens have the time or theexpertise to unlock the complexity of suchdeals. CUPE points out that Australia’s Cov-entry Walsgrave Hospital’s PPP contract ranto 17,000 pages.24
Even if specific contracts were made pub-licly available—and typically such docu-ments are withheld as proprietary informa-tion—it is unreasonable to expect the politi-cal opposition, concerned citizens, or inter-
ested groups to monitor these ventures inorder to convey their findings to the public.Government cannot perform as a “thirdparty” representing the interests of citizens,since it is already implicated as a full partyto any deal in question. Opposition partiesmay or may not wish to take on this role; iftheir criticism extends beyond the terms ofa particular deal to challenging the problemsinherent within all PPPs, they may scuttletheir own chance to use PPPs for their ownpolitical purposes should they becomeelected. Even effectively criticizing a par-ticular contract is difficult, since its terms arenot subject to the transparency of public au-dits and freedom of information requests.Without any watchdog, political or statutory,who protects the public interest? In NovaScotia, it was a particular auditor generalwhose report, with media assistance, scut-tled PPP schools. But, by definition, the scopeof concern of an auditor general is financial,while many of the most serious problems thatarise from PPPs extend beyond accounting.
Here the media could be of assistance,and on occasion they have undertaken theirown investigations into the financial, politi-cal and personal connections among partieswith an interest in a particular PPP. On Janu-ary 28, 2003, Paul McKay of The Ottawa Citi-zen reported that
Ontario Health Minister Tony Clement re-ceived political donations last year frompartners in all three private consortiums[sic] short-listed for a pending 60-year dealto build and operate a redeveloped RoyalOttawa Hospital….Members of two con-
Diminished Accountability
24 Canadian Centre for Policy Alternatives
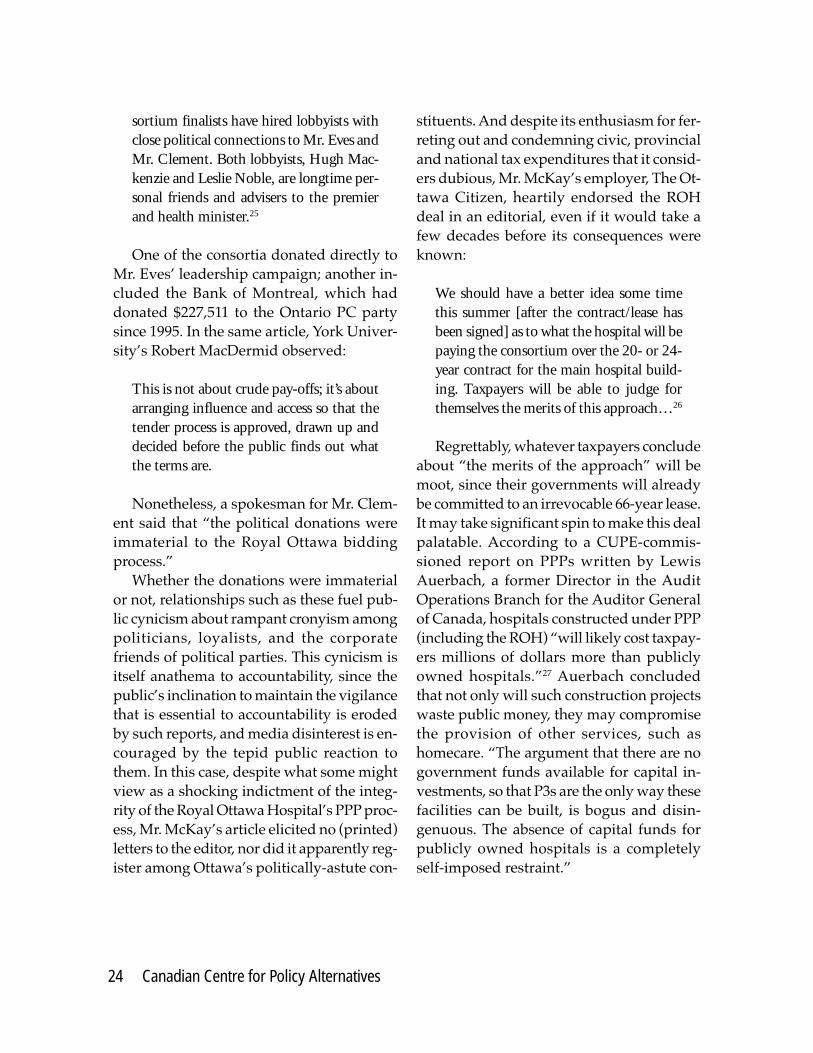
sortium finalists have hired lobbyists withclose political connections to Mr. Eves andMr. Clement. Both lobbyists, Hugh Mac-kenzie and Leslie Noble, are longtime per-sonal friends and advisers to the premierand health minister.25
One of the consortia donated directly toMr. Eves’ leadership campaign; another in-cluded the Bank of Montreal, which haddonated $227,511 to the Ontario PC partysince 1995. In the same article, York Univer-sity’s Robert MacDermid observed:
This is not about crude pay-offs; it’s aboutarranging influence and access so that thetender process is approved, drawn up anddecided before the public finds out whatthe terms are.
Nonetheless, a spokesman for Mr. Clem-ent said that “the political donations wereimmaterial to the Royal Ottawa biddingprocess.”
Whether the donations were immaterialor not, relationships such as these fuel pub-lic cynicism about rampant cronyism amongpoliticians, loyalists, and the corporatefriends of political parties. This cynicism isitself anathema to accountability, since thepublic’s inclination to maintain the vigilancethat is essential to accountability is erodedby such reports, and media disinterest is en-couraged by the tepid public reaction tothem. In this case, despite what some mightview as a shocking indictment of the integ-rity of the Royal Ottawa Hospital’s PPP proc-ess, Mr. McKay’s article elicited no (printed)letters to the editor, nor did it apparently reg-ister among Ottawa’s politically-astute con-
stituents. And despite its enthusiasm for fer-reting out and condemning civic, provincialand national tax expenditures that it consid-ers dubious, Mr. McKay’s employer, The Ot-tawa Citizen, heartily endorsed the ROHdeal in an editorial, even if it would take afew decades before its consequences wereknown:
We should have a better idea some timethis summer [after the contract/lease hasbeen signed] as to what the hospital will bepaying the consortium over the 20- or 24-year contract for the main hospital build-ing. Taxpayers will be able to judge forthemselves the merits of this approach…26
Regrettably, whatever taxpayers concludeabout “the merits of the approach” will bemoot, since their governments will alreadybe committed to an irrevocable 66-year lease.It may take significant spin to make this dealpalatable. According to a CUPE-commis-sioned report on PPPs written by LewisAuerbach, a former Director in the AuditOperations Branch for the Auditor Generalof Canada, hospitals constructed under PPP(including the ROH) “will likely cost taxpay-ers millions of dollars more than publiclyowned hospitals.”27 Auerbach concludedthat not only will such construction projectswaste public money, they may compromisethe provision of other services, such ashomecare. “The argument that there are nogovernment funds available for capital in-vestments, so that P3s are the only way thesefacilities can be built, is bogus and disin-genuous. The absence of capital funds forpublicly owned hospitals is a completelyself-imposed restraint.”

For Cash and Future Considerations 25
It is not surprising that Ontario’s Con-servative government would undertake themost bold PPP initiatives, given its repeatedcommitment to “do away with government”whenever possible. Carving out a larger andless restricted place for the private sector todo business in Ontario has been the Tory’sunabashed intention since 1995. Collapsingand confusing private and public spheres,merging the concepts of “customer” and“citizen” and overturning historic traditionsof government accountability came togetherin locating the delivery of the ill-fated 2003provincial budget on the premises of a Tory-friendly corporation.
But this government’s enthusiasm forPPPs would seem to have as much to do withstrategy as with ideology. As its popularitydeclines, and as the provincial economystumbles through difficult times, the Con-servative government will market itself tovoters as prudent managers of the publicpurse and as tax-cutters who can spend lessbut deliver more. The political advantagesof PPPs, especially the lure of shiny newprojects financed with off-book debt, areparticularly attractive at election time.
Critics can expect to hear a familiar re-frain: We had no alternative. In his capacityas Ontario’s Deputy Premier and FinanceMinister, Jim Flaherty told an enthusiasticaudience attending a 2001 CCPPP confer-ence that “the decade of infrastructure” hadarrived. Mr. Flaherty announced that “theold way to finance everything was throughtax revenues or government borrowing. Thisis no longer feasible. The public purse is notlarge enough to fund both today’s services
and tomorrow’s infrastructure.”28 To main-tain a “competitive economy” and “value formoney,” his government would tap what Mr.Flaherty called the “massive pools of capi-tal” in the private sector. He did not add thatthe public purse would be a very long timepaying down those “massive pools” that heintended to tap.
Mr. Flaherty went on to praise Private Fi-nance Initiatives, as PPPs are known in theU.K. His visit to the Darent Valley Hospitalin Kent, where “the private sector has notonly built the building but is also providingnon-clinical services” confirmed Mr.Flaherty in his view that PPPs “are aboutmore than bricks and mortar.” In the vocabu-lary of PPPs, this phrase locates a venturewell along CCPPP’s continuum of partner-ships and privatization (see Figure 1 page6). Initiatives that “are about more thanbricks and mortar” are about transferring thedelivery of at least some of the associatedservices, and their management, from thepublic to the corporation that has built andowns the facility in question. For example,the private partner to a hospital PPP couldretain the right to operate food services, or(perhaps) establish a private MRI clinic onsite; today the cafeteria and tomorrow hipreplacement surgery. Perhaps a fast foodmall? When the building is privately-owned,the leasing “partner” can end up having verylittle say about what takes place under some-one else’s roof. Predictably, Mr. Flahertyended his speech by assuring his audiencethat PPPs were “non-political, having noth-ing to do with left or right on the politicalspectrum.”
PPPs and the Politics of Ontario

26 Canadian Centre for Policy Alternatives
No one disagreed with him at this event,and too few Ontarians are challenging hisassertion that PPPs are “apolitical.” Few Ca-nadians routinely keep up with the vagar-ies of infrastructure financing in the UK orAustralia; how schools are funded in NovaScotia is not seen as newsworthy in Ontario.The low-key response to PPPs is partly dueto the failure to make connections acrosstypes of privatization as well as across sec-tors and across geography. It is not clear thatpublic reaction to the privatization of High-way 407, the mess caused by privatizing-not-privatizing Ontario Hydro and theWalkerton water tragedy are connected inOntarians minds as problematic ways of pro-viding public services, or merely as a seriesof poor but unrelated judgement calls madeby the same government. If the privatization
connection cannot be established across suchnotorious events, it is almost impossible tobelieve that the public will spontaneouslyconnect them to what’s happening with theRoyal Ottawa Hospital. Nor is it clear that“privatization” is necessarily problematic forOntarians. They do not like the word, but aslong as it is called something else (like part-nership) they are not unduly troubled. Ac-cording to a number of public opinion polls,while the general public is in favour of “pub-lic” services, it is not too concerned if theseare delivered by the private sector, and evenless concerned if these services are receivedin a location owned by the private sector.Canadians are far more anxious about hav-ing high-quality services available in atimely way than they are about their prov-enance.29

For Cash and Future Considerations 27
At a certain point…we don’t have univer-sities any more, but outlying branches ofindustry. Then all the things that societyturns to the university for are lost.30
John Polanyi
To this point the discussion has focusedon the physical infrastructure, that part of“the public space” in its most literal sense.But, this is not the only type of infrastruc-ture that is at risk. Through PPPs, the pri-vate sector is appropriating and exploitinguniversities’ intellectual infrastructure. It isskewing the type of knowledge acquisitionthat is funded, pursued, and valued by fac-ulty, students, and ultimately by society. Asa result, PPPs within the university sectorchange the purposes as well as the practicesof higher education.
Some consider this realignment to be de-sirable as well as inevitable. In 1988, the Sci-ence Council of Canada’s final report pre-dicted “that destiny includes closer univer-sity-industry interaction…It is imperativethat the university’s knowledge be put towork for winning in a world economy.”31
After a decade of orchestrating such asso-ciations, then Industry Minister John Manleytold a university audience:
[L]inkages between business and universi-ties need to be strengthened furtherstill…We want universities to become keyfocal points for economic activity, as wellas research. When researchers tap the com-mercial applications of their findings,knowledge becomes both an input and anoutput of the economy.32
The federal government’s views on post-secondary education have had multiple im-pacts on its form and function. The decisionto cut post-secondary funding as a key todeficit-fighting during the 1990s providedmuch of the economic context to which uni-versities in all provinces had to adapt. Yet,two previous ministers of finance, both ofwhom were instrumental in creating andmaintaining the current inadequate financialcontext in Canadian post-secondary educa-tion, were jockeying to position themselvesas “the education candidate” in the federalLiberal leadership race. Consecutive Liberalgovernments have disproportionately pun-ished post-secondary education during thedeficit years, and failed to allocate moniesin the surplus budgets to keep pace with realexpenses.
Despite expressed worries of a “braindrain” and the need to be competitive in theknowledge economy, between 1995 and2000, while American post-secondary insti-tutions received 32% more public funding,their Canadian counterparts absorbed a de-crease of 7.5% Yet, with a straight face,former finance minister and the author of themany cuts to universities, Paul Martin hasattempted to position himself in the race tobecome prime minister as the proponent ofa post-secondary system marked by equity,access, and affordability. According to Mar-tin, cutting money and resources from oureducation system is the “most counterpro-ductive thing” any government cando…”there’s no excuse for the kinds of cut-backs we’ve seen in education in Canada.”33
The Intellectual Infrastructure

28 Canadian Centre for Policy Alternatives
Mr. Manley, the current Minister of Fi-nance, was only superficially more generoustowards post-secondary education than Mr.Martin had been. The 2003 federal budgetwas sold as "good news for education," butby cutting federal cash transfers to the prov-inces, it further squeezed the operating budg-ets of post-secondary institutions. Accordingto CAUT, the reallocation that will be imple-mented in 2004 will enrich healthcare spend-ing, but funding available for post-second-ary education will fall from $2.8 billion in2003-04 to just $1.8 billion in 2004-05. Depart-ment of Finance records demonstrate howmany federal PSE expenditures are increas-ingly geared toward tax credits (for tuitionand education credits and student loan in-terest) rather than making the entire systemmore accessible and fiscally sound throughadequate tax-based funding.34
In addition, the much-promoted Regis-tered Education Savings Plan (RESP) is an-other means by which public funding is re-placed by targeted grants geared towardsindividual investors. The Canada EducationSavings Grant (CESG), the Federal contribu-tion to the RESP program, represented $412million in 2001-02 (projected) and $528 mil-lion in 2002-03 (projected) in lost revenueand expenditure, combined; a substantialamount of money that could have been allo-cated to making the entire education systemmore financially stable, rather than benefit-ing individual investors.35
When campaigning among students andparents, the Liberal government can becounted on to draw attention to “innova-tions” such as RESP and CESG, and to at-tempt to use these programs as evidence ofits commitment to post-secondary educationand its effort to make it more affordable. Butlike RRSPs, RESPs are of value only to thosewho have money available to invest. Kevin
Milligan, writing for the conservative C.D.Howe Institute, concluded that “RESP’s doa good thing but in a needlessly complicatedway, while CESGs give scarce public fundsto the wrong households”36 Indeed, accord-ing to Statistics Canada, in 1998 studentsfrom families in the highest income quartilewere 2.5 times more likely to attend univer-sity as those in the lowest income quartile.In 2001, less that half the young adults fromlow income families were participating inpost secondary education of any kind, al-though their families’ tax burdens helped tounderwrite this transfer of income from thepoor to the rich. 37
But the 2003 budget also signalled an in-tensified federal commitment to the “strate-gic” targeting of public dollars. The “new”money will be aimed at research, not opera-tions. The budget speech strongly hinted thatthe annual allocation of $225 million, begin-ning in 2003-04, may well be tied to perform-ance indicators that reward the commerciali-zation of university research.38
This is consistent with the government’sviews of post-secondary education. The fed-eral government released two white papersin February, 2002, that proposed targets andgoals for improving Canada’s innovationperformance. Achieving Excellence: Investingin People, Knowledge and Opportunity, pro-duced by Industry Canada, focuses on in-novation and research while Knowledge Mat-ters: Skills and Learning for Canadians ad-dresses the issues of skills and education.39
The papers suggest that in return for greatercommercialization efforts, individual uni-versities would receive a “long-term govern-ment commitment to their knowledge infra-structure.”
There are many who believe that squeez-ing the university sector for cash was less aresponse to budgetary pressures than to cre-

For Cash and Future Considerations 29
ating a climate in which universities wouldbe forced to make compromises, especiallywith the private sector, that would neverhave been tolerated under other conditions.Even provinces, or individual institutions,which reject the privatization of universities
and the commercialization of their activitiesmust operate within the context set by thefederal government. Some provinces (anduniversities), however, more than welcomethis reinforcement of their vision of post-sec-ondary education, both in practical and ideo-logical terms.

30 Canadian Centre for Policy Alternatives
University entry grade hits 85% or higher The Ottawa Citizen, April 16, 2003.40
The Statistics Canada report showed that,nationally, the fraction of university edu-cation paid for by the public fell from 81%in 1986 to 55 % last year….Ontario andNova Scotia have most enthusiasticallyembraced university finance restructuring,with government grants and contracts ac-counting for as little as … 47.8 % in On-tario.
The Ottawa Citizen, June 12, 200341
A number of factors influencing Ontario’suniversities have made conditions ripe forthe proliferation of PPPs in this sector.
The “double cohort,” created by the si-multaneous graduation of Grade 12 andOAC students in June 2003, constituted thelargest increase in first-year students sincethe baby boom years, and its impact will befelt for years to come. Whether every quali-fied student will find a place in Ontario’spost-secondary system remains to be seen,but this goal can only be accomplished if theinstitutions involved find ways to cope withextraordinary levels of organizational stress.
Especially when added to the probabil-ity of post-secondary participation rates in-creasing over the next decade, the doublecohort will almost certainly keep Ontario’shigher education system “bursting at theseams.”42 By 2005-06, the projected univer-sity enrolment is 30% greater than enrolmentin 2001-02. By 2015, the high school gradua-tion year for 2002’s grade one students, thereare expected to be 100,000 more students at
Ontario’s universities than in 2001. AsRosenfeld and Kaufman point out, this is theequivalent of “two University of Torontos.”43
Anxiety is not limited to the ivory tower.From the dinner table to the boardroom tothe back room, concerns about a gap be-tween what the public and private sectorswant from their universities, and what gov-ernments are willing and or able to provide,are taking on a new intensity.
When the retirement bulge and the en-rolment bulge coincide, a system strugglingto maintain quality despite already increas-ing student-faculty ratios will be put undereven greater pressure. At 22:1, Ontario’s ra-tio of students to faculty (both FTE) has in-creased significantly from 18:1 in 1991, andit is significantly higher than the 19:1 aver-age ratio found in other provinces. Both Ca-nadian and Ontario ratios compare very un-favourably with those of American institu-tions, where it is typically 30% lower.44 TheCouncil of Ontario universities projects theneed for 11,000—13,000 new and additionalfaculty by the end of the decade, but atpresent the provincial government antici-pates hiring just 4000 new faculty by 2005-06.
Too many students, too few faculty; de-teriorating infrastructure; a sector facingcompetition from other provinces, especiallyin high-demand programs. The future foruniversities looks pretty bleak, especiallywhen operating grants, both per capita andper student, place Ontario at the bottom ofall the provinces.
Despite being Canada’s richest province,Ontario spends 24% less than the national
PPPs and the Ontario University Sector

For Cash and Future Considerations 31
average on operating grants,45 and studentshave been expected to make up the differ-ence. In 1995-96, when the Conservativesformed the government, tuition fees madeup just 29% of operating revenues. Five yearslater, this had increased to 41%. Mackenzieand Rosenfeld calculate that once enrolmentgrowth and inflation are factored in, tuitionand fees had increased, in inflation adjusteddollars, by 69% during this period.46
In June 2002, the Ontario governmentpromised to “fully fund” every new student,to restore $70 million in operating grants andto make an additional $6 million availablefor Northern universities. The governmenthas committed $295 million to cover the en-rolment growth spiked by the double cohort,an announcement that was welcome, evenif the government’s calculations seem dubi-ous. Indeed most of the “new spaces” hadbeen announced, and re-announced.47 AsOCUFA (The Ontario Confederation of Uni-versity Faculty Associations) points out,there have been large and consistent gapsbetween the Ministry’s conservative enrol-ment projections and reality.
Nor does “fully” funding new studentsdeal adequately with the accumulated short-fall of $400 million in operating funds (1995-2002),48 nor the estimated $1.2 billion in de-ferred university maintenance costs ex-pected by 2005-06. Ontario’s parsimony isparticularly remarkable when its per-studentPSE expenditures are compared with theother provinces. In 2001-02, while NovaScotia and New Brunswick managed tospend slightly less per full-time universitystudent than Ontario’s $6831, five provincesspent more than $10,000, including conserva-tively-inclined Alberta at $10,932. Saskatch-ewan ($14,786) and Manitoba ($14,936), withfar less claim to wealth, have more than dou-
bled Ontario’s annual commitment to thepost-secondary education of each student.49
Predictably, university administratorshave decried their straightened circum-stances. It should be noted that, at least withrespect to the 11 largest Ontario universities,funding decreases were not absorbed withinuniversity operating budgets, but passed onto students through increased tuition. Mac-kenzie and Rosenfeld conclude that between1995-96 and 2000-01, these universities ac-tually raised $100 million more in tuition andfees than they lost in provincial grants.50
Passing costs on to students is not just aneconomic strategy; it signifies a capitulationto neo-conservative ideas of education thatemphasize personal and economic impactsover public and social contribution. Statis-tics Canada describes the dependence on“user-pay” financing as “a shift in philoso-phy.”51
Students have been recast as “users” ofthe post-secondary system, and as such theycan expect to pay user fees. Between 1993-94 and 2002-03, the average tuition at On-tario universities increased by 123%52; withinderegulated programs (such as medicine)students can expect to pay as much as$14,000 per year. Pundits claim that the gov-ernment considered deregulating tuitionentirely, but (during this mandate, at least)it “compromised” by continuing to squeezepublic universities while giving private uni-versities a provincial toe-hold.53 In a furthersleight of hand, Ontario’s universities are re-quired to set aside 30% of each tuition feeincrease for student assistance, making stu-dents themselves the primary source offunding for each other’s grants and bursa-ries, which are rapidly becoming an institu-tional rather than a governmental responsi-bility. Altering the eligibility criteria for theOntario Student Assistance Program (OSAP)

32 Canadian Centre for Policy Alternatives
resulted in a 42% decline in the government’sfunding of Ontario Student Loans between1997-98 and 2001-02. The $330 million(amount corrected for inflation) pulled out
of the system by 2001-02 resulted in a 27%decline in the number of student loan recipi-ents and an increase in average debt load:$22,000 for a four-year BA.54

For Cash and Future Considerations 33
The Ontario government’s decrease inpublic funding is particularly revealingwhen we look at the resultant increase inprivate revenues excluding tuition fees --which are among the highest in the country.The following chart demonstrates total rev-enues (all funds) by source: bequests, dona-tions, and non-government grants and con-tracts since 1986-87. While all have increased,revenues from corporate business far
outpace other types of private revenuesources at Ontario universities.
It is within this context of increased pri-vate funding (all kinds, all sources) that spe-cific provincial programs have been estab-lished, promoting and reinforcing infrastruc-ture and intellectual privatization. A numberof these initiatives are examined in the fol-lowing section of this report.
Higher Learning Inc.
Total Private Revenues for All Ontario Universities
0
50000
100000
150000
200000
250000
300000
350000
400000
1987 1988 1989 1990 1991 1992 1993 1994 1995 1996 1997 1998 1999 2000 2001
fiscal years ending
co
ns
tan
t 2
00
1 $
(m
illi
on
s)
IndividualsCorporate BusinessFoundationsNon-profits
400
350
300
250
200
150
100
50
Figure 2Total Private Revenues for All Ontario Universities
In c
onsta
nt
2001 d
olla
rs (
mill
ions)
Fiscal year ending

34 Canadian Centre for Policy Alternatives
Since its election in 1995, the Conserva-tive government has promoted the gradualprivatization of the university sector, primar-ily through private-public partnerships thatwear the labels of a variety of governmentprograms. The approach has been system-atic and comprehensive, demonstrating thegovernment’s commitment to partnershipsas a core business strategy for the province.Some programs have focused on the physi-cal infrastructure, others on the intellectualactivities of the university; still others focuson access and research.55 While the programsmay appear to be designed with differentobjectives, together they have a multipliereffect that intensifies the sense of the univer-sity as an instrument of the private sector.The four key provincial programs are de-scribed below.
Ontario Research and DevelopmentChallenge Fund (ORDCF)
In 1997, the Ontario Research and Devel-opment Challenge Fund (ORDCF) becamethe first PPP-enabler introduced by the Con-servative government. ORDCF allocatespublic money for research to universitiesonly after they find private sector businesspartners whose interests coincide with theresearch to be funded. In return for their in-volvement, “partnering” corporations re-ceive tax incentives commensurate withtheir investment.56
ORDCF investment decisions are madeby its eleven-member board of directors,which includes representatives of CanadianMedical Discoveries Fund, RBC Dominion
Securities, WaveNET, COMDEV, the GoekenGroup, Geometrica, Ontario Agri-Food Tech-nologies, Aero-Safe Technologies, ResearchIn Motion, and Stantive Solutions. (The genepool from which these corporations emergewould suggest that high-tech and bio-techare the only types of research still being con-ducted in Ontario.) Two other board mem-bers are the CEOs of crown corporations thatare involved in PPPs: David Lindsay, CEOof the SuperBuild Corporation and MichaelGourley, CEO of the Ontario Financing Au-thority. The only board member whose pri-mary allegiance could be assumed to be theuniversity sector is Dr. Desmond D.Anthony, a retired associate professor of bio-logical and environmental sciences atNipissing University. Board membership hasits privileges: on at least two occasions, in aflagrant conflict of interest, the ORDCF hasapproved giving money to companies rep-resented on the ORDCF board.57
According to its website, this fund is in-tended to promote research excellence byincreasing the R&D capacity of Ontario uni-versities and other research institutionsthrough partnerships. The ORDCF is asso-ciated with four ministries: (Enterprise, Op-portunity, and Innovation; Training, Col-leges, and Universities; Finance; and Agri-culture and Food). Unlike other research ini-tiatives that focus on project funding or in-frastructure, ORDCF focuses on human re-sources:
If Ontario is to continue taking advantageof the economic growth that stems fromapplying innovation, we must first make
Privatizing the Ontario University Sector Via PPPs

For Cash and Future Considerations 35
sure that our best and brightest scientists,researchers and technicians remain in ourprovince, and second, we must attract othertop researchers to make their home here.58
This first part of the assertion is not par-ticularly argumentative, but the contentionthat keeping and attracting “the best and thebrightest’ is a function of rewarding “realcommitted partnership between businessand universities, colleges, hospitals andother research institutions” is left hanging.Nonetheless, proof of a “real committedpartnership” could result in receiving a shareof this $750 million fund.
According to ORDCF’s 2001 annual re-port, the total value of all projects (1998-2001)was $1.5 billion; ORDCF’s investment overthat period was $435 million. Funding pri-
orities are geared towards certain industries:geonomics, bio-medicine, imaging, science,telecommunication, engineering andprotemics received most of the funding ($1.14billion) compared to a total of $373.7 millionfor IT, photonics, transportation, e-com-merce, environment, business, social science,geophysics and mining technology. Ministerof EOI Jim Flaherty’s explanation of the fund-ing preferences is that “these are complexareas that ultimately have a profound impacton our quality of life and standard of living.”
A breakdown of ORDCF funding indi-cates which universities benefit most (or notat all) from this fund. While the majority ofOntario universities received ORDCF fund-ing (at various levels) in 2001-02, Brock,Lakehead, Nipissing , Ryerson, Trent, WilfridLaurier, and York received nothing.
University 2001/02 ORDCF funding(expressed in $1000)
ORDCF funding as apercentage of provincial
funding
ORDCF funding ($) perFull-Time Equivalent
student
Carleton 905 17.08 62.40
Guelph 660 1.29 47.64
Laurentian 731 26.14 134.42
McMaster 2491 16.39 163.67
Ottawa 12299 49.00 609.60
Queen’s 7087 23.58 473.21
Toronto 13347 22.35 292.00
Waterloo 992 5.98 55.64
Western 5052 22.64 201.82
Windsor 275 7.06 25.05
Ontario Research and Development Challenge Fund (ORDCF) as a Percentage of
Total Provincially Sponsored Research Funding and Per Full-Time Equivalent (FTE)
Table 1

36 Canadian Centre for Policy Alternatives
Access to Opportunities Fund (ATOP)
The University of Windsor [has] intro-duced an automotive engineering optionin mechanical engineering which was de-signed to “assist in the development of theautomotive industry by providing gradu-ate engineers with the specialized skills andknowledge base needed by this sector.”Heads of industry are given seats on bodieslike the board of governors in order to en-sure that universities are properly trainingstudents….Tuition in engineering has in-creased 21% since 1999, the year that au-tomotive engineering stream was intro-duced at the University of Windsor.59
University of WindsorStudents’ Alliance
In 1998, the Access to Opportunities Fund(ATOP) became the second “family” of post-secondary PPPs. According to the govern-ment’s website, on February 1st, 1998, JohnRoth, vice-chairman and CEO of Nortel,wrote to the premier outlining the need forthe province’s post-secondary institutions toincrease their capacity to graduate studentsin disciplines of communication and infor-mation technology, computer scientists, elec-trical and computer engineers, physicists,mathematicians, and other professions. (Per-haps Mr. Roth was still riding high on thesuccess of Nortel, and his then recent acco-lade as “Businessman of the Year.” He hadrecently informed the federal governmentthat unless his sector saw significant tax con-cessions, he would move his company to theU.S. where he claimed many of his key staffhad already defected.60 His higher taxes-equals-brain drain argument was coveredwidely by the media, although there was lit-
tle mention of Mr. Roth’s 1998 salary:$682,783, a bonus of $2,261,248 and stockoptions worth $40 million—at the time.)61
On February 18, 1998, the high-tech lobbycalled The Canadian Advanced TechnologyAlliance (CATA) “challenged the Ontariogovernment to work with industry to ‘Dou-ble the Pipeline’ of IT professional workersby increasing enrolment at colleges and uni-versities.”62 On May 5th, 1998, Ontario’s min-ister of finance obligingly introduced ATOPand committed $150 million to the creationof 17,000 new student spaces in Ontario uni-versities for computer science and engineer-ing.
To obtain access to ATOP money, how-ever, the universities had to match “dollar-for-dollar” the amount of money they re-quested with money from the private sec-tor. Private sector contributions could be inthe form of cash, new or used equipment,software, or work-terms for students. In ef-fect, the private “partners” determined howmuch government funding would be allo-cated to each university. An advisory ATOPboard representing companies that wouldbenefit from more graduates in this area wasalso appointed, with then-Nortel CEO JohnRoth, serving as its chair.63 In July 1999, theOntario government announced that itwould expand the target of ATOP to 23,000new student spaces in engineering and com-puter science and increase its funding to theprogram by $78 million.64 In effect, the high-tech corporate lobby has been put in chargeof using public resources to train its futureworkforce, to increase its supply of labour,and to enhance profits.
This sector is not shy about this PPP wind-fall. Joanne Curry, of TeleLearning Solution,Inc. reports that benefits to the high-tech sec-

For Cash and Future Considerations 37
tor include their access to “new” (i.e. pub-lic) financial resources to underwrite re-search and bankroll its commercialization.But she claims that universities gain as well,since they have direct access to corporateopinions on “the knowledge and skillsneeded by employers for program gradu-ates.” And instructors can enjoy the “reuseof [the partner’s] training content.” Curryconcludes, universities gain status by“develop[ing] a more recognizable brandthat can be marketed through the partnerand identify new opportunities foroutsourcing.”65
Ontario Innovation Trust (OIT)In 1999, the Ontario government an-
nounced the creation of Ontario InnovationTrust (OIT). Its initial funding of $250 mil-lion had grown to $1 billion by the 2003budget.66 OIT funds are designed to bemerged with funds provided by the federalgovernment’s Canadian Foundation for In-novation (CFI).67 The purpose of both CFIand OIT is to invest in the “research infra-structure” of not-for-profit institutions in-cluding universities, hospitals, colleges, andresearch institutes. In the case of Ontariouniversities, OIT and CFI provide 40% of thecost of any project, while the host universityhas to make up the balance, either from itsown budget or, as is usually the case, throughtapping one or more private sector partners.
The OIT is directed toward the infrastruc-ture needed to support R&D in the scienceand technology sector, and thus it “comple-ments” the human resource focus of ORDCF.Since 1999, more than $1 billion has been al-located to the fund. According to its website,R&D projects that directly encourage col-laboration with the private sector are morelikely to be considered favourably, alongwith “your ability to capitalize on the invest-
ment, the ownership and use of the infra-structure, your project’s sustainability, andthe cost/benefit relationship.”68
Investing in Ontario’s Future ThroughResearch (1999-2001) reports that OIT trustinvestments of $362.4 million over this three-year period “leveraged” over $531 millionfrom other sources. A total of $893.4 millionfunded 294 projects in 16 universities, 6 col-leges, 10 hospitals, and 300 industry “part-ners.” OIT, which operates ostensibly at an“arm’s length” relationship from govern-ment, boasts that it announces its major in-vestments to the public so that citizens willknow “how Ontario tax dollars are beingused to their ultimate benefit.” Notably, OITis under no obligation to disclose the amountof private sector contributions that“leveraged” these tax dollars. The very struc-ture of the OIT exempts it from having todisclose fully the sources and amounts ofprivate funding, even though this researchis conducted in public institutions.
OIT’s research priorities closely resembleSuperBuild’s infrastructure priorities (Table2). While 55.2% of investment has been allo-cated to health sciences and 37.5% to natu-ral sciences and engineering, only 6.7% wentto multidisciplinary studies, 0.6% to humani-ties and social sciences, and 0.05% to arts andletters. The broadly defined social sciencesmay make up more than 33% of total uni-versity enrolment across Ontario, comparedwith 9.2% enrolled in engineering and ap-plied sciences, 6% in health professions andoccupations, 7.7% in mathematics and physi-cal sciences and 6% in agriculture and bio-logical sciences.69 OIT research money is evi-dently not representative of enrolment. Infact, disciplines representing 33% of all stu-dents received less than one percent of OITfunding. Only marketable research withimmediate commercial applications and

38 Canadian Centre for Policy Alternatives
clear ties to corporate dollars appears to ben-efit in any significant way from OIT fund-ing, leaving the vast majority of universitystudents in underfunded areas of study. (SeeAppendix 2: Statscan research about enrol-ment by field of study)
Nor is OIT funding equitably sharedacross institutions. Among those institutionreceiving OIT funding in 2001-02, the “per-student” average varies from the price of apizza to 25% of a year’s tuition fees. Notethat Brock, McMaster, Nipissing, andRyerson receive no OIT money.
Ontario Centres of Excellence (OCE)The Ontario Centres of Excellence, estab-
lished in 1987, have become important PPPvehicles. To date, four Centres have beenestablished:• Communications and Information Tech-
nology Ontario (CITO)• The Centre for Research in Earth and
Space Technology (CRESTech)• Materials and Manufacturing Ontario
(MMO)• Photonics Research Ontario (PRO)
University 2001/02 OIT funding(expressed in $1000)
OIT funding as apercentage of
provincial funding
OIT funding ($)per Full-Time
Equivalent student
Carleton 2080 39.26 143.43
Guelph 4961 9.73 358.12
Lakehead 1092 40.22 200.24
Laurentian 715 25.57 131.48
Ottawa 1459 5.81 72.31
Queen’s 14511 48.28 968.92
Toronto 29094 35.49 636.51
Trent 928 46.46 205.54
Waterloo 6528 39.39 366.20
Western 4271 19.14 170.62
Wilfrid Laurier 124 48.06 13.47
Windsor 1036 26.59 94.36
York 3072 77.98 100.62
Table 2Ontario Innovation Trust(OIT) as a Percentage of Total Provincially Sponsored
Research Funding and Per Full-Time Equivalent (FTE) Student

For Cash and Future Considerations 39
The OCE website claims that the centrespromote “the economic development of On-tario through directed research, commer-cialization of technology, and training forhighly qualified personnel.”70 Within theweb of federal and provincial programs thatdirectly or indirectly facilitate PPPs and thecommercialization of research, Ontario Cen-tres of Excellence are probably the least self-conscious about this agenda. Not surpris-ingly, their focus is high-tech, a business sec-tor that expects to be treated with deference,and one that is rarely disappointed:
The Centres are among the few publiclyfunded institutions that systematically in-tegrate and manage connections from uni-versity to marketplace to ensure the success-ful application of innovative science and tech-nology to profitable new businesses…[T]heinnovation challenge involves defining andfunding research projects with the potentialfor commercialization, managing them to thepoint of market-ready products, and defin-ing and negotiating license agreements/con-tracts with industry partners that can deploythe technology.71
The Ontario Centres of Excellence definethis final phase of the innovation process as“technology transfer from universities to themarketplace,” a process which fosters ahealthy and attractive business environmentand, consequently, keeps Ontario vital.” Inother words, innovation requires commer-cialization. If research does not containwithin it the potential of immediate marketapplication, it is not only not innovative, butconceivably does not “assist in job creationand economic growth.” Some OCE-fundedresearch illustrates its close ties with mar-ketability: The University of Western Ontario(through Materials and Manufacturing On-
tario), in cooperation with Pine Tree LawEnforcement Products of Canada, “has de-veloped a rubber bullet better designed totake down a police or military target with-out causing fatalities.”72
SuperBuildHaving tasted the first fruits of PPPs in
1997 and 1998, the Ontario government wasprepared to launch its most ambitious pro-gram to broker partnerships. The SuperBuildprogram, announced in the 1999 Ontarioprovincial budget, became the OntarioSuperBuild Corporation (OSBC) in Decem-ber 1999. The government calls OSBC its“central agency for capital planning and in-vestment.”73 For the first time, all provincialinfrastructure policy, investment and capi-tal decisions were to be consolidated withinone super-agency.
The OSBC is controlled by the CabinetCommittee on Privatization and SuperBuild(a surprisingly frank “partnership” of portfo-lios), and is chaired by Finance Minister JanetEcker. The committee reports directly to thewhole cabinet, and is advised by a 12 mem-ber board. Board members include the presi-dents of corporations including TD Bank,Coldwell-Banker Real Estate, McLeod Capi-tal Corporation, BankWorks Trading, Con-sumers Gas Company, and Bell Canada—along with a couple of deputy ministers. TheSuperBuild program is intended to spend $10billion on capital infrastructure (highways,health care, water filtration, prisons, and post-secondary education) over five years, to bematched with another $10 billion in privatesector funding.74 For universities to make useof SuperBuild funds for infrastructureprojects, they must first have commitmentsfrom a private partner or another “source” inorder to meet SuperBuild eligibility guide-lines.

40 Canadian Centre for Policy Alternatives
SuperBuild Projects in Ontario’sUniversity Sector
The SuperBuild program has resulted in22 projects in the Ontario university sectorsince 1999. (See Appendix 3 for an itemizedlist) The following chart illustrates the sourceof funding associated with these projects.
The SuperBuild program itself has fur-nished approximately 46% of the funding forthese 22 projects, while the private sectorcontributed approximately 23%. The remain-ing 31% came from a variety of sources. Theinstitutions themselves provided 12% of thefunding from their own revenues, whichwould have been comprised of both tuitionand endowment revenue. Overall, univer-sities were able to obtain another 8.6% oftheir budgets from a combination of provin-
cial government program money: ORDCF,OIT, or ATOP. Finally, universities foundanother 6.4% from federal governmentsources through CFI and direct federal trans-fers, and 3.2% from municipal governments.
Table 3 illustrates how the SuperBuildand private sector monies were invested,compared with the percentage of all studentsenrolled in each discipline.
When non-SuperBuild, non private-sec-tor spending on these infrastructure projectsis examined, a similar distortion in the pro-portion of spending allocated to each disci-pline is evident. “Marketable” programs ofstudies are being favoured consistently overthose areas less profitable to the private sec-tor, even though these programs contain alarge proportion of all students.
SuperBuild
Private
Tuition & Endowments
ORDCF, OIT, & ATOP
CFI & Federal Transfers
Municipal Government
Figure 3Breakdown of SuperBuild Funding in Ontario Since 1999
47%
23%
12%
5%
4%
4%
3%2%
SuperBuild Program
Private Sector
Institution
ORDCF/OIT
CFI
ATOP
Municipal
Federal Transfers

For Cash and Future Considerations 41
SuperBuild and Infrastructural In-equality
When the private sector becomes in-volved in funding universities, it is to be ex-pected that the bulk of the money they con-trol will be dedicated to programs of studyproviding the greatest strategic value to thissector. When disciplines compete directlywith each other for private sector funding,engineering, computer science, and businesswill win out over fine arts, humanities, edu-cation, and social sciences programs.
As Table 3 illustrates, the SuperBuild pro-gram has leveraged a dramatic increase inthe amount of construction at Ontario uni-versities dedicated to engineering, compu-ter science, business, natural sciences, andhealth sciences. These categories account fora 79% share of funding that the governmentallotted to the SuperBuild programs, and afull 87% of private sector funding, even
though these disciplines enrol only 42% ofall students. The degree of distortion is quiteremarkable: Education, social sciences andhumanities received only 5% of governmentand 3% of private sector SuperBuild fund-ing, even though they enrol 49% of all stu-dents.76 Even though arts and humanitiesstudents make up 40% of the student popu-lation, and therefore account for roughly 40%of tuition fees, Ontario universities devoteonly 0.3% of their contribution to SuperBuildprojects on these subject areas. The 15% ofgovernment and 10% of private SuperBuildfunding allocated to “multipurpose” projectswill hardly make up for the two-tiered lookof Ontario’s university campuses.
When the Ontario government mandatedprivate sector involvement throughSuperBuild, it condemned certain programsto “infrastructural inequality.” There is nocounterbalancing program (or apparent in-clination) to offset the evident unattractive-
Table 3Percentage of SuperBuild and Private Sector Funding, By Subject Area,
Compared to Enrolment75
Projects by discipline/subject area
Allocation ofSuperBuild funds
Allocation of privatesector funds
Student enrolment in1999-2000 by
discipline/subject area
Engineering, Computerscience and Business
51% 62% 24%
Multipurpose 15% 10% ---
Natural and HealthSciences
28% 25% 18%
Humanities and SocialSciences
3% 0.8% 40%
Fine Arts 2% 1.8% 3%
Education 0% 0% 9%
Library 0.14% 0.19% ---

42 Canadian Centre for Policy Alternatives
ness of education, humanities, and social sci-ences to the private sector. The private sec-tor may not be investing all the money, butthe SuperBuild scheme gives it control of allinfrastructure decision-making and priority-setting on campus, along with defacto con-trol over how federal, provincial, and mu-nicipal funds are allocated—and even howstudent tuition fees are spent. This takeoverof the functions of setting public policy bydemocratically-elected and accountable of-ficials has consequences well beyond the uni-versity sector. It exemplifies how one of PPPskey “structural faults”—the breakdown ofaccountability—operates in practice.
Public Finances and SuperBuildPartnerships
A private-sector partner expects that thefinancial return of the project will reflectthe level of risk and effort. This includesconsideration of: market demand, pricingrisk, revenue risk, capital costs, operatingrisk, financing costs, legislative risk, andother factors affecting financial perform-ance of a business. In general, the privatesector’s primary motive in any venture isto earn a return commensurate with therisks it undertakes and its performance onthe project.
From the guidelines for SuperBuild77
Table 4Percentage of Institutional, ORDCF/OIT, ATOP, Municipal, and Federal
Funding By Discipline/Subject Area Compared to Enrolment
Project areas bysubject area
Institutionalfunding
ORDCF/OIT
funding
CFIfunding
ATOPfunding
Municipalfunding
Directfederal
transfers
Enrolment in1999-2000by subject
area
Engineering,Computer science,and Business
65% 27% 15% 97% 18% 13% 24%
Multipurpose 12% 9% 11% 0% 35% 0% ---
Natural and HealthSciences
20% 62% 76% 1% 28% 87% 18%
Humanities andSocial sciences
0.3% 0.8% 0% 1% 0% 0% 40%
Fine Arts 2% 0% 0% 0% 18% 0% 3%
Education 0% 0% 0% 0% 0% 0% 9%
Library 0% 0.19% 0% 1% 0% 0% ---
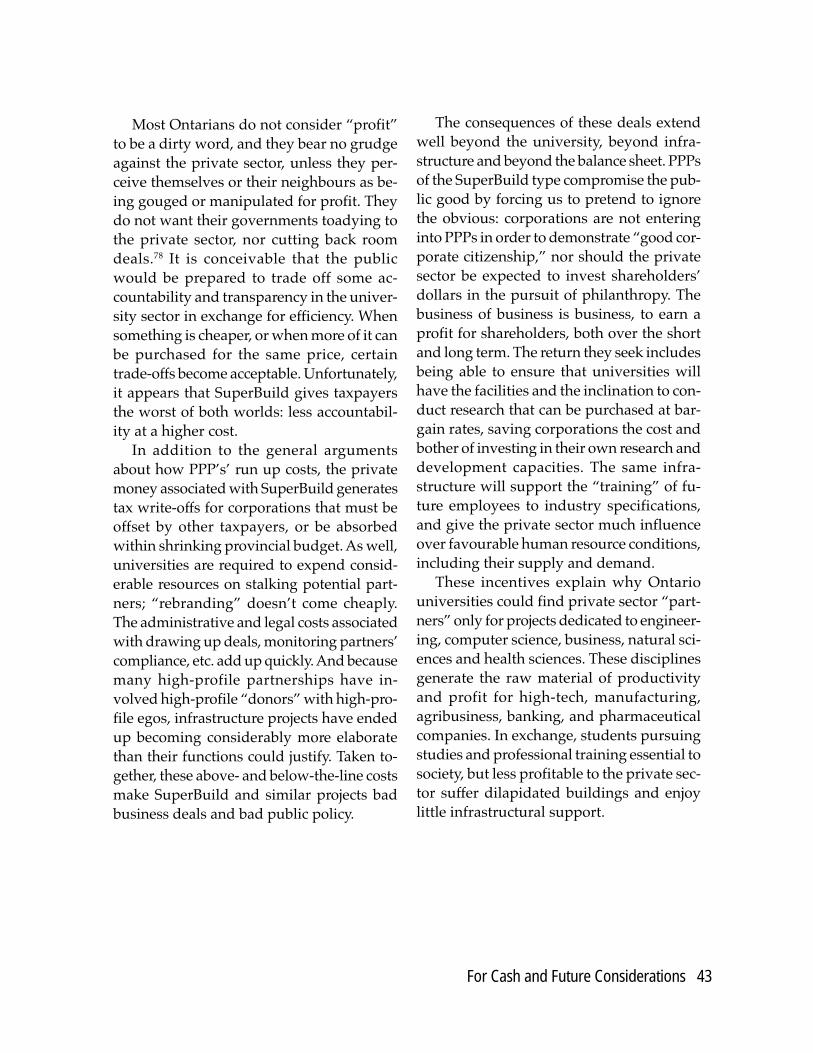
For Cash and Future Considerations 43
Most Ontarians do not consider “profit”to be a dirty word, and they bear no grudgeagainst the private sector, unless they per-ceive themselves or their neighbours as be-ing gouged or manipulated for profit. Theydo not want their governments toadying tothe private sector, nor cutting back roomdeals.78 It is conceivable that the publicwould be prepared to trade off some ac-countability and transparency in the univer-sity sector in exchange for efficiency. Whensomething is cheaper, or when more of it canbe purchased for the same price, certaintrade-offs become acceptable. Unfortunately,it appears that SuperBuild gives taxpayersthe worst of both worlds: less accountabil-ity at a higher cost.
In addition to the general argumentsabout how PPP’s’ run up costs, the privatemoney associated with SuperBuild generatestax write-offs for corporations that must beoffset by other taxpayers, or be absorbedwithin shrinking provincial budget. As well,universities are required to expend consid-erable resources on stalking potential part-ners; “rebranding” doesn’t come cheaply.The administrative and legal costs associatedwith drawing up deals, monitoring partners’compliance, etc. add up quickly. And becausemany high-profile partnerships have in-volved high-profile “donors” with high-pro-file egos, infrastructure projects have endedup becoming considerably more elaboratethan their functions could justify. Taken to-gether, these above- and below-the-line costsmake SuperBuild and similar projects badbusiness deals and bad public policy.
The consequences of these deals extendwell beyond the university, beyond infra-structure and beyond the balance sheet. PPPsof the SuperBuild type compromise the pub-lic good by forcing us to pretend to ignorethe obvious: corporations are not enteringinto PPPs in order to demonstrate “good cor-porate citizenship,” nor should the privatesector be expected to invest shareholders’dollars in the pursuit of philanthropy. Thebusiness of business is business, to earn aprofit for shareholders, both over the shortand long term. The return they seek includesbeing able to ensure that universities willhave the facilities and the inclination to con-duct research that can be purchased at bar-gain rates, saving corporations the cost andbother of investing in their own research anddevelopment capacities. The same infra-structure will support the “training” of fu-ture employees to industry specifications,and give the private sector much influenceover favourable human resource conditions,including their supply and demand.
These incentives explain why Ontariouniversities could find private sector “part-ners” only for projects dedicated to engineer-ing, computer science, business, natural sci-ences and health sciences. These disciplinesgenerate the raw material of productivityand profit for high-tech, manufacturing,agribusiness, banking, and pharmaceuticalcompanies. In exchange, students pursuingstudies and professional training essential tosociety, but less profitable to the private sec-tor suffer dilapidated buildings and enjoylittle infrastructural support.

44 Canadian Centre for Policy Alternatives
The gradual privatization of Ontario’suniversity system has been directed and con-trolled by a corporate-friendly cabinet, a fewlike-minded bureaucrats and the CEOs ofOntario’s largest corporations. Together,these programs have provided the mecha-nisms to transform the university into a serv-ice-provider to the private sector. The mas-sive infrastructural inequalities that resultthreaten to exacerbate “tiering” within theuniversity, privileging one set of privately-profitable disciplines over those that arepublicly useful. The priorities and activitieswithin the “more-valued” sector are them-selves compromised by an escalating de-pendence on corporate funding and the pro-vision of corporate services. Together, theseeffects risk undermining the university’sobligations to meet students’ needs and tocarry out its commitment to public service.
Corporations come and go. Market nichescome and go, along with the products sold
to them. The same cannot be said for thecreations of the public sector: public health,public education, planning for the publicgood are not “trends” whose existence de-pends on the whims of commerce. There isno substitute, waiting in the wings, to replacea university system mortally compromisedby its devotion to what is currently useful atthe expense of what is good and true—andtherefore useful—over time. No other insti-tution can treasure what the university as-pires to embrace, preserve and advance: theantidote to “common sense.” Put this way,the university is the antithesis of public opin-ion, while to the market, public opinion iseverything. It is the means by which today’sinvestment can be transformed into tomor-row’s return. It is sorrowful when the insti-tution that sets out to free people’s mindsfrom these manipulations ends up as theiragent.
Conclusion

For Cash and Future Considerations 45
1. That OCUFA continue its efforts to broaden awareness among its mem-bership of the dynamics of PPPs and their influence in the universitysector
2. That OCUFA seek support among other public employees, profession-als and public interest groups in lobbying for a moratorium on furtherSuperBuild agreements, pending a transparent cost/benefit analysis.
3. That OCUFA emphasize the "structural inequality" that disadvantagesthe majority of university students when their funding is determinedby the private sector, and urge compensatory funding .
4. That OCUFA request that all Universities publish the linkages betweenthe PPPs with which they are involved, and the corporate interests rep-resented by their boards of directors.
5. That OCUFA continue to lobby for funding for post-secondary institu-tions sufficient that they are not forced to seek private sector alterna-tives.
6. That OCUFA urge that the Task Force on Commercialization be recon-stituted.
7. That OCUFA work with like-minded groups to restore accountabilityto infrastructure finance in all sectors.
8. That OCUFA continue to assert leadership in extending public under-standing of PPPs and alternatives that would better reflect an appro-priate relationship between public and private sectors, and betweenthe public and its elected government.
Recommendations

46 Canadian Centre for Policy Alternatives
Endnotes
1 John Maynard Keynes, “The General Theory ofEmployment, Interest and Money.” Macmillan:Cambridge. 1973. In Christopher Sheil, An Un-holyAlliance. Evatt Institute. http://evatt.labor.net.au/publications/papers/5.1html
2 Richard Freeman, Financial Times, 1996, quoted byDavid Anderson, “An Analysis of a Public-PrivateSector Partnership: The Hamilton—Wentworth—Philip Utilities Management Corp. PPP.” http://www.cela.ca/water/CUPE
3 Christopher Sheil, An Un-holy Alliance. Paper pre-sented at the Evatt Foundation’s Seminar on PPPs,Sydney, Australia, August 16, 2002. http://evatt.labor.net.au/publications/papers/51.html
4 Jim Grieshaber-Otto and Matthew Sanger, PerilousLessons: The Impact of the WTO Service Agreement(GATS) on Canada’s Public Education System. Ot-tawa: Canadian Centre for Policy Alternatives. 2002
5 Kenneth Davidson, News of the World: PPPs are aDisaster. Evatt Institute. http:evatt.labor.net.au/news/92.html
6 Murray Dobbin, “Warning: The P3s are Coming.”Winnipeg Free Press. July 21, 2002. www.nupge.ca/news_au02/n23au02a.htm
7 CCPPP is the most influential PPP lobby. It pub-lishes on the topic of PPPs, networks its membersand holds events such as annual conferences, whereit recognizes “meritorious” projects with a series ofawards. Its website, (http://www.pppcouncil.ca., in-cludes some useful information about PPPs, as wellas a list of the organization’s membership roster anddonors.
8 (http://www.pppcouncil.ca/about)9 ibid p.110 Canadian Council on Public-Private Partnerships,
“About PPP: Definitions.” http://www.pppcouncil.ca/aboutPPP_definition.asp
11 John Spoehr, Dexter Whitfield, Christopher Sheiland John Quigan, Partnerships, Privatisation and thePublic Interest: PPP and the Financing of Infrastruc-ture Development in South Australia. Centre for La-bour Research, University of Adelaide, for the Pub-lic Service Association of South Australia. Sept. 2002
12 Christopher Sheil, ibid.
13 Thomas Frank, One Market Under God: ExtremeCapitalism, Market Populism and the End of EconomicDemocracy. New York: Doubleday. 2000
14 Thomas Frank, ibid p.1715 Christopher Sheil, op cit.16 ibid.17 CCPPP, “About PPP: Why Public-Private Partner-
ships?” http://www.pppcouncil.ca/aboutPPP_why.asp18 Cynthia Robertson, “Public—Private Partnerships :
World in Review.” http://www.pppcouncil.ca/crobert.pdf.
19 John Spoehr et al, op.cit.20 There are a number of individuals and organizations
sources that have tracked of these PPPs, and the ac-tivities of the communities affected by them. Thewebsite of the Nova Scotia Teachers Union providesdetailed information, and publishes the Union’sadopted ‘Principles on Public Private Partnerships’at http://www.nstu.ca/issues/P3/ethical.html
21 Heather-jane Robertson, “’Incent’ This!” Phi DeltaKappan, V84 N9 May 2003. Pp.713-14.
22 Canadian Union of Public Employees. “CUPE con-demns P3 schools cash grab by Scotia Learning.”Press Release. January 14, 2003. http://cupe.ca/m e d i a r o o m / n e w s r e l e a s e s /showitem.asp?id+7769&cl=1, cited in Heather-janeRobertson, “’Incent’ This,” op. cit.
23 For examples and further discussion, see CanadianCentre for Policy Alternatives, (CCPA), “The TrueCost of P3s.” CCPA Monitor, V10 N4. Sept, 2003.Insert. Also available at http://www.policyalternatives.ca
24 Ontario Health Coalition, P3 Hospitals: The BritishExperience; A Closer Look. Undated. http://www/web/net/ohc/bitp3.rtf. p.1. The state auditor evalu-ating this project also concluded that the hospitalcould have been built ‘twice over’ if it had been fi-nanced and built in a conventional manner.
25 Paul McKay, “ROH bidders gave money to Tories.”The Ottawa Citizen, January 28, 2003 p. B1.
26 “New hospital in a new way”. Editorial. The OttawaCitizen, May 30, 2003. P.E4.
27 Lewis Auerbach, “Issues Raised by Public PrivatePartnerships in Ontario’s Hospital Sector.” Canadian

For Cash and Future Considerations 47
Union of Public Employees. http://www.cupe.on.ca/news/nr021203.html
28 The Hon. Jim Flaherty, “Notes for Remarks to theConference on Public—Private Partnerships,” Nov.26, 2001. www.pppcouncil.ca/pdf/flaherty.pdf
29 Mark Zwelling, President of Vector Research, de-scribing the aggregate of many polls, asking manydifferent questions posed different ways about pub-lic services. Personal communication.
30 John Polyani, quoted in Post-Secondary Education:Can We Fulfill the Promise? Consider the Cost Coali-tion. www.socialjustice.org
31 Science Council of Canada, Winning in a WorldEconomy: University-Industry Interaction and Eco-nomic Renewal In Canada. Report 39. Ottawa: Min-istry of Supply and Services, 1998. P.x-xi, quoted byJim Turk, The Corporate Campu$: Commercializa-tion and the Dangers to Canada’s Colleges and Uni-versities. Ottawa: Canadian Association of Univer-sity Teachers / James Lorimer and Company, Ltd,p.3
32 John Manley, 1999, Speech to the Canadian Insti-tute of Advanced Research. Toronto, April 22, 1999.Available at http://www.connect.gc.ca/en/ep/1267-e
33 Graham Fraser, “Martin condemns cuts to educa-tion: Tells parents it’s a ‘knowledge economy’.” To-ronto Star. Sept 21, 2002.
34 Canadian Association of University Teachers(CAUT), “Analysis of the 2003 Federal Budget, Feb-ruary 2003,” quoted in Denise Doherty-Delormeand Erika Shaker, “Debt toll, How high can yougo?” In Denise Doherty-Delorme and Erika Shaker(eds), Missing Pieces IV: An Alternative Guide to Post-Secondary Education. Ottawa: Canadian Centre forPolicy Alternatives, May 2003. pp. 41-2.
35 Ibid, p. 4236 Carolyn Leitch, “RESP’s help fuel education
dreams.” Globe and Mail. Jan 18, 2003. p.C237 Statistics Canada, “Participation in postsecondary
education and family income.” The Daily. Dec. 7,2001. http://www.statcan.ca/Daily/English/011207
38 Canadian Association of University Teachers, “Com-mercialization: Canada’s Innovation Agenda:CAUT’s Response.” http://www.caut.ca/english/is-sues/commercialization/innovationagenda.asp
39 Both papers are available at http://www.innovationstrategy.gc.ca/cmb/innovation.nsf/pageE/Contents In Achieving Excellence, it is claimedthat Canada has a serious productivity problem ne-cessitating immediate action. This problem, it is
suggested, stems in large part from Canada’s rela-tively poorer performance in getting “new ideas intothe market more quickly.” It recommends that uni-versities facilitate this process more aggressively.
40 April Lindgren, “University entry grade hits 85% orhigher.” The Ottawa Citizen . April 16, 2003. p. A8
41 Sarah Schmidt, “Public funds for tuition fall 32%since ’86.” The Ottawa Citizen. June 12, 2003 p.A5.
42 Mark Rosenfeld and Amy Dickieson Kaufman, “Thestate of higher education in Ontario: Bursting at theseams.” In Missing Pieces IV, op. cit. p.59.
43 ibid, p. 6044 Ontario Confederation of University Faculty Asso-
ciations (OCUFA), “Brief to the Standing Commit-tee on Finance and Economic Affairs.” Pre-BudgetConsultation, Jan 30 2003. p.4. http//:www.ocufa.on.ca/briefs/budgetJan03.pdf
45 Mark Rosenfeld and Amy Dickieson Kaufman,op.cit p. 60.
46 Hugh Mackenzie and Mark Rosenfeld, “UniversityFunding Cuts: Shortchanging Ontario Students” inMissing Pieces IV, op.cit. p.30.
47 CUPE National Research Branch, “SuperBuild Up-date: Public-Private Partnerships in Ontario’s Col-leges and Universities.” Canadian Union of PublicEmployees. March 3, 2003.
48 Mark Rosenfeld and Amy Dickieson Kaufman,op.cit. p. 60
49 ………, “Background data: Quality.” In MissingPieces IV, op. cit. P.20.
50 Denis Doherty-Delorme and Erika Shaker, op. cit.P. 31.
51 Todd Robertson, “Changing patterns of universityfinance.” Statistics Canada: Education Quarterly Re-view, 2003 V9 N7, p. 10.
52 ……….,”Background data: Accessibility,affordability, opportunity.” In Missing Pieces IV,op.cit. p.11.
53 See, for example, the Canadian Federation of Stu-dents “Fact sheet, Private Universities: PrivilegedEducation.” Dec. 2000, V 7, N2. Dec, 2000.
54 Mark Rosenfeld and Amy Dickieson Kaufman,op.cit. p.62.
55 See Appendix #4 for a more detailed analysis of spon-sored research funding by university.
56 p. 69, Healy, Teresa. “Public Exclusion, Under Fund-ing and the Intensification of Work: Universities andthe Erosion of Democracy in Ontario.” Just Labour,Volume 1, 2002, p. 68-76. http://www.yorku.ca/julabour/volume1/jl_healy.pdf

48 Canadian Centre for Policy Alternatives
57 Both cases involved the company Research in Mo-tion whose CEO (Mike Lararidis) and one memberof its Board of Directors (Doug Wright) sit on theORDCF board. In 2001, the ORDCF gave $5.95million to a joint project between Research in Mo-tion and University of Waterloo (See p. 11: http://www.ontar iocha l l enge fund.com/eng l i sh/annual_report/Report2002.pdf ). In 1999, theORDCF gave $500,000 to a joint project betweenResearch in Motion and Laurier University ( See p.12: http://www.ontariochallengefund.com/english/annual_report/Report2000.pdf ). Both projects in-volved information technology and therefore re-search from these projects could definitely be usedto benefit Research in Motion.
58 http://www.ontariochallengefund.com59 ———, “U of W, St. Clair College Agreement De-
signed to Profit the Automotive Industry.” Univer-sity of Windsor Students’ Alliance. http://www.uwsa.ca/articles/articles.asp?Article=9
60 E. Pearce, “In Conversation with John Roth: Net-working the World.” Ivey Business Journal. V64 N2November/December 1999.
61 Heather-jane Robertson, Risky Business. Paper pre-sented to the 4th National Meeting of Economist,Havana Cuba. Feb. 14, 2002.
62 See http://www.edu.gov.on.ca/eng/general/postsec/atop/atop3.html
63 http://www.edu.gov.on.ca/eng/general/postsec/atop/atop2.html
64 http://www.edu.gov.on.ca/eng/document/nr/99.07/atop.html
65 Joanne Curry, “Canadian Experiences in Develop-ing Public Private Partnerships in the eLearning Sec-tor.” Presentation to TeleLearning 2001, Vancou-ver, Canada. http://www.telelearn.ca/conference
66 http://www.oit.on.ca/Pages/AboutTrust.html67 According to CFS-Quebec, “the federal program,
Canadian Foundation for Innovation and the Ca-nadian Research Chairs Program “has made govern-ment funding available to researchers only on thecondition that private sponsorship is also acquired,often in amounts that equal what is contributed bygovernment. In effect, these programs transform fed-eral research funding into a subsidy for corporate-driven research agendas that would otherwise havebeen funded entirely by the private sector.” RobGreen, Research Funding & the Public Interest.EducationAction. CFS-Quebec. http://w w w. e d u c a t i o n - a c t i o n . n e t / r u c k u s e n g /rfundingpi.htm
68 http://www.oit.on.ca/69 Centre for Education Statistics, Statistics Canada.
“University enrolment in Ontario by 1st digit fieldof study. 2000-01.”
70 http://www.oce-ontario.org71 ibid.72 Project literature explains that after September 11,
2001 the market for “less-lethal weapons systems”increased by 300% (the U.S. market alone is esti-mated to exceed $159 million in annual sales, 2004)and the U.S. government contacted Pine Tree im-mediately following the attacks to purchase 10,000pieces of ammunition. The resultant new rubberbullet is deemed to be more accurate and reusable,and will be used “for police and military training,crowd control and riot squads.” Explains AmerEbied, engineering graduate from UWO and recipi-ent of an MMO Industrial Masters Scholarship,“these bullets are revolutionizing the less-lethalammunitions market!”
73 Annual Report of the OSBC, 2000-01 p.4 http://w w w. s u p e r b u i l d . g o v. o n . c a / u s e r f i l e s /p a g e _ a t t a c h m e n t s / L i b r a r y / 2 / 2 0 0 0 -01_Annual_Report.pdf
74 Ontario Government. “A Guide to Public-PrivatePartnerships.” January 2001. P.1. http://w w w. s u p e r b u i l d . g o v. o n . c a / u s e r f i l e s /page_attachments/Library/2/Partnership_Guide.pdf
75 For a breakdown of the SuperBuild projects in theuniversity sector see: http://www.edu.gov.on.ca/superbuild/ english/projects/universities.html. Theenrolment figures of Ontario universities are pro-vided by Statistics Canada. Note 6% of students arereported as Arts and Science, Interdisciplinary, ornot known and not included in the totals for stu-dent enrolment. The subject areas are broken downas follows. Fine Arts includes: applied arts, fine arts,music, performing arts. Education includes: elemen-tary-secondary teacher training, human kinetics,nursery and kindergarten education, physical edu-cation, recreology and recreation administration.Humanities includes: classics, classical and dead lan-guages, English, French, history, journalism libraryscience, translation and interpretation, linguistics,other languages and/or literatures, mass communi-cations studies, philosophy, records science, religiousstudies and theology. Social Sciences includes: an-thropology, archaeology, area studies, Canadian stud-ies, criminology, demography, economics, geogra-phy, law, environmental studies, military studies,political science, psychology, social work, sociology

For Cash and Future Considerations 49
and specialized administration studies. Engineering,Computer Science and Business includes: compu-ter science, commerce, management, business ad-ministration, aeronautical and aerospace engineer-ing, architecture, chemical engineering, civil engi-neering, systems engineering, electrical engineering,engineering science, general engineering, forestry,industrial engineering, mechanical engineering,metallurgical engineering and mining engineering.Natural and Health Sciences includes: agriculture,biochemistry, biology, biophysics, botany, fisheriesand wildlife management, household science, toxi-cology, veterinary medicine, zoology, chemistry, ge-ology mathematics, metallurgy, meteorology, ocea-nography, physics, medical sciences, dentistry, medi-cal technology, medicine, nursing, optometry,paraclinical sciences, public health, pharmacy andrehabilitation medicine.
76 This inequity becomes particularly marked in thecase of education. Few disagree that the educationof children determines our society’s social, politicaland economic future. Yet not one penny ofSuperBuild money has thus far been spent on thepreparation of their future teachers. Among all 22SuperBuild University projects, only one minorproject may have a distant connection to education.The study of education is clearly of little value toprivate sector “partners;” it is governments and
school boards, not private companies, which willemploy (or at least be scrambling to find) qualifiedteachers in the next decade. Corporations do notuse educational research in the manufacture of cellphones, and what they need to know about chil-dren themselves they can learn from marketers. Pri-vate companies pursue self-interest, not the publicgood. This is not a political criticism, it is recogni-tion that profit-seeking is a characteristic of the pri-vate sector, not a character flaw. It is naïve at worstand disingenuous at best to expect the private sectorto behave otherwise.
77 http://www.superbuild.gov.on.ca/userfiles/HTML/nts_2_25809_1.html
78 Corporate-government alliances grow in a varietyof ways, including the smarmiest ones. A numberof companies that dominate the boards who controlthe OSBC, ORDCF and ATOP are also major con-tributors to the Ontario Progressive ConservativeParty. Between 1995 and 2001, Toronto DominionBank and Securities, which is represented on theOSCB advisory board, donated $79,418 to the Pro-gressive Conservative Party of Ontario. Bell Canada,also a member of the OSBC board, has receivedfunding from the ORDCF for a joint project withCarleton University and the University of Ottawa.Bell Canada and Bell Mobility also donated $30,200to the Conservative Party between 1995 and 2001.

50 Canadian Centre for Policy Alternatives
Sponsored Research Funding
University finance data from StatisticsCanada for 2001-02 provides a more thor-ough analysis of the breakdown for univer-sity income, including grants and contracts,and other sources of sponsored researchfunding—from federal and provincialgrants, and other sources—and allows us todetermine the degree to which universitytotal income is supplemented by incomefrom sponsored research (both from publicand private sources).
When looking at the percentage of uni-versity income from sponsored research,McMaster is first at 36.3%, followed by U ofT at almost 32%. Ottawa is also at nearly 32%,followed by Guelph (almost 27%), Queen’s(25.2%) and Western (24.28%). Compare thiswith Trent (14.6%), Brock (6.5%), York(7.68%), and Ryerson (3.5%). Clearly, largerinstitutions see sponsored research (from allsources) as a substantial source of income.Perhaps smaller institutions are not as wellpositioned to take advantage of sponsoredresearch as a lucrative income source.
Appendix 1
University Percentage ofsponsored
research incomefrom provincial
government(2001-02)
Percentage ofsponsored
research incomefrom federalgovernment(2001-02)
Percentage ofsponsored
research incomefrom other sources
(2001-02)
Sponsoredresearch incomeas percentage oftotal university
income (2001-02)
Brock 10.31 76.65 12.78 6.5
Carleton 9.47 53.83 36.70 17.33
Guelph 44.81 29.97 25.21 26.92
Lakehead 27.92 60.0 11.79 11.0
Laurentian 19.36 37.50 43.14 16.20
McMaster 7.70 37.24 55.05 36.30
Nipissing 10.18 2.77 87.03 0.52
Ottawa 16.48 45.92 35.58 31.88
Queen’s 19.94 39.81 40.24 25.20
Ryerson 0.00 50.46 49.53 3.53
Toronto 17.98 42.86 39.15 31.95
Trent 16.87 68.32 14.80 14.61
Waterloo 18.95 49.35 31.68 22.43
Western 14.94 37.05 47.99 24.28
Wilfrid Laurier 5.05 75.88 19.05 4.27
Windsor 23.48 63.98 12.52 9.39
York 9.33 66.27 24.39 7.68

For Cash and Future Considerations 51
This inequity becomes even more inter-esting when calculating universities’ totalsponsored research income from the provin-cial government per student (full-timeequivalent, or FTE). There is a clear dividebetween the larger and the smaller univer-sities, as indicated in the table above.
Of the 17 universities included in this ta-ble, only four are above the national aver-age (provincial sponsored research incomeper student) of $1,000.31: Guelph, Ottawa,Queen’s and Toronto. McMaster is almost atthe national average at $998.42, as is Water-loo ($929.58) and Western ($891.26). The re-maining universities fall well below the na-tional average, ranging from $514.15 at
Laurentian to $9.49 at Nipissing. This corre-sponds to what we know—the larger uni-versities are able to attract substantially moreresearch dollars than the smaller universi-ties, which is particularly striking on a per-student basis. In fact, the seven larger uni-versities attract a total of $242,132,000 or91.76% of provincial sponsored researchfunding, and the 10 smaller ones $21,731,000or 8.23%. To put it in student terms, the sevenbest-endowed universities representing57.92% of Ontario students (152,791.5 FTE2001-02) received almost 92% of the spon-sored research money provided by the pro-vincial government while 42.07% (110,988.7FTE 2001-02) received less than 9%.
University Total eligible FTE(undergraduate and
graduate)
Total sponsoredresearch income from
province ($1000)
Sponsoredresearch income
per student
Brock 9,277.6 811 $87.41
Carleton 14,502.0 5298 $365.32
Guelph 13,853.0 50951 $3677.97
Lakehead 5,453.4 2715 $497.85
Laurentian 5,438.0 2796 $514.15
McMaster 15,220.0 15196 $998.42
Nipissing 2,316.4 22 $9.49
Ottawa 20,175.5 25095 $1243.83
Queen’s 14,976.4 30054 $2006.75
Ryerson 16,666.0 0 N/A
Toronto 45,708.6 81955 $1792.98
Trent 4,515.0 1997 $442.30
Waterloo 17,826.2 16571 $929.58
Western 25,031.8 22310 $891.26
Wilfrid Laurier 9,199.4 258 $28.04
Windsor 10,978.8 3895 $354.77
York 30,530.0 3939 $129.02
Total 263,780.2 263,863 $1,000.31

52 Canadian Centre for Policy Alternatives
Appendix 2
Field of study 2000-2001 Percentage
Agricultural and biological sciences 19,165 0.1
Arts and science 33,853 0.1
Education 29,024 0.1
Engineering and applied sciences 29,281 0.1
Fine and applied arts 10,911 0.0
Health professions and occupations 19,207 0.1
Humanities and related 33,611 0.1
Mathematics and physical sciences 24,545 0.1
Not applicable 13,102 0.0
Not reported 140 0.0
Social sciences and related 106,415 0.3
Ontario total 319,254 100%
University Enrolment in Ontario By First Digit Field of Study, 2000-01
Field of study 2000-2001 Percentage
Agricultural and biological sciences 19,165 6.00
Arts and science 33,853 10.60
Education 29,024 9.09
Engineering and applied sciences 29,281 9.17
Fine and applied arts 10,911 3.42
Health professions and occupations 19,207 6.01
Humanities and related 33,611 10.52
Mathematics and physical sciences 24,545 7.69
Not applicable 13,102 4.10
Not reported 140 0.04
Social sciences and related 106,415 33.3
Ontario total 319,254 100%

For Cash and Future Considerations 53
Appe
ndix
3
Un
ive
rsit
yM
ult
ipu
rpo
se
Su
pe
rBu
ildP
riva
teIn
stitu
tio
nM
un
cip
al
AT
OP
OR
DC
F/O
ITC
FI
Fe
de
ral
Oth
er
Pro
v .
$
Alg
om
aL
ea
rnin
g P
avili
on
0.6
5
Bro
ck
Ne
w A
ca
de
mic
Co
mp
lex
15
.57
9.9
He
ars
tM
od
ern
iza
tio
n o
f K
ap
uska
sin
g0
.12
0.1
75
Fle
min
g a
nd
Tre
nt
Co
op
era
tive
Ve
ntu
res I
nita
tive
2.8
10
.3
We
ste
rnC
lassro
om
Re
no
va
tio
ns
40
.51
01
31
04
4
To
tals
5
9.6
52
0.2
13
10
44
N
atu
ral
an
d H
ea
lth
Sc
ien
ce
sS
up
erB
uild
Priva
teIn
stitu
tio
nM
un
cip
al
AT
OP
OR
DC
F/O
ITC
FI
Fe
de
ral
Oth
er
Pro
v .
$
Ca
rle
ton
Sta
cie
Bu
ildin
g2
8.6
61
.64
1.6
51
.54
.25
17
.4
U o
f T
He
alth
Scie
nce
s C
om
ple
x2
8.8
20
18
.51
25
.62
4
Gu
elp
hA
dva
nce
d L
ea
rnin
g a
nd
Tra
inin
g C
en
tre
45
30
1.3
8
To
tals
1
02
.46
51
.64
21
.46
82
7.1
28
.25
E
ng
ine
eri
ng
,Co
mp
ute
r S
cie
nc
e,
Bu
sin
es
sS
up
erB
uild
Priva
teIn
stitu
tio
nM
un
cip
al
AT
OP
OR
DC
F/O
ITC
FI
Fe
de
ral
Oth
er
Pro
v .
$
La
ke
he
ad
Ad
va
nce
d T
ech
no
log
y a
nd
Aca
de
mic
Ce
ntr
e1
3.3
87
.22
30
.53
.34
0.4
40
.44
2.5
McM
aste
rS
cie
nce
, H
ea
lth
Scie
nce
s,
an
d E
ng
ine
erin
g R
eh
ab
ilitio
n1
8.5
37
.68
.15
4
Nip
issin
gA
ca
de
mic
Exp
an
sio
n1
1.2
0.8
11
.5
Qu
ee
n`s
Ne
w C
he
mis
try B
uild
ing
an
d S
ch
oo
l o
f B
usin
ess R
en
ova
tio
n3
9.9
63
91
1.1
6
Rye
rso
nC
en
tre
fo
r G
rap
hic
Co
mm
un
ica
tio
ns M
an
ag
em
en
t4
.15
6
Ott
aw
aS
ch
oo
l o
f In
form
atio
n T
ech
no
log
y a
nd
En
gin
ee
rin
g4
.51
3.4
34
9
U o
f T
Ce
ntr
e f
or
Info
rma
tio
n T
ech
no
log
y2
4.0
31
2.6
26
.85
10
.29
.46
2.3
5
U o
f T
an
d S
he
rid
an
Co
mm
un
ica
tio
n,
Cu
ltu
re a
nd
In
form
atio
n T
ech
no
log
y2
7.3
1.9
33
4.5
0.4
30
.50
.75
Wa
terlo
oE
nviro
nm
en
tal a
nd
In
form
atio
n T
ech
no
log
y a
nd
Co
op
era
tive
Ce
ntr
e3
1.2
11
8.3
33
1.6
21
.62
2.2
8
La
urie
rS
ch
leg
er
Ce
ntr
e f
or
En
tre
pre
nu
ial S
tud
ies
6.3
4.0
21
.40
.55
Yo
rkS
ch
ulic
h S
ch
oo
l o
f B
usin
ess
30
.49
17
.51
0.2
2
To
tals
2
11
.05
12
8.4
36
8.7
85
32
12
.02
5.1
6
L
ibra
ryS
up
erB
uild
Priva
teIn
stitu
tio
nM
un
cip
al
AT
OP
OR
DC
F/O
ITC
FI
Fe
de
ral
Oth
er
Pro
v .
$
La
ure
ntia
nB
ren
da
Wa
llace
Re
ad
ing
Ro
om
0.6
10
.41
0.2
5
A
rts
an
d S
cie
nc
eS
up
erB
uild
Priva
teIn
stitu
tio
nM
un
cip
al
AT
OP
OR
DC
F/O
ITC
FI
Fe
de
ral
Oth
er
Pro
v .
$
Tre
nt
Fa
cu
lty o
f A
rts a
nd
Scie
nce
Aca
de
mic
Fa
cili
tie
s2
7.3
23
.63
0.7
30
.68
0.7
4
D
ram
ati
c A
rt a
nd
Mu
ltim
ed
ia L
ea
rnin
gS
up
erB
uild
Priva
teIn
stitu
tio
nM
un
cip
al
AT
OP
OR
DC
F/O
ITC
FI
Fe
de
ral
Oth
er
Pro
v .
$
Win
dso
rM
ultim
ed
ia L
ea
rnin
g C
en
tre
an
d D
ram
atic A
rt P
roje
ct
10
.66
3.8
2.5
5
Ove
rall
To
tals
4
11
.75
20
8.1
11
06
.47
28
32
.94
3.8
63
7.4
11
9.9
2.4
55
Bre
ak
do
wn
of
Su
pe
rBu
ild
Fu
nd
ing
by
Pro
jec
t (i
n $
mil
lio
ns
)

Institution Line General Special purpose Entities Entities not Sub-total Ancillary Capital Endowment Totalname title operating and trust Consolidated Consolidated enterprises funds
INSTNAME VAR_ENGLISH C01 C02 C03 C04 C05 C06 C07 C08 C09
Brock University 1. Social Sciences and Humanities Research Council 0 0 415 0 415 0 0 0 415
Brock University 3. Natural Sciences and Engineering Research Council 0 0 2878 0 2878 0 0 0 2878
Brock University 4. Canadian Institutes of Health Research (CIHR) 0 0 100 0 100 0 0 0 100
Brock University 5. Canada Foundation for Innovation (CFI) 0 0 259 0 259 0 0 0 259
Brock University 7. Other federal 0 0 2236 0 2236 0 0 0 2236
Brock University Ministry of Health 0 0 596 0 596 0 0 0 596Brock University Ontario Ministry of Training, Colleges and Universities (MTCU) 44975 0 140 0 140 127 685 0 45927Brock University C. Total of all departments and agencies under $100,000 71 0 75 0 75 0 0 0 146Brock University Total (calculated) * 45046 0 811 0 811 127 685 0 46669Brock University 9. Municipal 0 0 0 0 0 0 443 0 443
Brock University 12. Credit course tuition 39959 0 0 0 0 0 0 0 39959
Brock University 13. Non-credit tuition 1548 0 0 0 0 0 0 0 1548
Brock University 14. Other fees 2317 0 0 0 0 0 0 0 2317
Brock University 15. Individuals 0 757 0 0 0 0 1214 156 2127
Brock University 16. Business enterprises 0 673 0 0 0 0 1307 0 1980
Brock University 17. Foundations 0 115 0 0 0 0 155 0 270
Brock University 18. Not-for-profit organizations 0 51 0 0 0 0 69 0 120
Brock University 20. Business enterprises 0 0 412 0 412 0 0 0 412
Brock University 21. Foundations 0 0 431 0 431 0 0 0 431
Brock University 22. Not-for-profit organizations 0 0 139 0 139 0 0 0 139
Brock University 23. Endowment 0 636 0 0 0 0 0 -982 -346
Brock University 24. Other investment 467 0 0 0 0 0 312 0 779
Brock University 25. Sale of services and products 0 0 0 0 0 9891 0 0 9891
Brock University 26. Miscellaneous 0 0 0 0 0 4953 0 0 4953
Brock University 27. Total 89337 2232 7681 0 7681 14971 4185 -826 117580
Carleton University 1. Social Sciences and Humanities Research Council 0 0 2408 0 2408 0 0 0 2408
Carleton University 2. Health Canada 0 0 764 0 764 0 0 0 764
Carleton University 3. Natural Sciences and Engineering Research Council 353 0 10126 0 10126 0 0 0 10479
Carleton University 4. Canadian Institutes of Health Research (CIHR) 0 0 464 0 464 0 0 0 464
Carleton University 5. Canada Foundation for Innovation (CFI) 0 0 2873 0 2873 0 0 0 2873
Carleton University 7. Other federal 687 0 13482 0 13482 0 3005 0 17174
Carleton University Ontario Research & Development Challenge Fund 0 0 905 0 905 0 0 0 905Carleton University Ontario Innovation Trust (OIT) 0 0 2080 0 2080 0 0 0 2080Carleton University Premier's Research Excellence Awards 0 0 122 0 122 0 0 0 122Carleton University Ontario Ministry of Training, Colleges and Universities (MTCU) 89512 321 0 0 0 208 25750 0 115791Carleton University C. Total of all departments and agencies under $100,000 40 0 2191 0 2191 0 0 0 2231Carleton University Total (calculated) * 89552 321 5298 0 5298 208 25750 0 121129Carleton University 9. Municipal 0 0 134 0 134 0 0 0 134
Carleton University 10. Other provinces 0 0 2010 0 2010 0 0 0 2010
Carleton University 12. Credit course tuition 74657 0 0 0 0 0 0 0 74657
Carleton University 14. Other fees 5455 0 0 0 0 0 0 0 5455
Carleton University 15. Individuals 970 19876 274 0 274 0 0 374 21494
Carleton University 16. Business enterprises 133 1499 0 0 0 0 0 7 1639
Carleton University 19. Individuals 0 0 835 0 835 0 0 0 835
Carleton University 20. Business enterprises 689 0 3259 0 3259 0 0 0 3948
Carleton University 21. Foundations 67 0 1054 0 1054 0 0 0 1121
Carleton University 22. Not-for-profit organizations 0 0 599 0 599 0 0 0 599
Carleton University 23. Endowment 0 0 0 0 0 0 0 16893 16893
Carleton University 24. Other investment 1865 2446 0 0 0 0 2043 0 6354
Sponsored research
Appendix 4: Ontario Public Universities (CAUBO Members) Income 2001-02
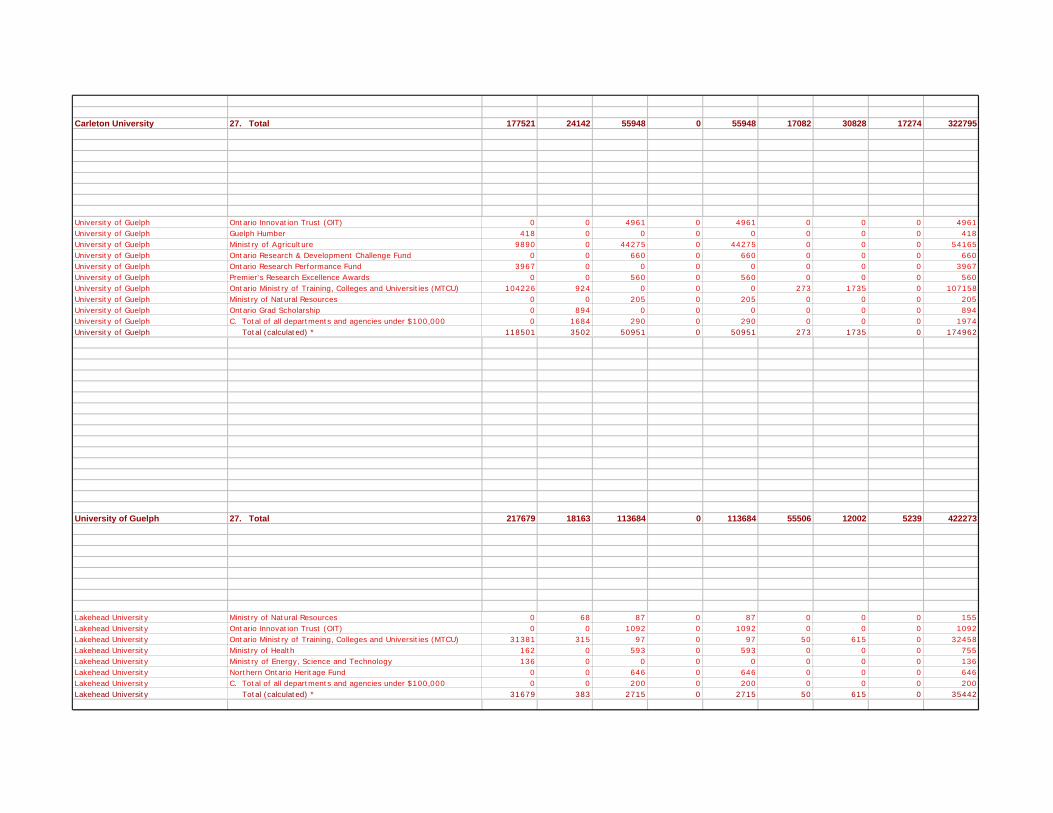
Carleton University 25. Sale of services and products 0 0 0 0 0 7424 0 0 7424
Carleton University 26. Miscellaneous 3093 0 12368 0 12368 9450 30 0 24941
Carleton University 27. Total 177521 24142 55948 0 55948 17082 30828 17274 322795
University of Guelph 1. Social Sciences and Humanities Research Council 0 0 1062 0 1062 0 0 0 1062
University of Guelph 2. Health Canada 0 0 458 0 458 0 0 0 458
University of Guelph 3. Natural Sciences and Engineering Research Council 0 0 13126 0 13126 0 0 0 13126
University of Guelph 4. Canadian Institutes of Health Research (CIHR) 0 0 1860 0 1860 0 0 0 1860
University of Guelph 5. Canada Foundation for Innovation (CFI) 0 0 4867 0 4867 0 0 0 4867
University of Guelph 6. Canada Research chairs 0 0 1300 0 1300 0 0 0 1300
University of Guelph 7. Other federal 0 88 11396 0 11396 0 0 0 11484
University of Guelph Ontario Innovation Trust (OIT) 0 0 4961 0 4961 0 0 0 4961University of Guelph Guelph Humber 418 0 0 0 0 0 0 0 418University of Guelph Ministry of Agriculture 9890 0 44275 0 44275 0 0 0 54165University of Guelph Ontario Research & Development Challenge Fund 0 0 660 0 660 0 0 0 660University of Guelph Ontario Research Performance Fund 3967 0 0 0 0 0 0 0 3967University of Guelph Premier's Research Excellence Awards 0 0 560 0 560 0 0 0 560University of Guelph Ontario Ministry of Training, Colleges and Universities (MTCU) 104226 924 0 0 0 273 1735 0 107158University of Guelph Ministry of Natural Resources 0 0 205 0 205 0 0 0 205University of Guelph Ontario Grad Scholarship 0 894 0 0 0 0 0 0 894University of Guelph C. Total of all departments and agencies under $100,000 0 1684 290 0 290 0 0 0 1974University of Guelph Total (calculated) * 118501 3502 50951 0 50951 273 1735 0 174962University of Guelph 10. Other provinces 0 0 900 0 900 0 0 0 900
University of Guelph 12. Credit course tuition 67372 0 0 0 0 0 0 0 67372
University of Guelph 13. Non-credit tuition 4878 0 0 0 0 0 0 0 4878
University of Guelph 14. Other fees 9001 0 0 0 0 0 0 0 9001
University of Guelph 15. Individuals 0 4083 0 0 0 0 0 3679 7762
University of Guelph 16. Business enterprises 0 637 0 0 0 0 7404 1239 9280
University of Guelph 17. Foundations 0 642 0 0 0 0 0 418 1060
University of Guelph 18. Not-for-profit organizations 0 154 0 0 0 0 0 177 331
University of Guelph 19. Individuals 0 45 1002 0 1002 0 0 0 1047
University of Guelph 20. Business enterprises 0 323 14868 0 14868 0 0 0 15191
University of Guelph 21. Foundations 0 75 1933 0 1933 0 0 0 2008
University of Guelph 22. Not-for-profit organizations 0 0 1933 0 1933 0 0 0 1933
University of Guelph 23. Endowment 0 0 0 0 0 0 0 -274 -274
University of Guelph 24. Other investment 2067 6736 0 0 0 297 2673 0 11773
University of Guelph 25. Sale of services and products 0 0 0 0 0 27973 0 0 27973
University of Guelph 26. Miscellaneous 15860 1878 8028 0 8028 26963 190 0 52919
University of Guelph 27. Total 217679 18163 113684 0 113684 55506 12002 5239 422273
Lakehead University 1. Social Sciences and Humanities Research Council 0 78 490 0 490 0 0 0 568
Lakehead University 2. Health Canada 0 0 663 0 663 0 0 0 663
Lakehead University 3. Natural Sciences and Engineering Research Council 0 116 1637 0 1637 0 0 0 1753
Lakehead University 4. Canadian Institutes of Health Research (CIHR) 0 0 229 0 229 0 0 0 229
Lakehead University 5. Canada Foundation for Innovation (CFI) 0 0 1051 0 1051 0 0 0 1051
Lakehead University 6. Canada Research chairs 0 0 200 0 200 0 0 0 200
Lakehead University 7. Other federal 766 0 1592 0 1592 0 0 0 2358
Lakehead University Ministry of Natural Resources 0 68 87 0 87 0 0 0 155Lakehead University Ontario Innovation Trust (OIT) 0 0 1092 0 1092 0 0 0 1092Lakehead University Ontario Ministry of Training, Colleges and Universities (MTCU) 31381 315 97 0 97 50 615 0 32458Lakehead University Ministry of Health 162 0 593 0 593 0 0 0 755Lakehead University Ministry of Energy, Science and Technology 136 0 0 0 0 0 0 0 136Lakehead University Northern Ontario Heritage Fund 0 0 646 0 646 0 0 0 646Lakehead University C. Total of all departments and agencies under $100,000 0 0 200 0 200 0 0 0 200Lakehead University Total (calculated) * 31679 383 2715 0 2715 50 615 0 35442Lakehead University 9. Municipal 0 0 28 0 28 0 0 0 28

Lakehead University 10. Other provinces 0 0 34 0 34 0 0 0 34
Lakehead University 12. Credit course tuition 22966 0 0 0 0 0 0 0 22966
Lakehead University 13. Non-credit tuition 454 0 0 0 0 0 0 0 454
Lakehead University 14. Other fees 1526 0 0 0 0 0 0 0 1526
Lakehead University 15. Individuals 138 24 3 0 3 0 63 168 396
Lakehead University 16. Business enterprises 308 80 494 0 494 0 5563 102 6547
Lakehead University 17. Foundations 3 28 1 0 1 0 78 2 112
Lakehead University 18. Not-for-profit organizations 10 91 0 0 0 0 0 1 102
Lakehead University 20. Business enterprises 70 41 340 0 340 0 0 0 451
Lakehead University 21. Foundations 0 0 19 0 19 0 0 0 19
Lakehead University 22. Not-for-profit organizations 211 0 76 0 76 0 0 0 287
Lakehead University 23. Endowment 0 254 0 0 0 0 0 95 349
Lakehead University 24. Other investment 0 14 0 0 0 184 73 0 271
Lakehead University 25. Sale of services and products 0 0 0 0 0 10755 0 0 10755
Lakehead University 26. Miscellaneous 897 5 152 0 152 0 0 0 1054
Lakehead University 27. Total 59028 1114 9724 0 9724 10989 6392 368 87615
Laurentian University 1. Social Sciences and Humanities Research Council 0 0 91 0 91 0 0 0 91
Laurentian University 3. Natural Sciences and Engineering Research Council 0 183 1632 0 1632 0 0 0 1815
Laurentian University 4. Canadian Institutes of Health Research (CIHR) 0 0 117 0 117 0 0 0 117
Laurentian University 5. Canada Foundation for Innovation (CFI) 0 0 778 0 778 0 0 0 778
Laurentian University 6. Canada Research chairs 0 0 300 0 300 0 0 0 300
Laurentian University 7. Other federal 12 68 2497 0 2497 0 0 0 2577
Laurentian University Ministry of Environment 0 0 100 0 100 0 0 0 100Laurentian University Ministry of Northern Development and Mines 0 1326 281 0 281 0 0 0 1607Laurentian University Ontario Research & Development Challenge Fund 0 0 731 0 731 0 0 0 731Laurentian University Ontario Innovation Trust (OIT) 0 0 715 0 715 0 0 0 715Laurentian University Ontario Ministry of Training, Colleges and Universities (MTCU) 38092 1833 0 0 0 0 1547 0 41472Laurentian University Ontario Research Performance Fund 405 0 0 0 0 0 0 0 405Laurentian University Ministry of Health 394 0 139 0 139 0 0 0 533Laurentian University Ministry of Natural Resources 0 0 550 0 550 0 0 0 550Laurentian University Premier's Research Excellence Awards 0 0 280 0 280 0 0 0 280Laurentian University Total (calculated) * 38891 3159 2796 0 2796 0 1547 0 46393Laurentian University 9. Municipal 0 0 113 0 113 0 0 0 113
Laurentian University 10. Other provinces 0 0 7 0 7 0 0 0 7
Laurentian University 12. Credit course tuition 17370 0 0 0 0 0 0 0 17370
Laurentian University 13. Non-credit tuition 1072 0 0 0 0 0 0 0 1072
Laurentian University 14. Other fees 1052 0 0 0 0 0 0 0 1052
Laurentian University 15. Individuals 0 46 31 0 31 0 0 11 88
Laurentian University 16. Business enterprises 1125 200 221 0 221 0 0 0 1546
Laurentian University 17. Foundations 0 38 77 0 77 0 0 0 115
Laurentian University 18. Not-for-profit organizations 0 5 0 0 0 0 0 30 35
Laurentian University 20. Business enterprises 25 0 3630 0 3630 0 0 0 3655
Laurentian University 21. Foundations 0 1 1534 0 1534 0 0 0 1535
Laurentian University 22. Not-for-profit organizations 0 0 159 0 159 0 0 0 159
Laurentian University 23. Endowment 0 162 40 0 40 0 0 0 202
Laurentian University 24. Other investment 622 0 0 0 0 0 0 0 622
Laurentian University 25. Sale of services and products 0 0 0 0 0 4196 0 0 4196
Laurentian University 26. Miscellaneous 2097 539 414 0 414 2205 0 0 5255
Laurentian University 27. Total 62266 4401 14437 0 14437 6401 1547 41 89093
McMaster University 1. Social Sciences and Humanities Research Council 0 0 2522 0 2522 0 0 0 2522
McMaster University 3. Natural Sciences and Engineering Research Council 0 0 15433 0 15433 0 0 0 15433
McMaster University 4. Canadian Institutes of Health Research (CIHR) 0 0 24571 0 24571 0 0 0 24571
McMaster University 5. Canada Foundation for Innovation (CFI) 0 0 6220 0 6220 0 0 0 6220
McMaster University 6. Canada Research chairs 0 0 4696 0 4696 0 0 0 4696
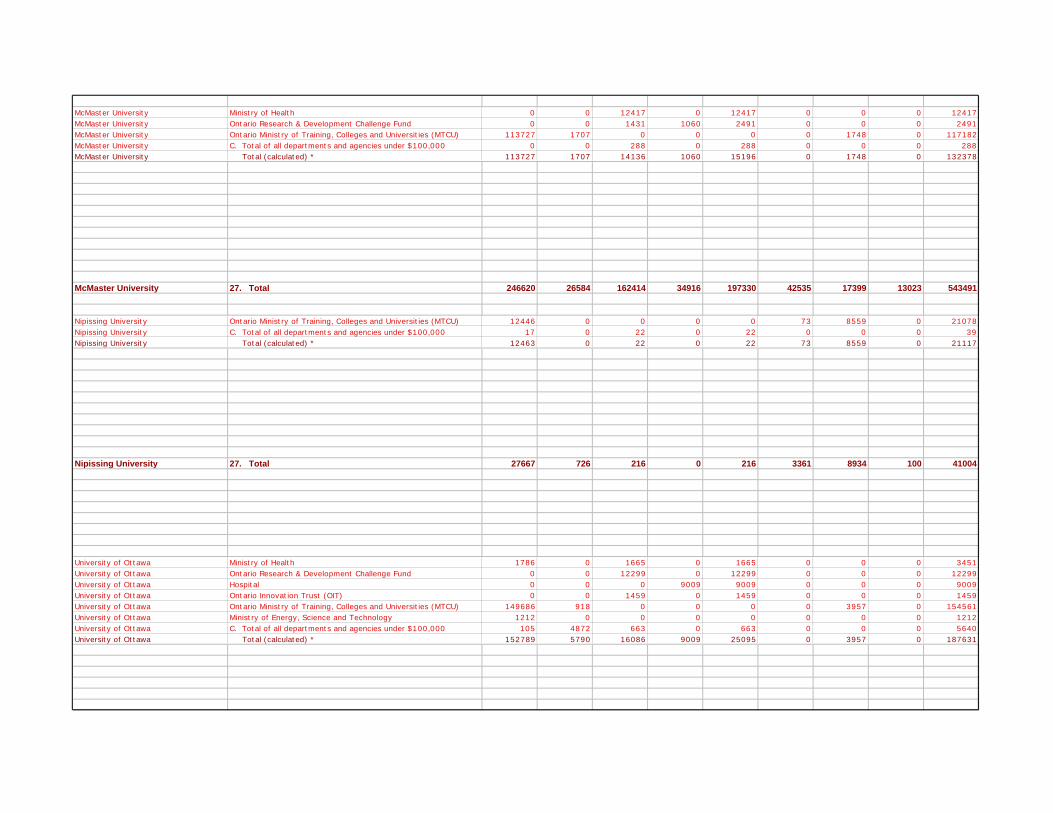
McMaster University 7. Other federal 0 0 20048 0 20048 0 4151 0 24199
McMaster University Ministry of Health 0 0 12417 0 12417 0 0 0 12417McMaster University Ontario Research & Development Challenge Fund 0 0 1431 1060 2491 0 0 0 2491McMaster University Ontario Ministry of Training, Colleges and Universities (MTCU) 113727 1707 0 0 0 0 1748 0 117182McMaster University C. Total of all departments and agencies under $100,000 0 0 288 0 288 0 0 0 288McMaster University Total (calculated) * 113727 1707 14136 1060 15196 0 1748 0 132378McMaster University 9. Municipal 0 0 26129 0 26129 0 0 0 26129
McMaster University 11. Foreign 0 0 10311 0 10311 0 0 0 10311
McMaster University 12. Credit course tuition 81125 0 0 0 0 0 0 0 81125
McMaster University 13. Non-credit tuition 1287 0 0 0 0 0 0 0 1287
McMaster University 14. Other fees 273 0 0 0 0 0 0 0 273
McMaster University 16. Business enterprises 0 25038 0 0 0 0 10048 13023 48109
McMaster University 20. Business enterprises 0 0 30665 30635 61300 0 0 0 61300
McMaster University 21. Foundations 0 0 7584 65 7649 0 0 0 7649
McMaster University 24. Other investment 6946 -161 0 1822 1822 0 1452 0 10059
McMaster University 25. Sale of services and products 0 0 0 0 0 26777 0 0 26777
McMaster University 26. Miscellaneous 43262 0 99 1334 1433 15758 0 0 60453
McMaster University 27. Total 246620 26584 162414 34916 197330 42535 17399 13023 543491
Nipissing University 7. Other federal 75 0 6 0 6 0 0 0 81
Nipissing University Ontario Ministry of Training, Colleges and Universities (MTCU) 12446 0 0 0 0 73 8559 0 21078Nipissing University C. Total of all departments and agencies under $100,000 17 0 22 0 22 0 0 0 39Nipissing University Total (calculated) * 12463 0 22 0 22 73 8559 0 21117Nipissing University 12. Credit course tuition 12312 0 0 0 0 0 0 0 12312
Nipissing University 13. Non-credit tuition 148 0 0 0 0 0 0 0 148
Nipissing University 14. Other fees 1412 0 0 0 0 0 0 0 1412
Nipissing University 15. Individuals 0 44 0 0 0 0 13 100 157
Nipissing University 16. Business enterprises 0 140 0 0 0 0 0 0 140
Nipissing University 17. Foundations 0 60 0 0 0 0 0 0 60
Nipissing University 20. Business enterprises 0 0 188 0 188 0 0 0 188
Nipissing University 24. Other investment 42 482 0 0 0 0 362 0 886
Nipissing University 25. Sale of services and products 0 0 0 0 0 3288 0 0 3288
Nipissing University 26. Miscellaneous 1215 0 0 0 0 0 0 0 1215
Nipissing University 27. Total 27667 726 216 0 216 3361 8934 100 41004
University of Ottawa 1. Social Sciences and Humanities Research Council 0 719 3652 117 3769 0 0 0 4488
University of Ottawa 2. Health Canada 0 0 1539 244 1783 0 0 0 1783
University of Ottawa 3. Natural Sciences and Engineering Research Council 0 1529 9972 636 10608 0 0 0 12137
University of Ottawa 4. Canadian Institutes of Health Research (CIHR) 0 0 9371 0 9371 0 0 0 9371
University of Ottawa 5. Canada Foundation for Innovation (CFI) 0 0 11325 1328 12653 0 0 0 12653
University of Ottawa 6. Canada Research chairs 0 0 1974 325 2299 0 0 0 2299
University of Ottawa 7. Other federal 3538 1572 19588 9832 29420 0 204 0 34734
University of Ottawa Ministry of Health 1786 0 1665 0 1665 0 0 0 3451University of Ottawa Ontario Research & Development Challenge Fund 0 0 12299 0 12299 0 0 0 12299University of Ottawa Hospital 0 0 0 9009 9009 0 0 0 9009University of Ottawa Ontario Innovation Trust (OIT) 0 0 1459 0 1459 0 0 0 1459University of Ottawa Ontario Ministry of Training, Colleges and Universities (MTCU) 149686 918 0 0 0 0 3957 0 154561University of Ottawa Ministry of Energy, Science and Technology 1212 0 0 0 0 0 0 0 1212University of Ottawa C. Total of all departments and agencies under $100,000 105 4872 663 0 663 0 0 0 5640University of Ottawa Total (calculated) * 152789 5790 16086 9009 25095 0 3957 0 187631University of Ottawa 9. Municipal 0 1020 187 348 535 0 0 0 1555
University of Ottawa 10. Other provinces 30 0 114 3789 3903 0 0 0 3933
University of Ottawa 11. Foreign 0 0 0 3030 3030 0 0 0 3030
University of Ottawa 12. Credit course tuition 102101 0 0 0 0 0 0 0 102101
University of Ottawa 13. Non-credit tuition 3978 0 0 0 0 0 0 0 3978
University of Ottawa 14. Other fees 7060 0 0 0 0 0 0 0 7060

University of Ottawa 15. Individuals 432 867 1249 0 1249 0 7 796 3351
University of Ottawa 16. Business enterprises 210 760 272 25 297 0 0 650 1917
University of Ottawa 17. Foundations 40 66 3 40 43 0 0 0 149
University of Ottawa 18. Not-for-profit organizations 7 81 278 266 544 0 0 131 763
University of Ottawa 19. Individuals 0 0 33 105 138 0 0 0 138
University of Ottawa 20. Business enterprises 0 0 7337 4315 11652 0 0 0 11652
University of Ottawa 21. Foundations 0 11 4193 9915 14108 0 0 0 14119
University of Ottawa 22. Not-for-profit organizations 7 1119 12171 5761 17932 0 0 0 19058
University of Ottawa 23. Endowment 0 0 0 0 0 0 0 1615 1615
University of Ottawa 24. Other investment 5305 4257 -86 3701 3615 1 1108 0 14286
University of Ottawa 25. Sale of services and products 0 0 0 0 0 3339 0 0 3339
University of Ottawa 26. Miscellaneous 4759 1581 83 71 154 13384 291 0 20169
University of Ottawa 27. Total 280256 19372 99341 52857 152198 16724 5567 3192 477309
Queen's University 1. Social Sciences and Humanities Research Council 0 951 2110 0 2110 0 0 0 3061
Queen's University 2. Health Canada 0 15 730 0 730 0 0 0 745
Queen's University 3. Natural Sciences and Engineering Research Council 0 1974 15169 0 15169 0 0 0 17143
Queen's University 4. Canadian Institutes of Health Research (CIHR) 0 0 10485 0 10485 0 0 0 10485
Queen's University 5. Canada Foundation for Innovation (CFI) 0 0 14652 0 14652 0 0 0 14652
Queen's University 6. Canada Research chairs 0 0 1575 0 1575 0 0 0 1575
Queen's University 7. Other federal 18 869 15282 0 15282 0 248 0 16417
Queen's University Ministry of Trade and Commerce 0 0 2326 0 2326 0 0 0 2326Queen's University Ontario Innovation Trust (OIT) 0 0 14511 0 14511 0 0 0 14511Queen's University Network Centre of Excellence 0 0 2280 0 2280 0 0 0 2280Queen's University Ministry of Energy, Science and Technology 1545 0 0 0 0 0 0 0 1545Queen's University Ministry of Natural Resources 0 0 102 0 102 0 0 0 102Queen's University Ontario Ministry of Training, Colleges and Universities (MTCU) 120168 3540 0 0 0 58 1810 0 125576Queen's University Ministry of Health 56199 720 2326 0 2326 0 0 1250 60495Queen's University Ontario Research & Development Challenge Fund 0 0 7087 0 7087 0 0 0 7087Queen's University Premier's Research Excellence Awards 0 0 1127 0 1127 0 0 0 1127Queen's University C. Total of all departments and agencies under $100,000 -400 575 295 0 295 0 0 0 470Queen's University Total (calculated) * 177512 4835 30054 0 30054 58 1810 1250 215519Queen's University 9. Municipal 0 15 12 0 12 0 0 0 27
Queen's University 10. Other provinces 0 44 33 0 33 0 0 0 77
Queen's University 11. Foreign 0 49 2222 0 2222 0 0 0 2271
Queen's University 12. Credit course tuition 95888 0 0 0 0 0 0 0 95888
Queen's University 13. Non-credit tuition 12541 0 0 0 0 0 0 0 12541
Queen's University 14. Other fees 8256 0 0 0 0 0 0 0 8256
Queen's University 15. Individuals 1580 11675 122 0 122 6 4874 11353 29610
Queen's University 16. Business enterprises 220 3097 203 0 203 0 569 1433 5522
Queen's University 17. Foundations 531 605 293 0 293 0 1171 799 3399
Queen's University 18. Not-for-profit organizations 0 0 0 0 0 0 0 1903 1903
Queen's University 20. Business enterprises 153 493 24591 15108 39699 388 0 0 40733
Queen's University 21. Foundations 0 474 4188 164 4352 0 220 0 5046
Queen's University 22. Not-for-profit organizations 40 1486 11224 35 11259 0 588 0 13373
Queen's University 23. Endowment 2217 14410 818 0 818 0 0 8056 25501
Queen's University 24. Other investment 124 6614 1057 27 1084 -167 2371 0 10026
Queen's University 25. Sale of services and products 0 0 0 0 0 21625 0 0 21625
Queen's University 26. Miscellaneous 966 7295 557 0 557 31240 2390 0 42448
Queen's University 27. Total 300046 54901 135377 15334 150711 53150 14241 24794 597843
Ryerson University 1. Social Sciences and Humanities Research Council 0 0 356 0 356 0 0 0 356
Ryerson University 3. Natural Sciences and Engineering Research Council 0 0 1853 0 1853 0 0 0 1853
Ryerson University 5. Canada Foundation for Innovation (CFI) 0 0 459 0 459 0 0 0 459
Ryerson University 7. Other federal 258 0 1566 0 1566 0 0 0 1824
Ryerson University Ontario Ministry of Training, Colleges and Universities (MTCU) 86780 0 0 0 0 331 1254 0 88365
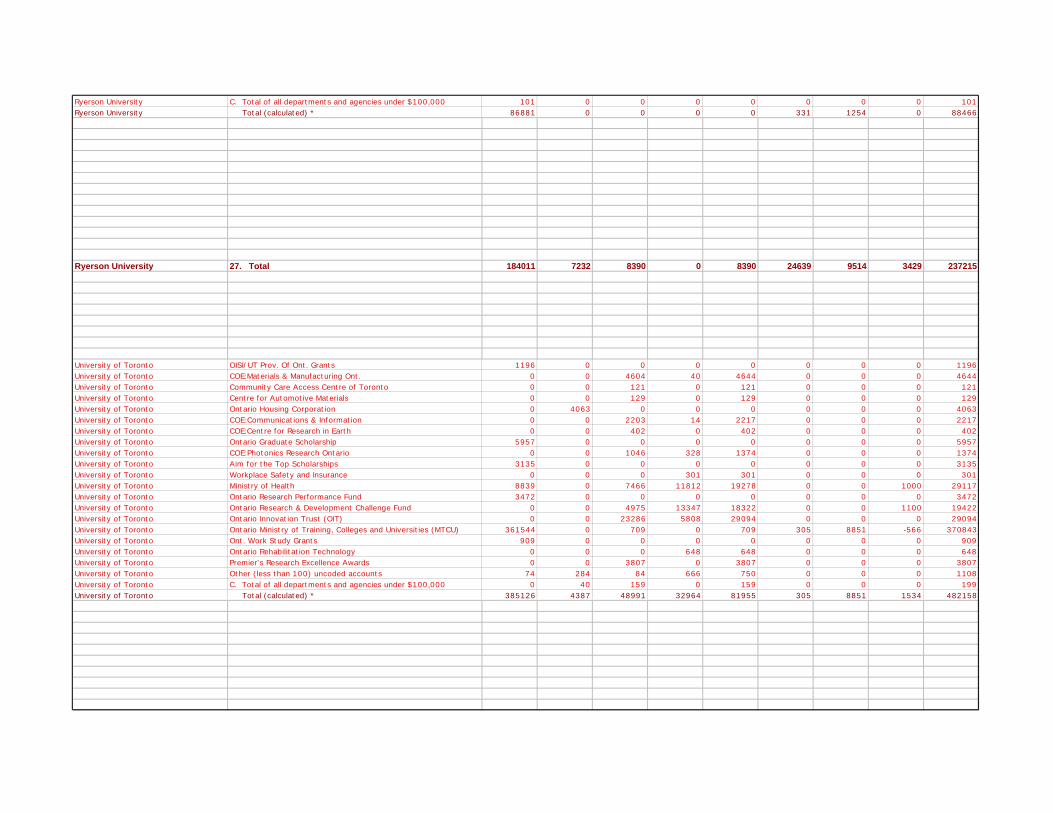
Ryerson University C. Total of all departments and agencies under $100,000 101 0 0 0 0 0 0 0 101Ryerson University Total (calculated) * 86881 0 0 0 0 331 1254 0 88466Ryerson University 9. Municipal 0 0 112 0 112 87 0 0 199
Ryerson University 12. Credit course tuition 81744 0 0 0 0 0 0 0 81744
Ryerson University 13. Non-credit tuition 2870 0 0 0 0 0 0 0 2870
Ryerson University 14. Other fees 6269 0 0 0 0 0 0 0 6269
Ryerson University 16. Business enterprises 0 6496 36 0 36 0 0 3412 9944
Ryerson University 19. Individuals 548 0 2067 0 2067 0 0 0 2615
Ryerson University 20. Business enterprises 784 65 322 0 322 39 0 0 1210
Ryerson University 21. Foundations 0 0 42 0 42 0 0 0 42
Ryerson University 22. Not-for-profit organizations 37 0 156 0 156 0 0 0 193
Ryerson University 23. Endowment 0 0 0 0 0 0 0 17 17
Ryerson University 24. Other investment 2188 218 0 0 0 3 2065 0 4474
Ryerson University 25. Sale of services and products 0 0 0 0 0 17739 0 0 17739
Ryerson University 26. Miscellaneous 2432 453 1421 0 1421 6440 6195 0 16941
Ryerson University 27. Total 184011 7232 8390 0 8390 24639 9514 3429 237215
University of Toronto 1. Social Sciences and Humanities Research Council 0 0 10741 14 10755 0 0 0 10755
University of Toronto 2. Health Canada 0 413 2172 769 2941 0 0 0 3354
University of Toronto 3. Natural Sciences and Engineering Research Council 0 0 40805 0 40805 0 0 0 40805
University of Toronto 4. Canadian Institutes of Health Research (CIHR) 0 0 35930 44430 80360 0 0 0 80360
University of Toronto 5. Canada Foundation for Innovation (CFI) 0 0 1017 5813 6830 0 0 0 6830
University of Toronto 6. Canada Research chairs 0 0 6017 0 6017 0 0 0 6017
University of Toronto 7. Other federal 0 32 41860 5793 47653 0 490 0 48175
University of Toronto OISI/UT Prov. Of Ont. Grants 1196 0 0 0 0 0 0 0 1196University of Toronto COE:Materials & Manufacturing Ont. 0 0 4604 40 4644 0 0 0 4644University of Toronto Community Care Access Centre of Toronto 0 0 121 0 121 0 0 0 121University of Toronto Centre for Automotive Materials 0 0 129 0 129 0 0 0 129University of Toronto Ontario Housing Corporation 0 4063 0 0 0 0 0 0 4063University of Toronto COE:Communications & Information 0 0 2203 14 2217 0 0 0 2217University of Toronto COE:Centre for Research in Earth 0 0 402 0 402 0 0 0 402University of Toronto Ontario Graduate Scholarship 5957 0 0 0 0 0 0 0 5957University of Toronto COE:Photonics Research Ontario 0 0 1046 328 1374 0 0 0 1374University of Toronto Aim for the Top Scholarships 3135 0 0 0 0 0 0 0 3135University of Toronto Workplace Safety and Insurance 0 0 0 301 301 0 0 0 301University of Toronto Ministry of Health 8839 0 7466 11812 19278 0 0 1000 29117University of Toronto Ontario Research Performance Fund 3472 0 0 0 0 0 0 0 3472University of Toronto Ontario Research & Development Challenge Fund 0 0 4975 13347 18322 0 0 1100 19422University of Toronto Ontario Innovation Trust (OIT) 0 0 23286 5808 29094 0 0 0 29094University of Toronto Ontario Ministry of Training, Colleges and Universities (MTCU) 361544 0 709 0 709 305 8851 -566 370843University of Toronto Ont. Work Study Grants 909 0 0 0 0 0 0 0 909University of Toronto Ontario Rehabilitation Technology 0 0 0 648 648 0 0 0 648University of Toronto Premier's Research Excellence Awards 0 0 3807 0 3807 0 0 0 3807University of Toronto Other (less than 100) uncoded accounts 74 284 84 666 750 0 0 0 1108University of Toronto C. Total of all departments and agencies under $100,000 0 40 159 0 159 0 0 0 199University of Toronto Total (calculated) * 385126 4387 48991 32964 81955 305 8851 1534 482158University of Toronto 9. Municipal 0 0 327 0 327 0 0 0 327
University of Toronto 10. Other provinces 0 0 78 38 116 0 0 0 116
University of Toronto 11. Foreign 0 0 4843 11852 16695 0 0 0 16695
University of Toronto 12. Credit course tuition 256154 0 0 0 0 0 0 0 256154
University of Toronto 13. Non-credit tuition 26717 0 0 0 0 0 0 0 26717
University of Toronto 14. Other fees 64267 0 0 0 0 0 0 0 64267
University of Toronto 15. Individuals 0 14927 676 0 676 0 5023 21414 42040
University of Toronto 16. Business enterprises 0 5286 820 0 820 0 1031 9044 16181
University of Toronto 17. Foundations 0 4111 712 0 712 0 52 56818 61693
University of Toronto 18. Not-for-profit organizations 0 1249 0 0 0 0 10 1210 2469

University of Toronto 19. Individuals 0 0 0 648 648 0 0 0 648
University of Toronto 20. Business enterprises 0 1955 20515 41704 62219 0 0 0 64174
University of Toronto 21. Foundations 0 389 10030 20337 30367 0 0 0 30756
University of Toronto 22. Not-for-profit organizations 0 3403 22776 43221 65997 0 0 0 69400
University of Toronto 23. Endowment 35950 -48921 -665 0 -665 0 0 0 -13636
University of Toronto 24. Other investment -7042 1861 556 0 556 1069 4954 0 1398
University of Toronto 25. Sale of services and products 0 0 0 0 0 85242 0 0 85242
University of Toronto 26. Miscellaneous 5977 0 0 0 0 15785 1414 0 23176
University of Toronto 27. Total 767149 -10908 248201 207583 455784 102401 21825 90020 1426271
Trent University 1. Social Sciences and Humanities Research Council 26 0 505 0 505 0 0 0 531
Trent University 2. Health Canada 0 0 550 0 550 0 0 0 550
Trent University 3. Natural Sciences and Engineering Research Council 0 287 2624 0 2624 0 0 0 2911
Trent University 4. Canadian Institutes of Health Research (CIHR) 0 0 226 0 226 0 0 0 226
Trent University 5. Canada Foundation for Innovation (CFI) 0 0 934 0 934 0 0 0 934
Trent University 6. Canada Research chairs 0 0 425 0 425 0 0 0 425
Trent University 7. Other federal 96 37 2824 0 2824 1 0 0 2958
Trent University Ontario Ministry of Training, Colleges and Universities (MTCU) 24572 196 23 0 23 8 436 0 25235Trent University Ministry of Natural Resources 490 0 668 0 668 0 0 0 1158Trent University Ministry of Health 0 0 300 0 300 0 0 0 300Trent University Ontario Innovation Trust (OIT) 0 0 928 0 928 0 0 0 928Trent University C. Total of all departments and agencies under $100,000 4 0 78 0 78 0 0 0 82Trent University Total (calculated) * 25066 196 1997 0 1997 8 436 0 27703Trent University 10. Other provinces 0 0 16 0 16 0 0 0 16
Trent University 12. Credit course tuition 22830 0 0 0 0 0 0 0 22830
Trent University 13. Non-credit tuition 557 0 0 0 0 0 0 0 557
Trent University 14. Other fees 2996 0 0 0 0 0 0 0 2996
Trent University 15. Individuals 395 189 115 0 115 0 197 762 1658
Trent University 16. Business enterprises 38 112 656 0 656 0 270 84 1160
Trent University 17. Foundations 8 133 65 0 65 0 0 0 206
Trent University 18. Not-for-profit organizations 64 5 5 0 5 0 0 1 75
Trent University 20. Business enterprises 23 32 580 0 580 0 0 0 635
Trent University 21. Foundations 0 7 222 0 222 0 0 0 229
Trent University 22. Not-for-profit organizations 0 7 93 0 93 0 0 0 100
Trent University 23. Endowment 0 808 0 0 0 0 0 104 912
Trent University 24. Other investment 543 71 0 0 0 9 1196 0 1819
Trent University 25. Sale of services and products 0 0 0 0 0 8126 0 0 8126
Trent University 26. Miscellaneous 1021 26 0 0 0 351 2013 0 3411
Trent University 27. Total 53663 1910 11837 0 11837 8495 4112 951 80968
University of Waterloo 1. Social Sciences and Humanities Research Council 0 544 1610 0 1610 0 0 0 2154
University of Waterloo 2. Health Canada 0 0 580 0 580 0 0 0 580
University of Waterloo 3. Natural Sciences and Engineering Research Council 15 3132 22153 0 22153 0 0 0 25300
University of Waterloo 4. Canadian Institutes of Health Research (CIHR) 0 0 1174 0 1174 0 0 0 1174
University of Waterloo 5. Canada Foundation for Innovation (CFI) 0 0 4502 0 4502 0 0 0 4502
University of Waterloo 6. Canada Research chairs 0 0 1175 0 1175 0 0 0 1175
University of Waterloo 7. Other federal 0 0 11961 0 11961 0 0 0 11961
University of Waterloo Ministry of Energy, Science and Technology 13 0 102 0 102 0 0 0 115University of Waterloo Ontario Research & Development Challenge Fund 0 0 992 0 992 0 0 734 1726University of Waterloo Ontario Innovation Trust (OIT) 0 0 6528 0 6528 0 0 0 6528University of Waterloo Premier's Research Excellence Awards 0 0 1010 0 1010 0 0 0 1010University of Waterloo Ontario Ministry of Training, Colleges and Universities (MTCU) 113301 4020 0 0 0 0 1752 0 119073University of Waterloo Ministry of Health 0 0 1972 0 1972 0 0 0 1972University of Waterloo Ontario Centres of Excellence 0 0 4965 0 4965 0 0 0 4965University of Waterloo Ontario Research Performance Fund 2107 0 0 0 0 0 0 0 2107University of Waterloo Ministry of Citizenship, Culture and Recreation 0 0 400 0 400 0 0 0 400
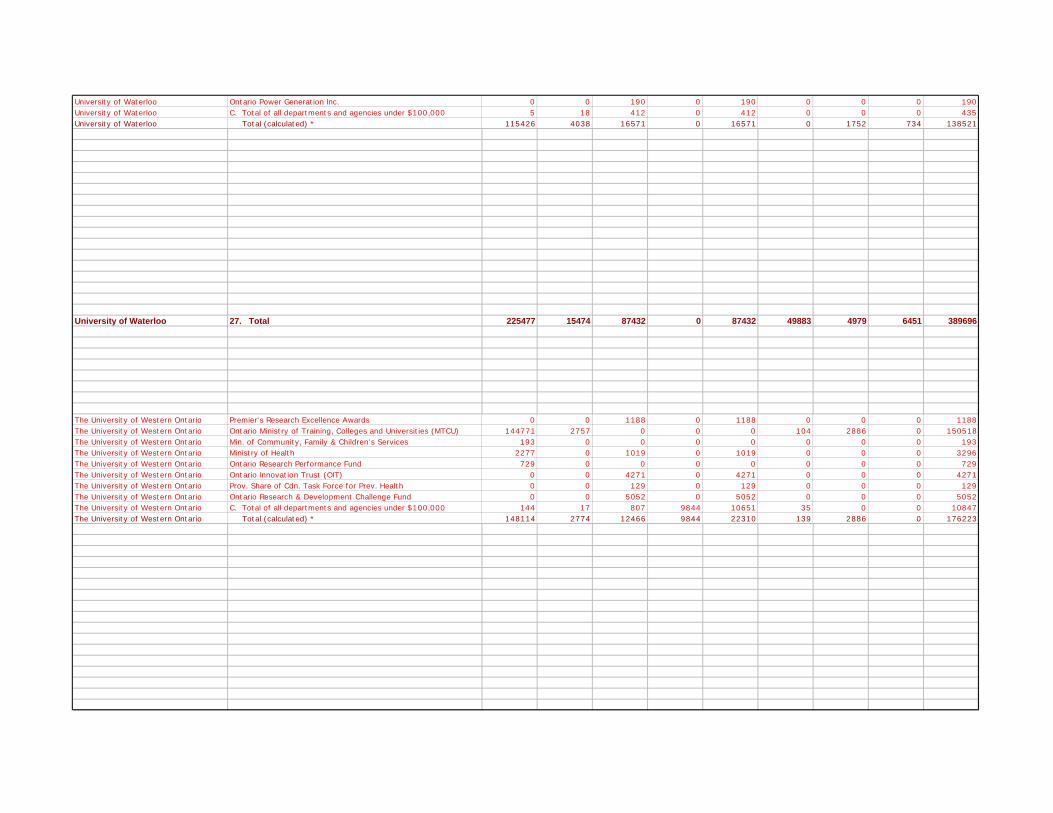
University of Waterloo Ontario Power Generation Inc. 0 0 190 0 190 0 0 0 190University of Waterloo C. Total of all departments and agencies under $100,000 5 18 412 0 412 0 0 0 435University of Waterloo Total (calculated) * 115426 4038 16571 0 16571 0 1752 734 138521University of Waterloo 9. Municipal 12 0 371 0 371 0 0 0 383
University of Waterloo 10. Other provinces 0 0 29 0 29 0 0 0 29
University of Waterloo 11. Foreign 0 0 289 0 289 0 0 0 289
University of Waterloo 12. Credit course tuition 88461 0 0 0 0 0 0 0 88461
University of Waterloo 13. Non-credit tuition 462 0 0 0 0 0 0 0 462
University of Waterloo 14. Other fees 12032 0 0 0 0 0 0 0 12032
University of Waterloo 15. Individuals 224 2786 402 0 402 0 928 3305 7645
University of Waterloo 16. Business enterprises 123 1529 663 0 663 0 509 1814 4638
University of Waterloo 17. Foundations 38 470 214 0 214 0 156 557 1435
University of Waterloo 18. Not-for-profit organizations 3 34 50 0 50 0 12 41 140
University of Waterloo 20. Business enterprises 0 0 15400 0 15400 0 0 0 15400
University of Waterloo 21. Foundations 0 0 947 0 947 0 0 0 947
University of Waterloo 22. Not-for-profit organizations 55 0 5014 0 5014 0 0 0 5069
University of Waterloo 23. Endowment 0 2768 0 0 0 0 0 0 2768
University of Waterloo 24. Other investment 2950 18 350 0 350 0 1460 0 4778
University of Waterloo 25. Sale of services and products 0 0 0 0 0 34361 0 0 34361
University of Waterloo 26. Miscellaneous 5676 155 3977 0 3977 15522 162 0 25492
University of Waterloo 27. Total 225477 15474 87432 0 87432 49883 4979 6451 389696
The University of Western Ontario 1. Social Sciences and Humanities Research Council 0 879 1806 0 1806 0 0 0 2685
The University of Western Ontario 2. Health Canada 0 0 281 0 281 0 0 0 281
The University of Western Ontario 3. Natural Sciences and Engineering Research Council 266 1994 12280 0 12280 0 0 0 14540
The University of Western Ontario 4. Canadian Institutes of Health Research (CIHR) 0 0 15135 0 15135 0 0 0 15135
The University of Western Ontario 5. Canada Foundation for Innovation (CFI) 0 0 5097 0 5097 0 0 0 5097
The University of Western Ontario 6. Canada Research chairs 0 0 2175 0 2175 0 0 0 2175
The University of Western Ontario 7. Other federal 1000 808 9864 8676 18540 26 0 0 20374
The University of Western Ontario Premier's Research Excellence Awards 0 0 1188 0 1188 0 0 0 1188The University of Western Ontario Ontario Ministry of Training, Colleges and Universities (MTCU) 144771 2757 0 0 0 104 2886 0 150518The University of Western Ontario Min. of Community, Family & Children's Services 193 0 0 0 0 0 0 0 193The University of Western Ontario Ministry of Health 2277 0 1019 0 1019 0 0 0 3296The University of Western Ontario Ontario Research Performance Fund 729 0 0 0 0 0 0 0 729The University of Western Ontario Ontario Innovation Trust (OIT) 0 0 4271 0 4271 0 0 0 4271The University of Western Ontario Prov. Share of Cdn. Task Force for Prev. Health 0 0 129 0 129 0 0 0 129The University of Western Ontario Ontario Research & Development Challenge Fund 0 0 5052 0 5052 0 0 0 5052The University of Western Ontario C. Total of all departments and agencies under $100,000 144 17 807 9844 10651 35 0 0 10847The University of Western Ontario Total (calculated) * 148114 2774 12466 9844 22310 139 2886 0 176223The University of Western Ontario 9. Municipal 14 1003 0 0 0 31 0 0 1048
The University of Western Ontario 10. Other provinces 10 9 0 0 0 0 0 0 19
The University of Western Ontario 11. Foreign 470 49 829 7561 8390 0 0 0 8909
The University of Western Ontario 12. Credit course tuition 137614 0 0 0 0 0 0 0 137614
The University of Western Ontario 13. Non-credit tuition 9200 0 0 0 0 0 0 0 9200
The University of Western Ontario 14. Other fees 12037 0 0 0 0 0 0 0 12037
The University of Western Ontario 15. Individuals 1348 5675 6609 56 6665 13855 436 7667 35646
The University of Western Ontario 16. Business enterprises 3037 9130 723 0 723 585 0 1325 14800
The University of Western Ontario 17. Foundations 377 2651 520 0 520 0 0 517 4065
The University of Western Ontario 18. Not-for-profit organizations 146 1252 14 0 14 0 0 288 1700
The University of Western Ontario 19. Individuals 7 0 0 0 0 0 0 0 7
The University of Western Ontario 20. Business enterprises 869 54 9457 10002 19459 0 0 0 20382
The University of Western Ontario 21. Foundations 93 574 4772 3877 8649 0 0 0 9316
The University of Western Ontario 22. Not-for-profit organizations 586 8 6957 20181 27138 0 0 0 27732
The University of Western Ontario 23. Endowment 0 0 0 0 0 0 0 -12453 -12453
The University of Western Ontario 24. Other investment 7464 8519 88 0 88 501 2320 0 18892
The University of Western Ontario 25. Sale of services and products 0 0 0 0 0 77929 0 0 77929
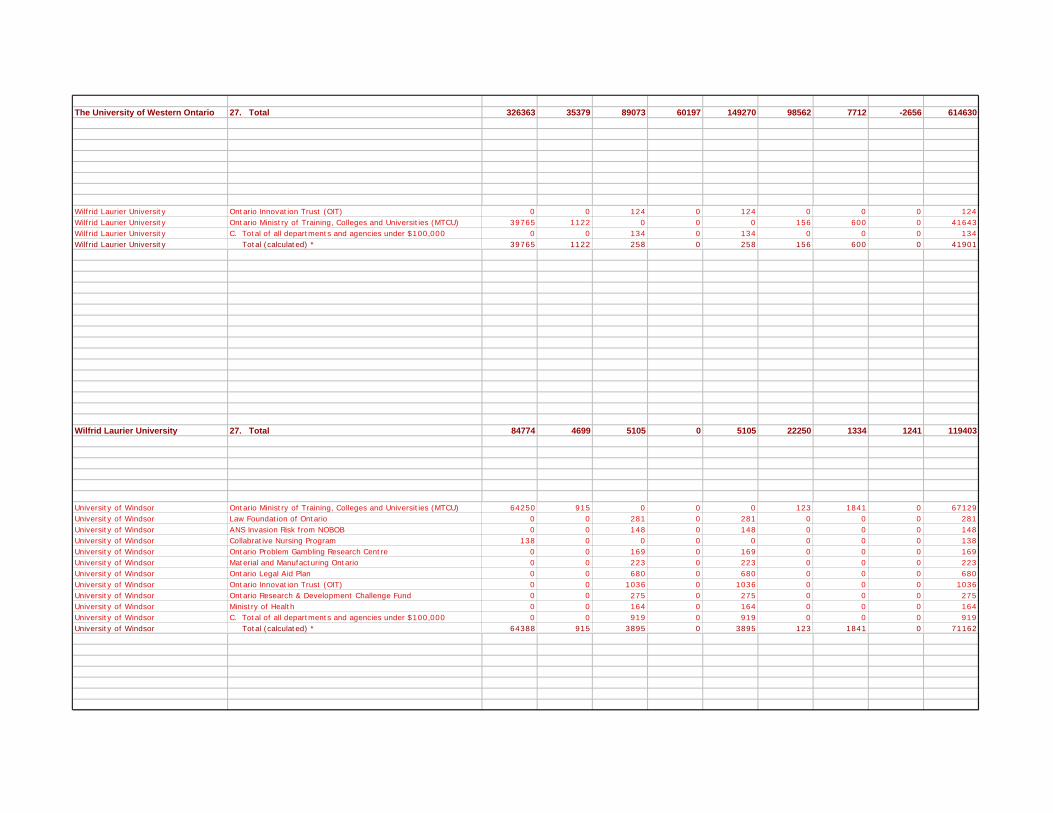
The University of Western Ontario 26. Miscellaneous 3711 0 0 0 0 5496 2070 0 11277
The University of Western Ontario 27. Total 326363 35379 89073 60197 149270 98562 7712 -2656 614630
Wilfrid Laurier University 1. Social Sciences and Humanities Research Council 0 0 790 0 790 0 0 0 790
Wilfrid Laurier University 2. Health Canada 0 0 404 0 404 0 0 0 404
Wilfrid Laurier University 3. Natural Sciences and Engineering Research Council 0 0 937 0 937 0 0 0 937
Wilfrid Laurier University 4. Canadian Institutes of Health Research (CIHR) 0 0 277 0 277 0 0 0 277
Wilfrid Laurier University 5. Canada Foundation for Innovation (CFI) 0 0 111 0 111 0 0 0 111
Wilfrid Laurier University 6. Canada Research chairs 0 0 200 0 200 0 0 0 200
Wilfrid Laurier University 7. Other federal 0 0 1155 0 1155 0 0 0 1155
Wilfrid Laurier University Ontario Innovation Trust (OIT) 0 0 124 0 124 0 0 0 124Wilfrid Laurier University Ontario Ministry of Training, Colleges and Universities (MTCU) 39765 1122 0 0 0 156 600 0 41643Wilfrid Laurier University C. Total of all departments and agencies under $100,000 0 0 134 0 134 0 0 0 134Wilfrid Laurier University Total (calculated) * 39765 1122 258 0 258 156 600 0 41901Wilfrid Laurier University 10. Other provinces 0 0 29 0 29 0 0 0 29
Wilfrid Laurier University 11. Foreign 0 0 11 0 11 0 0 0 11
Wilfrid Laurier University 12. Credit course tuition 41330 0 0 0 0 0 0 0 41330
Wilfrid Laurier University 14. Other fees 3066 0 0 0 0 0 0 0 3066
Wilfrid Laurier University 15. Individuals 0 1958 0 0 0 0 291 905 3154
Wilfrid Laurier University 16. Business enterprises 0 707 0 0 0 0 116 275 1098
Wilfrid Laurier University 17. Foundations 0 52 0 0 0 0 20 38 110
Wilfrid Laurier University 18. Not-for-profit organizations 0 24 0 0 0 0 0 13 37
Wilfrid Laurier University 19. Individuals 0 0 158 0 158 0 0 0 158
Wilfrid Laurier University 20. Business enterprises 0 0 422 0 422 0 0 0 422
Wilfrid Laurier University 21. Foundations 0 0 233 0 233 0 0 0 233
Wilfrid Laurier University 22. Not-for-profit organizations 0 0 120 0 120 0 0 0 120
Wilfrid Laurier University 23. Endowment 0 0 0 0 0 0 0 10 10
Wilfrid Laurier University 24. Other investment 544 716 0 0 0 0 223 0 1483
Wilfrid Laurier University 25. Sale of services and products 0 0 0 0 0 12100 0 0 12100
Wilfrid Laurier University 26. Miscellaneous 69 120 0 0 0 9994 84 0 10267
Wilfrid Laurier University 27. Total 84774 4699 5105 0 5105 22250 1334 1241 119403
University of Windsor 1. Social Sciences and Humanities Research Council 0 157 222 0 222 0 0 0 379
University of Windsor 3. Natural Sciences and Engineering Research Council 0 290 4992 0 4992 0 0 0 5282
University of Windsor 5. Canada Foundation for Innovation (CFI) 0 0 1710 0 1710 0 0 0 1710
University of Windsor 6. Canada Research chairs 0 0 500 0 500 0 0 0 500
University of Windsor 7. Other federal 0 0 3186 0 3186 0 0 0 3186
University of Windsor Ontario Ministry of Training, Colleges and Universities (MTCU) 64250 915 0 0 0 123 1841 0 67129University of Windsor Law Foundation of Ontario 0 0 281 0 281 0 0 0 281University of Windsor ANS Invasion Risk from NOBOB 0 0 148 0 148 0 0 0 148University of Windsor Collabrative Nursing Program 138 0 0 0 0 0 0 0 138University of Windsor Ontario Problem Gambling Research Centre 0 0 169 0 169 0 0 0 169University of Windsor Material and Manufacturing Ontario 0 0 223 0 223 0 0 0 223University of Windsor Ontario Legal Aid Plan 0 0 680 0 680 0 0 0 680University of Windsor Ontario Innovation Trust (OIT) 0 0 1036 0 1036 0 0 0 1036University of Windsor Ontario Research & Development Challenge Fund 0 0 275 0 275 0 0 0 275University of Windsor Ministry of Health 0 0 164 0 164 0 0 0 164University of Windsor C. Total of all departments and agencies under $100,000 0 0 919 0 919 0 0 0 919University of Windsor Total (calculated) * 64388 915 3895 0 3895 123 1841 0 71162University of Windsor 11. Foreign 0 0 257 0 257 0 0 0 257
University of Windsor 12. Credit course tuition 54833 0 0 0 0 0 0 0 54833
University of Windsor 14. Other fees 4842 0 0 0 0 0 0 0 4842
University of Windsor 15. Individuals 0 1541 0 0 0 0 26 24 1591
University of Windsor 16. Business enterprises 0 1672 0 0 0 0 362 1162 3196
University of Windsor 17. Foundations 0 66 0 0 0 0 211 0 277
University of Windsor 18. Not-for-profit organizations 0 0 0 0 0 0 88 0 88

University of Windsor 19. Individuals 0 0 13 0 13 0 0 0 13
University of Windsor 20. Business enterprises 0 0 1503 0 1503 0 0 0 1503
University of Windsor 21. Foundations 0 0 90 0 90 0 0 0 90
University of Windsor 22. Not-for-profit organizations 0 0 214 0 214 0 0 0 214
University of Windsor 23. Endowment 0 0 0 0 0 0 0 59 59
University of Windsor 24. Other investment 1689 1418 0 0 0 0 627 0 3734
University of Windsor 25. Sale of services and products 0 0 0 0 0 11129 0 0 11129
University of Windsor 26. Miscellaneous 3656 758 0 0 0 9728 -1746 0 12396
University of Windsor 27. Total 129408 6817 16582 0 16582 20980 1409 1245 176441
York University 1. Social Sciences and Humanities Research Council 0 0 6292 0 6292 0 0 0 6292
York University 2. Health Canada 0 0 480 0 480 0 0 0 480
York University 3. Natural Sciences and Engineering Research Council 0 0 8964 0 8964 0 0 0 8964
York University 4. Canadian Institutes of Health Research (CIHR) 0 0 930 0 930 0 0 0 930
York University 5. Canada Foundation for Innovation (CFI) 0 0 2893 0 2893 0 0 0 2893
York University 6. Canada Research chairs 0 0 1200 0 1200 0 0 0 1200
York University 7. Other federal 1749 860 7210 0 7210 0 0 0 9819
York University Ontario Innovation Trust (OIT) 0 0 3072 0 3072 0 0 0 3072York University Ontario Tobacco Research Unit 0 0 226 0 226 0 0 0 226York University Superbuild grants transfer from Seneca College 0 0 0 0 0 0 23490 0 23490York University Premier's Research Excellence Awards 0 0 213 0 213 0 0 0 213York University Ontario Ministry of Training, Colleges and Universities (MTCU) 180894 120 272 0 272 289 2494 0 184069York University Ontario Graduate Scholarship 0 1834 0 0 0 0 0 0 1834York University C. Total of all departments and agencies under $100,000 175 0 156 0 156 0 0 0 331York University Total (calculated) * 181069 1954 3939 0 3939 289 25984 0 213235York University 9. Municipal 13 0 909 0 909 0 298 0 1220
York University 10. Other provinces 0 0 8 0 8 0 0 0 8
York University 11. Foreign 0 0 2470 0 2470 0 0 0 2470
York University 12. Credit course tuition 165823 0 0 0 0 0 0 0 165823
York University 13. Non-credit tuition 16812 0 0 0 0 0 0 0 16812
York University 14. Other fees 20749 0 0 0 0 0 0 0 20749
York University 15. Individuals 1059 739 0 0 0 0 0 0 1798
York University 16. Business enterprises 600 419 0 0 0 0 1385 3548 5952
York University 17. Foundations 565 394 0 0 0 0 1250 0 2209
York University 20. Business enterprises 317 222 1426 0 1426 0 0 0 1965
York University 21. Foundations 530 369 3024 0 3024 0 0 0 3923
York University 22. Not-for-profit organizations 459 320 2457 0 2457 0 0 0 3236
York University 23. Endowment 0 5700 0 0 0 0 0 1685 7385
York University 24. Other investment 2605 0 0 0 0 0 6898 0 9503
York University 25. Sale of services and products 0 0 0 0 0 47131 0 0 47131
York University 26. Miscellaneous 8890 1643 0 0 0 1909 2578 0 15020
York University 27. Total 401240 12620 42202 0 42202 49329 38393 5233 549017


![Cecilia Skingsley: Considerations for a cashless future · 3 [8] good time, before cash usage has declined to such a point that cash is no longer a generally accepted means of payment](https://img.pdfslide.net/doc/110x75/5e2fbf554489b23b3f37d45f/cecilia-skingsley-considerations-for-a-cashless-future-3-8-good-time-before.jpg)