Embed Size (px)
Citation preview

DRAF
TPHASE 2 ENVIRONMENTAL SITE ASSESSMENT
GLENELG DRY CLEANERS
37-41 CLIFF STREET, GLENELG EAST
NOVEMBER 2004 DOC. REF: SG0411789RP01
REVISION 1
FOR
GLENELG DRY CLEANERS
S o i l & G r o u n d w a t e r C o n s u l t i n g
F i r s t F l o o r 2 0 7 T h e P a r a d e N o r w o o d S A 5 0 6 7 P O B o x 5 5 2 G l e n s i d e S A 5 0 6 5 T : + 6 1 8 8 4 3 1 7 1 1 3 F : + 6 1 8 8 4 3 1 7 1 1 5
A C N 1 0 0 2 2 0 4 7 9 A B N 6 2 1 0 0 2 2 0 4 7 9
REPORT

DRAF
T
T AR
An environmental site assessment (ESA) was undertaken at the Glenelg Dry Cleaners (GDC) site at 37 - 41Cliff Street, Glenelg East. The primary aim of the investigation was to identify areas of likely soil andgroundwater contamination resulting from either current or former activities at the site, using both targeted andgrid-based investigation locations.
The site is currently operationing as a dry cleaning operation, which is consistent with site dry cleaningactivities for approximately 50 years.
The investigations included advancing 8 soil boreholes across the site and laboratory analysis of selected soilsamples for chemicals of interest. Four groundwater wells were also installed at the site. The wells weregauged, purged and sampled on 7 October.
The chemicals of interest analysed by the laboratory include metals, petroleum hydrocarbons, monocyclicaromatic hydrocarbons, poly aromatic hydrocarbons, organochlorine pesticides and chlorinated hydrocarboncompounds (consistent with dry cleaning operations). Selected samples were also analysed for a wide rangeof inorganic and organic compounds typically referred to as a Victorian EPA screen.
The results of investigation identified:
Shallow fill overlying silty sands and sandy clay natural soils
Concentrations of PCE between 1.5 mg/kg and 9 mg/kg were reported in the upper soils (0 to 0.7 mdepth) at below the existing dry cleaning operations building, southern boundary storage area andformer spirit store.
Detectable soil petroleum hydrocarbon concentrations at the location of GW2 and SB2. Thehydrocarbon concentrations were below the assessment criteria and concentrations in sampleGW2/4 appeared associated with detectable groundwater hydrocarbon concentrations at GW2.
Groundwater standing water level was measured between 3.6 m and 4.1 m below ground surface.
Concentrations of filterable metals were low and generally below the EPP Water Quality Criteria(2003).
Petroleum hydrocarbon impacts to groundwater were identified in the four wells at the site. Theconcentrations of the hydrocarbons exceed the adopted criteria in GW1, GW2 and GW4.
VOCs impacts to groundwater were encountered in the four wells at the site. These included cis-1,2-DCE, TCE and PCE.
ESA Phase 2 – Glenelg Dry Cleaners, 31-47 Cliff Street, Glenelg East Page ES(i) W:\Projects\SG041189_ESA Glenelg DC\Report\SG041189rp01.doc Revision 0

DRAF
T
Concentrations of cis-1,2-DCE and TCE in GW4 are one order of magnitude above the assessmentcriteria, with trace levels (below the criteria) also reported in GW2.
Detectable PCE concentrations were measured in the four wells at the site. The concentration ofPCE exceeds the EPP potable water criteria in wells GW1, GW3 and GW4 by up to 100 times thecriteria.
The PCE concentrations of 5.3 mg/L (GW1) and 5.5 mg/L (GW4) occur within 5 m of the western siteboundary and given the inferred north westerly groundwater flow direction, there is potential forgroundwater PCE concentrations above the EPP potable water criteria to occur off site below theadjacent residential properties.
The extent and nature of the PCE groundwater concentrations source are currently unknown.
R
The current density of investigation locations is considered insufficient to allow the assessment of the sitecontamination to a level that would be accepted by an environmental auditor in accordance with therequirements of the SA EPA. Therefore, should development of the site be a desirable objective, then werecommend an environmental auditor be appointed for the site to review the existing data and identify furtherinvestigation requirements.
Additionally due to the identified PCE groundwater concentrations, in accordance with the South AustraliaEnvironment Protection Act 1993, it is recommended that the SA EPA be notified of the groundwater impactas soon as practicable.
ESA Phase 2 – Glenelg Dry Cleaners, 31-47 Cliff Street, Glenelg East Page ES(ii) W:\Projects\SG041189_ESA Glenelg DC\Report\SG041189rp01.doc Revision 0

DRAF
T
TA F T T
EXECUTIVE SUMMARY ..............................................................................................................................ES(I)
1. INTRODUCTION........................................................................................................................................1
2. BACKGROUND INFORMATION ...............................................................................................................22.1 Site History Information......................................................................................................................22.2 Site Inspection, Layout & Operations.................................................................................................22.3 Regional Geology and Hydrogeology ................................................................................................2
3. SCOPE OF WORK ....................................................................................................................................33.1 Methodology ......................................................................................................................................33.2 Rationale for Soil Bore / Groundwater Well Locations .......................................................................33.3 Soil Investigations ..............................................................................................................................43.4 Groundwater Investigations ...............................................................................................................43.5 Laboratory Analysis ...........................................................................................................................5
3.5.1 Soils.................................................................................................................................................... 53.5.2 Groundwater....................................................................................................................................... 6
3.6 Assessment Guidelines .....................................................................................................................73.6.1 Soils.................................................................................................................................................... 73.6.2 Groundwater....................................................................................................................................... 7
4. RESULTS...................................................................................................................................................94.1 Soils ...................................................................................................................................................9
4.1.1 Soil / Fill Materials Encountered......................................................................................................... 94.1.2 Potential Volatile Contaminants ......................................................................................................... 94.1.3 Soil Analytical Results ........................................................................................................................ 9
4.2 Groundwater ....................................................................................................................................104.2.1 Standing Water Levels & Hydrogeology........................................................................................... 104.2.2 Field Parameters .............................................................................................................................. 114.2.3 Groundwater Analytical Results ....................................................................................................... 11
4.3 Quality Assurance / Quality Control .................................................................................................134.3.1 Field Duplicate Samples................................................................................................................... 134.3.2 Rinsate Blank ................................................................................................................................... 144.3.3 Internal Laboratory QA ..................................................................................................................... 144.3.4 Summary of QA................................................................................................................................ 14
5. SUMMARY...............................................................................................................................................15
6. CONCLUSIONS.......................................................................................................................................17
7. RECOMMENDATIONS............................................................................................................................18
ESA Phase 2 – Glenelg Dry Cleaners, 31-47 Cliff Street, Glenelg East Page i W:\Projects\SG041189_ESA Glenelg DC\Report\SG041189rp01.doc Revision 0

DRAF
T
TATable 1 – Soil Analyses ..................................................................................................................................... 6
Table 2 – Groundwater Analyses....................................................................................................................... 6
Table 3 - Protected Environmental Values (EPP, 2003) .................................................................................... 8
Table 4 – Reduced Water Levels..................................................................................................................... 10
Table 5 – Summary of Field Parameters ......................................................................................................... 11
Table 6 – Summary of RPDs for Duplicate Samples ....................................................................................... 13
F R
Figure 1 – Site location plan
Figure 2 – Site plan showing investigation locations
Figure 3 – Site plan showing soil TPH and PCE results
Figure 4 – Groundwater contours (7 October 2004)
Figure 5 – Site plan showing groundwater TPH and PCE results
A D
Appendix A – Certified Laboratory Certificates & Chain of Custody Documentation
Appendix B - Reports of Borehole Logs & Well Permits
ESA Phase 2 – Glenelg Dry Cleaners, 31-47 Cliff Street, Glenelg East Page ii W:\Projects\SG041189_ESA Glenelg DC\Report\SG041189rp01.doc Revision 0

DRAF
T
TR D T
Soil and Groundwater Pty Ltd was commissioned by Glenelg Dry Cleaners (GDC) to undertake a Phase 2Environmental Site Assessment (ESA) of the site located at 31 - 47 Cliff Street, Glenelg East, South Australia(Figure 1).
It is understood that GDC wish to assess the potential environmental liabilities associated with the site forpossible site redevelopment or divestment. As such, the primary aim of the investigation was to identify areasof likely soil and groundwater contamination resulting from either current or former activities at the site, usingboth targeted and grid-based investigation locations.
This report presents the findings and methodology of the investigation undertaken between September 2004and October 2004, to achieve the abovementioned aims.
ESA Phase 2 – Glenelg Dry Cleaners, 31-47 Cliff Street, Glenelg East Page 1 W:\Projects\SG041189_ESA Glenelg DC\Report\SG041189rp01.doc Revision 0

DRAF
T
A R D F R AT
A Phase 1 ESA (site history) was completed for the site by Koukourou Engineers in November 2002. The sitehistory confirmed that the site has been an operational dry cleaners since the early 1950’s and prior to this theland was used for broad acre farming.
For further site history information please refer to
“Environmental Site History Report”, Koukourou Engineers, dated 14 November 2002, (Ref # Z70958-1)
A site inspection was undertaken on 15 September 2004. The site is rectangular in shape and is currently anoperational dry cleaners. The site topography is generally flat.
The dry cleaning operations are undertaken in a large stone building on the centre of the site. The boilers and surplus equipment are stored in sheds along the eastern boundary of the site, with an operational aboveground diesel storage tank (AST) located between the sheds. The ruins of the former spirit store are locatedin the south western corner of the site with a concrete paved general storage area along the southernboundary. A former shade house area is located along the western boundary with a garage on the northwestern corner of the site.
Two disused underground storage tanks (UST) are located on the site, one adjacent the eastern boundary to the south of the storage sheds and one on the south western corner of the site adjacent the former spirit store.The eastern UST was dipped during the field investigations and appeared to be a 1,000 gallon (4,500 litres)tank with approximately 50 gallons (250 litres) of diesel type fuel remaining in the tank. The condition of thesouth western UST is not known, but its fill point appeared to be sealed with concrete.
The site and features are shown in Figure 1.
R
The Soils Association Mapsheet of the Adelaide Region (1989) indicates the site is underlain by Red BrownEarths consisting of mottled silty clay over brown silty clay with granular structure, slight lime, becoming sandywith depth. The Pooraka Formation underlies the red brown earths at depth.
The Department of Water, Land and Biodiversity Conservation (DWLBC) groundwater database indicates thestanding water level below the site is between 3 and 7 m with a Total Dissolved Solids (TDS) of between 400 mg/L and 3,000 mg/L.
ESA Phase 2 – Glenelg Dry Cleaners, 31-47 Cliff Street, Glenelg East Page 2 W:\Projects\SG041189_ESA Glenelg DC\Report\SG041189rp01.doc Revision 0

DRAF
T
F R
The field investigation and sampling works were undertaken by an environmental engineer between22 September 2004 and 7 October 2004.
An assessment of both soil and groundwater was undertaken in accordance with the National EnvironmentProtection (Assessment of Site Contamination) Measure (NEPM, 1999). The site assessment was alsoundertaken in general accordance with the following guideline documents:
Australian Standard AS 4482.1 “Guide to the sampling and investigation of potentially contaminatedsoil - Part 1: Non-volatile and semi-volatile compounds”, 1997.
Australian Standard AS 4482.2 “Guide to the sampling and investigation of potentially contaminatedsoil - Part 1: Volatile substances”, 1999.
Australian / New Zealand Standard AS/NZS 5667.11 “Water quality – Sampling, Part 11: Guidanceon sampling of groundwaters” 1998.
The sampling methodologies for soil and groundwater are outlined in the following sections.
R
The primary aim of the investigation was to identify any potential soil and groundwater contamination issuesresulting from either current or former activities on the site. Therefore, the soil bores were generally targetedto potential contamination sources across the site. In addition a number of bores were placed on a gridbased pattern around the site features and targeted bores. The investigation locations included:
Soil bores SB1 and SB2 were placed adjacent the former and current boiler sheds and AST;
Soil bore SB3 was located in the former shade house area on the western boundary of the site;
Soil bore SB4 was located through the centre of the concrete storage area on the southernboundary;
Soil bores SB5, SB6, SB7 and SB8 were located on a grid based pattern within the dry cleaningoperations main building;
Groundwater wells GW1 and GW2 were targeted to the existing disused USTs;
Groundwater wells GW3 and GW4 were located on the northern and western boundaries inferreddown hydraulic gradient of the site operations;
ESA Phase 2 – Glenelg Dry Cleaners, 31-47 Cliff Street, Glenelg East Page 3 W:\Projects\SG041189_ESA Glenelg DC\Report\SG041189rp01.doc Revision 0
DRAF
T
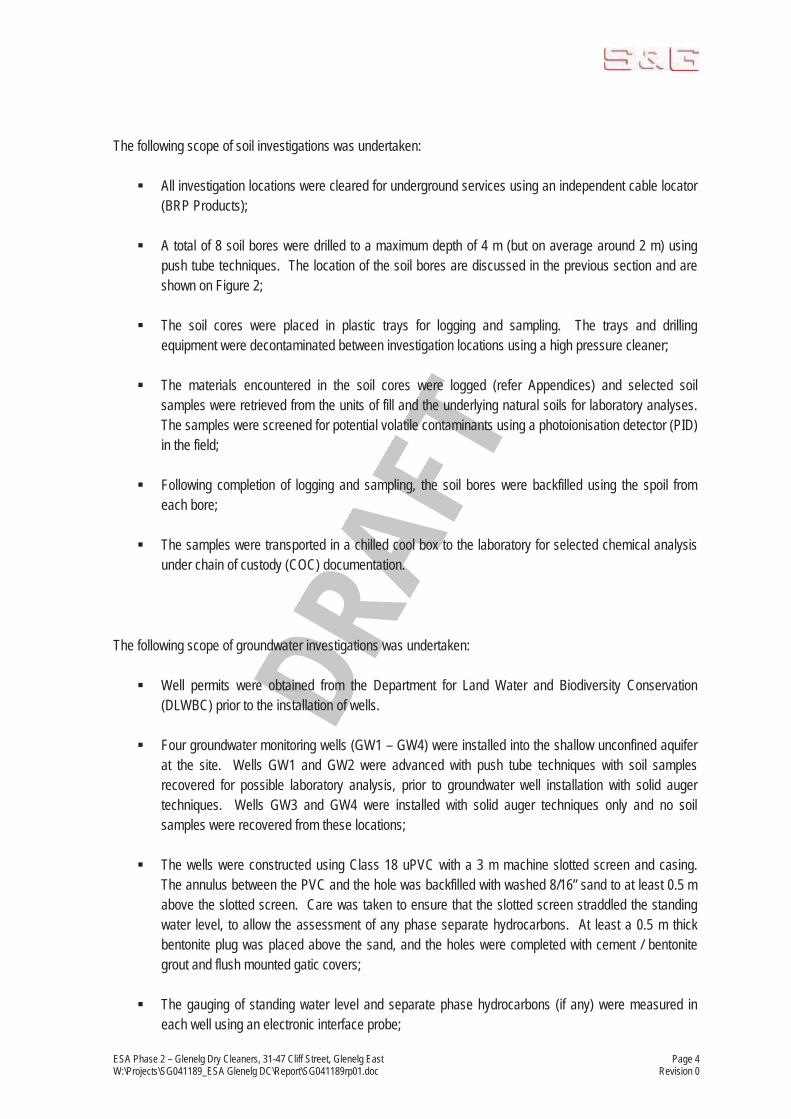
The following scope of soil investigations was undertaken:
All investigation locations were cleared for underground services using an independent cable locator(BRP Products);
A total of 8 soil bores were drilled to a maximum depth of 4 m (but on average around 2 m) usingpush tube techniques. The location of the soil bores are discussed in the previous section and areshown on Figure 2;
The soil cores were placed in plastic trays for logging and sampling. The trays and drillingequipment were decontaminated between investigation locations using a high pressure cleaner;
The materials encountered in the soil cores were logged (refer Appendices) and selected soilsamples were retrieved from the units of fill and the underlying natural soils for laboratory analyses.The samples were screened for potential volatile contaminants using a photoionisation detector (PID)in the field;
Following completion of logging and sampling, the soil bores were backfilled using the spoil fromeach bore;
The samples were transported in a chilled cool box to the laboratory for selected chemical analysisunder chain of custody (COC) documentation.
The following scope of groundwater investigations was undertaken:
Well permits were obtained from the Department for Land Water and Biodiversity Conservation(DLWBC) prior to the installation of wells.
Four groundwater monitoring wells (GW1 – GW4) were installed into the shallow unconfined aquiferat the site. Wells GW1 and GW2 were advanced with push tube techniques with soil samplesrecovered for possible laboratory analysis, prior to groundwater well installation with solid augertechniques. Wells GW3 and GW4 were installed with solid auger techniques only and no soilsamples were recovered from these locations;
The wells were constructed using Class 18 uPVC with a 3 m machine slotted screen and casing.The annulus between the PVC and the hole was backfilled with washed 8/16” sand to at least 0.5 mabove the slotted screen. Care was taken to ensure that the slotted screen straddled the standingwater level, to allow the assessment of any phase separate hydrocarbons. At least a 0.5 m thickbentonite plug was placed above the sand, and the holes were completed with cement / bentonitegrout and flush mounted gatic covers;
The gauging of standing water level and separate phase hydrocarbons (if any) were measured ineach well using an electronic interface probe;
ESA Phase 2 – Glenelg Dry Cleaners, 31-47 Cliff Street, Glenelg East Page 4 W:\Projects\SG041189_ESA Glenelg DC\Report\SG041189rp01.doc Revision 0

DRAF
T
ESA Phase 2 – Glenelg Dry Cleaners, 31-47 Cliff Street, Glenelg East Page 9 W:\Projects\SG041189_ESA Glenelg DC\Report\SG041189rp01.doc Revision 0
4. RESULTS
4.1 Soils
4.1.1 Soil / Fill Materials Encountered
The soil borehole reports SB1 – SB8 and groundwater monitoring wells GW01 – GW04 are included in Appendix B.
The materials encountered in the soil bores generally consisted of gravely sand surface fill up to 0.4 m deep over the majority of the site. This fill was underlain by brown silty sands of generally between 0.4 m and 1.2 m thick, with brown to red brown sandy clays extending to greater than 6 m depth below. Refusal was encountered at SB8 due to > 0.4 m of concrete foundations at two locations.
4.1.2 Potential Volatile Contaminants
Selected replicate soil samples were screened for ionisable compounds using a photoionisation detector (PID). The results of the PID screening are presented in the borelogs included in Appendix B. The PID results were generally below 50 ppm indicating the likelihood of elevated volatile contaminants is low. However, elevated PID results were measured in samples GW1/1, GW1/3, GW2/4, SB5/1, SB5/2 SB5/4, BS6/1 and SB6/3, between 50 ppm and 192 ppm indicating the possible presence of elevated volatile contaminants at these locations.
4.1.3 Soil Analytical Results
A summary of the laboratory results for soils are presented in Table A1 appended to this report. Laboratory Certificates are included as Appendix A. A summary of the laboratory results is presented below and in Figure 3.
Petroleum Hydrocarbons
Concentrations of petroleum hydrocarbons were reported below the laboratory reporting limits for sample analysed with the exception of:
300 mg/kg in sample GW2/4 – (3.8 – 4.0 m depth over the SWL), adjacent the disused UST in the south eastern section of the site. It is noted that concentrations of petroleum hydrocarbons were below the reporting limits at 2.5 – 2.6 m depth (unsaturated zone, sample GW2/3) at this location.
35 mg/kg in sample SB2/4 – (2.6 - 2.7 m depth) adjacent the operational AST and boiler room on the eastern boundary of the site. It is noted that no hydrocarbon concentrations were reported at 0.3-0.4 m depth (sample SB2/1) and no deeper soil samples were analysed at this location.
These concentrations of hydrocarbons are low and below the NSW EPA sensitive land use adopted guidelines.

DRAF
T
T A
D D D A TT A
PRIMARY SAMPLES GW1/2 29 Sep 04 2.2-2.4 XGW1/4 29 Sep 04 0.5-0.7 X X XGW2/1 30 Sep 04 0.2-0.4 X XGW2/3 30 Sep 04 2.5-2.6 XGW2/4 30 Sep 04 3.8-4.0 X X XSB1/1 29 Sep 04 0.05-0.2 X X XSB1/2 29 Sep 04 0.3-0.4 X XSB2/1 29 Sep 04 0.3-0.4 X X XSB2/2 29 Sep 04 0.6-0.7 X XSB2/4 29 Sep 04 2.6-2.7 X XSG3/1 29 Sep 04 0-0.2 XSB4/1 29 Sep 04 0.1-0.2 X XSB4/3 29 Sep 04 1.2-1.4 X XSB5/1 29 Sep 04 0.1-0.3 X XSB5/2 29 Sep 04 0.5-0.7 X XSB5/4 29 Sep 04 1.6-1.8 X X XSB6/1 30 Sep 04 0.1-0.2 X X XSB6/3 30 Sep 04 1.8-2.0 X XSB7/1 30 Sep 04 0.1-0.3 X X
QA SAMPLES RS01 29 Sep 04 water X
D1 (Dup of SB2/2) 29 Sep 04 X XD2 (Dup of SB5/1) 29 Sep 04 X XD3 (Dup of GW2/4) 30 Sep 04 X X
Groundwater samples from wells GW01 – GW04 were analysed for filterable metals (As, Cd, Cr, Cu, Hg, Ni,Zn), TPH, CHC and a comprehensive Victorian EPA screen.
T A D D T T A
GW1 7 Oct 04 X X XGW2 7 Oct 04 XGW3 7 Oct 04 X X XGW4 7 Oct 04 X
D1 (dup. of GW1) 7 Oct 04 X X X
ESA Phase 2 – Glenelg Dry Cleaners, 31-47 Cliff Street, Glenelg East Page 6 W:\Projects\SG041189_ESA Glenelg DC\Report\SG041189rp01.doc Revision 0

DRAF
T
A
The following assessment guidelines were used in the interpretation of the laboratory results. The guidelinesare presented with the laboratory results in the Tables appended to this report.
The laboratory results were compared to the following guidelines:
R
The National Environment Protection (Assessment of Site Contamination) Measure, 1999, Health BasedInvestigation Levels (HILs) were used to assess the potential risks to human health, for a sensitive land use(Setting A), including standard residential.
The HILs are based on generally conservative assumptions for the estimated exposure of residents / workersin the above land use scenarios. In the first instance the NEPM Setting A investigation levels were comparedagainst as they are the most sensitive health based guidelines. The NEPM states that:
“An investigation level is the concentration of a contaminant above which further appropriateinvestigation and evaluation will be required (ANZECC/NHMRC Guidelines 1992)”.
An exceedence of an investigation level does not indicate that there is a definite risk to human health, butrather that further site-specific assessment is undertaken to quantify the potential risk to human health.
The NSW EPA Guidelines for the assessment of service station sites were used as a supplement whereguideline values were not provided in the NEPM for volatile and semi-volatile contaminants. These guidelinesprovide threshold values to which a former service station site should be remediated to if it has been proposedfor a sensitive land use. The guideline values presented are primarily based on considerations of human andecological health. Lower concentrations are presented in the NSW EPA guidelines and refer to the protectionof terrestrial organisms in soil.
R
The NEPM Ecological Intervention Levels (EILs) - Interim Urban were used to assess the potential risks to the environment.
The EILs Interim Urban aim to protect ecological values (eg. flora, fauna) in developed areas. The EILs arebased on considerations of phytotoxicity (copper, chromium, lead) and soil survey data (barium, phosphorous,sulfur) from four Australian capital cities. The ANZECC B values were retained for the other contaminants.
Groundwater in South Australia is assessed in accordance with the recently issued ‘Environment Protection(Water Quality) Policy, 2003. The policy covers all waters in the State including marine, estuarine and inland(surface and underground) waters.
ESA Phase 2 – Glenelg Dry Cleaners, 31-47 Cliff Street, Glenelg East Page 7 W:\Projects\SG041189_ESA Glenelg DC\Report\SG041189rp01.doc Revision 0

DRAF
T
The steps involved in setting the water quality objectives entail:
1. setting the environmental values that are required to be protected
2. determining water quality characteristics that are important for these values
3. setting criteria for each characteristic that adequately protect each environmental value
4. choosing the most stringent set of criteria for the environmental values applicable to each waterbody.
In line with the National Water Quality Management Strategy, the policy recognises that the protectedenvironmental values or uses are:
Aquatic ecosystem (fresh waters and marine waters)
Potable use
Recreation and aesthetics (primary contact, secondary contact and aesthetics)
Agriculture/aquaculture (including irrigation, livestock)
Industrial use
T Aquatic
Ecosystem Recreation & aesthetics AgricultureWaterbody
fresh Marine primarycontact
secondarycontact aesthetic
Potableirrigation livestock aquaculture
Industrial
Groundwater X X X X X X X X
The criteria for the environmental values are presented compared against the laboratory results in Table A2(appended) for potable and irrigation uses.
It is noted that the water quality criteria presented in Schedule 2 of the EPP do not contain criteria for total petroleum hydrocarbons or trichloroethene (TCE). In the absence of TPH guidelines, the EnvironmentalQuality Objectives in Netherlands (Dutch, 1994) criteria were adopted. The Dutch 1994 guidelines provideintervention levels that indicate a level of contamination which seriously diminishes the functional properties ofthe groundwater for humans, flora or fauna, or at which the functional properties of the groundwater are atserious risk of being diminished and target values for groundwater hydrocarbon concentrations.
In the absence of TCE criteria the World Health Organisations (WHO) potable water criteria of 0.04 mg/L andthe Australian and New Zealand Environment and Conservation Council (ANZECC) Australian Water QualityGuidelines for Fresh and Marine Waters – Primary Recreational Contact of 0.03 mg/L were adopted.
ESA Phase 2 – Glenelg Dry Cleaners, 31-47 Cliff Street, Glenelg East Page 8 W:\Projects\SG041189_ESA Glenelg DC\Report\SG041189rp01.doc Revision 0

DRAF
T
ESA Phase 2 – Glenelg Dry Cleaners, 31-47 Cliff Street, Glenelg East Page 9 W:\Projects\SG041189_ESA Glenelg DC\Report\SG041189rp01.doc Revision 0
4. RESULTS
4.1 Soils
4.1.1 Soil / Fill Materials Encountered
The soil borehole reports SB1 – SB8 and groundwater monitoring wells GW01 – GW04 are included in Appendix B.
The materials encountered in the soil bores generally consisted of gravely sand surface fill up to 0.4 m deep over the majority of the site. This fill was underlain by brown silty sands of generally between 0.4 m and 1.2 m thick, with brown to red brown sandy clays extending to greater than 6 m depth below. Refusal was encountered at SB8 due to > 0.4 m of concrete foundations at two locations.
4.1.2 Potential Volatile Contaminants
Selected replicate soil samples were screened for ionisable compounds using a photoionisation detector (PID). The results of the PID screening are presented in the borelogs included in Appendix B. The PID results were generally below 50 ppm indicating the likelihood of elevated volatile contaminants is low. However, elevated PID results were measured in samples GW1/1, GW1/3, GW2/4, SB5/1, SB5/2 SB5/4, BS6/1 and SB6/3, between 50 ppm and 192 ppm indicating the possible presence of elevated volatile contaminants at these locations.
4.1.3 Soil Analytical Results
A summary of the laboratory results for soils are presented in Table A1 appended to this report. Laboratory Certificates are included as Appendix A. A summary of the laboratory results is presented below and in Figure 3.
Petroleum Hydrocarbons
Concentrations of petroleum hydrocarbons were reported below the laboratory reporting limits for sample analysed with the exception of:
300 mg/kg in sample GW2/4 – (3.8 – 4.0 m depth over the SWL), adjacent the disused UST in the south eastern section of the site. It is noted that concentrations of petroleum hydrocarbons were below the reporting limits at 2.5 – 2.6 m depth (unsaturated zone, sample GW2/3) at this location.
35 mg/kg in sample SB2/4 – (2.6 - 2.7 m depth) adjacent the operational AST and boiler room on the eastern boundary of the site. It is noted that no hydrocarbon concentrations were reported at 0.3-0.4 m depth (sample SB2/1) and no deeper soil samples were analysed at this location.
These concentrations of hydrocarbons are low and below the NSW EPA sensitive land use adopted guidelines.

DRAF
T
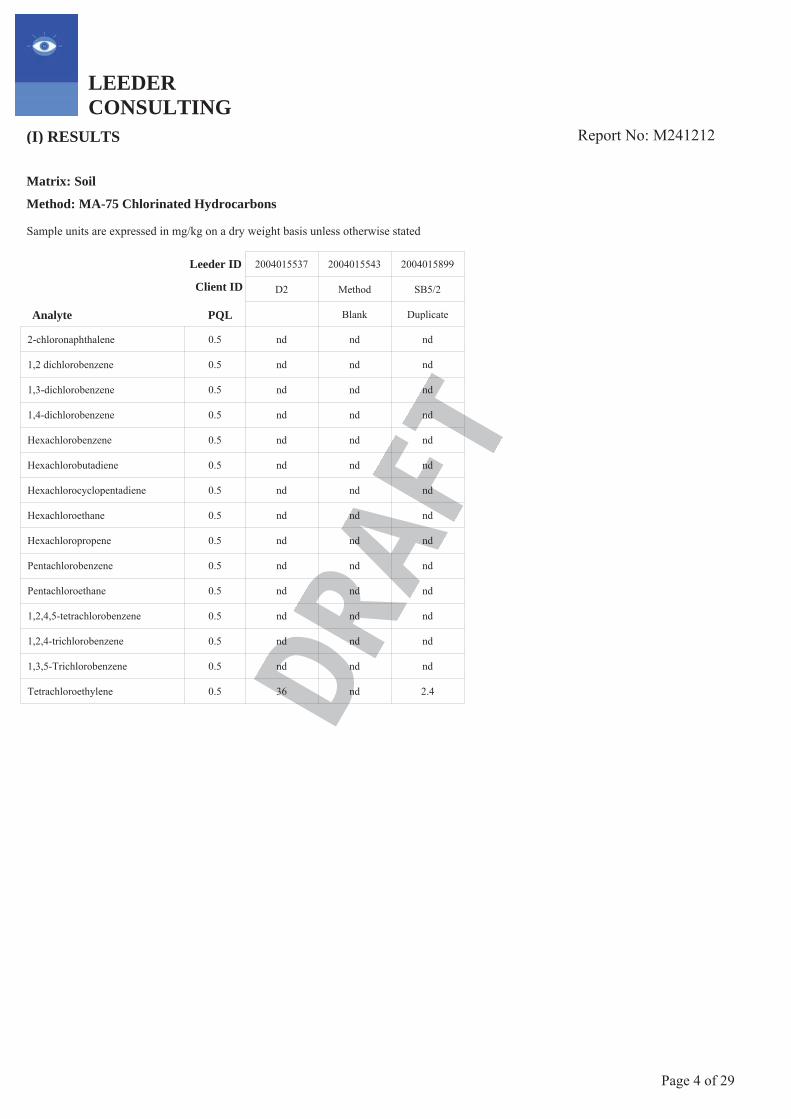
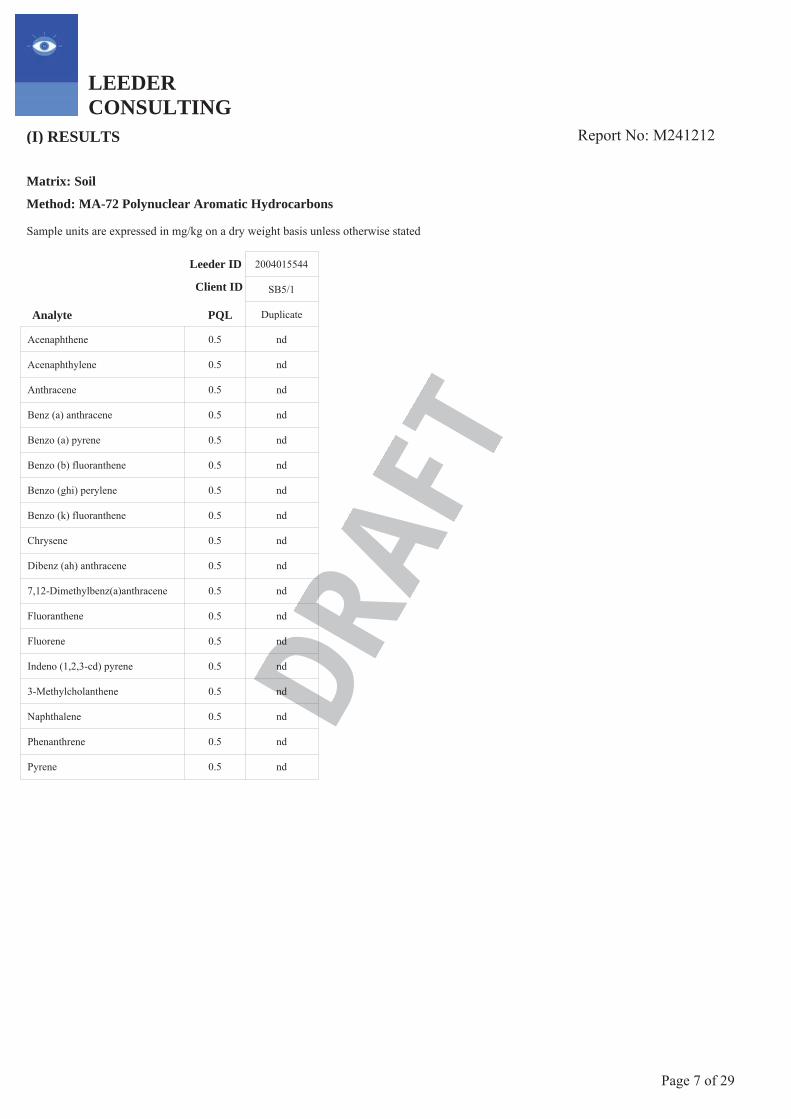
The concentrations of PAHs, OCPs, cresols and phenols were below the reporting limits in samples tested.
The concentrations of chlorinated hydrocarbons (CHC) and volatile organic compounds (VOCs) were belowthe laboratory reporting limits with the exception of tetrachloroethene. Tetrachloroethene is commonly knownas perchloroethylene (PCE) which is a common dry cleaning solvent. The maximum concentration of PCEwas measured in soil sample SB7/1 (0.1-0.3 m depth) of 9 mg/kg. PCE was also measured at 1.5 mg/kg inGW1/4, 4.7 mg/kg in SB4/1, 3.8 mg/kg in SB5/1, 3.3 mg/kg in SB5/2 and 4.5 mg/kg in SB6/1.
The concentrations of PCE observed were only in the upper 0.7 m of soils below the dry cleaning operationsmain building and along the southern site boundary near the former spirit house and chemical storage areas.Concentrations of PCE below 1 m depth at the locations of SB6 and SB5 were below the laboratory reportinglimits.
It is noted that no investigation levels for PCE in soils are provided in the NEPM.
The concentrations of heavy metals and cyanide are below the NEPM Setting A, standard residential andecological investigation levels.
The standing water level (SWL) of the wells was measured on 30 September and 7 October 2004. The SWL’s were reduced to an arbitrary datum to allow an assessment of the groundwater flow direction at the site. The reduced levels are presented in Table 4.
T R 30 September 2004 7 October 2004
Well ID RL TOC* (m)SWL (m BTOC) RWL (m RL) SWL (m BTOC) RWL (m RL)
GW1 10.42 4.03 6.39 4.06 6.36
GW2 10.36 3.9 6.46 3.93 6.43
GW3 10.00 3.61 6.39 3.665 6.335
GW4 10.13 3.725 6.405 3.78 6.35 Notes:
* - RL TOC = Reduced Level of Top of Casing (m) BTOC = below top of casing
The groundwater flow direction was inferred from the reduced water levels of the groundwater monitoringwells on-site. Based on the gauging results undertaken on 30 September and 7 October 2004, thegroundwater flow direction is inferred to be in a north westerly direction (Figure 4). A hydraulic gradient was
ESA Phase 2 – Glenelg Dry Cleaners, 31-47 Cliff Street, Glenelg East Page 10 W:\Projects\SG041189_ESA Glenelg DC\Report\SG041189rp01.doc Revision 0

DRAF
T
calculated for the October gauging event, with the result being 0.0014 m/m. The groundwater gradient is low, and consistent with the expected local groundwater flow direction and gradient.
F
The field parameters of electrical conductivity, temperature, dissolved oxygen and pH were measured duringpurging of the wells. The results of the field parameters are presented in Table 5.
T F D T R D D
mg/L degrees C mS/cm mVGW1 7-Oct-04 3.7 20.5 7.0 4.17 143
GW2 7-Oct-04 0.4 19.4 6.9 4.15 9
GW3 7-Oct-04 3.8 20.8 7.0 4.40 159
GW4 7-Oct-04 0.7 19.6 7.0 4.10 117
Dissolved oxygen values ranged from 0.4 mg/L in well GW2 to 3.8 mg/L in well GW1, which indicates low tomoderate dissolved oxygen concentrations in the local groundwater.
Recorded values for pH were neutral, whilst conductivity values ranged from 4.10 mS/cm in GW4 to4.40 mS/cm in GW3, which approximates to a total dissolved solids measurement of between 2,250 mg/L to2,450 mg/L.
Redox values were measured between 9 mV and 159 mV, which indicate a neutral or slightly oxidisingenvironment.
A hydrocarbon type sheen and odour was observed on the groundwater during purging from GW2.
A R
The concentrations of PAHs, OCPs, cresols and phenols in samples from wells GW2 and GW4 were belowthe reporting limits.
The concentrations of CHC and VOC were below the laboratory reporting limits with the exception of:
Cis-1,2-dichloroethene (cis-1,2-DEC)at 0.02 mg/L in GW2 and 0.11 mg/L in GW4. The concentrationof 0.11 mg/L in GW04 exceeds the EPP potable water criteria of 0.06 mg/L. Cis-1,2 – DCE is adaughter (breakdown) compound of TCE.
2-Butylbenzene at 0.001 mg/L in GW2.
ESA Phase 2 – Glenelg Dry Cleaners, 31-47 Cliff Street, Glenelg East Page 11 W:\Projects\SG041189_ESA Glenelg DC\Report\SG041189rp01.doc Revision 0

DRAF
T
Tetrachloroethene (PCE) at 5.5 mg/L in GW1, 0.013 mg/L in GW2, 0.16 mg/L in GW3 and 5.3 mg/Lin GW4. The concentrations in GW1, GW3 and GW4 exceed the EPP potable water criteria of 0.04mg/L.
Trichloroethene (TCE) at 0.002 mg/L in GW02 and 0.058 mg/L in GW4. The concentration in GW4exceeds the adopted WHO potable water criteria of 0.04 mg/L and ANZECC primary contact,recreation guideline of 0.04 mg/L in the absence of EPP criteria.
Concentrations of petroleum hydrocarbons were measured in groundwater samples GW1, GW2, GW3 andGW4 between 0.02 mg/L and 1.9 mg/L. The concentrations of hydrocarbons exceeding the adopted Dutchtarget value of 0.05 mg/L were measured in samples from GW1, GW2 and GW4. The petroleum hydrocarbonconcentrations consisted of predominantly C6-C9 fraction hydrocarbons in GW1 and GW4, likely to beassociated with solvents used on the site, while GW2 was dominantly C15-C28 fraction hydrocarbons.
It is noted that BTEX concentrations in wells was below the laboratory reporting limits.
Concentrations of filterable metals were low and were generally below the EPP Water Quality Criteria (2003),with the exception of boron in GW2 and GW3 and manganese in GW2.
The pH of groundwater from wells GW2 and GW4 was reported as 6.8 pH units by the laboratory, which isconsistent with the field data indicating neutral groundwater.
ESA Phase 2 – Glenelg Dry Cleaners, 31-47 Cliff Street, Glenelg East Page 12 W:\Projects\SG041189_ESA Glenelg DC\Report\SG041189rp01.doc Revision 0
DRAF
T
A
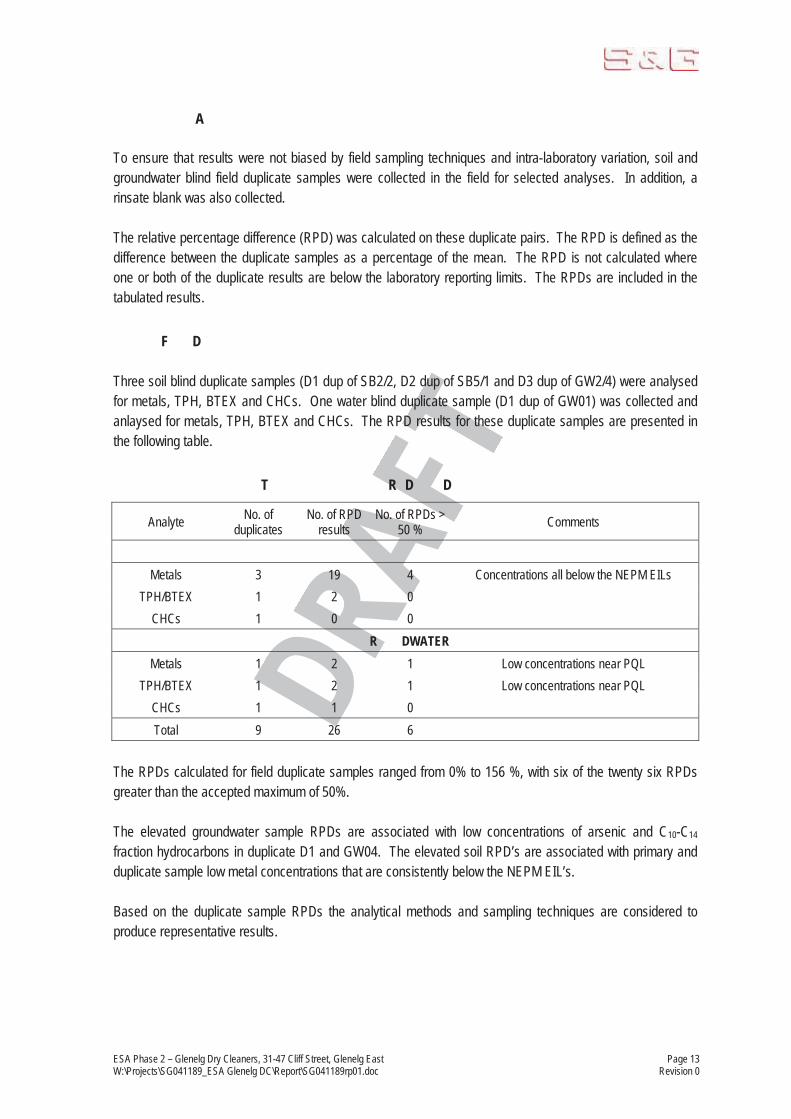
To ensure that results were not biased by field sampling techniques and intra-laboratory variation, soil andgroundwater blind field duplicate samples were collected in the field for selected analyses. In addition, arinsate blank was also collected.
The relative percentage difference (RPD) was calculated on these duplicate pairs. The RPD is defined as thedifference between the duplicate samples as a percentage of the mean. The RPD is not calculated whereone or both of the duplicate results are below the laboratory reporting limits. The RPDs are included in thetabulated results.
F D
Three soil blind duplicate samples (D1 dup of SB2/2, D2 dup of SB5/1 and D3 dup of GW2/4) were analysedfor metals, TPH, BTEX and CHCs. One water blind duplicate sample (D1 dup of GW01) was collected andanlaysed for metals, TPH, BTEX and CHCs. The RPD results for these duplicate samples are presented inthe following table.
T R D D
Analyte No. of duplicates
No. of RPD results
No. of RPDs > 50 % Comments
Metals 3 19 4 Concentrations all below the NEPM EILs TPH/BTEX 1 2 0
CHCs 1 0 0R DWATER
Metals 1 2 1 Low concentrations near PQL TPH/BTEX 1 2 1 Low concentrations near PQL
CHCs 1 1 0Total 9 26 6
The RPDs calculated for field duplicate samples ranged from 0% to 156 %, with six of the twenty six RPDsgreater than the accepted maximum of 50%.
The elevated groundwater sample RPDs are associated with low concentrations of arsenic and C10-C14
fraction hydrocarbons in duplicate D1 and GW04. The elevated soil RPD’s are associated with primary andduplicate sample low metal concentrations that are consistently below the NEPM EIL’s.
Based on the duplicate sample RPDs the analytical methods and sampling techniques are considered toproduce representative results.
ESA Phase 2 – Glenelg Dry Cleaners, 31-47 Cliff Street, Glenelg East Page 13 W:\Projects\SG041189_ESA Glenelg DC\Report\SG041189rp01.doc Revision 0

DRAF
T
4.3.2 Rinsate Blank
A rinsate blank sample was collected by running demineralised water through a washed pushtube afterdecontamination. A summary of the laboratory results is presented in Table A3.
The rinsate was analysed for metals. The results were less than the laboratory reporting limits, with theexception of zinc (4.7 mg/L). No elevated zinc concentrations above the NEPM investigation levels werereported indicating the high rinsate sample zinc concentration may be an anomaly. Based on the poorcorrelation between the investigation and rinsate sample result and low metals concentrations it is consideredunlikely that the sampling equipment contributed to any significant risk of cross-contamination between thesampling locations.
4.3.3 Internal Laboratory QA
The laboratory undertook internal QA/QC procedures, which are within the acceptable limits of repeatability,chemical extraction and detection. The chemical results are therefore considered to represent theconcentrations of chemicals in samples provided to the laboratory.
4.3.4 Summary of QA
The field duplicate samples and internal laboratory QA show a good correlation, indicating that the samplingand laboratory methods are appropriate, and the results are representative of the samples provided to thelaboratory.
ESA Phase 2 – Glenelg Dry Cleaners, 31-47 Cliff Street, Glenelg East Page 14 W:\Projects\SG041189_ESA Glenelg DC\Report\SG041189rp01.doc Revision 0

DRAF
T
5. SUMMARY
Soils
Based on the limited testing undertaken to date, the results of laboratory soil testing reported elevatedconcentrations of PCE only. The elevated concentrations of PCE were reported in the upper 0.7 m of soilsbelow the existing dry cleaning operations building and on the southern section of the site adjacent the formerspirit store and storage areas. PCE is a common dry cleaning solvent and it is considered that the drycleaning operations are the likely source of the PCE contaminated soils. Although no PCE concentrations insoils were reported below 0.7 m, elevated PCE concentrations measured in groundwater would suggest adeeper soil source.
The vertical and lateral extent of the PCE concentrations in soils along the western and south easternboundaries is unknown as no PCE analysis was conducted at these locations.
No PCE was detected in samples adjacent the former boiler room on the eastern boundary.
Concentrations of petroleum hydrocarbons in soils are low. The concentrations at the location of GW2, appear to be associated with impacted groundwater. No staining or odours were observed in soils within theunsaturated zone adjacent to the disused USTs.
Groundwater
Concentrations of filterable metals were low and generally below the EPP Water Quality Criteria (2003), with the exception of boron and manganese. Given that no groundwater extraction occurs at the site and thatthere are no identified sources of boron or manganese, these exceedences are not considered to present a asignificant risk.
Petroleum hydrocarbon impacts to groundwater were identified in the four wells at the site. Theconcentrations of the hydrocarbons exceed the adopted criteria in GW1, GW2 and GW4. The petroleumhydrocarbon concentrations consisted of dominantly C6-C9 fraction hydrocarbons in GW1 and GW4. It isnoted that BTEX concentrations were below the laboratory reporting limits and elevated VOCs weremeasured in these samples, therefore the C6-C9 fraction hydrocarbon result may represent elevated levels ofother non-petroleum hydrocarbon VOCs such as white spirits or solvents.
The petroleum hydrocarbon composition of GW2 was predominantly C15-C28 fraction hydrocarbons, which isconsistent with a diesel or light fuel oil source, and may be associated with historic storage of diesel or lightfuel oil at the site for boiler operation.
VOC impacts to groundwater were encountered in the four wells at the site. Concentrations of cis-1,2 DCEand TCE were measured in GW4 one order of magnitude above the assessment criteria, with trace levels,below the criteria, also reported in GW2. Cis-1,2 dichloroethene and TCE are daughter products of thebreakdown of PCE.
PCE was measured in all four wells at the site. The concentration of PCE exceeds the EPP potable watercriteria in wells GW1, GW3 and GW4 at up to 100 times the criteria. The PCE concentrations of 5.3 mg/L
ESA Phase 2 – Glenelg Dry Cleaners, 31-47 Cliff Street, Glenelg East Page 15 W:\Projects\SG041189_ESA Glenelg DC\Report\SG041189rp01.doc Revision 0

DRAF
T
(GW1) and 5.5 mg/L (GW4) occur within 5 m of the western site boundary and given the inferred northwesterly groundwater flow direction there is potential for groundwater PCE concentrations above the EPPpotable water criteria to occur off site below the adjacent residential properties. The source of thegroundwater PCE concentrations is currently unknown.
ESA Phase 2 – Glenelg Dry Cleaners, 31-47 Cliff Street, Glenelg East Page 16 W:\Projects\SG041189_ESA Glenelg DC\Report\SG041189rp01.doc Revision 0

DRAF
T
6. CONCLUSIONS
An environmental site assessment was undertaken at the Glenelg Dry Cleaning site at 37 - 41 Cliff Street,Glenelg East. It is understood that GDC wish to assess the potential environmental liabilities associated withthe site for possible site redevelopment or divestment.
The primary aim of the investigation was to identify areas of likely soil and groundwater contaminationresulting from either current or former activities at the site, using both targeted and grid-based investigationlocations.
The results of investigation identified:
Shallow fill overlying silty sands and sandy clay natural soils
Concentrations of PCE between 1.5 mg/kg and 9 mg/kg were reported in the upper soils (0 to 0.7 mdepth) at below the existing dry cleaning operations building, southern boundary storage area andformer spirit store.
Detectable soil petroleum hydrocarbon concentrations at the location of GW2 and SB2. Thehydrocarbon concentrations were below the assessment criteria and concentrations in sampleGW2/4 appeared associated with detectable groundwater hydrocarbon concentrations at GW2.
Groundwater
Groundwater standing water level was measured between 3.6 m and 4.1 m below ground surface.
Concentrations of filterable metals were low and generally below the EPP Water Quality Criteria(2003).
Petroleum hydrocarbon impacts to groundwater were identified in the four wells at the site. Theconcentrations of the hydrocarbons exceed the adopted criteria in GW1, GW2 and GW4.
VOCs impacts to groundwater were encountered in the four wells at the site. These included cis-1,2-DCE, TCE and PCE.
Concentrations of cis-1,2-DCE and TCE in GW4 are one order of magnitude above the assessmentcriteria, with trace levels (below the criteria) also reported in GW2.
Detectable PCE concentrations were measured in all four wells at the site. The concentration ofPCE exceeds the EPP potable water criteria in wells GW1, GW3 and GW4 by up to 100 times thecriteria.
The PCE concentrations of 5.3 mg/L (GW1) and 5.5 mg/L (GW4) occur within 5 m of the western siteboundary and given the inferred north westerly groundwater flow direction, there is potential for groundwater PCE concentrations above the EPP potable water criteria to occur off site below the adjacent residential properties.
The extent and nature of the PCE groundwater concentrations source are currently unknown.
ESA Phase 2 – Glenelg Dry Cleaners, 31-47 Cliff Street, Glenelg East Page 17 W:\Projects\SG041189_ESA Glenelg DC\Report\SG041189rp01.doc Revision 0

DRAF
T
7. RECOMMENDATIONS
The current density of investigation locations is considered insufficient to allow the assessment of the sitecontamination to a level that would be accepted by an environmental auditor in accordance with therequirements of the SA EPA. Therefore, should development of the site be a desirable objective, werecommend that an environmental auditor be appointed for the site to review the existing data and identifyfurther investigation requirements.
Additionally due to the identified PCE groundwater concentrations, in accordance with the South AustraliaEnvironment Protection Act 1993, it is recommended that the SA EPA be notified of the groundwater impactas soon as practicable.
ESA Phase 2 – Glenelg Dry Cleaners, 31-47 Cliff Street, Glenelg East Page 18 W:\Projects\SG041189_ESA Glenelg DC\Report\SG041189rp01.doc Revision 0

DRAF
T
FIGURES
ESA Phase 2 – Glenelg Dry Cleaners, 31-47 Cliff Street, Glenelg East W:\Projects\SG041189_ESA Glenelg DC\Report\SG041189rp01.doc Revision 0

DRAF
T
A4
Soil round ater Pty Ltd
Job No.: Project:
Title:
S 411 ESA lenel ry Cleaners
S TE L CAT PLA Sheet 1 of 1
F URE 1Scale:Date:
Date:
File Name:
Checked:
Drawn:
N.T.SFigure 1.wor
AKW
8 Nov 2004
NBP
207 The Parade Norwood SA 5067PO Box 3166 Norwood SA 5067T: 08 8431 7113 F: 08 8431 7115 Version:
Draft
THE S TE
Base plan from B
8 Nov 2004

DRAF
T
A4
Job No.: Project:
Title:
A D
T A T AT AT
Sheet 1 of 1
F R Scale:Date:
Date:
File Name:
Checked:
Drawn:
As ShownFigure 2.wor
AKW
8 Nov 2004
NBP
207 The Parade Norwood SA 5067PO Box 3166 Norwood SA 5067T: 08 8431 7113 F: 08 8431 7115 Version:
Draft
GW3GW3GW3GW3GW3GW3GW3GW3GW3
GW4GW4GW4GW4GW4GW4GW4GW4GW4
GW1GW1GW1GW1GW1GW1GW1GW1GW1
GW2GW2GW2GW2GW2GW2GW2GW2GW2
SB2SB2SB2SB2SB2SB2SB2SB2SB2
SB4SB4SB4SB4SB4SB4SB4SB4SB4
SB3SB3SB3SB3SB3SB3SB3SB3SB3SB6SB6SB6SB6SB6SB6SB6SB6SB6
SB5SB5SB5SB5SB5SB5SB5SB5SB5SB7SB7SB7SB7SB7SB7SB7SB7SB7
SB8SB8SB8SB8SB8SB8SB8SB8SB8
SB1SB1SB1SB1SB1SB1SB1SB1SB1
metresmetresmetresmetresmetresmetresmetresmetresmetres
000000000 555555555 101010101010101010
8 Nov 2004
DSoil Borehole Locations
Groundwater Well Locations

DRAF
T
A4
Job No.: Project:
Title:
A D
T A R T F R T A
Sheet 1 of 1
F R Scale:Date:
Date:
File Name:
Checked:
Drawn:
As ShownFigure 3.wor
AKW
8 Nov 2004
NBP
207 The Parade Norwood SA 5067PO Box 3166 Norwood SA 5067T: 08 8431 7113 F: 08 8431 7115 Version:
Draft
GW2/4
PAHs <0.5 mg/kg
TPH <20 mg/kg
TPH 300 mg/kg
GW2/3
GW2/1
GW2/4
PAHs <0.5 mg/kg
TPH <20 mg/kg
PAHs <0.5 mg/kg
PCE <0.5 mg/kg
TPH 35 mg/kg
TPH <20 mg/kgSB1/1
PAHs <0.5 mg/kgSB1/2
PAHs <0.5 mg.kgSB1/1
SB2/1
SB2/1
SB2/2
SB2/4
PAHs <0.5 mg/kg
TPH <20 mg/kg
PCE <0.5 mg/kg
PCE 3.8 mg/kg
PCE 3.3 mg/kg
TPH <20 mg/kg
TPH <20 mg/kg
SB5/1
SB5/1
SB5/2
SB5/2
SB5/2
SB6/1 TPH <20 mg/kg
PCE 4.5 mg/kg
PCE <0.5 mg/kg
SB6/1
SB6/3
PCE 9.0 mg/kgSB7/1
SB5/4
SB5/4
SG4/1 PCE 4.7 mg/kg
TPH <20 mg/kgSG4/3
PCE 1.5 mg/kg
TPH <20 mg/kgGW1/2
GW1/4
OCP <0.5 mg/kgSG3/1
metresmetresmetresmetresmetresmetresmetresmetresmetres
000000000 555555555 101010101010101010
DSoil Borehole Locations
Groundwater Well Locations
Soil Sample Result ConcentrationsSB1/1 TPH <20 mg/kg
8 Nov 2004

DRAF
T
A4
Job No.: Project:
Title:
A D
T A R D AT R T R
Sheet 1 of 1
F R Scale:Date:
Date:
File Name:
Checked:
Drawn:
As ShownFigure 4.wor
AKW
NBP
207 The Parade Norwood SA 5067PO Box 3166 Norwood SA 5067T: 08 8431 7113 F: 08 8431 7115 Version:
Draft
. 2. 2. 2. 2. 2. 2. 2. 2. 2
.........
.......... 2. 2. 2. 2. 2. 2. 2. 2. 2...........................
.........
.........
. 2. 2. 2. 2. 2. 2. 2. 2. 2
.........
.........
.........
.........
.........
.........
metresmetresmetresmetresmetresmetresmetresmetresmetres
000000000 555555555 101010101010101010
DGroundwater Well Locations
Groundwater Reduced Level (7-10-04)
Inferred Groundwater Contours
Inferred Groundwater Flow Direction
(1 .11)(1 .11)(1 .11)(1 .11)(1 .11)(1 .11)(1 .11)(1 .11)(1 .11)
8 Nov 2004
8 Nov 2004

DRAF
T
A4
Soil round ater Pty Ltd
Job No.: Project:
Title:
S 411 ESA lenel ry Cleaners
S TE PLASH R U ATER RESULTS 1 4
Sheet 1 of 1
F URE Scale:Date:
Date:
File Name:
Checked:
Drawn:
As ShownFigure 5.wor
AKW
8 Nov 2004
NBP
207 The Parade Norwood SA 5067PO Box 3166 Norwood SA 5067T: 08 8431 7113 F: 08 8431 7115 Version:
Draft
PCE 0.013 mg/kg
TPH 1.9 mg/L
cis 1,2-DCE 0.02 mg/L
TCE 0.002 mg/kg
GW2
GW2
GW2
GW2
TPH 0.79 mg/L
PCE 5.5 mg/kg
GW1
GW1
TPH 1.3 mg/L
GW3
GW3
TPH 0.02 mg/L
PCE 0.16 mg/kg
PCE 5.3 mg/kg
Cis1,2-DCE 0.11 mg/L
TCE 0.058 mg/kgGW4
GW4
GW4
GW4
3
2
1
4
metresmetresmetresmetresmetresmetresmetresmetresmetres
000000000 555555555 101010101010101010
LE EGroundwater Well Locations1
8 Nov 2004

DRAF
T
TA
ESA Phase 2 – Glenelg Dry Cleaners, 31-47 Cliff Street, Glenelg East W:\Projects\SG041189_ESA Glenelg DC\Report\SG041189rp01.doc Revision 0

DRAFT
Glen
elg D
ry Cl
eane
rsES
AT
A R
A
T
TR
A
Sample Description
Depth (m)
Date
pH
Antimony
Arsenic
Berylium
Cadmium
Chromium
Cobalt
Copper
Lead
Mercury
Molybdenum
Nickel
Selenium
Tin
Zinc
Total Cyanide
C6-C9
C10-C14
C15-C28
C29-C36
Total C6-C36
Benzene
Ethylbenzene
Toluene
Xylene
T A
T
T
T
Tetrachloroethylene
PQL
0.15
55
0.25
55
50.0
55
55
55
510
1020
2020
0.50.5
0.50.5
0.50.5
0.50.1
0.5GW
1/22.2
-2.4
29-0
9-04
ndnd
ndnd
ndnd
ndnd
ndGW
1/40.5
-0.7
29-0
9-04
ndnd
2716
21nd
1644
1.5GW
2/10.2
-0.4
30-0
9-04
ndnd
2612
260.6
735
ndGW
2/32.5
-2.6
30-0
9-04
ndnd
ndnd
ndnd
ndnd
ndGW
2/43.8
-4.0
30-0
9-04
8nd
5919
24nd
2946
nd70
230
nd30
0nd
ndnd
ndnd
SB1/1
0.05-
0.229
-09-
045
0.215
5126
0nd
712
0nd
ndnd
ndnd
ndnd
ndnd
ndSB
1/20.3
-0.4
29-0
9-04
ndnd
2913
20nd
924
ndSB
2/10.3
-0.4
29-0
9-04
5nd
4416
23nd
1536
ndnd
ndnd
ndnd
ndnd
ndnd
SB2/2
0.6-0
.729
-09-
046
nd43
1621
nd17
41SB
2/42.6
-2.7
29-0
9-04
8nd
7623
27nd
2756
ndnd
nd35
35nd
ndnd
ndSG
3/10-
0.229
-09-
046
0.410
2192
nd8
130
ndSB
4/10.1
-0.2
29-0
9-04
ndnd
2713
20nd
1031
4.7SB
4/31.2
-1.4
29-0
9-04
9nd
3816
22nd
1960
ndnd
ndnd
ndnd
ndnd
ndSB
5/10.1
-0.3
29-0
9-04
7.8nd
ndnd
0.531
637
170
0.35
nd7
nd18
320
ndnd
ndnd
ndnd
ndnd
ndnd
3.8SB
5/20.5
-0.7
29-0
9-04
ndnd
ndnd
ndnd
ndnd
nd3.3
SB5/4
1.6-1
.829
-09-
047
nd61
2028
nd20
59nd
ndnd
ndnd
ndnd
ndnd
ndSB
6/10.1
-0.2
30-0
9-04
ndnd
2615
27nd
1242
ndnd
ndnd
ndnd
ndnd
nd4.5
SB6/3
1.8-2
.030
-09-
047
nd59
2026
nd19
53nd
SB7/1
0.1-0
.330
-09-
04nd
nd18
1028
nd7
489
TAT
NE
PM A
100
2020
100
100
1000
300
1060
070
0025
020
8500
10NE
PM E
ILs20
340
010
060
01
6020
0
TAT
TNo
. of S
ample
s1
161
1616
116
1616
116
11
161
1111
1111
1110
1010
106
11
27
Maxim
um3
93
176
651
260
13
293
1832
03
570
230
3530
0nd
ndnd
ndnd
ndnd
nd9
Aver
age
34
30
376
2052
03
143
1872
35
1130
1239
3.4St
anda
rd D
eviat
ion-
3.5-
0.118
.7-
10.4
67.8
0.2-
7.2-
-72
.4-
0.019
.666
.37.5
87.0
0.00.0
0.00.0
0.0-
-0.0
3.1Is
Aver
age <
HILs
A?
Y
YY
YY
YY
Y
Y
Y
Y
Y
YY
Is
St. D
ev <
0.5 X
HILs
A?
Y
YY
YY
Y
Y
Y
-
Y
Y
Is Ma
x. <
2.5 x
HILs
A?
Y
YY
YY
YY
Y
Y
Y
Y
Y
YY
Is
Aver
age <
EILs
?
Y
YY
Y
YY
Y
Y
Is St
. Dev
< 0.
5 X E
ILs?
Y
Y
Y
YY
Y
Y
Y
Is
Max.
< 2.5
x EI
Ls?
Y
Y
Y
YY
Y
Y
Y
Notes
:

DRAF
T
Glenelg Dry CleanersESA
T A R T T A
DPQL Units potable 07-10-04 07-10-04 07-10-04 07-10-04
Antimony 0.001 mg/L 0.003 nd ndArsenic 0.0005 mg/L 0.007 0.001 0.001 0.001 0.001Barium 0.001 mg/L 0.7 0.32 0.29Berylium 0.001 mg/L nd ndBoron 0.001 mg/L 0.3Cadmium 0.0005 mg/L 0.002 nd nd nd ndChromium 0.001 mg/L 0.05 nd nd nd ndCobalt 0.001 mg/L nd ndCopper 0.001 mg/L 2 nd nd nd ndLead 0.001 mg/L 0.01 nd nd nd ndManganese 0.001 mg/L 0.5 0.02Mercury 0.0005 mg/L 0.001 nd nd nd ndMolybdenum 0.001 mg/L 0.05 nd ndNickel 0.001 mg/L 0.02 nd nd nd ndSelenium 0.005 mg/L 0.01 nd ndTin 0.001 mg/L nd ndZinc 0.001 mg/L 0.04 0.03 0.04 0.04Total Cyanide 0.01 mg/L 0.08 nd ndBenzene 0.001 mg/L 0.001 nd nd nd ndEthylbenzene 0.001 mg/L 0.3 nd nd nd ndToluene 0.001 mg/L 0.8 nd nd nd ndXylene 0.001 mg/L 0.6 nd nd nd ndC6-C9 0.01 mg/L nd ndC10-C14 0.01 mg/L 0.09 0.02 0.03C15-C28 0.05 mg/L nd nd ndC29-C36 0.05 mg/L nd nd nd ndTotal C6-C36 0.05 mg/L ndpH Others pH units 6.8 6.8
0.005 mg/L nd nd0.001 mg/L nd nd0.005 ppm nd nd
A 0.001 mg/L 0.00001 nd nd
0.05**

DRAF
T
Glenelg Dry CleanersESA
T A R
DPQL Units potable 07-10-04 07-10-04 07-10-04 07-10-04
1,1,1,2-Tetrachloroethane 0.001 mg/L nd nd1,1,1-Trichloroethane 0.001 mg/L nd nd1,1,2,2-Tetrachloroethane 0.001 mg/L nd nd1,1,2-Trichloroethane 0.001 mg/L nd nd1,1-Dichloroethane 0.001 mg/L nd nd1,1-Dichloroethene 0.001 mg/L nd nd1,1-Dichloropropene 0.001 mg/L nd nd1,2,3-Trichlorobenzene 0.001 mg/L nd nd1,2,3-Trichloropropane 0.001 mg/L nd nd1,2,4-Trimethylbenzene 0.001 mg/L nd nd1,2-Dibromo-3-chloropropane 0.001 mg/L nd nd1,2-Dibromoethane 0.001 mg/L nd nd1,2-Dichloroethane 0.001 mg/L nd nd1,2-Dichloropropane 0.001 mg/L nd nd1,3,5-Trimethylbenzene 0.001 mg/L nd nd1,3-Dichloropropane 0.001 mg/L nd nd2,2-Dichloropropane 0.001 mg/L nd nd2-Chlorotoluene 0.001 mg/L nd nd4-Chlorotoluene 0.001 mg/L nd ndBromobenzene 0.001 mg/L nd ndBromochloromethane 0.001 mg/L nd ndBromodichloromethane 0.001 mg/L nd ndBromomethane 0.001 mg/L nd ndCarbon tetrachloride 0.001 mg/L 0.003 nd ndChlorobenzene 0.001 mg/L nd ndChloroethane 0.001 mg/L nd ndChloromethane 0.001 mg/L nd ndcis-1,2-Dichloroethene 0.001 mg/L 0.06 0.02cis-1,3-Dichloropropene 0.001 mg/L nd ndDibromochloromethane 0.001 mg/L nd ndDibromomethane 0.001 mg/L nd ndDichlorodifluoromethane 0.001 mg/L nd ndDichloromethane 0.01 mg/L 0.004 nd ndHexachloro-1,3-butadiene 0.001 mg/L nd ndIsopropylbenzene 0.001 mg/L nd ndNaphthalene 0.001 mg/L nd ndn-Butylbenzene 0.001 mg/L nd ndp-Isopropyltoluene 0.001 mg/L nd ndPropylbenzene 0.001 mg/L nd nds-Butylbenzene 0.001 mg/L 0.001 ndStyrene 0.001 mg/L 0.03 nd ndt-Butylbenzene 0.001 mg/L nd ndTetrachloroethene 0.001 mg/L 0.04 0.013trans-1,2-Dichloroethene 0.001 mg/L 0.06 nd ndtrans-1,3-Dichloropropene 0.001 mg/L nd ndTribromomethane 0.001 mg/L nd ndTrichloroethene 0.001 mg/L 0.04* 0.002Trichlorofluoromethane 0.001 mg/L nd ndTrichloromethane 0.001 mg/L nd ndVinyl Chloride 0.001 mg/L nd nd

DRAF
T
Glenelg Dry CleanersESA
T A R
DPQL Units potable 07-10-04 07-10-04 07-10-04 07-10-04
1,2,4,5-tetrachlorobenzene 0.005 mg/L nd nd1,2,4-trichlorobenzene 0.005 mg/L nd nd nd nd1,2-dichlorobenzene 0.005 mg/L nd nd nd nd1,3,5-Trichlorobenzene 0.005 mg/L nd nd1,3-dichlorobenzene 0.005 mg/L nd nd nd nd1,4-dichlorobenzene 0.005 mg/L nd nd nd nd2-chloronaphthalene 0.005 mg/L nd ndHexachlorobenzene 0.005 mg/L nd ndHexachlorobutadiene 0.005 mg/L nd ndHexachlorocyclopentadiene 0.005 mg/L nd ndHexachloroethane 0.005 mg/L nd ndHexachloropropene 0.005 mg/L nd ndPentachlorobenzene 0.005 mg/L nd ndPentachloroethane 0.005 mg/L nd nd
Notes: ** commonly adopted Dutch target value for mineral oils in groundwater.* TCE guideline level for potable water from the World Health Organisation
ol e concentrations exceed EPP Potable criteria

RAFT
Glenelg Dry CleanersESA
T R R D RSOIL AT R
Sample Description PQL Units GW2/4 D3 RPD SB2/2 D1 RPD SB5/1 D2 RPD GW01 D1 RPD RS1Metals PQL Units mg/LAntimony 5 mg/kg - - nd - 0.001 mg/L -Arsenic 5 mg/kg 8 8 0 6 4 40 nd nd - 0.0005 mg/L 0.001 0.002 ndBerylium 5 mg/kg - - nd - 0.001 mg/L -Cadmium 0.2 mg/kg nd nd - nd nd 0.5 4 0.0005 mg/L nd nd - ndChromium 5 mg/kg 59 64 8 43 18 31 29 7 0.001 mg/L nd nd - ndCobalt 5 mg/kg - - 6 - 0.001 mg/L -Copper 5 mg/kg 19 21 10 16 10 46 37 37 0 0.001 mg/L nd nd - ndLead 5 mg/kg 24 29 19 21 15 33 170 290 0.001 mg/L nd nd - ndMercury 0.05 mg/kg nd nd - nd nd - 0.35 0 8 0.0005 mg/L nd nd -Molybdenum 5 mg/kg - - nd - 0.001 mg/L -Nickel 5 mg/kg 29 31 7 17 9 7 7 0 0.001 mg/L nd nd -Selenium 5 mg/kg - - nd - 0.005 mg/L nd -Tin 5 mg/kg - - 18 - 0.001 mg/L nd -Zinc 5 mg/kg 46 53 14 41 29 34 320 320 0 0.001 mg/L 0.04 0.03 29 4.7Total Cyanide 5 mg/kg - - nd - 0.01 mg/L ndTPHC6-C9 10 mg/kg nd nd - - nd - 0.01 mg/L 0.09C10-C14 10 mg/kg 70 43 48 - nd - 0.01 mg/L 0.09 0.06C15-C28 20 mg/kg 230 150 42 - nd - 0.05 mg/L nd nd -C29-C36 20 mg/kg nd nd - - nd - 0.05 mg/L nd nd -BTEXBenzene 0.5 mg/kg nd nd - - - 0.001 mg/L nd nd -Ethylbenzene 0.5 mg/kg nd nd - - - 0.001 mg/L nd nd -Toluene 0.5 mg/kg nd nd - - - 0.001 mg/L nd nd -Xylene 0.5 mg/kg nd nd - - - 0.001 mg/L nd nd -pH 0.1 pH units - - 7.8 - 0.1 pH units -PAHs 0.5 mg/kg nd - - nd - 0.001 mg/L -Cresols 0.5 mg/kg - - nd - 0.005 ppm -Phenol 0.5 mg/kg - - nd - 0.005 mg/L -OCPs 0.1 mg/kg - - nd - 0.001 mg/L -VOCs1,2-Dichlorobenzene 0.5 mg/kg - nd nd nd - 0.005 mg/L nd nd -1,3-Dichlorobenzene 0.5 mg/kg - nd nd nd nd - 0.005 mg/L nd nd -1,4-Dichlorobenzene 0.5 mg/kg - nd nd nd nd - 0.005 mg/L nd nd -cis-1,2-Dichloroethene 0.5 mg/kg - - nd - 0.001 mg/L -Hexachlorobenzene 0.5 mg/kg - nd nd - nd - 0.005 mg/L nd nd -Hexachlorobutadiene 0.5 mg/kg - nd nd - nd - 0.005 mg/L nd nd -Hexachlorocyclopentadiene 0.5 mg/kg - nd nd - nd - 0.005 mg/L nd nd -Hexachloroethane 0.5 mg/kg - nd nd - nd - 0.005 mg/L nd nd -Pentachlorobenzene 0.5 mg/kg - nd nd - nd - 0.005 mg/L nd nd -Pentachloroethane 0.5 mg/kg - nd nd - nd - 0.005 mg/L nd nd -Tetrachloroethene 0.5 mg/kg - - 3.8 - 0.001 mg/L -Tetrachloroethylene 0.5 mg/kg - - 36 - 0.005 mg/L 5.5 8Trichloroethene 0.5 mg/kg - - nd - 0.001 mg/L -
Notes: PD relative percentage difference e uipment blan rinsate sample

RAFT
A D A
CERTIFIED LABORATORY CERTIFICATES & CHAIN OF CUSTODY DOCUMENTATION
ESA Phase 2 – Glenelg Dry Cleaners, 31-47 Cliff Street, Glenelg East W:\Projects\SG041189_ESA Glenelg DC\Report\SG041189rp01.doc Revision 0

DRAF
T
LEEDER CONSULTING
M241212REPORT NUMBER: 8 October 2004
Chartered Chemists
ESASite/Client Ref:Gleneld Dry CleanerOrder No:
Soil and Groundwater Pty.Ltd
A.B.N. 87 126 206 4724 - 5, 18 Redland DriveMitcham, Vic, 3132Telephone: (03) 9874 1988Fax: (03) 9874 1933
First Floor 207GlensideSA 5065Attention: Andrew Nunn
CERTIFICATE OF ANALYSIS
SAMPLES: Twenty samples were received for analysis.
DATE RECEIVED: 1-Oct-2004
DATE COMMENCED: 4-Oct-2004
METHODS: See Attached Results
RESULTS:
Please refer to attached pages for results.
Note: Results are based on samples as received at Leeder Consulting's laboratories
REPORTED BY:
Leif CooperChemist
PO Box 552
This report has been prepared in accordance with the quality system of
Leeder Consulting Pty. Ltd and may not be reproduced except in full.
Page 1 of 29

DRAF
T
Report No: M241212(I) RESULTS
LEEDER CONSULTING
Matrix: Soil
Method: MA-77 Organochlorine Pesticides
Sample units are expressed in mg/kg on a dry weight basis unless otherwise stated
Analyte PQL
Client ID
Leeder ID
nd
nd
nd
nd
nd
nd
nd
nd
nd
nd
nd
nd
nd
nd
nd
nd
nd
nd
nd
nd
nd
nd
nd
nd
nd
nd
nd
nd
nd
nd
nd
nd
nd
nd
nd
nd
nd
nd
nd
nd
nd
nd
nd
nd
nd
nd
nd
nd
nd
nd
nd
nd
nd
nd
nd
nd
nd
nd
nd
nd
nd
nd
nd
nd
nd
nd
nd
nd
nd
nd
nd
nd
nd
nd
nd
nd
nd
nd
nd
nd0.1Methoxychlor
0.1Isodrin
0.1Hexachlorobenzene
0.1Heptachlor Epoxide
0.1Heptachlor
0.1Endrin aldehyde
0.1Endrin
0.1Endosulfan sulphate
0.1Endosulfan 2
0.1Endosulfan 1
0.1Dieldrin
0.14,4-DDT
0.14,4-DDE
0.14,4-DDD
0.1Chlordane
0.1gamma-BHC
0.1delta-BHC
0.1beta-BHC
0.1alpha-BHC
0.1Aldrin
Duplicate
SB5/1
2004015544
Blank
Method
2004015543
SB5/1
2004015527
SG3/1
2004015525
Page 2 of 29

DRAF
T
Report No: M241212(I) RESULTS
LEEDER CONSULTING
Matrix: Soil
Method: MA-75 Chlorinated Hydrocarbons
Sample units are expressed in mg/kg on a dry weight basis unless otherwise stated
Analyte PQL
Client ID
Leeder ID
nd
nd
nd
nd
nd
nd
nd
nd
nd
nd
nd
nd
nd
nd
4.7
nd
nd
nd
nd
nd
nd
nd
nd
nd
nd
nd
nd
nd
nd
1.5
nd
nd
nd
nd
nd
nd
nd
nd
nd
nd
nd
nd
nd
nd
nd
nd
nd
nd
nd
nd
nd
nd
nd
nd
nd
nd
nd
nd
nd
4.5
nd
nd
nd
nd
nd
nd
nd
nd
nd
nd
nd
nd
nd
nd
nd
nd
nd
nd
nd
nd
nd
nd
nd
nd
nd
nd
nd
nd
nd
9.0
nd
nd
nd
nd
nd
nd
nd
nd
nd
nd
nd
nd
nd
nd
3.30.5Tetrachloroethylene
0.51,3,5-Trichlorobenzene
0.51,2,4-trichlorobenzene
0.51,2,4,5-tetrachlorobenzene
0.5Pentachloroethane
0.5Pentachlorobenzene
0.5Hexachloropropene
0.5Hexachloroethane
0.5Hexachlorocyclopentadiene
0.5Hexachlorobutadiene
0.5Hexachlorobenzene
0.51,4-dichlorobenzene
0.51,3-dichlorobenzene
0.51,2 dichlorobenzene
0.52-chloronaphthalene
SB5/2
2004015534
SB7/1
2004015532
SB6/3
2004015531
SB6/1
2004015530
SB5/4
2004015529
GW1/4
2004015528
SB4/1
2004015526
Page 3 of 29
DRAF
T
Report No: M241212(I) RESULTS
LEEDER CONSULTING
Matrix: Soil
Method: MA-75 Chlorinated Hydrocarbons
Sample units are expressed in mg/kg on a dry weight basis unless otherwise stated
Analyte PQL
Client ID
Leeder ID
nd
nd
nd
nd
nd
nd
nd
nd
nd
nd
nd
nd
nd
nd
36
nd
nd
nd
nd
nd
nd
nd
nd
nd
nd
nd
nd
nd
nd
nd
nd
nd
nd
nd
nd
nd
nd
nd
nd
nd
nd
nd
nd
nd
2.40.5Tetrachloroethylene
0.51,3,5-Trichlorobenzene
0.51,2,4-trichlorobenzene
0.51,2,4,5-tetrachlorobenzene
0.5Pentachloroethane
0.5Pentachlorobenzene
0.5Hexachloropropene
0.5Hexachloroethane
0.5Hexachlorocyclopentadiene
0.5Hexachlorobutadiene
0.5Hexachlorobenzene
0.51,4-dichlorobenzene
0.51,3-dichlorobenzene
0.51,2 dichlorobenzene
0.52-chloronaphthalene
Duplicate
SB5/2
2004015899
Blank
Method
2004015543
D2
2004015537
Page 4 of 29

DRAF
T
Report No: M241212(I) RESULTS
LEEDER CONSULTING
Matrix: Soil
Method: MA-73 Phenols
Sample units are expressed in mg/kg on a dry weight basis unless otherwise stated
Analyte PQL
Client ID
Leeder ID
nd
nd
nd
nd
nd
nd
nd
nd
nd
nd
nd
nd
nd
nd
nd
nd
nd
nd
nd
nd
nd
nd
nd
nd
nd
nd
nd
nd
nd
nd
nd
nd
nd
nd
nd
nd0.52,4,6-trichlorophenol
0.52,4,5-trichlorophenol
0.5tetrachlorophenol
0.5Phenol
0.5pentachlorophenol
0.54-nitrophenol
0.52-nitrophenol
0.5hexachlorophene
0.5dinoseb
0.52,4-dinitrophenol
0.54,6-dinitro-2-methylphenol
0.52,4-dimethylphenol
0.52,6-dichlorophenol
0.52,4-dichlorophenol
0.5o-cresol
0.5m&p-cresol
0.52-chlorophenol
0.54-chloro-3-methylphenol
Duplicate
SB5/1
2004015544
SB5/1
2004015527
Page 5 of 29

DRAF
T
Report No: M241212(I) RESULTS
LEEDER CONSULTING
Matrix: Soil
Method: MA-72 Polynuclear Aromatic Hydrocarbons
Sample units are expressed in mg/kg on a dry weight basis unless otherwise stated
Analyte PQL
Client ID
Leeder ID
nd
nd
nd
nd
nd
nd
nd
nd
nd
nd
nd
nd
nd
nd
nd
nd
nd
nd
nd
nd
nd
nd
nd
nd
nd
nd
nd
nd
nd
nd
nd
nd
nd
nd
nd
nd
nd
nd
nd
nd
nd
nd
nd
nd
nd
nd
nd
nd
nd
nd
nd
nd
nd
nd
nd
nd
nd
nd
nd
nd
nd
nd
nd
nd
nd
nd
nd
nd
nd
nd
nd
nd
nd
nd
nd
nd
nd
nd
nd
nd
nd
nd
nd
nd
nd
nd
nd
nd
nd
nd
nd
nd
nd
nd
nd
nd
nd
nd
nd
nd
nd
nd
nd
nd
nd
nd
nd
nd
nd
nd
nd
nd
nd
nd
nd
nd
nd
nd
nd
nd
nd
nd
nd
nd
nd
nd0.5Pyrene
0.5Phenanthrene
0.5Naphthalene
0.53-Methylcholanthene
0.5Indeno (1,2,3-cd) pyrene
0.5Fluorene
0.5Fluoranthene
0.57,12-Dimethylbenz(a)anthracene
0.5Dibenz (ah) anthracene
0.5Chrysene
0.5Benzo (k) fluoranthene
0.5Benzo (ghi) perylene
0.5Benzo (b) fluoranthene
0.5Benzo (a) pyrene
0.5Benz (a) anthracene
0.5Anthracene
0.5Acenaphthylene
0.5Acenaphthene
Blank
Method
2004015543
GW2/1
2004015536
SB5/1
2004015527
SB2/1
2004015524
SB1/2
2004015523
SB1/1
2004015522
GW2/4
2004015521
Page 6 of 29
DRAF
T
Report No: M241212(I) RESULTS
LEEDER CONSULTING
Matrix: Soil
Method: MA-72 Polynuclear Aromatic Hydrocarbons
Sample units are expressed in mg/kg on a dry weight basis unless otherwise stated
Analyte PQL
Client ID
Leeder ID
nd
nd
nd
nd
nd
nd
nd
nd
nd
nd
nd
nd
nd
nd
nd
nd
nd
nd0.5Pyrene
0.5Phenanthrene
0.5Naphthalene
0.53-Methylcholanthene
0.5Indeno (1,2,3-cd) pyrene
0.5Fluorene
0.5Fluoranthene
0.57,12-Dimethylbenz(a)anthracene
0.5Dibenz (ah) anthracene
0.5Chrysene
0.5Benzo (k) fluoranthene
0.5Benzo (ghi) perylene
0.5Benzo (b) fluoranthene
0.5Benzo (a) pyrene
0.5Benz (a) anthracene
0.5Anthracene
0.5Acenaphthylene
0.5Acenaphthene
Duplicate
SB5/1
2004015544
Page 7 of 29

DRAF
T
Report No: M241212(I) RESULTS
LEEDER CONSULTING
Matrix: Soil
Method: MA-30 Total Petroleum Hydrocarbons
Sample units are expressed in mg/kg on a dry weight basis unless otherwise stated
Analyte PQL
Client ID
Leeder ID
nd
nd
nd
nd
nd
nd
nd
nd
nd
nd
nd
70
230
nd
300
nd
nd
nd
nd
nd
nd
nd
nd
nd
nd
nd
nd
nd
nd
nd
nd
nd
nd
nd
nd20Total C6-C36
20C29-C36
20C15-C28
10C10-C14
10C6-C9
SB5/4
2004015529
SB5/1
2004015527
SB2/1
2004015524
SB1/1
2004015522
GW2/4
2004015521
GW2/3
2004015520
GW1/2
2004015519
Matrix: Soil
Method: MA-30 Total Petroleum Hydrocarbons
Sample units are expressed in mg/kg on a dry weight basis unless otherwise stated
Analyte PQL
Client ID
Leeder ID
nd
nd
nd
nd
nd
nd
nd
nd
nd
nd
nd
nd
nd
nd
nd
nd
nd
nd
35
35
nd
43
150
nd
190
nd
nd
nd
nd
nd
nd
nd
nd
nd
nd20Total C6-C36
20C29-C36
20C15-C28
10C10-C14
10C6-C9
Duplicate
SB5/1
2004015544
Blank
Method
2004015543
D3
2004015538
SB2/4
2004015535
SB5/2
2004015534
SB4/3
2004015533
SB6/1
2004015530
Page 8 of 29

DRAF
T
Report No: M241212(I) RESULTS
LEEDER CONSULTING
Matrix: Soil
Method: MA-30 Total Petroleum Hydrocarbons
Sample units are expressed in mg/kg on a dry weight basis unless otherwise stated
Analyte PQL
Client ID
Leeder ID
nd
nd
nd
nd
nd20Total C6-C36
20C29-C36
20C15-C28
10C10-C14
10C6-C9
Duplicate
SB5/2
2004015899
Page 9 of 29

DRAF
T
Report No: M241212(I) RESULTS
LEEDER CONSULTING
Matrix: Soil
Method: MA-15 Volatile Organic Compounds
Sample units are expressed in mg/kg on a dry weight basis unless otherwise stated
Analyte PQL
Client ID
Leeder ID
nd
nd
nd
nd
nd
nd
nd
nd
nd
nd
nd
nd
nd
nd
nd
nd
nd
nd
nd
nd
nd
nd
nd
nd
nd
nd
nd
nd
nd
nd
nd
nd
nd
nd
nd
nd
nd
nd
nd
nd
nd
nd
nd
nd
nd
nd
nd
nd
nd
nd
nd
nd
nd
nd
nd
nd
nd
nd
nd
nd
nd
nd
nd
nd
nd
nd
nd
nd
nd
nd
nd
nd
nd
nd
nd
nd
nd
nd
nd
nd
nd
nd
nd
nd0.51,2-Dichloropropane
0.5trans-1,2-Dichloroethene
0.5cis-1,2-Dichloroethene
0.51,1-Dichloroethene
0.51,1-Dichloroethane
0.51,2-Dichloroethane
0.5Dichlorodifluoromethane
0.51,4-Dichlorobenzene
0.51,3-Dichlorobenzene
0.51,2-Dichlorobenzene
0.5Dibromomethane
0.51,2-Dibromoethane
0.51,2-Dibromo-3-chloropropane
0.5Dibromochloromethane
0.54-Chlorotoluene
0.52-Chlorotoluene
0.5Chloromethane
0.5Chloroethane
0.5Chlorobenzene
0.5Carbon tetrachloride
0.5t-Butylbenzene
0.5s-Butylbenzene
0.5n-Butylbenzene
0.5Bromomethane
0.5Bromodichloromethane
0.5Bromochloromethane
0.5Bromobenzene
0.5Benzene
Blank
Method
2004015547
Duplicate
SB5/1
2004015544
SB5/1
2004015527
Page 10 of 29

DRAF
T
Report No: M241212(I) RESULTS
LEEDER CONSULTING
Matrix: Soil
Method: MA-15 Volatile Organic Compounds
Sample units are expressed in mg/kg on a dry weight basis unless otherwise stated
Analyte PQL
Client ID
Leeder ID
nd
nd
nd
nd
nd
nd
nd
nd
nd
nd
nd
nd
nd
nd
3.8
nd
nd
nd
nd
nd
nd
nd
nd
nd
nd
nd
nd
nd
nd
nd
nd
nd
nd
nd
nd
nd
nd
nd
nd
nd
nd
nd
4.7
nd
nd
nd
nd
nd
nd
nd
nd
nd
nd
nd
nd
nd
nd
nd
nd
nd
nd
nd
nd
nd
nd
nd
nd
nd
nd
nd
nd
nd
nd
nd
nd
nd
nd
nd
nd
nd
nd
nd
nd
nd0.5Vinyl Chloride
0.51,3,5-Trimethylbenzene
0.51,2,4-Trimethylbenzene
0.51,2,3-Trichloropropane
0.5Trichloromethane
0.5Trichlorofluoromethane
0.5Trichloroethene
0.51,1,2-Trichloroethane
0.51,1,1-Trichloroethane
0.51,2,4-Trichlorobenzene
0.51,2,3-Trichlorobenzene
0.5Tribromomethane
0.5Toluene
0.5Tetrachloroethene
0.51,1,2,2-Tetrachloroethane
0.51,1,1,2-Tetrachloroethane
0.5Styrene
0.5Propylbenzene
0.5Naphthalene
0.5p-Isopropyltoluene
0.5Isopropylbenzene
0.5Hexachloro-1,3-butadiene
0.5Ethylbenzene
0.5trans-1,3-Dichloropropene
0.5cis-1,3-Dichloropropene
0.51,1-Dichloropropene
0.52,2-Dichloropropane
0.51,3-Dichloropropane
Blank
Method
2004015547
Duplicate
SB5/1
2004015544
SB5/1
2004015527
Page 11 of 29

DRAF
T
Report No: M241212(I) RESULTS
LEEDER CONSULTING
Matrix: Soil
Method: MA-15 Volatile Organic Compounds
Sample units are expressed in mg/kg on a dry weight basis unless otherwise stated
Analyte PQL
Client ID
Leeder ID
nd nd nd0.5Xylenes
Blank
Method
2004015547
Duplicate
SB5/1
2004015544
SB5/1
2004015527
Matrix: Soil
Method: MA-1490 pH of soil
Sample units are expressed in pH units on a dry weight basis unless otherwise stated
Analyte PQL
Client ID
Leeder ID
7.8 7.7 5.7pH
Blank
Method
2004015547
Duplicate
SB5/1
2004015544
SB5/1
2004015527
Page 12 of 29

DRAF
T
Report No: M241212(I) RESULTS
LEEDER CONSULTING
Matrix: Soil
Method: MA-1400 Metals
Sample units are expressed in mg/kg on a dry weight basis unless otherwise stated
Analyte PQL
Client ID
Leeder ID
8
nd
59
19
24
nd
29
46
5
0.2
15
51
260
nd
7
120
nd
nd
29
13
20
nd
9
24
5
nd
44
16
23
nd
15
36
6
0.4
10
21
92
nd
8
130
nd
nd
27
13
20
nd
10
31
nd
nd
nd
0.5
31
6
37
170
0.35
nd
7
nd
18
3205Zinc
5Tin
5Selenium
5Nickel
5Molybdenum
0.05Mercury
5Lead
5Copper
5Cobalt
5Chromium
0.2Cadmium
5Berylium
5Arsenic
5Antimony
SB5/1
2004015527
SB4/1
2004015526
SG3/1
2004015525
SB2/1
2004015524
SB1/2
2004015523
SB1/1
2004015522
GW2/4
2004015521
Page 13 of 29

DRAF
T
Report No: M241212(I) RESULTS
LEEDER CONSULTING
Matrix: Soil
Method: MA-1400 Metals
Sample units are expressed in mg/kg on a dry weight basis unless otherwise stated
Analyte PQL
Client ID
Leeder ID
nd
nd
27
16
21
nd
16
44
7
nd
61
20
28
nd
20
59
nd
nd
26
15
27
nd
12
42
7
nd
59
20
26
nd
19
53
nd
nd
18
10
28
nd
7
48
9
nd
38
16
22
nd
19
60
8
nd
76
23
27
nd
27
565Zinc
5Nickel
0.05Mercury
5Lead
5Copper
5Chromium
0.2Cadmium
5Arsenic
SB2/4
2004015535
SB4/3
2004015533
SB7/1
2004015532
SB6/3
2004015531
SB6/1
2004015530
SB5/4
2004015529
GW1/4
2004015528
Page 14 of 29

DRAF
T
Report No: M241212(I) RESULTS
LEEDER CONSULTING
Matrix: Soil
Method: MA-1400 Metals
Sample units are expressed in mg/kg on a dry weight basis unless otherwise stated
Analyte PQL
Client ID
Leeder ID
nd
nd
26
12
26
0.60
7
35
nd
4.0
29
37
290
0.38
7
320
8
nd
64
21
29
nd
31
53
nd
nd
nd
nd
nd
nd
nd
nd
nd
nd
nd
nd
nd
nd
nd
nd
nd
0.5
29
8
37
200
0.45
nd
7
nd
17
330
8
nd
66
20
25
nd
30
475Zinc
5Tin
5Selenium
5Nickel
5Molybdenum
0.05Mercury
5Lead
5Copper
5Cobalt
5Chromium
0.2Cadmium
5Berylium
5Arsenic
5Antimony
Duplicate
D3
2004015978
Duplicate
SB5/1
2004015544
Blank
Method
2004015543
D3
2004015538
D2
2004015537
GW2/1
2004015536
Matrix: Soil
Method: MA-1102 Total Cyanide
Sample units are expressed in mg/kg on a dry weight basis unless otherwise stated
Analyte PQL
Client ID
Leeder ID
nd nd5Total Cyanide
Blank
Method
2004015547
SB5/1
2004015527
Page 15 of 29
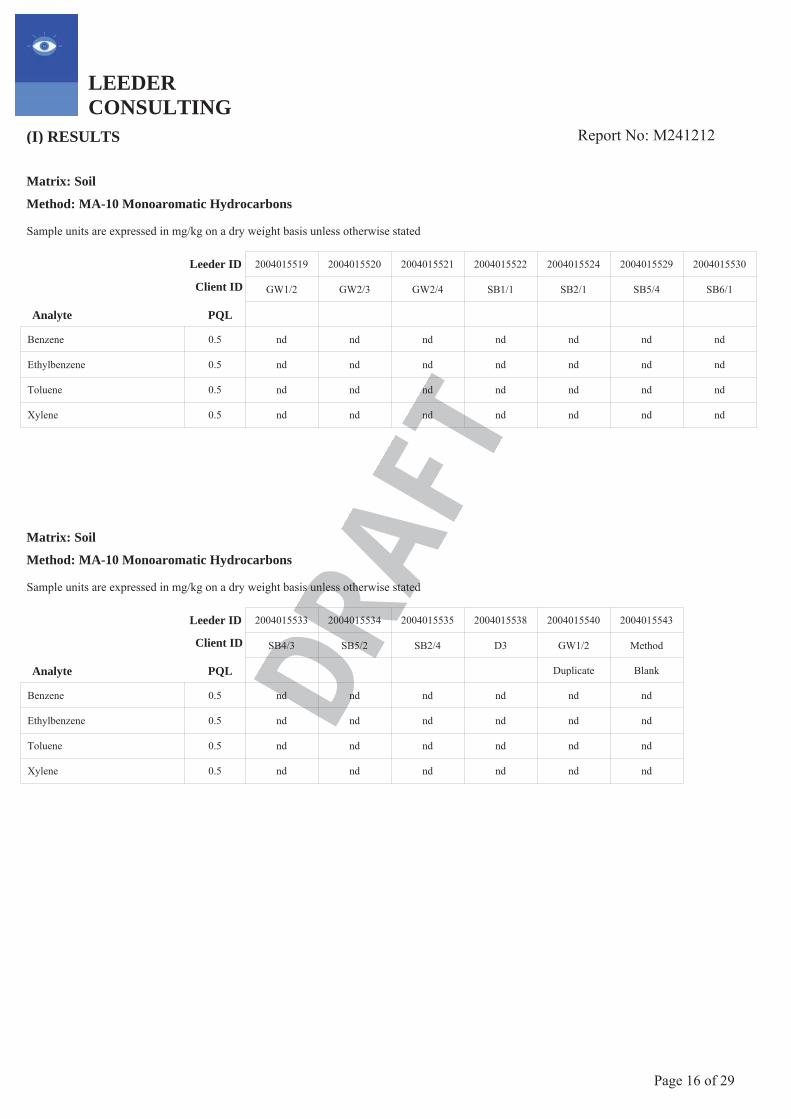
DRAF
T
Report No: M241212(I) RESULTS
LEEDER CONSULTING
Matrix: Soil
Method: MA-10 Monoaromatic Hydrocarbons
Sample units are expressed in mg/kg on a dry weight basis unless otherwise stated
Analyte PQL
Client ID
Leeder ID
nd
nd
nd
nd
nd
nd
nd
nd
nd
nd
nd
nd
nd
nd
nd
nd
nd
nd
nd
nd
nd
nd
nd
nd
nd
nd
nd
nd0.5Xylene
0.5Toluene
0.5Ethylbenzene
0.5Benzene
SB6/1
2004015530
SB5/4
2004015529
SB2/1
2004015524
SB1/1
2004015522
GW2/4
2004015521
GW2/3
2004015520
GW1/2
2004015519
Matrix: Soil
Method: MA-10 Monoaromatic Hydrocarbons
Sample units are expressed in mg/kg on a dry weight basis unless otherwise stated
Analyte PQL
Client ID
Leeder ID
nd
nd
nd
nd
nd
nd
nd
nd
nd
nd
nd
nd
nd
nd
nd
nd
nd
nd
nd
nd
nd
nd
nd
nd0.5Xylene
0.5Toluene
0.5Ethylbenzene
0.5Benzene
Blank
Method
2004015543
Duplicate
GW1/2
2004015540
D3
2004015538
SB2/4
2004015535
SB5/2
2004015534
SB4/3
2004015533
Page 16 of 29

DRAF
T
Report No: M241212(I) RESULTS
LEEDER CONSULTING
Matrix: Soil
Method: % VOC Surrogate Recovery
Sample units are expressed in % on a dry weight basis unless otherwise stated
Analyte
Client ID
Leeder ID
88
88
87
82
92
92
91
84
94
94
93
88
95
94
92
88
82
83
82
77
82
84
82
75
95
96
95
88p-Bromofluorobenzene
Toluene-d8
12-Dichloroethane-d4
Dibromofluoromethane
SB5/4
2004015529
SB5/1
2004015527
SB2/1
2004015524
SB1/1
2004015522
GW2/4
2004015521
GW2/3
2004015520
GW1/2
2004015519
Matrix: Soil
Method: % VOC Surrogate Recovery
Sample units are expressed in % on a dry weight basis unless otherwise stated
Analyte
Client ID
Leeder ID
85
86
85
78
89
90
89
81
91
92
91
83
110
110
120
110
87
87
86
81
91
91
91
84
89
88
88
82p-Bromofluorobenzene
Toluene-d8
12-Dichloroethane-d4
Dibromofluoromethane
Blank
Method
2004015543
Duplicate
GW1/2
2004015540
D3
2004015538
SB2/4
2004015535
SB5/2
2004015534
SB4/3
2004015533
SB6/1
2004015530
Page 17 of 29

DRAF
T
Report No: M241212(I) RESULTS
LEEDER CONSULTING
Matrix: Soil
Method: % VOC Surrogate Recovery
Sample units are expressed in % on a dry weight basis unless otherwise stated
Analyte
Client ID
Leeder ID
94
95
95
86
89
88
88
82p-Bromofluorobenzene
Toluene-d8
12-Dichloroethane-d4
Dibromofluoromethane
Blank
Method
2004015547
Duplicate
SB5/1
2004015544
Page 18 of 29

DRAF
T
Report No: M241212(I) RESULTS
LEEDER CONSULTING
Matrix: Soil
Method: % Surrogate Recovery
Sample units are expressed in % on a dry weight basis unless otherwise stated
Analyte
Client ID
Leeder ID
110
120
110
110
100
94
98
110
110
110
110
97
95
120
120
100
110
110
96
100
110
110
120
120
100
120
120
120
110
100
96
110
120
120
110
110
93
120
130
100
110
1202,4,6-Tribromophenol
p-Terphenyl-d14
Phenol-d6
Nitrobenzene-d5
Fluorophenol
Fluorobiphenyl
SB5/1
2004015527
SB4/1
2004015526
SG3/1
2004015525
SB2/1
2004015524
SB1/2
2004015523
SB1/1
2004015522
GW2/4
2004015521
Matrix: Soil
Method: % Surrogate Recovery
Sample units are expressed in % on a dry weight basis unless otherwise stated
Analyte
Client ID
Leeder ID
94
120
120
100
100
95
94
120
100
110
110
96
94
120
120
100
110
120
96
110
120
100
110
110
93
120
100
120
100
100
89
110
100
110
100
99
94
110
120
100
110
982,4,6-Tribromophenol
p-Terphenyl-d14
Phenol-d6
Nitrobenzene-d5
Fluorophenol
Fluorobiphenyl
GW2/1
2004015536
SB5/2
2004015534
SB7/1
2004015532
SB6/3
2004015531
SB6/1
2004015530
SB5/4
2004015529
GW1/4
2004015528
Page 19 of 29

DRAF
T
Report No: M241212(I) RESULTS
LEEDER CONSULTING
Matrix: Soil
Method: % Surrogate Recovery
Sample units are expressed in % on a dry weight basis unless otherwise stated
Analyte
Client ID
Leeder ID
95
110
110
120
120
97
110
110
130
110
120
110
90
110
110
95
120
110
94
110
120
100
110
982,4,6-Tribromophenol
p-Terphenyl-d14
Phenol-d6
Nitrobenzene-d5
Fluorophenol
Fluorobiphenyl
Duplicate
SB5/2
2004015899
Duplicate
SB5/1
2004015544
Blank
Method
2004015543
D2
2004015537
Page 20 of 29

DRAF
T
Report No: M241212(II) QUALITY CONTROL
LEEDER CONSULTING
Matrix: Soil
Method: MA-77 Organochlorine Pesticides
Quality Control Results are expressed in Percent Recovery of expected result
Analyte
Client ID
Leeder ID
130
97
83
110
86
91
120
95
86
110
87
99Heptachlor
Endrin
Dieldrin
4,4-DDT
gamma-BHC
Aldrin
SpikeDup
SB5/1
2004015898
Spike
SB5/1
2004015897
Matrix: Soil
Method: MA-75 Chlorinated Hydrocarbons
Quality Control Results are expressed in Percent Recovery of expected result
Analyte
Client ID
Leeder ID
96
100
96
1001,2,4-trichlorobenzene
1,4-dichlorobenzene
SpikeDup
SB5/1
2004015898
Spike
SB5/1
2004015897
Page 21 of 29

DRAF
T
Report No: M241212(II) QUALITY CONTROL
LEEDER CONSULTING
Matrix: Soil
Method: MA-73 Phenols
Quality Control Results are expressed in Percent Recovery of expected result
Analyte
Client ID
Leeder ID
76
100
90
90
77
100
71
88Phenol
pentachlorophenol
2-chlorophenol
4-chloro-3-methylphenol
SpikeDup
SB5/1
2004015898
Spike
SB5/1
2004015897
Matrix: Soil
Method: MA-72 Polynuclear Aromatic Hydrocarbons
Quality Control Results are expressed in Percent Recovery of expected result
Analyte
Client ID
Leeder ID
100
120
100
130Pyrene
Acenaphthene
SpikeDup
SB5/1
2004015898
Spike
SB5/1
2004015897
Page 22 of 29

DRAF
T
Report No: M241212(II) QUALITY CONTROL
LEEDER CONSULTING
Matrix: Soil
Method: MA-30 Total Petroleum Hydrocarbons
Quality Control Results are expressed in Percent Recovery of expected result
Analyte
Client ID
Leeder ID
78
73
78
74
76
73
80
67C29-C36
C15-C28
C10-C14
C6-C9
SpikeDup
SB5/1
2004015898
Spike
SB5/1
2004015897
Page 23 of 29
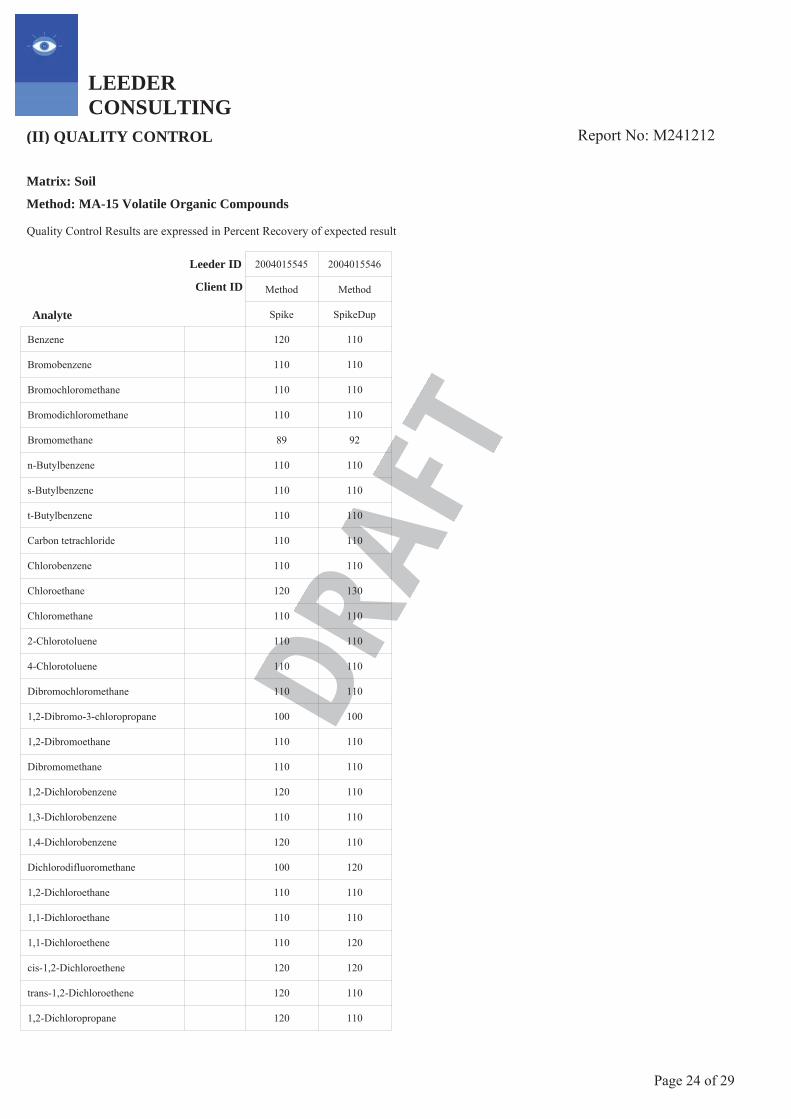
DRAF
T
Report No: M241212(II) QUALITY CONTROL
LEEDER CONSULTING
Matrix: Soil
Method: MA-15 Volatile Organic Compounds
Quality Control Results are expressed in Percent Recovery of expected result
Analyte
Client ID
Leeder ID
120
110
110
110
89
110
110
110
110
110
120
110
110
110
110
100
110
110
120
110
120
100
110
110
110
120
120
120
110
110
110
110
92
110
110
110
110
110
130
110
110
110
110
100
110
110
110
110
110
120
110
110
120
120
110
1101,2-Dichloropropane
trans-1,2-Dichloroethene
cis-1,2-Dichloroethene
1,1-Dichloroethene
1,1-Dichloroethane
1,2-Dichloroethane
Dichlorodifluoromethane
1,4-Dichlorobenzene
1,3-Dichlorobenzene
1,2-Dichlorobenzene
Dibromomethane
1,2-Dibromoethane
1,2-Dibromo-3-chloropropane
Dibromochloromethane
4-Chlorotoluene
2-Chlorotoluene
Chloromethane
Chloroethane
Chlorobenzene
Carbon tetrachloride
t-Butylbenzene
s-Butylbenzene
n-Butylbenzene
Bromomethane
Bromodichloromethane
Bromochloromethane
Bromobenzene
Benzene
SpikeDup
Method
2004015546
Spike
Method
2004015545
Page 24 of 29

DRAF
T
Report No: M241212(II) QUALITY CONTROL
LEEDER CONSULTING
Matrix: Soil
Method: MA-15 Volatile Organic Compounds
Quality Control Results are expressed in Percent Recovery of expected result
Analyte
Client ID
Leeder ID
120
110
120
110
110
110
110
110
110
110
110
120
110
110
120
120
110
96
99
110
120
120
110
110
110
100
110
120
120
110
120
110
110
110
100
110
110
99
110
110
110
110
120
120
110
91
95
110
110
110
120
110
110
100
110
120Vinyl Chloride
1,3,5-Trimethylbenzene
1,2,4-Trimethylbenzene
1,2,3-Trichloropropane
Trichloromethane
Trichlorofluoromethane
Trichloroethene
1,1,2-Trichloroethane
1,1,1-Trichloroethane
1,2,4-Trichlorobenzene
1,2,3-Trichlorobenzene
Tribromomethane
Toluene
Tetrachloroethene
1,1,2,2-Tetrachloroethane
1,1,1,2-Tetrachloroethane
Styrene
Propylbenzene
Naphthalene
p-Isopropyltoluene
Isopropylbenzene
Hexachloro-1,3-butadiene
Ethylbenzene
trans-1,3-Dichloropropene
cis-1,3-Dichloropropene
1,1-Dichloropropene
2,2-Dichloropropane
1,3-Dichloropropane
SpikeDup
Method
2004015546
Spike
Method
2004015545
Page 25 of 29

DRAF
T
Report No: M241212(II) QUALITY CONTROL
LEEDER CONSULTING
Matrix: Soil
Method: MA-15 Volatile Organic Compounds
Quality Control Results are expressed in Percent Recovery of expected result
Analyte
Client ID
Leeder ID
120 110Xylenes
SpikeDup
Method
2004015546
Spike
Method
2004015545
Matrix: Soil
Method: MA-1400 Metals
Quality Control Results are expressed in Percent Recovery of expected result
Analyte
Client ID
Leeder ID
110
94
98
91
87
96
76
110
100
90
91
98
83
100
99
99
110
96
100
110
100
89Zinc
Tin
Selenium
Nickel
Molybdenum
Mercury
Lead
Copper
Cobalt
Chromium
Cadmium
Berylium
Arsenic
Antimony
Spike
D3
2004015979
Spike
SB5/1
2004015897
Page 26 of 29

DRAF
T
Report No: M241212(II) QUALITY CONTROL
LEEDER CONSULTING
Matrix: Soil
Method: MA-1102 Total Cyanide
Quality Control Results are expressed in Percent Recovery of expected result
Analyte
Client ID
Leeder ID
100Total Cyanide
Spike
Method
2004015545
Matrix: Soil
Method: MA-10 Monoaromatic Hydrocarbons
Quality Control Results are expressed in Percent Recovery of expected result
Analyte
Client ID
Leeder ID
120
110
120
120
110
110
120
110Xylene
Toluene
Ethylbenzene
Benzene
SpikeDup
Method
2004015542
Spike
Method
2004015541
Page 27 of 29
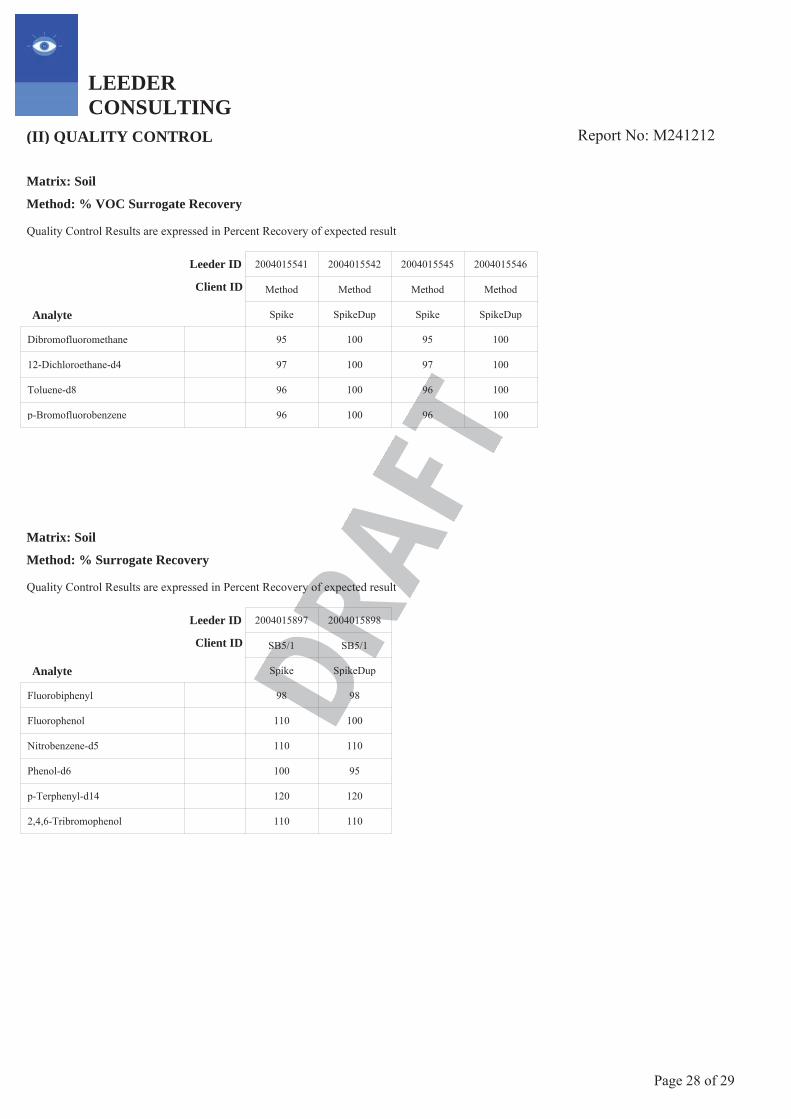
DRAF
T
Report No: M241212(II) QUALITY CONTROL
LEEDER CONSULTING
Matrix: Soil
Method: % VOC Surrogate Recovery
Quality Control Results are expressed in Percent Recovery of expected result
Analyte
Client ID
Leeder ID
95
97
96
96
100
100
100
100
95
97
96
96
100
100
100
100p-Bromofluorobenzene
Toluene-d8
12-Dichloroethane-d4
Dibromofluoromethane
SpikeDup
Method
2004015546
Spike
Method
2004015545
SpikeDup
Method
2004015542
Spike
Method
2004015541
Matrix: Soil
Method: % Surrogate Recovery
Quality Control Results are expressed in Percent Recovery of expected result
Analyte
Client ID
Leeder ID
98
110
110
100
120
110
98
100
110
95
120
1102,4,6-Tribromophenol
p-Terphenyl-d14
Phenol-d6
Nitrobenzene-d5
Fluorophenol
Fluorobiphenyl
SpikeDup
SB5/1
2004015898
Spike
SB5/1
2004015897
Page 28 of 29

DRAF
T
Report No: M241212
LEEDER CONSULTING
QUALIFIERS / NOTES FOR REPORTED RESULTS
is Insufficient Sample to perform this analysis.
T Tentative identification based on computer library search of mass spectra.
ND Not Detected – The analyte was not detected at or above the reported PQL.
nr Not Requested for analysis.
R Rejected Result – results for this analysis failed QC checks.
SQ Semi-Quantitative result – quantitation based on a generic response factor for this class of analyte.
U Unable to provide Quality Control data – high levels of compounds in sample interfered with analysis of surrogate QC results.
UI Unable to provide Quality Control data – insufficient sample to perform QC checks.
B This analyte also detected in analysis of the Method Blank.
D Deviation from standard method – see notes for specific explanation.
L Analyte detected at a level above the linear response of calibration curve.
NS Analyte not part of standard compound list for this method.
NT No blank sorbent tubes provided for QC analysis.
C1 These compounds co-elute.
C2 These compounds co-elute.
Page 29 of 29

DRAF
T
LEEDER CONSULTING
APPENDIX ONE.
CHAIN OF CUSTODY DOCUMENT

DRAF
T

DRAF
T

DRAF
T

DRAF
T

DRAF
T
LEEDER CONSULTING
M241240REPORT NUMBER: 15 October 2004
Chartered Chemists
SG041189Site/Client Ref:SG041189Order No:
Soil and Groundwater Pty.Ltd
A.B.N. 87 126 206 4724 - 5, 18 Redland DriveMitcham, Vic, 3132Telephone: (03) 9874 1988Fax: (03) 9874 1933
First Floor 207GlensideSA 5065Attention: Andrew Nunn
CERTIFICATE OF ANALYSIS
SAMPLES: Five samples were received for analysis.
DATE RECEIVED: 8-Oct-2004
DATE COMMENCED: 11-Oct-2004
METHODS: See Attached Results
RESULTS:
Please refer to attached pages for results.
Note: Results are based on samples as received at Leeder Consulting's laboratories
REPORTED BY:
Leif CooperChemist
PO Box 552
This report has been prepared in accordance with the quality system of
Leeder Consulting Pty. Ltd and may not be reproduced except in full.
Page 1 of 23

DRAF
T
Report No: M241240(I) RESULTS
LEEDER CONSULTING
Matrix: Water
Method: USEPA 8260B Volatile Organic Compounds in Water
Sample units are expressed in mg/L
Analyte PQL
Client ID
Leeder ID
nd
nd
nd
nd
nd
nd
0.001
nd
nd
nd
nd
nd
nd
nd
nd
nd
nd
nd
nd
nd
nd
nd
nd
nd
nd
0.020
nd
nd
nd
nd
nd
nd
nd
nd
nd
nd
nd
nd
nd
nd
nd
nd
nd
nd
nd
nd
nd
nd
nd
nd
nd
nd
nd
0.11
nd
nd
nd
nd
nd
nd
nd
nd
nd
nd
nd
nd
nd
nd
nd
nd
nd
nd
nd
nd
nd
nd
nd
nd
nd
nd
nd
nd
nd
nd
nd
nd
nd
nd
nd
nd
0.001
nd
nd
nd
nd
nd
nd
nd
nd
nd
nd
nd
nd
nd
nd
nd
nd
nd
nd
0.021
nd
nd0.01Dichloromethane
0.001trans-1,2-Dichloroethene
0.001cis-1,2-Dichloroethene
0.0011,1-Dichloroethene
0.0011,1-Dichloroethane
0.0011,2-Dichloroethane
0.001Dichlorodifluoromethane
0.0011,4-Dichlorobenzene
0.0011,3-Dichlorobenzene
0.0011,2-Dichlorobenzene
0.001Dibromomethane
0.0011,2-Dibromoethane
0.0011,2-Dibromo-3-chloropropane
0.001Dibromochloromethane
0.0014-Chlorotoluene
0.0012-Chlorotoluene
0.001Chloromethane
0.001Chloroethane
0.001Chlorobenzene
0.001Carbon tetrachloride
0.001t-Butylbenzene
0.001s-Butylbenzene
0.001n-Butylbenzene
0.001Bromomethane
0.001Bromodichloromethane
0.001Bromochloromethane
0.001Bromobenzene
0.001Benzene
Duplicate
GW04
2004016179
Blank
Method
2004015929
GW04
2004015924
GW02
2004015922
Page 2 of 23

DRAF
T
Report No: M241240(I) RESULTS
LEEDER CONSULTING
Matrix: Water
Method: USEPA 8260B Volatile Organic Compounds in Water
Sample units are expressed in mg/L
Analyte PQL
Client ID
Leeder ID
nd
nd
nd
nd
nd
nd
nd
nd
nd
nd
nd
nd
nd
nd
0.013
nd
nd
nd
nd
nd
nd
nd
0.002
nd
nd
nd
nd
nd
nd
nd
nd
nd
nd
nd
nd
nd
nd
nd
nd
nd
nd
nd
5.3
nd
nd
nd
nd
nd
nd
nd
0.058
nd
nd
nd
nd
nd
nd
nd
nd
nd
nd
nd
nd
nd
nd
nd
nd
nd
nd
nd
nd
nd
nd
nd
nd
nd
nd
nd
nd
nd
nd
nd
nd
nd
nd
nd
nd
nd
nd
nd
nd
nd
nd
nd
nd
nd
nd
nd
0.012
nd
nd
nd
nd
nd
nd
nd
0.002
nd
nd
nd
nd
nd0.0011,3,5-Trimethylbenzene
0.0011,2,4-Trimethylbenzene
0.0011,2,3-Trichloropropane
0.001Trichloromethane
0.001Trichlorofluoromethane
0.001Trichloroethene
0.0011,1,2-Trichloroethane
0.0011,1,1-Trichloroethane
0.0011,2,4-Trichlorobenzene
0.0011,2,3-Trichlorobenzene
0.001Tribromomethane
0.001Toluene
0.0011,1,1,2-Tetrachloroethane
0.001Tetrachloroethene
0.0011,1,2,2-Tetrachloroethane
0.001Styrene
0.001Propylbenzene
0.001Naphthalene
0.001p-Isopropyltoluene
0.001Isopropylbenzene
0.001Hexachloro-1,3-butadiene
0.001Ethylbenzene
0.001trans-1,3-Dichloropropene
0.001cis-1,3-Dichloropropene
0.0011,1-Dichloropropene
0.0012,2-Dichloropropane
0.0011,3-Dichloropropane
0.0011,2-Dichloropropane
Duplicate
GW04
2004016179
Blank
Method
2004015929
GW04
2004015924
GW02
2004015922
Page 3 of 23

DRAF
T
Report No: M241240(I) RESULTS
LEEDER CONSULTING
Matrix: Water
Method: USEPA 8260B Volatile Organic Compounds in Water
Sample units are expressed in mg/L
Analyte PQL
Client ID
Leeder ID
nd
nd
nd
nd
nd
nd
nd
nd0.001Xylenes
0.001Vinyl Chloride
Duplicate
GW04
2004016179
Blank
Method
2004015929
GW04
2004015924
GW02
2004015922
Matrix: Water
Method: MA-82 Polychlorinated Biphenyls
Sample units are expressed in ppm
Analyte PQL
Client ID
Leeder ID
nd
nd
nd
nd
nd
nd
nd
nd
nd
nd
nd
nd
nd
nd
nd
nd
nd
nd
nd
nd
nd
nd
nd
nd
nd
nd0.005Arochlor 1268
0.005Arochlor 1262
0.005Arochlor 1260
0.005Arochlor 1254
0.005Arochlor 1248
0.005Arochlor 1242
0.005Arochlor 1232
0.005Arochlor 1221
0.005Arochlor 1016
Blank
Method
2004015929
GW04
2004015924
GW02
2004015922
Page 4 of 23

DRAF
T
Report No: M241240(I) RESULTS
LEEDER CONSULTING
Matrix: Water
Method: MA-77 Organochlorine Pesticides
Sample units are expressed in mg/L
Analyte PQL
Client ID
Leeder ID
nd
nd
nd
nd
nd
nd
nd
nd
nd
nd
nd
nd
nd
nd
nd
nd
nd
nd
nd
nd
nd
nd
nd
nd
nd
nd
nd
nd
nd
nd
nd
nd
nd
nd
nd
nd
nd
nd
nd
nd
nd
nd
nd
nd
nd
nd
nd
nd
nd
nd
nd
nd
nd
nd
nd
nd
nd0.001Methoxychlor
0.001Hexachlorobenzene
0.001Heptachlor Epoxide
0.001Heptachlor
0.001Endrin Aldehyde
0.001Endrin
0.001Endosulfan Sulphate
0.001Endosulfan 2
0.001Endosulfan 1
0.001Dieldrin
0.0014,4-DDT
0.0014,4-DDE
0.0014,4-DDD
0.001Chlordane
0.001gamma-BHC
0.001delta-BHC
0.001beta-BHC
0.001alpha-BHC
0.001Aldrin
Blank
Method
2004015929
GW04
2004015924
GW02
2004015922
Page 5 of 23
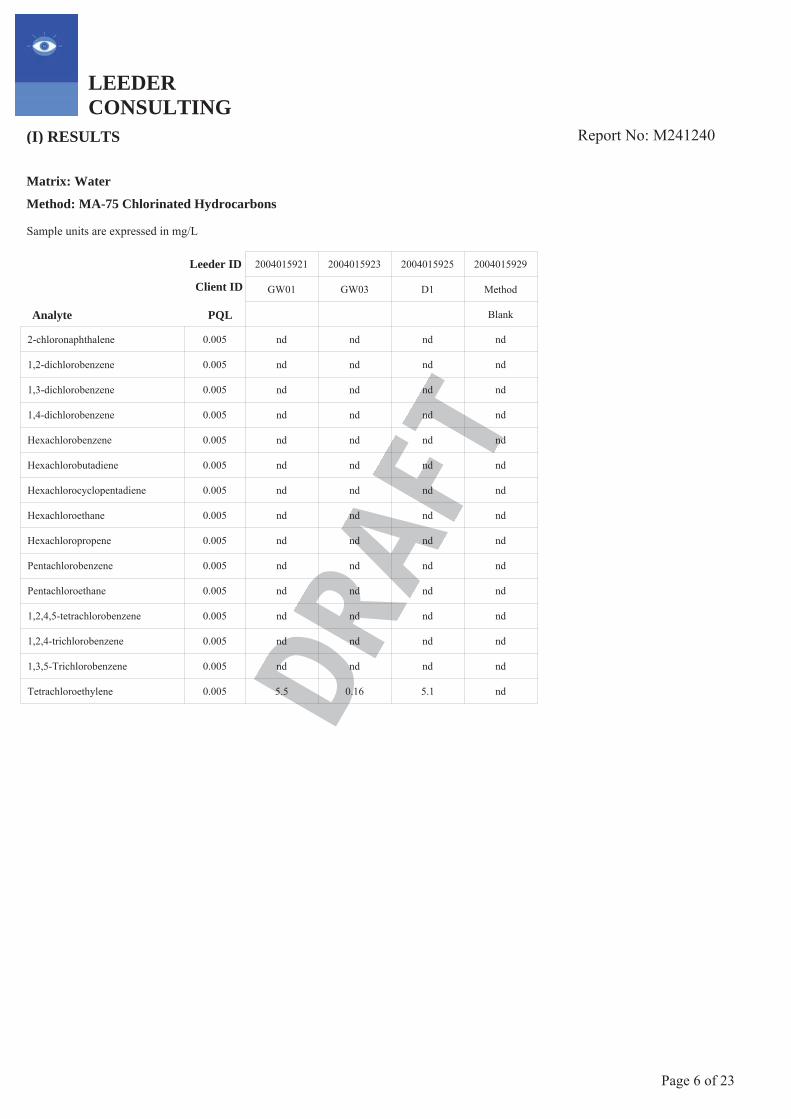
DRAF
T
Report No: M241240(I) RESULTS
LEEDER CONSULTING
Matrix: Water
Method: MA-75 Chlorinated Hydrocarbons
Sample units are expressed in mg/L
Analyte PQL
Client ID
Leeder ID
nd
nd
nd
nd
nd
nd
nd
nd
nd
nd
nd
nd
nd
nd
5.5
nd
nd
nd
nd
nd
nd
nd
nd
nd
nd
nd
nd
nd
nd
0.16
nd
nd
nd
nd
nd
nd
nd
nd
nd
nd
nd
nd
nd
nd
5.1
nd
nd
nd
nd
nd
nd
nd
nd
nd
nd
nd
nd
nd
nd
nd0.005Tetrachloroethylene
0.0051,3,5-Trichlorobenzene
0.0051,2,4-trichlorobenzene
0.0051,2,4,5-tetrachlorobenzene
0.005Pentachloroethane
0.005Pentachlorobenzene
0.005Hexachloropropene
0.005Hexachloroethane
0.005Hexachlorocyclopentadiene
0.005Hexachlorobutadiene
0.005Hexachlorobenzene
0.0051,4-dichlorobenzene
0.0051,3-dichlorobenzene
0.0051,2-dichlorobenzene
0.0052-chloronaphthalene
Blank
Method
2004015929
D1
2004015925
GW03
2004015923
GW01
2004015921
Page 6 of 23

DRAF
T
Report No: M241240(I) RESULTS
LEEDER CONSULTING
Matrix: Water
Method: MA-73 Phenols
Sample units are expressed in mg/L
Analyte PQL
Client ID
Leeder ID
nd
nd
nd
nd
nd
nd
nd
nd
nd
nd
nd
nd
nd
nd
nd
nd
nd
nd
nd
nd
nd
nd
nd
nd
nd
nd
nd
nd
nd
nd
nd
nd
nd
nd
nd
nd
nd
nd
nd
nd
nd
nd
nd
nd
nd
nd
nd
nd
nd
nd
nd
nd
nd
nd
nd
nd
nd0.0052,4,6-Trichlorophenol
0.0052,4,5-Trichlorophenol
0.005Tetrachlorophenol
0.0052,3,4,5-Tetrachlorophenol
0.005Phenol
0.005Pentachlorophenol
0.0054-Nitrophenol
0.0052-Nitrophenol
0.005Hexachlorophene
0.005Dinoseb
0.0052,4-Dinitrophenol
0.0054,6-Dinitro-2-methylphenol
0.0052,4-Dimethylphenol
0.0052,6-Dichlorophenol
0.0052,4-Dichlorophenol
0.005o-cresol
0.005m&p Cresol
0.0052-Chlorophenol
0.0054-Chloro-3-methylphenol
Blank
Method
2004015929
GW04
2004015924
GW02
2004015922
Page 7 of 23

DRAF
T
Report No: M241240(I) RESULTS
LEEDER CONSULTING
Matrix: Water
Method: MA-72 Polynuclear Aromatic Hydrocarbons
Sample units are expressed in mg/L
Analyte PQL
Client ID
Leeder ID
nd
nd
nd
nd
nd
nd
nd
nd
nd
nd
nd
nd
nd
nd
nd
nd
nd
nd
nd
nd
nd
nd
nd
nd
nd
nd
nd
nd
nd
nd
nd
nd
nd
nd
nd
nd
nd
nd
nd
nd
nd
nd
nd
nd
nd
nd
nd
nd
nd
nd
nd
nd
nd
nd0.001Pyrene
0.001Phenanthrene
0.001Naphthalene
0.0013-Methylcholanthene
0.001Indeno (123-cd) pyrene
0.001Fluorene
0.001Fluoranthene
0.0017,12 Dimethylbenz(a)anthracene
0.001Dibenz (ah) anthracene
0.001Chrysene
0.001Benzo (k) fluoranthene
0.001Benzo (ghi) perylene
0.001Benzo (b) fluoranthene
0.001Benzo (a) pyrene
0.001Benz (a) anthracene
0.001Anthracene
0.001Acenaphthylene
0.001Acenaphthene
Blank
Method
2004015929
GW04
2004015924
GW02
2004015922
Page 8 of 23

DRAF
T
Report No: M241240(I) RESULTS
LEEDER CONSULTING
Matrix: Water
Method: MA-30 Total Petroleum Hydrocarbons
Sample units are expressed in mg/L
Analyte PQL
Client ID
Leeder ID
0.70
0.09
nd
nd
0.79
nd
0.52
1.4
nd
1.9
nd
0.02
nd
nd
nd
1.3
0.03
nd
nd
1.3
0.09
0.06
nd
nd
0.14
nd
nd
nd
nd
nd0.05Total C6-C36
0.05C29-C36
0.05C15-C28
0.01C10-C14
0.01C6-C9
Blank
Method
2004015929
D1
2004015925
GW04
2004015924
GW03
2004015923
GW02
2004015922
GW01
2004015921
Matrix: Water
Method: MA-1490 pH of water
Sample units are expressed in pH units
Analyte PQL
Client ID
Leeder ID
6.8 6.8 6.0pH
Blank
Method
2004015929
GW04
2004015924
GW02
2004015922
Page 9 of 23

DRAF
T
Report No: M241240(I) RESULTS
LEEDER CONSULTING
Matrix: Water
Method: MA-1400 Metals
Sample units are expressed in mg/L
Analyte PQL
Client ID
Leeder ID
0.0010
nd
nd
nd
nd
nd
nd
0.040
nd
0.0010
0.32
nd
0.46
nd
nd
nd
nd
nd
1.3
nd
nd
nd
nd
nd
0.030
0.0010
nd
nd
nd
nd
nd
nd
0.040
nd
0.0010
0.29
nd
0.33
nd
nd
nd
nd
nd
0.020
nd
nd
nd
nd
nd
0.040
0.0020
nd
nd
nd
nd
nd
nd
0.030
nd
nd
nd
nd
nd
nd
nd
nd
nd
nd
nd
nd
nd
nd
nd
nd
nd
nd
0.0010
0.32
nd
0.47
nd
nd
nd
nd
nd
1.3
nd
nd
nd
nd
nd
0.0400.001Zinc
0.001Tin
0.005Selenium
0.001Nickel
0.001Molybdenum
0.0005Mercury
0.001Manganese
0.001Lead
0.001Copper
0.001Cobalt
0.001Chromium
0.0005Cadmium
0.001Boron
0.001Berylium
0.001Barium
0.0005Arsenic
0.001Antimony
Duplicate
GW02
2004016341
Blank
Method
2004015929
D1
2004015925
GW04
2004015924
GW03
2004015923
GW02
2004015922
GW01
2004015921
Page 10 of 23

DRAF
T
Report No: M241240(I) RESULTS
LEEDER CONSULTING
Matrix: Water
Method: MA-1102 Total Cyanide
Sample units are expressed in mg/L
Analyte PQL
Client ID
Leeder ID
nd nd nd nd0.01Total Cyanide
Duplicate
GW04
2004016179
Blank
Method
2004015929
GW04
2004015924
GW02
2004015922
Page 11 of 23

DRAF
T
Report No: M241240(I) RESULTS
LEEDER CONSULTING
Matrix: Water
Method: MA-10 Monoaromatic Hydrocarbons
Sample units are expressed in mg/L
Analyte PQL
Client ID
Leeder ID
nd
nd
nd
nd
nd
nd
nd
nd
nd
nd
nd
nd
nd
nd
nd
nd
nd
nd
nd
nd
nd
nd
nd
nd
nd
nd
nd
nd0.001Xylene
0.001Toluene
0.001Ethylbenzene
0.001Benzene
Blank
Method
2004015929
Duplicate
GW01
2004015926
D1
2004015925
GW04
2004015924
GW03
2004015923
GW02
2004015922
GW01
2004015921
Matrix: Water
Method: MA-10 Monoaromatic Hydrocarbons
Sample units are expressed in mg/L
Analyte PQL
Client ID
Leeder ID
nd
nd
nd
nd0.001Xylene
0.001Toluene
0.001Ethylbenzene
0.001Benzene
Duplicate
GW04
2004016179
Page 12 of 23

DRAF
T
Report No: M241240(I) RESULTS
LEEDER CONSULTING
Matrix: Water
Method: % VOC Surrogate Recovery
Sample units are expressed in %
Analyte
Client ID
Leeder ID
110
110
110
110
100
100
100
99
120
120
120
110
120
120
110
110
110
110
100
110
110
110
110
110
120
110
110
100p-Bromofluorobenzene
Toluene-d8
12-Dichloroethane-d4
Dibromofluoromethane
Blank
Method
2004015929
Duplicate
GW01
2004015926
D1
2004015925
GW04
2004015924
GW03
2004015923
GW02
2004015922
GW01
2004015921
Matrix: Water
Method: % VOC Surrogate Recovery
Sample units are expressed in %
Analyte
Client ID
Leeder ID
120
110
110
100p-Bromofluorobenzene
Toluene-d8
12-Dichloroethane-d4
Dibromofluoromethane
Duplicate
GW04
2004016179
Page 13 of 23

DRAF
T
Report No: M241240(I) RESULTS
LEEDER CONSULTING
Matrix: Water
Method: % Surrogate Recovery
Sample units are expressed in %
Analyte
Client ID
Leeder ID
130
100
97
63
110
99
110
86
99
73
97
100
120
86
100
60
120
110
130
73
120
71
120
100
130
75
110
62
110
100
120
69
120
69
110
682,4,6-Tribromophenol
p-Terphenyl-d14
Phenol-d6
Nitrobenzene-d5
Fluorophenol
Fluorobiphenyl
Blank
Method
2004015929
D1
2004015925
GW04
2004015924
GW03
2004015923
GW02
2004015922
GW01
2004015921
Page 14 of 23

DRAF
T
Report No: M241240(II) QUALITY CONTROL
LEEDER CONSULTING
Matrix: Water
Method: USEPA 8260B Volatile Organic Compounds in Water
Quality Control Results are expressed in Percent Recovery of expected result
Analyte
Client ID
Leeder ID
100
100
100
100
100
99
99
99
100
110
100
110
99
100
99
96
100
100
100
95
97
100
100
100
110
110
100
100
110
100
100
100
110
100
100
100
110
110
110
100
100
100
100
99
100
100
100
100
100
100
100
110
110
110
110
110Dichloromethane
trans-1,2-Dichloroethene
cis-1,2-Dichloroethene
1,1-Dichloroethene
1,1-Dichloroethane
1,2-Dichloroethane
Dichlorodifluoromethane
1,4-Dichlorobenzene
1,3-Dichlorobenzene
1,2-Dichlorobenzene
Dibromomethane
1,2-Dibromoethane
1,2-Dibromo-3-chloropropane
Dibromochloromethane
4-Chlorotoluene
2-Chlorotoluene
Chloromethane
Chloroethane
Chlorobenzene
Carbon tetrachloride
t-Butylbenzene
s-Butylbenzene
n-Butylbenzene
Bromomethane
Bromodichloromethane
Bromochloromethane
Bromobenzene
Benzene
SpikeDup
Method
2004015928
Spike
Method
2004015927
Page 15 of 23

DRAF
T
Report No: M241240(II) QUALITY CONTROL
LEEDER CONSULTING
Matrix: Water
Method: USEPA 8260B Volatile Organic Compounds in Water
Quality Control Results are expressed in Percent Recovery of expected result
Analyte
Client ID
Leeder ID
100
110
100
110
100
99
100
96
100
98
100
99
100
100
110
100
100
97
94
93
100
100
100
100
100
100
95
96
110
110
100
110
100
100
100
97
100
100
110
100
110
100
110
100
110
99
93
110
100
110
110
100
110
110
98
1001,3,5-Trimethylbenzene
1,2,4-Trimethylbenzene
1,2,3-Trichloropropane
Trichloromethane
Trichlorofluoromethane
Trichloroethene
1,1,2-Trichloroethane
1,1,1-Trichloroethane
1,2,4-Trichlorobenzene
1,2,3-Trichlorobenzene
Tribromomethane
Toluene
1,1,1,2-Tetrachloroethane
Tetrachloroethene
1,1,2,2-Tetrachloroethane
Styrene
Propylbenzene
Naphthalene
p-Isopropyltoluene
Isopropylbenzene
Hexachloro-1,3-butadiene
Ethylbenzene
trans-1,3-Dichloropropene
cis-1,3-Dichloropropene
1,1-Dichloropropene
2,2-Dichloropropane
1,3-Dichloropropane
1,2-Dichloropropane
SpikeDup
Method
2004015928
Spike
Method
2004015927
Page 16 of 23

DRAF
T
Report No: M241240(II) QUALITY CONTROL
LEEDER CONSULTING
Matrix: Water
Method: USEPA 8260B Volatile Organic Compounds in Water
Quality Control Results are expressed in Percent Recovery of expected result
Analyte
Client ID
Leeder ID
110
100
110
110Xylenes
Vinyl Chloride
SpikeDup
Method
2004015928
Spike
Method
2004015927
Matrix: Water
Method: MA-77 Organochlorine Pesticides
Quality Control Results are expressed in Percent Recovery of expected result
Analyte
Client ID
Leeder ID
110
120
94
110
79
86
77
120
60
100
78
76Heptachlor
Endrin
Dieldrin
4,4-DDT
gamma-BHC
Aldrin
SpikeDup
Method
2004015928
Spike
Method
2004015927
Page 17 of 23

DRAF
T
Report No: M241240(II) QUALITY CONTROL
LEEDER CONSULTING
Matrix: Water
Method: MA-73 Phenols
Quality Control Results are expressed in Percent Recovery of expected result
Analyte
Client ID
Leeder ID
98
71
110
76Phenol
4-Chloro-3-methylphenol
SpikeDup
Method
2004015928
Spike
Method
2004015927
Matrix: Water
Method: MA-72 Polynuclear Aromatic Hydrocarbons
Quality Control Results are expressed in Percent Recovery of expected result
Analyte
Client ID
Leeder ID
110
120
120
100Pyrene
Acenaphthene
SpikeDup
Method
2004015928
Spike
Method
2004015927
Page 18 of 23

DRAF
T
Report No: M241240(II) QUALITY CONTROL
LEEDER CONSULTING
Matrix: Water
Method: MA-30 Total Petroleum Hydrocarbons
Quality Control Results are expressed in Percent Recovery of expected result
Analyte
Client ID
Leeder ID
120
110
90
100
120
110
94
110C29-C36
C15-C28
C10-C14
C6-C9
SpikeDup
Method
2004015928
Spike
Method
2004015927
Page 19 of 23

DRAF
T
Report No: M241240(II) QUALITY CONTROL
LEEDER CONSULTING
Matrix: Water
Method: MA-1400 Metals
Quality Control Results are expressed in Percent Recovery of expected result
Analyte
Client ID
Leeder ID
98
120
120
100
100
120
120
110
110
120
100
100
90
110
130
98
120Zinc
Tin
Selenium
Nickel
Molybdenum
Mercury
Manganese
Lead
Copper
Cobalt
Chromium
Cadmium
Boron
Berylium
Barium
Arsenic
Antimony
Spike
GW02
2004016342
Page 20 of 23

DRAF
T
Report No: M241240(II) QUALITY CONTROL
LEEDER CONSULTING
Matrix: Water
Method: MA-1102 Total Cyanide
Quality Control Results are expressed in Percent Recovery of expected result
Analyte
Client ID
Leeder ID
100Total Cyanide
Spike
GW04
2004016343
Matrix: Water
Method: MA-10 Monoaromatic Hydrocarbons
Quality Control Results are expressed in Percent Recovery of expected result
Analyte
Client ID
Leeder ID
110
100
100
100
110
100
110
110Xylene
Toluene
Ethylbenzene
Benzene
SpikeDup
Method
2004015928
Spike
Method
2004015927
Page 21 of 23

DRAF
T
Report No: M241240(II) QUALITY CONTROL
LEEDER CONSULTING
Matrix: Water
Method: % VOC Surrogate Recovery
Quality Control Results are expressed in Percent Recovery of expected result
Analyte
Client ID
Leeder ID
99
100
100
100
100
110
100
100p-Bromofluorobenzene
Toluene-d8
12-Dichloroethane-d4
Dibromofluoromethane
SpikeDup
Method
2004015928
Spike
Method
2004015927
Matrix: Water
Method: % Surrogate Recovery
Quality Control Results are expressed in Percent Recovery of expected result
Analyte
Client ID
Leeder ID
120
89
110
63
130
120
94
65
120
65
110
1102,4,6-Tribromophenol
p-Terphenyl-d14
Phenol-d6
Nitrobenzene-d5
Fluorophenol
Fluorobiphenyl
SpikeDup
Method
2004015928
Spike
Method
2004015927
Page 22 of 23

DRAF
T
Report No: M241240
LEEDER CONSULTING
QUALIFIERS / NOTES FOR REPORTED RESULTS
is Insufficient Sample to perform this analysis.
T Tentative identification based on computer library search of mass spectra.
ND Not Detected – The analyte was not detected at or above the reported PQL.
nr Not Requested for analysis.
R Rejected Result – results for this analysis failed QC checks.
SQ Semi-Quantitative result – quantitation based on a generic response factor for this class of analyte.
U Unable to provide Quality Control data – high levels of compounds in sample interfered with analysis of surrogate QC results.
UI Unable to provide Quality Control data – insufficient sample to perform QC checks.
B This analyte also detected in analysis of the Method Blank.
D Deviation from standard method – see notes for specific explanation.
L Analyte detected at a level above the linear response of calibration curve.
NS Analyte not part of standard compound list for this method.
NT No blank sorbent tubes provided for QC analysis.
C1 These compounds co-elute.
C2 These compounds co-elute.
Page 23 of 23

DRAF
T
LEEDER CONSULTING
APPENDIX ONE.
CHAIN OF CUSTODY DOCUMENT

DRAF
T

DRAF
T
APPE
REP RTS F REH LE L S ELL PERM TS
ESA Phase 2 – Glenelg Dry Cleaners, 31-47 Cliff Street, Glenelg East W:\Projects\SG041189_ESA Glenelg DC\Report\SG041189rp01.doc Revision 0

DRAF
T
A D
A
R D
R
Push
tube
/ soli
d aug
ers
SP
SM
SP
CL
CI
CL
FILLGravelly SAND, grey brown, fine to coarse grained, fine to coarse gravel. (concrete and bitumen inclusions)Silty SANDBrown, fine to medium grained, low liquid limit finesGravelly SANDBrown, mediumto coarse grained, fine gravel.Sandy CLAYBrown, low plasticity, fine to coarse grained sand.
Sandy CLAYPale brown, medium plasticity, fine to coarse sand.
Red brown
Sandy CLAYPale brown,low plasticity, fine to coarse grained sand.
Borehole Terminated
M
M
M
=PL
=PL
<PL
GW1/40.5-0.7m
GW1/11-1.2 m
GW1/22.2-2.4 m
GW1/33.8-4.0 m
Flush Mount Cover
SWL 29/9/04 4.05 m
Cement/bentonie grout
Casing 50 mm Dia Class 18
Bentonie Seal
Screen 50 mm Dia Class 18
Filter Pack
End Cap @ 6.0 m
32
69
22
50
GROUNDWATER WELL REPORT WELL NUMBER:
Project No:
Project:Client:
Location:
Date Commenced:Date Completed:
Logged by:Checked by:
R.L. surface:
Datum:Easting:Northing:
Contractor:Operator:Machine:
Page 1 of 1
First Floor 207 The ParadeNORWOOD SA 5067T: + 61 8 8431 7113
SUBSURFACE PROFILE SAMPLING
Drilli
ng M
ethod
Wate
r
Depth
(m)
1
2
3
4
5
6
Grap
hic
USCS
Description
Moist
ure
Cons
isten
cyRe
cove
ry Sampling Well Construction Details
PID
(ppm
)

DRAF
T

DRAF
T

DRAF
T
GW2
SG041189
ESA Glenelg EastGlenelg Dry Cleaners
Glenelg East
30/9/0430/9/04
NBPAKW
10.36
RL arbitaryDrillmax
ShaneRockmaster
Push
tube
/ soli
d aug
ers
SP SM
CI
SC
CI
CL
FILLGravelly SAND, brown, fine to coarse grained, fine to medium gravel.Silty SANDBrown, fine to coarse grained, low liquid limit fines. (sandy lense @ 0.7 m)Sandy CLAYRed brown, medium plasticity, fine to coarse sandClayey SANDBrown, fine to coarse grained, low plasticity fines.
Sandy CLAYPale brown, medium plasticity, fine to coarse sand.
Red brown
Brown
(diesel odour from 3.8 m)
Borehole Terminated
M M
=PL
M
=PL
<PL
GW2/10.2-0.4 m
GW2/20.8-1.0 m
GW2/32.5-2.6 m
GW2/4 & D33.8-4.0 m
Flush Mount Cover
SWL 30/9/04 3.9 m
Cement/bentonie grout
Casing 50 mm Dia Class 18
Bentonie Seal
Screen 50 mm Dia Class 18
Filter Pack
End Cap @ 6.0 m
3
14
5
101
GROUNDWATER WELL REPORT WELL NUMBER:
Project No:
Project:Client:
Location:
Date Commenced:Date Completed:
Logged by:Checked by:
R.L. surface:
Datum:Easting:Northing:
Contractor:Operator:Machine:
Page 1 of 1
First Floor 207 The ParadeNORWOOD SA 5067T: + 61 8 8431 7113
SUBSURFACE PROFILE SAMPLING
Drilli
ng M
ethod
Wate
r
Depth
(m)
1
2
3
4
5
6
Grap
hic
USCS
Description
Moist
ure
Cons
isten
cyRe
cove
ry Sampling Well Construction Details
PID
(ppm
)

DRAF
T

DRAF
T

DRAF
T
GW3
SG041189
ESA Glenelg EastGlenelg Dry Cleaners
Glenelg East
29/9/0429/9/04
NBPAKW
10.00
RLDrillmax
ShaneRockmaster
Solid
auge
rs
SM
CI
CONCRETESilty SANDBrown, fine to coarse grained, low liquid limit fines.Sandy CLAYBrown/red brown, medium plasticity, fine to coarse sand.
Cobbles @ 5.4 m
Borehole Terminated
M
=PL
Flush Mount Cover
SWL 29/9/04 3.5 m
Cement/bentonie grout
Casing 50 mm Dia Class 18
Bentonie Seal
Screen 50 mm Dia Class 18
Filter Pack
End Cap @ 6.0 m
GROUNDWATER WELL REPORT WELL NUMBER:
Project No:
Project:Client:
Location:
Date Commenced:Date Completed:
Logged by:Checked by:
R.L. surface:
Datum:Easting:Northing:
Contractor:Operator:Machine:
Page 1 of 1
First Floor 207 The ParadeNORWOOD SA 5067T: + 61 8 8431 7113
SUBSURFACE PROFILE SAMPLING
Drilli
ng M
ethod
Wate
r
Depth
(m)
1
2
3
4
5
6
Grap
hic
USCS
Description
Moist
ure
Cons
isten
cyRe
cove
ry Sampling Well Construction Details
PID
(ppm
)

DRAF
T
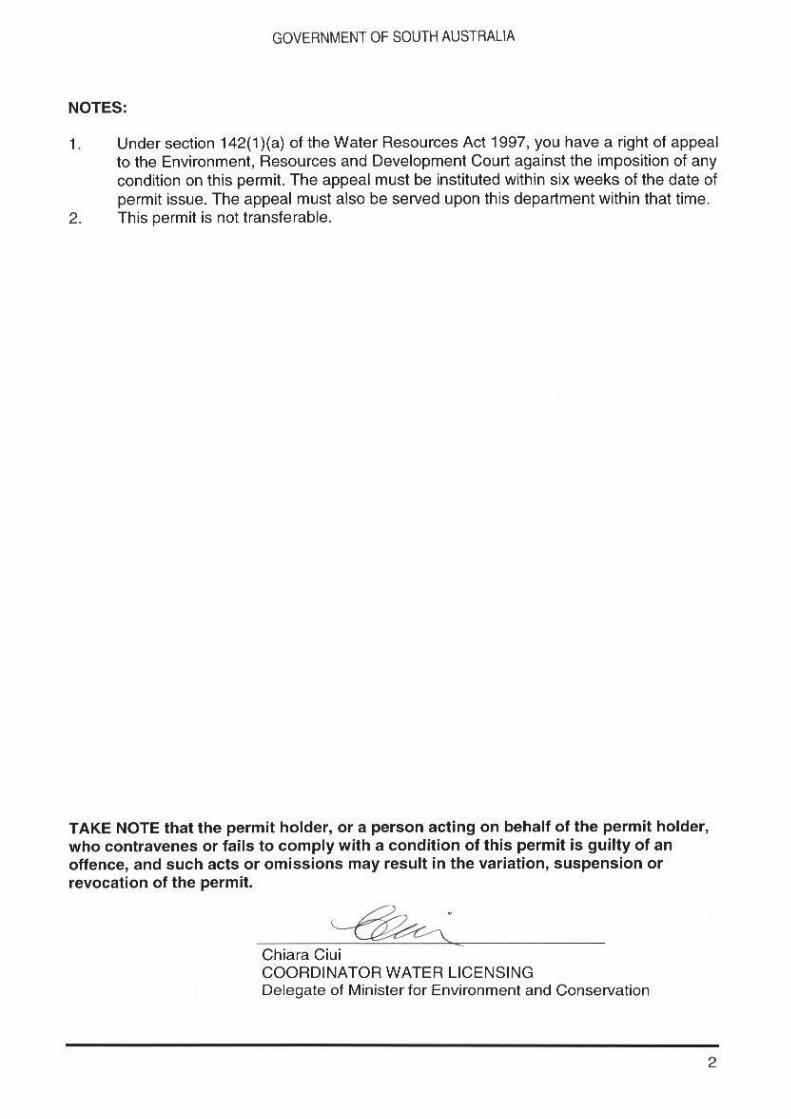
DRAF
T

DRAF
T
GW4
SG041189
ESA Glenelg EastGlenelg Dry Cleaners
Glenelg East
29/9/0429/9/04
NBPAKW
10.13
RLDrillmax
ShaneRockmaster
Solid
auge
rs
GP SM
CI
FILLSandy Cobbles, brown, cobbles & red bricks, fine to coarse sand and gravel.Silty SANDDark brown, fine to medium grained, low liquid limit fines.Sandy CLAYBrown, medium plasticity, fine to coarse sand.
Red brown
Borehole Terminated
M
M
=PL
Flush Mount Cover
SWL 29/9/04 3.8 m
Cement/bentonie grout
Casing 50 mm Dia Class 18
Bentonie Seal
Screen 50 mm Dia Class 18
Filter Pack
End Cap @ 6.0 m
GROUNDWATER WELL REPORT WELL NUMBER:
Project No:
Project:Client:
Location:
Date Commenced:Date Completed:
Logged by:Checked by:
R.L. surface:
Datum:Easting:Northing:
Contractor:Operator:Machine:
Page 1 of 1
First Floor 207 The ParadeNORWOOD SA 5067T: + 61 8 8431 7113
SUBSURFACE PROFILE SAMPLING
Drilli
ng M
ethod
Wate
r
Depth
(m)
1
2
3
4
5
6
Grap
hic
USCS
Description
Moist
ure
Cons
isten
cyRe
cove
ry Sampling Well Construction Details
PID
(ppm
)

DRAF
T

DRAF
T

DRAF
T
SB01
SG041189
ESA Glenelg EastGlenelg Dry Cleaners
Glenelg East
29/9/04
NBPDrillmax
Rockmaster
Push
tube
SP
SM
SC
SC
SC
CI
SC
FILLGravelly SAND, yellow brown, medium to coarse grained sand, fine to medium grained gravelSilty SANDBrown, fine to medium grained sand, low liquid limit fines
Clayey silty SANDBrown, fine to medium grained sand, low liquid limit fines
Clayey SANDGrey/brown, fine to coarse grained sand, medium plasticity clayClayey SANDRed brown, fine to coarse grained sand, medium plasticity fines
Sandy CLAYRed brown, medium plasticity, fine to coarse grained sandClayey SANDPale brown, fine to coarse grained sand, low plastcity fines
Borehole Terminated
M
M
M
M
<PL
W
SB1/10.05 - 0.2 mSB1/20.3 - 0.4 m
SB1/31.1 - 1.3 m
SB1/42.4 - 2.5 m
SB1/53.8 - 4 m
Bitumen surfaceRed brick fragments
Calcareous inclusions
5
5
5
6
3
SOIL BOREHOLE REPORT SOIL BOREHOLE NUMBER:
Project No:
Project:Client:
Location:
Date:
Logged by:
Checked by: R.L. surface:
Datum:Easting:Northing:
Contractor:Operator:Machine:
Page 1 of 1
First Floor 207 The ParadeNORWOOD SA 5067T: + 61 8 8431 7113
SUBSURFACE PROFILE SAMPLING
Drilli
ng M
ethod
Wate
r
Depth
(m)
0.5
1.0
1.5
2.0
2.5
3.0
3.5
4.0
Grap
hic
USCS
Description
Moist
ure
Cons
isten
cyRe
cove
ry Sampling Additional Comments
PID
(ppm
)

DRAF
T
SB02
SG041189
ESA Glenelg EastGlenelg Dry Cleaners
Glenelg East
29/9/04
NBPDrillmax
Rockmaster
Push
tube
SP
SM
SP
SC
CI
FILLGravelly SAND, brown, medium to coarse grained sand, fine to coarse grained gravelSilty SANDBrown, fine to coarse grained sand, low liquid limit finesSANDBrown, medium to coarse grained with traces of low plasticity fines
Clayey SANDBrown, fine to coarse grained sand, low plasticity fines
Sandy CLAYPale brown, medium plasticity, fine to coarse grained sand
Red brown
Borehole Terminated
M
M
M
M
PL
SB2/10.3 - 0.4 m
SB2/2D10.6 - 0.7 m
SB2/31.4 - 1.5 m
SB2/42.6 - 2.7 m
Bitumen surface
5
11
12
14
SOIL BOREHOLE REPORT SOIL BOREHOLE NUMBER:
Project No:
Project:Client:
Location:
Date:
Logged by:
Checked by: R.L. surface:
Datum:Easting:Northing:
Contractor:Operator:Machine:
Page 1 of 1
First Floor 207 The ParadeNORWOOD SA 5067T: + 61 8 8431 7113
SUBSURFACE PROFILE SAMPLING
Drilli
ng M
ethod
Wate
r
Depth
(m)
0.5
1.0
1.5
2.0
2.5
3.0
3.5
4.0
Grap
hic
USCS
Description
Moist
ure
Cons
isten
cyRe
cove
ry Sampling Additional Comments
PID
(ppm
)

DRAF
T
SB03
SG041189
ESA Glenelg EastGlenelg Dry Cleaners
Glenelg East
29/9/04
NBPDrillmax
Rockmaster
Push
tube
GP
SM
SP
SC
CI
SC
FILLSandy GRAVEL, pale brown, fine grained gravel, fine to coarse grained sandSilty SANDBrown, fine to coarse grained sand, low liquid limit fines
Clayey gravelly SANDRed brown, fine to coarse grained sand, fine to coarse grained gravel, low plasticity fines
Clayey silty SANDBrown, fine to coarse grained sand, low plasticity fines
Sandy CLAYBrown, medium plasticity, fine to coarse grained snad
Clayey SANDBrown/red brown, fine to coarse grained sand, low plasticity fines
Borehole Terminated
D
M
M
M
PL
M
SG3/10 - 0.2 m
SG3/20.4 - 0.6 m
SG3/31 - 1.2 m
SG3/42.1 - 2.3 m
SG3/53.3 - 3.5 m
12
15
15
32
17
SOIL BOREHOLE REPORT SOIL BOREHOLE NUMBER:
Project No:
Project:Client:
Location:
Date:
Logged by:
Checked by: R.L. surface:
Datum:Easting:Northing:
Contractor:Operator:Machine:
Page 1 of 1
First Floor 207 The ParadeNORWOOD SA 5067T: + 61 8 8431 7113
SUBSURFACE PROFILE SAMPLING
Drilli
ng M
ethod
Wate
r
Depth
(m)
0.5
1.0
1.5
2.0
2.5
3.0
3.5
4.0
Grap
hic
USCS
Description
Moist
ure
Cons
isten
cyRe
cove
ry Sampling Additional Comments
PID
(ppm
)

DRAF
T
SB04
SG041189
ESA Glenelg EastGlenelg Dry Cleaners
Glenelg East
29/9/04
NBPDrillmax
Rockmaster
Push
Tub
e
SM
CI
SP
FILLConcreteSilty SANDBrown, fine to medium grained sand, low liquid limit finesSandy CLAYBrown, medium plasticity, fine to coarse grained sand
Gravelly SANDBrown, fine to coarse grained sand, fine to coarse grained gravel
Borehole Terminated
SB4/10.1 - 0.2 m
SB4/20.5 - 0.7 m
SB4/31.2 - 1.4 m
Concrete
Poor recovery 1.5 - 2m
2
15
3
SOIL BOREHOLE REPORT SOIL BOREHOLE NUMBER:
Project No:
Project:Client:
Location:
Date:
Logged by:
Checked by: R.L. surface:
Datum:Easting:Northing:
Contractor:Operator:Machine:
Page 1 of 1
First Floor 207 The ParadeNORWOOD SA 5067T: + 61 8 8431 7113
SUBSURFACE PROFILE SAMPLING
Drilli
ng M
ethod
Wate
r
Depth
(m)
0.5
1.0
1.5
2.0
2.5
3.0
3.5
4.0
Grap
hic
USCS
Description
Moist
ure
Cons
isten
cyRe
cove
ry Sampling Additional Comments
PID
(ppm
)

DRAF
T
SB5
SG041189
ESA Glenelg EastGlenelg Dry Cleaners
Glenelg East
29/9/04
NBPDrillmax
Rockmaster
Porta
ble pu
sh tu
be SM
SC
FILLConcreteSilty SANDBrown, fine to coarse grained sand, low liquid limit fines
Clayey silty SANDBrown, fine to coarse grained sand, low plasticity fines
Borehole Terminated
D
M
M
SB5/1D20.1 - 0.3
SB5/20.5 - 0.7
SB5/31 - 1.2
SB5/41.6 - 1.8
Concrete
White, coarse grained gravel inclusions
68
37
8
192
SOIL BOREHOLE REPORT SOIL BOREHOLE NUMBER:
Project No:
Project:Client:
Location:
Date:
Logged by:
Checked by: R.L. surface:
Datum:Easting:Northing:
Contractor:Operator:Machine:
Page 1 of 1
First Floor 207 The ParadeNORWOOD SA 5067T: + 61 8 8431 7113
SUBSURFACE PROFILE SAMPLING
Drilli
ng M
ethod
Wate
r
Depth
(m)
0.5
1.0
1.5
2.0
2.5
3.0
3.5
4.0
Grap
hic
USCS
Description
Moist
ure
Cons
isten
cyRe
cove
ry Sampling Additional Comments
PID
(ppm
)

DRAF
T
SB06
SG041189
ESA Glenelg EastGlenelg Dry Cleaners
Glenelg East
30/9/04
NBPDrillmax
Rockmaster
Porta
ble pu
sh tu
be SM
SP
CI
FILLConcreteSilty SANDBrown, fine to coarse grained sand, low liquid limit fines
SANDBrown, medium to coarse grainedSandy CLAYBrown, medium plasticity, fine to coarse grained sand
Borehole Terminated
D M
M
<PL
SB6/10.1 - 0.2
SB6/20.6 - 0.7
SB6/31.6 - 2.0
ConcreteClay content increasing with depth
43
14
53
SOIL BOREHOLE REPORT SOIL BOREHOLE NUMBER:
Project No:
Project:Client:
Location:
Date:
Logged by:
Checked by: R.L. surface:
Datum:Easting:Northing:
Contractor:Operator:Machine:
Page 1 of 1
First Floor 207 The ParadeNORWOOD SA 5067T: + 61 8 8431 7113
SUBSURFACE PROFILE SAMPLING
Drilli
ng M
ethod
Wate
r
Depth
(m)
0.5
1.0
1.5
2.0
2.5
3.0
3.5
4.0
Grap
hic
USCS
Description
Moist
ure
Cons
isten
cyRe
cove
ry Sampling Additional Comments
PID
(ppm
)

DRAF
T
SB07
SG041189
ESA Glenelg EastGlenelg Dry Cleaners
Glenelg East
30/9/04
NBPDrillmax
Rockmaster
Porta
ble pu
sh tu
be SM
CH
CI
FILLConcreteSilty SANDBrown, fine to coarse grained, low liquid limit finesSandy CLAYRed brown, high plasticity, fine to coarse sandSandy CLAYBrown, medium plasticity, fine to coarse grained sand.
Borehole Terminated
M
<PL
<PL
SB7/10.1 - 0.3
SB7/20.4-0.6
SB7/31.7-1.9
Pockets of sandy clay
Grey gravel inclusions @ 1.4 m
0
0
0
SOIL BOREHOLE REPORT SOIL BOREHOLE NUMBER:
Project No:
Project:Client:
Location:
Date:
Logged by:
Checked by: R.L. surface:
Datum:Easting:Northing:
Contractor:Operator:Machine:
Page 1 of 1
First Floor 207 The ParadeNORWOOD SA 5067T: + 61 8 8431 7113
SUBSURFACE PROFILE SAMPLING
Drilli
ng M
ethod
Wate
r
Depth
(m)
0.5
1.0
1.5
2.0
2.5
3.0
3.5
4.0
Grap
hic
USCS
Description
Moist
ure
Cons
isten
cyRe
cove
ry Sampling Additional Comments
PID
(ppm
)

DRAF
T
SB08
SG041189
ESA Glenelg EastGlenelg Dry Cleaners
Glenelg East
30/9/04
NBPDrillmax
Rockmaster
Diam
ond C
oring
barre
l
ConcreteConcrete to greater than 0.4 m
(refusal on concrete)
Borehole Terminated
SOIL BOREHOLE REPORT SOIL BOREHOLE NUMBER:
Project No:
Project:Client:
Location:
Date:
Logged by:
Checked by: R.L. surface:
Datum:Easting:Northing:
Contractor:Operator:Machine:
Page 1 of 1
First Floor 207 The ParadeNORWOOD SA 5067T: + 61 8 8431 7113
SUBSURFACE PROFILE SAMPLING
Drilli
ng M
ethod
Wate
r
Depth
(m)
0.5
1.0
1.5
2.0
2.5
3.0
3.5
4.0
Grap
hic
USCS
Description
Moist
ure
Cons
isten
cyRe
cove
ry Sampling Additional Comments
PID
(ppm
)