Embed Size (px)
Citation preview
Test Programme for the Fab 10 RCTO Abatement System
Introduction
A rotor concentrator/thermal oxidiser (RCTO) unit has been installed during the second and third quarter of 2002 into Fab 10. The unit treats emissions of volatile organic compounds (VOCs) and significantly reduces the mass of VOC discharged to air. The RCTO system was extensively described in attachment 9 of the Integrated Pollution Control Licence Application, December 2000.
A test proposal to assess the performance of the installed technology was submitted to the Agency on the 1”’ of May 2002 and approved by the Agency in a letter dated the 8/05/02 (ref. M589/ap02mm.doc). The proposal described the following:
l The proposed methodology for demonstrating the VOC removal efficiency and compliance with the limits specified in the IPCL.
l Description of the controls in place for successful operation.
The commissioning process has now been completed including the:
* Construction and commissioning phases; . Optimisation of control systems; n Staff training and development of operating procedures.
This test programme report details the monitoring carried out to demonstrate that the Fab 10 RCTO is operating in compliance with the IPCL. The results have been compared against the criteria identified in the test programme proposal and the requirements of Schedule l(i) of the IPCL. In accordance with the Condition 2.6.6 of the IPCL, an estimate of the frequency of bypass condition of the RCTO unit has been included along with a contingency plan to prevent any exceedance of IPCL limits.
Methodology for demonstrating VOC removal efficiency and compliance with IPCL Limits
Detailed monitoring has been carried out to demonstrate the VOC removal efficiency and level of emissions released to air. The monitoring programme included both continuous and non-continuous methods and was carried out using methodology described in the proposal. Emissions of total organic carbon (TOC)/ VOC were monitored on the inlet of the RCTO and the two outlet stacks to assess emission performance and the removal efficiency of VOC. Monitoring of oxides of nitrogen (NOx and N02), carbon monoxide (CO), Sulphur Dioxide (SO2), oxygen (02) and temperature was also carried out on the oxidiser exhaust to
For
insp
ectio
n pur
pose
s only
.
Conse
nt of
copy
right
owne
r req
uired
for a
ny ot
her u
se.
EPA Export 25-07-2013:15:37:24
assess the level of combustion control and performance of this component of the RCTO.
Continuous Monitoring
Total Organic Carbon as Carbon (TOC as C) was measured in (9 the inlet from Fab 10 to the RCTO unit, (ii) the outlet of the RCTO concentrator exhaust (A56) and (iii) the RCTO oxidiser exhaust (A.57).
Monitoring of the three gas streams was carried out over the 24 hour test period to identify overall VOC removal efficiencies. The TOC as carbon was measured using a Signal 3000HM Total Hydrocarbon analyser. The results were recorded on the FMS (Facilities Mansystem.
On the RCTO oxidiser exhaust a Maihak S700 gas analyser system was used. The unit measures nitrogen oxides (as NO,), sulphur dioxide, carbon monoxide using infra red spectroscopy. Oxygen was measured using a paramagnetic analyser. This method is considered to be more accurate than the electromagnetic cell technologies over extended sampling periods. The temperature is measured using a temperature probe. The combustion gases results from the oxidiser unit were corrected for the following reference conditions; temperature 273K, pressure 101.3kPa, and 18% oxygen. Again the results were recorded on the FMS system.
The continuous analyser systems were calibrated before sampling using traceable gas standards.
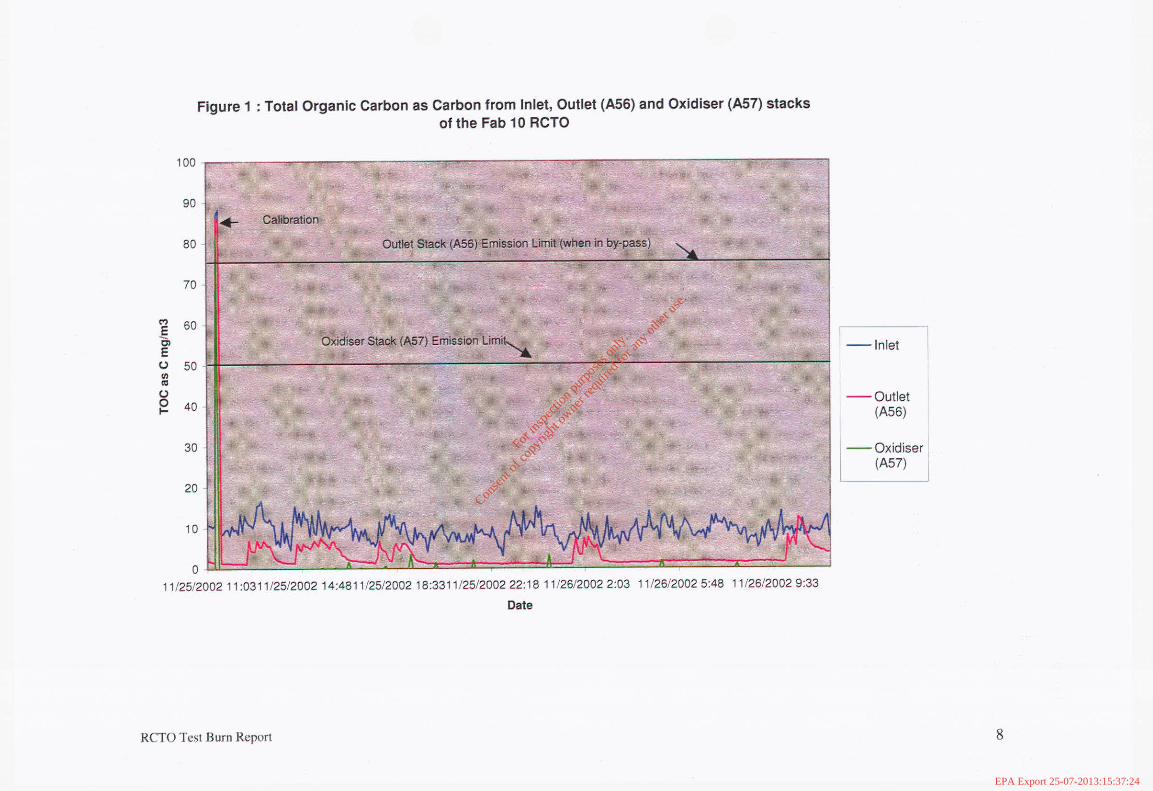
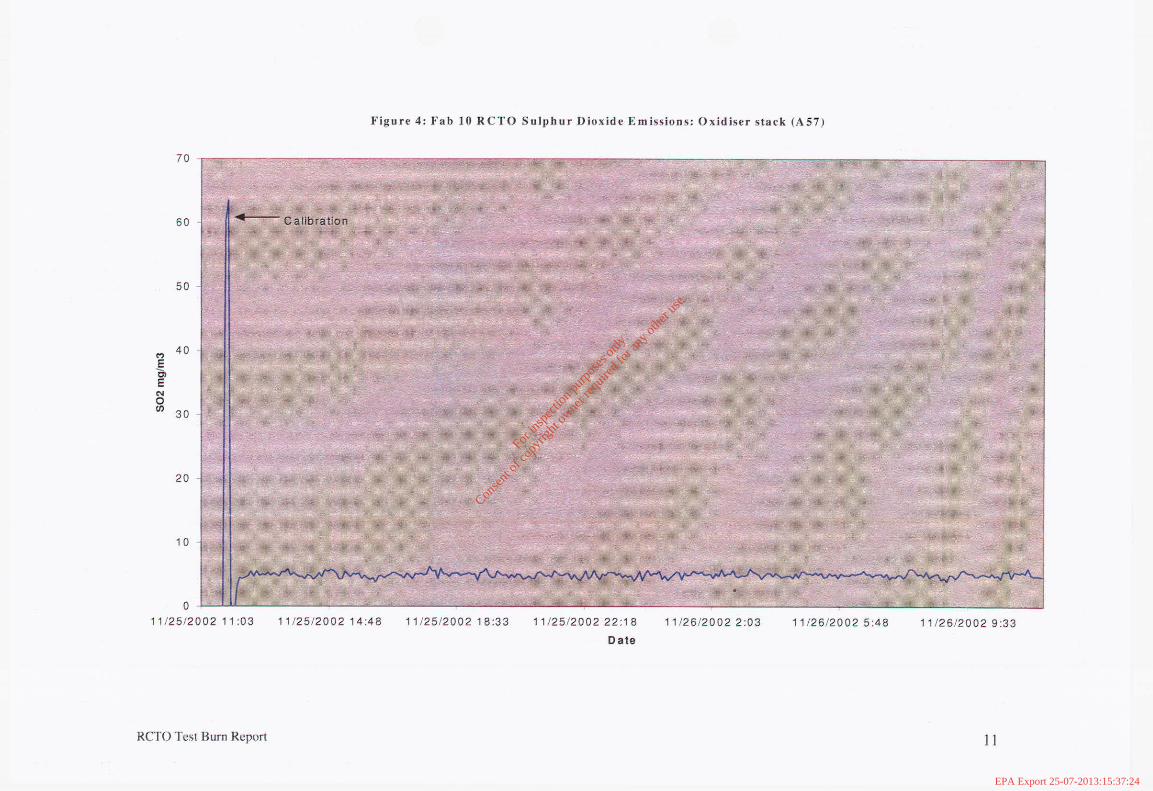
The monitoring results obtained by continuous analyser are illustrated in Figures 1 to 4. The results of the average, maximum and minimum concentrations (expressed as a 30-minute average) are summarised in Table 1.
Non-continuous Monitoring
Monitoring to identify the concentration of individual volatile organic compounds was also carried out. This allowed comparison with TA Luft Class I, II, and III emission limits specified in the IPCL. Sampling was carried out on the inlet to the RCTO, the RCTO concentrator exhaust and the RCTO oxidiser exhaust. Samples of air of known volume were extracted and passed through activated charcoal and silica gel adsorption tubes. The tubes were then analysed by Gas Chromatography-coupled-Mass Spectrometry (GCMS following laboratory solvent desorption. The calibrations for the named organic substance were performed using standards prepared from the authentic substances.
The samples were taken over four, separate half hour periods during the 24 hour survey when the RCTO was in sustained operation with samples on the inlet and outlet of the RCTO being carried out simultaneously. A 24-hour sample was also
2
For
insp
ectio
n pur
pose
s only
.
Conse
nt of
copy
right
owne
r req
uired
for a
ny ot
her u
se.
EPA Export 25-07-2013:15:37:24
taken from the inlet and outlet stacks using jumbo silica gel and activated charcoal tubes in series at a reduced sampling rate to prevent over saturation of the tubes.
The results of this analysis are summarised in Tables 2 to 4. The sampling report including analytical data is reproduced in Appendix 1 of this report.
WC Loadings
Fab 10 was operating at approximately 75% of available production capacity during the sampling period. Due to technology changeovers and preventative maintenance requirements, the Fab 10 production unit rarely operates at 100% capacity. The monitoring carried out during the test programme is considered to be representative of typical production.
For
insp
ectio
n pur
pose
s only
.
Conse
nt of
copy
right
owne
r req
uired
for a
ny ot
her u
se.
EPA Export 25-07-2013:15:37:24

Table 1: Fab 10 RCTO Results of the Continuous TOC Monitoring for 24 hour period (See Figure 1 for 24 hour trend)
Parameter
TOC as C Mean Max
Inlet to RCTO Concentration (mg/Nm3)
9.2 16.6
RCTO Outlet (A56) Concentration (mg/Nm3)
2.5
12.4
RCTO Oxidiser (A57)
Concentration (mg/Nm3) 0
3.3
Min 2.9 0.9 0
Note : VOC is concentrated up by the rotating wheels of the concentrator unit before being desorbed in a lower volume stream to the oxidiser unit. The measured concentrations in the outlets
of the inlet to the RCTO, and oxidiser outlet are therefore not directly comparable.
Table 2: Fab 10 RCTO Results of the 24 hour Non-Continuous Monitoring of Organics
Flow Rate, Nm3/hr
Inlet to RCTO
13545
RCTO Concentrator RCTO Oxidiser Outlet Outlet (A56) b457)
11923 1740
Parameter Concentration (mg/Nm3) Concentration (mg/Nm3) Concentration (mg/Nm3)
TA Luft Class I (Relative to Chloroform) co.02 co.02 co.04
TA Luft Class II (Relative to 0-xylene) 0.04 co.02 0.2
TA Luft Class III (Relative to IPA) 2.11 0.11 0.65
TOC as C (Relative to IPA) 1.47 0.07 1.42
Notes
(I) Whom sampling used jumbo silica gel and activated charcoal tubes in series (two sets of each). Results presented are the aggregate of all tubes in series. Analysis of the level of
breakthrough to the second set of tubes identifies sampling efficiencies of between 96% and 99%.
(2) VOC is concentrated up by the rotating wheels of the concentrator unit before being desorbed in a lower volume stream to the oxidiser unit. The measured concentrations in the inlet to the
RCTO and the outlet of the oxidiser are therefore not directly comparable.
(3) Minor variations in flow between component Rows and the aggregate volume flow may occur due to minor sampling errors. This error is less than I lo.
RCTO Test Burn Report 4
For
insp
ectio
n pur
pose
s only
.
Conse
nt of
copy
right
owne
r req
uired
for a
ny ot
her u
se.
EPA Export 25-07-2013:15:37:24
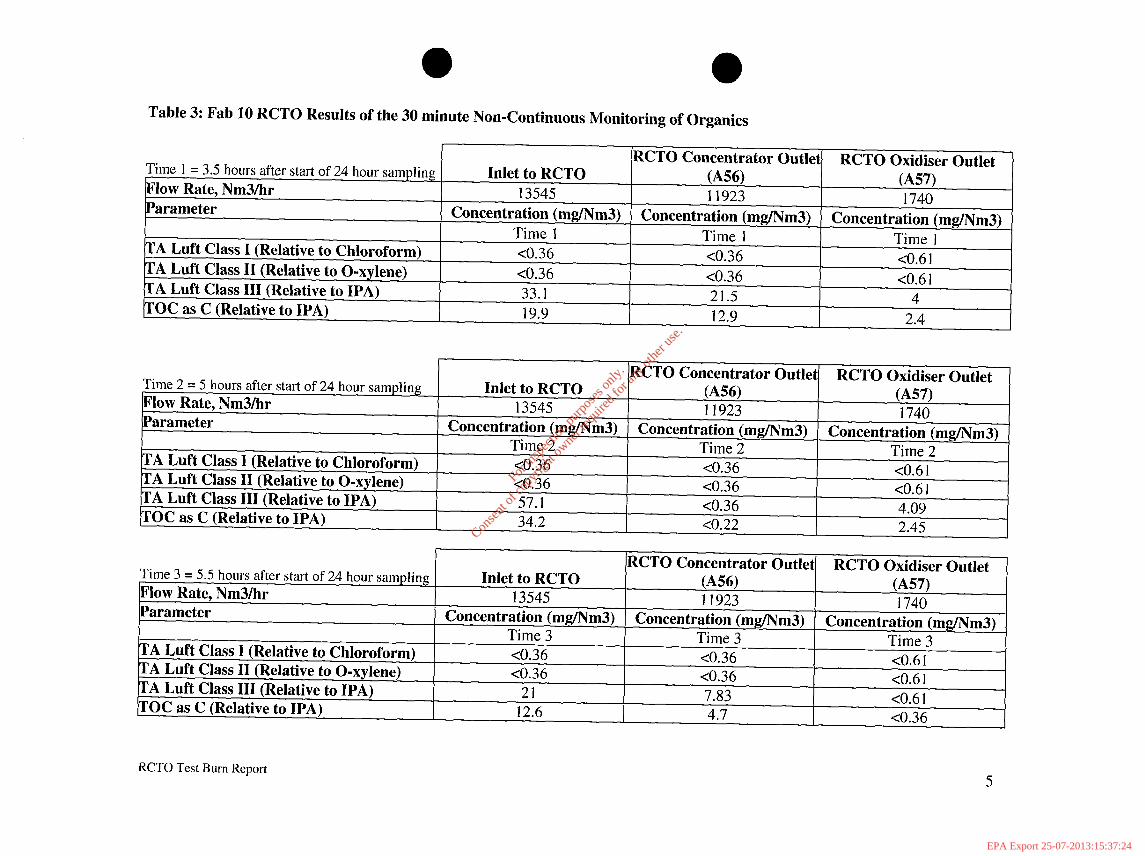
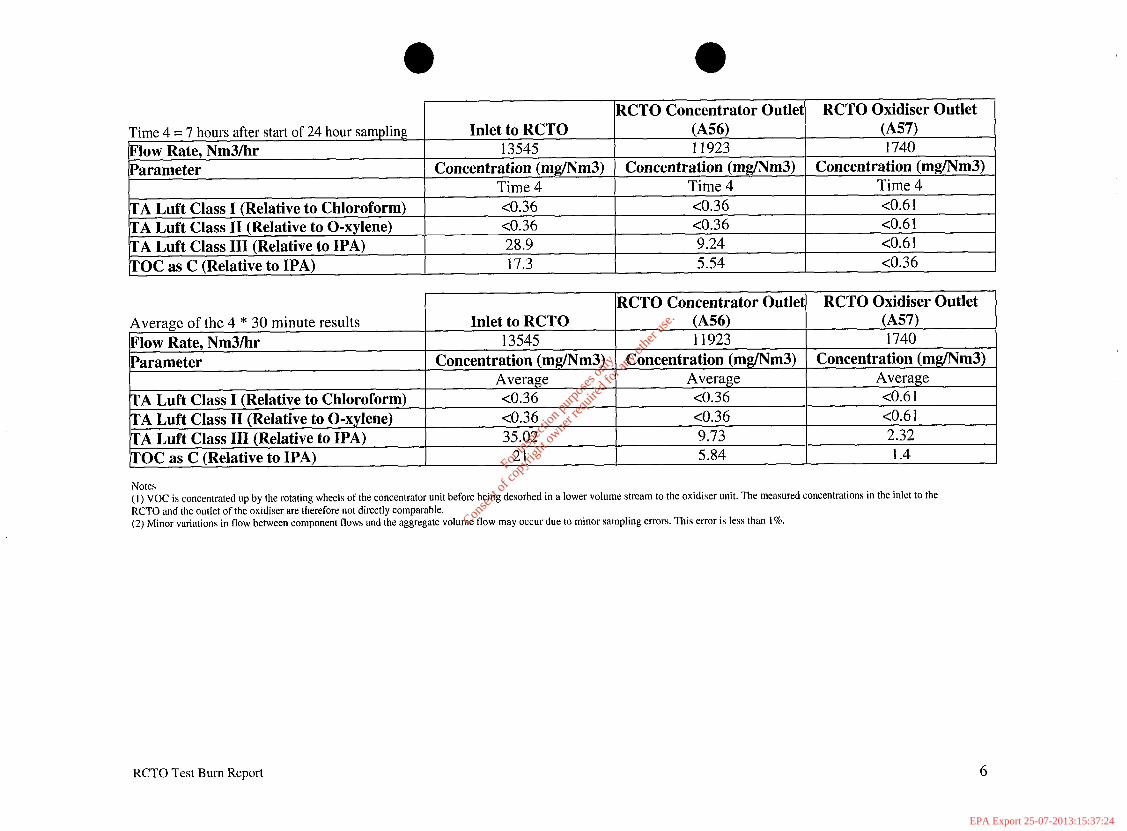
Table 3: Fab 10 RCTO Results of the 30 minute Non-Continuous Monitoring of Organics
Time 1 = 3.5 hours after start of 24 hour sampling RCTO Concentrator Outlet
Inlet to RCTO RCTO Oxidiser Outlet
Flow Rate, Nm3/hr ww (A571
13545 11923 Parameter
1740 Concentration (mg/Nm3) Concentration (mg/Nm3) Concentration (mg/Nm3)
Time I Time 1 TA Luft Class I (Relative to Chloroform)
Time 1 <0.36 <0.36
TA Luft Class II (Relative to 0-xylene) ~0.6 1
co.36 co.36 ~0.6 I
TOC C (Relative to IPA) 4
as 19.9 12.9 2.4
IRCTO Concentrator Outlet1 RCTO Oxidiser Outlet
IRCTO Concentrator Outlet1 RCTO Oxidiser Outlet (
RCTO Test Burn Report
For
insp
ectio
n pur
pose
s only
.
Conse
nt of
copy
right
owne
r req
uired
for a
ny ot
her u
se.
EPA Export 25-07-2013:15:37:24
(RCTO Concentrator Outlet\ RCTO Oxidiser Outlet [
)RCTO Concentrator Outlet\ RCTO Oxidiser Outlet 1 Average of the 4 * 30 minute results Inlet to RCTO 6456) W7) Flow Rate, Nm3/hr 13545 11923 1740 Parameter Concentration (mg/Nm3) Concentration (mg/Nm3) Concentration (mg/Nm3)
A Luft Class I (Relative to Chloroform) A Luft Class II (Relative to 0-xylene) A Luft Class III (Relative to IPA) OC as C (Relative to IPA)
Average <0.36 <0.36 35.02
21
Average <0.36 <0.36 9.73 5.84
Average co.6 1 <0.61 2.32 1.4
Notes
(I) VOC is concentrated up by the rotating wheels of the concentrator unit before being desorbed in a lower volume stream to the oxidiser unit. The measured concentrations in the inlet to the
RCTO and the outlet of the oxidiser are therefore not directly comparable.
(2) Minor variations in flow between component flows and the aggregate volume flow may occur due to minor sampling errors. This error is less than 1%.
RCTO Test Burn Report
For
insp
ectio
n pur
pose
s only
.
Conse
nt of
copy
right
owne
r req
uired
for a
ny ot
her u
se.
EPA Export 25-07-2013:15:37:24
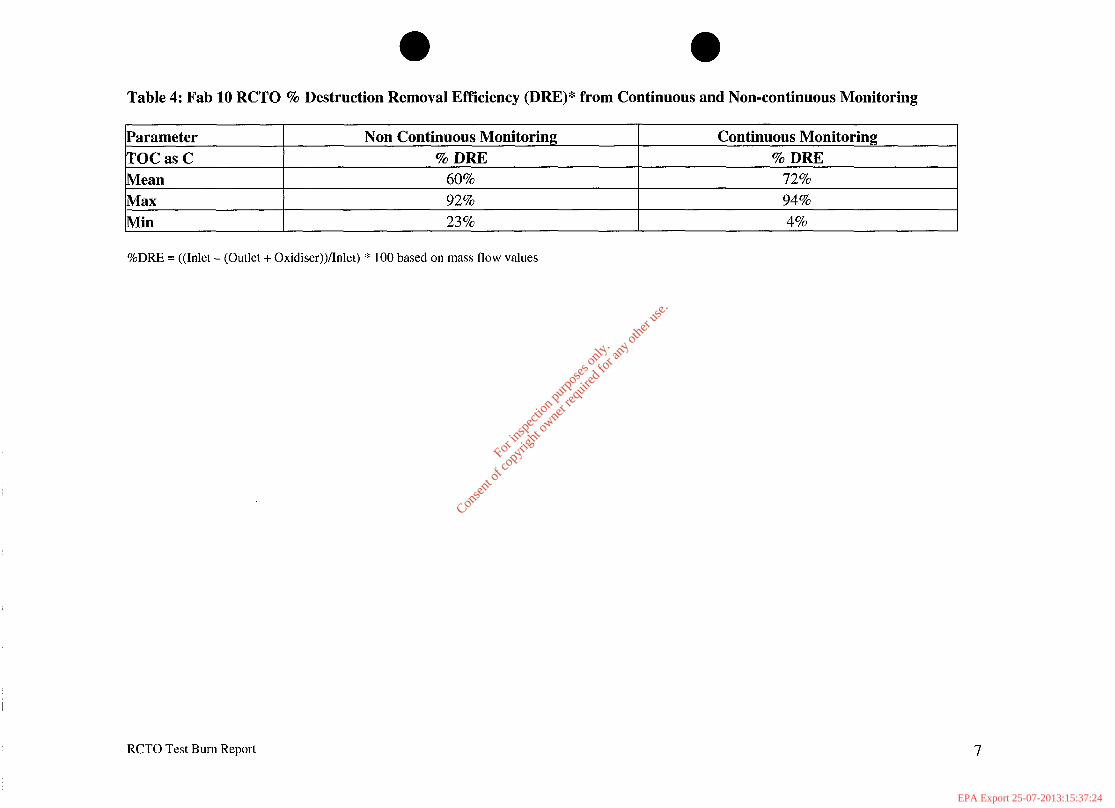
0 l Table 4: Fab 10 RCTO % Destruction Removal Efficiency (DRE)* from Continuous and Non-continuous Monitoring
Parameter Non Continuous Monitoring
TOC as C %DRE
Mean 60%
Max 92%
Min 23%
Continuous Monitoring % DRE
72% 94%
4%
%DRE = ((Inlet - (Outlet + Oxidiser))/Inlet) * 100 based on mass flow values
RCTO Test Burn Report 7
For
insp
ectio
n pur
pose
s only
.
Conse
nt of
copy
right
owne
r req
uired
for a
ny ot
her u
se.
EPA Export 25-07-2013:15:37:24
For
insp
ectio
n pur
pose
s only
.
Conse
nt of
copy
right
owne
r req
uired
for a
ny ot
her u
se.
EPA Export 25-07-2013:15:37:24
For
insp
ectio
n pur
pose
s only
.
Conse
nt of
copy
right
owne
r req
uired
for a
ny ot
her u
se.
EPA Export 25-07-2013:15:37:24

For
insp
ectio
n pur
pose
s only
.
Conse
nt of
copy
right
owne
r req
uired
for a
ny ot
her u
se.
EPA Export 25-07-2013:15:37:24
For
insp
ectio
n pur
pose
s only
.
Conse
nt of
copy
right
owne
r req
uired
for a
ny ot
her u
se.
EPA Export 25-07-2013:15:37:24

Success Criteria for Test Acceptance
The success criteria for the test acceptance were outlined in Table 5 of the commissioning test proposal. The monitoring results have been compared against these criteria in Table 5 of this report below:
Table 5: Emissions Performance Criteria as ner Schedule l(i) of II L
Measured by
Pitot tube and manometer
Sampling using charcoal and silica gel tubes and
analysis of the tubes using GC-MS
Sampling using charcoal and silica gel tubes and
analysis of the tubes using GC-MS
Sampling using charcoal and silica gel tubes and
analysis of the tubes using GC-MS
Pitot tube and manometer
Sampling using charcoal and silica gel tubes and
analysis of the tubes using GC-MS
Sampling using charcoal and silica gel tubes and
analysis of the tubes using GC-MS
IR Combustion gas analyser
IR Combustion gas analyser
\ I
Success Criteria
Parameter Result Emission Point
RCTO Concentrator
exhaust
(A56)
Criteria Mel Yes/No
Yes
(
13,545 Flow (Nm3/hr)
< 40,000 m3/hr
TA Luft Organics Class I
(wW-0 TA Luft Organics Class II
(mgmm3 TA Luft Organics Class III
hg~n-3 Flow
(Nm3/hr)
c 5 mg/m”
< 20 mg/mj
c 50 mg/mj Note 1
RCTO Oxidiser exhaust (A57)
: 2,000 m’/l-r
Total Organics
(as Cl (w/NW TA Luft Organics Class I
(wmm3) Carbon
Monoxide (mgmm3 Nitrogen
oxides (as NOa)
(mgmm3)
< 50 mg/mj
c 5 mg/m‘(
: 400 mg/m3
: 200 mg/m’
Note 1: Where orgamc substances of several classes are emitted simultaneous1 Y, in addition to the limits, the sum of the concentrations of Clwes I, II and III shall not exceed the CIas: $1 II limits.
Mean = co.36 Max = co.36 Min = co.36
Yes
Mean = co.36 Max = co.36 Min = x0.36
Yes
Mean = 9.73 Max = 21.5
Min = co.36
1,740
Yes
Yes r
Mean = 1.4 Max = 2.45 Min = co.36
Mean = co.36 Max = co.36 Min = co.36
Mean = 134.7 Max = 194.1 Min = 86.9 Mean = 5.9 Max = 12.4 Min = 3.7
ab love individual
Yes
Yes
Yes
Yes
RCTO Test Burn Report 12
For
insp
ectio
n pur
pose
s only
.
Conse
nt of
copy
right
owne
r req
uired
for a
ny ot
her u
se.
EPA Export 25-07-2013:15:37:24
Discussion of Monitoring Results
All emission components measured during the sampling period were identified to be well within IPCL limits and demonstrate the emission performance criteria for the Fab 10 RCTO have been met. Additionally no Class I or Class II VOC’s were identified to be above the limit of sampling detection in any of the samples taken.
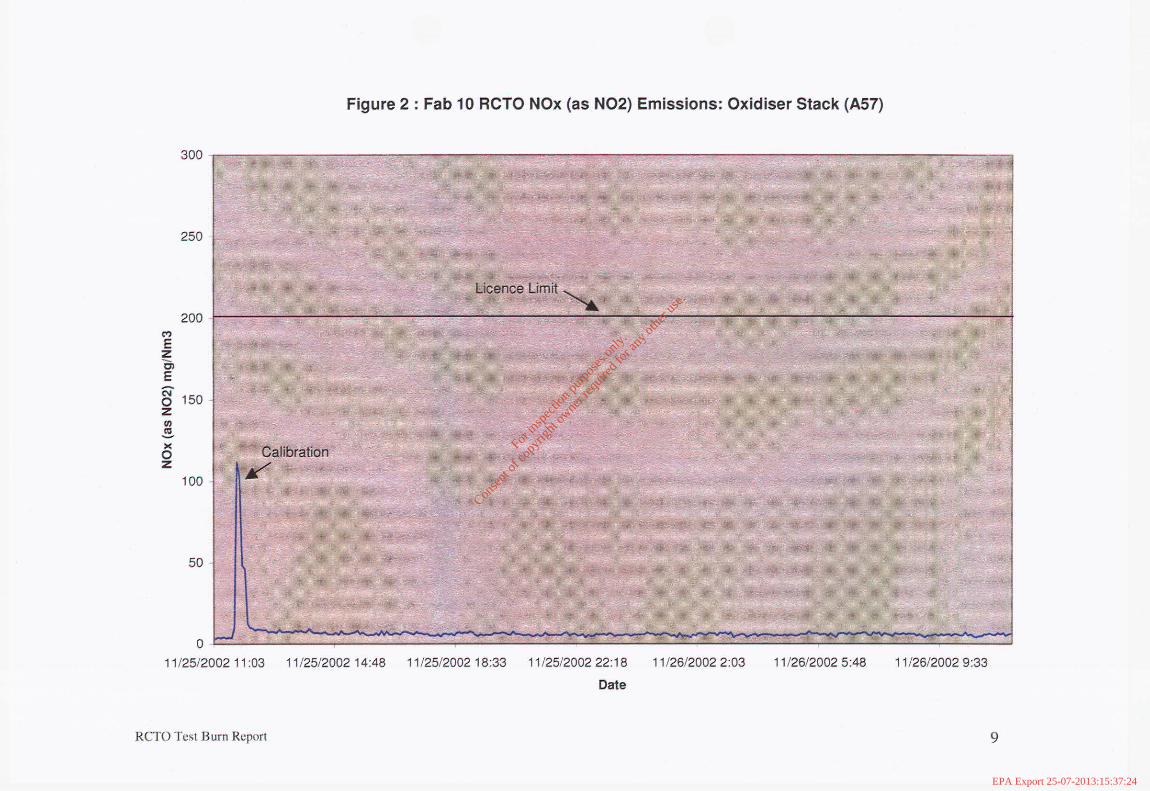
The oxidiser unit has operated with a high degree of removal efficiency and the performance of the ultra-low NOx burner has operated to design expectation with emissions of NOx (as N02) averaging less than 6 mg/Nm3 at the standard reference conditions. The oxygen concentration, temperature of the oxidiser chamber and carbon monoxide concentration over the test period and in the time the oxidiser has been very steady demonstrating that oxidiser is operating in a steady state. Work is continuing to improve the collection efficiency of the concentrator unit with typical capture rates of approximately 70%. This may be due in part to the relatively low levels of VOC on the inlet to the RCTO despite the relatively high level of production activity. The VOC inlet concentration is still lower than the IPCL limit for the exhaust outlets. This is of relevance to the contingency measures employed in the event of bypass described in the following section of this report.
RCTO Test Burn Report 13
For
insp
ectio
n pur
pose
s only
.
Conse
nt of
copy
right
owne
r req
uired
for a
ny ot
her u
se.
EPA Export 25-07-2013:15:37:24
Bypass Frequency and Contingency Measures in the event of a Bypass Condition.
Condition 2.6.6 of the IPCL requires “for each thermal oxidiser installed the test programme report shall include an estimate of the frequency of bypasses expected and where necessary a contingency plan to prevent an exceedance of emission limit values given in Schedule I(i) Emissions to Atmosphere of this licence.”
Frequency of bypass
Planned bypass
The unit is expected to be placed into by-pass mode on a quarterly basis for planned maintenance. Maintenance would be expected to take a minimum of 1 day per quarter and a maximum of 2-3 days for the annual service of the system Overall availability is expected to be around 97% to 98% taking into account planned maintenance activities.
Unplanned bvDass
As described in the proposal for the test programme, the control systems on the RCTO have both warning and fault monitoring. A fault is a condition that will automatically shut down the system while a warning is a message notifying the operator of a condition that could lead to a fault. In the event of a warning condition, the RCTO system will continue to operate and will not shut down. A warning message will be generated on the facilities management system. In the event of a fault condition, an immediate shut-down of the RCTO will be initiated and a 45 minute cool down sequence started. The RCTO system will then go into by-pass. A total of 23 faults exist on the system dealing with all aspect of the unit as outlined below including: l rotary drum control; l an adsorption system isolation damper and bypass l flow and pressure controls into oxidiser 0 oxidiser inlet and outlet temperature controls 0 combustion fan flow damper l power supply monitors l gas supply pressure gauges l flame detection and burner settings
RCTO Test Burn Report 14
For
insp
ectio
n pur
pose
s only
.
Conse
nt of
copy
right
owne
r req
uired
for a
ny ot
her u
se.
EPA Export 25-07-2013:15:37:25
On the generation of a fault, a message will appear on the FMS system and a technician would respond to the fault and initiate actions to start up the system again.
It is therefore not possible to predict the frequency of unplanned by-pass but it is not expected to be a frequent occurrence. This is demonstrated by the fact that the RCTO has been operational since the 18’ of October and has not experienced any by-pass incidents in this time period.
Contingency Plan to Prevent Exceedance
There will be no emissions from the oxidiser stack (A57) during a by-pass scenario as the RCTO will be off-line and the burner will not be in operation. Emissions from the concentrator exhaust stack need only be considered in the event of a bypass condition. In the event of a bypass, the VOC will not be treated and emissions will be equivalent to inlet concentrations.
It is not envisaged that there will be an exceedance of the values given in Schedule l(i) Emissions to Atmosphere. The limit for outlet (A56) is 75 mg/Nm3 TOC as C. The 30 minute average for the TOC as C on the inlet since the unit has been in operation is 6 mg/Nm3. The peak 30 minute average TOC as C over the same period is 14 mg/Nm3. During the sampling period, Fab 10 was operating at 75% of available production capacity. Even if production levels increased to lOO%, releases from Fab 10 will still be within the licence limits in the event of a bypass scenario.
Condition 3.1.1 (ii) additionally identifies 97% of all 30 minute mean values taken continuously over an annual period shall not exceed 1.2 times the emission limit value. This allows 3% of all the 30 minute mean values over an annual period to be as high as 90 mg/Nm3. Condition 3.1.1. (iv) also identifies that the peak 30 minute value shall not exceed twice the IPCL limit (equivalent to 150mg/Nm3). Given the relatively low peak levels of VOC on the inlet of the RCTO unit measured during a representative period, emission levels would still be expected to comply with these conditions in the event of a bypass.
In the unlikely event of a by-pass scenario and the emissions on the outlet (A56) being at 75% of the licence limit (56mg/Nm3) Intel will identify the high loaded solvent tools in the Fab. In the event that 90% of the emission limit (67 mg/Nm3) is exceeded, Intel will reduce production levels on these tools to ensure compliance.
RCTO Test Burn Report 15
For
insp
ectio
n pur
pose
s only
.
Conse
nt of
copy
right
owne
r req
uired
for a
ny ot
her u
se.
EPA Export 25-07-2013:15:37:25
For
insp
ectio
n pur
pose
s only
.
Conse
nt of
copy
right
owne
r req
uired
for a
ny ot
her u
se.
EPA Export 25-07-2013:15:37:25
For
insp
ectio
n pur
pose
s only
.
Conse
nt of
copy
right
owne
r req
uired
for a
ny ot
her u
se.
EPA Export 25-07-2013:15:37:25
For
insp
ectio
n pur
pose
s only
.
Conse
nt of
copy
right
owne
r req
uired
for a
ny ot
her u
se.
EPA Export 25-07-2013:15:37:25
For
insp
ectio
n pur
pose
s only
.
Conse
nt of
copy
right
owne
r req
uired
for a
ny ot
her u
se.
EPA Export 25-07-2013:15:37:25

For
insp
ectio
n pur
pose
s only
.
Conse
nt of
copy
right
owne
r req
uired
for a
ny ot
her u
se.
EPA Export 25-07-2013:15:37:25
For
insp
ectio
n pur
pose
s only
.
Conse
nt of
copy
right
owne
r req
uired
for a
ny ot
her u
se.
EPA Export 25-07-2013:15:37:25