Embed Size (px)
Citation preview
IMPORTANT This report was updated on 10192016 and since
then the report may have changed Updates are available to
subscribers - Stock Traders Daily
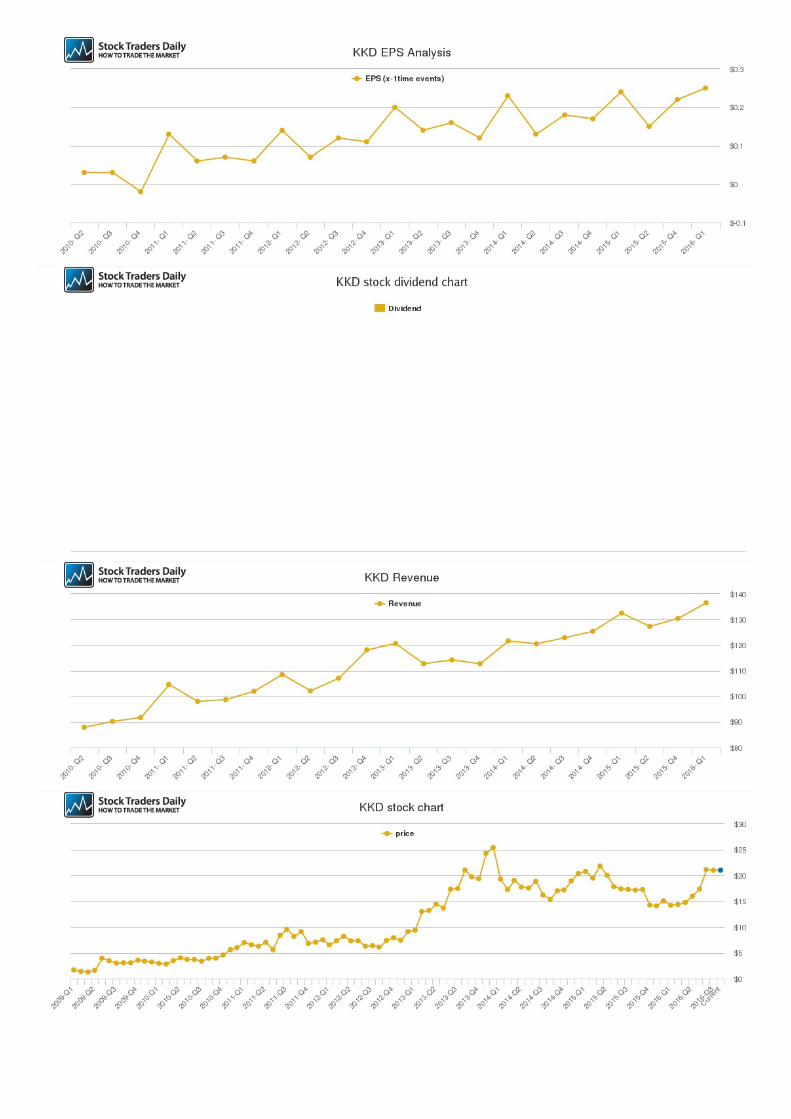
1 At the bottom of this PDF you will find fundamental charts
2 Fundamental charts exist for stocks not ETFs or ETNs
3 The focus of our fundamental observations is EPS growth
4 We track EPS on a trailing 12 month basis every quarter
5 We compare QQ and YY to determine EPS growth
6 We chart PE over time to identify ebbs and flows
7 And conclude with a PEG ratio evaluation of relative value
1 We cover 5000 stocks fundamentally but only 1300
technically
2 If you would like us to cover your stock technically please
register
3 If we cover your stock now the technicals will tell you
where to buy and sell
4 We recommend that investors start with the long term
trading plans
5 Technicals change as prices change so updates are
available on Stock Traders Daily
1 We also offer an automated Trading Tool
2 It does almost all of the work for you
3 It is free to all of our subscribers on Stock Traders Daily
If you join us for a free trial we will personally help you with KKD
and answer all of your questions about the economy stock
market and your investments
Investment Advicefor KKD
Fundamental Analysis
Technical Analysis
Trend Tracker
Special Offer
Our Stock of the WeekStrategy was beating the
market by 225 as of Sep
2014 That is because it has
integrated risk controls We will
show you how it is done
Stock Traders Daily also has the
most accurate leading longer
term Stock Market and
Economic Indicator ever
developed It is called The
Investment Rate and it is
available for our clients
Stock of the Week27953 as of Oct 2016shy
by Thomas H Kee
Jr
You can purchase
this book at the
following online
stores
Buy amp Holdis Dead
Amazoncom
Borders
Barnes amp Noble
If you like this report please share it
Like us on Facebook
Follow us on Twitter
Join us on LinkedIn
If you like this report please share it
Additional ServicesWe Will Teach You How to TradeWe Will Teach You How to Trade
How to Trade Stocks amp MarketsHow to Trade Stocks amp Markets
Understand TrendsUnderstand Trends
Make MoneyMake Money
Sign Up NowIco Std
Market Analysis Technical
DOW SampP
NASDAQ RUSSELL
Our Proprietary macroeconomicanalysis has identified everymajor economic and market cyclein US History in advance Seewhat is says about todaysenvironment MORE
The Investment Rate
Stock Finder
Find a Stock to Buy or Short
Stock Report
Enter Symbol Go
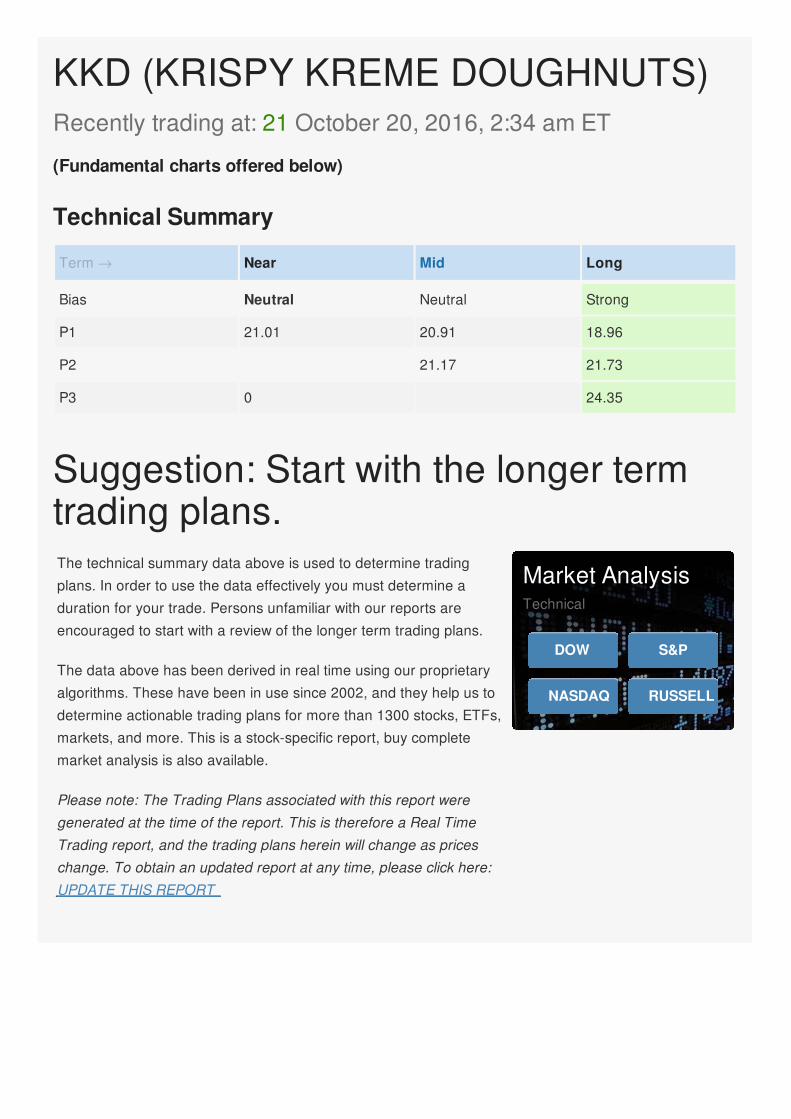
KKD (KRISPY KREME DOUGHNUTS)Recently trading at 21 October 20 2016 234 am ET
(Fundamental charts offered below)
Term reg Near Mid Long
Bias Neutral Neutral Strong
P1 2101 2091 1896
P2 2117 2173
P3 0 2435
Technical Summary
The technical summary data above is used to determine trading
plans In order to use the data effectively you must determine a
duration for your trade Persons unfamiliar with our reports are
encouraged to start with a review of the longer term trading plans
The data above has been derived in real time using our proprietary
algorithms These have been in use since 2002 and they help us to
determine actionable trading plans for more than 1300 stocks ETFs
markets and more This is a stock-specific report buy complete
market analysis is also available
Please note The Trading Plans associated with this report weregenerated at the time of the report This is therefore a Real TimeTrading report and the trading plans herein will change as priceschange To obtain an updated report at any time please click hereUPDATE THIS REPORT
Suggestion Start with the longer termtrading plans
Market AnalysisTechnical
DOW SampP
NASDAQ RUSSELL
The technical Summary and associated Trading Plans for KKD listed below will help you make important
timing decisions for your trades This data is based on our proprietary analysis for KKD In addition we
offer Market Timing Models and Stock Filters in the links above which may increase the proficiency of the
decisions you make
Buy over 1896 target 2173 stop loss 187
Buy over 1896 target 2173 stop loss 187
The technical summary data tells us to buy
KKD near 1896 with an upside target of
2173 This data also tells us to set a stop loss
187 to protect against excessive loss in
case the stock begins to move against the
trade 1896 is the first level of support below
Short under 2173 target 1896 stop loss
2199
Short under 2173 target 1896 stop loss
2199
The technical summary data is suggesting a
short of KKD as it gets near 2173 with a
downside target of 1896 We should have a
stop loss in place at 2199 though 2173 is the
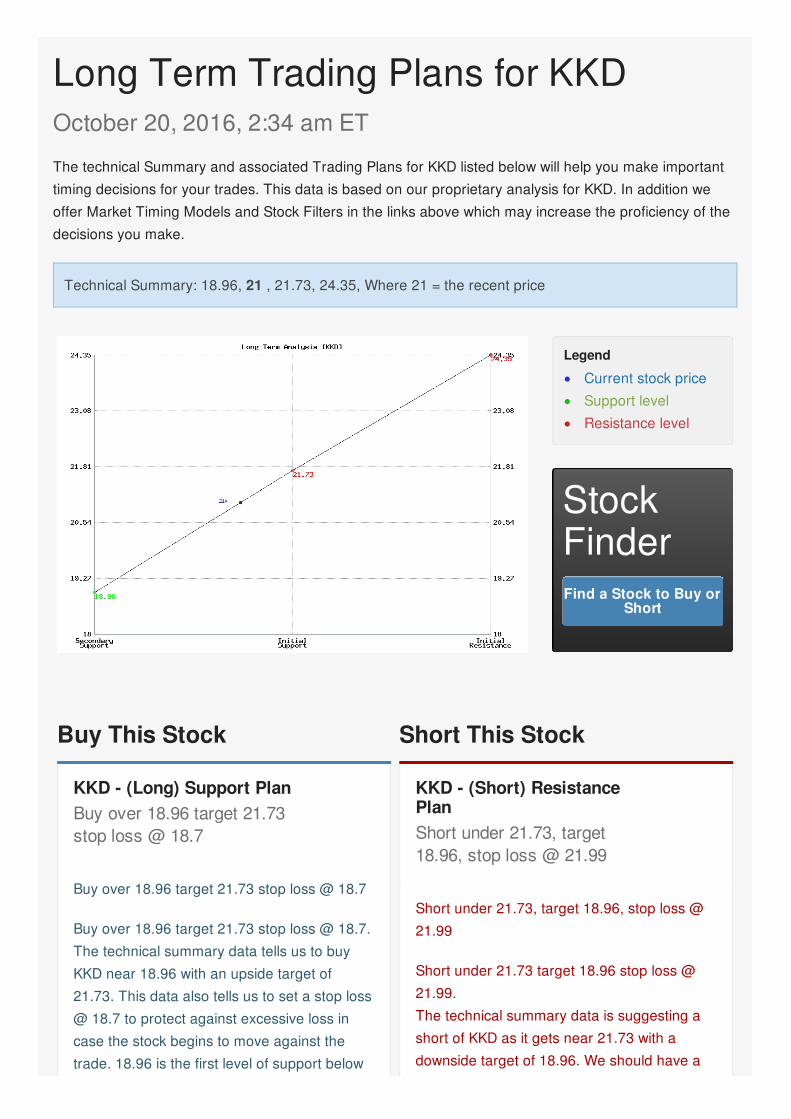
Long Term Trading Plans for KKDOctober 20 2016 234 am ET
Technical Summary 1896 21 2173 2435 Where 21 = the recent price
Legend
Current stock pricebullSupport levelbullResistance levelbull
StockFinderFind a Stock to Buy or
Short
Buy This Stock
KKD - (Long) Support PlanBuy over 1896 target 2173stop loss 187
Short This Stock
KKD - (Short) ResistancePlanShort under 2173 target1896 stop loss 2199
21 and by rule any test of support is a buy
signal In this case support 1896 would be
being tested so a buy signal would exist
Buy over 2173 target 2435 stop loss
2147
Buy over 2173 target 2435 stop loss
2147
If 2173 begins to break higher the technical
summary data will suggest a buy of KKD over
2173 with an upside target of 2435 The
data also tells us to set a stop loss 2147 in
case the stock turns against the trade 2173
is the first level of resistance above 21 and by
rule any break above resistance is a buy
signal In this case resistance 1896 would be
breaking higher so a buy signal would
existpgt
stop loss in place at 2199 though 2173 is the
first level of resistance above 21 and by rule
any test of resistance is a short signal In this
case if resistance 2173 is being tested so a
short signal would exist
Short under 1896 target na stop loss
1922
Short under 1896 target na stop loss
1922
The technical summary data is suggesting a
short of KKD if it breaks below 1896 But
there is no current downside target from the
summary table This tells us that we should
hold this position until either a revised target is
generated which usually occurs at the open of
the next session or until this position has
been stopped We should have a stop loss in
place at 1922 according to the data 1896 is
the first level of support below 21 and by rule
any break below support is a short signal In
this case if support 1896 is breaking lower a
short signal would exist
Please Note The Trading Plans listed above are based on real time stock prices They are dynamic and
they change as the market changes so they are only valid at or near the time you request them Pleaserefresh your request if you delay your decisions
KKD - (Long) ResistancePlanBuy over 2173 target 2435stop loss 2147
KKD - (Short) Support PlanShort under 1896 target nastop loss 1922
The technical Summary and associated Trading Plans for KKD listed below will help you make important
timing decisions for your trades This data is based on our proprietary analysis for KKD In addition we
offer Market Timing Models and Stock Filters in the links above which may increase the proficiency of the
decisions you make
Buy over 2117 target 2173 Stop Loss
2091
Buy over 2117 target 2173 Stop Loss
2091If 2117 begins to break higher the
technical summary data tells us to buy KKD
just over 2117 with an upside target of 2173
The data also tells us to set a stop loss
Short near 2117 target 2091 Stop Loss
2143
Short near 2117 target 2091 Stop Loss
2143The technical summary data is
suggesting a short of KKD if it tests 2117 with
a downside target of 2091 We should have a
stop loss in place at 2143 though in case the
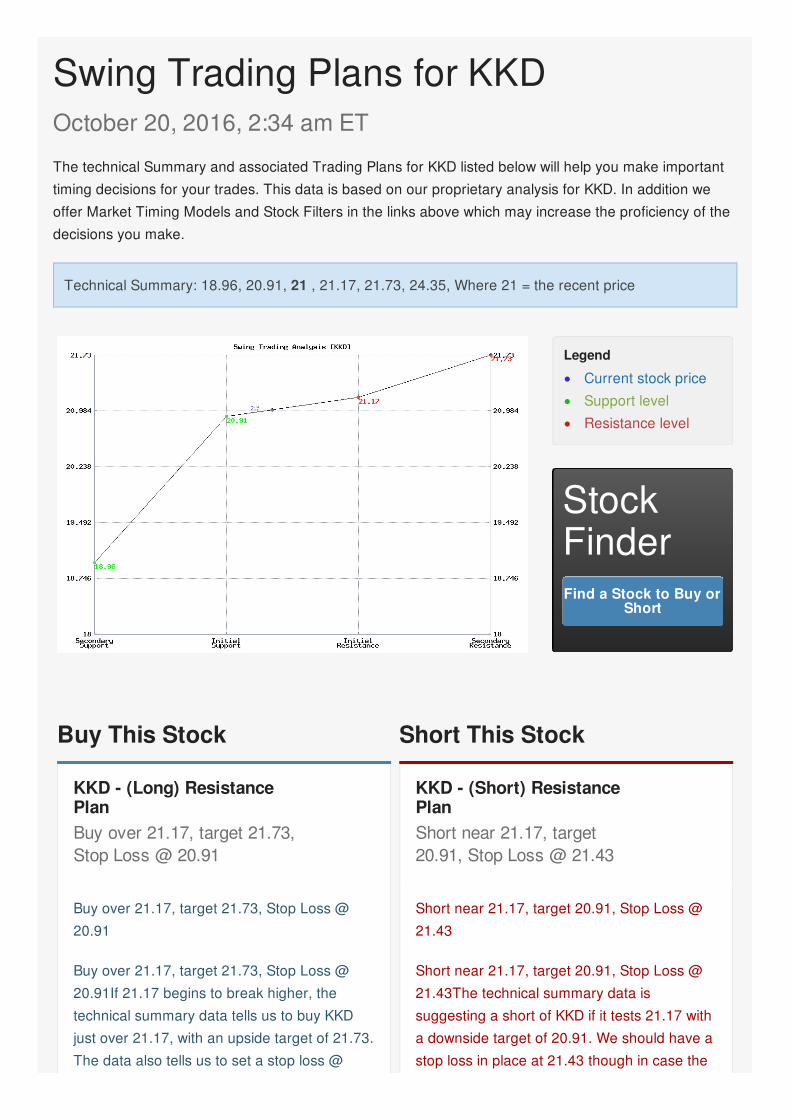
Swing Trading Plans for KKDOctober 20 2016 234 am ET
Technical Summary 1896 2091 21 2117 2173 2435 Where 21 = the recent price
Legend
Current stock pricebullSupport levelbullResistance levelbull
StockFinderFind a Stock to Buy or
Short
Buy This Stock
KKD - (Long) ResistancePlanBuy over 2117 target 2173Stop Loss 2091
Short This Stock
KKD - (Short) ResistancePlanShort near 2117 target2091 Stop Loss 2143
2091 in case the stock turns against the
trade 2117 is the first level of resistance
above 21 and by rule any break above
resistance is a buy signal In this case 2117
initial resistance would be breaking higher so
a buy signal would exist Because this plan is
based on a break of resistance it is referred
to as a Long Resistance Plan
Buy near 2091 target 2117 Stop Loss
2065
Buy near 2091 target 2117 Stop Loss
2065The technical summary data tells us to
buy KKD near 2091 with an upside target of
2117 This data also tells us to set a stop loss
2065 to protect against excessive loss in
case the stock begins to move against the
trade 2091 is the first level of support below
21 and by rule any test of support is a buy
signal In this case 2091 initial support
would be tested so a buy signal would exist
Because this plan is based on a test of
support it is referred to as a Long Support
Plan
stock begins to move against the trade By
rule any test of resistance is a short signal In
this case if resistance 2117 is being tested
a short signal would exist Because this plan is
a short plan based on a test of resistance it is
referred to as a Short Resistance Plan
Short under 2091 target 1896 Stop Loss
2117
Buy near 2091 target 2117 Stop Loss
2065The technical summary data tells us to
buy KKD near 2091 with an upside target of
2117 This data also tells us to set a stop loss
2065 to protect against excessive loss in
case the stock begins to move against the
trade 2091 is the first level of support below
21 and by rule any test of support is a buy
signal In this case 2091 initial support
would be tested so a buy signal would exist
Because this plan is based on a test of
support it is referred to as a Long Support
Plan
Please Note The Trading Plans listed above are based on real time stock prices They are dynamic and
they change as the market changes so they are only valid at or near the time you request them Pleaserefresh your request if you delay your decisions
KKD - (Long) Support PlanBuy near 2091 target 2117Stop Loss 2065
KKD - (Short) Support PlanShort under 2091 target1896 Stop Loss 2117
The technical Summary and associated Trading Plans for KKD listed below will help you make important
timing decisions for your trades This data is based on our proprietary analysis for KKD In addition we
offer Market Timing Models and Stock Filters in the links above which may increase the proficiency of the
decisions you make
Buy over 2117 target 2173 Stop Loss
2096
Buy over 2117 target 2173 Stop Loss
2096If 2117 begins to break higher the
technical summary data tells us to buy KKD
just over 2117 with an upside target of 2173
The data also tells us to set a stop loss
Short near 2117 target 1896 Stop Loss
2138
Short near 2117 target 1896 Stop Loss
2138The technical summary data is
suggesting a short of KKD if it tests 2117 with
a downside target of 1896 We should have a
stop loss in place at 2138 though in case the
Day Trading Plans for KKDOctober 20 2016 234 am ET
Technical Summary 1896 21 2117 2173 2435 Where 21 = the recent price
Legend
Current stock pricebullSupport levelbullResistance levelbull
StockFinderFind a Stock to Buy or
Short
Buy This Stock
KKD - (Long) ResistancePlanBuy over 2117 target 2173Stop Loss 2096
Short This Stock
KKD - (Short) ResistancePlanShort near 2117 target1896 Stop Loss 2138
2096 in case the stock turns against the
trade 2117 is the first level of resistance
above 21 and by rule any break above
resistance is a buy signal In this case 2117
initial resistance would be breaking higher so
a buy signal would exist Because this plan is
based on a break of resistance it is referred
to as a Long Resistance Plan
Buy near 1896 target 2117 Stop Loss
1875
Buy near 1896 target 2117 Stop Loss
1875The technical summary data tells us to
buy KKD near 1896 with an upside target of
2117 This data also tells us to set a stop loss
1875 to protect against excessive loss in
case the stock begins to move against the
trade 1896 is the first level of support below
21 and by rule any test of support is a buy
signal In this case 1896 initial support
would be tested so a buy signal would exist
Because this plan is based on a test of
support it is referred to as a Long Support
Plan
stock begins to move against the trade By
rule any test of resistance is a short signal In
this case if resistance 2117 is being tested
a short signal would exist Because this plan is
a short plan based on a test of resistance it is
referred to as a Short Resistance Plan
Short under 1896 target na Stop Loss
1917
Buy near 1896 target 2117 Stop Loss
1875The technical summary data tells us to
buy KKD near 1896 with an upside target of
2117 This data also tells us to set a stop loss
1875 to protect against excessive loss in
case the stock begins to move against the
trade 1896 is the first level of support below
21 and by rule any test of support is a buy
signal In this case 1896 initial support
would be tested so a buy signal would exist
Because this plan is based on a test of
support it is referred to as a Long Support
Plan
Please Note The Trading Plans listed above are based on real time stock prices They are dynamic and
they change as the market changes so they are only valid at or near the time you request them Pleaserefresh your request if you delay your decisions
KKD - (Long) Support PlanBuy near 1896 target 2117Stop Loss 1875
KKD - (Short) Support PlanShort under 1896 target naStop Loss 1917

Like us on Facebook
Follow us on Twitter
Join us on LinkedIn
If you like this report please share it
Additional ServicesWe Will Teach You How to TradeWe Will Teach You How to Trade
How to Trade Stocks amp MarketsHow to Trade Stocks amp Markets
Understand TrendsUnderstand Trends
Make MoneyMake Money
Sign Up NowIco Std
Market Analysis Technical
DOW SampP
NASDAQ RUSSELL
Our Proprietary macroeconomicanalysis has identified everymajor economic and market cyclein US History in advance Seewhat is says about todaysenvironment MORE
The Investment Rate
Stock Finder
Find a Stock to Buy or Short
Stock Report
Enter Symbol Go
KKD (KRISPY KREME DOUGHNUTS)Recently trading at 21 October 20 2016 234 am ET
(Fundamental charts offered below)
Term reg Near Mid Long
Bias Neutral Neutral Strong
P1 2101 2091 1896
P2 2117 2173
P3 0 2435
Technical Summary
The technical summary data above is used to determine trading
plans In order to use the data effectively you must determine a
duration for your trade Persons unfamiliar with our reports are
encouraged to start with a review of the longer term trading plans
The data above has been derived in real time using our proprietary
algorithms These have been in use since 2002 and they help us to
determine actionable trading plans for more than 1300 stocks ETFs
markets and more This is a stock-specific report buy complete
market analysis is also available
Please note The Trading Plans associated with this report weregenerated at the time of the report This is therefore a Real TimeTrading report and the trading plans herein will change as priceschange To obtain an updated report at any time please click hereUPDATE THIS REPORT
Suggestion Start with the longer termtrading plans
Market AnalysisTechnical
DOW SampP
NASDAQ RUSSELL
The technical Summary and associated Trading Plans for KKD listed below will help you make important
timing decisions for your trades This data is based on our proprietary analysis for KKD In addition we
offer Market Timing Models and Stock Filters in the links above which may increase the proficiency of the
decisions you make
Buy over 1896 target 2173 stop loss 187
Buy over 1896 target 2173 stop loss 187
The technical summary data tells us to buy
KKD near 1896 with an upside target of
2173 This data also tells us to set a stop loss
187 to protect against excessive loss in
case the stock begins to move against the
trade 1896 is the first level of support below
Short under 2173 target 1896 stop loss
2199
Short under 2173 target 1896 stop loss
2199
The technical summary data is suggesting a
short of KKD as it gets near 2173 with a
downside target of 1896 We should have a
stop loss in place at 2199 though 2173 is the
Long Term Trading Plans for KKDOctober 20 2016 234 am ET
Technical Summary 1896 21 2173 2435 Where 21 = the recent price
Legend
Current stock pricebullSupport levelbullResistance levelbull
StockFinderFind a Stock to Buy or
Short
Buy This Stock
KKD - (Long) Support PlanBuy over 1896 target 2173stop loss 187
Short This Stock
KKD - (Short) ResistancePlanShort under 2173 target1896 stop loss 2199
21 and by rule any test of support is a buy
signal In this case support 1896 would be
being tested so a buy signal would exist
Buy over 2173 target 2435 stop loss
2147
Buy over 2173 target 2435 stop loss
2147
If 2173 begins to break higher the technical
summary data will suggest a buy of KKD over
2173 with an upside target of 2435 The
data also tells us to set a stop loss 2147 in
case the stock turns against the trade 2173
is the first level of resistance above 21 and by
rule any break above resistance is a buy
signal In this case resistance 1896 would be
breaking higher so a buy signal would
existpgt
stop loss in place at 2199 though 2173 is the
first level of resistance above 21 and by rule
any test of resistance is a short signal In this
case if resistance 2173 is being tested so a
short signal would exist
Short under 1896 target na stop loss
1922
Short under 1896 target na stop loss
1922
The technical summary data is suggesting a
short of KKD if it breaks below 1896 But
there is no current downside target from the
summary table This tells us that we should
hold this position until either a revised target is
generated which usually occurs at the open of
the next session or until this position has
been stopped We should have a stop loss in
place at 1922 according to the data 1896 is
the first level of support below 21 and by rule
any break below support is a short signal In
this case if support 1896 is breaking lower a
short signal would exist
Please Note The Trading Plans listed above are based on real time stock prices They are dynamic and
they change as the market changes so they are only valid at or near the time you request them Pleaserefresh your request if you delay your decisions
KKD - (Long) ResistancePlanBuy over 2173 target 2435stop loss 2147
KKD - (Short) Support PlanShort under 1896 target nastop loss 1922
The technical Summary and associated Trading Plans for KKD listed below will help you make important
timing decisions for your trades This data is based on our proprietary analysis for KKD In addition we
offer Market Timing Models and Stock Filters in the links above which may increase the proficiency of the
decisions you make
Buy over 2117 target 2173 Stop Loss
2091
Buy over 2117 target 2173 Stop Loss
2091If 2117 begins to break higher the
technical summary data tells us to buy KKD
just over 2117 with an upside target of 2173
The data also tells us to set a stop loss
Short near 2117 target 2091 Stop Loss
2143
Short near 2117 target 2091 Stop Loss
2143The technical summary data is
suggesting a short of KKD if it tests 2117 with
a downside target of 2091 We should have a
stop loss in place at 2143 though in case the
Swing Trading Plans for KKDOctober 20 2016 234 am ET
Technical Summary 1896 2091 21 2117 2173 2435 Where 21 = the recent price
Legend
Current stock pricebullSupport levelbullResistance levelbull
StockFinderFind a Stock to Buy or
Short
Buy This Stock
KKD - (Long) ResistancePlanBuy over 2117 target 2173Stop Loss 2091
Short This Stock
KKD - (Short) ResistancePlanShort near 2117 target2091 Stop Loss 2143
2091 in case the stock turns against the
trade 2117 is the first level of resistance
above 21 and by rule any break above
resistance is a buy signal In this case 2117
initial resistance would be breaking higher so
a buy signal would exist Because this plan is
based on a break of resistance it is referred
to as a Long Resistance Plan
Buy near 2091 target 2117 Stop Loss
2065
Buy near 2091 target 2117 Stop Loss
2065The technical summary data tells us to
buy KKD near 2091 with an upside target of
2117 This data also tells us to set a stop loss
2065 to protect against excessive loss in
case the stock begins to move against the
trade 2091 is the first level of support below
21 and by rule any test of support is a buy
signal In this case 2091 initial support
would be tested so a buy signal would exist
Because this plan is based on a test of
support it is referred to as a Long Support
Plan
stock begins to move against the trade By
rule any test of resistance is a short signal In
this case if resistance 2117 is being tested
a short signal would exist Because this plan is
a short plan based on a test of resistance it is
referred to as a Short Resistance Plan
Short under 2091 target 1896 Stop Loss
2117
Buy near 2091 target 2117 Stop Loss
2065The technical summary data tells us to
buy KKD near 2091 with an upside target of
2117 This data also tells us to set a stop loss
2065 to protect against excessive loss in
case the stock begins to move against the
trade 2091 is the first level of support below
21 and by rule any test of support is a buy
signal In this case 2091 initial support
would be tested so a buy signal would exist
Because this plan is based on a test of
support it is referred to as a Long Support
Plan
Please Note The Trading Plans listed above are based on real time stock prices They are dynamic and
they change as the market changes so they are only valid at or near the time you request them Pleaserefresh your request if you delay your decisions
KKD - (Long) Support PlanBuy near 2091 target 2117Stop Loss 2065
KKD - (Short) Support PlanShort under 2091 target1896 Stop Loss 2117
The technical Summary and associated Trading Plans for KKD listed below will help you make important
timing decisions for your trades This data is based on our proprietary analysis for KKD In addition we
offer Market Timing Models and Stock Filters in the links above which may increase the proficiency of the
decisions you make
Buy over 2117 target 2173 Stop Loss
2096
Buy over 2117 target 2173 Stop Loss
2096If 2117 begins to break higher the
technical summary data tells us to buy KKD
just over 2117 with an upside target of 2173
The data also tells us to set a stop loss
Short near 2117 target 1896 Stop Loss
2138
Short near 2117 target 1896 Stop Loss
2138The technical summary data is
suggesting a short of KKD if it tests 2117 with
a downside target of 1896 We should have a
stop loss in place at 2138 though in case the
Day Trading Plans for KKDOctober 20 2016 234 am ET
Technical Summary 1896 21 2117 2173 2435 Where 21 = the recent price
Legend
Current stock pricebullSupport levelbullResistance levelbull
StockFinderFind a Stock to Buy or
Short
Buy This Stock
KKD - (Long) ResistancePlanBuy over 2117 target 2173Stop Loss 2096
Short This Stock
KKD - (Short) ResistancePlanShort near 2117 target1896 Stop Loss 2138
2096 in case the stock turns against the
trade 2117 is the first level of resistance
above 21 and by rule any break above
resistance is a buy signal In this case 2117
initial resistance would be breaking higher so
a buy signal would exist Because this plan is
based on a break of resistance it is referred
to as a Long Resistance Plan
Buy near 1896 target 2117 Stop Loss
1875
Buy near 1896 target 2117 Stop Loss
1875The technical summary data tells us to
buy KKD near 1896 with an upside target of
2117 This data also tells us to set a stop loss
1875 to protect against excessive loss in
case the stock begins to move against the
trade 1896 is the first level of support below
21 and by rule any test of support is a buy
signal In this case 1896 initial support
would be tested so a buy signal would exist
Because this plan is based on a test of
support it is referred to as a Long Support
Plan
stock begins to move against the trade By
rule any test of resistance is a short signal In
this case if resistance 2117 is being tested
a short signal would exist Because this plan is
a short plan based on a test of resistance it is
referred to as a Short Resistance Plan
Short under 1896 target na Stop Loss
1917
Buy near 1896 target 2117 Stop Loss
1875The technical summary data tells us to
buy KKD near 1896 with an upside target of
2117 This data also tells us to set a stop loss
1875 to protect against excessive loss in
case the stock begins to move against the
trade 1896 is the first level of support below
21 and by rule any test of support is a buy
signal In this case 1896 initial support
would be tested so a buy signal would exist
Because this plan is based on a test of
support it is referred to as a Long Support
Plan
Please Note The Trading Plans listed above are based on real time stock prices They are dynamic and
they change as the market changes so they are only valid at or near the time you request them Pleaserefresh your request if you delay your decisions
KKD - (Long) Support PlanBuy near 1896 target 2117Stop Loss 1875
KKD - (Short) Support PlanShort under 1896 target naStop Loss 1917
The technical Summary and associated Trading Plans for KKD listed below will help you make important
timing decisions for your trades This data is based on our proprietary analysis for KKD In addition we
offer Market Timing Models and Stock Filters in the links above which may increase the proficiency of the
decisions you make
Buy over 1896 target 2173 stop loss 187
Buy over 1896 target 2173 stop loss 187
The technical summary data tells us to buy
KKD near 1896 with an upside target of
2173 This data also tells us to set a stop loss
187 to protect against excessive loss in
case the stock begins to move against the
trade 1896 is the first level of support below
Short under 2173 target 1896 stop loss
2199
Short under 2173 target 1896 stop loss
2199
The technical summary data is suggesting a
short of KKD as it gets near 2173 with a
downside target of 1896 We should have a
stop loss in place at 2199 though 2173 is the
Long Term Trading Plans for KKDOctober 20 2016 234 am ET
Technical Summary 1896 21 2173 2435 Where 21 = the recent price
Legend
Current stock pricebullSupport levelbullResistance levelbull
StockFinderFind a Stock to Buy or
Short
Buy This Stock
KKD - (Long) Support PlanBuy over 1896 target 2173stop loss 187
Short This Stock
KKD - (Short) ResistancePlanShort under 2173 target1896 stop loss 2199
21 and by rule any test of support is a buy
signal In this case support 1896 would be
being tested so a buy signal would exist
Buy over 2173 target 2435 stop loss
2147
Buy over 2173 target 2435 stop loss
2147
If 2173 begins to break higher the technical
summary data will suggest a buy of KKD over
2173 with an upside target of 2435 The
data also tells us to set a stop loss 2147 in
case the stock turns against the trade 2173
is the first level of resistance above 21 and by
rule any break above resistance is a buy
signal In this case resistance 1896 would be
breaking higher so a buy signal would
existpgt
stop loss in place at 2199 though 2173 is the
first level of resistance above 21 and by rule
any test of resistance is a short signal In this
case if resistance 2173 is being tested so a
short signal would exist
Short under 1896 target na stop loss
1922
Short under 1896 target na stop loss
1922
The technical summary data is suggesting a
short of KKD if it breaks below 1896 But
there is no current downside target from the
summary table This tells us that we should
hold this position until either a revised target is
generated which usually occurs at the open of
the next session or until this position has
been stopped We should have a stop loss in
place at 1922 according to the data 1896 is
the first level of support below 21 and by rule
any break below support is a short signal In
this case if support 1896 is breaking lower a
short signal would exist
Please Note The Trading Plans listed above are based on real time stock prices They are dynamic and
they change as the market changes so they are only valid at or near the time you request them Pleaserefresh your request if you delay your decisions
KKD - (Long) ResistancePlanBuy over 2173 target 2435stop loss 2147
KKD - (Short) Support PlanShort under 1896 target nastop loss 1922
The technical Summary and associated Trading Plans for KKD listed below will help you make important
timing decisions for your trades This data is based on our proprietary analysis for KKD In addition we
offer Market Timing Models and Stock Filters in the links above which may increase the proficiency of the
decisions you make
Buy over 2117 target 2173 Stop Loss
2091
Buy over 2117 target 2173 Stop Loss
2091If 2117 begins to break higher the
technical summary data tells us to buy KKD
just over 2117 with an upside target of 2173
The data also tells us to set a stop loss
Short near 2117 target 2091 Stop Loss
2143
Short near 2117 target 2091 Stop Loss
2143The technical summary data is
suggesting a short of KKD if it tests 2117 with
a downside target of 2091 We should have a
stop loss in place at 2143 though in case the
Swing Trading Plans for KKDOctober 20 2016 234 am ET
Technical Summary 1896 2091 21 2117 2173 2435 Where 21 = the recent price
Legend
Current stock pricebullSupport levelbullResistance levelbull
StockFinderFind a Stock to Buy or
Short
Buy This Stock
KKD - (Long) ResistancePlanBuy over 2117 target 2173Stop Loss 2091
Short This Stock
KKD - (Short) ResistancePlanShort near 2117 target2091 Stop Loss 2143
2091 in case the stock turns against the
trade 2117 is the first level of resistance
above 21 and by rule any break above
resistance is a buy signal In this case 2117
initial resistance would be breaking higher so
a buy signal would exist Because this plan is
based on a break of resistance it is referred
to as a Long Resistance Plan
Buy near 2091 target 2117 Stop Loss
2065
Buy near 2091 target 2117 Stop Loss
2065The technical summary data tells us to
buy KKD near 2091 with an upside target of
2117 This data also tells us to set a stop loss
2065 to protect against excessive loss in
case the stock begins to move against the
trade 2091 is the first level of support below
21 and by rule any test of support is a buy
signal In this case 2091 initial support
would be tested so a buy signal would exist
Because this plan is based on a test of
support it is referred to as a Long Support
Plan
stock begins to move against the trade By
rule any test of resistance is a short signal In
this case if resistance 2117 is being tested
a short signal would exist Because this plan is
a short plan based on a test of resistance it is
referred to as a Short Resistance Plan
Short under 2091 target 1896 Stop Loss
2117
Buy near 2091 target 2117 Stop Loss
2065The technical summary data tells us to
buy KKD near 2091 with an upside target of
2117 This data also tells us to set a stop loss
2065 to protect against excessive loss in
case the stock begins to move against the
trade 2091 is the first level of support below
21 and by rule any test of support is a buy
signal In this case 2091 initial support
would be tested so a buy signal would exist
Because this plan is based on a test of
support it is referred to as a Long Support
Plan
Please Note The Trading Plans listed above are based on real time stock prices They are dynamic and
they change as the market changes so they are only valid at or near the time you request them Pleaserefresh your request if you delay your decisions
KKD - (Long) Support PlanBuy near 2091 target 2117Stop Loss 2065
KKD - (Short) Support PlanShort under 2091 target1896 Stop Loss 2117
The technical Summary and associated Trading Plans for KKD listed below will help you make important
timing decisions for your trades This data is based on our proprietary analysis for KKD In addition we
offer Market Timing Models and Stock Filters in the links above which may increase the proficiency of the
decisions you make
Buy over 2117 target 2173 Stop Loss
2096
Buy over 2117 target 2173 Stop Loss
2096If 2117 begins to break higher the
technical summary data tells us to buy KKD
just over 2117 with an upside target of 2173
The data also tells us to set a stop loss
Short near 2117 target 1896 Stop Loss
2138
Short near 2117 target 1896 Stop Loss
2138The technical summary data is
suggesting a short of KKD if it tests 2117 with
a downside target of 1896 We should have a
stop loss in place at 2138 though in case the
Day Trading Plans for KKDOctober 20 2016 234 am ET
Technical Summary 1896 21 2117 2173 2435 Where 21 = the recent price
Legend
Current stock pricebullSupport levelbullResistance levelbull
StockFinderFind a Stock to Buy or
Short
Buy This Stock
KKD - (Long) ResistancePlanBuy over 2117 target 2173Stop Loss 2096
Short This Stock
KKD - (Short) ResistancePlanShort near 2117 target1896 Stop Loss 2138
2096 in case the stock turns against the
trade 2117 is the first level of resistance
above 21 and by rule any break above
resistance is a buy signal In this case 2117
initial resistance would be breaking higher so
a buy signal would exist Because this plan is
based on a break of resistance it is referred
to as a Long Resistance Plan
Buy near 1896 target 2117 Stop Loss
1875
Buy near 1896 target 2117 Stop Loss
1875The technical summary data tells us to
buy KKD near 1896 with an upside target of
2117 This data also tells us to set a stop loss
1875 to protect against excessive loss in
case the stock begins to move against the
trade 1896 is the first level of support below
21 and by rule any test of support is a buy
signal In this case 1896 initial support
would be tested so a buy signal would exist
Because this plan is based on a test of
support it is referred to as a Long Support
Plan
stock begins to move against the trade By
rule any test of resistance is a short signal In
this case if resistance 2117 is being tested
a short signal would exist Because this plan is
a short plan based on a test of resistance it is
referred to as a Short Resistance Plan
Short under 1896 target na Stop Loss
1917
Buy near 1896 target 2117 Stop Loss
1875The technical summary data tells us to
buy KKD near 1896 with an upside target of
2117 This data also tells us to set a stop loss
1875 to protect against excessive loss in
case the stock begins to move against the
trade 1896 is the first level of support below
21 and by rule any test of support is a buy
signal In this case 1896 initial support
would be tested so a buy signal would exist
Because this plan is based on a test of
support it is referred to as a Long Support
Plan
Please Note The Trading Plans listed above are based on real time stock prices They are dynamic and
they change as the market changes so they are only valid at or near the time you request them Pleaserefresh your request if you delay your decisions
KKD - (Long) Support PlanBuy near 1896 target 2117Stop Loss 1875
KKD - (Short) Support PlanShort under 1896 target naStop Loss 1917
21 and by rule any test of support is a buy
signal In this case support 1896 would be
being tested so a buy signal would exist
Buy over 2173 target 2435 stop loss
2147
Buy over 2173 target 2435 stop loss
2147
If 2173 begins to break higher the technical
summary data will suggest a buy of KKD over
2173 with an upside target of 2435 The
data also tells us to set a stop loss 2147 in
case the stock turns against the trade 2173
is the first level of resistance above 21 and by
rule any break above resistance is a buy
signal In this case resistance 1896 would be
breaking higher so a buy signal would
existpgt
stop loss in place at 2199 though 2173 is the
first level of resistance above 21 and by rule
any test of resistance is a short signal In this
case if resistance 2173 is being tested so a
short signal would exist
Short under 1896 target na stop loss
1922
Short under 1896 target na stop loss
1922
The technical summary data is suggesting a
short of KKD if it breaks below 1896 But
there is no current downside target from the
summary table This tells us that we should
hold this position until either a revised target is
generated which usually occurs at the open of
the next session or until this position has
been stopped We should have a stop loss in
place at 1922 according to the data 1896 is
the first level of support below 21 and by rule
any break below support is a short signal In
this case if support 1896 is breaking lower a
short signal would exist
Please Note The Trading Plans listed above are based on real time stock prices They are dynamic and
they change as the market changes so they are only valid at or near the time you request them Pleaserefresh your request if you delay your decisions
KKD - (Long) ResistancePlanBuy over 2173 target 2435stop loss 2147
KKD - (Short) Support PlanShort under 1896 target nastop loss 1922
The technical Summary and associated Trading Plans for KKD listed below will help you make important
timing decisions for your trades This data is based on our proprietary analysis for KKD In addition we
offer Market Timing Models and Stock Filters in the links above which may increase the proficiency of the
decisions you make
Buy over 2117 target 2173 Stop Loss
2091
Buy over 2117 target 2173 Stop Loss
2091If 2117 begins to break higher the
technical summary data tells us to buy KKD
just over 2117 with an upside target of 2173
The data also tells us to set a stop loss
Short near 2117 target 2091 Stop Loss
2143
Short near 2117 target 2091 Stop Loss
2143The technical summary data is
suggesting a short of KKD if it tests 2117 with
a downside target of 2091 We should have a
stop loss in place at 2143 though in case the
Swing Trading Plans for KKDOctober 20 2016 234 am ET
Technical Summary 1896 2091 21 2117 2173 2435 Where 21 = the recent price
Legend
Current stock pricebullSupport levelbullResistance levelbull
StockFinderFind a Stock to Buy or
Short
Buy This Stock
KKD - (Long) ResistancePlanBuy over 2117 target 2173Stop Loss 2091
Short This Stock
KKD - (Short) ResistancePlanShort near 2117 target2091 Stop Loss 2143
2091 in case the stock turns against the
trade 2117 is the first level of resistance
above 21 and by rule any break above
resistance is a buy signal In this case 2117
initial resistance would be breaking higher so
a buy signal would exist Because this plan is
based on a break of resistance it is referred
to as a Long Resistance Plan
Buy near 2091 target 2117 Stop Loss
2065
Buy near 2091 target 2117 Stop Loss
2065The technical summary data tells us to
buy KKD near 2091 with an upside target of
2117 This data also tells us to set a stop loss
2065 to protect against excessive loss in
case the stock begins to move against the
trade 2091 is the first level of support below
21 and by rule any test of support is a buy
signal In this case 2091 initial support
would be tested so a buy signal would exist
Because this plan is based on a test of
support it is referred to as a Long Support
Plan
stock begins to move against the trade By
rule any test of resistance is a short signal In
this case if resistance 2117 is being tested
a short signal would exist Because this plan is
a short plan based on a test of resistance it is
referred to as a Short Resistance Plan
Short under 2091 target 1896 Stop Loss
2117
Buy near 2091 target 2117 Stop Loss
2065The technical summary data tells us to
buy KKD near 2091 with an upside target of
2117 This data also tells us to set a stop loss
2065 to protect against excessive loss in
case the stock begins to move against the
trade 2091 is the first level of support below
21 and by rule any test of support is a buy
signal In this case 2091 initial support
would be tested so a buy signal would exist
Because this plan is based on a test of
support it is referred to as a Long Support
Plan
Please Note The Trading Plans listed above are based on real time stock prices They are dynamic and
they change as the market changes so they are only valid at or near the time you request them Pleaserefresh your request if you delay your decisions
KKD - (Long) Support PlanBuy near 2091 target 2117Stop Loss 2065
KKD - (Short) Support PlanShort under 2091 target1896 Stop Loss 2117
The technical Summary and associated Trading Plans for KKD listed below will help you make important
timing decisions for your trades This data is based on our proprietary analysis for KKD In addition we
offer Market Timing Models and Stock Filters in the links above which may increase the proficiency of the
decisions you make
Buy over 2117 target 2173 Stop Loss
2096
Buy over 2117 target 2173 Stop Loss
2096If 2117 begins to break higher the
technical summary data tells us to buy KKD
just over 2117 with an upside target of 2173
The data also tells us to set a stop loss
Short near 2117 target 1896 Stop Loss
2138
Short near 2117 target 1896 Stop Loss
2138The technical summary data is
suggesting a short of KKD if it tests 2117 with
a downside target of 1896 We should have a
stop loss in place at 2138 though in case the
Day Trading Plans for KKDOctober 20 2016 234 am ET
Technical Summary 1896 21 2117 2173 2435 Where 21 = the recent price
Legend
Current stock pricebullSupport levelbullResistance levelbull
StockFinderFind a Stock to Buy or
Short
Buy This Stock
KKD - (Long) ResistancePlanBuy over 2117 target 2173Stop Loss 2096
Short This Stock
KKD - (Short) ResistancePlanShort near 2117 target1896 Stop Loss 2138
2096 in case the stock turns against the
trade 2117 is the first level of resistance
above 21 and by rule any break above
resistance is a buy signal In this case 2117
initial resistance would be breaking higher so
a buy signal would exist Because this plan is
based on a break of resistance it is referred
to as a Long Resistance Plan
Buy near 1896 target 2117 Stop Loss
1875
Buy near 1896 target 2117 Stop Loss
1875The technical summary data tells us to
buy KKD near 1896 with an upside target of
2117 This data also tells us to set a stop loss
1875 to protect against excessive loss in
case the stock begins to move against the
trade 1896 is the first level of support below
21 and by rule any test of support is a buy
signal In this case 1896 initial support
would be tested so a buy signal would exist
Because this plan is based on a test of
support it is referred to as a Long Support
Plan
stock begins to move against the trade By
rule any test of resistance is a short signal In
this case if resistance 2117 is being tested
a short signal would exist Because this plan is
a short plan based on a test of resistance it is
referred to as a Short Resistance Plan
Short under 1896 target na Stop Loss
1917
Buy near 1896 target 2117 Stop Loss
1875The technical summary data tells us to
buy KKD near 1896 with an upside target of
2117 This data also tells us to set a stop loss
1875 to protect against excessive loss in
case the stock begins to move against the
trade 1896 is the first level of support below
21 and by rule any test of support is a buy
signal In this case 1896 initial support
would be tested so a buy signal would exist
Because this plan is based on a test of
support it is referred to as a Long Support
Plan
Please Note The Trading Plans listed above are based on real time stock prices They are dynamic and
they change as the market changes so they are only valid at or near the time you request them Pleaserefresh your request if you delay your decisions
KKD - (Long) Support PlanBuy near 1896 target 2117Stop Loss 1875
KKD - (Short) Support PlanShort under 1896 target naStop Loss 1917
The technical Summary and associated Trading Plans for KKD listed below will help you make important
timing decisions for your trades This data is based on our proprietary analysis for KKD In addition we
offer Market Timing Models and Stock Filters in the links above which may increase the proficiency of the
decisions you make
Buy over 2117 target 2173 Stop Loss
2091
Buy over 2117 target 2173 Stop Loss
2091If 2117 begins to break higher the
technical summary data tells us to buy KKD
just over 2117 with an upside target of 2173
The data also tells us to set a stop loss
Short near 2117 target 2091 Stop Loss
2143
Short near 2117 target 2091 Stop Loss
2143The technical summary data is
suggesting a short of KKD if it tests 2117 with
a downside target of 2091 We should have a
stop loss in place at 2143 though in case the
Swing Trading Plans for KKDOctober 20 2016 234 am ET
Technical Summary 1896 2091 21 2117 2173 2435 Where 21 = the recent price
Legend
Current stock pricebullSupport levelbullResistance levelbull
StockFinderFind a Stock to Buy or
Short
Buy This Stock
KKD - (Long) ResistancePlanBuy over 2117 target 2173Stop Loss 2091
Short This Stock
KKD - (Short) ResistancePlanShort near 2117 target2091 Stop Loss 2143
2091 in case the stock turns against the
trade 2117 is the first level of resistance
above 21 and by rule any break above
resistance is a buy signal In this case 2117
initial resistance would be breaking higher so
a buy signal would exist Because this plan is
based on a break of resistance it is referred
to as a Long Resistance Plan
Buy near 2091 target 2117 Stop Loss
2065
Buy near 2091 target 2117 Stop Loss
2065The technical summary data tells us to
buy KKD near 2091 with an upside target of
2117 This data also tells us to set a stop loss
2065 to protect against excessive loss in
case the stock begins to move against the
trade 2091 is the first level of support below
21 and by rule any test of support is a buy
signal In this case 2091 initial support
would be tested so a buy signal would exist
Because this plan is based on a test of
support it is referred to as a Long Support
Plan
stock begins to move against the trade By
rule any test of resistance is a short signal In
this case if resistance 2117 is being tested
a short signal would exist Because this plan is
a short plan based on a test of resistance it is
referred to as a Short Resistance Plan
Short under 2091 target 1896 Stop Loss
2117
Buy near 2091 target 2117 Stop Loss
2065The technical summary data tells us to
buy KKD near 2091 with an upside target of
2117 This data also tells us to set a stop loss
2065 to protect against excessive loss in
case the stock begins to move against the
trade 2091 is the first level of support below
21 and by rule any test of support is a buy
signal In this case 2091 initial support
would be tested so a buy signal would exist
Because this plan is based on a test of
support it is referred to as a Long Support
Plan
Please Note The Trading Plans listed above are based on real time stock prices They are dynamic and
they change as the market changes so they are only valid at or near the time you request them Pleaserefresh your request if you delay your decisions
KKD - (Long) Support PlanBuy near 2091 target 2117Stop Loss 2065
KKD - (Short) Support PlanShort under 2091 target1896 Stop Loss 2117
The technical Summary and associated Trading Plans for KKD listed below will help you make important
timing decisions for your trades This data is based on our proprietary analysis for KKD In addition we
offer Market Timing Models and Stock Filters in the links above which may increase the proficiency of the
decisions you make
Buy over 2117 target 2173 Stop Loss
2096
Buy over 2117 target 2173 Stop Loss
2096If 2117 begins to break higher the
technical summary data tells us to buy KKD
just over 2117 with an upside target of 2173
The data also tells us to set a stop loss
Short near 2117 target 1896 Stop Loss
2138
Short near 2117 target 1896 Stop Loss
2138The technical summary data is
suggesting a short of KKD if it tests 2117 with
a downside target of 1896 We should have a
stop loss in place at 2138 though in case the
Day Trading Plans for KKDOctober 20 2016 234 am ET
Technical Summary 1896 21 2117 2173 2435 Where 21 = the recent price
Legend
Current stock pricebullSupport levelbullResistance levelbull
StockFinderFind a Stock to Buy or
Short
Buy This Stock
KKD - (Long) ResistancePlanBuy over 2117 target 2173Stop Loss 2096
Short This Stock
KKD - (Short) ResistancePlanShort near 2117 target1896 Stop Loss 2138
2096 in case the stock turns against the
trade 2117 is the first level of resistance
above 21 and by rule any break above
resistance is a buy signal In this case 2117
initial resistance would be breaking higher so
a buy signal would exist Because this plan is
based on a break of resistance it is referred
to as a Long Resistance Plan
Buy near 1896 target 2117 Stop Loss
1875
Buy near 1896 target 2117 Stop Loss
1875The technical summary data tells us to
buy KKD near 1896 with an upside target of
2117 This data also tells us to set a stop loss
1875 to protect against excessive loss in
case the stock begins to move against the
trade 1896 is the first level of support below
21 and by rule any test of support is a buy
signal In this case 1896 initial support
would be tested so a buy signal would exist
Because this plan is based on a test of
support it is referred to as a Long Support
Plan
stock begins to move against the trade By
rule any test of resistance is a short signal In
this case if resistance 2117 is being tested
a short signal would exist Because this plan is
a short plan based on a test of resistance it is
referred to as a Short Resistance Plan
Short under 1896 target na Stop Loss
1917
Buy near 1896 target 2117 Stop Loss
1875The technical summary data tells us to
buy KKD near 1896 with an upside target of
2117 This data also tells us to set a stop loss
1875 to protect against excessive loss in
case the stock begins to move against the
trade 1896 is the first level of support below
21 and by rule any test of support is a buy
signal In this case 1896 initial support
would be tested so a buy signal would exist
Because this plan is based on a test of
support it is referred to as a Long Support
Plan
Please Note The Trading Plans listed above are based on real time stock prices They are dynamic and
they change as the market changes so they are only valid at or near the time you request them Pleaserefresh your request if you delay your decisions
KKD - (Long) Support PlanBuy near 1896 target 2117Stop Loss 1875
KKD - (Short) Support PlanShort under 1896 target naStop Loss 1917
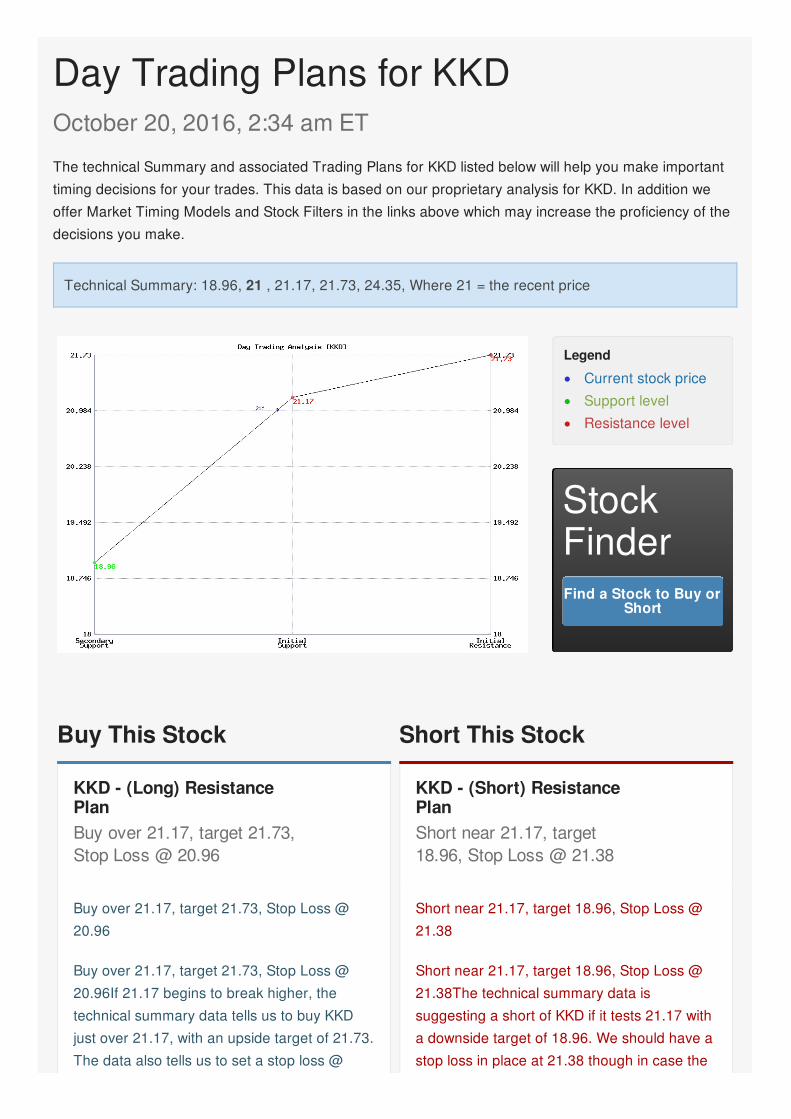