Embed Size (px)
Citation preview

FOR LEASE
DEMOGRAPHICS
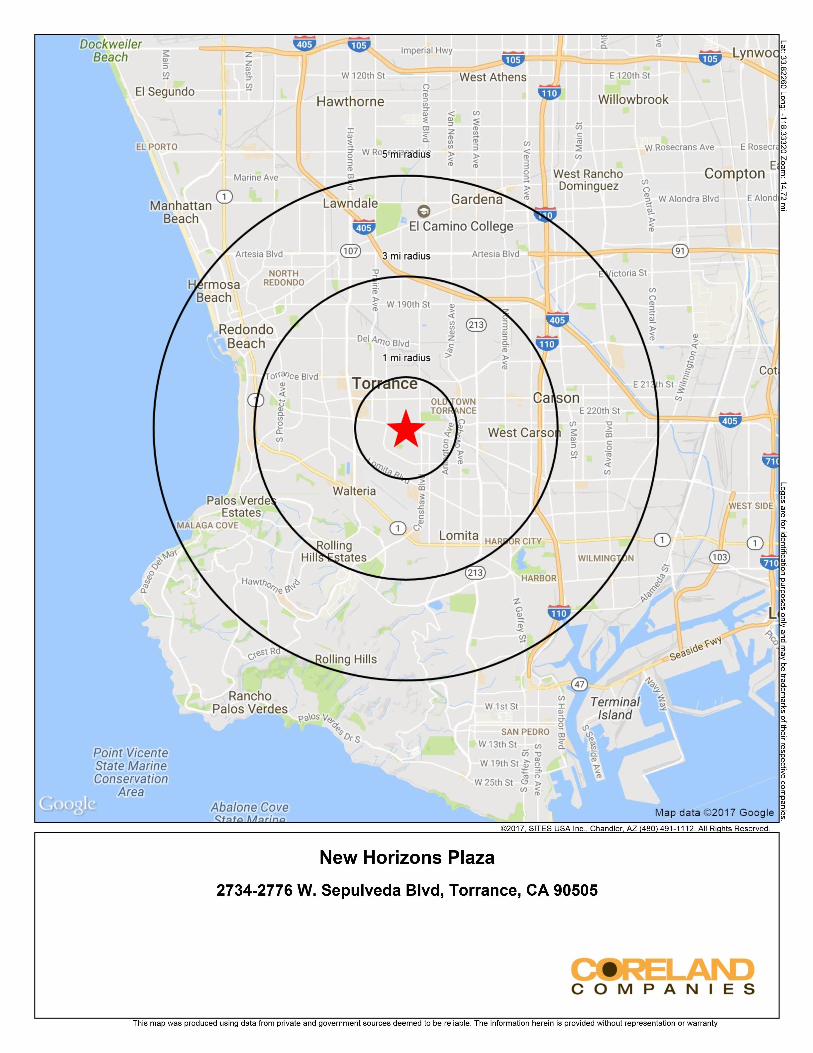
1 MILE 3 MILES 5 MILES
Population 26,697 216,639 542,871
Avg. HH Income $102,893 $98,157 $105,864
TRAFFIC COUNT: Over 45,000 cars per day along
Sepulveda Boulevard.
Positioned w/in Dense Residential Community of Torrance | 803 - 2,475 SF Available
2734-2776 West Sepulveda Blvd.Torrance, California
NEW HORIZONS PLAZA
www.coreland.com
17542 E. 17th Street, Suite 420Tustin, CA 92780
t 714.573.7780 I f 714.573.7790
For leasing opportunities, please contact:
Joseph Kim (Lic. #01463895)
[email protected] I 714.210.6731
Matt Hammond (Lic. #01235239)
[email protected] I 714.210.6711
Chris Premac (Lic. #01966099)
[email protected] I 714.210.6705
The information contained herein has been obtained from sources we deem reliable, however no warranty or representation is made to the accuracy of the information. Terms of lease or availability are subject to change or withdrawal without notice.

www.coreland.com I 714.573.7780
4
4
NEW HORIZONS PLAZA | 2734-2776 West Sepulveda Blvd. | Torrance, CA
Positioned in the heart of Torrance with ideal visibility off Sepulveda Boulevard (45,000 CPD);
Surrounded by densely-populated Torrance housing community and within close proximity to Shery High School;
4
4Great synergy among many longstanding co-tenants, including local favorite, Korean walnut pastry cafe Cocohodo ;
Pylon signage available.

©2017, Sites USA, Chandler, Arizona, 480-491-1112 page 1 of 1 Demographic Source: Applied Geographic Solutions 10/2016, TIGER Geography
2016 Estimated Population 26,697 216,639 542,871
2021 Projected Population 27,515 223,201 559,443
2010 Census Population 26,013 211,164 528,774
2000 Census Population 23,393 202,626 510,821
Projected Annual Growth 2016 to 2021 0.6% 0.6% 0.6%
Historical Annual Growth 2000 to 2016 0.9% 0.4% 0.4%
2016 Median Age 42.5 39.9 39.2
2016 Estimated Households 10,722 79,895 194,973
2021 Projected Households 11,196 83,320 203,343
2010 Census Households 10,350 77,136 188,197
2000 Census Households 9,454 75,263 184,683
Projected Annual Growth 2016 to 2021 0.9% 0.9% 0.9%
Historical Annual Growth 2000 to 2016 0.8% 0.4% 0.3%
2016 Estimated White 41.9% 47.8% 48.4%
2016 Estimated Black or African American 2.6% 4.9% 6.1%
2016 Estimated Asian or Pacific Islander 46.1% 30.2% 25.8%
2016 Estimated American Indian or Native Alaskan 0.3% 0.5% 0.5%
2016 Estimated Other Races 9.0% 16.5% 19.2%
2016 Estimated Hispanic 14.9% 27.3% 33.0%
2016 Estimated Average Household Income $102,893 $98,157 $105,864
2016 Estimated Median Household Income $86,879 $80,124 $85,390
2016 Estimated Per Capita Income $41,387 $36,278 $38,094
2016 Estimated Elementary (Grade Level 0 to 8) 2.4% 6.2% 7.6%
2016 Estimated Some High School (Grade Level 9 to 11) 3.6% 5.6% 6.2%
2016 Estimated High School Graduate 17.5% 19.3% 19.3%
2016 Estimated Some College 20.0% 20.8% 20.3%
2016 Estimated Associates Degree Only 7.9% 8.1% 7.8%
2016 Estimated Bachelors Degree Only 34.2% 27.0% 25.5%
2016 Estimated Graduate Degree 14.3% 13.0% 13.3%
2016 Estimated Total Businesses 2,788 13,039 25,430
2016 Estimated Total Employees 32,434 145,271 244,315
2016 Estimated Employee Population per Business 11.6 11.1 9.6
2016 Estimated Residential Population per Business 9.6 16.6 21.3
Thi
s re
port
was
pro
duce
d us
ing
data
from
priv
ate
and
gove
rnm
ent s
ourc
es d
eem
ed to
be
relia
ble.
The
info
rmat
ion
here
in is
pro
vide
d w
ithou
t rep
rese
ntat
ion
or w
arra
nty.
POPU
LATI
ON
HO
USE
HO
LDS
RA
CE
AN
D
ETH
NIC
ITY
IN
CO
ME
EDU
CA
TIO
N(A
GE
25+)
BU
SIN
ESS
RS1
New Horizons Plaza1 mi radius 3 mi radius 5 mi radius
2734-2776 W. Sepulveda Blvd, Torrance, CA 90505
SUMMARY PROFILE2000-2010 Census, 2016 Estimates with 2021 ProjectionsCalculated using Weighted Block Centroid from Block Groups
Lat/Lon: 33.8226/-118.3332