Embed Size (px)
Citation preview

FOR LOCAL PUBLIC HEALTH LEADERS AND FISCAL STAFF
PUBLIC HEALTH BUDGETING ACCOUNTING & REPORTING SYSTEM (BARS)
APRIL 1, 2014

Mute your phone Do NOT use Hold Write down your questions When commenting or asking a question,
remember to: Un-mute your phone Identify yourself and your agency Address issues that are relevant to the majority
of participants More specific issues will be addressed
outside of the webinar We will not be using the text chat during this
webinar
2
Webinar Guidelines

Including you, how many people are watching this session at your current location? 1 2 3 4 5 6 or more
3
Question 1

For fiscal staff, how long have you been in your current role at your current agency? Less than a year 1 - 2 years 3 or more years
4
Question 2

If you are responsible for completing the BARS report this year, is this your first time? Yes No
5
Question 3

Have you taken BARS training provided by the State Auditors Office (SAO) through the Washington Finance Officers Association (WFOA)? Yes No
6
Question 4

Outline for Today’s Training
Why is BARS important? What is BARS and where did it come from? How does BARS work? What do I need to report? What next? How can I learn more?
7

BARS data is used to: Answer questions from policy makers
Legislature Governor’s office Office of Financial Management (OFM) County commissioners/local boards of health Federal agencies (e.g. CDC) National efforts (RWJ, IOM, ASTHO, NACCHO)
To report on how state general funds to LHJs are used Local Capacity Development Funds (LCDF) MVET Replacement 5930 / Blue Ribbon Commission (BRC) County Public Health Assistance
8
Why is BARS Important?

BARS data is used to: To understand financing of local public health
PHIP Finance Committee PHIP Foundational Public Health Services Research Others
Examples Funding – revenue source, trends, comparisons Spending
9
Why is BARS important? (cont.)

8
Local Gov't Contribution
21.3%
Misc/Fund Balance/Other
2.9%
Licenses, Permits
& Fees19.5%
State Funds17.5%
Federal Funds38.8%
Example 1Revenue by Fund Source
All LHJs 2011


PIE CHART 1
9 LHJ A LHJ B
State Funds 40.6%
Federal Funds27.3%
Local Gov't Contrib3.2%
Licenses, Permits &
Fees22.4%
Misc/Fund Balance/ Other6.5%
$4.3M
State Funds 21.8%
Federal Funds21.6%
Local Gov't Contrib31.9%
Licenses, Permits &
Fees23.9%
Misc/Fund Balance/ Other0.8%
$9.5M
Example 3Revenue, by Fund Sources for Two LHJs
Serving a Similar Sized Populations2011
PIE CHART 111
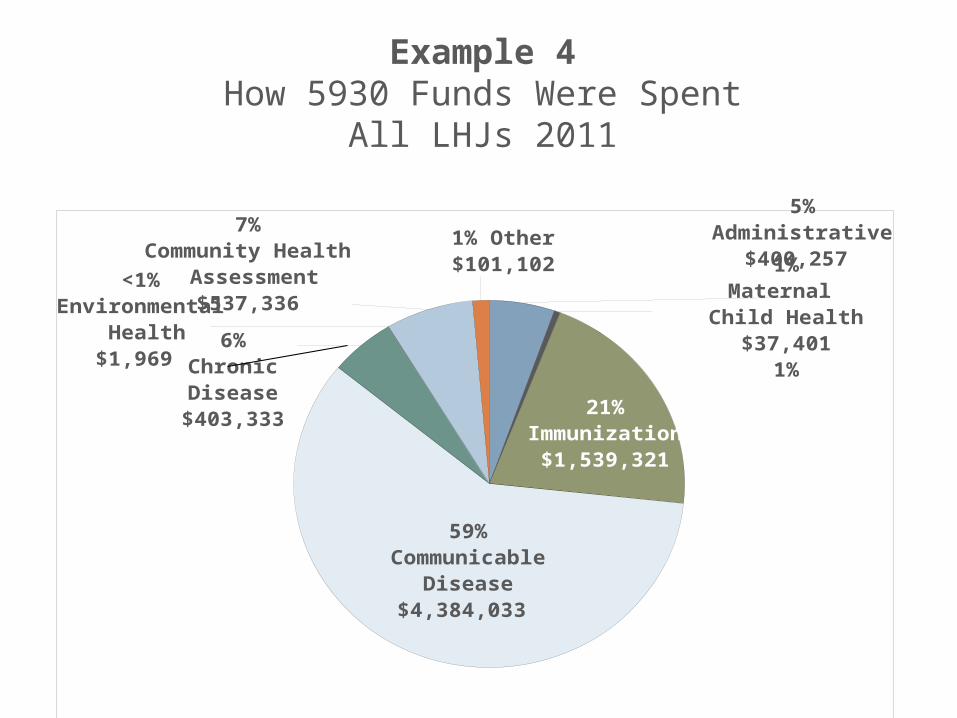
5%Administrative
$400,257 1%
Maternal Child Health
$37,401 1%
21%Immunization $1,539,321
59%Communicable
Disease$4,384,033
6%Chronic Disease
$403,333
<1%Environmental
Health$1,969
7%Community Health
Assessment $537,336
1% Other $101,102
Example 4How 5930 Funds Were Spent
All LHJs 2011

Budgeting, Accounting and Reporting System (BARS) A chart of accounts
The Law (RCW43.09.200) The state auditor shall formulate, prescribe, and
install asystem of accounting and reporting for all local governments, which shall be uniform for every public institution, and every public office, and every public account of the same class.The system shall exhibit true accounts and detailed statementsof funds collected, received, and expended for account of the public for any purpose whatever, and by all public officers, employees, or other persons. (1909)
Many states require similar reporting from local governments
14
What is BARS & Where Did It Come From?

State Auditor’s Office (SAO) designed and manages the chart of account for Washington State Establish revenue and expenditure codes and
definitions Coordinate with state agencies that can establish
more detailed expenditure codes and definitions Publish manuals and state agency supplemental
manuals Provide training Collect and publish data and reports
All local governments are required to use BARS to report to SAO each June
For LHJs Districts report directly to SAO Departments, the county reports to SAO
15
What is BARS & Where Did It Come From?

16
Budgeting, Accounting & Reporting System (BARS)

17
Anatomy of a BARS Code

18
DIGIT 1 2 3 . 5 6 7 8 9 10,11,12 13,14.15,16
WICxxx.xxxxx
x.333 .10.55
Immunizationsxxx.xxxxx
x.333 .93.26
LCDFxxx.xxxxx
x.334 .04.92
MVET Replacement
xxx.xxxxxx
.336 .04.23
Anatomy of a BARS Code – Revenue Examples

19
Anatomy of a BARS Code

20
DIGIT 1 2 3 . 5 6 7 8 9 10,11,12 13,14.15,16
WIC xxx.xxxxxx .562 .28.xx
Immunizations xxx.xxxxxx .562 .32.xx
Administration xxx.xxxxxx .562 .10.xx
Community Health Assessment
xxx.xxxxxx .562 .80.xx
TB xxx.xxxxxx .562 .34.xx
Onsite Septic & Land Development
xxx.xxxxxx .562 .54.xx
Anatomy of a BARS Code – Expenditure Examples

21
WIC xxx.xxxxxx .333 .10.55 WIC xxx.xxxxx
x .562 .28 .xx
Immunizations
xxx.xxxxxx .333 .93.26 Immunizatio
nsxxx.xxxxxx .562 .32 .x
x
LCDF xxx.xxxxxx .334 .04.92
Administration
Community HealthAssessment
xxx.xxxxxx
xxx.xxxxxx
.562
.562
.10
.80
.xx
.xx
BRC/5930 xxx.xxxxxx .334 .04.99
Other Communicable Disease
Immunizations
xxx.xxxxxx
xxx.xxxxxx
.562
.562
.39
.32
.xx
.xx
Examples of Linking Revenue & Expenditure Codes

What accounting method does your agency use? Cash Accrual
22
Question 5

Cash/Accrual Identifier Data Rows – Expenditure Codes & Amounts Columns – Revenue Codes & Amounts
Include all 7 digits even if the later 4 are zeros
23
What & How Do I Report to DOH?

Reconciliation Compares your BARS data with our record of
Con Con payments (we know that Con Con represents only a part of your total revenue)
Common Issues Old BARS codes Putting data in the wrong column Not using the template provided FTE’s not provided Formula errors
Post-Reconciliation Revise individual LHJ reports and combine
revenue codes Aggregate individual reports into statewide
summary DOH reviews and publishes in hardcopy and on
the web
24
What Does DOH Do with Your Data?

Each LHJ receives 2 hardcopies of the BARS report
All data will be on the web by July 2014 Used to:
Understand how the local public health system is funded
Answer questions from elected officials Research National interest in the data
25
What Happens Then?

Institute of Medicine (IOM)For the Public’s Health: Investing in aHealthier Future 2012
Robert Wood Johnson Foundation (RWJF)
National Association of City &County Health Officials (NACCHO)Public Health Uniform National Data System (PHUND$)
26
National Interest in an UniformChart of Accounts for Public Health

Long-term planning to improve BARS State/Local Workgroup to make
improvements Learn more about processes used by LHJs,
DOH, and SAO – how can the processes be streamlined and simplified?
Learn more about who is using BARS and how Update BARS expenditure codes and
definitions to better reflect our work – both currently and into the future
27
Future

State Auditor’s Office (SAO)www.sao.wa.gov/Pages/default.aspx
Washington Finance Officers Association (WFOA) www.wfoa.org/default.aspwww.mrsc.org/associations/wfoa/register/training.aspx
Washington State Department of Revenue Information for Local Governmenthttp://dor.wa.gov/content/doingbusiness/localgovernment.aspx
28
How Can I Learn More?

Marie Flake – (360) [email protected]
Charles Messer – (360) [email protected]
Questions may be submitted to:Tom Rogers, DOH Grants [email protected]
29
Contacts