Embed Size (px)
Citation preview
October 11, 2005
www.cibcwm.com/researchEconomics & Strategy
Jeffrey Rubin Avery Shenfeld Benjamin Tal Peter Buchanan Warren Lovely Leslie Preston(416) 594-7357 (416) 594-7356 (416) 956-3698 (416) 594-7354 (416) 594-7359 (416) 956-3219
CIBC World Markets Inc. • PO Box 500, 161 Bay Street, BCE Place, Toronto Canada M5J 2S8 • Bloomberg @ WGEC1 • (416) 594-7000CIBC World Markets Corp. • 300 Madison Avenue, New York, NY 10017 • (212) 856-4000, (800) 999-6726
CONTENTS
Executive Summary ................................. 2
Recent Trends In Self-Employment ........... 5
The Quality of Self-Employment ............... 8
Serial Entrepreneurs .............................. 13
Small Businesses Creating Jobs ............. 15
Facing Challenges .................................. 18 The Soaring Canadian Dollar ................ 18 Rising Oil and Gas Prices ..................... 21
A Regional Perspective ........................... 24
A Look Ahead ......................................... 26
Small Business Statistics ....................... 27
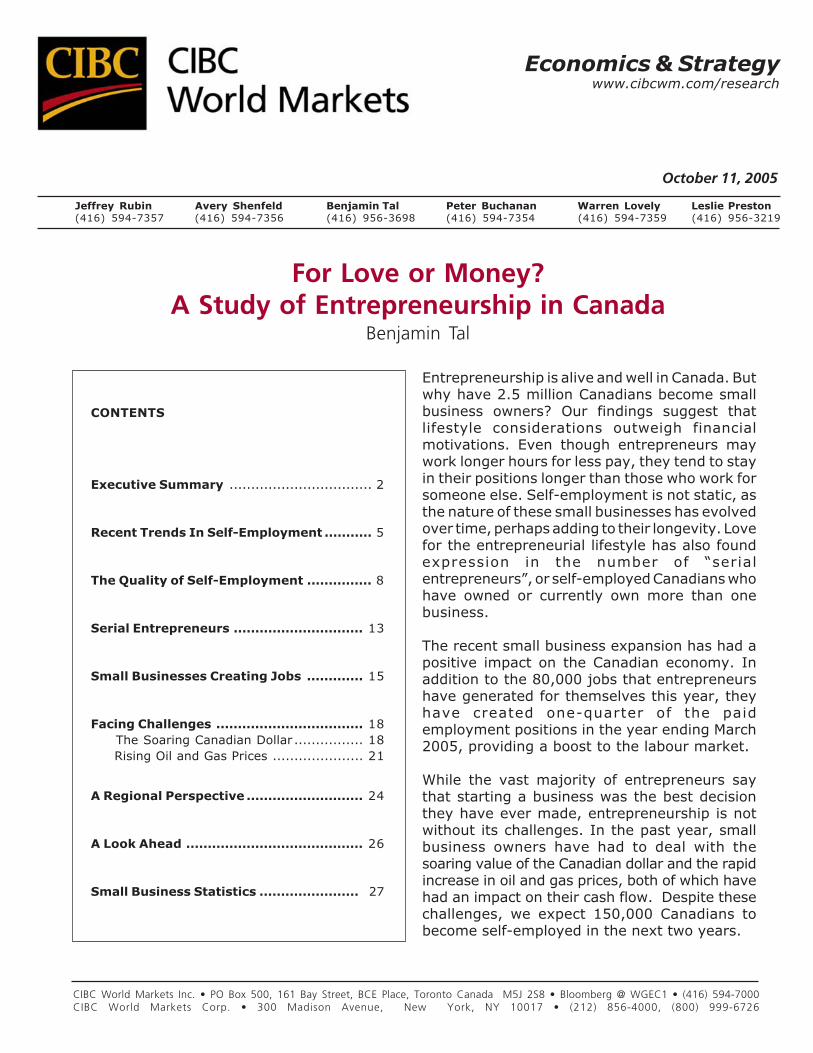
Entrepreneurship is alive and well in Canada. Butwhy have 2.5 million Canadians become smallbusiness owners? Our findings suggest thatlifestyle considerations outweigh financialmotivations. Even though entrepreneurs maywork longer hours for less pay, they tend to stayin their positions longer than those who work forsomeone else. Self-employment is not static, asthe nature of these small businesses has evolvedover time, perhaps adding to their longevity. Lovefor the entrepreneurial lifestyle has also foundexpression in the number of “serialentrepreneurs”, or self-employed Canadians whohave owned or currently own more than onebusiness.
The recent small business expansion has had apositive impact on the Canadian economy. Inaddition to the 80,000 jobs that entrepreneurshave generated for themselves this year, theyhave created one-quarter of the paidemployment positions in the year ending March2005, providing a boost to the labour market.
While the vast majority of entrepreneurs saythat starting a business was the best decisionthey have ever made, entrepreneurship is notwithout its challenges. In the past year, smallbusiness owners have had to deal with thesoaring value of the Canadian dollar and the rapidincrease in oil and gas prices, both of which havehad an impact on their cash flow. Despite thesechallenges, we expect 150,000 Canadians tobecome self-employed in the next two years.
For Love or Money?A Study of Entrepreneurship in Canada
Benjamin Tal
2For Love or Money? A Study of Entrepreneurship in Canada
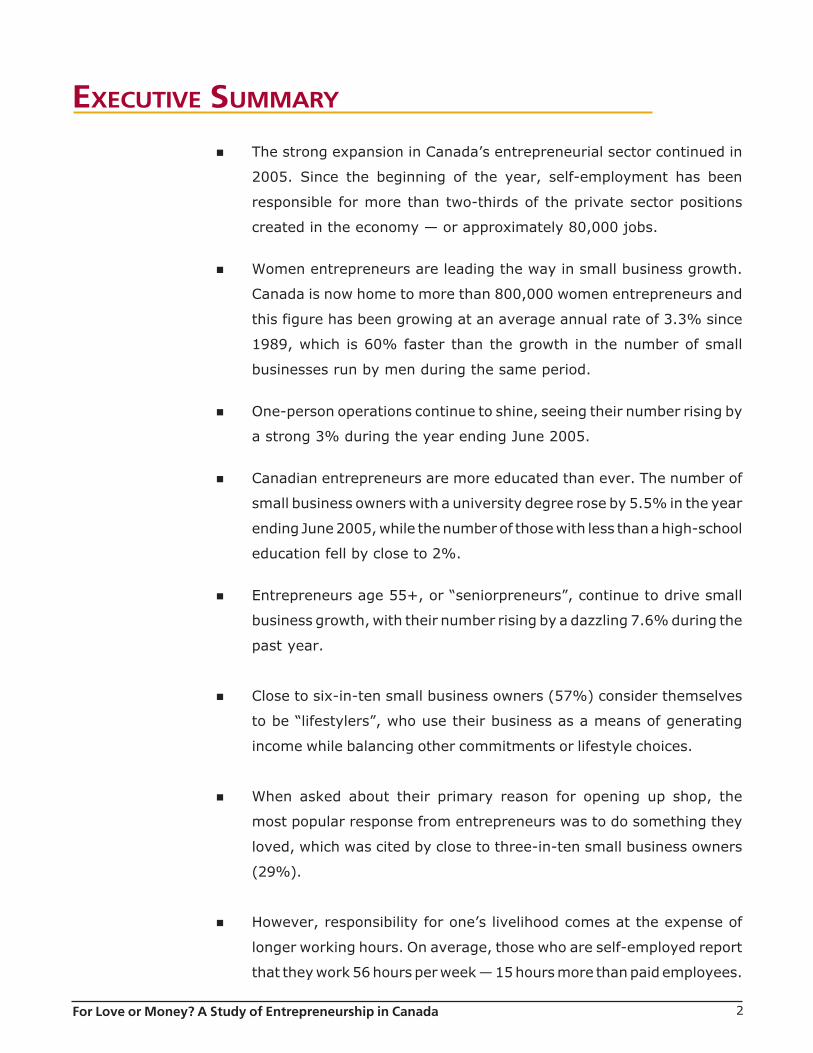
EXECUTIVE SUMMARY
� The strong expansion in Canada’s entrepreneurial sector continued in
2005. Since the beginning of the year, self-employment has been
responsible for more than two-thirds of the private sector positions
created in the economy — or approximately 80,000 jobs.
� Women entrepreneurs are leading the way in small business growth.
Canada is now home to more than 800,000 women entrepreneurs and
this figure has been growing at an average annual rate of 3.3% since
1989, which is 60% faster than the growth in the number of small
businesses run by men during the same period.
� One-person operations continue to shine, seeing their number rising by
a strong 3% during the year ending June 2005.
� Canadian entrepreneurs are more educated than ever. The number of
small business owners with a university degree rose by 5.5% in the year
ending June 2005, while the number of those with less than a high-school
education fell by close to 2%.
� Entrepreneurs age 55+, or “seniorpreneurs”, continue to drive small
business growth, with their number rising by a dazzling 7.6% during the
past year.
� Close to six-in-ten small business owners (57%) consider themselves
to be “lifestylers”, who use their business as a means of generating
income while balancing other commitments or lifestyle choices.
� When asked about their primary reason for opening up shop, the
most popular response from entrepreneurs was to do something they
loved, which was cited by close to three-in-ten small business owners
(29%).
� However, responsibility for one’s livelihood comes at the expense of
longer working hours. On average, those who are self-employed report
that they work 56 hours per week — 15 hours more than paid employees.
3For Love or Money? A Study of Entrepreneurship in Canada
EXECUTIVE SUMMARY, CONTINUED
� Generally, self-employed people earn less than paid employees. As of
2004, a paid employee earned, on average, $43,000, while a self-
employed person earned, on average, close to $38,000.
� When comparing the stability of self-employment to paid-employment,
somewhat surprisingly, the average tenure of self-employed positions
rose by more than 10% since 1997 and it is now at its highest level in
30 years. Furthermore, at an average tenure of approximately 135
months (or more than 11 years), self-employed positions last 35%
longer than those in paid-employment.
� A large number of small business owners are “serial entrepreneurs”, with
one-in-three entrepreneurs (33%) having owned, or currently owning,
more than one business. The growth in the number of serial entrepreneurs
is expected to continue.
� During the past 18 months, paid-employment in small firms (companies
with fewer than 20 employees) rose by 2%. At the same time,
employment in large firms (companies with more than 20 employees)
rose by 1.6%. In fact, during the year ending March 2005, small business
generated one-quarter of all new paid-employment positions in the
economy.
� The direct impact of the rising dollar on small businesses is limited, given
that, on average, two-thirds (66%) of their business comes from inside
the small business owners’ city and 20% from elsewhere in their
province. Only a small proportion of their business comes from outside
the small business owner’s province within Canada (6%), from the US
(6%) or from international sources (3%).
� Overall, we expect the Canadian dollar to trade at the $0.80-$0.85 (US)
level in the foreseeable future. While at this valuation many small firms
will hardly be impacted, one should not ignore the significant damage of
4For Love or Money? A Study of Entrepreneurship in Canada
EXECUTIVE SUMMARY, CONTINUED
the dollar appreciation on sectors and regions that rely heavily on
manufacturing and on exports to the US. Heavy machinery, the auto
sector and primary industries are some examples.
� Not surprisingly, 70% of entrepreneurs indicate that the increase in
gasoline prices has had an impact on their businesses. The majority
(64%) report that rising gas prices have had a negative impact on their
business, while 6% report a positive impact. Those who say that gas
prices have had a negative impact on their business report an average
revenue decrease of 15%.
� The most significant improvement in small business activity in 2004 was
in British Columbia, with the number of establishments with less than
20 employees rising by a strong 4.1%.
� Ontario has seen the second fastest pace of small business formation
in 2004, with the number of firms with less than 20 employees rising by
3.8%.
� Alberta, home to nearly 15% of Canadian small businesses, also showed
strong growth in business formation, which was 2.5% in 2004, reflecting
the positive spin-offs from the energy sector as well as robust consumer
spending.
� Most of the growth in small business formation during 2004 was in large
urban centres, with the number of firms in rural areas rising by only 1.8%
during the year.
� Recent challenges have not disrupted the forces driving small business
formation. We expect 150,000 Canadians to become entrepreneurs in
the next two years. Nearly one in four Canadians (24%) say they will be
self-employed at some point in the next five years.
5For Love or Money? A Study of Entrepreneurship in Canada
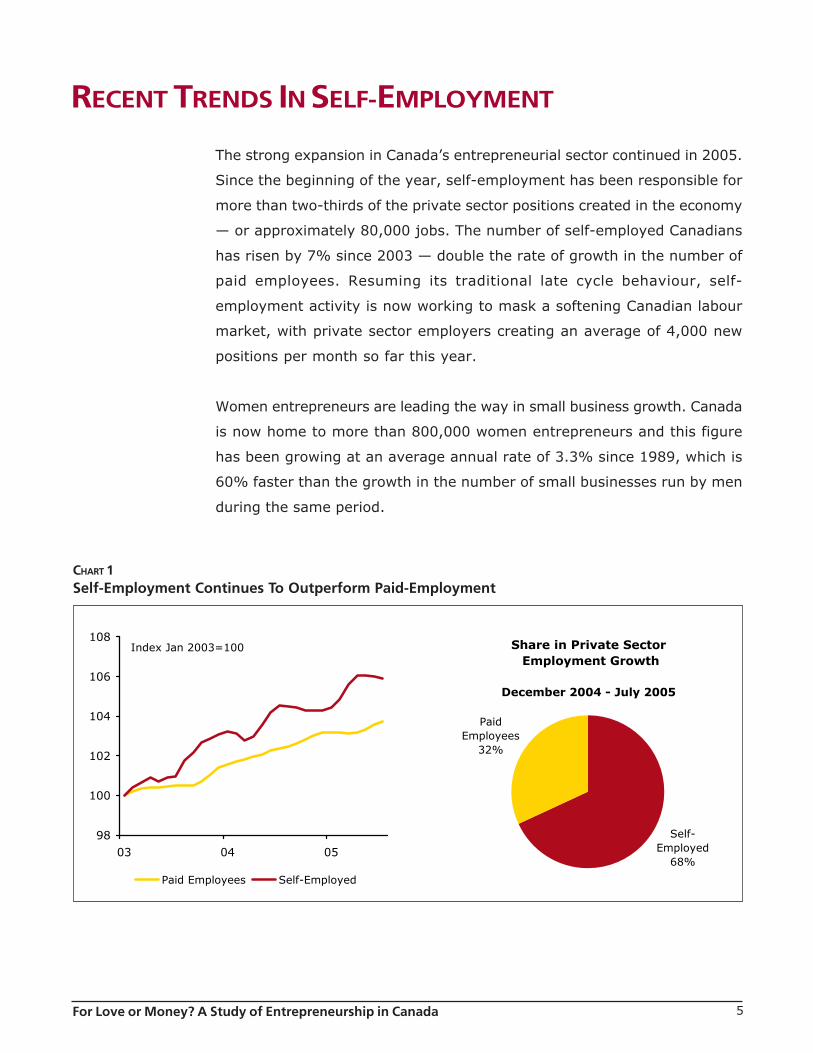
The strong expansion in Canada’s entrepreneurial sector continued in 2005.
Since the beginning of the year, self-employment has been responsible for
more than two-thirds of the private sector positions created in the economy
— or approximately 80,000 jobs. The number of self-employed Canadians
has risen by 7% since 2003 — double the rate of growth in the number of
paid employees. Resuming its traditional late cycle behaviour, self-
employment activity is now working to mask a softening Canadian labour
market, with private sector employers creating an average of 4,000 new
positions per month so far this year.
Women entrepreneurs are leading the way in small business growth. Canada
is now home to more than 800,000 women entrepreneurs and this figure
has been growing at an average annual rate of 3.3% since 1989, which is
60% faster than the growth in the number of small businesses run by men
during the same period.
RECENT TRENDS IN SELF-EMPLOYMENT
CHART 1Self-Employment Continues To Outperform Paid-Employment
98
100
102
104
106
108
03 04 05
Paid Employees Self-Employed
Index Jan 2003=100 Share in Private Sector Employment Growth
December 2004 - July 2005
Self-Employed
68%
Paid Employees
32%
6For Love or Money? A Study of Entrepreneurship in Canada
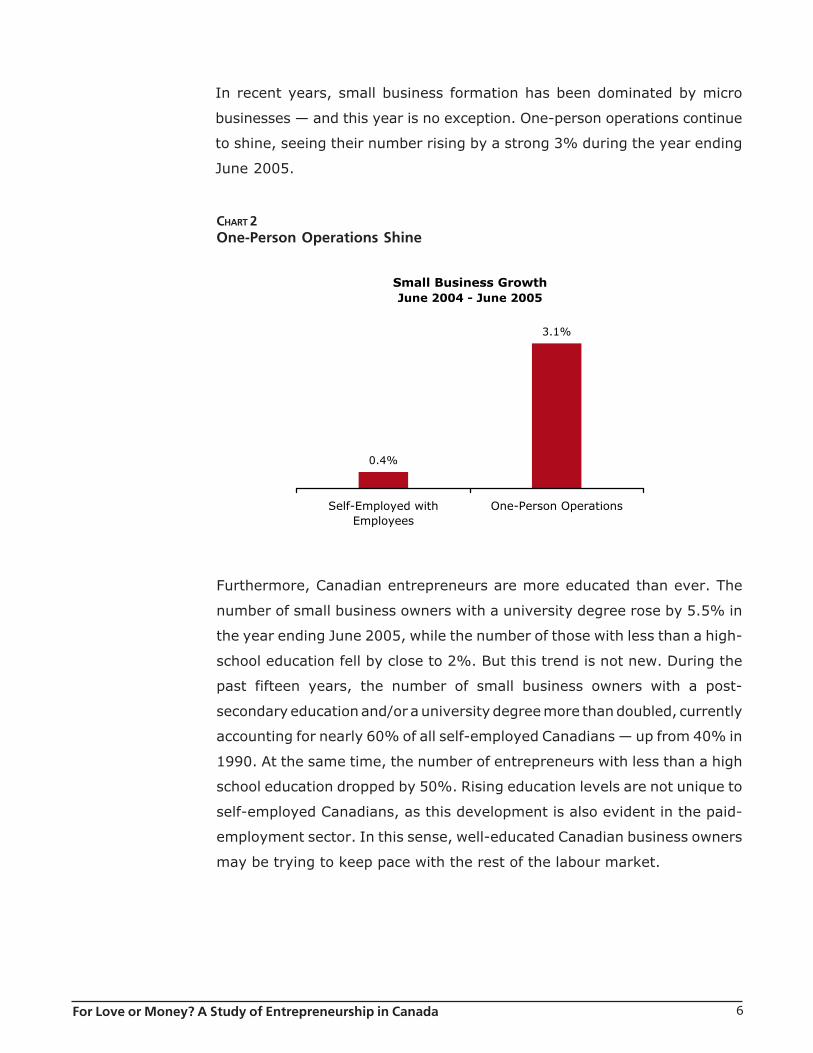
CHART 2One-Person Operations Shine
In recent years, small business formation has been dominated by micro
businesses — and this year is no exception. One-person operations continue
to shine, seeing their number rising by a strong 3% during the year ending
June 2005.
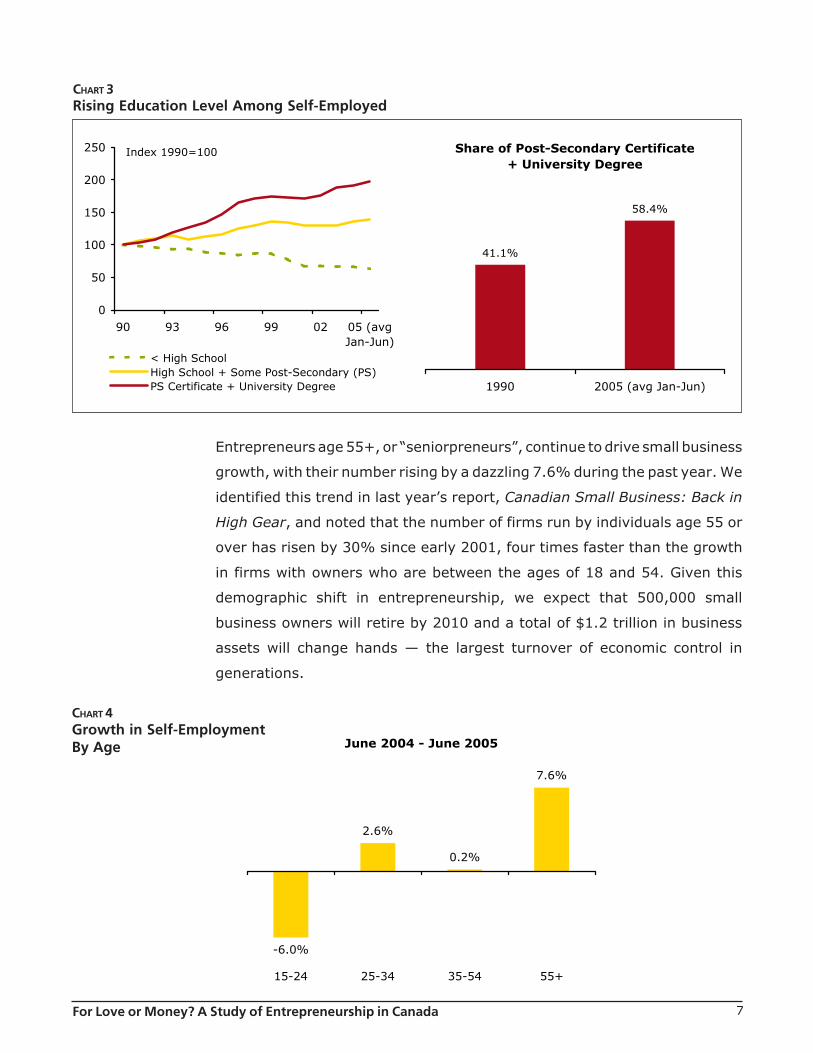
Furthermore, Canadian entrepreneurs are more educated than ever. The
number of small business owners with a university degree rose by 5.5% in
the year ending June 2005, while the number of those with less than a high-
school education fell by close to 2%. But this trend is not new. During the
past fifteen years, the number of small business owners with a post-
secondary education and/or a university degree more than doubled, currently
accounting for nearly 60% of all self-employed Canadians — up from 40% in
1990. At the same time, the number of entrepreneurs with less than a high
school education dropped by 50%. Rising education levels are not unique to
self-employed Canadians, as this development is also evident in the paid-
employment sector. In this sense, well-educated Canadian business owners
may be trying to keep pace with the rest of the labour market.
Small Business GrowthJune 2004 - June 2005
0.4%
3.1%
Self-Employed withEmployees
One-Person Operations
7For Love or Money? A Study of Entrepreneurship in Canada
CHART 3Rising Education Level Among Self-Employed
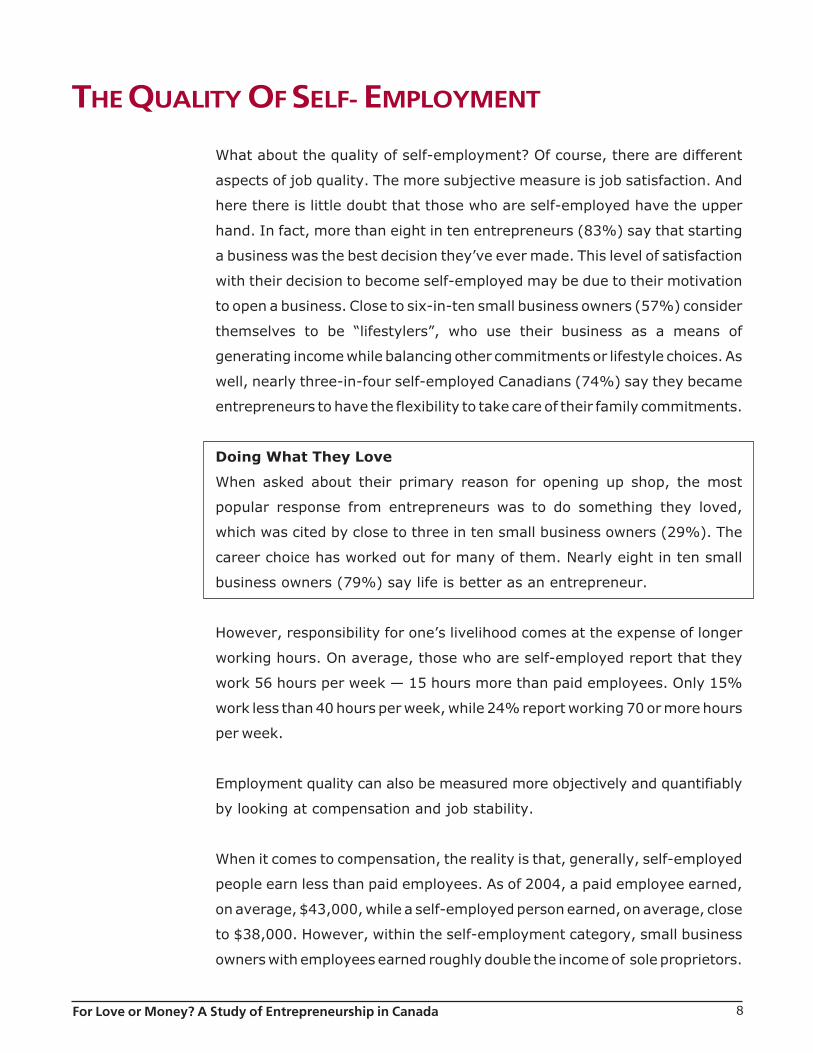
Entrepreneurs age 55+, or “seniorpreneurs”, continue to drive small business
growth, with their number rising by a dazzling 7.6% during the past year. We
identified this trend in last year’s report, Canadian Small Business: Back in
High Gear, and noted that the number of firms run by individuals age 55 or
over has risen by 30% since early 2001, four times faster than the growth
in firms with owners who are between the ages of 18 and 54. Given this
demographic shift in entrepreneurship, we expect that 500,000 small
business owners will retire by 2010 and a total of $1.2 trillion in business
assets will change hands — the largest turnover of economic control in
generations.
CHART 4Growth in Self-EmploymentBy Age June 2004 - June 2005
-6.0%
2.6%
0.2%
7.6%
15-24 25-34 35-54 55+
0
50
100
150
200
250
90 93 96 99 02 05 (avgJan-Jun)
< High SchoolHigh School + Some Post-Secondary (PS)PS Certificate + University Degree
Index 1990=100 Share of Post-Secondary Certificate + University Degree
41.1%
58.4%
1990 2005 (avg Jan-Jun)
8For Love or Money? A Study of Entrepreneurship in Canada
What about the quality of self-employment? Of course, there are different
aspects of job quality. The more subjective measure is job satisfaction. And
here there is little doubt that those who are self-employed have the upper
hand. In fact, more than eight in ten entrepreneurs (83%) say that starting
a business was the best decision they’ve ever made. This level of satisfaction
with their decision to become self-employed may be due to their motivation
to open a business. Close to six-in-ten small business owners (57%) consider
themselves to be “lifestylers”, who use their business as a means of
generating income while balancing other commitments or lifestyle choices. As
well, nearly three-in-four self-employed Canadians (74%) say they became
entrepreneurs to have the flexibility to take care of their family commitments.
Doing What They Love
When asked about their primary reason for opening up shop, the most
popular response from entrepreneurs was to do something they loved,
which was cited by close to three in ten small business owners (29%). The
career choice has worked out for many of them. Nearly eight in ten small
business owners (79%) say life is better as an entrepreneur.
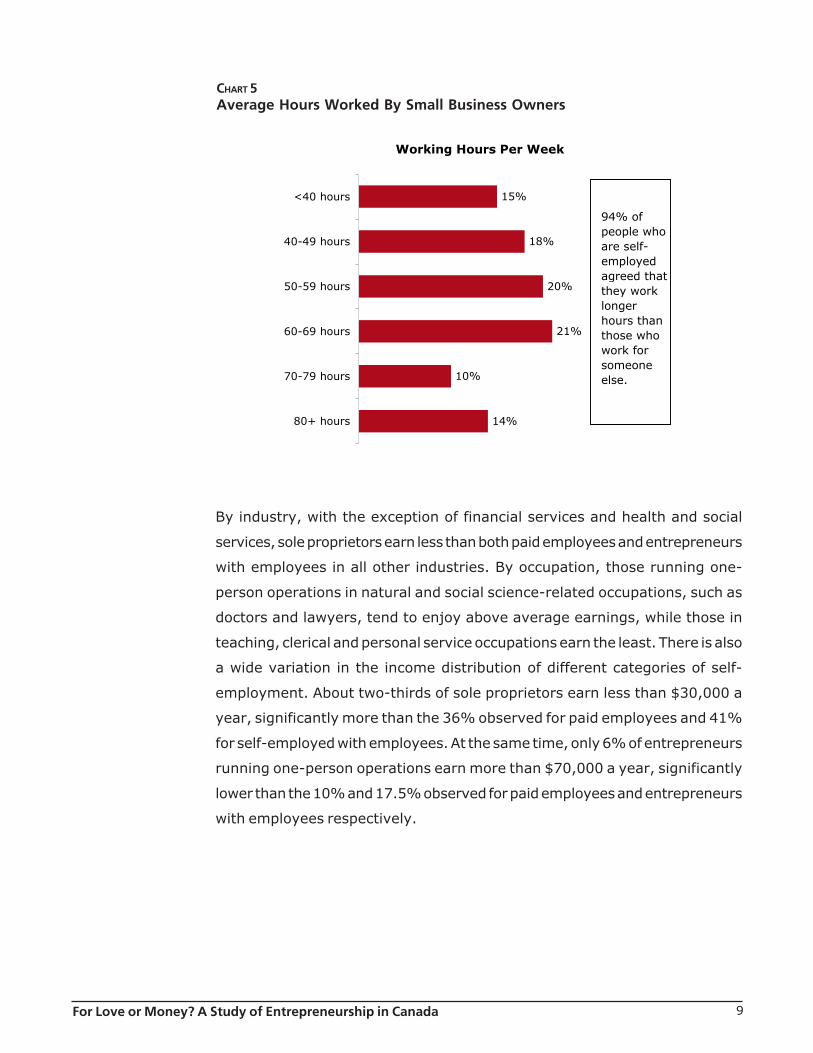
However, responsibility for one’s livelihood comes at the expense of longer
working hours. On average, those who are self-employed report that they
work 56 hours per week — 15 hours more than paid employees. Only 15%
work less than 40 hours per week, while 24% report working 70 or more hours
per week.
Employment quality can also be measured more objectively and quantifiably
by looking at compensation and job stability.
When it comes to compensation, the reality is that, generally, self-employed
people earn less than paid employees. As of 2004, a paid employee earned,
on average, $43,000, while a self-employed person earned, on average, close
to $38,000. However, within the self-employment category, small business
owners with employees earned roughly double the income of sole proprietors.
THE QUALITY OF SELF- EMPLOYMENT
9For Love or Money? A Study of Entrepreneurship in Canada
CHART 5Average Hours Worked By Small Business Owners
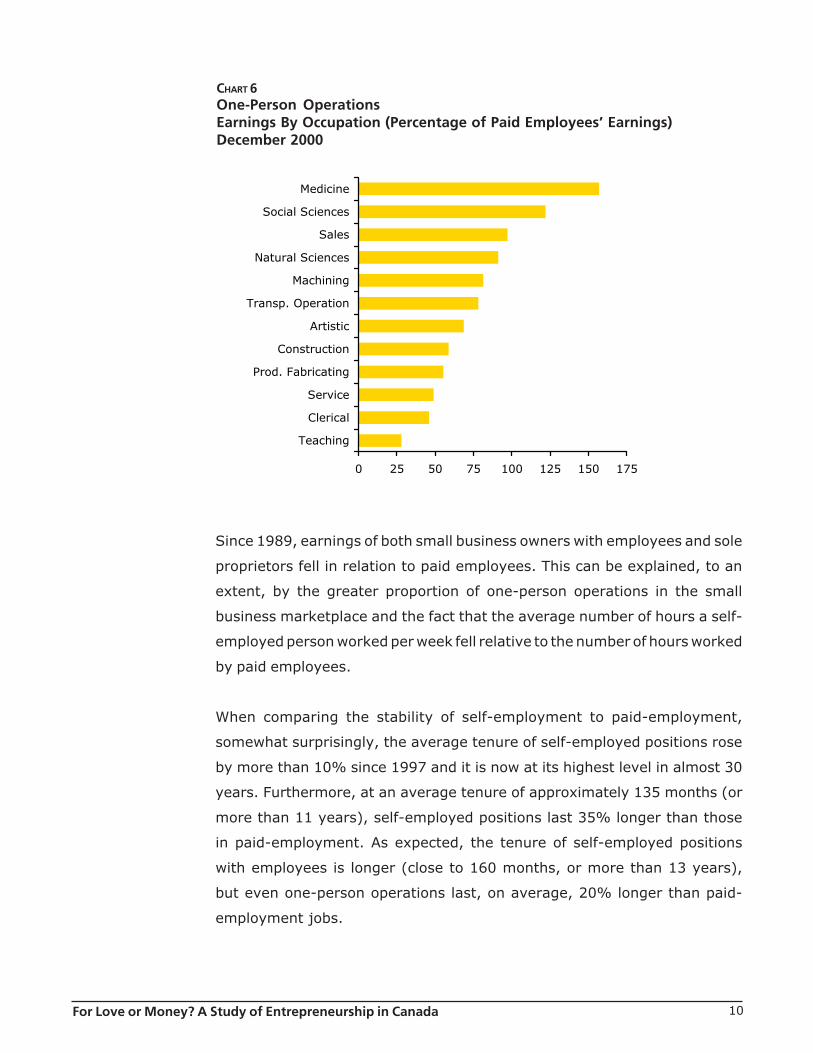
By industry, with the exception of financial services and health and social
services, sole proprietors earn less than both paid employees and entrepreneurs
with employees in all other industries. By occupation, those running one-
person operations in natural and social science-related occupations, such as
doctors and lawyers, tend to enjoy above average earnings, while those in
teaching, clerical and personal service occupations earn the least. There is also
a wide variation in the income distribution of different categories of self-
employment. About two-thirds of sole proprietors earn less than $30,000 a
year, significantly more than the 36% observed for paid employees and 41%
for self-employed with employees. At the same time, only 6% of entrepreneurs
running one-person operations earn more than $70,000 a year, significantly
lower than the 10% and 17.5% observed for paid employees and entrepreneurs
with employees respectively.
Working Hours Per Week
15%
18%
20%
21%
10%
14%
<40 hours
40-49 hours
50-59 hours
60-69 hours
70-79 hours
80+ hours
94% of people who are self-employed agreed that they work longer hours than those who work for someone else.
10For Love or Money? A Study of Entrepreneurship in Canada
Since 1989, earnings of both small business owners with employees and sole
proprietors fell in relation to paid employees. This can be explained, to an
extent, by the greater proportion of one-person operations in the small
business marketplace and the fact that the average number of hours a self-
employed person worked per week fell relative to the number of hours worked
by paid employees.
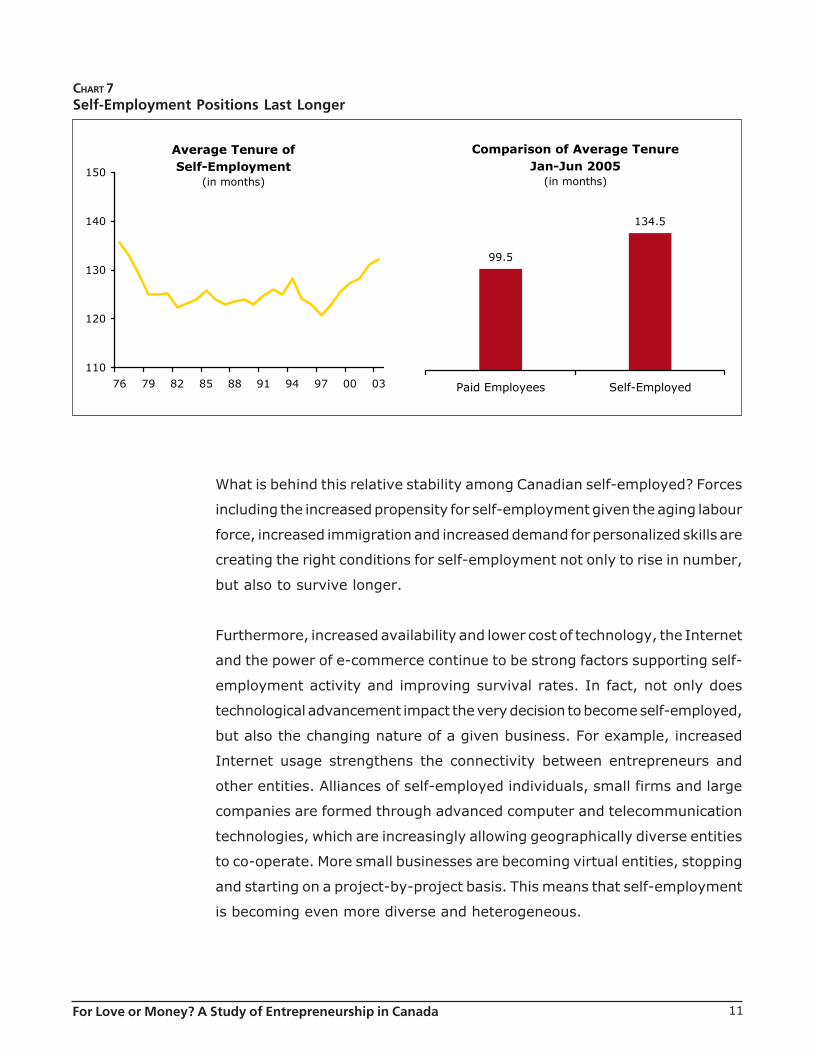
When comparing the stability of self-employment to paid-employment,
somewhat surprisingly, the average tenure of self-employed positions rose
by more than 10% since 1997 and it is now at its highest level in almost 30
years. Furthermore, at an average tenure of approximately 135 months (or
more than 11 years), self-employed positions last 35% longer than those
in paid-employment. As expected, the tenure of self-employed positions
with employees is longer (close to 160 months, or more than 13 years),
but even one-person operations last, on average, 20% longer than paid-
employment jobs.
CHART 6One-Person OperationsEarnings By Occupation (Percentage of Paid Employees’ Earnings)December 2000
0 25 50 75 100 125 150 175
Medicine
Social Sciences
Sales
Natural Sciences
Machining
Transp. Operation
Artistic
Construction
Prod. Fabricating
Service
Clerical
Teaching
11For Love or Money? A Study of Entrepreneurship in Canada
CHART 7Self-Employment Positions Last Longer
What is behind this relative stability among Canadian self-employed? Forces
including the increased propensity for self-employment given the aging labour
force, increased immigration and increased demand for personalized skills are
creating the right conditions for self-employment not only to rise in number,
but also to survive longer.
Furthermore, increased availability and lower cost of technology, the Internet
and the power of e-commerce continue to be strong factors supporting self-
employment activity and improving survival rates. In fact, not only does
technological advancement impact the very decision to become self-employed,
but also the changing nature of a given business. For example, increased
Internet usage strengthens the connectivity between entrepreneurs and
other entities. Alliances of self-employed individuals, small firms and large
companies are formed through advanced computer and telecommunication
technologies, which are increasingly allowing geographically diverse entities
to co-operate. More small businesses are becoming virtual entities, stopping
and starting on a project-by-project basis. This means that self-employment
is becoming even more diverse and heterogeneous.
Average Tenure ofSelf-Employment
(in months)
110
120
130
140
150
76 79 82 85 88 91 94 97 00 03
Comparison of Average TenureJan-Jun 2005
(in months)
99.5
134.5
Paid Employees Self-Employed
12For Love or Money? A Study of Entrepreneurship in Canada
CHART 8Nature of Business Changed Since Inception
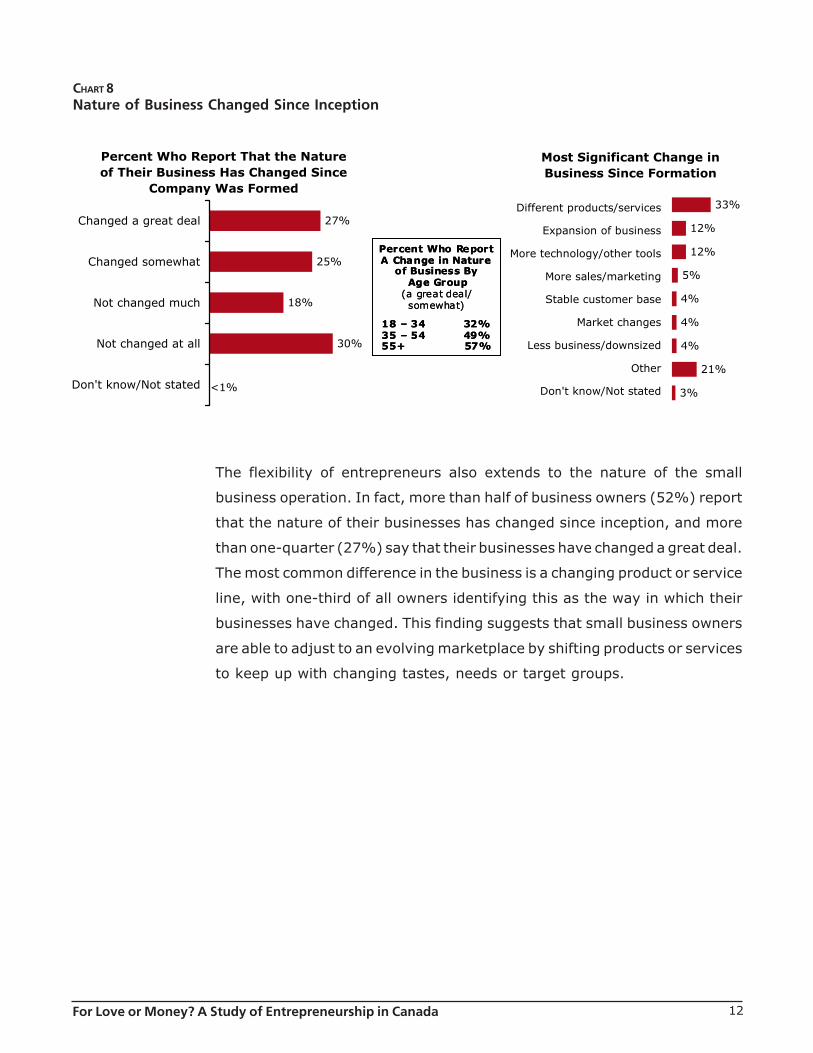
The flexibility of entrepreneurs also extends to the nature of the small
business operation. In fact, more than half of business owners (52%) report
that the nature of their businesses has changed since inception, and more
than one-quarter (27%) say that their businesses have changed a great deal.
The most common difference in the business is a changing product or service
line, with one-third of all owners identifying this as the way in which their
businesses have changed. This finding suggests that small business owners
are able to adjust to an evolving marketplace by shifting products or services
to keep up with changing tastes, needs or target groups.
Percent Who Report That the Nature of Their Business Has Changed Since
Company Was Formed
27%
25%
18%
30%
Changed a great deal
Changed somewhat
Not changed much
Not changed at all
Don't know/Not stated <1%
Most Significant Change inBusiness Since Formation
33%
12%
12%
5%
4%
4%
4%
21%
3%
Different products/services
Expansion of business
More technology/other tools
More sales/marketing
Stable customer base
Market changes
Less business/downsized
Other
Don't know/Not stated
Percent Who Report A Change in Nature
of Business ByAge Group
(a great deal/somewhat)
18 – 34 32%35 – 54 49%55+ 57%
Percent Who Report A Change in Nature
of Business ByAge Group
(a great deal/somewhat)
18 – 34 32%35 – 54 49%55+ 57%
13For Love or Money? A Study of Entrepreneurship in Canada
SERIAL ENTREPRENEURS
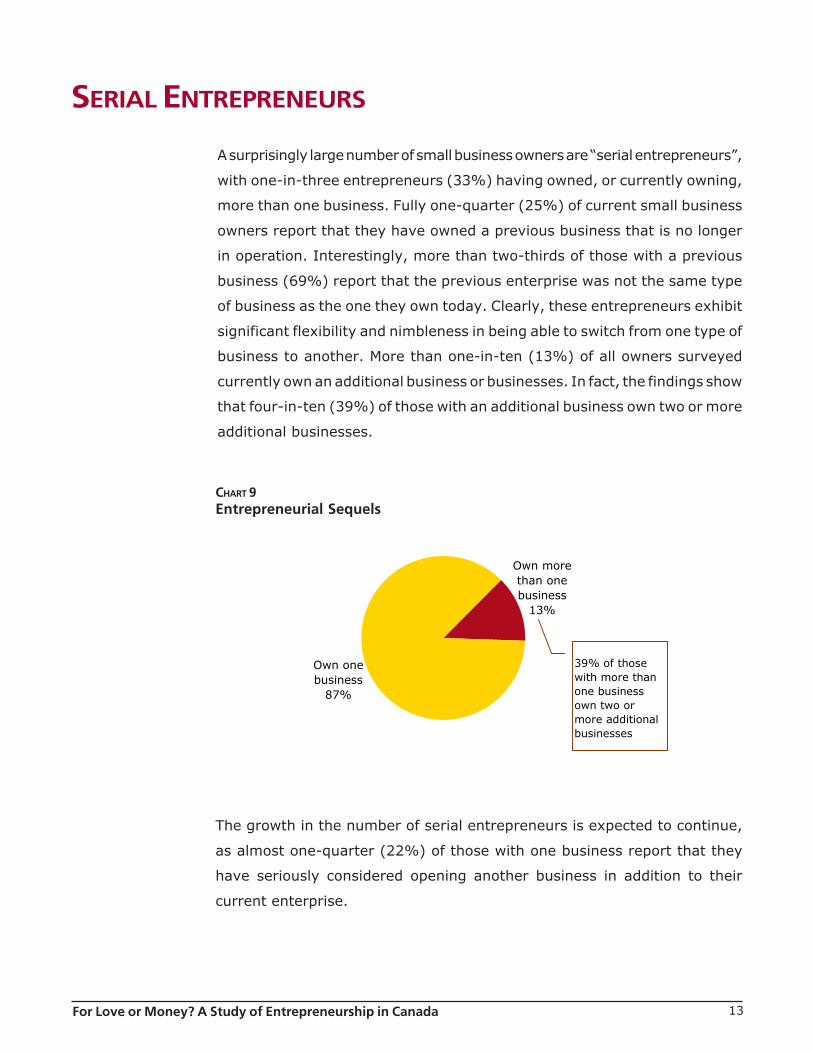
A surprisingly large number of small business owners are “serial entrepreneurs”,
with one-in-three entrepreneurs (33%) having owned, or currently owning,
more than one business. Fully one-quarter (25%) of current small business
owners report that they have owned a previous business that is no longer
in operation. Interestingly, more than two-thirds of those with a previous
business (69%) report that the previous enterprise was not the same type
of business as the one they own today. Clearly, these entrepreneurs exhibit
significant flexibility and nimbleness in being able to switch from one type of
business to another. More than one-in-ten (13%) of all owners surveyed
currently own an additional business or businesses. In fact, the findings show
that four-in-ten (39%) of those with an additional business own two or more
additional businesses.
CHART 9Entrepreneurial Sequels
The growth in the number of serial entrepreneurs is expected to continue,
as almost one-quarter (22%) of those with one business report that they
have seriously considered opening another business in addition to their
current enterprise.
Own one business
87%
Own more than one business
13%
39% of those with more than one business own two or more additional businesses
14For Love or Money? A Study of Entrepreneurship in Canada
The ability of entrepreneurs to adapt to changing circumstances is also
reflected in the improved survival rate of small businesses. Business
bankruptcies have been falling over the past two years, with the cumulative
number of business bankruptcies down by more than 7% year over year, as
of July 2005. With the exception of Atlantic Canada, all provinces continue to
experience declining business bankruptcies, with Alberta leading the way.
15For Love or Money? A Study of Entrepreneurship in Canada
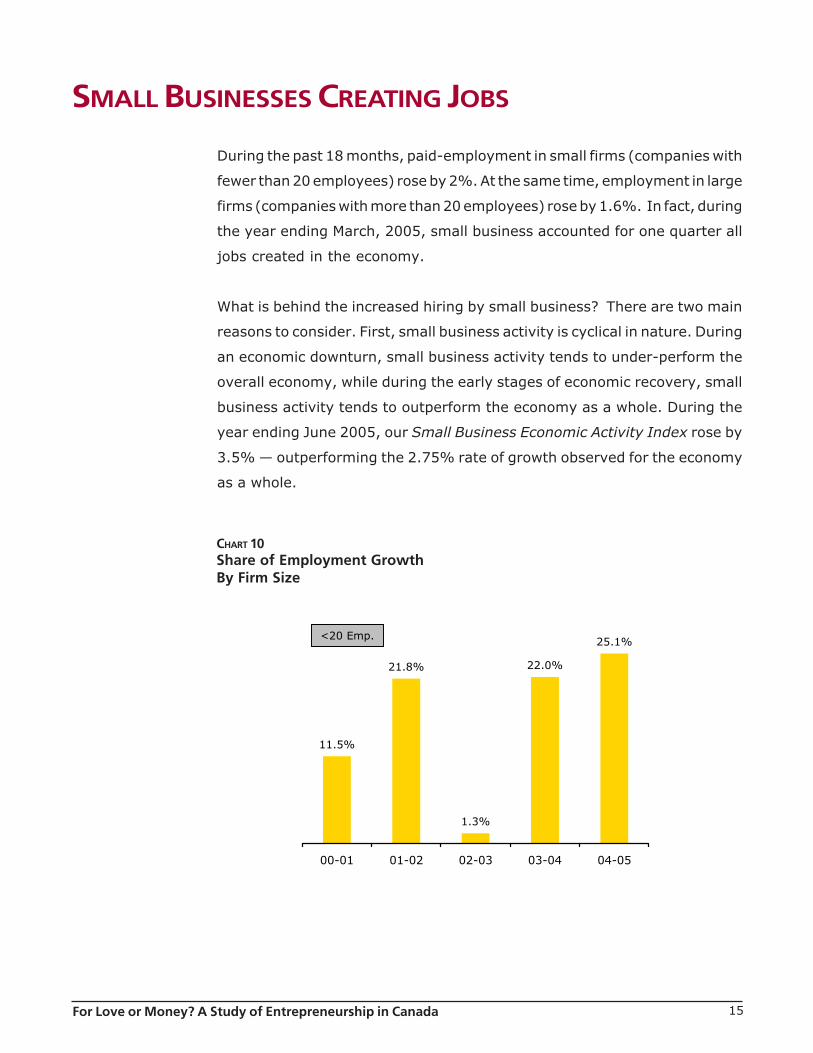
SMALL BUSINESSES CREATING JOBS
During the past 18 months, paid-employment in small firms (companies with
fewer than 20 employees) rose by 2%. At the same time, employment in large
firms (companies with more than 20 employees) rose by 1.6%. In fact, during
the year ending March, 2005, small business accounted for one quarter all
jobs created in the economy.
What is behind the increased hiring by small business? There are two main
reasons to consider. First, small business activity is cyclical in nature. During
an economic downturn, small business activity tends to under-perform the
overall economy, while during the early stages of economic recovery, small
business activity tends to outperform the economy as a whole. During the
year ending June 2005, our Small Business Economic Activity Index rose by
3.5% — outperforming the 2.75% rate of growth observed for the economy
as a whole.
CHART 10Share of Employment GrowthBy Firm Size
11.5%
21.8%
1.3%
22.0%
25.1%
00-01 01-02 02-03 03-04 04-05
<20 Emp.
16For Love or Money? A Study of Entrepreneurship in Canada
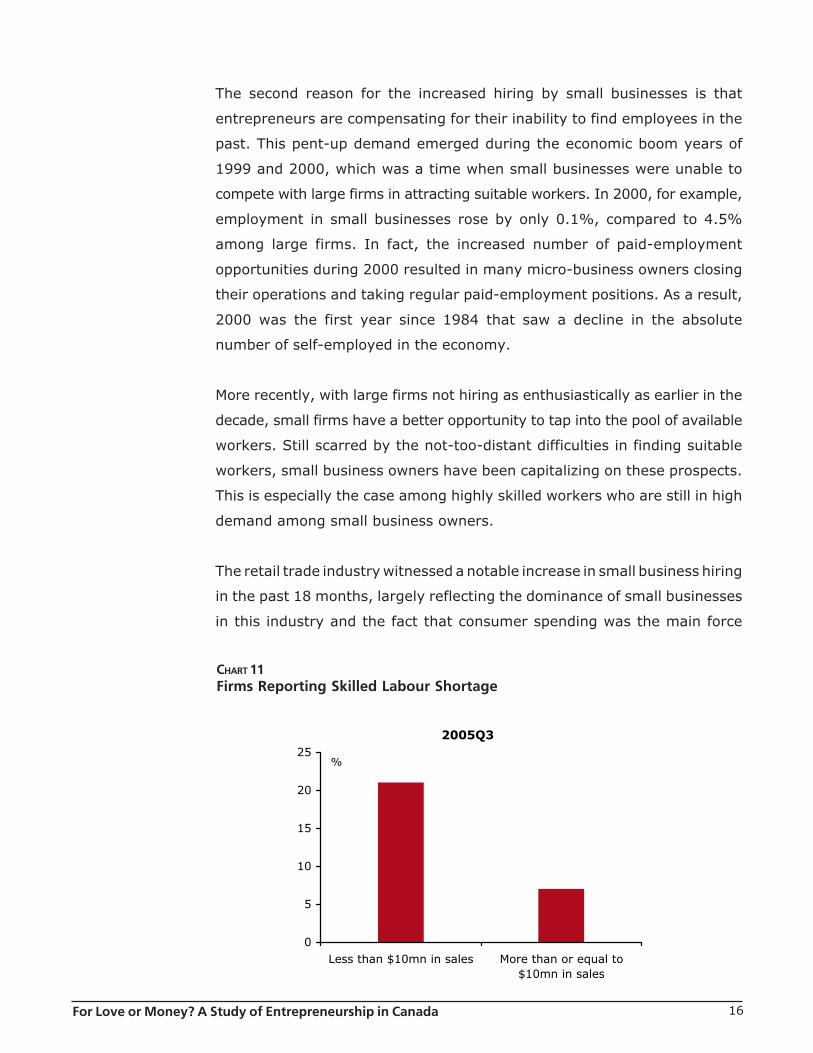
CHART 11Firms Reporting Skilled Labour Shortage
The second reason for the increased hiring by small businesses is that
entrepreneurs are compensating for their inability to find employees in the
past. This pent-up demand emerged during the economic boom years of
1999 and 2000, which was a time when small businesses were unable to
compete with large firms in attracting suitable workers. In 2000, for example,
employment in small businesses rose by only 0.1%, compared to 4.5%
among large firms. In fact, the increased number of paid-employment
opportunities during 2000 resulted in many micro-business owners closing
their operations and taking regular paid-employment positions. As a result,
2000 was the first year since 1984 that saw a decline in the absolute
number of self-employed in the economy.
More recently, with large firms not hiring as enthusiastically as earlier in the
decade, small firms have a better opportunity to tap into the pool of available
workers. Still scarred by the not-too-distant difficulties in finding suitable
workers, small business owners have been capitalizing on these prospects.
This is especially the case among highly skilled workers who are still in high
demand among small business owners.
The retail trade industry witnessed a notable increase in small business hiring
in the past 18 months, largely reflecting the dominance of small businesses
in this industry and the fact that consumer spending was the main force
2005Q3
0
5
10
15
20
25
Less than $10mn in sales More than or equal to$10mn in sales
%
17For Love or Money? A Study of Entrepreneurship in Canada
keeping the economy afloat. Interestingly, the recent growth in small business
employees was limited almost exclusively to young workers (between the ages
of 15 and 24) and those over the age of 45.
Small businesses have traditionally been an important source of employment
for young Canadians, so it is hardly surprisingly that there has been a recent
increase in small business employment among the age group 15-24. The
strong increase in the number of people age 45+ working in small businesses
is more interesting. This may well be connected to recent changes in the labour
market, with small businesses capitalizing on the increased supply of
experienced workers. Regardless of the reason, the fact that small businesses
are now able to hire high-skilled and experienced workers is a positive sign
for their growth prospects.
18For Love or Money? A Study of Entrepreneurship in Canada
FACING CHALLENGES
Small business owners in Canada have had to withstand a number of shocks
in recent years. With SARS and Mad Cow disease in the not too distant past,
small business owners have had to deal with the Canadian dollar continuing
to soar, along with oil prices. The impact of these challenges has varied
regionally and by sector, but small businesses continue to show resiliency.
TTTTTHE HE HE HE HE SSSSSOARING OARING OARING OARING OARING CCCCCANADIAN ANADIAN ANADIAN ANADIAN ANADIAN DDDDDOLLAROLLAROLLAROLLAROLLAR
The sharp appreciation of the Canadian dollar over the past few years has
raised concerns about its potential negative impact on the Canadian economy
in general, and the manufacturing sector in particular. These concerns are
justifiable given the speed and the magnitude of the dollar’s appreciation. A
strong dollar is particularly harmful to small businesses that export their
products to the US market and to those firms that have direct links to larger
exporting firms. Having said that, the direct impact of the rising dollar on small
businesses is limited, given that, on average, two-thirds (66%) of their
business comes from inside the small business owners’ city and 20% from
elsewhere in their province. Only a small proportion of their business comes
from outside the small business owner’s province within Canada (6%), from
the US (6%) or from international sources (3%). Vulnerability to increased
import penetration and reduced tourism are also important negatives for the
small business sector. At the same time, the increase in the value of the dollar
means cheaper imports — a clear positive for small firms that import raw
materials and finished goods.
Approximately one in four small firms in Canada are in sectors that are
directly impacted by a stronger dollar. But one should not lose sight of the
indirect impact of a stronger currency (for example, a lawyer experiencing
less business from their main client, an exporting firm). All of this is
consistent with our survey results. Two-thirds (66%) of the small business
owners polled say that the rising Canadian dollar has had no real impact on
their business. This is consistent with the fact that only 9% of small business
19For Love or Money? A Study of Entrepreneurship in Canada
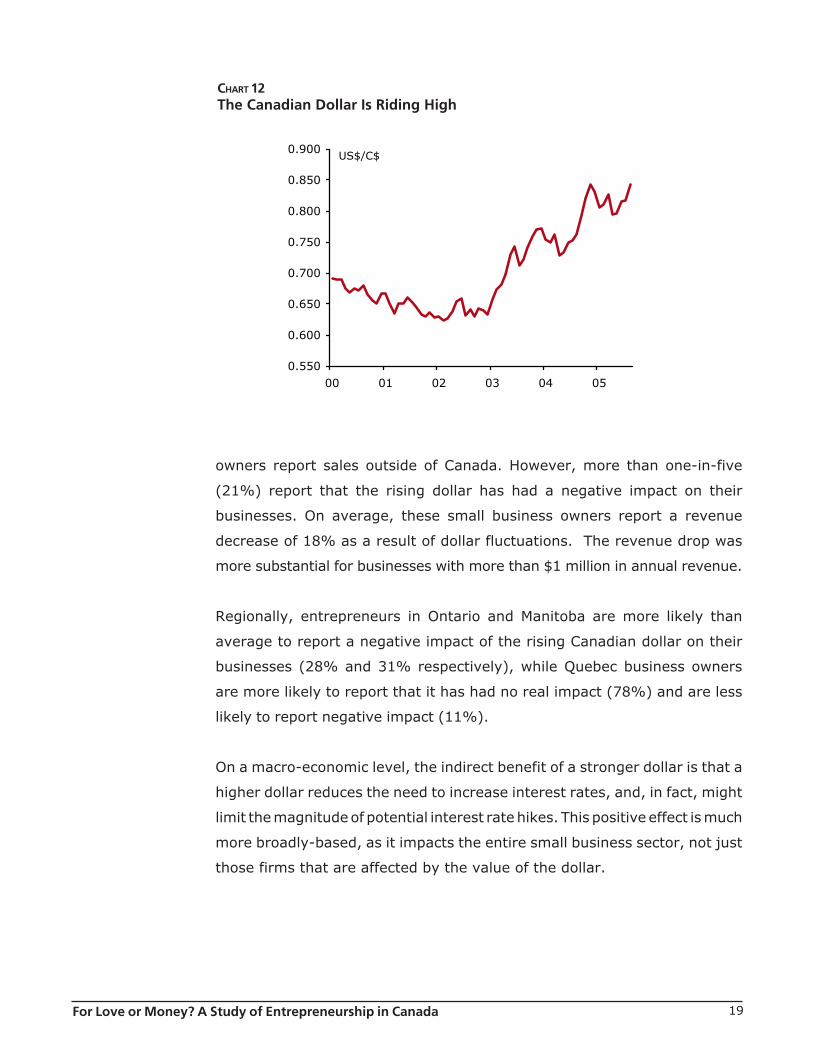
CHART 12The Canadian Dollar Is Riding High
owners report sales outside of Canada. However, more than one-in-five
(21%) report that the rising dollar has had a negative impact on their
businesses. On average, these small business owners report a revenue
decrease of 18% as a result of dollar fluctuations. The revenue drop was
more substantial for businesses with more than $1 million in annual revenue.
Regionally, entrepreneurs in Ontario and Manitoba are more likely than
average to report a negative impact of the rising Canadian dollar on their
businesses (28% and 31% respectively), while Quebec business owners
are more likely to report that it has had no real impact (78%) and are less
likely to report negative impact (11%).
On a macro-economic level, the indirect benefit of a stronger dollar is that a
higher dollar reduces the need to increase interest rates, and, in fact, might
limit the magnitude of potential interest rate hikes. This positive effect is much
more broadly-based, as it impacts the entire small business sector, not just
those firms that are affected by the value of the dollar.
0.550
0.600
0.650
0.700
0.750
0.800
0.850
0.900
00 01 02 03 04 05
US$/C$
20For Love or Money? A Study of Entrepreneurship in Canada
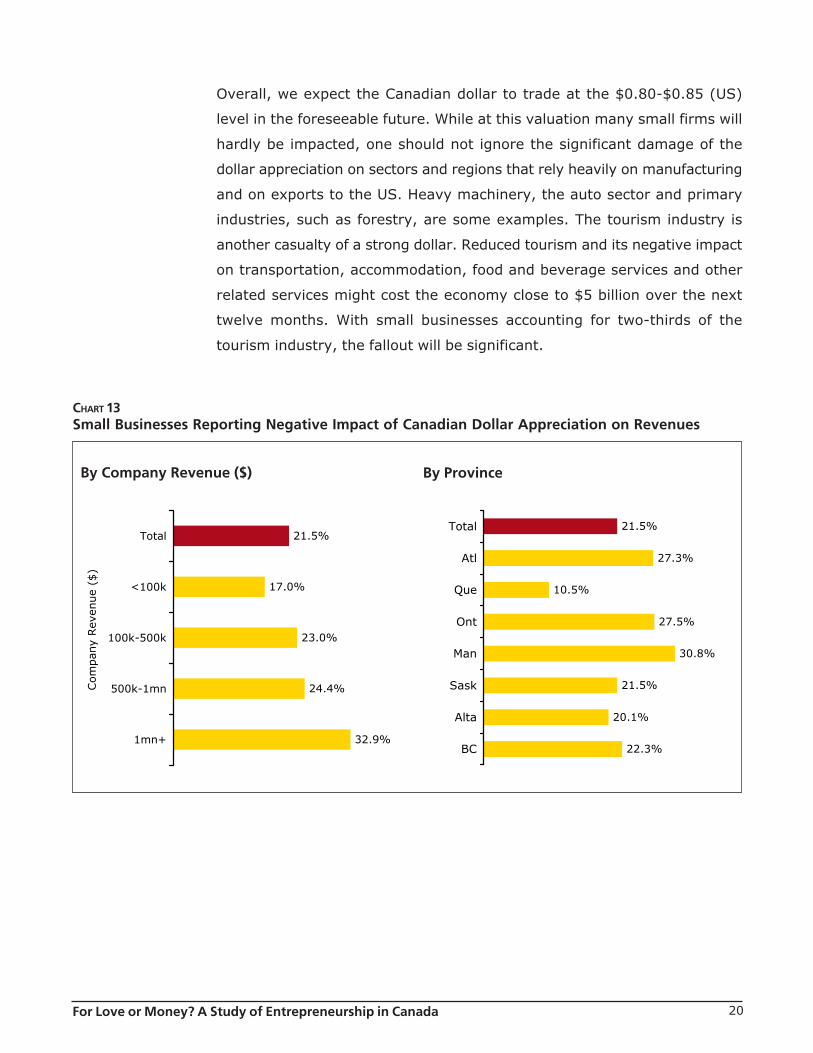
CHART 13Small Businesses Reporting Negative Impact of Canadian Dollar Appreciation on Revenues
Overall, we expect the Canadian dollar to trade at the $0.80-$0.85 (US)
level in the foreseeable future. While at this valuation many small firms will
hardly be impacted, one should not ignore the significant damage of the
dollar appreciation on sectors and regions that rely heavily on manufacturing
and on exports to the US. Heavy machinery, the auto sector and primary
industries, such as forestry, are some examples. The tourism industry is
another casualty of a strong dollar. Reduced tourism and its negative impact
on transportation, accommodation, food and beverage services and other
related services might cost the economy close to $5 billion over the next
twelve months. With small businesses accounting for two-thirds of the
tourism industry, the fallout will be significant.
21.5%
17.0%
23.0%
24.4%
32.9%
Total
<100k
100k-500k
500k-1mn
1mn+
Com
pan
y Rev
enue
($)
21.5%
27.3%
10.5%
27.5%
30.8%
21.5%
20.1%
22.3%
Total
Atl
Que
Ont
Man
Sask
Alta
BC
By Company Revenue ($) By Province
21For Love or Money? A Study of Entrepreneurship in Canada
RRRRRISING ISING ISING ISING ISING OOOOOIL AND IL AND IL AND IL AND IL AND GGGGGAS AS AS AS AS PPPPPRICESRICESRICESRICESRICES
The real story about oil prices is not that they are elevated now, but that they
will remain elevated 12 months from now. Hurricanes Katrina and Rita, as well
as geopolitical events have no doubt contributed to the recent upswing in
energy prices, but what really makes them market movers is the fact that
today’s hikes are not triggered by sudden supply disruptions like the 1973
or 1979 oil shocks. Instead, they follow from the collision between surging
global crude oil demand and accelerating depletion of conventional crude oil
supply.
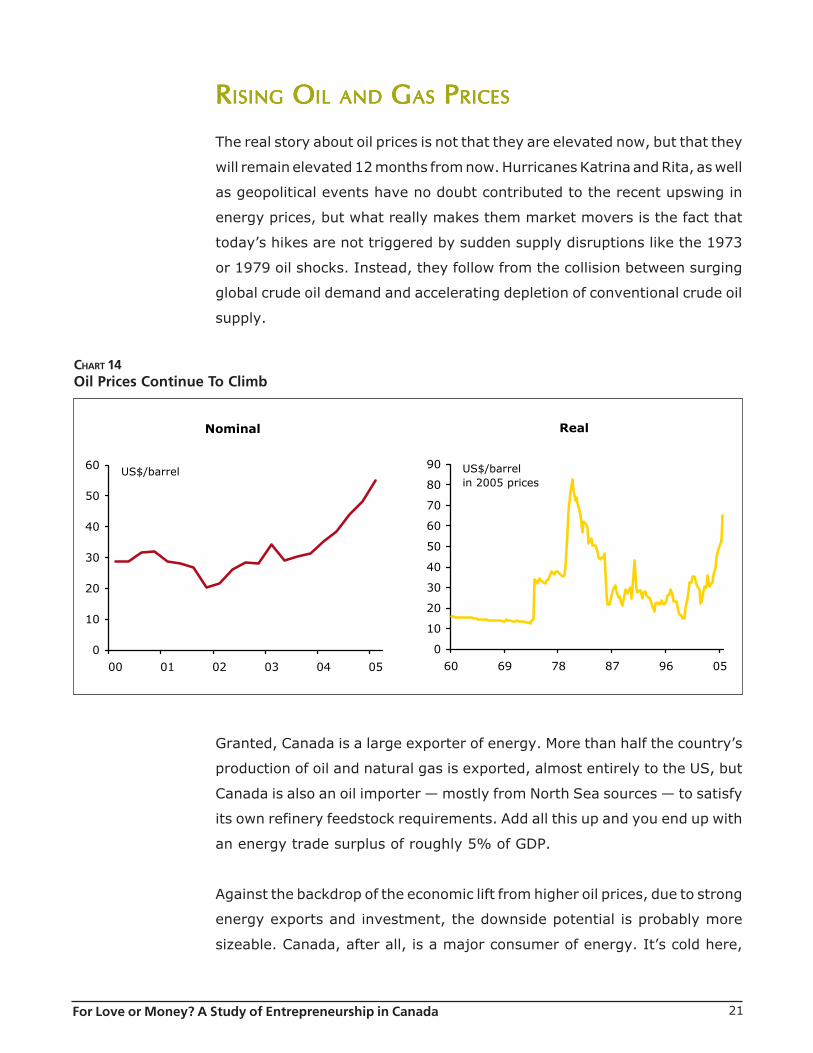
CHART 14Oil Prices Continue To Climb
Nominal
0
10
20
30
40
50
60
00 01 02 03 04 05
US$/barrel
Real
0
10
20
30
40
50
60
70
80
90
60 69 78 87 96 05
US$/barrelin 2005 prices
Granted, Canada is a large exporter of energy. More than half the country’s
production of oil and natural gas is exported, almost entirely to the US, but
Canada is also an oil importer — mostly from North Sea sources — to satisfy
its own refinery feedstock requirements. Add all this up and you end up with
an energy trade surplus of roughly 5% of GDP.
Against the backdrop of the economic lift from higher oil prices, due to strong
energy exports and investment, the downside potential is probably more
sizeable. Canada, after all, is a major consumer of energy. It’s cold here,
22For Love or Money? A Study of Entrepreneurship in Canada
distances between major urban centres are relatively large, and the country’s
resource sectors use a lot of energy. Indeed, per capita energy consumption
in Canada is double that of the G-7 average and roughly 20% higher than in
the US.
The structure of the Canadian non-energy manufacturing sector makes it
highly energy-intensive. Heavy energy-utilizing industries, such as paper
products, primary metals and wood products, account for more than half the
sector’s energy-weighted output. And with the manufacturing sector five
times larger than the energy sector in Canada, higher energy prices will
constrain growth in aggregate industrial production.
That damage, however, is only secondary to the cost endured by Canadian
households where the pain is immediate and largely unavoidable. During the
first nine months of the year, Canadians spent more than $8 billion of extra
cash just to fill their gas tanks — an amount that taxed away one-third of their
wage growth. If oil prices average $60 per barrel, drivers would be forced to
increase their spending on gasoline by an additional $6-7 billion in the coming
twelve months, with reduced buying elsewhere, including small business
products and services. Overall, we expect higher oil prices to trim GDP growth
by more than half a percentage point, which would largely neutralize the
combined benefit derived from rising energy exports, royalties and investment,
leaving the economy, on balance, exposed to the damaging blow of an oil-
driven slowdown in the American economy.
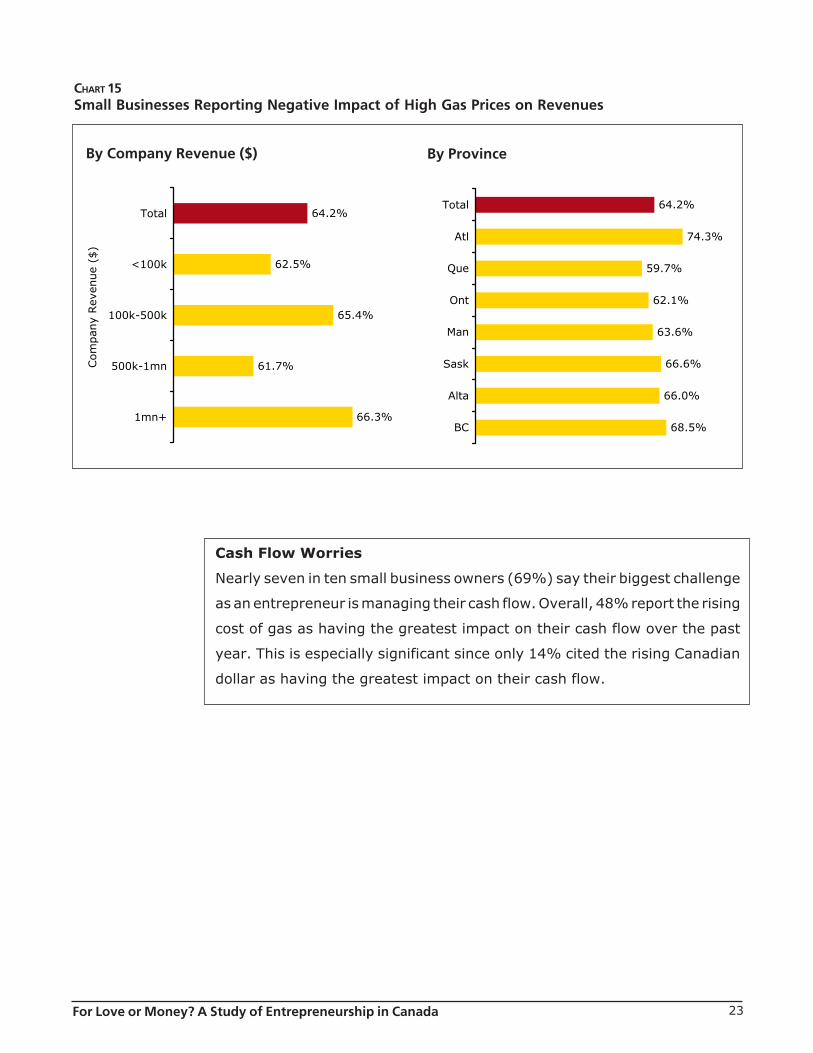
Not surprisingly, in a survey conducted in mid-summer 2005, 70% of
entrepreneurs indicate that the increase in gasoline prices has had an impact
on their businesses. The majority (64%) report that rising gas prices have
had a negative impact on their business, while 6% report a positive impact.
Those who say that gas prices have had a negative impact on their business
report an average revenue decrease of 15%.
Business owners in the Atlantic provinces are more likely than average to
report a negative net impact of rising gas prices (74%) and those in Quebec
are more likely to report that it had no real impact (34%).
23For Love or Money? A Study of Entrepreneurship in Canada
Cash Flow Worries
Nearly seven in ten small business owners (69%) say their biggest challenge
as an entrepreneur is managing their cash flow. Overall, 48% report the rising
cost of gas as having the greatest impact on their cash flow over the past
year. This is especially significant since only 14% cited the rising Canadian
dollar as having the greatest impact on their cash flow.
CHART 15Small Businesses Reporting Negative Impact of High Gas Prices on Revenues
64.2%
62.5%
65.4%
61.7%
66.3%
Total
<100k
100k-500k
500k-1mn
1mn+
Com
pan
y Rev
enue
($)
64.2%
74.3%
59.7%
62.1%
63.6%
66.6%
66.0%
68.5%
Total
Atl
Que
Ont
Man
Sask
Alta
BC
By ProvinceBy Company Revenue ($)
24For Love or Money? A Study of Entrepreneurship in Canada
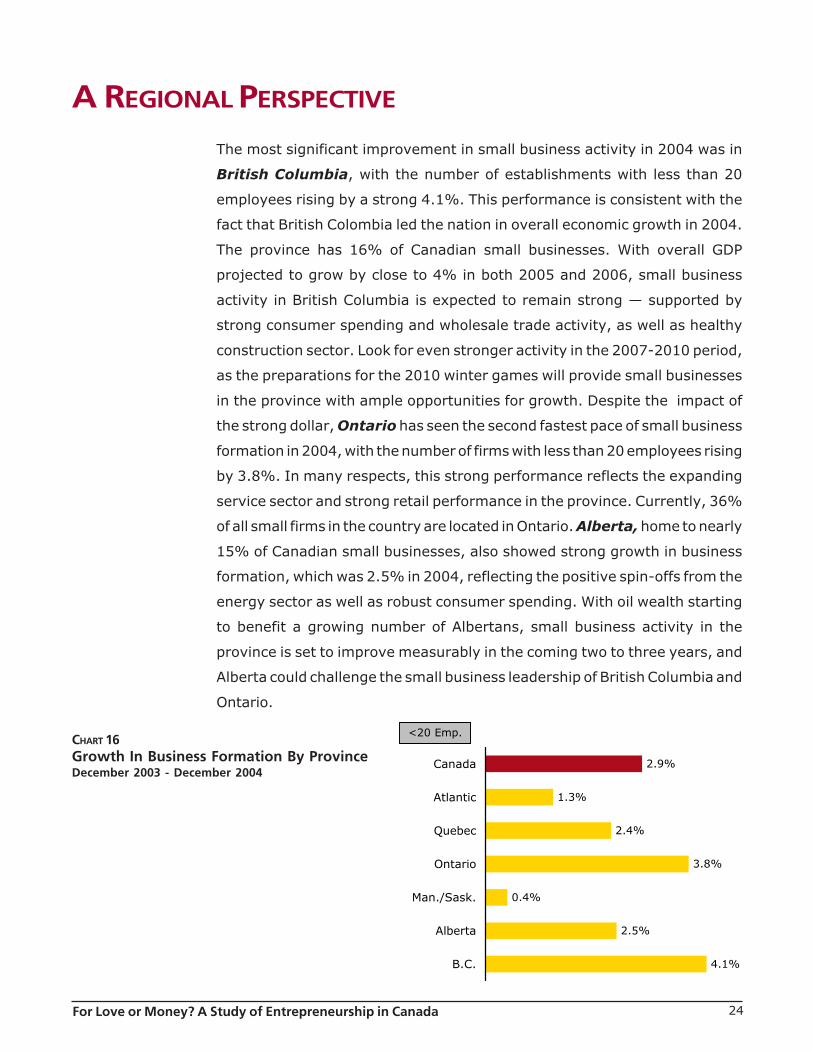
A REGIONAL PERSPECTIVE
The most significant improvement in small business activity in 2004 was in
British Columbia, with the number of establishments with less than 20
employees rising by a strong 4.1%. This performance is consistent with the
fact that British Colombia led the nation in overall economic growth in 2004.
The province has 16% of Canadian small businesses. With overall GDP
projected to grow by close to 4% in both 2005 and 2006, small business
activity in British Columbia is expected to remain strong — supported by
strong consumer spending and wholesale trade activity, as well as healthy
construction sector. Look for even stronger activity in the 2007-2010 period,
as the preparations for the 2010 winter games will provide small businesses
in the province with ample opportunities for growth. Despite the impact of
the strong dollar, Ontario has seen the second fastest pace of small business
formation in 2004, with the number of firms with less than 20 employees rising
by 3.8%. In many respects, this strong performance reflects the expanding
service sector and strong retail performance in the province. Currently, 36%
of all small firms in the country are located in Ontario. Alberta, home to nearly
15% of Canadian small businesses, also showed strong growth in business
formation, which was 2.5% in 2004, reflecting the positive spin-offs from the
energy sector as well as robust consumer spending. With oil wealth starting
to benefit a growing number of Albertans, small business activity in the
province is set to improve measurably in the coming two to three years, and
Alberta could challenge the small business leadership of British Columbia and
Ontario.
CHART 16Growth In Business Formation By ProvinceDecember 2003 - December 2004
2.9%
1.3%
2.4%
3.8%
0.4%
2.5%
4.1%
Canada
Atlantic
Quebec
Ontario
Man./Sask.
Alberta
B.C.
<20 Emp.
25For Love or Money? A Study of Entrepreneurship in Canada
TABLE 1Business Formation By Province
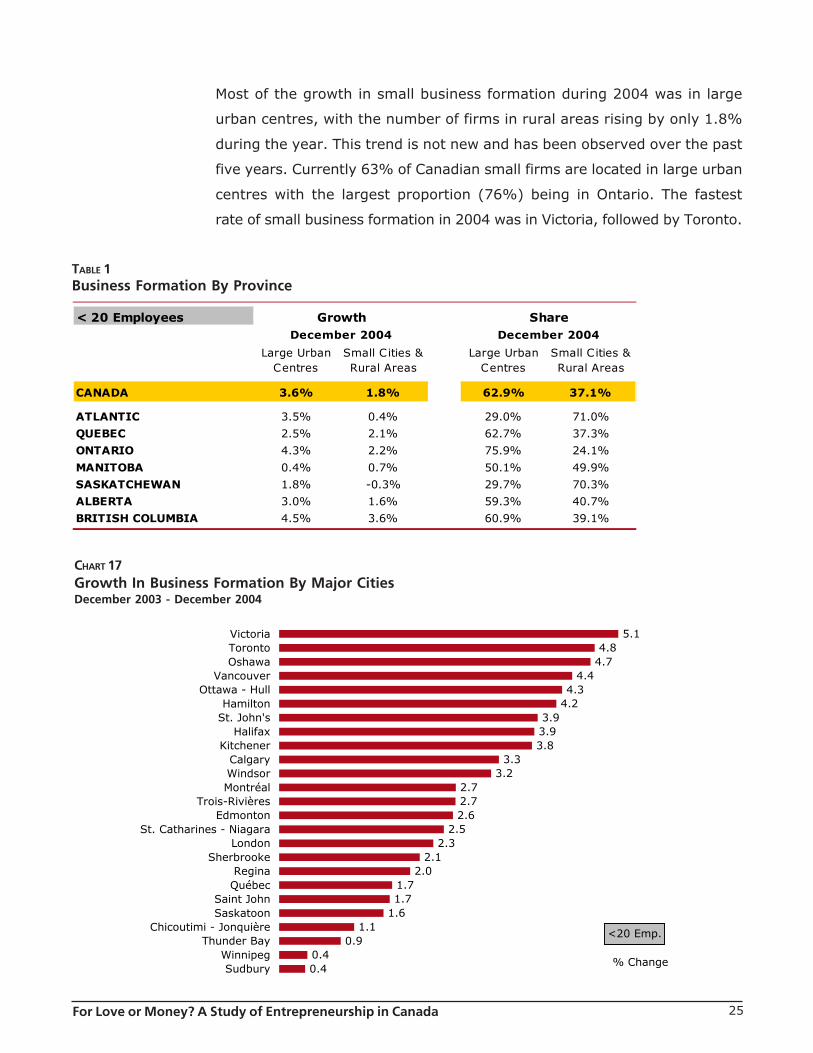
Most of the growth in small business formation during 2004 was in large
urban centres, with the number of firms in rural areas rising by only 1.8%
during the year. This trend is not new and has been observed over the past
five years. Currently 63% of Canadian small firms are located in large urban
centres with the largest proportion (76%) being in Ontario. The fastest
rate of small business formation in 2004 was in Victoria, followed by Toronto.
CHART 17Growth In Business Formation By Major CitiesDecember 2003 - December 2004
< 20 EmployeesDecember 2004 December 2004
Large Urban Small Cities & Large Urban Small Cities &Centres Rural Areas Centres Rural Areas
CANADA 3.6% 1.8% 62.9% 37.1%
ATLANTIC 3.5% 0.4% 29.0% 71.0%
QUEBEC 2.5% 2.1% 62.7% 37.3%
ONTARIO 4.3% 2.2% 75.9% 24.1%
MANITOBA 0.4% 0.7% 50.1% 49.9%
SASKATCHEWAN 1.8% -0.3% 29.7% 70.3%
ALBERTA 3.0% 1.6% 59.3% 40.7%
BRITISH COLUMBIA 4.5% 3.6% 60.9% 39.1%
Growth Share
5.14.8
4.74.4
4.34.2
3.93.93.8
3.33.2
2.72.72.6
2.52.3
2.12.0
1.71.7
1.61.1
0.90.40.4
VictoriaTorontoOshawa
VancouverOttawa - Hull
HamiltonSt. John's
HalifaxKitchener
CalgaryWindsorMontréal
Trois-RivièresEdmonton
St. Catharines - NiagaraLondon
SherbrookeReginaQuébec
Saint JohnSaskatoon
Chicoutimi - JonquièreThunder Bay
WinnipegSudbury
% Change
<20 Emp.
26For Love or Money? A Study of Entrepreneurship in Canada
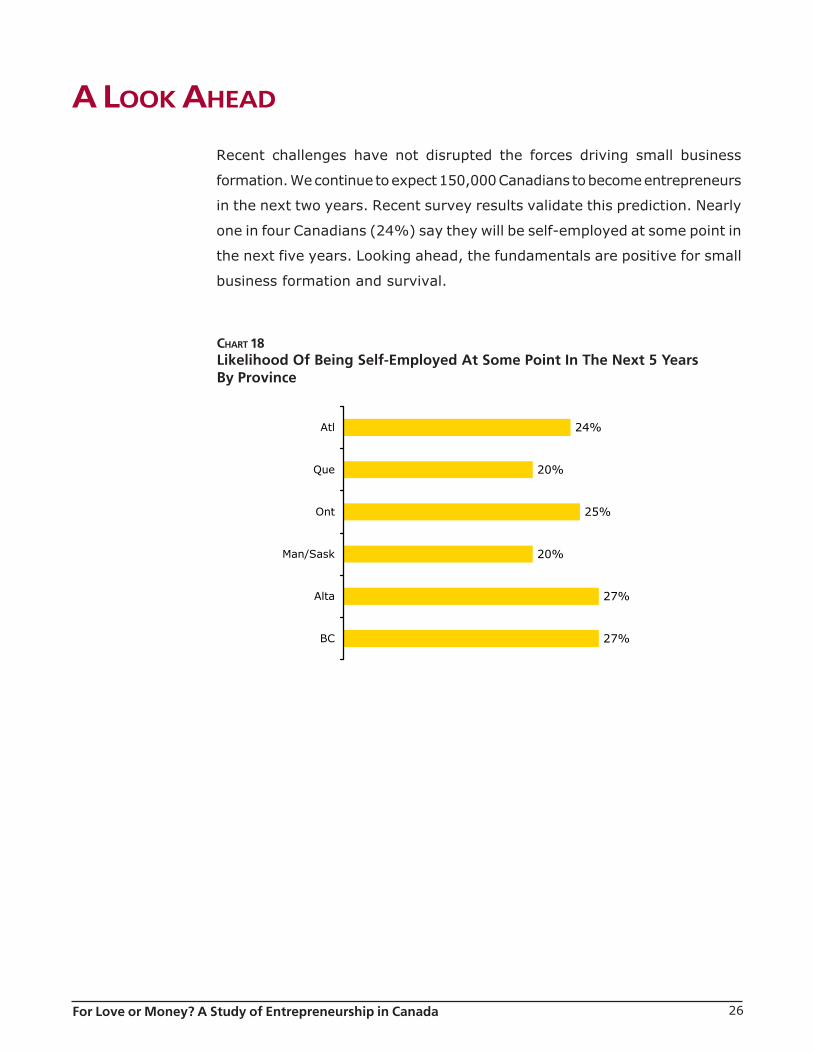
A LOOK AHEAD
Recent challenges have not disrupted the forces driving small business
formation. We continue to expect 150,000 Canadians to become entrepreneurs
in the next two years. Recent survey results validate this prediction. Nearly
one in four Canadians (24%) say they will be self-employed at some point in
the next five years. Looking ahead, the fundamentals are positive for small
business formation and survival.
CHART 18Likelihood Of Being Self-Employed At Some Point In The Next 5 YearsBy Province
24%
20%
25%
20%
27%
27%
Atl
Que
Ont
Man/Sask
Alta
BC
27For Love or Money? A Study of Entrepreneurship in Canada
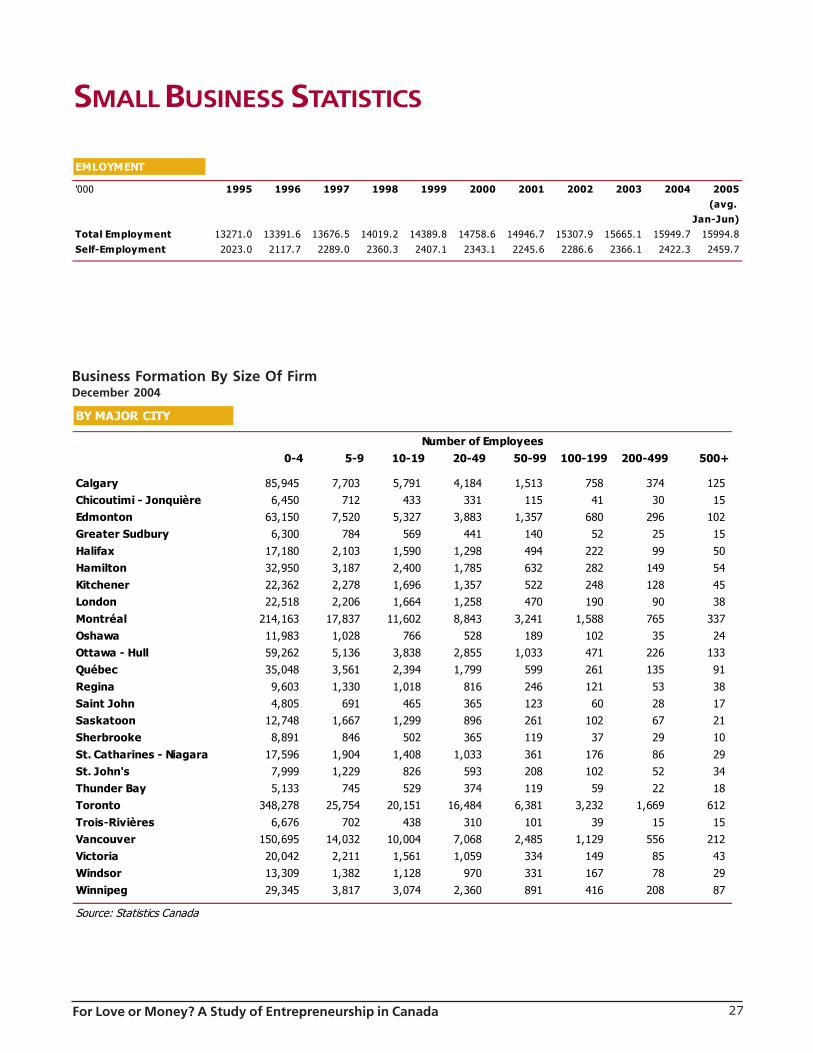
SMALL BUSINESS STATISTICS
Business Formation By Size Of FirmDecember 2004
EMLOYMENT
'000 1995 1996 1997 1998 1999 2000 2001 2002 2003 2004 2005(avg.
Jan-Jun)Total Employment 13271.0 13391.6 13676.5 14019.2 14389.8 14758.6 14946.7 15307.9 15665.1 15949.7 15994.8
Self-Employment 2023.0 2117.7 2289.0 2360.3 2407.1 2343.1 2245.6 2286.6 2366.1 2422.3 2459.7
BY MAJOR CITY
Number of Employees0-4 5-9 10-19 20-49 50-99 100-199 200-499 500+
Calgary 85,945 7,703 5,791 4,184 1,513 758 374 125 Chicoutimi - Jonquière 6,450 712 433 331 115 41 30 15 Edmonton 63,150 7,520 5,327 3,883 1,357 680 296 102 Greater Sudbury 6,300 784 569 441 140 52 25 15
Halifax 17,180 2,103 1,590 1,298 494 222 99 50 Hamilton 32,950 3,187 2,400 1,785 632 282 149 54 Kitchener 22,362 2,278 1,696 1,357 522 248 128 45 London 22,518 2,206 1,664 1,258 470 190 90 38
Montréal 214,163 17,837 11,602 8,843 3,241 1,588 765 337 Oshawa 11,983 1,028 766 528 189 102 35 24 Ottawa - Hull 59,262 5,136 3,838 2,855 1,033 471 226 133 Québec 35,048 3,561 2,394 1,799 599 261 135 91
Regina 9,603 1,330 1,018 816 246 121 53 38 Saint John 4,805 691 465 365 123 60 28 17 Saskatoon 12,748 1,667 1,299 896 261 102 67 21 Sherbrooke 8,891 846 502 365 119 37 29 10
St. Catharines - Niagara 17,596 1,904 1,408 1,033 361 176 86 29 St. John's 7,999 1,229 826 593 208 102 52 34 Thunder Bay 5,133 745 529 374 119 59 22 18 Toronto 348,278 25,754 20,151 16,484 6,381 3,232 1,669 612
Trois-Rivières 6,676 702 438 310 101 39 15 15 Vancouver 150,695 14,032 10,004 7,068 2,485 1,129 556 212 Victoria 20,042 2,211 1,561 1,059 334 149 85 43 Windsor 13,309 1,382 1,128 970 331 167 78 29
Winnipeg 29,345 3,817 3,074 2,360 891 416 208 87
Source: Statistics Canada
28For Love or Money? A Study of Entrepreneurship in Canada
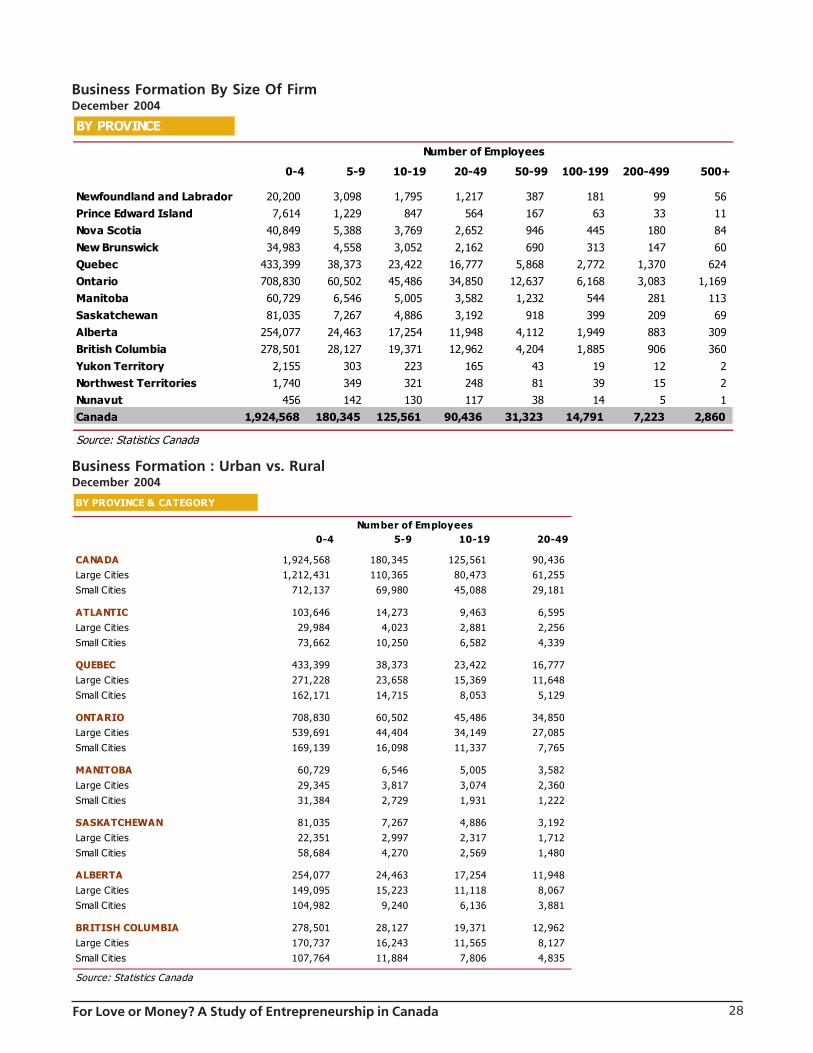
Business Formation By Size Of FirmDecember 2004
Business Formation : Urban vs. RuralDecember 2004
BY PROVINCE
Number of Employees
0-4 5-9 10-19 20-49 50-99 100-199 200-499 500+
Newfoundland and Labrador 20,200 3,098 1,795 1,217 387 181 99 56 Prince Edward Island 7,614 1,229 847 564 167 63 33 11 Nova Scotia 40,849 5,388 3,769 2,652 946 445 180 84
New Brunswick 34,983 4,558 3,052 2,162 690 313 147 60 Quebec 433,399 38,373 23,422 16,777 5,868 2,772 1,370 624 Ontario 708,830 60,502 45,486 34,850 12,637 6,168 3,083 1,169 Manitoba 60,729 6,546 5,005 3,582 1,232 544 281 113
Saskatchewan 81,035 7,267 4,886 3,192 918 399 209 69 Alberta 254,077 24,463 17,254 11,948 4,112 1,949 883 309 British Columbia 278,501 28,127 19,371 12,962 4,204 1,885 906 360
Yukon Territory 2,155 303 223 165 43 19 12 2 Northwest Territories 1,740 349 321 248 81 39 15 2 Nunavut 456 142 130 117 38 14 5 1 Canada 1,924,568 180,345 125,561 90,436 31,323 14,791 7,223 2,860
Source: Statistics Canada
BY PROVINCE & CATEGORY
Number of Employees0-4 5-9 10-19 20-49
CANADA 1,924,568 180,345 125,561 90,436 Large Cities 1,212,431 110,365 80,473 61,255 Small Cities 712,137 69,980 45,088 29,181
ATLANTIC 103,646 14,273 9,463 6,595 Large Cities 29,984 4,023 2,881 2,256 Small Cities 73,662 10,250 6,582 4,339
QUEBEC 433,399 38,373 23,422 16,777 Large Cities 271,228 23,658 15,369 11,648 Small Cities 162,171 14,715 8,053 5,129
ONTARIO 708,830 60,502 45,486 34,850 Large Cities 539,691 44,404 34,149 27,085 Small Cities 169,139 16,098 11,337 7,765
MANITOBA 60,729 6,546 5,005 3,582 Large Cities 29,345 3,817 3,074 2,360 Small Cities 31,384 2,729 1,931 1,222
SASKATCHEWAN 81,035 7,267 4,886 3,192 Large Cities 22,351 2,997 2,317 1,712 Small Cities 58,684 4,270 2,569 1,480
ALBERTA 254,077 24,463 17,254 11,948 Large Cities 149,095 15,223 11,118 8,067 Small Cities 104,982 9,240 6,136 3,881
BRITISH COLUMBIA 278,501 28,127 19,371 12,962 Large Cities 170,737 16,243 11,565 8,127 Small Cities 107,764 11,884 7,806 4,835
Source: Statistics Canada
29For Love or Money? A Study of Entrepreneurship in Canada
Conflicts of Interest: CIBC World Markets’ analysts and economists are compensated from revenues generated byvarious CIBC World Markets businesses, including CIBC World Markets’ Investment Banking Department. CIBC WorldMarkets may have a long or short position or deal as principal in the securities discussed herein, related securities orin options, futures or other derivative instruments based thereon. The reader should not rely solely on this report inevaluating whether or not to buy or sell the securities of the subject company.
Legal Matters: This report is issued and approved for distribution by (i) in Canada by CIBC World Markets Inc., amember of the IDA and CIPF, (ii) in the UK, CIBC World Markets plc, which is regulated by the FSA, and (iii) in Australia,CIBC World Markets Australia Limited, a member of the Australian Stock Exchange and regulated by the ASIC(collectively, “CIBC World Markets”). This report has not been reviewed or approved by CIBC World Markets Corp.,a member of the NYSE and SIPC, and is intended for distribution in the United States only to Major Institutional Investors(as such term is defined in SEC Rule 15a-6 and Section 15 of the Securities Act of 1934, as amended). This documentand any information contained herein are not intended for the use of private investors in the UK. The comments andviews expressed in this document are meant for the general interests of clients of CIBC World Markets Australia Limited.This report is provided for informational purposes only.This report does not take into account the investment objectives, financial situation or specific needs of any particularclient of CIBC World Markets Inc. Before making an investment decision on the basis of any information containedin this report, the recipient should consider whether such information is appropriate given the recipient’s particularinvestment needs, objectives and financial circumstances. CIBC World Markets Inc. suggests that, prior to acting onany information contained herein, you contact one of our client advisers in your jurisdiction to discuss your particularcircumstances. Since the levels and bases of taxation can change, any reference in this report to the impact of taxationshould not be construed as offering tax advice; as with any transaction having potential tax implications, clients shouldconsult with their own tax advisors. Past performance is not a guarantee of future results.The information and any statistical data contained herein were obtained from sources that we believe to be reliable,but we do not represent that they are accurate or complete, and they should not be relied upon as such. All estimatesand opinions expressed herein constitute judgements as of the date of this report and are subject to change withoutnotice.Although each company issuing this report is a wholly owned subsidiary of Canadian Imperial Bank of Commerce(“CIBC”), each is solely responsible for its contractual obligations and commitments, and any securities productsoffered or recommended to or purchased or sold in any client accounts (i) will not be insured by the Federal DepositInsurance Corporation (“FDIC”), the Canada Deposit Insurance Corporation or other similar deposit insurance, (ii) willnot be deposits or other obligations of CIBC, (iii) will not be endorsed or guaranteed by CIBC, and (iv) will be subjectto investment risks, including possible loss of the principal invested. The CIBC trademark is used under license.
© 2005 CIBC World Markets Inc. All rights reserved. Unauthorized use, distribution, duplication or disclosure withoutthe prior written permission of CIBC World Markets Inc. is prohibited by law and may result in prosecution.
Sources:CIBC World MarketsStatistics Canada2005 CIBC Small Business Outlook Poll, conducted by The Strategic CounselThe Self-Employment Study, conducted by Maritz Research
The 2005 CIBC Small Business Outlook Poll was conducted by The Strategic Counsel between July 18th andAugust 1st, 2005 and was based on a sample of 1,400 Canadian small business owners (defined as thosebusinesses having between one and fifteen employees including the owner and having revenues under $5million for the year 2004). With a sample of this size, the results are considered accurate to within ± 2.6percentage points, 19 times out of 20, of what they would have been had the entire Canadian populationof businesses with 1-15 employees been polled. The margin of error will be larger within regions and for othersub-groupings of the survey population. The sample of respondents is representative of the region, CMA andemployee size of Canada’s small businesses according to the December 2004 Business Register dataproduced by Statistics Canada.
The Self-Employment Study was conducted by Maritz Research amongst a nationally representative sampleof 2,000 Canadian adults between July 14th and 19th, 2005. With a sample of this size, the results areconsidered accurate to within +/-2.19 percentage points, 19 times out of 20, of what they would have beenhad the entire Canadian adult population been polled. The margin of error will be larger within regions,Census Metropolitan Areas, and for other sub-groupings of the survey population. The results are weightedto reflect age, gender and regional composition of the Canadian population according to the 2001 Canadiancensus. Percentages may not sum to one hundred due to rounding or the acceptance of multiple mentions.