Embed Size (px)
Citation preview

Markku Iljina GeoConsulting
Reinfjord drilling and mapping campaigns in 2012 –
geochemical observations, discussion on ore genesis and
exploration implications
for
NORDIC MINING ASA
Markku Iljina GeoConsulting Jan 17th, 2013

Markku Iljina GeoConsulting
Table of Contents
1. Executive summary...........................................................................................................................................1
2. Drilling operation 2012 .....................................................................................................................................2
3. Core logging, sampling and chemical assays ....................................................................................................3
4. Mapping and bedrock sampling 2012 ..............................................................................................................3
5. Geology of the study area ................................................................................................................................4
6. Petrological observations .................................................................................................................................5
6.1. Theoretical background ............................................................................................................................5
6.2. Reinfjord mineralogy ................................................................................................................................6
6.3. Drill hole chemistry ...................................................................................................................................8
6.4. Chemistry of surface samples ................................................................................................................ 11
6.5. Base and precious metal variations in drill holes .................................................................................. 13
7. Composition of the sulphide fraction ............................................................................................................ 16
8. Chondrite normalised six-PGE patterns ........................................................................................................ 19
9. Discussion on ore genesis .............................................................................................................................. 21
9.1. Exploration outcome ............................................................................................................................. 22
10. References ................................................................................................................................................. 23

R e i n f j o r d d r i l l i n g a n d m a p p i n g c a m p a i g n s i n 2 0 1 2 P a g e | 1
Markku Iljina GeoConsulting
1. Executive summary The drilling programme was targeted to get geological information on the conductor suggested by the
interpretations based on SkyTEM helicopter survey and ground-TEM measurements. Drilling was supported
by concurrent drill hole TEM measurements and later by mapping and surface sampling campaign.
Drilling encountered two metal enriched sections, one enriched in base metals (BM), especially in nickel,
and the other more enriched in Platinum-Group Elements (PGE). These mineralised sections are in Reef
position, which was formerly unknown mineralisation type in the Reinfjord Intrusion. Following average
metal concentrations are calculated for the two intersections:
Hole ID From To Meters Nickel Copper Cobalt Gold Palladium Platinum PGE+Au Sulphur (m) (m) (m) % % % g/t g/t g/t g/t %
RF-1 86 93 7 0.38 0.12 0.02 0.03 0.03 0.03 0.09 0.61
RF-1* 107.75 117 9.25 0.27 0.06 0.02 0.07 0.20 0.15 0.42 0.58
*including 107.75 113 5.25 0.24 0.05 0.01 0.10 0.31 0.23 0.64 0.41
Following metal and mineral concentrations can be calculated from the sulphide specific assay results for
the composition of the sulphide fraction:
Element concentrations BM section PGE section
Average of 86-88 m and 91-93 m
Average of 107-113 m
Fe 42.9 wt.% 47.9 wt.%
Ni 14.7 11.7
Cu 7.1 4.5
Co 0.4 0.4
S 34.9 35.6
Au+Pd+Pt 6.9 ppm 50.6 ppm
Mineral compositions
Pyrrhotite 35.5 wt.% 51.9 wt.%
Pentlandite 44.0 35.3
Chalcopyrite 20.5 12.9
Amount of sulphides in the rock
1.6 wt.% 1.2 wt.%
Calculated metal concentrations suggest good quality for composite sulphide concentrate in sulphide
flotation, if that is assumed for concentration method. Ni and Cu concentrations in the sulphide fraction are
also irrespective of the total amount of sulphides. This leads positive expectations as finding of more
sulphides would consequently mean higher Ni and Cu concentrations in the same respect.
Surface sampling didn’t reveal any PGE enrichments. This and the structural interpretation based on
outcrop observations suggest that at least the PGE enriched section does not outcrop on the present
erosion surface. Proposed genesis model (Fig. 12) calls for dissolution sulphides into an immiscible siliceous
R e i n f j o r d d r i l l i n g a n d m a p p i n g c a m p a i g n s i n 2 0 1 2 P a g e | 2
Markku Iljina GeoConsulting
and volatile enriched melt phase passing through sulphide bearing Central Series magma followed by
precipitation of metals as the upward rising melts encountered more impermeable roof of partially
consolidated Layered Series. This suggests the bottom of the Layered Series to control the mineralisation
and further exploration to target this structural environment. The stratigraphic level or site where Central
Series magma reached sulphide saturation forms another target for exploration.
Comparison of the six-PGE patterns of the Reinfjord and Lokkarfjord PGE enrichments refer similar ore
forming process for both deposits. This leads to following expectations in exploration:
Reinfjord may have massive sulphide bodies similar to those found in Lokkarfjord.
The Lokkarfjord mineralised field can be larger in its areal extent as known this far.
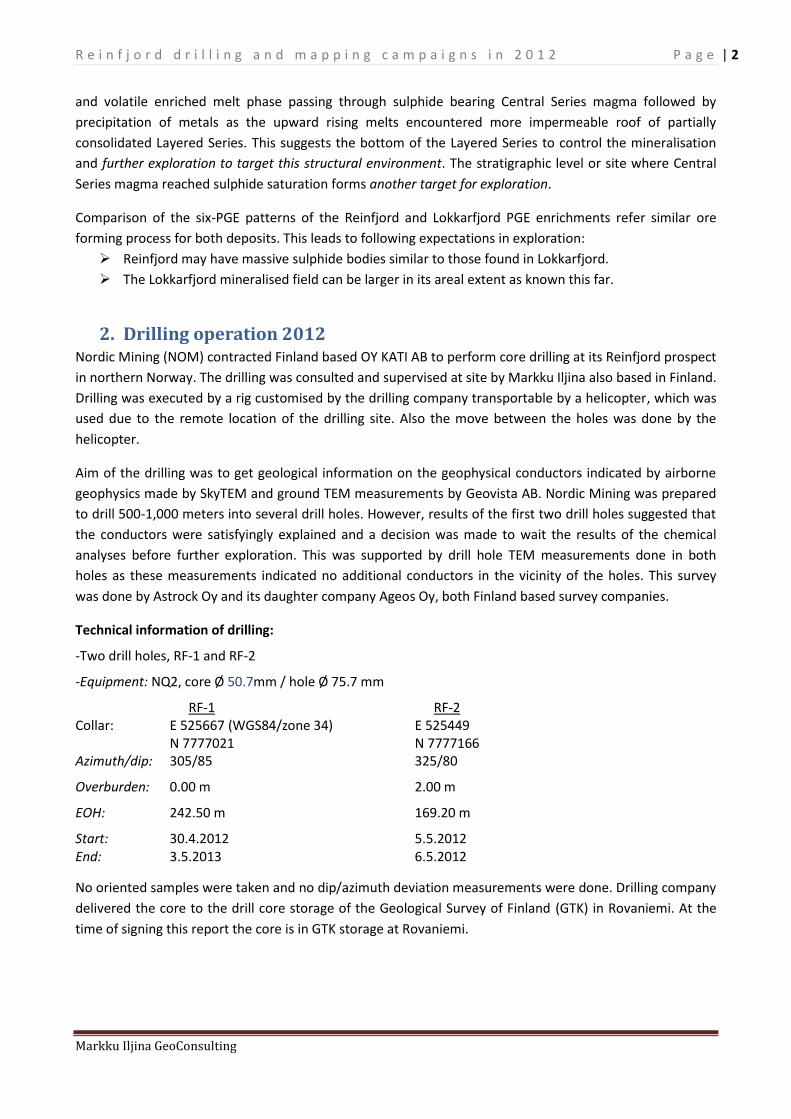
2. Drilling operation 2012 Nordic Mining (NOM) contracted Finland based OY KATI AB to perform core drilling at its Reinfjord prospect
in northern Norway. The drilling was consulted and supervised at site by Markku Iljina also based in Finland.
Drilling was executed by a rig customised by the drilling company transportable by a helicopter, which was
used due to the remote location of the drilling site. Also the move between the holes was done by the
helicopter.
Aim of the drilling was to get geological information on the geophysical conductors indicated by airborne
geophysics made by SkyTEM and ground TEM measurements by Geovista AB. Nordic Mining was prepared
to drill 500-1,000 meters into several drill holes. However, results of the first two drill holes suggested that
the conductors were satisfyingly explained and a decision was made to wait the results of the chemical
analyses before further exploration. This was supported by drill hole TEM measurements done in both
holes as these measurements indicated no additional conductors in the vicinity of the holes. This survey
was done by Astrock Oy and its daughter company Ageos Oy, both Finland based survey companies.
Technical information of drilling:
-Two drill holes, RF-1 and RF-2
-Equipment: NQ2, core Ø 50.7mm / hole Ø 75.7 mm
RF-1 RF-2 Collar: E 525667 (WGS84/zone 34) E 525449 N 7777021 N 7777166 Azimuth/dip: 305/85 325/80
Overburden: 0.00 m 2.00 m
EOH: 242.50 m 169.20 m
Start: 30.4.2012 5.5.2012 End: 3.5.2013 6.5.2012
No oriented samples were taken and no dip/azimuth deviation measurements were done. Drilling company
delivered the core to the drill core storage of the Geological Survey of Finland (GTK) in Rovaniemi. At the
time of signing this report the core is in GTK storage at Rovaniemi.

R e i n f j o r d d r i l l i n g a n d m a p p i n g c a m p a i g n s i n 2 0 1 2 P a g e | 3
Markku Iljina GeoConsulting
3. Core logging, sampling and chemical assays The core logging was done by the signer of this report at the core storage and core logging facility of GTK in
Rovaniemi. Logging concentrated visual identification of rock types and amount of sulphides. The contract
included also reviewing of lithological rock names after receiving assay results of the core samples.
Sampling was done in several phases and the core of both drill holes were completely sampled the
common sample length being 1-2 m. A ¼ core samples were taken, in the case of resampling, another ¼
core sample was taken. This results that there is at least ½ core left throughout the entire length of the
holes. About 5 cm long samples were taken for thin sections by the signer and NTNU. Core cutting was
done by GTK in Rovaniemi.
Assays were done by Finland based accredited laboratory Labtium. The principal assay methods were ICP-
OES after Aqua Regia Digestion (Labtium code 510P) for base metals and IPC-OES after Pb-Fire Assay
preconcentration for precious metals (codes 704P/705P). The principal mineralised sections were also
analysed by sulphide specific method (code 240P, ICP-OES after Ammonium Citrate-H2O2 - leach). In order
to study the petrology of the rocks a number samples were also subjected into XRF analyses (code 175X)
complemented by carbon determinations (code 811L) and Loss on Ignition, LOI (code 813G). In addition,
eight samples (six from Reinfjord and two from Lokkarfjord) were submitted to six-PGE (Os, Ir, Ru, Rh, Pt,
and Pd) assays (code 714M, ICP-MS after NiS-Fire Assay). This six-PGE package included also gold.
GTK was further contracted to measure the petrophysical properties of the core; properties measured
included density, susceptibility, remanence, and conductivity/resistivity determinations by galvanic
method. These measurements were done in Rovaniemi and Espoo laboratories of GTK.
4. Mapping and bedrock sampling 2012 A field mapping and sampling operation was executed between 28.8.-2.9.2012 (full days on site) by NOM
staff, the signer, and NTNU (Norwegian University of Science and Technology) students. Mapping and
sampling efforts were concentrated in the area of interpreted electric conductor and drilling site. Samples
collected by the signer were cut by GTK at Rovaniemi and send for whole-rock analyses to Labtium. Applied
assay methods were XRF (code 175X) and Pb-Fire-Assay/ICP-OES (704P) complemented by carbon and LOI
determinations (811L and 813G). Samples collected by the students were taken to NTNU.
R e i n f j o r d d r i l l i n g a n d m a p p i n g c a m p a i g n s i n 2 0 1 2 P a g e | 4
Markku Iljina GeoConsulting
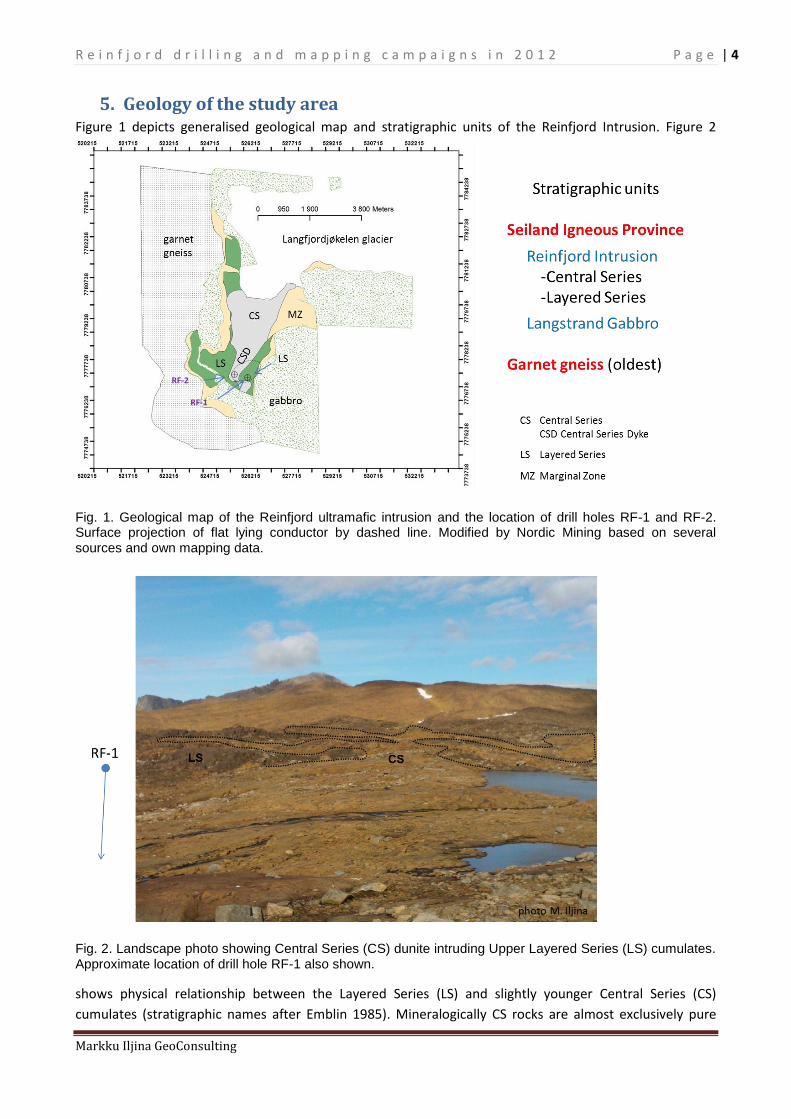
5. Geology of the study area Figure 1 depicts generalised geological map and stratigraphic units of the Reinfjord Intrusion. Figure 2
Fig. 1. Geological map of the Reinfjord ultramafic intrusion and the location of drill holes RF-1 and RF-2. Surface projection of flat lying conductor by dashed line. Modified by Nordic Mining based on several sources and own mapping data.
Fig. 2. Landscape photo showing Central Series (CS) dunite intruding Upper Layered Series (LS) cumulates. Approximate location of drill hole RF-1 also shown.
shows physical relationship between the Layered Series (LS) and slightly younger Central Series (CS)
cumulates (stratigraphic names after Emblin 1985). Mineralogically CS rocks are almost exclusively pure
RF-1
RF-2

R e i n f j o r d d r i l l i n g a n d m a p p i n g c a m p a i g n s i n 2 0 1 2 P a g e | 5
Markku Iljina GeoConsulting
olivine adcumulates, dunites, while LS contains increased amounts of clino- and orthopyroxenes often in
intercumulus positions making rock meso-orthocumulate in texture. The LS cumulates are mainly olivine
pyroxenites.
The principal observation is that CS intrudes LS and many (if not all) dunitic olivine cumulate ‘layers’ in LS
Domain are related to infiltration of CS magma into LS, which obviously had only some residual interstitial
liquid at the time of intrusion of CS magma.
6. Petrological observations
6.1. Theoretical background PGE and base metal sulphide enrichments are basically found in two structural positions in the layered
intrusions. One is the Contact Type, which is confined to intrusion margins. The Småvatna and Bonjikdalen
deposits in the Reinfjord Intrusion represent this type (Iljina 2011). The other type is so called Reef Type,
which occurs as laterally extensive layer-like enrichments within the layered sequence inside the intrusion
body.
Interpretation of the structural position of the conductor as based on geophysical measurements and
logging of drill core refers to Reef position of the mineralized body intersected by the hole RF-1. This type of
metal enrichment was formerly unknown in the Reinfjord Intrusion.
In classic models the formation of reef type is generally understood to be part of the fractionational
crystallisation taking place in the magma chamber or related to replenishments of new magma.
Crystallisation Fe-Mg silicates from ultramafic/mafic magma leads at some point the residual magma to
reach sulphide saturation and excess sulphur forms immiscible sulphide liquid. The sulphur content of the
magma at the point, when the magma is no more capable to dissolve any more sulphur, is called Sulphur
Content at Sulphide Saturation (SCSS, Fig. 3). SCSS has negative correlation with the pressure and high
crystallisation depth (25 km, 7 kbar) of Reinfjord intrusion can be approximated to have lowered the SCSS
by 200-300 ppm.
Fig. 3. Sulphur Content at Sulphide Saturation (SCSS) and sulphur content of residual magma as a function of crystallisation of model komatiitic magma. Upper curve with blue diamonds depicts surface conditions; lower red curve approximates SCSS at about 7 kbar. Arrowed black lines indicate the development of residual magma starting from 400 and 500 ppm of sulphur content corresponding to 50% partial melting of the mantle. Blue arrow indicates magma to reach SCSS earlier if external sulphur is added; more sulphur added, the earlier magma reaches SCSS. Calculations made for model komatiite based on equation of Li and Ripley (2009) and consulted by prof. W. Maier 2012 at Oulu University, Finland.

R e i n f j o r d d r i l l i n g a n d m a p p i n g c a m p a i g n s i n 2 0 1 2 P a g e | 6
Markku Iljina GeoConsulting
The immiscible sulphide liquid formed at the point when the silicate melt has reached SCSS is very effective
in scavenging base metals like Cu and Ni and especially Platinum-Group Elements (PGE). Note that
fractional crystallisation will further reduce SCSS and the system will stay at sulphur saturation and
precipitate sulphides. The partitioning coefficients (D) of PGE are very strongly in favour of sulphide melt in
the system of immiscible sulphide and silicate melts. This leads that the very first sulphides drain the
silicate magma effectively from PGE and hence first sulphides are most PGE enriched. Ds of PGE are also
about a hundred times higher than those of the base metals. This results in any later formed sulphides to
have lower Cu/PGE ratio. This phenomenon has been successfully used in exploration of reef type PGE
enrichments (Fig. 4).
Fig. 4. Use of Cu/Pd ratio in locating PGE reefs in four different intrusions. From Maier 2005.
6.2. Reinfjord mineralogy Layered and Central Series cumulates are in practise exclusively composed of three Fe-Mg silicates. These
are olivine, clinopyroxene, and orthopyroxene. Chemical compositions of these minerals are presented in
Table 1.
Table 1. Compositions of the three prevailing Fe-Mg silicates in Reinfjord Intrusion after Emblin 1985.
MgO, wt.% FeO CaO Al2O3 SiO2 TiO2 Ni, Cr, Mn,… MgO:FeO
Olivine 44 15 0 0 40 0 1 2.9
Orthopyroxene 29 12 2 2 53 1 1 2.4
Clinopyroxene 17 4 23 3 51 1 1* 4.3
*clinopyroxene carries often 1-2 wt.% Cr only.

R e i n f j o r d d r i l l i n g a n d m a p p i n g c a m p a i g n s i n 2 0 1 2 P a g e | 7
Markku Iljina GeoConsulting
Whole-rock chemistry of the rocks is basically controlled by these three silicates. Key conclusions are:
Amount of CaO is exclusively controlled by the modal amount of clinopyroxene in the rock.
Both pyroxenes can account few percent of Al2O3 in the rock.
Excess of 30 wt.% of MgO in whole-rock analyse presumes modal olivine.

R e i n f j o r d d r i l l i n g a n d m a p p i n g c a m p a i g n s i n 2 0 1 2 P a g e | 8
Markku Iljina GeoConsulting
6.3. Drill hole chemistry Figures 5-6 depict variation of selected elements in drill holes RF-1 and RF-2. Figures show also
approximated rock names based on whole-rock chemistry, core logs, and mineral chemistry.
Fig. 5. Variation in whole-rock chemistry in the drill hole RF-1. Black horizontal lines indicate visually identified lithological boundaries. Dykes removed from the log. Vertical axis not in scale.
Start depth Na2O % MgO % Al2O3 % SiO2 % CaO % TiO2 % Fe2O3 % S % V % Cr %
3.20 0.39 21.00 2.81 47.60 15.36 0.730 8.17 0.140 0.015 0.406
12.55 0.32 23.80 2.17 47.1 14.01 0.510 8.40 0.090 0.0111 0.3826
14.50 0.32 23.80 2.07 46.70 13.77 0.476 8.30 0.088 0.011 0.365
16.60 0.06 38.20 0.42 38.00 2.75 0.098 14.60 0.470 <0.003 0.081
24.75 0.28 27.60 2.03 44.80 10.99 0.520 9.94 0.192 0.010 0.299
29.20 0.24 29.40 1.78 44.0 9.68 0.446 10.80 0.277 0.0096 0.2791
31.90 0.09 38.40 0.67 39.7 3.30 0.168 14.00 0.169 0.0038 0.1492
39.75 0.07 39.80 0.47 38.10 1.75 0.112 16.10 0.247 <0.003 0.092
45.40 0.07 39.00 0.68 38.10 2.02 0.163 16.30 0.220 0.004 0.220
52.00 0.05 40.90 0.39 38.00 1.43 0.088 15.20 0.221 <0.003 0.095
58.00 0.05 39.40 0.52 37.50 1.70 0.119 16.60 0.426 0.004 0.222
62.00 0.04 39.90 0.34 37.40 1.34 0.076 16.70 0.413 <0.003 0.148
66.00 0.11 35.80 0.68 39.20 4.01 0.158 15.90 0.683 0.004 0.157
72.00 0.10 37.20 0.70 38.80 3.34 0.171 15.40 0.427 0.005 0.290
76.00 0.05 41.20 0.41 37.20 0.62 0.109 16.70 0.314 <0.003 0.157
80.00 <0.0337 41.30 0.38 36.70 0.51 0.101 16.40 0.404 <0.003 0.218
84.00 0.039 40.6 0.44 37.2 0.830 0.121 16.8 0.259 0.0035 0.235
86.00 0.036 41.3 0.46 37.3 0.690 0.121 16.5 0.245 0.0034 0.252
88.00 0.065 41.5 0.48 36.9 0.530 0.092 16.0 0.909 <0.003 0.156
88.45 <0.0337 42.4 0.37 37.0 0.540 0.082 15.3 0.663 0.0032 0.182
89.13 0.173 40.0 1.21 37.4 1.230 0.210 15.3 0.809 0.0035 0.150
91.00 <0.0337 42.5 0.33 37.1 0.427 0.078 15.3 0.668 <0.003 0.175
93.00 0.070 42.4 0.57 37.4 0.460 0.110 14.6 0.281 <0.003 0.203
95.00 0.061 41.0 0.66 37.2 0.770 0.152 15.8 0.131 0.0038 0.232
97.00 <0.0337 38.9 0.23 36.6 0.620 0.072 19.3 0.347 <0.003 0.032
99.00 <0.0337 38.3 0.21 36.4 0.540 0.066 20.1 0.267 <0.003 0.025
101.00 0.043 38.6 0.38 36.8 0.990 0.106 18.6 0.403 <0.003 0.049
103.00 0.059 40.5 0.60 37.0 0.700 0.142 16.9 0.632 <0.003 0.129
105.00 0.054 40.7 0.74 36.6 0.520 0.164 16.9 0.471 0.0042 0.259
107.00 0.064 40.0 0.47 37.2 0.484 0.092 17.8 0.094 <0.003 0.052
107.75 0.041 38.4 0.30 36.5 0.550 0.100 20.1 0.138 <0.003 0.031
109.45 0.086 32.4 1.80 43.2 1.290 0.361 17.4 0.360 0.0082 0.127
110.20 <0.0337 37.4 0.68 36.1 0.660 0.230 21.0 0.432 0.0058 0.271
110.60 0.174 28.0 2.89 47.9 1.830 0.560 15.4 0.494 0.0118 0.180
111.00 0.042 36.5 0.85 36.1 0.730 0.308 21.2 0.477 0.0074 0.319
113.00 0.073 37.3 0.74 36.7 0.790 0.204 20.5 0.472 0.0040 0.152
115.00 0.055 38.5 0.66 35.9 0.530 0.186 19.9 0.465 0.0051 0.258
117.00 0.115 36.9 1.01 36.6 0.950 0.249 20.0 0.648 0.0058 0.230
119.00 0.051 38.3 0.99 36.1 0.800 0.267 19.3 0.325 0.0073 0.455
127.00 0.05 38.10 0.66 36.10 0.72 0.205 20.20 0.480 0.005 0.239
135.00 0.05 42.00 0.48 37.40 0.54 0.121 15.50 0.502 <0.003 0.121
142.10 0.049 40.9 0.48 36.8 0.750 0.117 14.4 0.024 0.0033 0.098
147.00 <0.0337 40.0 0.40 35.3 0.660 0.076 12.9 0.025 <0.003 0.236
150.30 0.04 40.10 0.39 36.0 0.82 0.090 13.10 0.032 <0.003 0.1939
155.45 <0.0337 39.90 0.32 36.40 0.62 0.085 17.40 0.418 <0.003 0.125
160.87 0.04 40.70 0.38 37.00 0.99 0.089 15.80 0.189 <0.003 0.188
166.52 0.04 40.60 0.37 37.50 1.18 0.085 15.60 0.101 <0.003 0.134
174.00 0.08 40.10 0.69 38.00 1.70 0.133 15.40 0.173 0.004 0.265
180.13 <0.0337 42.00 0.35 37.10 0.52 0.076 16.00 0.166 <0.003 0.240
186.26 <0.0337 42.80 0.47 37.60 0.68 0.083 14.70 0.234 0.003 0.330
190.45 0.04 41.70 0.58 37.7 0.88 0.108 15.20 0.192 0.0039 0.3549
197.00 0.06 42.30 0.57 38.10 1.11 0.148 14.30 0.135 0.004 0.242
201.00 0.04 42.40 0.54 38.00 1.06 0.111 14.00 0.144 0.004 0.414
207.00 <0.0337 42.30 0.45 37.50 0.84 0.078 14.80 0.325 0.003 0.320
213.00 0.05 41.60 0.56 37.60 1.22 0.109 14.40 0.221 0.004 0.408
217.92 0.05 40.50 0.44 37.6 1.09 0.112 16.20 0.322 <0.003 0.3164
224.00 0.08 40.10 0.66 37.30 1.17 0.186 16.10 0.151 0.004 0.231
230.00 0.04 41.10 0.39 37.40 0.98 0.084 15.90 0.159 <0.003 0.228
238.00 0.05 41.40 0.44 37.60 1.09 0.091 15.00 0.165 <0.003 0.251
242.50 0.05 41.10 0.35 38.4 1.46 0.079 14.90 0.129 <0.003 0.0820
Olivine pyroxenite
Fe-
dunite
Dunite
pegmatite
bearing interval
Fe-
dunite
Ni+Cu
PGE
Layered Series
Central Series

R e i n f j o r d d r i l l i n g a n d m a p p i n g c a m p a i g n s i n 2 0 1 2 P a g e | 9
Markku Iljina GeoConsulting
Fig. 6. Variation in whole-rock chemistry in the drill hole RF-2. Black horizontal lines indicate visually identified lithological boundaries. Lines in blue are fine-grained mafic rocks. Vertical axis not in scale.
Start depth Na2O % MgO % Al2O3 % SiO2 % K2O % CaO % TiO2 % MnO % Fe2O3 % S % Cl % Sc % V % Cr % Ni % Cu % Zn % Sr % Y % Zr %
4.01 <0.0337 38.9 0.29 35.5 0.005 0.74 0.063 0.177 15.9 0.236 0.047 <0.002 <0.003 0.100 0.246 0.030 0.011 <0.001 <0.0007 <0.001
13.50 <0.0337 40.3 0.31 36.9 0.005 0.54 0.059 0.185 16.6 0.139 0.017 <0.002 <0.003 0.114 0.233 0.017 0.011 <0.001 <0.0007 <0.001
17.00 <0.0337 40.8 0.33 36.5 0.004 0.52 0.057 0.181 16.9 0.327 0.007 <0.002 <0.003 0.132 0.275 0.042 0.011 <0.001 <0.0007 <0.001
25.20 <0.0337 40.3 0.26 36.7 0.007 0.47 0.051 0.194 17.6 0.142 <0.006 <0.002 <0.003 0.094 0.211 0.017 0.012 <0.001 <0.0007 <0.001
30.75 <0.0337 40.6 0.52 36.3 0.015 0.52 0.082 0.184 16.7 0.128 <0.006 <0.002 0.003 0.397 0.191 0.018 0.011 <0.001 <0.0007 <0.001
36.00 0.036 40.5 0.32 37.4 0.007 0.86 0.063 0.185 16.9 0.171 <0.006 <0.002 <0.003 0.106 0.176 0.024 0.011 <0.001 <0.0007 <0.001
41.4 0.0420 39.3 0.59 36.2 0.010 0.74 0.121 0.1940 18.4 0.477 <0.006 <0.002 0.003 0.313 0.253 0.054 0.013 <0.001 <0.0007 <0.001
47.96 0.0410 39.2 0.55 36.4 0.010 1.08 0.090 0.1860 17.7 0.705 0.006 <0.002 0.0035 0.279 0.295 0.084 0.012 <0.001 <0.0007 <0.001
53.60 0.165 38.5 1.23 38.0 0.015 1.65 0.269 0.181 16.5 0.151 <0.006 <0.002 0.004 0.078 0.191 0.018 0.012 0.0025 <0.0007 <0.001
59.30 <0.0337 41.0 0.38 37.4 <0.003614 0.84 0.064 0.182 16.5 0.147 <0.006 <0.002 <0.003 0.166 0.216 0.019 0.011 <0.001 <0.0007 <0.001
65.38 0.037 41.0 0.38 37.7 0.016 0.89 0.059 0.178 16.3 0.087 <0.006 <0.002 <0.003 0.098 0.225 0.009 0.012 <0.001 <0.0007 <0.001
72.57 0.101 37.2 1.18 38.6 0.011 3.23 0.248 0.179 16.2 0.147 <0.006 <0.002 0.006 0.280 0.202 0.017 0.011 <0.001 <0.0007 <0.001
76.2 0.101 37.7 0.80 39.7 0.029 3.36 0.128 0.172 14.7 0.082 <0.006 <0.002 0.0034 0.147 0.194 0.011 0.010 0.0014 <0.0007 <0.001
80.00 0.159 36.1 1.11 39.6 0.006 4.13 0.172 0.172 14.7 0.155 <0.006 <0.002 0.005 0.264 0.182 0.025 0.011 0.0020 <0.0007 <0.001
88.00 0.076 38.2 0.84 37.3 <0.003614 2.27 0.157 0.174 16.2 0.503 <0.006 <0.002 0.005 0.539 0.284 0.078 0.011 <0.001 <0.0007 <0.001
91.20 0.302 34.0 2.31 38.5 0.016 3.86 0.500 0.164 14.8 0.345 0.022 <0.002 0.007 0.205 0.198 0.057 0.010 0.0056 <0.0007 0.0011
93.05 0.0440 36.5 0.67 35.1 <0.003614 1.61 0.142 0.1720 15.9 0.370 0.033 <0.002 0.0046 0.532 0.345 0.063 0.012 <0.001 <0.0007 <0.001
94.00 0.037 34.5 0.95 35.7 0.004 2.07 0.192 0.169 15.4 0.446 0.042 <0.002 0.005 0.438 0.364 0.058 0.010 0.0015 <0.0007 <0.001
96.00 0.047 34.8 0.72 34.8 0.004 2.20 0.127 0.168 15.0 0.355 0.038 <0.002 0.004 0.319 0.311 0.043 0.011 0.0028 <0.0007 <0.001
98.00 0.058 35.8 0.53 36.1 0.004 2.33 0.106 0.167 14.8 0.197 0.024 <0.002 <0.003 0.107 0.289 0.032 0.009 0.0017 <0.0007 <0.001
100.00 0.080 35.0 1.75 35.8 0.007 2.61 0.204 0.160 14.3 0.636 0.019 <0.002 0.004 0.099 0.342 0.080 0.009 0.0026 <0.0007 <0.001
102.50 0.0430 37.5 0.42 35.6 <0.003614 1.30 0.097 0.1740 15.7 0.230 0.021 <0.002 <0.003 0.096 0.291 0.032 0.009 <0.001 <0.0007 <0.001
104.00 0.069 37.7 0.61 35.2 0.004 1.06 0.081 0.176 15.9 0.730 0.019 <0.002 <0.003 0.072 0.348 0.050 0.010 <0.001 <0.0007 <0.001
108.00 <0.0337 39.7 0.22 35.6 <0.003614 0.61 0.049 0.177 16.3 0.410 0.014 <0.002 <0.003 0.075 0.314 0.065 0.011 <0.001 <0.0007 <0.001
110.80 <0.0337 40.2 0.25 36.4 <0.003614 0.59 0.057 0.1790 16.7 0.427 0.012 <0.002 <0.003 0.105 0.290 0.057 0.010 <0.001 <0.0007 <0.001
112.00 <0.0337 40.4 0.29 36.3 <0.003614 0.59 0.064 0.183 16.8 0.542 0.009 <0.002 <0.003 0.195 0.331 0.072 0.011 <0.001 <0.0007 <0.001
118.00 0.035 40.1 0.54 36.2 <0.003614 0.72 0.105 0.181 17.1 0.422 0.008 <0.002 <0.003 0.408 0.246 0.049 0.010 <0.001 <0.0007 <0.001
124.00 0.052 39.0 0.57 36.9 <0.003614 1.49 0.112 0.182 16.9 0.363 0.006 <0.002 0.003 0.212 0.195 0.045 0.011 <0.001 <0.0007 <0.001
130.00 0.117 34.7 0.80 39.4 <0.003614 4.64 0.164 0.168 15.1 0.392 0.006 <0.002 0.005 0.151 0.152 0.024 0.011 <0.001 <0.0007 <0.001
135.2 0.064 38.7 0.50 37.5 0.022 1.85 0.080 0.178 16.6 0.503 0.006 <0.002 <0.003 0.150 0.172 0.041 0.012 <0.001 <0.0007 <0.001
139.20 0.041 40.0 0.44 37.0 <0.003614 0.99 0.083 0.180 17.3 0.489 <0.006 <0.002 0.003 0.192 0.199 0.038 0.011 <0.001 <0.0007 <0.001
143.75 0.463 18.7 5.15 45.5 0.008 16.42 1.180 0.138 9.7 0.250 <0.006 0.004 0.023 0.229 0.065 0.022 0.006 0.0041 0.00 0.0042
144.78 0.328 24.7 3.71 43.1 0.009 11.90 0.840 0.151 11.8 0.367 <0.006 0.004 0.015 0.235 0.103 0.025 0.007 0.0023 <0.0007 0.0031
149.15 0.181 31.1 1.38 41.4 <0.003614 7.48 0.260 0.161 13.9 0.490 <0.006 <0.002 0.007 0.336 0.130 0.034 0.009 0.0014 <0.0007 <0.001
151.20 0.620 18.5 5.90 44.8 0.017 15.43 1.160 0.132 10.3 0.476 0.011 0.006 0.022 0.155 0.097 0.046 0.005 0.0072 <0.0007 0.0036
158.30 0.086 37.9 0.74 37.4 <0.003614 2.24 0.164 0.179 17.0 0.730 <0.006 <0.002 0.004 0.213 0.185 0.044 0.012 <0.001 <0.0007 0.0011
167.50 0.090 36.4 0.81 38.3 <0.003614 3.25 0.162 0.181 17.2 0.620 <0.006 <0.002 0.005 0.342 0.171 0.038 0.013 0.0010 <0.0007 <0.001
Dunite

R e i n f j o r d d r i l l i n g a n d m a p p i n g c a m p a i g n s i n 2 0 1 2 P a g e | 10
Markku Iljina GeoConsulting
Observations on drill hole whole-rock chemistry depicted in Figs 5 and 6:
Visually located lithological boundaries are well identifiable in whole-rock chemistry in the
hole RF-1.
Visually logged rock type boundaries are less definable by whole-rock chemistry in the hole
RF-2. Some elements show gradual increase or decrease within visually identified rock body
referring fractionation in a cyclic unit.
Rock in both drill holes are constantly sulphide bearing, especially the lower half of the hole
RF-2.
The additional iron in rock type named as “Fe-dunite” (RF-1) is most likely due to spinel,
which is described to be present in Reinfjord Intrusion (Emblin 1985). Available mineral
analyses refer to Mg and Cr bearing Fe-Al spinel, hercynite.
Composition of spinel: Available spinel analyses refer to hercynite. However, whole-rock Cr
concentrations over 0.4 wt.% and some intervals of elevated susceptibility refer also to the
local presence of chromite and magnetite, respectively. This suggests composition of the
spinel to vary in the space defined by hercynite-chromite-magnetite.

R e i n f j o r d d r i l l i n g a n d m a p p i n g c a m p a i g n s i n 2 0 1 2 P a g e | 11
Markku Iljina GeoConsulting
6.4. Chemistry of surface samples Location of surface samples is presented in Fig. 7. Collection of chemical analyses is presented
in Table 2.
Fig. 7. Outcrop sample locations on geological map. Lakes and rivers shown. Suggested corrections for current geological map indicated.
Should be LS
Should be CS

R e i n f j o r d d r i l l i n g a n d m a p p i n g c a m p a i g n s i n 2 0 1 2 P a g e | 12
Markku Iljina GeoConsulting
Table 2. Chemical compositions of surface samples grouped lithologically.
Na2O MgO Al2O3 SiO2 P2O5 K2O CaO TiO2 MnO Fe2O3 S V Cr Ni Cu Zn Sr Zr Au Pd Pt C LOI
Pyroxene pegmatites % % % % % % % % % % % % % % % % % % ppb ppb ppb % %
R1062 0.194 26.2 3.03 48.7 0.023 0.025 2.19 0.620 0.207 15.30 0.305 0.013 0.166 0.111 0.065 0.0106 <0.001 0.0015 32 18 29 0.07 0.36
R1063 0.165 25.7 3.18 47.9 0.017 0.019 2.73 0.800 0.211 15.40 0.321 0.014 0.257 0.112 0.040 0.0111 0.0013 0.0021 <10 <10 <10 0.06 0.16
R1064 0.103 28.1 2.76 49.1 <0.01375 0.010 1.81 0.500 0.225 14.90 0.110 0.011 0.206 0.066 0.012 0.0114 <0.001 0.0010 <10 <10 <10 0.11 <0.01
R1065 0.387 21.6 3.31 45.3 <0.01375 0.005 12.44 0.800 0.172 12.30 0.405 0.017 0.223 0.091 0.037 0.0078 0.0037 0.0024 <10 <10 <10 0.11 0.08
R1071 0.181 27.0 3.06 48.1 0.017 0.020 1.98 0.540 0.216 15.20 0.391 0.011 0.153 0.085 0.023 0.0119 0.0015 0.0012 <10 <10 <10 0.32 0.26
R1074 0.149 26.4 3.33 49.6 <0.01375 0.013 2.44 0.650 0.215 14.20 0.201 0.013 0.246 0.070 0.018 0.0112 0.0016 0.0015 <10 <10 <10 0.07 0.10
R1076 0.204 27.5 2.53 46.4 0.014 0.010 5.67 0.520 0.192 13.80 0.171 0.011 0.206 0.079 0.019 0.0096 0.0012 0.0016 <10 <10 <10 0.10 <0.01
R1077 0.101 31.2 1.94 44.5 0.015 0.011 2.23 0.372 0.216 16.90 0.192 0.008 0.152 0.102 0.016 0.0133 0.0011 0.0011 <10 <10 <10 <0.05 <0.01
R1084 0.313 22.5 3.07 43.0 0.016 0.011 11.01 0.710 0.131 10.30 0.310 0.013 0.288 0.115 0.028 0.0068 0.0031 0.0027 <10 <10 <10 0.12 5.67
R1087 0.570 16.6 5.56 46.7 <0.01375 0.011 16.40 1.130 0.144 9.33 0.210 0.022 0.196 0.041 0.016 0.0064 0.0069 0.0031 <10 <10 <10 0.21 0.77
R1089 0.176 27.5 2.50 44.6 0.014 0.011 4.11 0.520 0.207 16.00 0.768 0.011 0.207 0.161 0.075 0.0128 0.0013 0.0012 11 <10 14 0.10 0.35
R1090 0.500 21.1 3.75 45.9 0.031 0.019 12.90 0.820 0.158 11.10 0.316 0.015 0.235 0.092 0.039 0.0075 0.0064 0.0034 13 <10 <10 0.08 0.31
R1082 0.287 24.8 3.88 49.0 0.041 0.057 2.01 0.860 0.210 15.10 0.106 0.014 0.193 0.046 0.036 0.0098 0.0030 0.0027 <10 <10 <10 0.09 0.26
Cumulates in LS Domain
R1073 intruding CS vein 0.044 39.9 0.30 37.9 0.016 <0.003614 1.76 0.066 0.159 13.60 0.101 <0.003 0.068 0.167 0.030 0.0086 <0.001 <0.001 <10 <10 <10 0.12 3.85
R1079 intruding CS vein <0.0337 39.9 0.24 36.9 <0.01375 <0.003614 0.86 0.065 0.187 16.40 0.098 <0.003 0.030 0.135 0.021 0.0130 <0.001 <0.001 <10 <10 <10 0.08 1.13
R1078 intrud. px-rich vein 0.185 31.9 1.47 41.4 0.014 0.004 6.47 0.321 0.178 14.50 0.150 0.007 0.153 0.094 0.012 0.0113 0.0023 <0.001 <10 <10 <10 0.09 0.27
R1075 LS cumulate 0.338 22.9 2.74 47.1 <0.01375 0.005 13.91 0.660 0.131 8.41 0.102 0.013 0.334 0.063 0.008 0.0047 0.0035 0.0018 <10 <10 <10 0.14 0.17
R1080 0.269 28.0 2.27 43.8 <0.01375 0.005 10.17 0.560 0.144 10.40 0.203 0.011 0.315 0.109 0.026 0.0063 0.0023 0.0018 <10 <10 <10 0.10 0.51
R1081 0.287 26.5 2.10 44.9 <0.01375 0.008 11.15 0.500 0.144 10.50 0.197 0.011 0.249 0.084 0.017 0.0068 0.0030 0.0013 <10 <10 <10 0.09 0.09
R1072 0.331 24.7 2.67 45.4 <0.01375 0.005 12.16 0.660 0.140 10.20 0.122 0.011 0.329 0.082 0.017 0.0084 0.0035 0.0023 <10 <10 <10 0.20 0.34
RF-1/2.30-3.20m 0.393 21.0 2.81 47.6 <0.01375 0.008 15.36 0.730 0.129 8.17 0.140 0.015 0.406 0.051 0.008 0.0057 0.0040 0.0019 <10 <10 <10 <0.05 0.09
RF-1/11.60-12.55m 0.316 23.8 2.17 47.1 <0.01375 0.006 14.01 0.510 0.128 8.40 0.090 0.011 0.383 0.066 0.016 0.0049 0.0036 0.0014
Cumulates in CS Domain
R1083 0.154 36.4 1.16 36.6 0.015 0.009 0.70 0.115 0.204 20.10 0.813 <0.003 0.043 0.270 0.065 0.0141 0.0020 <0.001 21 30 27 0.07 <0.01
R1088 0.038 38.8 0.40 36.4 <0.01375 0.004 0.74 0.074 0.170 15.80 0.119 <0.003 0.155 0.201 0.020 0.0109 <0.001 <0.001 <10 <10 <10 0.08 4.11
R1061 0.060 39.9 0.58 37.1 <0.01375 0.006 0.89 0.150 0.178 17.30 0.790 0.004 0.317 0.221 0.076 0.0119 <0.001 0.0010 <10 <10 <10 0.10 0.09
EØ11008 0.120 40.8 1.30 37.3 0.030 0.020 0.82 0.390 0.220 17.50 0.030 0.009 0.152 0.155 0.002 0.0131 0.0014 0.0016 0 3 0 0.06 2.90
LA11011 0.070 35.1 0.23 39.2 0.060 0.020 4.02 0.080 0.180 17.20 1.000 0.000 0.144 0.263 0.081 0.0106 0.0003 0.0002 8 13 10 0.08 1.20
Black pyroxenite with rough surface
R1085 0.281 25.4 2.35 45.4 <0.01375 <0.003614 12.20 0.468 0.131 9.27 0.164 0.011 0.307 0.091 0.012 0.0060 0.0024 0.0014 <10 <10 <10 0.10 1.08
R1086 0.248 27.3 2.12 44.1 <0.01375 <0.003614 10.54 0.476 0.141 10.70 0.127 0.010 0.228 0.093 0.008 0.0072 0.0023 0.0014 <10 <10 <10 0.10 0.54
Marginal Zone
R1060 0.459 16.1 4.82 46.7 <0.01375 0.017 15.59 1.170 0.152 10.60 0.773 0.025 0.270 0.095 0.047 0.0059 0.0043 0.0029 <10 <10 <10 0.13 1.21
R1066 0.354 20.4 4.34 47.9 0.015 0.017 7.95 0.940 0.188 13.70 0.301 0.019 0.226 0.062 0.055 0.0086 0.0037 0.0026 <10 <10 <10 0.11 0.84
R1067 0.332 23.4 3.51 44.3 0.017 0.029 8.68 0.870 0.184 14.40 0.458 0.016 0.184 0.111 0.027 0.0099 0.0041 0.0026 <10 <10 <10 0.07 0.24
R1068 0.302 27.1 2.68 41.8 0.019 0.016 7.63 0.690 0.184 15.10 0.145 0.013 0.238 0.109 0.013 0.0117 0.0033 0.0020 <10 19 11 0.22 1.25
R1070 0.367 19.2 4.11 45.0 <0.01375 0.004 12.80 0.940 0.162 12.80 0.503 0.020 0.190 0.105 0.060 0.0069 0.0037 0.0024 <10 <10 <10 <0.05 0.96
Langstrand gabbro
R1069 0.680 21.2 6.48 44.4 <0.01375 0.022 11.68 0.740 0.155 12.00 0.188 0.015 0.123 0.047 0.010 0.0083 0.0120 0.0018 <10 <10 <10 0.15 0.26

R e i n f j o r d d r i l l i n g a n d m a p p i n g c a m p a i g n s i n 2 0 1 2 P a g e | 13
Markku Iljina GeoConsulting
Observations on the whole-rock chemistry of surface samples:
Pyroxene pegmatites numerous in LS Domain form a heterogenous family as expected.
Outcrop observations supported by the chemistry refer to need of review of the geological
map in the places indicated in the Fig. 7.
There is a clear chemical difference in LS and CS chemistry, especially in CaO and MgO.
Samples R1073, R1078, and R1079 are dunites, which intrude LS. These dunite ‘layers’
infiltrate more calcareous pyroxenitic LS cumulates.
Sample R1072 represents the collar spot of RF-1.
Sample R1088 represents the collar spot of RF-2.
Note the location of highly sulphide bearing samples R1061 and LA11011. These samples
show low-CaO and high-MgO chemistry typical for CS and correspond cumulates
especially in the lower half of the drill hole RF-2. These two samples represent rather large
area of rusty outcrop surface. Considering the topography, modelled TEM conductor, and
structural interpretation, the sulphurous dunite in the end (125-169 m) of RF-2 may have its
surface exposure in the area of samples R1061 and LA11011.
Surface samples are devoid of PGE despite of rather constant sulphide content.
6.5. Base and precious metal variations in drill holes Drilling encountered two metal enriched intersections, one enriched in base metals, especially in nickel, and
the other more enriched in Platinum-Group Elements (PGE). These mineralised sections are in Reef position,
which was formerly unknown mineralisation type in Reinfjord Intrusion. Following average metal
concentrations are calculated for the two intersections (Schanche et al 2012 and Iljina and Schanche 2012):
Hole ID From To Meters Nickel Copper Cobalt Gold Palladium Platinum PGE+Au Sulphur (m) (m) (m) % % % g/t g/t g/t g/t %
RF-1 86 93 7 0.38 0.12 0.02 0.03 0.03 0.03 0.09 0.61
RF-1* 107.75 117 9.25 0.27 0.06 0.02 0.07 0.20 0.15 0.42 0.58
*including 107.75 113 5.25 0.24 0.05 0.01 0.10 0.31 0.23 0.64 0.41
Figures 8 and 9 show variations of base and precious metal concentrations in drill holes RF-1 and RF-2.
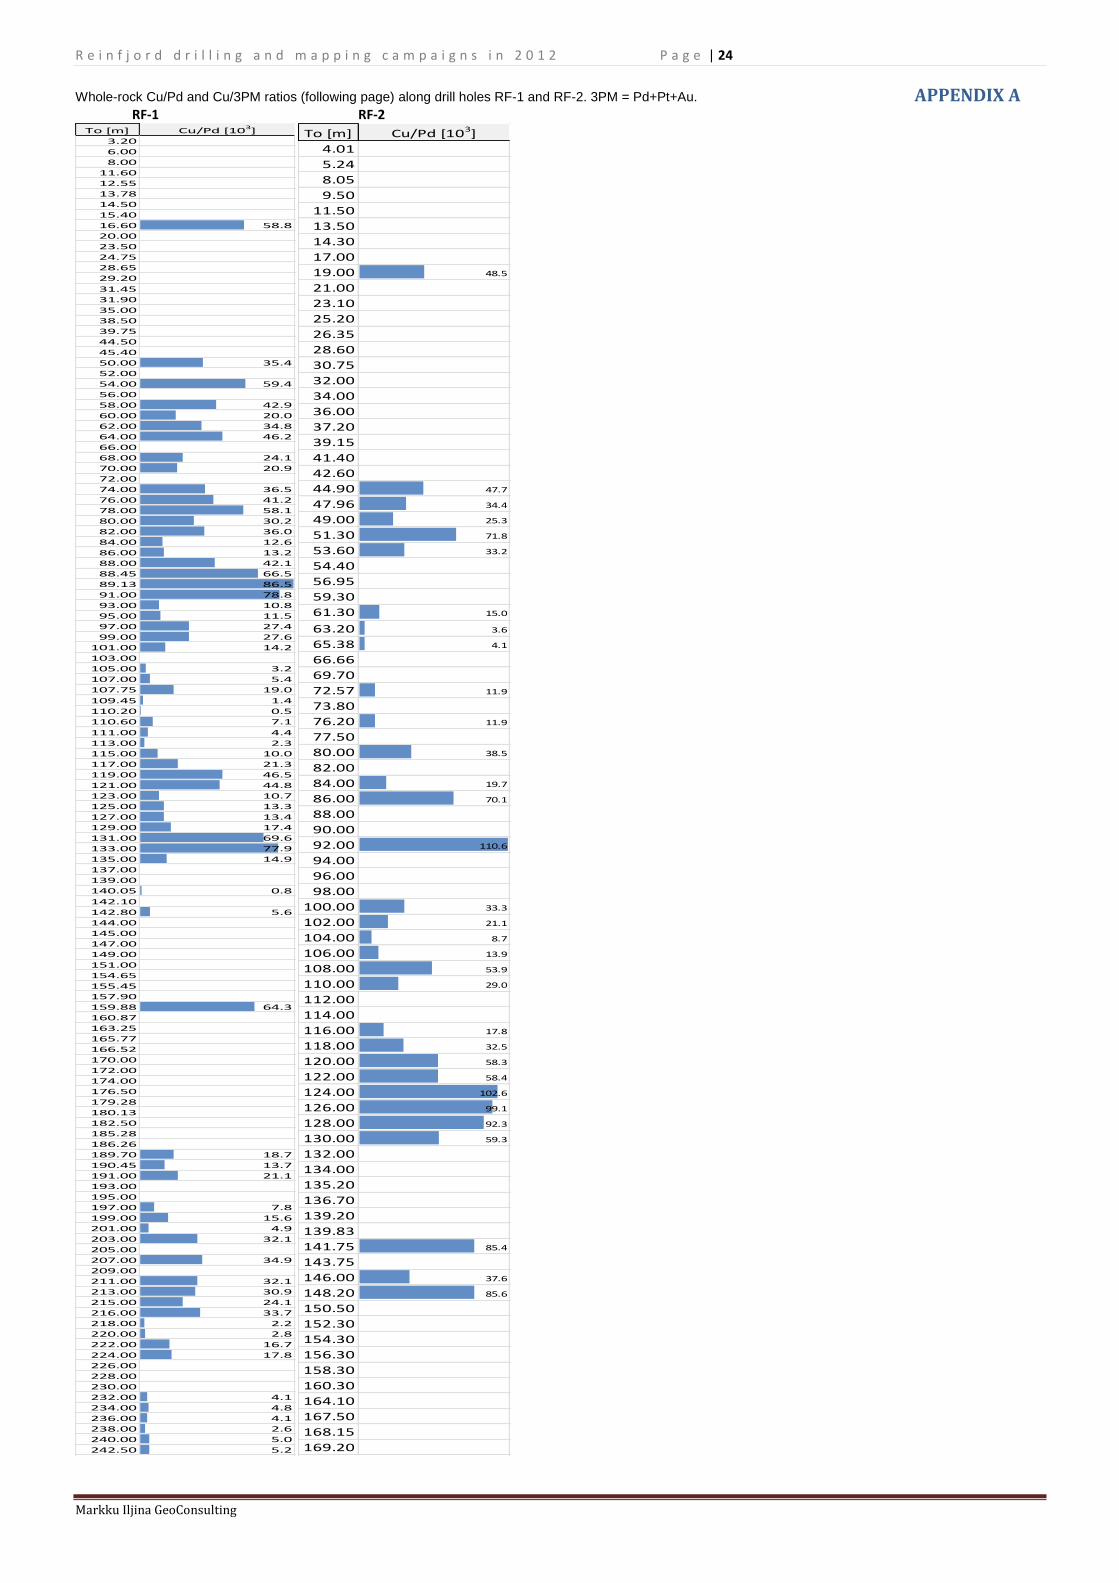
Copper/precious metals ratios in the same drill holes are depicted in Appendix A.

R e i n f j o r d d r i l l i n g a n d m a p p i n g c a m p a i g n s i n 2 0 1 2 P a g e | 14
Markku Iljina GeoConsulting
To [m] Ni Cu Co S Au Pd Pt 3PM
3.20 0.051 0.008 0.140 <10 <10 <10
6.00 0.071 0.023 60.7 0.124 6 <5 <5 6
8.00 0.108 0.034 94.8 0.17 <5 <5 <5
11.60 0.126 0.073 85.5 0.319 5 <5 <5 5
12.55 0.066 0.016 0.090 <10 <10 <10
13.78 0.061 0.013 62.3 0.078 <5 <5 <5
14.50 0.057 0.007 0.088 <10 <10 <10
15.40 0.117 0.044 93.8 0.227 <5 <5 <5
16.60 0.212 0.076 0.470 <10 13 <10 13
20.00 0.050 0.015 44.9 0.097 <5 <5 <5
23.50 0.061 0.011 63.7 0.11 <5 <5 <5
24.75 0.091 0.016 0.192 <10 <10 <10
28.65 0.091 0.026 84.9 0.235 <5 <5 <5
29.20 0.113 0.031 0.277 <10 <10 <10
31.45 0.101 0.017 96.2 0.231 <5 <5 <5
31.90 0.154 0.009 0.169 <10 <10 <10
35.00 0.151 0.016 143 0.263 <5 <5 <5
38.50 0.135 0.014 149 0.213 <5 <5 <5
39.75 0.154 0.015 0.247 <10 <10 <10
44.50 0.173 0.020 154 0.209 <5 <5 <5
45.40 0.190 0.028 0.220 <10 <10 <10
50.00 0.197 0.032 146 0.202 <5 9 7 16
52.00 0.194 0.020 151 0.166 <5 <5 <5
54.00 0.223 0.031 151 0.3 7 5 8 21
56.00 0.223 0.035 149 0.337 26 <10 13 39
58.00 0.270 0.041 0.426 6 9 12 28
60.00 0.204 0.014 145 0.153 <5 7 7 14
62.00 0.297 0.032 0.413 8 9 15 32
64.00 0.239 0.041 153 0.388 11 9 16 37
66.00 0.301 0.066 0.683 11 <5 14 25
68.00 0.198 0.035 123 0.364 7 15 14 35
70.00 0.189 0.012 139 <5 6 <5 6
72.00 0.206 0.048 146 0.359 <5 <5 6 6
74.00 0.184 0.022 156 0.169 <5 6 7 13
76.00 0.192 0.029 156 0.215 <5 7 8 15
78.00 0.240 0.063 162 0.361 6 11 11 27
80.00 0.241 0.052 162 0.316 6 17 16 39
82.00 0.233 0.041 153 0.284 9 11 10 30
84.00 0.232 0.040 152 0.25 7 32 34 73
86.00 0.226 0.034 153 0.227 5 26 21 52
88.00 0.407 0.166 187 0.878 24 39 32 95
88.45 0.344 0.127 179 0.627 28 19 17 64
89.13 0.378 0.122 175 0.775 30 14 14 58
91.00 0.410 0.134 176 0.636 31 17 18 66
93.00 0.348 0.053 145 0.26 43 50 36 129
95.00 0.265 0.016 136 0.127 5 14 18 37
97.00 0.279 0.040 160 0.331 7 15 18 39
99.00 0.243 0.030 164 0.253 6 11 19 37
101.00 0.327 0.055 153 0.39 40 38 41 119
103.00 0.441 0.100 160 0.608 37 <10 26 63
105.00 0.386 0.068 155 0.452 64 215 166 445
107.00 0.242 0.009 145 0.089 <5 16 17 33
107.75 0.209 0.016 163 0.131 <5 8 10 18
109.45 0.162 0.041 106 0.345 22 297 271 590
110.20 0.269 0.036 165 0.425 213 730 419 1362
110.60 0.155 0.083 58.9 0.467 47 117 69 233
111.00 0.283 0.051 164 0.45 135 116 96 347
113.00 0.296 0.055 159 0.45 129 243 180 552
115.00 0.308 0.063 157 0.433 32 63 47 142
117.00 0.342 0.091 160 0.615 29 43 34 106
119.00 0.269 0.047 137 0.303 8 10 8 27
121.00 0.221 0.034 146 0.341 10 8 7 25
123.00 0.254 0.047 158 0.496 25 45 34 103
125.00 0.275 0.038 147 0.317 17 29 24 70
127.00 0.290 0.039 149 0.329 17 29 22 69
129.00 0.265 0.039 146 0.331 12 22 17 51
131.00 0.262 0.078 132 0.418 12 11 11 34
133.00 0.374 0.074 139 0.488 15 10 8 32
135.00 0.357 0.050 140 0.245 26 34 31 91
137.00 0.249 0.008 141 0.098 <5 <5 <5
139.00 0.238 0.013 135 0.145 <5 <5 5 5
140.05 0.258 0.001 134 0.01 <5 18 19 38
142.10 0.261 0.002 130 0.021 <5 <5 <5
142.80 0.230 0.007 122 0.128 <5 13 18 30
144.00 0.026 0.007 35.7 0.136 <5 <5 <5
145.00 0.091 0.005 74.4 0.113 <5 <5 <5
147.00 0.199 0.001 126 0.024 <5 <5 <5
149.00 0.198 0.002 135 0.03 <5 <5 <5
151.00 0.208 0.003 136 0.038 <5 <5 <5
154.65 0.218 0.013 150 0.154 <5 <5 <5
155.45 0.186 0.016 0.418 <10 <10 <10
157.90 0.168 0.023 154 0.172 <5 <5 <5
159.88 0.190 0.034 154 0.282 <5 5 <5 5
160.87 0.223 0.026 0.189 <10 <10 <10
163.25 0.185 0.014 150 0.104 <5 <5 <5
165.77 0.168 0.014 153 0.108 <5 <5 <5
166.52 0.172 0.015 0.101 <10 <10 <10
170.00 0.157 0.020 145 0.146 <5 <5 <5
172.00 0.156 0.021 142 0.14 <5 <5 <5
174.00 0.170 0.022 144 0.167 <5 <5 <5
176.50 0.190 0.014 148 0.114 <5 <5 <5
179.28 0.182 0.011 148 0.11 <10 <10 <10
180.13 0.173 0.016 0.166 <10 <10 <10
182.50 0.179 0.023 152 0.181 <10 <10 <10
185.28 0.169 0.021 148 0.156 <5 <5 <5
186.26 0.212 0.035 0.234 <10 <10 <10
189.70 0.225 0.014 144 0.132 <5 7 <5 7
190.45 0.255 0.016 0.192 <10 12 <10 12
191.00 0.250 0.017 145 0.18 <5 8 5 13
193.00 0.142 0.015 92.9 0.224 <5 <5 <5
195.00 0.268 0.011 135 0.144 <5 <5 5 5
197.00 0.250 0.009 131 0.119 <5 12 <5 12
199.00 0.282 0.020 141 0.177 14 13 6 33
201.00 0.266 0.014 134 0.129 18 28 11 57
203.00 0.321 0.026 142 0.266 25 8 6 39
205.00 0.260 0.018 138 0.152 <5 <5 <5
207.00 0.330 0.027 145 0.297 9 8 8 24
209.00 0.240 0.011 135 0.096 8 <5 <5 8
211.00 0.266 0.017 138 0.139 6 5 <5 11
213.00 0.299 0.021 144 0.197 7 7 <5 14
215.00 0.284 0.022 145 0.206 16 9 <5 25
216.00 0.274 0.038 152 0.32 26 11 7 44
218.00 0.277 0.027 147 0.249 34 122 74 230
220.00 0.260 0.025 140 0.249 40 91 84 216
222.00 0.201 0.012 131 0.153 <5 7 7 14
224.00 0.199 0.014 136 0.136 <5 8 <5 8
226.00 0.202 0.010 143 0.112 <5 <5 <5
228.00 0.198 0.012 141 0.137 <5 <5 <5
230.00 0.199 0.012 140 0.145 <5 <5 7 7
232.00 0.229 0.017 142 0.191 <5 41 23 64
234.00 0.216 0.015 135 0.159 <5 31 25 56
236.00 0.191 0.011 130 0.133 <5 28 19 46
238.00 0.223 0.014 137 0.148 <5 54 34 88
240.00 0.204 0.012 131 0.103 <5 23 24 47
242.50 0.201 0.011 134 0.104 <5 20 22 42
Fig. 8. Base and precious metal chemistry in the drill hole RF-1. Ni, Cu and S in wt.%; Co in ppm; Au, Pd, Pt and 3PM in ppb. 3PM=Au+Pd+Pt. Vertical axis not in scale.
pegmatite
bearing
occacional plagioclase and blue quartz
Ni+Cu
PGE
86.00-93.00 m: 7.00 m @ 0.38 % Ni, 0.12 Cu, 0.03 ppm Au, 0.03 Pd, 0.03 Pt, 0.09 3PM
107.75-113.00 m: 5.25 m @ 0.27 % Ni, 0.05 Cu, 0.10 ppm Au, 0.31 Pd, 0.23 Pt, 0.64 3PM
Olivine pyroxenite
Fe-
dunite
Layered Series
Central Series
Dunite

R e i n f j o r d d r i l l i n g a n d m a p p i n g c a m p a i g n s i n 2 0 1 2 P a g e | 15
Markku Iljina GeoConsulting
To [m] Ni Cu Co S Au Pd Pt 3PM
4.01 0.247 0.038 151 0.252 <10 <10 <10
5.24 0.246 0.030 0.236 <10 <10 <10
8.05 0.203 0.019 140 0.156 <10 <10 <10
9.50 0.221 0.025 147 0.186 <5 <5 <5
11.50 0.231 0.029 151 0.219 <5 <5 7 7
13.50 0.277 0.047 160 0.353 7 <5 6 13
14.30 0.233 0.017 0.139 <10 <10 <10
17.00 0.235 0.026 156 0.196 <10 <10 <10
19.00 0.255 0.039 163 0.315 <5 8 7 15
21.00 0.314 0.071 173 0.588 24 <10 14 38
23.10 0.209 0.027 154 0.163 <5 <5 <5
25.20 0.206 0.019 158 0.145 <10 <10 <10
26.35 0.211 0.017 0.142 <10 <10 <10
28.60 0.222 0.022 156 0.177 <5 <5 <5
30.75 0.218 0.030 158 0.195 <10 <10 <10
32.00 0.191 0.018 0.128 <10 <10 <10
34.00 0.271 0.059 167 0.420 <10 <10 <10
36.00 0.186 0.017 157 0.129 <5 <5 <5
37.20 0.176 0.024 0.171 <10 <10 <10
39.15 0.176 0.029 160 0.260 <5 <5 <5
41.40 0.169 0.021 160 0.182 <10 <10 <10
42.60 0.253 0.054 0.477 <10 <10 <10
44.90 0.217 0.060 150 0.509 5 13 9 27
47.96 0.241 0.061 167 0.475 9 18 18 44
49.00 0.295 0.084 0.705 15 33 45 93
51.30 0.206 0.041 162 0.326 <5 6 <5 6
53.60 0.193 0.024 158 0.202 <5 7 <5 7
54.40 0.191 0.018 0.151 <10 <10 <10
56.95 0.180 0.020 139 0.187 <5 <5 <5
59.30 0.216 0.022 157 0.177 <10 <10 12 12
61.30 0.200 0.017 149 0.135 <5 12 10 21
63.20 0.213 0.009 147 0.089 <10 25 16 42
65.38 0.217 0.007 156 0.082 <10 18 17 35
66.66 0.225 0.009 0.087 <10 <10 19 19
69.70 0.174 0.015 133 0.158 <5 <5 <5
72.57 0.179 0.020 132 0.173 <5 17 16 32
73.80 0.202 0.017 0.147 <10 17 16 33
76.20 0.201 0.011 141 0.112 <5 9 10 19
77.50 0.194 0.011 0.082 <10 <10 <10
80.00 0.169 0.032 129 0.228 5 8 5 19
82.00 0.171 0.024 135 0.141 26 <10 12 38
84.00 0.198 0.034 146 0.214 10 17 13 41
86.00 0.254 0.074 145 0.518 17 11 17 45
88.00 0.265 0.082 148 0.563 22 <10 <10 22
90.00 0.259 0.077 147 0.482 8 <5 8 16
92.00 0.198 0.058 133 0.352 6 5 8 20
94.00 0.266 0.066 133 0.366 25 <10 <10 25
96.00 0.316 0.054 137 0.436 24 <10 <10 24
98.00 0.281 0.039 129 0.346 24 <10 <10 24
100.00 0.257 0.030 127 0.187 9 9 11 29
102.00 0.310 0.074 136 0.372 30 35 58 123
104.00 0.275 0.030 134 0.201 12 34 30 77
106.00 0.318 0.048 146 0.325 13 34 39 87
108.00 0.336 0.066 152 0.450 41 12 30 83
110.00 0.288 0.065 155 0.385 13 22 26 62
112.00 0.300 0.072 157 0.480 21 <10 11 32
114.00 0.286 0.063 159 0.453 21 <10 13 34
116.00 0.234 0.049 159 0.345 29 28 31 88
118.00 0.213 0.053 151 0.431 10 16 18 44
120.00 0.224 0.044 161 0.417 9 7 9 25
122.00 0.230 0.056 162 0.423 <5 10 8 18
124.00 0.213 0.052 159 0.440 <5 5 6 11
126.00 0.185 0.055 156 0.354 <5 6 8 13
128.00 0.272 0.090 172 0.751 10 10 12 32
130.00 0.202 0.059 145 0.488 7 10 10 27
132.00 0.145 0.022 134 0.391 <5 <5 <5
134.00 0.171 0.041 139 0.471 <5 <5 5 5
135.20 0.166 0.044 162 0.515 <5 <5 <5
136.70 0.172 0.041 0.503 <10 <10 <10
139.20 0.220 0.052 179 0.660 <5 <5 <5
139.83 0.199 0.038 0.489 <10 <10 <10
141.75 0.196 0.048 178 0.638 <5 6 <5 6
143.75 0.105 0.031 122 0.437 <5 <5 <5
146.00 0.068 0.028 57 0.343 5 8 7 19
148.20 0.084 0.048 49 0.504 6 6 7 19
150.50 0.122 0.038 116 0.528 <5 <5 <5
152.30 0.083 0.045 62 0.497 <5 <5 7 7
154.30 0.153 0.042 148 0.599 <5 <5 <5
156.30 0.152 0.036 138 0.639 <5 <5 <5
158.30 0.171 0.038 169 0.638 7 <5 6 14
160.30 0.177 0.040 170 0.716 5 <5 <5 5
164.10 0.191 0.046 181 0.733 <5 <5 <5
167.50 0.189 0.045 183 0.730 <5 <5 <5
168.15 0.171 0.038 0.620 <10 <10 <10
169.20 0.176 0.042 171 0.636 <5 <5 <5
Fig. 9. Base and precious metal chemistry in the drill hole RF-2. Ni, Cu and S in wt.%; Co in ppm; Au, Pd, Pt and 3PM in ppb. 3PM=Au+Pd+Pt. Vertical axis not in scale.
Dunite
R e i n f j o r d d r i l l i n g a n d m a p p i n g c a m p a i g n s i n 2 0 1 2 P a g e | 16
Markku Iljina GeoConsulting
Following conclusions can be drawn from base and precious metal variations in drill holes:
Drill hole RF-1 intersects two distinct mineralised sections, one more precious metal enriched and another more base metal enriched locating about 20 m above the former.
The PGE enriched sequence contains ultramafic pegmatite intercalations. PGE enriched section locates at the top of much thicker cumulate sequence containing occasional blue
quartz and plagioclase. The rock type named as Fe-dunite (c. 30-140 m) in RF-1 is anomalous in PGE except the topmost 20 m. Base and especially precious metal levels are lower in the drill hole RF-2 than in RF-1. Anomalous base metal levels are found between 84 – 128 m in RF-2. The whole-rock sulphur concentrations are distinctly higher in RF-2. Lower half of the hole contains
almost constantly S 0.4-0.7 wt.%. Cu/Pd and Cu/(Pd+Pt+Au) ratios vary between 103-104 without distinct abrupt shifts to higher or lower
values (except few anomalous values), or any systematic change with increasing depth (App. A). An interval of elevated Cu/precious metal ratios and depleted PGE+Au is however located between 144-186 m of RF-1 i.e under the rock type named as Fe-dunite.
7. Composition of the sulphide fraction Sixteen two-meter long samples were sent to sulphide specific analyses to Labtium (code 240P). This was
necessary to do as the hosting ultramafic rock presumably contains considerable amount of nickel in silicates
and in order to assess the metal concentration recoverable in sulphide flotation a sulphide specific digest was
applied. Sulphide specific method gives metal concentration bound in sulphides amenable to recovery in
sulphide flotation.
Definition of the terms:
Sulphidic metal content, Msp The amount of metal bound in sulphide minerals
Silicate metal content The amount of metal bound in silicate minerals
Total metal/element content, Mwr The amount of metal or other element in the rock
Metal/element concentration in the
sulphide fraction, Msf
The amount of metal or element in 100% sulphides
(in present case the sulphide fraction is practically exclusively
composed of S, Ni, and Cu)
Preliminary ore mineral study made in NTNU indicates principal sulphide minerals to be pyrrhotite, pentlandite,
and chalcopyrite; this assemblage was also used as the basis for sulphide fraction calculations.
The composition of the sulphide fraction was calculated by calculating first the sulphur required to make
pentlandite and chalcopyrite and then assigning the remaining sulphur to pyrrhotite1. Following mineral
compositions were used:
Fe, wt.% Ni+Co Cu S
pyrrhotite 62.3 37.7
pentlandite 32.6 34.2 33.2
chalcopyrite 30.4 34.6 35.0
This method resulted in metal and mineral compositions of the sulphide fractions depicted in the Table 3.
1 The amount of Co and 3PM were calculated using the mass fraction of sulphides. Received Cosf was subtracted from that
of Nisf.

R e i n f j o r d d r i l l i n g a n d m a p p i n g c a m p a i g n s i n 2 0 1 2 P a g e | 17
Markku Iljina GeoConsulting
Table 3. Metal, sulphur and mineral compositions of the sulphide fraction calculated separately for the base and precious metal enriched sections. For method see text.
Element concentrations in the rock
Average of 86-88 m and 91-93 m
Average of 107-113 m
Nisp 2390 ppm 1350
Cusp 1154 514
Cosp 63 42
Swr 5690 4113
Element concentrations in the sulphide fraction
Fesf 42.9 wt.% 47.9 wt.%
Nisf 14.7 11.7
Cusf 7.1 4.5
Cosf 0.4 0.4
Ssf 34.9 35.6
(Au+Pd+Pt)sf 6.9 ppm 50.6 ppm
Mineral composition of the sulphide fraction
Pyrrhotite 35.5 wt.% 51.9 wt.%
Pentlandite 44.0 35.3
Chalcopyrite 20.5 12.9
Amount of sulphides in the rock
1.6 wt.% 1.2 wt.%
Approximate compositions were also calculated for all samples and depicted in the Table 4. Nickel and copper
concentrations in the sulphide fraction as a function of total amount of sulphides are shown in the Figure 10.

R e i n f j o r d d r i l l i n g a n d m a p p i n g c a m p a i g n s i n 2 0 1 2 P a g e | 18
Markku Iljina GeoConsulting
Table 4. Results of sulphide specific analyses and approximated metal concentrations in 100% sulphides (Msf) based on assumption of 35 wt.% S in the sulphide fraction. Drill hole RF-1.
3PM=Au+Pd+Pt
Fig. 10. Ni and Cu concentrations in 100% sulphides versus whole-rock sulphur.
From To Swr Nisp Cusp Cosp 3PMwr Nisf Cusf Cosf 3PMsf
m m ppm ppm ppm ppm ppb wt.% wt.% wt.% ppm
86.00 88.00 8780 3230 1750 92.6 95 12.9 7.0 0.4 3.8
91.00 93.00 2600 1550 557 32.6 129 20.9 7.5 0.4 17.3
107.00 109.00 3350 1000 428 33.5 329 10.4 4.5 0.4 34.3
109.00 111.00 4490 1410 520 44.4 873 11.0 4.1 0.3 68.1
111.00 113.00 4500 1640 594 48.8 552 12.8 4.6 0.4 42.9
113.00 115.00 4330 1720 698 47.3 142 13.9 5.6 0.4 11.5
115.00 117.00 6150 2240 961 63.4 106 12.7 5.5 0.4 6.0
117.00 119.00 3030 1230 507 33.5 27 14.2 5.9 0.4 3.1
119.00 121.00 3410 1180 386 42.6 25 12.1 4.0 0.4 2.6
121.00 123.00 4960 1550 527 56 103 10.9 3.7 0.4 7.3
123.00 125.00 3170 1280 409 36.6 70 14.1 4.5 0.4 7.7
125.00 127.00 3290 1400 438 38.8 69 14.9 4.7 0.4 7.3
127.00 129.00 3310 1260 402 37.8 51 13.3 4.3 0.4 5.4
129.00 131.00 4180 1430 815 40.5 34 12.0 6.8 0.3 2.9
131.00 133.00 4880 2230 779 46.5 32 16.0 5.6 0.3 2.3
133.00 135.00 2450 1480 519 30.1 91 21.1 7.4 0.4 13.0

R e i n f j o r d d r i l l i n g a n d m a p p i n g c a m p a i g n s i n 2 0 1 2 P a g e | 19
Markku Iljina GeoConsulting
Observations on the composition of the sulphide fraction:
Expected Ni concentration in the concentrate after sulphide flotation is very good i.e. 12-15 wt.%.
Expected PGE content of the sulphide concentrate of the PGE enriched section is acceptable 50 ppm.
Cusf is rather constantly 4-6 wt.%.
Ni and Cu concentrations in the sulphide fraction are irrespective of the total amount of sulphides. This
leads positive expectations as finding more sulphides would consequently mean higher Ni and Cu
concentrations in the same respect.
8. Chondrite normalised six-PGE patterns Chondrite normalised six-PGE patterns are often used to describe the mineralising processes. The patterns are
also used as a quantitative evidence of genetic link between mineralisation and they can be used in
classification of mineralisation types within an intrusive complex or within a deposit. In order to study above
objects six samples from Reinfjord together with two samples from Lokkarfjord were submitted to 6PGE-Au
assays. Results of these assays are presented in the Table 5 and Fig. 11.
Table 5. Results of six-PGE assays, some metal ratios, and comparison with Merensky Reef (Naldrett and Cabri 1976) and JM-Reef (Barnes et al. 1985) data.
Os Ir Ru Rh Pt Pd Au Pd/Ir
(Pt+Pd)/
(Os+Ir+Ru)
ppb ppb ppb ppb ppb ppb ppb
RF-1/PGE Zone, 107.75-109.45 m 144 37.1 65.9 15.2 262 208 18.7 5.6 1.9
RF-1/PGE Zone, 109.45-110.20 m 56.5 14.9 20.3 6.29 393 512 227 34.4 9.9
Lokkarfjord, L1 84.8 37.6 64.7 34.7 187 1010 339 26.9 6.4
Lokkarfjord, L1003 61.7 18 19.9 27.1 187 483 59.8 26.8 6.7
RF-1/BM Zone, 86.00-88.00 m 21.8 3.49 5.52 1.33 25.5 20.1 19.3 5.8 1.5
RF-1/BM Zone, 89.13-91.00 m 12.8 2.48 3.92 1.16 19.5 16 17.6 6.5 1.8
RF-2/100.00-102.00 m 13 6.49 10.7 2.83 69.9 41.9 19.9 6.5 3.7
RF-2/104.00-106.00 m 12.3 4.92 9.85 1.98 38.2 28.6 13.1 5.8 2.5
Merensky Reef, South Africa 63 74 430 240 3740 1530 310 20.7 9.3
JM Reef, Sti l lwater Complex, USA 22 19 50 150 5000 17300 640 911 245

R e i n f j o r d d r i l l i n g a n d m a p p i n g c a m p a i g n s i n 2 0 1 2 P a g e | 20
Markku Iljina GeoConsulting
Fig. 11. Chondrite (C1, Naldrett 1981) normalised six-PGE-Au patterns.
Following observations can be made on the six-PGE assays and patterns: Pd/Ir and (Pt+Pd)/(Os+Ir+Ru) ratios are about equal or below those of the Merensky Reef, Bushveld
Complex, RSA.
Pd/Ir and (Pt+Pd)/(Os+Ir+Ru) ratios are significantly lower than those in the Stillwater Complex, USA.
Six-PGE patterns are rather uniform in their shape.
Patterns show W-shape in their left end (Os-->Pt).
Patterns show rather low degree of fractionation.
In general low degree of fractionation is attributed to precipitation of Platinum-Group Minerals (PGM) from an
immiscible sulphide liquid and not from fluids, which often strongly enrich Pd and Pt over other PGE. Strong
relative Pd-Pt enrichment can also be a result of the fractionation of sulphide melt, which also tends to enrich
copper over nickel (like also the precipitation of sulphides from the fluids). Reinfjord six-PGE ratios and
patterns resemble PGE enrichments associated with some chromite and massive pyrrhotite deposits. Patterns
together with high Ni/Cu ratio refer Reinfjord sulphides to represent the early pyrrhotite-pentlandite end of
the crystallisation process of monosulphide solid-solution (mss).
Os Ir Ru Rh Pt Pd Au
Sam
ple
/ C
ho
nd
rite
R e i n f j o r d d r i l l i n g a n d m a p p i n g c a m p a i g n s i n 2 0 1 2 P a g e | 21
Markku Iljina GeoConsulting
9. Discussion on ore genesis The base and precious metal enrichments intersected in the hole RF-1 have most likely a Reef position. Surface
samples (Table 2) as well as core samples reveal all cumulates in the study area to carry reasonable amounts of
sulphides. Especially noteworthy is the lower half of the drill hole RF-2. High Ni/Cu ratio and the six-PGE
patterns refer sulphides to represent early pyrrhotite-pentlandite end of the fractionation of immiscible
magmatic sulphide liquid. However, the PGE do have a poor correlation with the total amount of sulphides
except the very position of the PGE enriched section. This overall sulphide richness and rather steady
copper/precious metals ratio (Appendix A) suggest system to have been at sulphide saturation at the time of
crystallisation. Also, system has reached sulphide saturation (SCSS) rather early in fractional crystallisation (in
ol+sp field, Fig. 3); this recalls at least some addition of external sulphur into the magma (blue arrow in Fig. 3).
As discussed earlier in this report, the first sulphides that formed when magma reaches sulphide saturation,
will scavenge most of the PGE from the magma and any later sulphides are lower in PGE. The position of the
encountered reef is therefore in contrast to that model, which has shown to be applicable in many natural
cases (Fig. 4). A more customised model is suggested below.
The PGE enriched section is characterised by occasional pegmatitic textures, blue quartz, and plagioclase.
These characteristics refer to increased amounts of siliceous and volatile enriched material not being fully
homogenised with the hosting ultramafic magma. It can be postulated that this melt extracted metals from CS
magma and earlier sulphide enrichments locating in lower levels of the stratigraphy and transported metals to
present site of deposition. Structurally the reef is locating underneath the Layered Series
meso/orthocumulates, which due to this cementing texture may have acted as a less permeable barrier for the
upward rising melts (Fig. 12). LS was also partially consolidated at the time of the intrusion of CS.
Sulphur isotope studies of pyrrhotite (provided by prof. Rune Larsen, NTNU) indicate an intermediate δ34S
value (+0.01) for the PGE reef in respect to BM reef (-4.17) and Langstrand gabbro (+2.19). The δ34S value of
PGE reef is also the same as the heavily contaminated Marginal Series (+0.02). These results are in line with the
presence of more siliceous component in the PGE reef as this component possibly derived due to assimilation
of Langstrand gabbro. This siliceous and volatile enriched melt phase passed through CS dissolving also some of
the sulphides already present in the CS. This is supported by observation (RL/NTNU) of extensive replacement
of sulphides by silicates in CS cumulates.
A selective leach of PGE from MZ sulphides may also have resulted in PGE deficiency and extraordinary high
Cu/Pd ratio of the MZ as noted by Iljina 2011.

R e i n f j o r d d r i l l i n g a n d m a p p i n g c a m p a i g n s i n 2 0 1 2 P a g e | 22
Markku Iljina GeoConsulting
Fig. 12. Ore genesis model for the metal enrichments. Circled numbers 1 and 2 refer to suggested sites for further exploration:
1 Structural positions below of the Layered Series
2 The stratigraphic level or site where Central Series magma had reached sulphide saturation
9.1. Exploration outcome Surface sampling didn’t reveal any PGE enrichments. This and the structural interpretation based on outcrop
observations suggest that at least the PGE enriched section does not outcrop on present erosion surface.
Proposed genesis model (Fig. 12) calls for dissolution sulphides into an immiscible siliceous and volatile
enriched melt phase passing through sulphide bearing Central Series magma followed by precipitation of
metals as the upward rising melts encountered more impermeable roof of partially consolidated Layered
Series. This suggests the bottom of the Layered Series to control the mineralisation and further exploration to
target this structural environment. The stratigraphic level or site where Central Series magma had reached
sulphide saturation forms another target for exploration.
Comparison of the six-PGE patterns of the Reinfjord and Lokkarfjord PGE enrichments refer similar
concentrating process for both deposits. This leads to following expectations in the exploration:
Reinfjord may have massive sulphide bodies similar to those found in Lokkarfjord.
The Lokkarfjord mineralised field can be larger in areal extent as known this far.

R e i n f j o r d d r i l l i n g a n d m a p p i n g c a m p a i g n s i n 2 0 1 2 P a g e | 23
Markku Iljina GeoConsulting
10. References
Sarne, S.-J., Naldrett, A. Gorton, M. 1985. The origin of the fractionation of Platinum-Group Elements in
terrestial magmas. Chem. Geol. 53, 303-323.
Iljina, M., 2011. Exploration report on Reinfjord, Lokkarfjord and Tappeluft Intrusions of the Seiland Igneous
Province, Norway. In-house report for Nordic Mining.
Iljina, M. and Schanche, M., 2012. New nickel and PGE deposit types in Seiland Igneous Province, north
Norway. Geochemistry and ore deposit models seminar. Program and abstracts. Publication of Finnish
Association of Mining and Metallurgical Engineers, Serie B, No B94, pp 13-16.
Li, C. and Ripley, E.M., 2009. Sulfur Contents at Sulfide‐Liquid or Anhydrite Saturation in Silicate Melts:
Empirical Equations and Example Applications, Econ. Geol. 104, 405–412.
Maier, W.D., 2005. Platinum-group element (PGE) deposits and occurrences: mineralization styles, genetic
concepts, and exploration criteria. Invited presidential review, Journal of African Earth Sciences, 41, 165-191.
Naldrett, A.J., 1981. Platinum-group element deposit. in Cabri, L.J., (ed.) Platinum-group elements: mineralogy,
geology, recovery. Montreal. Canadian Institute of Mining and Metallurgy, 197-231. (CIM Spec. vol. 23).
Naldrett, A.J. and Cabri, L.J., 1976. Ultramafic and related mafic rocks: their classification and genesis with
special reference to the concentration of nickel sulfides and Platinum-Group Elements. Econ. Geol. 71, 1131-
1158.
Schanche, M., Iljina, M. and Larsen, R., 2012. New nickel, copper and platinum-group element discoveries in
northern Norway. Mineralproduksjon 2 (2012), 91-99. Norsk Bergforening.
R e i n f j o r d d r i l l i n g a n d m a p p i n g c a m p a i g n s i n 2 0 1 2 P a g e | 24
Markku Iljina GeoConsulting
Whole-rock Cu/Pd and Cu/3PM ratios (following page) along drill holes RF-1 and RF-2. 3PM = Pd+Pt+Au. APPENDIX A
RF-1 RF-2
To [m] Cu/Pd [103]
3.20
6.00
8.00
11.60
12.55
13.78
14.50
15.40
16.60 58.8
20.00
23.50
24.75
28.65
29.20
31.45
31.90
35.00
38.50
39.75
44.50
45.40
50.00 35.4
52.00
54.00 59.4
56.00
58.00 42.9
60.00 20.0
62.00 34.8
64.00 46.2
66.00
68.00 24.1
70.00 20.9
72.00
74.00 36.5
76.00 41.2
78.00 58.1
80.00 30.2
82.00 36.0
84.00 12.6
86.00 13.2
88.00 42.1
88.45 66.5
89.13 86.5
91.00 78.8
93.00 10.8
95.00 11.5
97.00 27.4
99.00 27.6
101.00 14.2
103.00
105.00 3.2
107.00 5.4
107.75 19.0
109.45 1.4
110.20 0.5
110.60 7.1
111.00 4.4
113.00 2.3
115.00 10.0
117.00 21.3
119.00 46.5
121.00 44.8
123.00 10.7
125.00 13.3
127.00 13.4
129.00 17.4
131.00 69.6
133.00 77.9
135.00 14.9
137.00
139.00
140.05 0.8
142.10
142.80 5.6
144.00
145.00
147.00
149.00
151.00
154.65
155.45
157.90
159.88 64.3
160.87
163.25
165.77
166.52
170.00
172.00
174.00
176.50
179.28
180.13
182.50
185.28
186.26
189.70 18.7
190.45 13.7
191.00 21.1
193.00
195.00
197.00 7.8
199.00 15.6
201.00 4.9
203.00 32.1
205.00
207.00 34.9
209.00
211.00 32.1
213.00 30.9
215.00 24.1
216.00 33.7
218.00 2.2
220.00 2.8
222.00 16.7
224.00 17.8
226.00
228.00
230.00
232.00 4.1
234.00 4.8
236.00 4.1
238.00 2.6
240.00 5.0
242.50 5.2
To [m] Cu/Pd [103]
4.01
5.24
8.05
9.50
11.50
13.50
14.30
17.00
19.00 48.5
21.00
23.10
25.20
26.35
28.60
30.75
32.00
34.00
36.00
37.20
39.15
41.40
42.60
44.90 47.7
47.96 34.4
49.00 25.3
51.30 71.8
53.60 33.2
54.40
56.95
59.30
61.30 15.0
63.20 3.6
65.38 4.1
66.66
69.70
72.57 11.9
73.80
76.20 11.9
77.50
80.00 38.5
82.00
84.00 19.7
86.00 70.1
88.00
90.00
92.00 110.6
94.00
96.00
98.00
100.00 33.3
102.00 21.1
104.00 8.7
106.00 13.9
108.00 53.9
110.00 29.0
112.00
114.00
116.00 17.8
118.00 32.5
120.00 58.3
122.00 58.4
124.00 102.6
126.00 99.1
128.00 92.3
130.00 59.3
132.00
134.00
135.20
136.70
139.20
139.83
141.75 85.4
143.75
146.00 37.6
148.20 85.6
150.50
152.30
154.30
156.30
158.30
160.30
164.10
167.50
168.15
169.20

R e i n f j o r d d r i l l i n g a n d m a p p i n g c a m p a i g n s i n 2 0 1 2 P a g e | 25
Markku Iljina GeoConsulting
To [m] Cu/3PM
3.20
6.00 3.66E+04
8.00
11.60 1.43E+05
12.55
13.78
14.50
15.40
16.60 5.88E+04
20.00
23.50
24.75
28.65
29.20
31.45
31.90
35.00
38.50
39.75
44.50
45.40
50.00 2.04E+04
52.00
54.00 1.50E+04
56.00 8.86E+03
58.00 1.47E+04
60.00 1.00E+04
62.00 1.02E+04
64.00 1.12E+04
66.00 2.69E+04
68.00 9.97E+03
70.00 2.09E+04
72.00 8.68E+04
74.00 1.76E+04
76.00 1.98E+04
78.00 2.30E+04
80.00 1.34E+04
82.00 1.34E+04
84.00 5.53E+03
86.00 6.52E+03
88.00 1.74E+04
88.45 1.98E+04
89.13 2.10E+04
91.00 2.04E+04
93.00 4.16E+03
95.00 4.31E+03
97.00 1.03E+04
99.00 8.27E+03
101.00 4.60E+03
103.00 1.58E+04
105.00 1.53E+03
107.00 2.67E+03
107.75 8.63E+03
109.45 7.00E+02
110.20 2.61E+02
110.60 3.57E+03
111.00 1.46E+03
113.00 1.00E+03
115.00 4.46E+03
117.00 8.54E+03
119.00 1.73E+04
121.00 1.37E+04
123.00 4.60E+03
125.00 5.49E+03
127.00 5.71E+03
129.00 7.54E+03
131.00 2.28E+04
133.00 2.29E+04
135.00 5.55E+03
137.00
139.00 2.46E+04
140.05 3.85E+02
142.10
142.80 2.34E+03
144.00
145.00
147.00
149.00
151.00
154.65
155.45
157.90
159.88 6.43E+04
160.87
163.25
165.77
166.52
170.00
172.00
174.00
176.50
179.28
180.13
182.50
185.28
186.26
189.70 1.87E+04
190.45 1.37E+04
191.00 1.27E+04
193.00
195.00 2.09E+04
197.00 7.77E+03
199.00 6.16E+03
201.00 2.43E+03
203.00 6.70E+03
205.00
207.00 1.11E+04
209.00 1.35E+04
211.00 1.55E+04
213.00 1.50E+04
215.00 8.91E+03
216.00 8.64E+03
218.00 1.17E+03
220.00 1.17E+03
222.00 8.10E+03
224.00 1.78E+04
226.00
228.00
230.00 1.68E+04
232.00 2.61E+03
234.00 2.68E+03
236.00 2.44E+03
238.00 1.63E+03
240.00 2.50E+03
242.50 2.50E+03
RF-1 RF-2
To [m] Cu/3PM
4.01
5.24
8.05
9.50
11.50 4.17E+04
13.50 3.62E+04
14.30
17.00
19.00 2.56E+04
21.00 1.88E+04
23.10
25.20
26.35
28.60
30.75
32.00
34.00
36.00
37.20
39.15
41.40
42.60
44.90 2.25E+04
47.96 1.38E+04
49.00 9.04E+03
51.30 7.18E+04
53.60 3.32E+04
54.40
56.95
59.30 1.80E+04
61.30 8.08E+03
63.20 2.21E+03
65.38 2.15E+03
66.66 4.53E+03
69.70
72.57 6.11E+03
73.80 5.18E+03
76.20 5.83E+03
77.50
80.00 1.70E+04
82.00 6.36E+03
84.00 8.41E+03
86.00 1.66E+04
88.00 3.72E+04
90.00 4.85E+04
92.00 2.99E+04
94.00 2.69E+04
96.00 2.24E+04
98.00 1.67E+04
100.00 1.04E+04
102.00 6.02E+03
104.00 3.89E+03
106.00 5.53E+03
108.00 7.88E+03
110.00 1.06E+04
112.00 2.28E+04
114.00 1.87E+04
116.00 5.58E+03
118.00 1.21E+04
120.00 1.73E+04
122.00 3.13E+04
124.00 4.72E+04
126.00 4.11E+04
128.00 2.80E+04
130.00 2.18E+04
132.00
134.00 8.12E+04
135.20
136.70
139.20
139.83
141.75 8.54E+04
143.75
146.00 1.47E+04
148.20 2.49E+04
150.50 #JAKO/0!
152.30 6.48E+04
154.30
156.30
158.30 2.81E+04
160.30 7.87E+04
164.10
167.50
168.15
169.20