Embed Size (px)
Citation preview
For Peer Review
Spatial management of marine resources can enhance the
recovery of predators and avoid local depletion of forage fish
Journal: Conservation Letters
Manuscript ID: CONL-12-0017.R2
Manuscript Type: Letters
Date Submitted by the Author: n/a
Complete List of Authors: Eero, Margit; Technical University of Denmark, National Institute of Aquatic
Resources Vinther, Morten; Technical Unoversity of Denmark, National Institute of Aquatic Resources Haslob, Holger; Helmholtz Centre for Ocean Research Kiel, Huwer, Bastian; Technical University of Denmark, National Institute of Aquatic Resources Casini, Michele; Swedish Institute of Agricultural Sciences, Departement of Aquatic Resources Storr-Paulsen, Marie; Technical University of Denmark, National Institute of Aquatic Resources Köster, Friedrich; Technical University of Denmark, National Institute of Aquatic Resources
Keywords: predator-prey overlap, stock recovery, species distribution, food limitation, ecosystem based fisheries management, Baltic Sea, cod, forage fish, local depletion
Privileged Communication

For Peer Review
1
Spatial management of marine resources can enhance the recovery of predators and avoid 1
local depletion of forage fish 2
3
Margit Eero1, Morten Vinther
1, Holger Haslob
2*, Bastian Huwer
1, Michele Casini
3, Marie Storr-4
Paulsen1, Friedrich W. Köster
1 5
6 1Technical University of Denmark, National Institute of Aquatic Resources, Charlottenlund 7
Castle, DK- 2920, Charlottenlund, Denmark 8 2Helmholtz Centre for Ocean Research Kiel (GEOMAR), Düsternbrooker Weg 20, 24105, Kiel, 9
Germany 10 3Swedish University of Agricultural Sciences, Department of Aquatic Resources, Institute of 11
Marine Research, 45330 Lysekil, Sweden 12
*present address: Thünen-Institute of Sea Fisheries, Palmaille 9, 22767, Hamburg, Germany 13
14
15
Emails: [email protected] (M.E.); [email protected]( M.V.); [email protected] (H.H); 16
[email protected] (B.H.); [email protected] (M.C.); [email protected] (M.S-P.); 17
[email protected] (F.W.K) 18
19
Running title: spatial management of marine ecosystem 20
21
Key words: Baltic Sea, cod recovery, ecosystem based fisheries management, food limitation, 22
forage fish, local depletion, predator-prey overlap, species distribution 23
24
Type of article: a letter 25
Number of words: 147 (abstract); 2839 (main text) 26
Number of references: 40 27
Number of figures: 5 28
Number of tables: 0 29
30
Corresponding author: 31
32
Margit Eero 33
Technical University of Denmark 34
National Institute of Aquatic Resources 35
Charlottenlund Castle, 2920 Charlottenlund, Denmark 36
Tel.:+45 3588 3318 37
Fax: +45 3588 3333 38
Email: [email protected] 39
40
41
42
Page 1 of 24 Privileged Communication
For Peer Review
2
Abstract 43
44
The eastern Baltic cod stock has recently started to recover, after two decades of severe 45
depletion, however with unexpected side-effects. The stock has not re-occupied its former wide 46
distribution range, but remains concentrated in a limited area in the southern Baltic Sea. The 47
biomass of forage fish, i.e. sprat and herring, is historic low in this area, which in combination 48
with increasing cod stock results in locally high predation mortality of forage fish and 49
cannibalism of cod. In line with low prey availability, body weight and nutritional condition of 50
cod drastically declined. In the southern Baltic Sea, cod competes with pelagic fisheries for the 51
limited resources of sprat and herring, while the largest biomass of these species is currently 52
found outside the distribution range of cod. Accounting for spatial overlap between species is 53
crucial in developing ecosystem based fisheries management to enhance the recovery of predator 54
stocks. 55
56
57
58
Page 2 of 24Privileged Communication

For Peer Review
3
Introduction 59
60
In order to achieve healthy marine ecosystems, an ecosystem-based approach to fisheries 61
management has been widely acknowledged as the fundamental principle for sustainable 62
resource use (Pikitch et al. 2004; McLeod & Leslie 2009). The underlying aim of this approach 63
is ecologically sound resource management that responds to ecosystem processes, including 64
species interactions (Marasco et al. 2007). The concerns of marine animal population’s 65
conservation and recovery are today largely focused on predator species, which have declined 66
worldwide over the past decades (Myers & Worm 2003). Species interactions are considered to 67
influence their recovery mainly through mortality due to predation (MacKenzie et al. 2011; 68
Swain & Mohn 2012). In contrast, the abundance of forage fish as a food resource for predators 69
is usually not included in management strategies aimed to recover the predator stocks. This is 70
probably because declines in predator species have in many cases been followed by a 71
pronounced increase in prey biomass (Myers and Worm 2003; Baum & Worm 2009), and food 72
limitation for recovering predator populations is therefore not expected. 73
74
Nevertheless, the ecosystems where predator species have to recover may have different 75
structural and functional properties from those where they once were abundant (Bakun and 76
Weeks 2006; Hammer et al. 2010). Recovery potential of predators may be affected by factors 77
such has changes in habitats and species interactions, which may include spatial overlap between 78
the predators and prey (Kempf et al. 2010). Especially in a wasp-waist type ecosystem like the 79
Baltic Sea, where a few forage fish species dominate the intermediate trophic level, changes in 80
abundance or distribution of these species can have large implications for higher trophic levels 81
Page 3 of 24 Privileged Communication

For Peer Review
4
(Bakun 2006; Smith et al. 2011). In the Baltic Sea, cod has been severely depleted for about 20 82
years during which a major restructuring of the ecosystem has occurred (Möllmann et al. 2009; 83
Casini et al. 2009), including an increase in the biomass of sprat, i.e. one of the major prey 84
species for cod (Köster et al. 2003). Since 2007, the eastern Baltic cod population has started to 85
recover, partly due to effective management measures (Eero et al. 2012). Unexpectedly, and 86
despite the biomass still being relatively low compared to historical levels, recent observations 87
show that the cod has become lean, which indicates food limitation. 88
89
In this paper we apply a spatially resolved multi-species model for the Baltic Sea to elucidate 90
area-specific population dynamics of adult cod and its major fish prey (sprat and herring), 91
including spatially explicit predation mortalities by cod. Further, we document recent changes in 92
body weight and nutritional condition of cod and relate these to the local availability of sprat and 93
herring. Our analyses highlight the need for taking into account species distribution in 94
developing ecosystem based fisheries management strategies, to sustain a sufficient prey biomass 95
in the areas of high predator abundance to enhance its recovery and at the same time avoid local 96
depletion of forage fish. 97
98
99
Material and methods 100
101
Spatially resolved biomasses and predation mortalities of cod, sprat and herring 102
103
Page 4 of 24Privileged Communication
For Peer Review
5
The eastern Baltic cod is assessed and managed as one stock unit covering ICES Subdivisions 104
(SD) 25–32 in the Baltic Sea (see Fig. 1 for location of SDs). Sprat is considered as one stock for 105
the entire Baltic Sea (SD 22–32), while the central Baltic herring assessment and management 106
cover SD 25–29&32. In this paper, biomasses and predation mortalities of the three species were 107
estimated separately for four areas in the Baltic Sea, i.e. SD 25, SD 26, SD 28 and SD 27, 29 and 108
32 combined (Fig. 1). For the purpose of investigating the dynamics of predators compared to 109
prey, cod stock size was represented by numbers of individuals instead of biomass, as the body 110
weight incorporated in biomass is already influenced by prey availability. 111
112
The analyses were conducted applying a Stochastic Multi Species (SMS) model (Lewy & 113
Vinther 2004), which is regularly used for scenario forecasts and management strategy 114
evaluations in the Baltic and North Sea. The SMS includes estimation of predation mortalities 115
from observation of catches, survey indices and stomach contents. The predation mortalities of 116
sprat and herring represent predation by cod. Predation mortality on young age-groups of cod 117
represents cod cannibalism. The data on stock distribution by year and quarter were derived from 118
research surveys supplemented with information from commercial catches. A description of the 119
model procedures related to estimation of predation mortalities and area-specific stock sizes is 120
provided in Supplement 1, including the sources where further information on the model can be 121
found. 122
123
Mean weight and energy status of cod 124
125
Page 5 of 24 Privileged Communication
For Peer Review
6
Changes in mean weight of cod by age in SD 25 were analysed using international data from 126
commercial catches for 1976–2010. Anomalies in cod weight by age and year were calculated as 127
difference from the long-term mean. To supplement the information on changes in mean weight 128
with indices of energy status of cod, Fulton’s condition factor (K) and hepatosomatic condition 129
index (HSI) were calculated. Analyses of Fulton’s condition factor (K) were based on data on 130
total length (Lt) and whole weight (W) of individual cod sampled on Danish and German 131
research cruises in SD 25, in the 1st and 2
nd quarter of the year, in the period from 1994 to 2011. 132
The analyses included adult cod between 40 and 60 cm in length (approximately 400–2000 fish 133
per year). The cod with Fulton’s K below 0.8 were classified as being in low condition, 134
according to Marteinsdottir and Begg (2002). Hepatosomatic condition index (HSI) was 135
calculated for pre-spawning time based on data from German research cruises in the 2nd
quarter 136
of the year (1996–2011), as the ratio between liver weight (WL) and ovarian free body weight, 137
i.e. total weight (W) minus ovary weight (WO) (Marteinsdottir & Begg 2002): 138
139
O
L
WW
WHSI
−= *100 140
The hepatosomatic index was estimated only for females, at 40–60 cm and >60cm in length 141
(based on approximately 200–400 and 10–20 fish per year, respectively). 142
143
Cod stomach data 144
145
On German research surveys in the 2nd
and 3rd
quarter in 1999–2011, cod stomachs have been 146
recorded as empty or containing food items. The proportion of non-empty stomachs in each year 147
Page 6 of 24Privileged Communication
For Peer Review
7
was calculated as an average of the data for the two quarters, for all length-groups combined. 148
The analyses excluded juveniles as well as individuals at a stage of active spawning. 149
150
Results 151
152
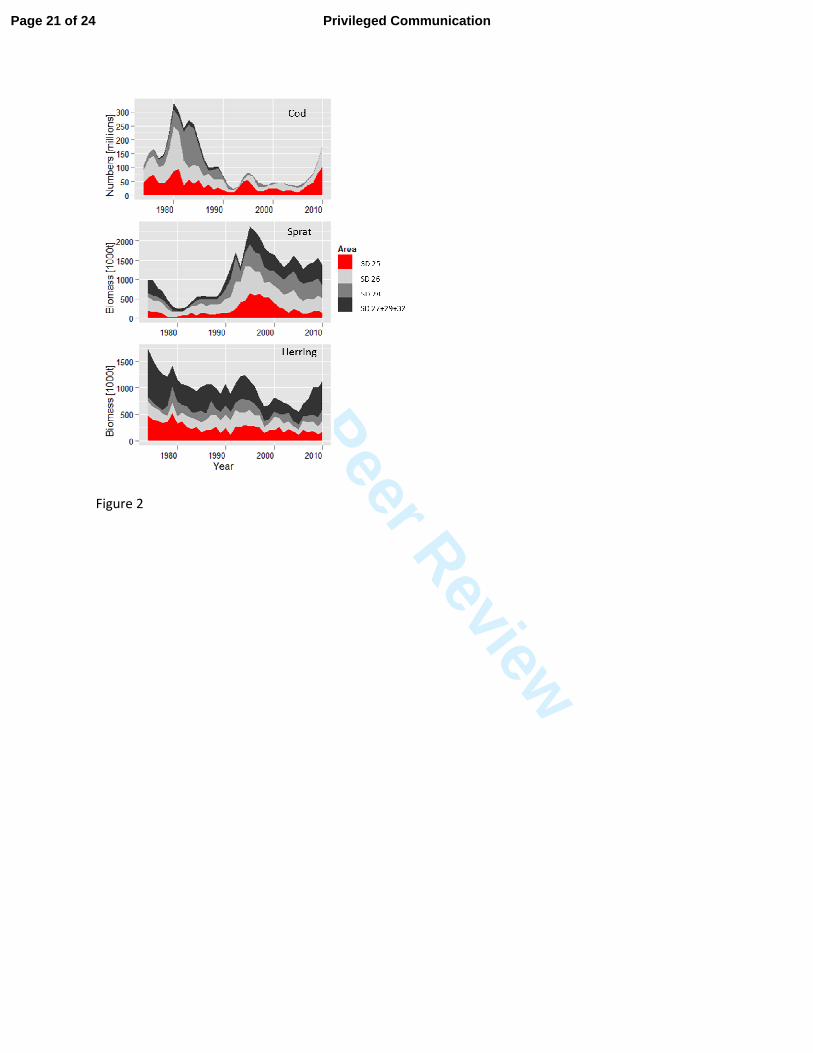
The abundance of adult cod (age-groups 4 and older) in the entire eastern Baltic Sea (SD 25–32) 153
is currently estimated to be only about a half of the historic high stock size observed in the early 154
1980s. However, in SD 25, the present density of cod is close to the highest level in the time-155
series since the 1970s (Fig. 2). Since 2007, the number of cod in this area sharply increased, 156
whereas in the northeastern Baltic Sea (SD 26–32), the abundance of cod has been relatively low 157
since the 1990s. Thus, most of the adult cod is currently concentrated in SD 25. In contrast, only 158
about 10–15 percent of the herring and sprat biomass is distributed in SD 25. Largest 159
concentrations of both species are found in SDs 28–32, i.e. out of the current distribution area of 160
cod. 161
162
The relatively low biomass of clupeids (sprat and herring) in combination with an increasing cod 163
stock in SD 25 has resulted in a steep decline in the ratio of prey to predators, with the lowest 164
biomass of clupeids relative to the abundance of cod in 2009–2010 (Fig. 3). Concurrent with the 165
decline in prey biomass, mean weight of larger cod (age-groups 4–7) sharply declined to record 166
low values since 2007 (Fig. 3). In line with reduced prey availability, the proportion of cod with 167
food in the stomachs declined from 50 percent in the early 2000s to 20 percent in 2011 (Fig. 3). 168
Moreover, in the 1990s–early 2000s, almost no cod in SD 25 were found in low somatic 169
condition, i.e. had Fulton’s K values below 0.8, whereas in 2011, 15 percent of cod at 40–60 cm 170
Page 7 of 24 Privileged Communication
For Peer Review
8
in length was at such low condition (Fig. 4). Also, the average hepatosomatic condition (HSI) of 171
cod is currently the lowest in the time-series since 1996 (Fig. 4). 172
173
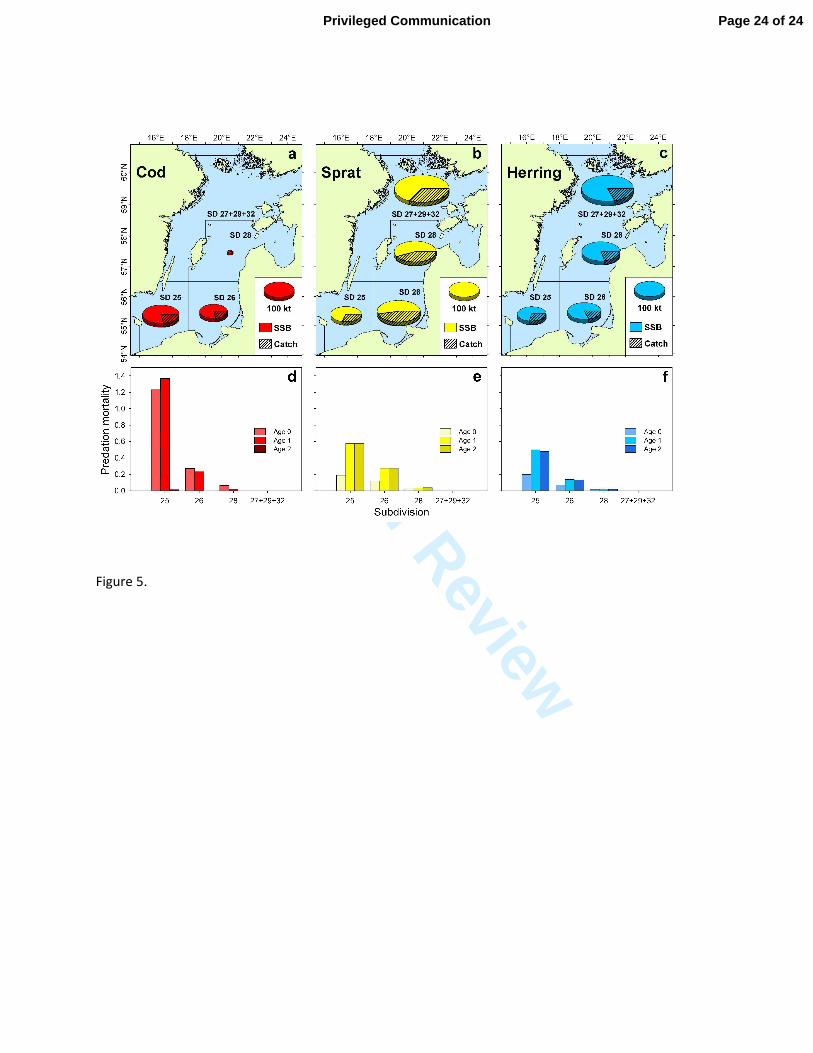
The high density of cod in SD 25 is reflected in a pronounced cannibalism taking place in this 174
area, compared with much lower or negligible predation mortalities of young cod (age-groups 0–175
2) estimated for the other areas (SD 26–32) (Fig. 5). Similarly, predation pressure on sprat and 176
herring is highest in SD 25, with intermediate levels in SD 26 and almost no predation in SD 27–177
32 (Fig. 5). Fisheries in the Baltic Sea are targeting all three species and are conducted in the 178
entire distribution area of the stocks. Sprat and herring in SD 25 are currently harvested at a 179
similar rate than the stock components distributed in SD 26–32 (Fig. 5). Consequently, the small 180
stock components of sprat and herring located in SD 25 are exposed to a high pressure both from 181
exploitation and predation. In contrast, the abundant resources of clupeids in the northern areas 182
(SD 28–32) are less utilized (Fig. 5). 183
184
185
Discussion 186
187
The ecological consequences of declines in marine predator populations are well-documented, 188
including trophic cascade effects, which have in some cases led to major restructuring of food 189
webs (Pace et al. 1999; Shurin et al. 2002). In contrast, the ecological effects of the return of a 190
predator to such ecosystem are less clear. The Baltic Sea is an example of an ecosystem that has 191
undergone major structural changes subsequent to a more than ten-fold decline in cod biomass 192
from the late 1980s to the 1990s (Möllmann et al. 2009; Casini et al. 2009). Before the late 193
Page 8 of 24Privileged Communication
For Peer Review
9
1980s, cod was widely distributed in the entire Baltic Proper (Aro 2000; Eero et al. 2007). The 194
collapse of cod involved a contraction of the stock to SD 25 in the southern Baltic Sea (Fig. 2). 195
The hydrographic conditions in the eastern spawning grounds (in SDs 26&28) did no longer 196
allow for regular survival of cod eggs, and SD 25 has been basically the only area supporting 197
successful reproduction of the eastern Baltic cod since the mid-1980s (Köster et al. 2009). The 198
recent recovery of cod in SD 25 has resulted in the highest cod abundance recorded in this area 199
in the time series since the 1970s (Fig. 2), which is also higher than the historical estimates going 200
back to the 1950s (Eero et al. 2007). The stocks of the main pelagic prey for cod, sprat and 201
herring, have on the other hand increased in the northern Baltic since the early 1990s (Casini et 202
al. 2011). Our study suggests that in this largely modified ecosystem set-up, the carrying 203
capacity for cod in SD 25 may have been reached, indicated by record low weight and 204
deteriorated condition of adult cod. 205
206
Variations in cod growth in other regions of the North Atlantic have been linked to density-207
dependent effects and hydrological conditions, or a combination of both (Swain et al. 2003 and 208
references therein). The growth of the eastern Baltic cod has been described earlier as density 209
dependent and affected by the relative availability of clupeid prey (Baranova 1992). In addition, 210
oxygen concentration affects cod metabolism with impacts on growth and condition (Hinrichsen 211
et al. 2011). Therefore, variable hydrographic conditions by sub-regions in the Baltic Sea 212
prevent direct comparisons of cod weight and condition between sub-areas in relation to prey 213
availability. However, the sharp decline in cod weight in SD 25 since 2007, concurrent with a 214
rapid local increase of the stock size, can hardly be due oxygen conditions affecting cod 215
physiology and growth directly, as oxygen conditions deteriorated already since the 1990s 216
Page 9 of 24 Privileged Communication
For Peer Review
10
(Hinrichsen et al. 2011). This suggests that the recent dramatic change in cod growth in SD 25 is 217
due to food limitation and density-dependence. 218
219
In addition to clupeid prey, adult cod is cannibalistic and preys as well on benthic invertebrates 220
(Uzars 1994). Utilization of benthic food resources by cod is believed to be reduced at low 221
oxygen concentrations in deeper water layers, when cod is more pelagic (Schaber et al. 2009). At 222
present ecological conditions, the alternative food resources seem not to be able to compensate 223
for the shortage of clupeids in SD 25, indicated by an increasing proportion of empty stomachs 224
and a close correspondence between the availability of sprat and herring and the weight of adult 225
cod in this area (Fig. 3). However, the extent of movement of cod into areas with better feeding 226
conditions and the factors preventing or promoting this need to be investigated to improve the 227
process knowledge of the current ecological status of the Baltic Sea. 228
229
Multi-species and ecosystem models are considered as necessary tools to further develop 230
ecosystem based fisheries management and evaluate the ecosystem consequences of proposed 231
management actions (Sainsbury et al. 2000). Importantly, multi-species tradeoffs and community 232
responses to management schemes need to be examined across broader spatial scales (Kellner & 233
Hastings 2009; Bartolino et al. 2012). The recent developments in the Baltic Sea support the 234
importance of incorporating spatial aspects in the analyses of species interactions, to be able to 235
identify processes, which operate on a local scale, but potentially have wider ecosystem 236
consequences. At the present distribution of the fish stocks in the Baltic Sea, intensive predator-237
prey interactions are taking place only in a limited area in the southern Baltic Sea. The present 238
density-dependence and related high cannibalism of cod can be expected to have negative 239
Page 10 of 24Privileged Communication
For Peer Review
11
impacts on cod recruitment. However, as a counteracting mechanism, low abundance of clupeids 240
reduces predation pressure on cod eggs (Köster et al. 2003). Further, the current food limitation 241
and consequent low weight and condition of adult cod in its main reproduction and distribution 242
area may lower the productivity of the stock (Rätz and Lloret 2003) and limit its further 243
recovery. At the same time, fisheries are competing with cod for the limited resources of sprat 244
and herring in this area, which results in a substantially higher mortality on these local stock 245
components of forage fish compared to the abundant resources distributed in the northern Baltic 246
Sea. 247
248
Forage fish are generally considered a central part of the ecosystem based fisheries management, 249
especially to avoid ecosystem overfishing when forage species, which serve as a prey for other 250
fish and marine top-predators, are also targeted by fisheries (Pikitch et al 2004). However, the 251
spatial scale at which these mechanisms operate is usually not explicitly considered in 252
management strategies, although the importance of spatial heterogeneity and dynamics in marine 253
ecosystems is increasingly recognized (Lorenzen et al. 2010). Spatial fisheries management 254
measures are conventionally implemented in the form of spatio-temporal closures to protect 255
threatened species or habitats, while the use of spatial management measures to protect prey 256
biomass for predator fish is not common. Concerns of local food limitations usually relate to 257
charismatic marine top predators such as sea lions (Witherell et al. 2000) or seabirds (Cury et al. 258
2011), which in some cases has led to fisheries moratoria on local prey populations (Greenstreet 259
et al. 2006). 260
261
Page 11 of 24 Privileged Communication
For Peer Review
12
The eastern Baltic cod is one of the first examples of partial recovery of a heavily exploited 262
demersal fish stock in North Atlantic waters in recent decades. The unexpected density 263
dependent effects which have become apparent in the core distribution area of the stock illustrate 264
that novel management measures are increasingly needed to support the recovery of predator 265
species in ecosystems, which in fact may not be any longer structured to sustain large cod stocks 266
(Frank et al. 2005). The present situation in the Baltic, with a high cod stock in the south and 267
large biomass of clupeids in the north, calls for a spatially explicit management of these 268
resources. A decrease in fishing pressure on clupeids in the south would likely enhance cod 269
growth in the area and thus have a positive effect on cod recovery. On the other hand, a relatively 270
higher fishing pressure on clupeids in the north could release clupeid competition in these areas 271
(Casini et al. 2011), and release prey-to-predator feedback loops (Bakun and Weeks 2006), 272
which could also be beneficial for cod in case the hydrological conditions would allow cod to 273
spawn in more northern areas. 274
275
With increasing use of the marine environment, spatial aspects in marine management are getting 276
increasingly important including conservation issues which are becoming an integral part of the 277
overall spatial planning (Mackelworth 2012). Implementation of ecosystem approach to fisheries 278
management should be seen in conjunction with this process, given the spatial heterogeneity in 279
fish populations (Norse et al. 2010). The Baltic Sea is currently chosen as a pilot case for taking 280
into account biological interactions in the new fisheries management plans being under 281
development in the European Commission. Thus, the experiences from the Baltic Sea can serve 282
as a basis for similar developments elsewhere. This study is intended to contribute to this process 283
by highlighting the importance of taking into account biological interactions at an appropriate 284
Page 12 of 24Privileged Communication
For Peer Review
13
spatial scale, in order to achieve a healthy balance between species, on both local and regional 285
sea wide scales. 286
287
288
Acknowledgements 289
290
The research leading to these results has received funding from the European 291
Community’s Seventh Framework Programme (FP7/2007–2013) under Grant Agreement No. 292
266445 for the project Vectors of Change in Oceans and Seas Marine Life, Impact on Economic 293
Sectors (VECTORS) and EU FP7 Integrated Project 212085 (MEECE). The results of this study 294
contribute to the FP7 project FACTS (024966). MC was partially funded by the Swedish project 295
“Planktivore management—linking food web dynamics to fisheries in the Baltic Sea” (PLAN 296
FISH). The efforts of ICES working groups over past decades producing area-disaggregated data 297
for the Baltic fish stocks, utilized in this paper, are greatly acknowledged. 298
299
References 300
301
Aro, E. (2000) The Spatial and Temporal Distribution Patterns of Cod (Gadus morhua callarias 302
L.) in the Baltic Sea and Their Dependence on Environmental Variability –Implications for 303
Fishery Management. Academic Dissertation, University of Helsinki, Helsinki. ISBN 951–304
776–271–2. 75 pp. 305
Baranova, T. (1992) On the growth of eastern Baltic cod. ICES CM Document, 1992/J:29. 306
Page 13 of 24 Privileged Communication

For Peer Review
14
Bartolino, V., Ciannelli, L., Spencer, P., Wilderbuer, T.K., Chan, K.S. (2012) Scale-dependent 307
detection of the effects of harvesting a marine fish population. Mar Ecol Prog Ser 444, 251–308
272. 309
Bakun, A. (2006) Wasp-waist populations and marine ecosystem dynamics: Navigating the 310
‘‘predator pit’’ topographies. Prog Oceanogr 68, 271–288. 311
Bakun, A., Weeks, S.J. (2006). Adverse feedback sequences in exploited marine systems: are 312
deliberate interruptive actions warranted? Fish and Fisheries, 7: 316-333. 313
Baum, J., Worm, B. (2009) Cascading top-down effects of changing oceanic predator 314
abundances. J Anim Ecol 78, 699–714. 315
Casini, M., Hjelm, J., Molinero, J.C., Lovgren, J., Cardinale M, Bartolino, V., Belgrano, A., 316
Kornilovs, G. (2009) Trophic cascades promote threshold-like shifts in pelagic marine 317
ecosystems. Proc Natl Acad Sci USA 106, 197–202. 318
Casini, M., Kornilovs, G., Cardinale, M., Möllmann, M., Grygiel, W., Jonsson, P., Raid, T., 319
Flinkman, J. and Feldman, V. (2011) Spatial and temporal density-dependence regulates the 320
condition of central Baltic Sea clupeids: compelling evidence using an extensive international 321
acoustic survey. Pop Ecol 53, 511–523. 322
Cury, P.M., Boyd, I.J., Bonhommeau, S., Anker-Nilssen, T., Crawford, R.J.M., Furness, R.W., 323
Mills, J.A., Murphy, E.J., İsterblom, H., Paleczny, M., Piatt, J.F., Roux, J.-P., Shannon, L., 324
Sydeman, W.J. (2011) Global seabird response to forage fish depletion-one third for the birds. 325
Science 334, 1703–1706. 326
Eero, M., Köster, F.W., Plikshs, M., Thurow, F. (2007) Eastern Baltic cod (Gadus morhua 327
callarias ) stock dynamics: Extending the analytical assessment back to the mid-1940s. ICES 328
J Mar Sci 64, 1257–1271. 329
Page 14 of 24Privileged Communication

For Peer Review
15
Eero, M., Köster, F.W., Vinther, M. (2012) Why is the eastern Baltic cod recovering? Mar Pol 330
36, 235–240. 331
Frank, K.T., Petrie, B., Choi, J.S., Leggett, W.C. (2005) Trophic cascades in a formerly cod 332
dominated ecosystem. Science 308, 1621–1623. 333
Greenstreet, S.P.R., Armstrong, E., Mosegaard, H., Jensen, H., Gibb, I. M., Fraser, H.M., 334
Scott, B.E., Holland, G.J., Sharples, J. (2006) Variation in the abundance of sandeels 335
Ammodytes marinus off southeast Scotland: an evaluation of area-closure fisheries 336
management and stock abundance assessment methods. ICES J Mar Sci 63, 1530–1550. 337
Hammer, C., von Dorrien, C., Hopkins, C. C. E., Köster, F.W., Nilssen, E. M., St John, M., 338
Wilson, D. C. (2010) Framework of stock-recovery strategies – analyses of factors affecting 339
success and failure. ICES J Mar Sci 67, 1849–1855. 340
Hinrichsen, H-H., Huwer, B., Makarchouk, A., Petereit, C., Schaber, M., Voss, R. (2011) 341
Climate-driven long-term trends in Baltic Sea oxygen concentrations and the potential 342
consequences for eastern Baltic cod (Gadus morhua). ICES J Mar Sci 68, 2019–2028. 343
Kellner, J.B., Hastings, A. (2009) A reserve paradox: introduced heterogeneity may increase 344
regional invasibility. Conserv Lett 2, 115–122. 345
Kempf, A., Dingsør, G.E, Huse, G., Vinther, M., Floeter, J., Temming, A. (2010) The 346
importance of predator-prey overlap: predicting North Sea cod recovery with a multispecies 347
assessment model. ICES J Mar Sci 67, 1989–1997. 348
Köster, F.W., Möllmann, C., Neuenfeldt, S., Vinther, M., St. John, M.A., Tomkiewicz, J., Voss, 349
R., Hinrichsen, H.-H., MacKenzie, B., Kraus, G., Schnack, D. (2003) Fish stock development 350
in the Central Baltic Sea (1974–1999) in relation to variability in the environment. ICES Mar 351
Sci Symp 219, 294–306. 352
Page 15 of 24 Privileged Communication
For Peer Review
16
Köster, F.W., Vinther, M., MacKenzie, B.R., Eero, M., Plikshs, M. (2009) Environmental 353
Effects on Recruitment and Implications for Biological Reference Points of Eastern Baltic 354
Cod (Gadus morhua). J Northw Atl Fish Sci 41, 205–220. 355
Lewy P., Vinther, M. (2004) A stochastic age-length structured multi-species model applied to 356
North Sea stocks. ICES CM Document, 2004/FF: 20. 357
Lorenzen, K., Steneck, R.S., Warner, R.R., Parma, A.M., Coleman, F.C., Leber, K.M. (2010) 358
The spatial dimension of fisheries: putting it all in place. B Mar Sci 86, 169–177. 359
Mackelworth, P. (2012) Peace parks and transboundary initiatives: implications for marine 360
conservation and spatial planning. Conserv Lett, doi: 10.1111/j.1755-263X.2012.00223.x 361
MacKenzie, B.R., Eero, M., Ojaveer, H. (2011) Could Seals Prevent Cod Recovery in the Baltic 362
Sea? PLoS ONE 6 (5), e18998. doi:10.1371/journal.pone.0018998 363
Marasco, R.J., Goodman, D., Grimes, C.B., Lawson, P.W., Punt, A.E., Quinn II, T.J. (2007) 364
Ecosystem-based fisheries management: some practical suggestions. Can J Fish Aquat Sci 64, 365
928–939. 366
Marteinsdottir, G., Begg, G.A. (2002) Essential relationships incorporating the influence 367
of age, size and condition on variables required for estimation of reproductive potential in 368
Atlantic cod Gadus morhua. Mar Ecol Prog Ser 235, 235–256. 369
McLeod, K.L., Leslie, H. (2009) Ecosystem-Based Management for the Oceans. Island Press, 370
Washington. 371
Myers, R.A., Worm, B. (2003) Rapid worldwide depletion of predatory fish communities. 372
Nature 423, 280–283. 373
Page 16 of 24Privileged Communication
For Peer Review
17
Möllmann, C., Diekmann, R., Müller-Karulis, B., Kornilovs, G., Plikshs, M., Axe, P. (2009) 374
Reorganization of a large marine ecosystem due to atmospheric and anthropogenic pressure: a 375
discontinuous regime shift in the Central Baltic Sea. Glob Change Biol 15, 1377–1393. 376
Norse, E.A. (2010) Ecosystem-based spatial planning and management of marine fisheries: why 377
and how? B Mar Sci 86, 179–195. 378
Pace, M.L., Cole, J.J., Carpenter, S.R., Kitchell, J.F. (1999) Trophic cascades revealed in diverse 379
ecosystems. Trends Ecol Evol 14, 483–488. 380
Pikitch, E.K., Santora, C., Babcock, E.A., Bakun, A., Bonfil, R., Conover, D.O., Dayton, P., 381
Doukakis, P., Fluharty, D., Heneman, B., Houde, E.D., Link, J., Livingston, P.A., Mangel, 382
M., McAllister, M.K., Pope, J., Sainsbury, K.J. (2004) Ecosystem-based fishery management. 383
Science 305, 346–347. 384
Rätz, H.-J., Lloret, J. (2003) Variation in fish condition between Atlantic cod (Gadus morhua) 385
stocks, the effect on their productivity and management implications. Fish Res 60, 369–380. 386
Sainsbury, K.J., Punt, A.E., Smith, A.D.M. (2000) Design of operational management strategies 387
for achieving fishery ecosystem objectives. ICES J Mar Sci 57, 731–741. 388
Schaber, M., Hinrichsen, H.-H., Neuenfeldt, S., Voss, R. 2009. Hydroacoustic resolution of 389
small-scale vertical distribution in Baltic cod Gadus morhua– habitat choice and limits during 390
spawning. Mar Ecol Prog Ser 377, 239-253. 391
Shurin, J.B., Borer, E.T., Seabloom, E.W., Anderson, K., Blanchette, C.A., Broitman, B., 392
Cooper, S.D., Halpern, B.S. (2002) A cross-ecosystem comparison of the strength of trophic 393
cascades. Ecol Lett 5, 785–791. 394
Page 17 of 24 Privileged Communication
For Peer Review
18
Smith, A.D., Brown, C.J., Bulman, C.M., Fulton, E.A., Johnson, P., Kaplan, I.C., Lozano-395
Montes, H., Mackinson, S., Marzloff, M., Shannon, L., Shin, Y., Tam, J. (2011) Impacts of 396
Fishing Low–Trophic Level Species on Marine Ecosystems. Science 333, 1147–1150. 397
Swain, D.P., Sinclair, A.F., Castonguay, M., Chouinard, G.A., Drinkwater, K.F., Fanning, L.P., 398
Clark, D.S. (2003). Density-versus temperature-dependent growth of Atlantic cod (Gadus 399
morhua) in the Gulf of St. Lawrence and on the Scotian Shelf. Can J Fish Aquat Sci 59, 327-400
341. 401
Swain, D.P., Mohn, R.K. (2012) Forage fish and the factors governing recovery of 402
Atlantic cod (Gadus morhua) on the eastern Scotian Shelf. Can J Fish Aquat Sci 69, 997–403
1001. 404
Uzars, D. (1994) Feeding of cod (Gadus morhua callarias L.) in the central Baltic in relation to 405
environmental changes. In: Cod and Climate Change (eds. Jakobsson, J., Astthorsson, O.S., 406
Beverton, R.J.H., Bjoernsson, B., Daan, N., Frank, K.T., Meincke, J., Rothschild, B., Sundby, 407
S., Tilseth, S.). Symp. on Cod and Climate Change, Reykjavik (Iceland), 23-27 Aug. 1993, 408
pp. 612–623. 409
Witherell, D., Pautzke, C., Fluharty, D. (2000) An ecosystem-based approach for Alaska 410
groundfish fisheries. ICES J Mar Sci 57, 771–777. 411
412
Page 18 of 24Privileged Communication
For Peer Review
19
Figure captions 413
414
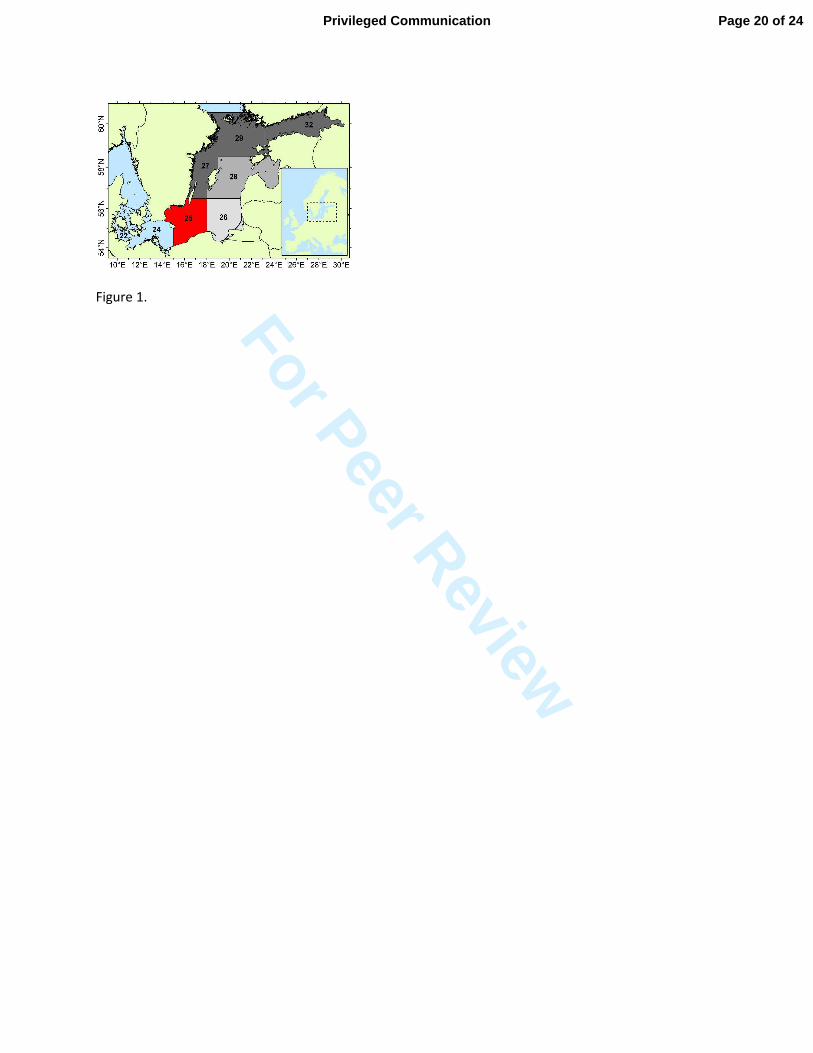
Figure1. ICES Subdivisions (SD) in the Baltic Sea, indicating the units applied for area-based 415
analyses (SD 25; SD 26, SD 28 and SD 27+29+32). 416
417
Figure 2. Time series of annual average abundance of adult cod (age-groups 4 and older), and 418
total biomass of sprat and herring, by area. 419
420
Figure 3. Anomalies in mean weight of cod (average of age-groups 4–7) in SD 25 (bars) 421
compared with changes in the biomass of clupeids (sprat and herring) relative to the number of 422
adult cod (at age 4 and older) in the same area (line). The stars show the proportion of cod 423
stomachs containing food items. 424
425
Figure 4. The percentage of cod at 40–60cm in length caught in SD 25 in 1994–2011, which 426
were at low somatic condition (Fulton’s K<0.8) (bars); and average hepatosomatic condition 427
index (HSI) of female cod in SD 25 in 1996–2011, by length-groups (40–60cm, >60cm), in the 428
second quarter of a year. The error bars represent standard error of the mean. 429
430
Figure 5. Panels a-c: Spawning stock biomass (SSB) of cod, sprat and herring, including the 431
proportion of catch (shown as sectors of SSB), by area (Subdivisions (SD)), in 2010. Panels d-f: 432
Predation mortality of cod, sprat and herring, for age-groups 0–2, by area (based on average 433
estimates for 2009–2010). 434
435
Page 19 of 24 Privileged Communication
For Peer Review
Figure 1.
Page 20 of 24Privileged Communication
For Peer Review
Figure 2
Page 21 of 24 Privileged Communication

For Peer Review
Year
1975 1980 1985 1990 1995 2000 2005 2010
Anomalies of cod weight
-0.3
-0.2
-0.1
0.0
0.1
0.2
0.3
0.4
Clupeids / Cod
0
10
20
30
40
50
60
Proportion of stomachs
0.1
0.2
0.3
0.4
0.5
0.6
Cod weight Clupeids / CodStomachs with food items
Figure 3
Page 22 of 24Privileged Communication

For Peer ReviewYear
1994 1996 1998 2000 2002 2004 2006 2008 2010
Proportion of cod at low condition (Fulton K<0.8)
0.00
0.02
0.04
0.06
0.08
0.10
0.12
0.14
0.16
0.18
Hepatosomatic condition index (HSI)
3
4
5
6
7
8
9
Fulton K < 0.8, 40-60 cm
HSI, 40-60 cm
HSI, >60 cm
Figure 4
Page 23 of 24 Privileged Communication
For Peer Review
Figure 5.
Page 24 of 24Privileged Communication