Embed Size (px)
Citation preview

For Peer Review
Pharmacokinetics evaluation and establishment of in vitro-
in vivo correlation of extended release dosage form of Milnacipran HCl
Journal: Biopharmaceutics & Drug Disposition
Manuscript ID: Draft
Wiley - Manuscript type: Original Papers
Date Submitted by the Author: n/a
Complete List of Authors: Parejiya, Punit; K.B. Inst. of Pharm. Edu. & Res., Pharmaceutics
Barot, Bhavesh; K.B. Inst. of Pharm. Edu. & Res.,, Pharmaceutics Patel, Hetal; K.B. Inst. of Pharm. Edu. & Res.,, Pharmaceutics Chorawala, Mehul; K.B. Inst. of Pharm. Edu. & Res.,, Pharmacology Shelat, Pragna; K.B. Inst. of Pharm. Edu. & Res.,, Pharmaceutics Shukla, ArunKumar; K.B. Inst. of Pharm. Edu. & Res.,, Pharmaceutics
Keywords: Milnacipran HCl, osmotic pump, in-vitro in-vivo correlation, extended release, protraction index
Abstract:
The objective of the present study was to carry out pharmacokinetics evaluation of oral modified release formulation [Aquarius EKX 19102 SRX–2 based osmotic pump (OP)] containing highly soluble Milnacipran HCl (MH) as a model drug. It was also aimed to develop an in vitro-in vivo correlation (IVIVC) models for developed OP. In vivo plasma concentration
data were obtained from 6 healthy male New Zealand albino rabbits after administration of immediate-release Milnacipran HCL solution (IRMHSOL) and Milncipran HCl osmotic pump (MHOP). In vitro samples were analysed using in house developed spectrophotometry method and in vivo samples were analyzed using a RP- HPLC method developed by author. The IVIVC analyses comparing the two results were performed using STATISTICAe computer program. A deconvolution based level A model was attempted through a correlation of percent in vivo input obtained through deconvolution and percent in vitro dissolution obtained experimentally. A good correlation between the percentages dissolved vs absorbed (R2= 0.989) was obtained using level A correlation. Evaluation of the internal predictability of level A correlation was calculated in terms of percent
prediction error, which was found to be below 15%. In a nutshell, the success of present study warrants for further studies in patient volunteers to assess the ability of the MHOP in providing an effective therapy of depression.
http://mc.manuscriptcentral.com/bdd
Biopharmaceutics & Drug Disposition

For Peer Review
1
Pharmacokinetics evaluation and establishment of in vitro- in vivo correlation of extended
release dosage form of Milnacipran HCl
Punit B. Parejiya*, Bhavesh S. Barot, Hetal K. Patel, Mehul R. Chorawala, Pragna K. Shelat, Arunkumar
Shukla
K. B. Institute of Pharmaceutical Education and Research, Gandhinagar, India-382023
Page 1 of 26
http://mc.manuscriptcentral.com/bdd
Biopharmaceutics & Drug Disposition
123456789101112131415161718192021222324252627282930313233343536373839404142434445464748495051525354555657585960

For Peer Review
2
Running Title: Pharmacokinetics evaluation and IVIVC of Milnacipran HCl osmotic pump
* Corresponding Author:
Mr. Punit Parejiya
Department of Pharmaceutics
K. B. Institute of Pharmaceutical Education and Research
Sec-23, GH-6
Gandhinagar, Gujarat, India-382023
Email: [email protected]
Phone: +91-9898561832
Page 2 of 26
http://mc.manuscriptcentral.com/bdd
Biopharmaceutics & Drug Disposition
123456789101112131415161718192021222324252627282930313233343536373839404142434445464748495051525354555657585960

For Peer Review
3
Abstract
The objective of the present study was to carry out pharmacokinetics evaluation of oral modified
release formulation [Aquarius EKX 19102 SRX–2 based osmotic pump (OP)] containing highly
soluble Milnacipran HCl (MH) as a model drug. It was also aimed to develop an in vitro-in vivo
correlation (IVIVC) models for developed OP. In vivo plasma concentration data were obtained
from 6 healthy male New Zealand albino rabbits after administration of immediate-release
Milnacipran HCL solution (IRMHSOL) and Milncipran HCl osmotic pump (MHOP). In vitro
samples were analysed using in house developed spectrophotometry method and in vivo samples
were analyzed using a RP- HPLC method developed by author. The IVIVC analyses comparing
the two results were performed using STATISTICAe computer program. A deconvolution based
level A model was attempted through a correlation of percent in vivo input obtained through
deconvolution and percent in vitro dissolution obtained experimentally. A good correlation
between the percentages dissolved vs absorbed (R2= 0.978) was obtained using level A
correlation. Evaluation of the internal predictability of level A correlation was calculated in
terms of percent prediction error, which was found to be below 15%. In a nutshell, the success of
present study warrants for further studies in patient volunteers to assess the ability of the MHOP
in providing an effective therapy of depression.
Keywords: Milnacipran HCl, osmotic pump, in-vitro in-vivo correlation, extended release,
protraction index
Page 3 of 26
http://mc.manuscriptcentral.com/bdd
Biopharmaceutics & Drug Disposition
123456789101112131415161718192021222324252627282930313233343536373839404142434445464748495051525354555657585960

For Peer Review
4
Introduction
Oral controlled release (CR) systems continue to be the most popular amongst all the drug
delivery systems. Conventional oral drug delivery systems are known to provide an immediate
release of drug, in which one cannot control the release of the drug and effective concentration at
the target site, therefore modulation of drug release is required [1]. The development of oral
controlled release delivery systems for highly water soluble drugs possesses a significant
challenge to the formulation scientists [2]. Most of these highly water-soluble drugs, if not
formulated properly, may readily release the drug at a faster rate, and are likely to produce toxic
concentration of the drug on oral administration [3]. Formulation scientist’s focus is always on
achieving zero order release, which is a prerequisite for ideal drug delivery for highly water
soluble drugs.
The majority of per-oral CR dosage forms of water soluble drugs fall in the category of matrix,
reservoir or osmotic systems. Drug release from matrix and reservoir systems is affected by pH,
hydrodynamic conditions and the presence of food in the gastro-intestinal tract [4]. Osmotic
systems utilize the principle of osmotic pressure for controlled delivery of drugs [5]. Drug
release from these systems is to a large extent independent of pH and other physiological
parameters [6]. The development of oral osmotic system has a large market potential, as evident
from the marketed products and number of patents granted in the last few years [7, 8].
Milnacipran hydrochloride (MH), is a cyclopropane derivative with the chemical name (±)-
[1R(S), 2S(R)]-2-(aminomethyl)-N,N-diethyl-1- phenylcyclopropanecarboxamide hydrochloride
[9]. It is a wonderful new weapon in the fight against both depression and pain. It has essentially
equal potency for inhibiting the reuptake of both serotonin and noradrenaline, with no affinity for
Page 4 of 26
http://mc.manuscriptcentral.com/bdd
Biopharmaceutics & Drug Disposition
123456789101112131415161718192021222324252627282930313233343536373839404142434445464748495051525354555657585960

For Peer Review
5
any neurotransmitter receptor. It is well absorbed following oral administration with an absolute
bioavailability of 85% [10]. MH is a highly water soluble molecule, (aqueous solubility 800
mg/mL). The base form of MH is very unstable, so it cannot be used for pharmaceutical use. As
MH has a short half life (8 hrs) its immediate release formulation may not be suitable for a once
a day dosing regimen [11]. Conventional MH therapy is often associated with gastrointestinal
side effects, such as gastric discomfort, nausea, and diarrhea. Delivery of MH in a modified-
release (MR), once a- day dosage form could reduce the dosing frequency and improve patient
compliance.
Applications of in vitro-in vivo correlation (IVIVC) models were outlined in a recent U.S.
regulatory guidance [12]. Through the use of IVIVC models, it may be possible to develop MR
dosage forms or predict in vivo performance of the MR dosage forms based on in vitro
dissolution data. The FDA guidance has identified three categories of IVIVC models: namely,
level A, B, and C models. Several investigators have attempted to develop IVIVC models based
on these categories. Because a level A correlation uses the entire time course of in vitro
dissolution and in vivo input, it has been identified as the IVIVC model of choice for the purpose
of obtaining biowaivers or setting of dissolution specifications [13, 14]. Nevertheless, level B
and C models have been reported and may be used in the initial stages of formulation
development to examine whether level A IVIVC models are feasible for specific
drugs/formulations or, alternatively, to modify in vitro dissolution conditions [15].
The FDA guidance outlines methods of internally and externally validating an IVIVC along with
the predictive criteria to assess its validity [12]. The development of a correlation is based on the
scientific principles associated with mathematical modeling, statistical evaluation and numerical
deconvolution. Internal validation refers to how well the IVIVC model predicts the in vivo
Page 5 of 26
http://mc.manuscriptcentral.com/bdd
Biopharmaceutics & Drug Disposition
123456789101112131415161718192021222324252627282930313233343536373839404142434445464748495051525354555657585960

For Peer Review
6
behavior of the formulations used to develop the correlation. External validation focuses on how
well the IVIVC model predicts the bioavailability of alternative formulations which differ from
those used in the initial correlation. The alternative formulations may represent changes in
release and non-release controlling excipients, manufacturing site changes, manufacturing
process changes or scale-up of a formulation [16].
Considering clinical need, physicochemical and biopharmaceutical properties of MH three
prototype modified formulations [Milnacipran HCl osmotic pump (MHOP), Milnacipran HCl
press coated tablet (MHPCT) and Milnacipran HCl solid dispersion tablet (MHSDT)] were
formulated. Out of developed three MR formulations, one which satisfied the desired zero order
drug release profile was subjected to pharmacokinetics study in rabbits and its pharmacokinetics
parameters were resolved. Further level A IVIVC model was employed to generate validated
IVIVC model. To date no pharmacopoeial dissolution method is available for MR formulation of
MH. Hence it is necessary to prove validated IVIVC for this MR formulation. To the best of our
knowledge, validated IVIVC of MR formulation of MH as mentioned in this manuscript has not
been published to date.
Materials
Milnacipran HCl was received as a gift sample from Torrent Research Center (Gandhinagar,
India). Aquarius EKX 19102 SRX–2 coating system (low porosity) was received as a gift sample
from Zydus Research Center (Ahmedabad, India). Potassium dihydrogen phosphate was of
analytical grade and supplied by M/s S.D. Fine-Chem Limited, Mumbai, India. Acetonitrile and
water used were of high performance liquid chromatography (HPLC) grade (Qualigens). All
other reagents used in the study were of AR quality (Qualigens). Other materials used in the
Page 6 of 26
http://mc.manuscriptcentral.com/bdd
Biopharmaceutics & Drug Disposition
123456789101112131415161718192021222324252627282930313233343536373839404142434445464748495051525354555657585960

For Peer Review
7
study such as dicalcium phosphate, talc, and magnesium stearate were of pharmacopoeia quality
(USP/NF).
Methods
Formulation of modified release forms of MH
Based on the clinical need of MH, The MHOP was fabricated using pan coating method as
previously described [17]. Briefly the, dry powder blend of MH, dicalcium phoshphate,
magnesium stearate and talc was directly compressed on a 12 station rotary punch tablet machine
(Karnawati Engineering, India) equipped with 10 mm concave punches. The core tablets were
spray coated by coating solution of Aquarius EKX 19102 SRX–2 in ethyl alcohol-water mixture
(80:20). The coating conditions were kept as, inlet air temperature, 40 °C; air flow rate, 1.3
kg/cm2; coating spray rate, 4-5 ml/min and pan speed, 30 rpm. The MHPCT was formulated by
compressing fast release component of MH over core tablet comprised of MH, Compritol ATO
888 and Benecel®
. The MHSDT was developed by directly compressing solid dispersion of MH
(1:1.5 ratio of MH: bees wax) in a Benecel®
.
Quantitative determination of MH in MHOP
A double-beam UV spectrophotometer (Shimadzu-1800, Kyoto, Japan) was used for drug
analysis. A known detectible amount of MH (10 µg/mL) was taken and dissolved in the
dissolution medium and analyzed at 220 nm. Standard concentrations in the Beer-Lambert's
range of 1-50 µg/mL were prepared and studied for 3 days for interday and intraday variations.
Statistical test (linearity test) was applied to authenticate the standard curve [18].
In vitro drug release study
Page 7 of 26
http://mc.manuscriptcentral.com/bdd
Biopharmaceutics & Drug Disposition
123456789101112131415161718192021222324252627282930313233343536373839404142434445464748495051525354555657585960

For Peer Review
8
MHOPs were subjected to in vitro drug release studies to assess their ability in providing the
desired drug release profile. Drug release studies were carried out using USP-II apparatus
(Paddle-type, Electrolab, Model TDT 06-T, Mumbai, India) with rotating speed of 100 rpm, at
37±1°C. The dissolution medium was 0.1N HCl (pH 1.2) (900 mL) for first 2 hrs and phosphate
buffer (pH 6.8) (900 mL) for subsequent hours. During the drug release studies, all the
formulations were observed for physical integrity. The dissolution samples were obtained at
different time intervals replacing with drug free dissolution medium. Samples were withdrawn at
specified intervals and were suitably diluted and analyzed immediately by UV spectroscopic
method.
In vivo study in rabbits
An in vivo study was carried out using male New Zealand albino rabbits with an average weight
of 2.5 kg, housed individually in standard cages in a room with air, humidity and temperature
control. The animals were kept on a standard diet. At least 12 h prior to drug administration; the
animals were fasted but had free access to water. The protocol was approved by the Institutional
Ethical Committee of K. B. Institute of Pharmaceutical Education and Research, Gandhinagar,
India. (KBIPER/2011/244) The experiments were conducted as per CPCSEA (Committee for
Prevention, Control and Supervision of Experimental Animals) guidelines. Milnacipran HCl OP
and immediate release Milnacipran HCl solution (IRMHSOL) were administered orally to six
rabbits, with a wash-out period of 2 weeks between the different administrations. Blood samples
(1.5 ml) were withdrawn from a heparinized catheter placed in the marginal vein of the ear
before administration and at predetermined times, using EDTA as anticoagulant. Plasma samples
were immediately separated by centrifugation at 3000 rpm for 10 min and stored at -80°C until
Page 8 of 26
http://mc.manuscriptcentral.com/bdd
Biopharmaceutics & Drug Disposition
123456789101112131415161718192021222324252627282930313233343536373839404142434445464748495051525354555657585960

For Peer Review
9
analysis. Baseline plasma samples collected prior to MH administration at time 0 served as the
blank control for each animal.
Quantitative determination of MH from rabbit plasma
The quantitative determination of MH in rabbit plasma was performed by a reverse phase HPLC
with these chromatographic specifications: The HPLC system (LC-2010C HT), equipped with
system controller (SCL-10AVP), on-line degasser (DGU-14A), low-pressure gradient flow
control valve (FCV-10ALVP), solvent delivery module (LC-10ADVP), autoinjector (SIL-10
ADVP), column oven (CTO-10AVP),UV/Vis detector (SPD-10AVP), and CLASS–VP software
Version 6.14 SP1 (Shimadzu, Kyoto, Japan). The chromatographic separations were achieved on
HiQ sil C18 column (250 mm x 4.6 mm i.d., 5 µm). The mobile phase was prepared by mixing
720 mL of phoshphate buffer and 280 mL of acetonitrile. The phosphate buffer was prepared by
weighing 1.70 g of potassium dihydrogen phosphate and dissolving in 1000 mL of water (0.0125
M), to this 0.20 % of triethylamine was added. The pH of the solution was adjusted to 3.65 with
0.1 M orthophosphoric acid. The mobile phase was filtered through a 0.45 µ filter (Millipore,
Beford, MA, USA) and degassed by an ultrasonic bath (Frontline Electronics, Ahmedabad,
India). The eluents were monitored using UV detection at 220 nm. The injection volume was 20
µL. The column was equilibrated with mobile phase and the column temperature was kept as
ambient during the analysis. Frozen plasma samples were thawed at room temperature. In a glass
tube, 50 µl of internal standard solution was added. The content of each tube was briefly mixed
and 2 mL of chloroform was added. The tubes were shaken for 20 min on a horizontal shaker
(Remi Electronics, Ahmedabad, India) and then centrifuged at 4°C for 10 min at 2500×g
(Eltech centrifuge, India). The organic layer was collected and transferred to tube at 40°C to
Page 9 of 26
http://mc.manuscriptcentral.com/bdd
Biopharmaceutics & Drug Disposition
123456789101112131415161718192021222324252627282930313233343536373839404142434445464748495051525354555657585960

For Peer Review
10
dryness under a gentle stream of nitrogen. The residues were reconstituted with 1 mL of mobile
phase.
Pharmacokinetics parameters
Estimation of pharmacokinetics parameters with variability was done using plasma concentration
versus time data. The maximum concentration (Cmax) and the time to reach the maximum
concentration (tmax) were read directly from the arithmetic plot of plasma concentration versus
time data as a measure of the rate of absorption. The overall elimination rate constant (Kel) was
calculated from the slope of the terminal elimination phase of a semi-logarithmic plot of
concentration versus time, after subjecting it to linear regression analysis. The elimination half-
life (t1/2) was calculated by dividing 0.693 with Kel. The area under the concentration–time curve
(AUC) up to the last sampling point was estimated by the trapezoidal method, and the AUC
beyond the last observed plasma concentration (Cn) was extrapolated to Cn/Kel [19].
Statistical analysis
The observed variation in the pharmacokinetics parameters (t1/2, ka and Tmax) was tested by
using analysis of variance (ANOVA) and Duncan’s multiple range test with the help of
STATISTICAe computer program (Release 4.5, StatSoft Inc., 1993). The observed difference in
mean pharmacokinetics parameters of MH from MHOP and IRMHSOL was subjected to paired
t-test to find the statistical significance. In all the cases, a value of P < 0.01 was considered
statistically significant.
Establishment of IVIVC
Page 10 of 26
http://mc.manuscriptcentral.com/bdd
Biopharmaceutics & Drug Disposition
123456789101112131415161718192021222324252627282930313233343536373839404142434445464748495051525354555657585960
For Peer Review
11
Four levels of correlation (level A, B, C and multiple level C) have been described in the FDA
guidance [12]. Of these levels, level A correlations are the highest level of correlation
representing a point-to-point correlation between the in vitro input rate (e.g. dissolution rate) and
the in vivo input rate. Hence for IVIVC correlation, level A was selected. The in vivo absorption
or dissolution time course was estimated using an appropriate deconvolution technique for both
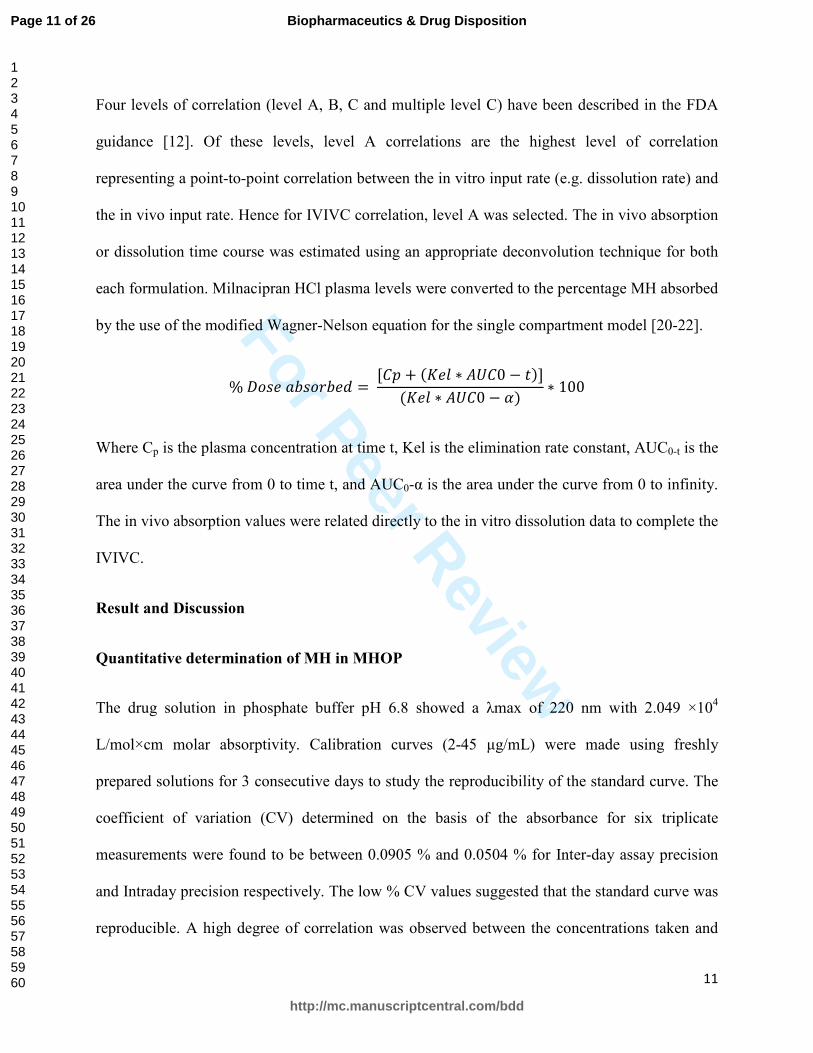
each formulation. Milnacipran HCl plasma levels were converted to the percentage MH absorbed
by the use of the modified Wagner-Nelson equation for the single compartment model [20-22].
%���������� � � � � ���� ∗ �� 0 � ���
���� ∗ �� 0 � ��∗ 100
Where Cp is the plasma concentration at time t, Kel is the elimination rate constant, AUC0-t is the
area under the curve from 0 to time t, and AUC0-α is the area under the curve from 0 to infinity.
The in vivo absorption values were related directly to the in vitro dissolution data to complete the
IVIVC.
Result and Discussion
Quantitative determination of MH in MHOP
The drug solution in phosphate buffer pH 6.8 showed a λmax of 220 nm with 2.049 ×10⁴
L/mol×cm molar absorptivity. Calibration curves (2-45 µg/mL) were made using freshly
prepared solutions for 3 consecutive days to study the reproducibility of the standard curve. The
coefficient of variation (CV) determined on the basis of the absorbance for six triplicate
measurements were found to be between 0.0905 % and 0.0504 % for Inter-day assay precision
and Intraday precision respectively. The low % CV values suggested that the standard curve was
reproducible. A high degree of correlation was observed between the concentrations taken and
Page 11 of 26
http://mc.manuscriptcentral.com/bdd
Biopharmaceutics & Drug Disposition
123456789101112131415161718192021222324252627282930313233343536373839404142434445464748495051525354555657585960

For Peer Review
12
the respective absorbance obtained (R2 = 0.999). Linearity test was applied to check whether the
obtained regressed line was a straight or a curve. The test showed perfect linearity for the
regressed line at 95% confidence interval (P = 0.0384).
In vitro drug release study
The formulation scientists always focus to achieve zero order drug delivery for highly water
soluble drugs. Keeping the solubility (800 mg/mL) and biological half life (6-8 hrs) of MH into
consideration, the goal of the present study was to acquire the dissolution profile of the proposed
formulation simulating near to zero order. In vitro dissolution profiles of proposed formulations
and ideal zero order release profile are presented in Figure 1. Theoretical zero order drug release
profile (5 mg/hr) was targeted to achieve for fulfilling desired plasma concentration up to 24 hrs
Desired criteria for drug release patern were: % of drug released in 6 hrs (C6)=30, % of drug
released in 12 hrs (C12) = 60 and % of drug released in 18 hrs (C18) = 90. Figure 1 clearly
indicated the close proximity of the rate and extent of the drug release from MHOP with ideal
zero order release pattern. The drug release form MHOP, MHPCT and MHSDT were C6 =
33.15±0.98, C12 = 63.47±1.04, C18 = 89.53±1.96; C6 = 48.5±1.34, C12 =72.24±2.51, C18 =
92.14±2.06; C6 = 54.0±1.64, C12 = 78.27±1.82, C18 = 96.34±2.37 respectively. These finding
were further supported by the similarity factor (f2) values which were found to be 88.31±2.34
(MHOP), 76.21±3.64 (MHPCT), 71.67±4.37 (MHSDT). Model independent approaches [i.e.,
dissolution efficiency (DE) and mean dissolution time (MDT)] were used to translate the drug
release profile differences between developed dosage forms into a single value. Mean dissolution
time values were 9.65±0.23 (MHOP), 7.41±0.53 (MHPCT), 6.98±0.64 (MHSDT) and 10.00
(Ideal). Dissolution efficiency values were 10.36±0.48 (MHOP), 12.8±0.87 (MHPCT),
Page 12 of 26
http://mc.manuscriptcentral.com/bdd
Biopharmaceutics & Drug Disposition
123456789101112131415161718192021222324252627282930313233343536373839404142434445464748495051525354555657585960

For Peer Review
13
14.2±0.58 (MHSDT) and 10.00 (Ideal). MHOP exhibited MDT and DE values proximal to ideal
zero order release pattern relative to MHPCT and MHSDT.
Quantitative determination of MH from rabbit plasma:
The peak area ratio of MH to that of internal standard (IS, Venlafexin HCl) was determined, and
this was used to estimate the plasma concentration of MH from the regression equation. The
regression equation was set up by spiking drug-free plasma with varying amounts of MH (0.01-
15 µg/0.5 ml) and fixed quantity of IS (5 µg/ml), and treating the plasma as described above. The
peak area ratio of MH to IS was obtained. A good linear relationship (R2= 0.998) was observed
between the peak area ratio and plasma concentration of MH in the range of 0.05-10 µg/0.5 ml.
The inter- and intra-day variation was found to be less than 3% (CV) indicating high precision of
the HPLC method.
In vivo study
The extent of absorption is a key characteristic of a drug formulation, and therefore the AUC0–α
is an important parameter for analysis in a comparative bioavailability study. However, the other
two parameters, namely tmax and Cmax; are also important features related to the therapeutic
use of many drugs and hence also considered in the present pharmacokinetics analysis. The
IRMHSOL and MHOP were administered at a dose of 3.5 mg and 7 mg equivalent to human
dose of 50 mg (BID dose) and 100 mg (OD dose) respectively [23]. The mean plasma
concentration of MH following oral administration of MHOP and IRMHSOL are shown in
Figure 2. The tmax of MH from MHOP was 10.0±0.93 h, and the peak concentration (Cmax) at
that time was 162±14.36 ng/ml. In case of IRMHSOL, the Cmax was 160.0±12.9 ng/ml, which
was significantly different (P < 0.001) from that of MHOP (Table 2). The mean tmax value after
Page 13 of 26
http://mc.manuscriptcentral.com/bdd
Biopharmaceutics & Drug Disposition
123456789101112131415161718192021222324252627282930313233343536373839404142434445464748495051525354555657585960

For Peer Review
14
administration of IRMHSOL was 2.0±0.12 h, which was significantly different (P < 0.001) from
that of MHOP. The absorption rate constant (Ka) of the drug from IRMHSOL was 2.20±0.3 h,
and that of MHOP was 0.18±0.085 h wherein the difference in the value of absorption rate
constant was statistically significant (P < 0.001). Thus prolonged tmax and decreased ka of MH
in rabbits indicated that the drug release from MHOP is slow providing a prolonged and
controlled in vivo delivery of the MH. These in vivo absorption characteristics are in
confirmation with the observed in vitro drug release rate of the drug from the MHOP [17].
The area under the plasma MH concentration versus time curves (AUC0–α) for the IRMHSOL
and MHOP was 3323.47±485.36 and 1055.31±389.4 ng*h/ml, respectively (Table 2). Based on
this assumption, the relative bioavailability of MH from MHOP against the IRMHSOL was
calculated to find the extent of absorption of the drug. There was significant difference in the
extent of absorption of MH from MHOP when compared to IRMHSOL (157.46 ± 11.2%) of the
drug (Table 2). This difference in bioavailability is might be due to successful release retardation
of MH from developed formulation. The elimination half-lives of MH following oral ingestion of
IRMHSOL and MHOP were 4.13±0.41 and 8.81±3.7 h, respectively, which were significantly
different (P < 0.001). Thus the prolonged t1/2 is another important indication on the in vivo
performance of the controlled release MHOP in providing a prolonged drug delivery. The
clearance of MH after administration of MHOP was 30.09±6.87 ml/h whereas that of after
administration of IRMHSOL was 47.38±8.64 ml/h indicated long residence time of drug due to
MHOP.
Protraction index was also used to illustrates the flatness of the steady state plasma concentration
profile, which is the average concentration in the 24 hour dosing interval divided by the
maximum concentration, i.e. ((AUC0-24/24)/Cmax). In the theoretical case where the profile is
Page 14 of 26
http://mc.manuscriptcentral.com/bdd
Biopharmaceutics & Drug Disposition
123456789101112131415161718192021222324252627282930313233343536373839404142434445464748495051525354555657585960

For Peer Review
15
completely flat the average concentration will be identical to the maximum concentration and the
protraction index will be equal to 1. Hence, due to the fact that the average concentration cannot
take a value higher than the maximum concentration, the protraction index can never be higher
than 1. In cases where the profile is substantially flat, the difference between the maximum
concentration and the average concentration is small and the protraction index will take a value
close to 1. In the proposed study the value of protraction index was found to be 0.65, which
signified the control of drug release for once a day from developed MHOP.
In addition, the MRT value displayed by MHOP was almost 3.5 fold larger than that of
IRMHSOL confirming the extended release behavior of this preparation in the rabbit model. The
plasma concentrations of MH after oral administration of MHOP did not show a sharp peak and
the corresponding times to reach the maximum plasma level were significantly prolonged up to
24 hrs which in turn may enhance antidepressant activity with minimal adverse effects. The
successful outcome of the present study warrants for further studies in human and patient
volunteers to assess the ability of the above MHOP formulation in providing an effective and
safe therapy of depression.
Establishment of IVIVC
The feasibility of developing a Level A correlation for MHOP was evaluated by plotting fraction
dissolved in vitro with respect to fraction absorbed in vivo (Figure 3). There was significant
correlation (P < 0.001) between the fraction dissolution (FD) and fraction absorbed (FA).
However, the linear regression analysis showed that a statistically significant relationship (r2
=
0.978; P < 0.001) existed between the FD and FA for the MHOP and was best described by the
Page 15 of 26
http://mc.manuscriptcentral.com/bdd
Biopharmaceutics & Drug Disposition
123456789101112131415161718192021222324252627282930313233343536373839404142434445464748495051525354555657585960
For Peer Review
16
equation FA= 1.533 (FD) + 0.098. The slope and intercept were close to 1 and 0, respectively,
indicating that the in vivo fraction absorbed could be predicted from in vitro dissolution data.
It was further supported by constructing Levy plot (in vitro with respect to in vivo times at
matched values for dissolution and absorption) (Figure 4). The linearity relationship existed
between the time in vivo and time in vitro for a given fraction absorbed or dissolved (r2
= 0.990;
P < 0.001). It was best described by the equation time in vivo = 1.243 (time in vitro) – 2.792. The
recent trend to facilitate formulation modification is the application of the criterion called BCS
(Biopharmaceutical Classification System), which is categorized by the solubility and membrane
permeability characteristics of drugs. Based on the same, the pH-solubility profile shows that the
highest dose (100 mg) could dissolve in 250 ml of media of different pH varying from 2 to 8.
Thus MH can be classified as a drug with high solubility. The absolute bioavailability of MH is
85%, indicating high permeability. Hence MH is a BCS class I drug. As the objective of the
IVIVC is to develop a mathematical model to describe the relation between in vitro fraction
dissolved and in vivo fraction absorbed, the predictive performance of the linear model was
evaluated based on the internal predictability. The internal predictability of level A correlation
was evaluated by calculating the percent prediction error (% PE).
% PE= [(Observed value-Predicted value) ⁄ Observed value]*100
According to FDA guidance [12], the correlation is valid (predictive) if the % PE for each
formulation does not exceed 15%. Observed % PE for MHOP was 11.54 % demonstrated a good
level A correlation. The low prediction error indicates that the correlation model is predictive of
in vivo performance of MR formulations. This indicates a valid Level A IVIVC as per the
criteria mentioned in the FDA guidance. External predictability was not warranted as low
predictions errors were observed with internal predictability [24].
Page 16 of 26
http://mc.manuscriptcentral.com/bdd
Biopharmaceutics & Drug Disposition
123456789101112131415161718192021222324252627282930313233343536373839404142434445464748495051525354555657585960

For Peer Review
17
Conclusion
In vivo performance of the Aquarius EKX 19102 SRX–2 based osmotic pump of highly water
soluble drug (MH) was studied in rabbits against an immediate release oral solution of MH. The
delayed tmax, decreased Ka, prolonged half life and reduced clearance indicated slow and
prolonged release of MH form MHOP. Good Level A IVIVC was established for developed
osmotic pump. Low predictive error exhibited well prediction power of an established IVIVC
model.
Acknowledgment
Authors are grateful to Vaccine Institute (Gandhinagar, India) for providing rabbits to conduct
pharmacokinetics study.
Conflict of interest
There is no any conflict of interest amongst authors of this manuscript.
Page 17 of 26
http://mc.manuscriptcentral.com/bdd
Biopharmaceutics & Drug Disposition
123456789101112131415161718192021222324252627282930313233343536373839404142434445464748495051525354555657585960

For Peer Review
18
References
1. Prescott LF. The need for improved drug delivery in clinical practice. In Novel Drug
Delivery and its Therapeutic Application, John Wiley and Sons: West Susset, 1989; 1-11.
2. Mishra M, Mishra B. Design and evaluation of microporous membrane coated matrix
tablets for a highly water soluble drug. Chem Pharm Bull (Tokyo) 2010; 58: 995-1000.
doi: JST.JSTAGE/cpb/58.995.
3. Al-Saidan SM, Krishnaiah YS, Satyanarayana V, Bhaskar P, Karthikeyan RS.
Pharmacokinetics evaluation of guar gum-based three-layer matrix tablets for oral
controlled delivery of highly soluble metoprolol tartrate as a model drug. Eur J Pharm
Biopharm 2004; 58: 697-703. doi: 10.1016/j.ejpb.2004.04.013S0939641104001250.
4. Verma RK, Mishra B, Garg S. Osmotically controlled oral drug delivery. Drug Dev Ind
Pharm 2000; 26: 695-708. doi: 10.1081/DDC-100101287.
5. Verma RK, Krishna DM, Garg S. Formulation aspects in the development of osmotically
controlled oral drug delivery systems. J Control Release 2002; 79: 7-27. doi:
S0168365901005508.
6. Theeuwes F. Elementary osmotic pump. J Pharm Sci 1975; 64: 1987-91. doi:
10.1002/jps.2600641218.
7. Kumar P, Singh S, Rajinikanth PS, Mishra B. An overview of osmotic pressure
controlled release formulation. J Pharm Res 2006; 5: 34–45.
8. Kumar P, Mishra B. An overview of recent patents on oral osmotic drug delivery
systems. Recent Pat Drug Deliv Formul 2007; 1: 236-55.
Page 18 of 26
http://mc.manuscriptcentral.com/bdd
Biopharmaceutics & Drug Disposition
123456789101112131415161718192021222324252627282930313233343536373839404142434445464748495051525354555657585960

For Peer Review
19
9. Dias CL, Rossi RC, Bajerski L, Froehlich PE. Dissolution method for milnacipran
hydrochloride capsules: Development validation and study of changes in dissolution rate
after storage. Diss. Tech 2011; 47-53.
10. Puozzo C, Leonard BE. Pharmacokinetics of milnacipran in comparison with other
antidepressants. Int Clin Psychopharmacol 1996; 11 Suppl 4: 15-27.
11. Ansseau M, Papart P, Troisfontaines B, Bartholome F, Bataille M, Charles G, et al.
Controlled comparison of milnacipran and fluoxetine in major depression.
Psychopharmacology (Berl) 1994; 114: 131-7.
12. Guidance for Industry. Extended Release Oral Dosage Forms: Development, Evaluation
and Application of In Vitro/In Vivo Correlation. U.S. Department of Health and Human
Services, Food and Drug Administration, Centre for Drug Evaluation and Research:
Rockville, MD; September 1997.
13. Meyer MC, Straughn AB, Mhatre RM, Shah VP, Williams RL, Lesko LJ. The relative
bioavailability and in vivo-in vitro correlations for four marketed carbamazepine tablets.
Pharm Res 1998; 15: 1787-91.doi: 10.1023/A:1011929300613.
14. Drewe J, Guitard P. In vitro-in vivo correlation for modified-release formulations. J
Pharm Sci 1993; 82: 132-7. doi: 10.1002/jps.2600820204.
15. Balan G, Timmins P, Greene DS, Marathe PH. In vitro-in vivo correlation (IVIVC)
models for metformin after administration of modified-release (MR) oral dosage forms to
healthy human volunteers. J Pharm Sci 2001; 90: 1176-85. doi: 10.1002/jps.1071.
16. Sirisuth N, Augsburger LL, Eddington ND. Development and validation of a non-linear
IVIVC model for a diltiazem extended release formulation. Biopharm Drug Dispos 2002;
23: 1-8. doi: 10.1002/bdd.270.
Page 19 of 26
http://mc.manuscriptcentral.com/bdd
Biopharmaceutics & Drug Disposition
123456789101112131415161718192021222324252627282930313233343536373839404142434445464748495051525354555657585960

For Peer Review
20
17. Parejiya PB, Barot BS, Patel HK, Shelat PK, Shukla AK. Development of platform
technology for oral controlled delivery of highly water soluble drugs using milnacipran
HCl as a model drug. Drug Deliv Lett 2012; 2: 35-45.
18. Parejiya PB, Barot BS, Shelat PK, Patel RC, Shukla AK. Development and validation of
analytical methods of milnacipran hydrochloride in bulk and pharmaceutical
formulations. Eurasian J Anal Chem 2011; 6: 67-75.
19. Rowland M, Tozer TN. Clinical Pharmacokinetics: Concepts and Applications. BI
Waverly Pvt Ltd: New Delhi, 1996; 469–472.
20. Kortejarvi H, Mikkola J, Backman M, Antila S, Marvola M. Development of level A, B
and C in vitro-in vivo correlations for modified-release levosimendan capsules. Int J
Pharm 2002; 241: 87-95. doi: S0378517302001370.
21. Turner S, Federice C, Hite M, Fassihi R. Formulation development and human in vitro in
vivo correlation for a novel, monolithic controlled release matrix system of high load and
high water soluble drug niacin. Drug Dev Ind Pharm 2004; 30: 797–807. doi:
10.1081/DDC-200026747.
22. Rao BS, Seshasayana A, Saradhi SVP. Correlation of in vitro release and in vivo
absorption characteristics of rifampicin from ethylcellulose coated nonpareil beads. Int J
Pharm 2001; 230: 1–9. doi. 10.1016/S0378-5173(01)00835-3.
23. Ghosh MN. Toxicity studies. In Fundamentals of experimental pharmacology, S. K.
Ghosh and others: Kolkata, 2011; 167.
24. Shah HJ, Subbaiah G, Patel DM, Patel CN. In vitro-in vivo correlation of modified
release dosage form of lamotrigine. Biopharm Drug Dispos 2009; 30: 524-31. doi:
10.1002/bdd.688.
Page 20 of 26
http://mc.manuscriptcentral.com/bdd
Biopharmaceutics & Drug Disposition
123456789101112131415161718192021222324252627282930313233343536373839404142434445464748495051525354555657585960

For Peer Review
21
Figure legends
Fig.1. In vitro dissolution study showing the mean (±SD) percentage of MH released from
developed MR formulations (MHOP, MHPCT, MHSDT)
Fig.2. Mean (±SD) plasma concentration of MH in rabbits (n=6) following oral administration of
IRMHSOL and MHOP
Fig.3. Relationship between the percentage released and the percent absorbed from MHOP in
rabbits
Fig.4. Levy plot of in vitro versus in vivo times for a given fraction absorbed or dissolved of MH
from MHOP
Page 21 of 26
http://mc.manuscriptcentral.com/bdd
Biopharmaceutics & Drug Disposition
123456789101112131415161718192021222324252627282930313233343536373839404142434445464748495051525354555657585960

For Peer Review
22
Tables 1: Pharmacokinetics parameters of MH after oral administration of IRMHSOL and
MHOP
PK parameters IRMHSOL MHOP
Cmax (ng/ml) 160.00±12.9 162.00±14.36
tmax (h) 2.00±0.12 10.00±0.93
ka (h-1
) 2.20±0.30 0.18±0.085
kel (h-1
) 0.17±0.056 0.08±0.007
t1/2 (h) 4.13±0.41 8.81±3.7
AUC0-t (ng·h·ml-1
) 727.74±121.53 2586.50±472.38
AUCt-α (ng·h·ml-1
) 327.58±68.91 736.97±153.64
AUC0- α (ng·h·ml-1
) 1055.31±389.40 3323.47±485.36
AUMC0-t (ng·h·ml-1
) 2649.44±503.87 31711.00±1436.87
MRT (h) 3.64±0.85 12.26±2.64
Cl (ml·h-1
) 47.38±8.64 30.09±6.87
Page 22 of 26
http://mc.manuscriptcentral.com/bdd
Biopharmaceutics & Drug Disposition
123456789101112131415161718192021222324252627282930313233343536373839404142434445464748495051525354555657585960

For Peer Review
Fig.1. In vitro dissolution study showing the mean (±SD) percentage of MH released from developed MR formulations (MHOP, MHPCT, MHSDT)
360x252mm (300 x 300 DPI)
Page 23 of 26
http://mc.manuscriptcentral.com/bdd
Biopharmaceutics & Drug Disposition
123456789101112131415161718192021222324252627282930313233343536373839404142434445464748495051525354555657585960

For Peer Review
Fig.2. Mean (±SD) plasma concentration of MH in rabbits (n=6) following oral administration of IRMHSOL and MHOP
573x460mm (300 x 300 DPI)
Page 24 of 26
http://mc.manuscriptcentral.com/bdd
Biopharmaceutics & Drug Disposition
123456789101112131415161718192021222324252627282930313233343536373839404142434445464748495051525354555657585960

For Peer Review
Fig.3. Relationship between the percentage released and the percent absorbed from MHOP in rabbits 479x338mm (300 x 300 DPI)
Page 25 of 26
http://mc.manuscriptcentral.com/bdd
Biopharmaceutics & Drug Disposition
123456789101112131415161718192021222324252627282930313233343536373839404142434445464748495051525354555657585960

For Peer Review
Fig.4. Levy plot of in vitro versus in vivo times for a given fraction absorbed or dissolved of MH from MHOP 1397x941mm (96 x 96 DPI)
Page 26 of 26
http://mc.manuscriptcentral.com/bdd
Biopharmaceutics & Drug Disposition
123456789101112131415161718192021222324252627282930313233343536373839404142434445464748495051525354555657585960

AUTHOR’S QUERY SHEET
Author(s): P. B. Parejiya et al. Article title: Innovation of novel ‘Tab in Tab’ system for release modulation of milnacipran HCl: optimiza-
tion, formulation and in vitro investigationsArticle no: LDDI 738686Enclosures: 1) Query sheet 2) Article proofs 3) Track changes manuscript showing language editing
Dear Author,
Please check these proofs carefully. It is the responsibility of the corresponding author to check against the original manuscript and approve or amend these proofs. A second proof is not normally provided. Informa Healthcare cannot be held responsible for uncorrected errors, even if introduced during the com-position process. The journal reserves the right to charge for excessive author alterations, or for changes requested after the proofing stage has concluded.
A version of your manuscript showing the language edits as tracked changes is appended to the typeset proofs. This document is provided for reference purposes only. Please mark all your corrections to the type-set pages at the front of the PDF. Corrections marked to the tracked changes section will not be incorporated in the published document.
The following queries have arisen during the editing of your manuscript and are marked in the margins of the proofs. Unless advised otherwise, submit all corrections using the CATS online correction form. Once you have added all your corrections, please ensure you press the “Submit All Corrections” button.
AQ1 Please review the table of contributors below and confirm that the first and last names are structured correctly and that the authors are listed in the correct order of contribution.
AQ2. Please check if the hierarchy of head levels is correct in this article.
AQ3. Please provide volume number and page range for Ref. 17.
LDDI
738686
Contrib No. Given Name(s) Surname Suffix
1. Punit B. Parejiya
2. Bhavesh S. Barot
3. Hetal K. Patel
4. Pragna K. Shelat
5. Arunkumar Shukla

12345678910111213141516171819202122232425262728293031323334353637383940414243444546474849505152535455565758
5960616263646566676869707172737475767778798081828384858687888990919293949596979899
100101102103104105106107108109
110111112113114115116
1
IntroductionOral controlled release (CR) systems continue to be the most popular amongst all the drug delivery systems. Conventional oral drug delivery systems are known to provide an immediate release of drug, in which one can-not control the release of the drug and effective concen-tration at the target site, therefore modulation of drug release is required.1 The development of oral controlled release delivery systems for highly water soluble drugs possesses a significant challenge to the formulation sci-entists.2 Most of these highly water-soluble drugs, if not formulated properly, may readily release the drug at a faster rate and are likely to produce toxic concentration of the drug on oral administration.3 For highly water-soluble drugs, drug release for a prolonged period using
a hydrophilic matrix system is limited because of rapid diffusion of the dissolved drug through the hydrophilic gel network or shearing of the hydrated polymer gel layer by the food present in the gastrointestinal tract, leading to dose dumping.4 The unpredictable leaching out of the highly water soluble drugs in to gastro intestinal tract when using conventional sustained release techniques testify the limited success.5
Coating is one of the major technologies to develop controlled release formulations including sustained release, modified release and delayed release oral dosage forms. Pan coating using solvent or latex is well established for many decades but it suffers from disadvantages of significant solvent consumption, long process, and considerable energy use. On the other
ReseaRch aRtIcle
Innovation of novel ‘Tab in Tab’ system for release modulation of milnacipran HCl: optimization, formulation and in vitro investigations
Punit B. Parejiya, Bhavesh S. Barot, Hetal K. Patel, Pragna K. Shelat, and Arunkumar Shukla
K. B. Institute of Pharmaceutical Education and Research, Kadi Sarvavishwavidyalaya, Gandhinagar, India-382023
abstractThe study was aimed toward development of modified release oral drug delivery system for highly water soluble drug, Milnacipran HCl (MH). Novel Tablet in Tablet system (TITs) comprising immediate and extended release dose of MH in different parts was fabricated. The outer shell was composed of admixture of MH, lactose and novel herbal disintegrant obtained from seeds of Lepidium sativum. In the inner core, MH was matrixed with blend of hydrophilic (Benecel®) and hydrophobic (Compritol®) polymers. 32 full factorial design and an artificial neuron network (ANN) were employed for correlating effect of independent variables on dependent variables. The TITs were characterized for pharmacopoeial specifications, in vitro drug release, SEM, drug release kinetics and FTIR study. The release pattern of MH from batch A10 containing 25.17% w/w Benecel® and 8.21% w/w of Compritol® exhibited drug release pattern close proximal to the ideal theoretical profile (t50% = 5.92 h, t75% = 11.9 h, t90% = 18.11 h). The phenomenon of drug release was further explained by concept of percolation and the role of Benecel® and Compritol ATO 888® in drug release retardation was studied. The normalized error obtained from ANN was less, compared with the multiple regression analysis, and exhibits the higher accuracy in prediction. The results of short-term stability study revealed stable chataracteristics of TITs. SEM study of TITs at different dissolution time points confirmed both diffusion and erosion mechanisms to be operative during drug release from the batch A10. Novel TITs can be a succesful once a day delivery system for highly water soluble drugs.Keywords: Milnacipran HCl, Benecel®, Compritol®, Artificial Neuron Network, Lepidium sativum, percolation theory
AQ1
Correspondence: Punit Parejiya, Department of Pharmaceutics, K. B. Institute of Pharmaceutical Education and Research, Sec-23, GH-6, Gandhinagar, Gujarat, India-382023. Tel.: +91 989 856 1832. E-mail: [email protected]
(Received 05 September 2012; revised 06 October 2012; accepted 08 October 2012)
Drug Development and Industrial Pharmacy, 2012; Early Online: 1–13© 2012 Informa Healthcare USA, Inc.ISSN 0363-9045 print/ISSN 1520-5762 onlineDOI: 10.3109/03639045.2012.738686
Drug Development and Industrial Pharmacy
00
00
1
13
05September2012
06October2012
08October2012
0363-9045
1520-5762
© 2012 Informa Healthcare USA, Inc.
10.3109/03639045.2012.738686
2012
Novel ‘Tab in Tab’ system for release modulation
P. B. Parejiya et al.

12345678910111213141516171819202122232425262728293031323334353637383940414243444546474849505152535455565758
5960616263646566676869707172737475767778798081828384858687888990919293949596979899100101102103104105106107108109110111112113114115116
2 P. B. Parejiya et al.
LDDI 738686 Drug Development and Industrial Pharmacy
hand, there is a considerable challenge to develop very thick coating using liquid coating for delayed release or erosion-based controlled delivery. Compression coating is more environment friendly, is perceived to have the potential to eliminate some of the drawbacks of wet coating.6 From manufacturing viewpoint, the compression coated tablets are extremely acceptable to industry because they are prepared using conventional manufacturing methods.7
In recent years, a growing interest has developed in designing drug delivery systems that include an immedi-ate release (IR) component to CR dosages. The addition of an IR component allows one to design delivery systems having optimal pharmacokinetic profiles.8 Milnacipran HCl (MH) which is wonderful new weapon in the fight against both depression and pain. It has essentially equal potency for inhibiting the reuptake of both serotonin and noradrenaline, with no affinity for any neurotransmitter receptor. It is well absorbed following oral administration with an absolute bioavailability of 85%.9 MH is a highly water soluble molecule, (aqueous solubility 800 mg/mL). The base form of Milnacipran is very unstable so it can-not be use for pharmaceutical use. As MH has a short half life (8 h) its immediate release formulation may not be suitable for a once a dosing regimen.10
Compritol® ATO 888 (Glyceryl behenate), a waxy material with low fusion point, has gained wide accep-tance as a novel modified-release excipient. Formulation scientists have explored the potential use of glyceryl behenate in sustained release formulations as a lipo-philic matrix or as a hot melt coating agent.11–13
Hydroxypropyl methylcellulose (HPMC) is one of the most commonly used hydrophilic excipients for developing matrix tablet because it works as a pH-independent gelling agent.14–17 The viscosity grade of HPMC influences drug release profiles by modifying the diffusion and erosion behavior of the matrix system. Benecel® is an ultra high viscosity grade of HPMC as its 2% solution at 20°C shows 150,000–280,000 cps range of viscosity.
Artificial neural network (ANN) resembles the human brain in the way in which knowledge is acquired by the network from its environment through a learning pro-cess and interneuron connection strengths. ANN could be applied to quantify a non linear relationship between causal factors and pharmaceutical responses by means of iterative training of data obtained from a designed experiment.18
The drug release for extended duration, particularly for highly water-soluble drugs, using a hydrophilic matrix system is restricted due to rapid diffusion of the dissolved drug through the hydrophilic gel network. The solely use of hydrophobic polymer as a matrixing agent is not rec-ommended as it repel water molecules and subsequently water diffusion inside the matrix. So, in the proposed research, novel ‘Tablet in Tablet’ system (TITs) was fabricated using polymer blend of hydrophilic polymer (Benecel®) and hydrophobic polymer (Compritol®) for
release modulation of highly water soluble drug MH. TITs is a press coated tablet where dual release com-ponents (immediate release and sustained release) are incorporated in different layers.
Materials and methodsMaterialsMilnacipran HCl, a highly water soluble drug was received as a gift sample from Torrent Research Center (Gandhinagar, India). Hydroxypropylmethylcellulose K200M (Benecel®) was received as gift sample from Amneal pharmaceuticals (Ahmedabad, India). Compritol ATO 888® was gifted from Alembic Pharmaceuticals (Baroda, India). Magnesium stearate, lactose and talc were purchased from Laser Laboratories (India). The seeds of Lepidium sativum were procured from local market. The other chemicals were of labora-tory grade.
MethodsDrug analysis and preparation of calibration curveA double-beam UV spectrophotometer (Shimadzu-1800, Kyoto, Japan) was used for drug analysis. A known detectible amount of MH (10 μg/mL) was taken and dissolved in the dissolution medium and analyzed at 220 nm. Standard concentrations in the Beer–Lambert’s range of 1–50 μg/mL were prepared and studied for 3 days for interday and intraday variations. Statistical test (linearity test) was applied to authenticate the standard curve.19
Calculation of total dose and immediate part releasedThe total dose of MH was calculated by the following equation using available pharmacokinetics data20:
DR Css ClT= ×
(1)
FX ss lT0 / � �λ =C C×
(2)
Where, X0 is oral dose, l is dosing interval, F is fractional
bioavailability, DR is the dosing ate, Css is the steady state plasma concentration and Cl
T is total renal clearance.
From the above equation, Css for the MH is 0.0885 mg/L.
IPR C Vd F( * ) / . ~= =ss 33 11 33 mg
(3)
Dose 1 693 1 1 95 1 2 mg1 2[ . * / ] . ~/= + ( ) =IPR t t0 0 0 (4)
Where t is time up to which controlled release is required and t
1/2 is the drug half-life. Hence, the formula-
tion should release 33 mg of the drug within initial hour and remaining dose up to 18–20 h in a controlled manner.
Preparation of TITsThe TITs was prepared in three steps: (1) Preparation of cup (2) Preparation of core tablet (3) Preparation of TITs. The graphical presentation of preparation of TITs is given in Figure 1.

12345678910111213141516171819202122232425262728293031323334353637383940414243444546474849505152535455565758
5960616263646566676869707172737475767778798081828384858687888990919293949596979899100101102103104105106107108109110111112113114115116
Novel ‘Tab in Tab’ system for release modulation 3
© 2012 Informa Healthcare USA, Inc. LDDI 738686
Slow release component (core tablet)Core tablets containing 77 mg MH were prepared by direct compression. Accurately weighed amount of MH, matrixing polymers (Compritol® and Benecel®), magnesium stearate and talc were mixed thoroughly in double cone blender (Wintech Pharmchem equip-ments, India) for 30 min. The resultant powder blend was compressed into core tablets using a rotary tablet machine equipped with 8 mm round, flat, and plain punches (Karnawati Engineering, India). The force of compression was adjusted so that hardness of all the prepared core tablets ranged from 5–6 kg/cm2. The detailed composition of core tablet is presented in Table 1.
Fast release component (coat layer)The powder used to enrobe the core was formulated to obtain a quick release of the drug. Half of the fast releas-ing powder was placed into die and compressed using modified punch to obtain a cup. The core tablet was placed in the cup. The remaining half quantity of pow-der was filled in the die and contents were compressed using 11 mm round and concave punches. The force of compression was adjusted so that hardness of all the prepared tablets ranged from 5 to 6 kg/cm2 (Karnawati Engineering, India). The detailed composition of coat
layer is presented in Table 1. The dimensions and design of modified punch is given in Figure 2.
Optimization of TITsFactorial designA 32 full factorial design was employed for optimization of the formulation. The amount of Benecel® (X
1) and
Figure 1. Design of TITs.
Table 1. Detail composition of factorial batches of TITs.
Batch code
Composition of MH TITsComposition of the core tablets (320 mg) Composition of the coat layer (240 mg)
MH (mg)Compritol®
(mg)Benecel®
(mg) DCP (mg) MH (mg) Lactose (mg)LSML
(%w/w)
A1 77 150 75
q.s. to 320
25
q.s. to 240
5A2 77 150 50 25 5A3 77 150 25 25 5A4 77 125 75 25 5A5 77 125 50 25 5A6 77 125 25 25 5A7 77 100 75 25 5A8 77 100 50 25 5A9 77 100 25 25 5A10 77 141 46 25 5A11 77 144.5 38.5 25 5In both part of TITs: core tablet and coat layer, 2% magnesium stearate and 1% talc were added, DCP: dicalcium phoshphate, LSML: Lepidium sativum mucilage lyophilized powder.
Figure 2. Design of punch (A) Conventional upper punch (B) Modified punch.

12345678910111213141516171819202122232425262728293031323334353637383940414243444546474849505152535455565758
5960616263646566676869707172737475767778798081828384858687888990919293949596979899100101102103104105106107108109110111112113114115116
4 P. B. Parejiya et al.
LDDI 738686 Drug Development and Industrial Pharmacy
Compritol® (X2) were selected as independent variables
whereas the responses (Y1 = time required to release
50% of the drug, Y2 = time required to release 75% of the
drug and Y3 = time required to release 90% of the drug)
were selected as dependent variables. Table 2 shows the design layout and responses of factorial batches.
Criteria for optimized batchTwo limits were arbitrarily selected: (i) Y
1: time required
to release 50% of the drug should be equal to 6 ± 0.25 h, (ii) Y
2: time required to release 75% of the drug should be
equal to 12 ± 0.25 h and (iii) Y3: time required to release
90% of the drug should be equal to 18 ± 0.25 h.
Artificial neural networkCommercial software, Neurosolutions Version 5.0 (NeuroDimension, Inc., Gainesville, FL, USA) was used throughout the study. The software combines a modu-lar, icon-based network design interface with an imple-mentation of advanced-learning procedures including recurrent back propagation, back propagation through time and genetic optimization. Neurosolutions allow the user to select the number of hidden layers, hidden layer nodes (neurons), iterations used during the model training, learning algorithm, and transfer functions. In the present work, a multilayer perceptron neural net-work was used to predict dependent variables (Y
1 = time
required to release 50% of the drug, Y2 = time required to
release 75% of the drug and Y3 = time required to release
90% of the drug of two batches A10 and A11. The network architecture comprised of two inputs (X
1 and X
2) and
three outputs (Y1, Y
2 and Y
3) processing elements (PEs)
and one hidden layer. The hidden layer contained four PEs with TanhAxon transfer. The learning rule was kept at momentum with step size of 1.0. The output layer con-tained three PEs with TanhAxon transfer. The learning rule was again kept as momentum with a step size of 0.1. The maximum numbers of epochs allowed were 1000. The program was designed to terminate the training program using minimum function when mean squared error drops below specified threshold of 0.01. The depen-dent and independent variables of 32 full factorial design
(batches A1–A9) were used for training. The dependent (Y
1, Y
2 and Y
3) and independent variables (X
1 and X
2) of
batches A10, A11 and A12 were used for validation of the trained network.
Normalized error determinationThe quantitative relationship established by both tech-niques (ANN and FD) was confirmed by preparing experimentally three TITs by random selection of causal factors. Cumulative percentage drug release predicted from the ANN and FD were compared with those gener-ated from physical experiment using Normalized Error (NE). The equation of NE is expressed as follows21:
NE Er Er= −( ){ } ∑ Pr / /2 1 2
(5)
Where, Pr and Er represent predicted and experimen-tal response, respectively.
characterization of tItsPhysical characterization of core tablets and TITsCore tablets and TITs were characterized for weight vari-ation (analytical balance, Sartorius, CP-224S, Germany), thickness (electronic digital micrometer, Palmer, Browne and Sharpe, North Kingstown, RI), crushing strength (Erweka, model TBH 28, Heusenstamm, Germany), and friability (Roche-type friabilometer, 25 rpm for 4 min, Sotax model F1 friabilator, Basel, Switzerland)
.22
In vitro dissolution studyThe TITs were subjected to in vitro drug release for 24 h in a calibrated USP dissolution test apparatus (Electrolab, Model TDT 06-T, Mumbai, India) equipped with paddle employing 900 mL dissolution media. The dissolution media was changed after 2 h from 0.1N HCl (pH 1.2) to phosphate buffer (pH 6.8). The paddles were rotated at 50 rpm and the dissolution medium was maintained at a temperature of 37 ± 0.5°C throughout the experiment. Five ml aliquots were withdrawn and analyzed by spec-trophotometric method as mentioned above. Five ml of fresh dissolution medium was added after each with-drawal to maintain the volume of dissolution media. The study was carried out in triplicate.
Drug release kineticsTo investigate the kinetics of drug release from TITs, the data of in vitro drug release were fitted to different models. In house developed FORTRAN language based program was used to fit zero order, first order, Higuchi, Hixson-Crowell, Korsmeyer-Peppas, and Weibull models. Appropriate drug release kinetic model was selected based on least SSR, least Fisher’s ratio (F) and maximum R2.14
Stability studyThe optimized TITs were charged for the accelerated sta-bility studies as per ICH guidelines (40 ± 2°C and 75 ± 5% RH) for a period of 3 months in stability chambers
Table 2. 32 full factorial design layout and observed responses for core tablets.
Batch code
Transformed values Actual values ResponsesX
1X
2X
1X
2Y
1Y
2Y
3
A1 1 1 150 75 12.3 20.4 30A2 1 0 150 50 8 17.1 26A3 1 −1 150 25 2 6.1 10.2A4 0 1 125 75 6.11 12.5 17A5 0 0 125 50 5.4 10.6 14A6 0 −1 125 25 1.75 4.1 9.1A7 −1 1 100 75 7.6 15.3 19A8 −1 0 100 50 3.5 9.2 12.9A9 −1 −1 100 25 1.6 4 8.2A10 0.64 −0.16 141 46 5.92 11.9 18.11A11 0.78 −0.46 144.5 38.5 4.38 9.83 15.16
12345678910111213141516171819202122232425262728293031323334353637383940414243444546474849505152535455565758
5960616263646566676869707172737475767778798081828384858687888990919293949596979899100101102103104105106107108109110111112113114115116
Novel ‘Tab in Tab’ system for release modulation 5
© 2012 Informa Healthcare USA, Inc. LDDI 738686
(Model-TH 90 S, Thermolab, India). They were placed in flint vials and hermetically sealed with rubber plugs and aluminum caps. The samples were taken out at 30, 60 and 90 days and evaluated for the various physicochemical parameters.
FTIR spectroscopyThe pure drug MH and physical mixture of optimized formulation A10 were analyzed for determination of drug excipients compatibility by Fourier Transformed Infrared Spectroscopy (FTIR, 8400S, Shimadzu, Germany). The IR spectra were done against the KBr background. Spectral scanning was done in the range between 4000 and 400 cm−1.
Result and discussionDrug analysis and preparation of calibration curveThe drug solution in phosphate buffer pH 6.8 showed a λ
max of 220 nm with 2.049 × 10⁴ L/mol × cm molar absorp-
tivity. Calibration curves (2–45 μg/mL) were made using freshly prepared solutions for 3 consecutive days to study the reproducibility of the standard curve. The coefficient of variation (CV) determined on the basis of the absor-bance for six triplicate measurements were found to be between 0.0905 % and 0.0504 % for Inter-day assay preci-sion and Intraday precision respectively. The low % CV values suggested that the standard curve was reproduc-ible. A high degree of correlation was observed between the concentrations taken and the respective absorbance obtained (R2 = 0.999). Linearity test was applied to check whether the obtained regressed line was a straight or a curve. The test showed perfect linearity for the regressed line at 95% confidence interval (p value = 0.0384).
Factorial designA two-factor, three-level full factorial design was employed for optimization of the formulation using amounts of Benecel® (X
1) and amount of Compritol®
(X2) as independent variables. Table 2 shows the design
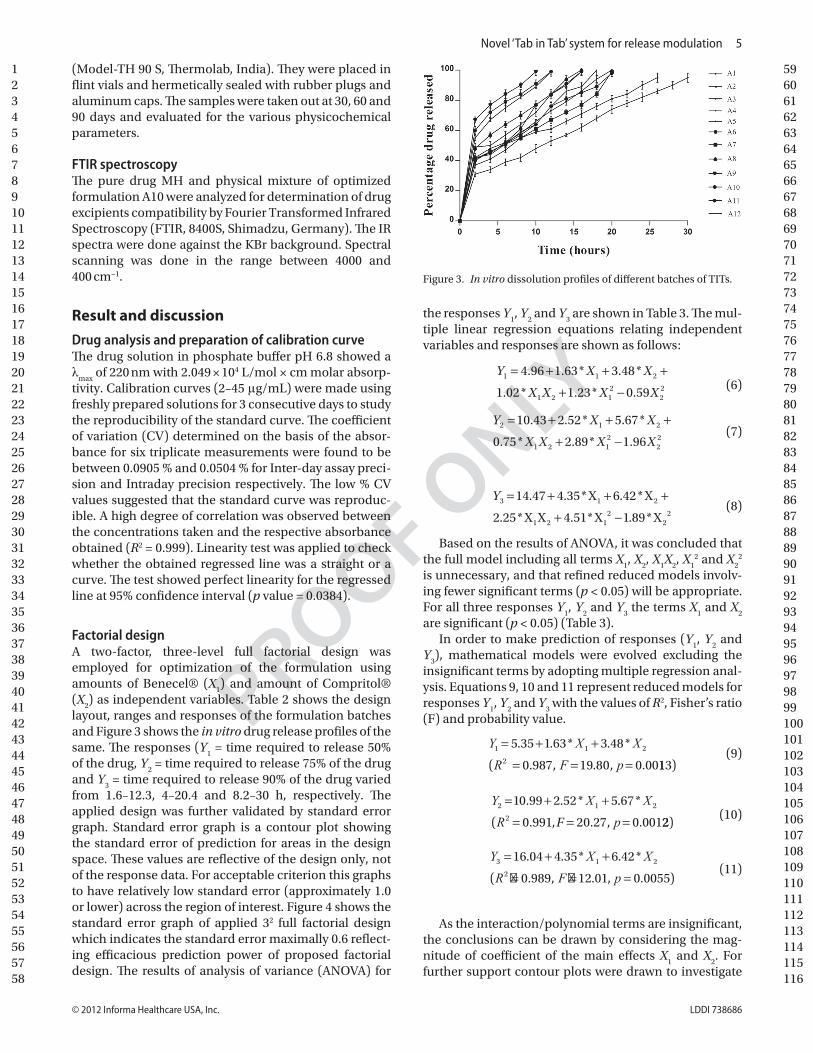
layout, ranges and responses of the formulation batches and Figure 3 shows the in vitro drug release profiles of the same. The responses (Y
1 = time required to release 50%
of the drug, Y2 = time required to release 75% of the drug
and Y3 = time required to release 90% of the drug varied
from 1.6–12.3, 4–20.4 and 8.2–30 h, respectively. The applied design was further validated by standard error graph. Standard error graph is a contour plot showing the standard error of prediction for areas in the design space. These values are reflective of the design only, not of the response data. For acceptable criterion this graphs to have relatively low standard error (approximately 1.0 or lower) across the region of interest. Figure 4 shows the standard error graph of applied 32 full factorial design which indicates the standard error maximally 0.6 reflect-ing efficacious prediction power of proposed factorial design. The results of analysis of variance (ANOVA) for
the responses Y1, Y
2 and Y
3 are shown in Table 3. The mul-
tiple linear regression equations relating independent variables and responses are shown as follows:
Y X X
X X X X1 1 2
1 2 12
22
4 96 1 63 3 48
1 02 1 23 0 59
= + + +
+ −
. . * . *
. * . * .
(6)
Y X X
X X X X2 1 2
1 2 12
22
10 43 2 52 5 67
0 75 2 89 1 96
= + + +
+ −
. . * . *
. * . * .
(7)
Y3 1 2
1 2 12
22
14 47 4 35 X 6 42 X
2 25 X X 4 51 X 1 89 X
. . * . *
. * . * . *
= + + +
+ − (8)
Based on the results of ANOVA, it was concluded that the full model including all terms X
1, X
2, X
1X
2, X
12 and X
22
is unnecessary, and that refined reduced models involv-ing fewer significant terms (p < 0.05) will be appropriate. For all three responses Y
1, Y
2 and Y
3 the terms X
1 and X
2
are significant (p < 0.05) (Table 3).In order to make prediction of responses (Y
1, Y
2 and
Y3), mathematical models were evolved excluding the
insignificant terms by adopting multiple regression anal-ysis. Equations 9, 10 and 11 represent reduced models for responses Y
1, Y
2 and Y
3 with the values of R2, Fisher’s ratio
(F) and probability value.
Y X X
R F p
1 1 2
2
5 35 1 63 3 48
987 19 8
. . * . *
( . , . , .
= + +
= = =0 0 0 00113)
(9)
Y X X
R p
2 1 2
2
1 99 2 52 5 67
2 27
. . * . *
( . , . , .
= + +
= = =
0
0 991 0 0 001F 22)
(10)
Y X X
R F p
3 1 2
2
16 4 4 35 6 42
989 12 1
= + +
=
. . * . *
( � . , � . , . )
0
0 0 0 0055= =
(11)
As the interaction/polynomial terms are insignificant, the conclusions can be drawn by considering the mag-nitude of coefficient of the main effects X
1 and X
2. For
further support contour plots were drawn to investigate
Figure 3. In vitro dissolution profiles of different batches of TITs.

12345678910111213141516171819202122232425262728293031323334353637383940414243444546474849505152535455565758
5960616263646566676869707172737475767778798081828384858687888990919293949596979899100101102103104105106107108109110111112113114115116
6 P. B. Parejiya et al.
LDDI 738686 Drug Development and Industrial Pharmacy
the influence of significant variables. An interaction is said to occur when the effect of one factor on a particular response varies with change in another factor. But this was not observed with the selected model. The perturba-tion plot assisted to compare the effect of all the factors at a particular point in the design space. The response was plotted by changing only one factor over its range,
while holding the other factors constant. A steep slope or curvature in a factor shows that the response is sensi-tive to that factor. Figure 5 depicts the steep slope of lines presenting the effect of X
1 and X
2 variables on responses
Y1, Y
2 and Y
3 proved sensitivity of dependent variables on
the independent variables X1 and X
2. Moreover, the mag-
nitude of influence of factor X2 on responses Y
1, Y
2 and
Y3 is higher than factor X
1 as the perturbation lines of X
2
resides above that of X1 perturbation lines.
The critical observation of the overlaid contour plots of Y
1, Y
2 and Y
3 (Figure 6) exhibits that by vary-
ing X1 from 0.18 to 0.89 and X
2 from −0.26 to 0.14 one
can achieve desired region of acceptability in terms of Y
1 (6 ± 0.25 h), Y
2 (12 ± 0.25 h) and Y
3 (18 ± 0.25 h). A
check-point batch A10 (Table 1) was formulated. For model validation, an additional check-point batch A11, lying outside the region of acceptability and within the design space, was also formulated. The theoretical and experimental responses of Y
1, Y
2 and Y
3 for batch A10
were 5.9, 11.9, 18.11 and 5.83, 12.19, 17.79 h, respec-tively, whereas that of batch A11 were 4.38, 9.83, 15.16 and 4.89, 10.86, 16.44 h respectively, confirming pre-dictive capability of the evolved models. Based on the results of in vitro drug release, batch A10 was consid-ered as an optimized batch satisfying predetermined Figure 4. Standard error graph of applied 32 full factorial design.
Table 3. Result of analysis of variance (ANOVA) of batches A1–A9.Response Source SS DF MS F Prob>F NatureY
1X
116.01 1 16.01 8.48 0.0436 S
X2
72.52 1 72.52 38.43 0.0034 SX
1X
24.20 1 4.20 2.23 0.2099 NS
X1
2 3.55 1 3.55 1.88 0.2423 NSX
22 0.80 1 0.80 0.43 0.5495 NS
Y2
X1
38.00 1 38.00 11.85 0.0262 SX
2192.67 1 192.67 60.10 0.0015 S
X1X
22.25 1 2.25 0.70 0.4493 NS
X1
2 19.53 1 19.53 6.09 0.691 NSX
22 8.94 1 8.94 2.79 0.1703 NS
Y3
X1
113.53 1 113.53 13.23 0.0220 SX
2247.04 1 247.04 28.79 0.0058 S
X1X
220.25 1 20.25 2.36 0.1993 NS
X1
2 47.40 1 47.40 5.52 0.0785 NSX
22 8.36 1 8.36 0.97 0.3795 NS
SS, DF, MS, SN and NS indicate sum of square, degree of freedom, mean square difference, significant and nonsignificant, respectively.
Figure 5. Perturbation plots relating magnitude of effect of individual independent variables on individual dependent variables.

12345678910111213141516171819202122232425262728293031323334353637383940414243444546474849505152535455565758
5960616263646566676869707172737475767778798081828384858687888990919293949596979899100101102103104105106107108109110111112113114115116
Novel ‘Tab in Tab’ system for release modulation 7
© 2012 Informa Healthcare USA, Inc. LDDI 738686
criteria in terms of time required to release 50%, 75% and 90% of MH from TITs.
These findings are due to the nature of polymers used in the formulation. It is inferred from the polynomial equations and perturbation plots that concentration of Compritol® greatly controls the release of drug from polymer backbone. As MH is highly water soluble mol-ecule, release extension for 24 h from solely hydrophilic polymer (Benecel®) matrix is not possible. After initial hours, once the hydrophilic polymer is hydrated, creates channels for drug to diffuse out from dosage form. As the time elapses, the solubilized molecules generate pores within matrix and facilitate drug release from tablet. This phenomenon is responsible for upliftment of curvature of in-vitro dissolution profile after few hours. Incorporation of hydrophobic materials into hydrophilic matrix hinders drug diffusion from the system. Subsequently, the in-vitro drug release profile approaches to linear line. This contri-bution of Benecel® and Compritol® in release modula-tion of highly water soluble drugs works independently. On contact with aqueous media, Benecel® hydrates and expands which hasten drug release while Compritol® resists the diffusion of drug from tablet. Mutual action of both polymers can be a key factor in release extension. Both polymers work on their independent way. This finding is witnessed by absence of interaction term in reduced model obtained from multiple linear regressions of independent and dependent variables. Moreover, the perturbation plots maintain steep slope of both pertur-bation lines over the entire range of design space.
The drug release from the developed (TITs) can be easily explained by the concept of percolation theory.23 It further signifies the role of Compritol ATO 888 in the pro-posed system for modulation of drug release. The drug release from matrix tablet is majorly through pores gen-erated in the system. The percolation theory explains the role of porosity in governing the drug release. The release mechanism of pore diffusion-controlled involves dif-fusion of the drug through water acquired pores within the matrix. The pore structure is generally obtained from the dissolution process associated with the drug and the
inherent pore spaces associated with the matrix. The total porosity of the system is a summation of drug porosity and the inherent porosity of the matrix (porosity before any dissolution). On dissolution and release of drug from the matrix, the leached porous region of the matrix grows on account of the undissolved drug-polymer region.
The process can be graphically illustrated by plots of porosity Vs Log time (Figure 7). The term є
d presents the
inherent porosity of the matrix system (due to nature of material and air composition). The term є
c stands for the
percolation threshold which should be overcome for dif-fusion to be manifested. Exceeding the porosity beyond to є
c, make the volume of system accessible to percolate
the drug. The volume fraction accessible is denoted by єa which progressively increased proportional to the time. The plot clarifies that for drug to leach out from the sys-tem the magnitude of porous network must be exceeds the percolation threshold. Applying the percolation con-cept to out proposed system, the maximum possible vol-ume fraction of drug loaded is 0.240 (i.e. porosity due to MH). Considering the higher solubility of MH (800 mg/mL), it facilitates the ceasing of sample spanning pore networks. This value is relatively high and additionally if matrix is composed of solely Benecel® then volume fraction accessible can be achieved fast in couples of initial hours. This communicates the external environ-ment via narrow throats. This phenomenon is respon-sible for higher drug release of highly water soluble drug from hydrophilic matrix after initial hours. The path through which MH travels in matrix is significantly con-sidered as another important factor which is expressed by tortuosity factor τ. It further reflects in percolation theory. The fate of TITs can be understood by Figure 8, where after ingesion of TITs, the coat layer immediately disintegrates to release fast release component (25mg). Initially, core tablet (batch A10) released 8 mg MH in 15 min. Further, the cumulative amount of MH released in the dissolution media cumulates to 33 mg (25 mg coat + 8 mg core), which corresponds to the required load-ing dose calculated as per equation 3. The core tablet is then exposed to gastrointestinal environment where in
Figure 6. Overlaid contour plot.
Figure 7. Plot of porosity Vs time demonstrating concept of percolation of drug through matrix.

12345678910111213141516171819202122232425262728293031323334353637383940414243444546474849505152535455565758
5960616263646566676869707172737475767778798081828384858687888990919293949596979899100101102103104105106107108109110111112113114115116
8 P. B. Parejiya et al.
LDDI 738686 Drug Development and Industrial Pharmacy
presence of gastrointestinal fluid, the core tablet progres-sively hydrates followed by axial and radial swelling. The magnified view of swollen core table and possible diffu-sion path arrangement is shown in Figure 8. The straight channel indicates unit probability for percolation of MH. This condition is practically impossible for TITs. Other possibility of diffusion can be considered through cir-cuitous pathway where presence of Compritol® in the formulation meaningfully build circuitous path, which suppress the kinetic energy of fluid carrying drug mol-ecule and aids in the extension of release of MH for 24 h. Similar results were reported by Li FQ et al. and Zhang YE et al. who have investigated the effects of melt granula-tion techniques using Compritol® 888 ATO or the effects of post-compression sintering to re-distribute the melted waxy material, increase tortuosity of the matrix and thus further retard drug release.24,25
Moreover the diffusivity of MH from solely Benecel® is higher as compared to mixture of Benecel® and Compritol®. This finding can be correlated to the par-titioning of MH between GIT fluid/Benecel® and GIT fluid/Benecel®/Compritol®. The wax component of Compritol® reduces the partition and sustains MH in polymer backbone. The esterification of glycerol by long-chain fatty acids and the absence of poly ethylene glycol
esters give Compritol® hydrophobic character.26 Though its hydrophobicity, being a nonionic surfactant, it was assumed that the presence of a surfactant increases the wettability of the particles in an aqueous dissolution system.27
This fact further can be supported by micro porous structure of tablet at different time internal after disso-lution (Figure 9). SEM study confirmed both diffusion and erosion mechanisms to be operative during drug release from the batch A10. SEM photomicrographs of the TITs taken at different time intervals after dissolution experiment showed intactness of matrix and rubbery gelling structure with restricted swelling. The hydrophilic chains were could not relaxed properly due to presence of Compritol®.
The performance of sustained-release dosage forms is considerably influenced by anatomical and physiologi-cal constraints. The sustained dosage forms should attain a mechanical strength to prevent the undesired burst effect caused by gastrointestinal motility. The incorpora-tion of Compritol® in the proposed formulation supports the structural integrity.
The presence of Lepidium sativum mucilage lyophi-lized (LSML) powder (5% w/w) in coat layer exhib-ited remarkable effect for release of loading dose
Figure 8. Fate of TITs in gastrointestinal tract and possible drug diffusion pathways.

12345678910111213141516171819202122232425262728293031323334353637383940414243444546474849505152535455565758
5960616263646566676869707172737475767778798081828384858687888990919293949596979899100101102103104105106107108109110111112113114115116
Novel ‘Tab in Tab’ system for release modulation 9
© 2012 Informa Healthcare USA, Inc. LDDI 738686
(Disintegration time = 55 s). This material was extracted from seeds of Lepidium sativum after overnight soak-ing. The mucilage was collected and finally lyophilized (Lyophilizer, Acm-78097 S, ACMAS technology Pvt Ltd, India). Lepidium sativum mucilage lyophilized pow-der was characterized for various physicochemical and microbial testing and results were found satisfactory for its further use in direct compression. Lepidium sativum mucilage lyophilized powder exhibited swelling and sub-sequently rupture of coat layer of TITs. Table 4 depicts the
results of in house specifications of TITs (batches A1-A11) and all were found in the acceptable range.
artificial neural networkDuring development of pharmaceutical dosage form, optimization of formulation variables is very critical. Multiple linear regression analysis is a widely used method for optimization.28,29 However, since the predic-tion of pharmaceutical responses based on polynomial equation of multiple linear regressions (MLR) is often limited to low levels, prediction power of the MLR is poor. To overcome disadvantages of MLR, artificial neural networks were introduced.30,31 Artificial neural networks (ANN) are highly distributed interconnections of adaptive nonlinear processing elements (PEs). When employed in digital hardware, the PE is a simple sum of products followed by non linearity (McCulloch–Pitts neuron). The connection strengths of PEs are adapted to match networks output with desired response. Different type of artificial neural networks like multilayer percep-tron, Jordan/Elmannetwork, principal component anal-ysis, generalized feed forward, generalized regression neural network, self organizing feature map network, modular neural network, time lag recurrent network, recurrent network, fuzzy logic network, etc. are available for prediction. In the present study, multilayer percep-tron was used. Multi-layer perceptrons are a layered feed forward network which is trained with static back propa-gation. The design of the feed forward back propagation network used in the study is presented in Figure 10. The dependent variables (Y
1, Y
2 and Y
3) and independent
variables (X1 and X
2) of 32 full factorial design (batches
A1–A9) were used for training whereas those of batches A10, A11 and A12 were used for validation of the trained network. Predicted ANN responses of batches A10, A11 and A12 are shown in Table 5.
comparison of aNN and FDBoth ANN and FD visualized similar results, and their predictions regarding dependent variables (Y
1, Y
2 and Y
3)
coincided very well. To check the accuracy of these predic-tions, check point batches were prepared experimentally by random selection of causal factors. As an evaluation standard between ANN and FD, the Normalized Error (NE) between the predicted and experimental response variables was employed. The NE values observed with the optimal ANN structure and second order polynomial equations (FD) are depicted in Table 6. Statistically, the practical and predicted responses of batches A10, A11 and A12 were insignificant with F
cal<F
crit at 5% level of
significance. A close look at both ANN and FD presents following facts. The normalized error obtained from ANN was less, compared with the multiple regression analysis, and exhibits the higher accuracy in prediction. ANN can easily handle more input variables and is extremely use-ful when the number of experiments is greater, but in the
Figure 9. SEM images of TITs (batch A10) in dissolution media after (A) 2 h (B) 10 h (C) 24 h.

12345678910111213141516171819202122232425262728293031323334353637383940414243444546474849505152535455565758
5960616263646566676869707172737475767778798081828384858687888990919293949596979899100101102103104105106107108109110111112113114115116
10 P. B. Parejiya et al.
LDDI 738686 Drug Development and Industrial Pharmacy
case of factorial design, a large number of input variables lead to a polynomial with many coefficients, make the computation tedious.
effect of alcoholThe FDA has recently suggested the testing of modi-fied release dosage forms in dissolution media con-taining ethanol. The FDA specifies that the potentially fatal interaction of a modified release system might be observed on consumption of alcohol which results in impairment of the formulation and dose dump-ing.32 Ten percent ethanol, typical of those found in alcoholic beverages, was added in dissolution media (PBS: 6.8) and the drug release of batch A10 was tested. The similarity factor (f
2) value of dissolution profiles
in phoshphate buffer with and without ethanol was
79.13 ± 0.057. There were no any significant physical changes observed in TITs when immersed in hydro alcoholic medium.
effect of phThe possible changes in the drug release profile of a formulation in dissolution media of different pH can be attributed to two factors. One is pH dependent solubility of drug molecule and the other is variation in polymer characteristics in different media. To study the effect of above mentioned variable, release profile of batch A10 was determined in sequential gastrointestinal fluid (pH 1.2, 4.5, 6.8,) and in distilled water. No significant dif-ference was observed in the drug release in different dissolution media. Owing to pKa value 9.7, MH remains predominantly in non ionic state in the pH range studied and solubility does not change significantly at pH values of 1.2–7.433. Therefore, effect of alteration in pH of the media is not significant on drug release profile.
Drug release kineticsIn vitro dissolution data of the optimized formulation A10 was fitted to various mathematical models (zero order, first order, Higuchi, Hixson-Crowell, Korsmeyer-Peppas,
Table 4. Physicochemical evaluation of TITs.Batch Thickness* (mm) Hardness** (kg/cm2) Friability** (%) WeightVariation *** (%) Drug content* (%)A1 4.11 ± 0.065 6.64 ± 0.492 0.70 ± 0.037 3.42 ± 0.043 99.33 ± 0.048A2 4.64 ± 0.0011 6.55 ± 0.248 0.64 ± 0.014 2.24 ± 0.064 98.29 ± 0.026A3 4.63 ± 0.079 6.46 ± 0.491 0.55 ± 0.064 2.37 ± 0.021 99.73 ± 0.049A4 4.67 ± 0.035 6.94 ± 0.467 0.74 ± 0.046 3.56 ± 0.081 98.92 ± 0.064A5 4.27 ± 0.058 6.37 ± 0.128 0.81 ± 0.048 2.98 ± 0.064 97.95 ± 0.037A6 4.51 ± 0.013 6.64 ± 0.578 0.68 ± 0.057 3.64 ± 0.021 98.21 ± 0.046A7 4.28 ± 0.022 6.43 ± 0.348 0.71 ± 0.024 2.83 ± 0.083 99.87 ± 0.082A8 4.34 ± 0.049 6.56 ± 0.642 0.57 ± 0.043 3.53 ± 0.043 99.21 ± 0.057A9 4.91 ± 0.034 6.41 ± 0.247 0.68 ± 0.042 2.91 ± 0.073 98.67 ± 0.016A10 4.54 ± 0.053 6.76 ± 0.348 0.59 ± 0.029 3.41 ± 0.073 99.46 ± 0.073A11 4.67 ± 0.052 6.43 ± 0.427 0.76 ± 0.061 3.07 ± 0.054 99.11 ± 0.037All values are expressed as mean ± SD.* n = 3; ** n = 6; *** n = 20.
Figure 10. The feed forward back propagation network used in the study.
Table 5. Validation of the Established Relationships.
Validation batch code
Transformed valueResponses
Obtained by experiments Predicted from FD Predicted form ANNX
1X
2Y
1Y
2Y
3Y
1Y
2Y
3Y
1Y
2Y
3
A10 0.64 -0.16 5.92 11.9 18.11 5.83 12.19 17.79 5.53 12.46 18.37A11 0.78 -0.46 4.38 9.83 15.16 4.89 10.86 16.44 3.89 9.20 14.79A12 0.51 -0.14 4.98 11.24 16.14 5.571 11.63 16.84 5.23 12.02 17.18
Table 6. Comparison of ANN and FD by NE.
Batches ResponsesNormalized error by FD
Normalized error by ANN
A10 Y1
0.166 0.139A11 Y
20.113 0.105
A12 Y3
0.096 0.070

12345678910111213141516171819202122232425262728293031323334353637383940414243444546474849505152535455565758
5960616263646566676869707172737475767778798081828384858687888990919293949596979899100101102103104105106107108109110111112113114115116
Novel ‘Tab in Tab’ system for release modulation 11
© 2012 Informa Healthcare USA, Inc. LDDI 738686
and Weibull) in order to describe the kinetics of drug release. Drug release from optimized formulation (A10) fitted well into Higuchi kinetics with least sum of square of residuals (SSR = 192.51), Fischer’s ratio (F = 19.25) and maximum R2 value 0.990 (Table 7). The value of drug release exponent (n) was less than 0.45 indicated fickian diffusion.
stability studyThe optimized formulations subjected to short term stability study were evaluated for physical appearance, hardness, friability, in vitro drug release study and drug content. There was no any change in physical appear-ance of TITs. There was insignificant change in drug
release profiles before and after stability study period. (f
2 = 77.14 ± 0.015, t test, p value = 0.027). Table 8 depicts
the results various evaluation parameters of batch A10 before and after stability study which were found to be in official limits.
FtIR spectroscopyFigure 11 shows the IR spectra of MH and physical mixture of optimized formulation A10. An IR spec-trum of MH shows a peak at 3151 cm−1 due to N-H stretching of amine. The band obtained at 3070 cm−1 due to aromatic C-H stretching. Other sharp peaks were seen at 2970, 2921 and 2813 cm−1 are due to methyl and methylene symmetrical and asymmetrical
AQ2
Table 7. Results of kinetics of drug release of batch A10.
ParameterZero order
First order Higuchi model Hixon–Crowell Korsmeyer–Peppas Weibull
R2 0.945 −0.898 0.989 0.936 0.979 0.908F* 93.471 184.32 19.251 64.707 22.312 61.595SSR** 934.708 1843.22 192.513 647.071 200.795 554.350Slope 3.902 −0.163 19.974 0.141 0.346 0.672Intercept 26.075 4.705 7.612 0.231 −0.491 −0.503n – – – – 0.346 –*F is Fisher’s ratio.**SSR is sum of square of residuals.
Table 8. Evaluation parameters for optimized batch A10 subjected to stability study (Mean ± SD, n = 3).
ParametersTime period
Initial 1 month 2 months 3 monthsDrug content (%) 99.46 ± 0.073 98.93 ± 0.054 99.14 ± 0.067 98.67 ± 0.047Hardness ((kg/cm2) 6.76 ± 0.348 6.81 ± 0.62 6.46 ± 0.57 6.37 ± 0.37Friability 0.59 ± 0.029 0.78 ± 0.47 0.69 ± 0.52 0.77 ± 0.19T90% (hrs) 17.89 ± 0.045 18.01 ± 0.057 18.05 ± 0.048 17.94 ± 0.073
Figure 11. Overlay FTIR spectra of drug and optimized formulation.

12345678910111213141516171819202122232425262728293031323334353637383940414243444546474849505152535455565758
5960616263646566676869707172737475767778798081828384858687888990919293949596979899100101102103104105106107108109110111112113114115116
12 P. B. Parejiya et al.
LDDI 738686 Drug Development and Industrial Pharmacy
stretching vibrations. The peak obtained at 1610 cm−1 due to amide carbonyl stretching. The peaks at 744 and 690 cm−1 which are due to mono substituted aromatic ring and at 1363 cm−1 due to symmetrical methyl bending (umbrella bend). The IR spectrum of the optimized formulation showed the charac-teristic absorption bands of MH at 3151, 3070, 2970, 2921, 2812, 1610, 1363, 744 and 690 cm−1. In addition to this, the IR spectrum of the optimized formulation showed the major characteristic absorption bands of the excipients with negligible difference of absorption band values. The peak at 3500 to 3400 cm−1 was due to OH vibrational stretching. The symmetric stretching mode of methyl and hydroxypropyl groups was found in the range 2916 cm−1. The peak at 2550–2500 cm−1 was assigned to OH stretching vibration. The band between 1650 and 1600 cm−1 indicated the pres-ence of stretching vibration of C-O for six membered cyclic rings. The band between 1400 and 1350 cm−1 suggested C-O-C of cyclic anhydrides. The peak at 1300–1250 cm−1 was due to C-O-C cyclic epoxide. These aforementioned peaks were due to presence of Benecel® in the formulation.34–38 The characteristic peaks obtained at 1735 cm−1 (C=O stretching of car-bonyl group) and 1464 cm−1 were due to Compritol®39.
The characteristic peaks obtained at 1463, 2854 and 2918 cm−1, which were due to magnesium stearate. The characteristic IR frequencies of talc were seen at 1024, 667 and 604 cm−1. From the results, it is clear that, there is no significant change in the positions of the charac-teristic peaks of the drug along with the IR spectrum of the optimized formulation derived during the present investigation. So, it can be inferred that the drug main-tains its identity without any chemical interaction with the excipients used.
conclusionThe proposed modified release TITs for MH was con-firmed to be a successful tool for providing the desired drug release pattern characterized by initial burst release followed by its prolonged release for 24 h. The role of Compritol® was appeared to be key factor for release modulation of highly water soluble drugs. The study highlighted that the factorial design and artificial neural network are useful tools to understand the effects of the various formulation parameters in the development of TITs and to predict the best composition for a particular response. Desirable goals can be thus achieved by a sys-tematic formulation approach in the shortest possible time with a reduced number of experiments, thereby reducing the cost of development of the formulations. The proposed system was found to be stable in the presence of alcohol. In future, its application to drugs of higher solubility should be studied to substantiate its ability as a delivery system and its application on a commercial scale to a wide variety of drugs needs to be explored.
Declarations of interest
References 1. Prescott LF, Nimmo WS. (1989). Novel Drug Delivery and Its
Therapeutic Application. New York: John Wiley and Sons. 2. Mishra M, Mishra B. (2010). Design and evaluation of microporous
membrane coated matrix tablets for a highly water soluble drug. Chem Pharm Bull, 58:995–1000.
3. Al-Saidan SM, Krishnaiah YS, Satyanarayana V, Bhaskar P, Karthikeyan RS. (2004). Pharmacokinetic evaluation of guar gum-based three-layer matrix tablets for oral controlled delivery of highly soluble metoprolol tartrate as a model drug. Eur J Pharm Biopharm, 58:697–703.
4. Abd El-Halim SM, Amin MM, El-Gazayerly ON, Abd El-Gawad NA. (2010). Comparative study on the different techniques for the preparation of sustained release hydrophobic matrices of a highly water-soluble drug. Drug Discover Thera, 4(6):484–492.
5. Kotwal PM, Howard SA. (2006). Multilayered Controlled Release Pharmaceutical Dosage Form. In: US PTO, ed. Raritan, NJ: Ortho Pharmaceutical corporation.
6. Chen X, Wen H, Park K. (2010). Challenges and new technologies of oral controlled release. In: Wen H, Park K, eds. Oral Controlled Release Formulation Design and Drug Delivery: Theory to Practice. New Jersey: John Wiley and Sons, 257–277.
7. Lopes CM, Lobo JM, Pinto JF, Costa PC. (2007). Compressed matrix core tablet as a quick/slow dual-component delivery system containing ibuprofen. AAPS PharmSciTech, 8:E76.
8. Kenneth CH, Leung AK. (1987). Hypospadias: a review. J Singapore Paediatr Soc, 29:54–56.
9. Puozzo C, Leonard BE. (1996). Pharmacokinetics of milnacipran in comparison with other antidepressants. Int Clin Psychopharmacol, 11 Suppl 4:15–27.
10. Ansseau M, Papart P, Troisfontaines B, Bartholomé F, Bataille M, Charles G et al. (1994). Controlled comparison of milnacipran and fluoxetine in major depression. Psychopharmacology (Berl), 114:131–137.
11. Faham A, Prinderre P, Farah N, Eichler KD, Kalantzis G, Joachim J. (2000). Hot-melt coating technology. I. Influence of Compritol 888 Ato and granule size on theophylline release. Drug Dev Ind Pharm, 26:167–176.
12. Sutananta W, Craig DQ, Newton JM. (1995). An evaluation of the mechanisms of drug release from glyceride bases. J Pharm Pharmacol, 47:182–187.
13. Mirghani A, Idkaidek NM, Salem MS, Najib NM. (2000). Formulation and release behavior of diclofenac sodium in Compritol 888 matrix beads encapsulated in alginate. Drug Dev Ind Pharm, 26:791–795.
14. Gohel MC, Parikh RK, Nagori SA, Jena DG. (2009). Fabrication of modified release tablet formulation of metoprolol succinate using hydroxypropyl methylcellulose and xanthan gum. AAPS PharmSciTech, 10:62–68.
15. Tiwari SB, Rajabi-Siahboomi AR. (2008). Extended-release oral drug delivery technologies: monolithic matrix systems. In: Jain KK, ed. Drug Delivery Systems. Totowa, NJ: Humana Press, 217–243.
16. Rajabi-Siahboomi AR, Jordan MP. (2000). Slow release HPMC matrix systems. Eur Pharm Rev, 5:21–23.
17. Mohamed FA, Roberts M, Seton L, Ford JL, Levina M, Rajabi-Siahboomi AR. (2012). The influence of HPMC concentration on release of theophylline or hydrocortisone from extended release mini-tablets. Drug Dev Ind Pharm.
18. Gohel M, Nagori SA. (2009). Fabrication and evaluation of captopril modified-release oral formulation. Pharm Dev Technol, 14:679–686.
19. Parejiya PB, Barot BS, Shelat PK, Patel RC, Shukla AK. (2011). Development and validation of analytical methods of milnacipran hydrochloride in bulk and pharmaceutical formulations. Eurasian J Anal Chem, 6(1):67–75.
AQ3

12345678910111213141516171819202122232425262728293031323334353637383940414243444546474849505152535455565758
5960616263646566676869707172737475767778798081828384858687888990919293949596979899100101102103104105106107108109110111112113114115116
Novel ‘Tab in Tab’ system for release modulation 13
© 2012 Informa Healthcare USA, Inc. LDDI 738686
20. Patel GM, Patel MM. (2009). Compressed matrix dual-component vaginal drug delivery system containing metoclopramide hydrochloride. Acta Pharm, 59:273–288.
21. Subramanian N, Yajnik A, Murthy RS. (2004). Artificial neural network as an alternative to multiple regression analysis in optimizing formulation parameters of cytarabine liposomes. AAPS PharmSciTech, 5:E4.
22. IndianPharmacopoeia. (2010). General Monographs. 6th ed.. New Delhi: Government of India.
23. Tongwen X, Binglin H. (1998). Mechanism of sustained drug release in diffusion-controlled polymer matrix-application of percolation theory. Int J Pharm, 170(2):139–149.
24. Li FQ, Hu JH, Deng JX, Su H, Xu S, Liu JY. (2006). In vitro controlled release of sodium ferulate from Compritol 888 ATO-based matrix tablets. Int J Pharm, 324:152–157.
25. Zhang YE, Schwartz JB. (2003). Melt granulation and heat treatment for wax matrix-controlled drug release. Drug Dev Ind Pharm, 29:131–138.
26. Hamdani J, Moës AJ, Amighi K. (2003). Physical and thermal characterisation of Precirol and Compritol as lipophilic glycerides used for the preparation of controlled-release matrix pellets. Int J Pharm, 260:47–57.
27. Ozyazici M, Gökçe EH, Ertan G. (2006). Release and diffusional modeling of metronidazole lipid matrices. Eur J Pharm Biopharm, 63:331–339.
28. Levison KK, Takayama K, Isowa K, Okabe K, Nagai T. (1994). Formulation optimization of indomethacin gels containing a combination of three kinds of cyclic monoterpenes as percutaneous penetration enhancers. J Pharm Sci, 83:1367–1372.
29. Shirakura O, Yamada M, Hashimoto M, Ishimaru S, Takayama K, Nagai T. (1991). Particle size design using computer optimization technique. Drug Dev Ind Pharm, 17(4):471–483.
30. Takayama K, Morva A, Fujikawa M, Hattori Y, Obata Y, Nagai T. (2000). Formula optimization of theophylline controlled-release tablet based on artificial neural networks. J Control Release, 68:175–186.
31. Takahara J, Takayama K, Nagai T. (1997). Multi objective simultaneous optimization technique based on an artificial neural network in sustained release formulations. J Control Release, 49(1):11–20.
32. Traynor MJ, Brown MB, Pannala A, Beck P, Martin GP. (2008). Influence of alcohol on the release of tramadol from 24-h controlled-release formulations during in vitro dissolution experiments. Drug Dev Ind Pharm, 34:885–889.
33. Parejiya PB, Barot BS, Patel HK, Shelat PK, Shukla AK. (2012). Development of platform technology for oral controlled delivery of highly water soluble drugs using milnacipran HCl as a model drug. Drug Deliv Lett, 2(1):35–45.
34. Silverstein RM, Webster FX, Kiemle DJ. (2005). Spectrometric Identification of Organic Compounds. 7th ed. New York: John Wiley and Sons.
35. Dani VR. (1995). Organic spectroscopy. 1st ed. New Delhi: Tata McGraw-Hill Publishing Company Ltd.
36. Raj A, Raju K, Varghese HT, Granadeiro CM, Nogueira HIS, Panicker CY. (2009). IR, Raman and SERS spectra of 2-(methoxycarbonylmethylsulfanyl)-3,5-dinitrobenzene carboxylic acid. J Braz Chem Soc, 20(3):549–559.
37. Govindarajan M, Periandy S, Ganesan K. (2010). Scaled quantum FT-IR and FT-Raman spectral analysis of 1-methoxynaphthalene. E-Journal of Chemistry, 7(2):457–464.
38. Ibrahim M, Alaam M, El-Haes H, Jalbout AF, Leon A. (2006). Analysis of the structure and vibrational spectra of glucose and fructose. Eclética Química, 31:15–21.
39. Brubach JB, Jannin V, Mahler B, Bourgaux C, Lessieur P, Roy P et al. (2007). Structural and thermal characterization of glyceryl behenate by X-ray diffraction coupled to differential calorimetry and infrared spectroscopy. Int J Pharm, 336:248–256.

- 1 -
Original Research Paper
Innovation of novel ‘Tab in Tab’ system for release
modulation of Milnacipran HCl: Optimization, formulation
and in vitro investigations
Punit B. Parejiya*, Bhavesh S. Barot, Hetal K. Patel, Pragna K. Shelat, Arunkumar
Shukla
K. B. Institute of Pharmaceutical Education and Research, Kadi Sarvavishwavidyalaya,
Gandhinagar, India-382023
* Corresponding Author:
Mr. Punit Parejiya
Department of Pharmaceutics
K. B. Institute of Pharmaceutical Education and Research
Sec-23, GH-6
Gandhinagar, Gujarat, India-382023
Email: [email protected]
Phone: +91-9898561832
Abstract
The study was aimed towards development of modified release oral drug delivery system
for highly water soluble drug, Milnacipran HCl (MH). Novel Tablet in Tablet system

- 2 -
(TITs) comprising immediate and extended release dose of MH in different parts was
fabricated. The outer shell was composed of admixture of MH, lactose and novel herbal
disintegrant obtained from seeds of Lepidium sativum. In the inner core, MH was
matrixed with blend of hydrophilic (Benecel®
) and hydrophobic (Compritol®
) polymers.
32 full factorial design and an artificial neuron network (ANN) were employed for
correlating effect of independent variables on dependent variables. The TITs were
characterized for pharmacopoeial specifications, in vitro drug release, SEM, drug release
kinetics and FTIR study. The release pattern of MH from batch A10 containing 25.17%
w/w Benecel®
and 8.21% w/w of Compritol®
exhibited drug release pattern close
proximal to the ideal theoretical profile (t50%=5.92 h, t75%=11.9 h, t90%=18.11 h). The
phenomenon of drug release was further explained by concept of percolation and the role
of Benecel®
and Compritol ATO 888®
in drug release retardation was studied. The
normalized error obtained from ANN was less, compared with the multiple regression
analysis, and exhibits the higher accuracy in prediction. The results of short term stability
study revealed stable chataracteristics of TITs. SEM study of TITs at different dissolution
time points confirmed both diffusion and erosion mechanisms to be operative during drug
release from the batch A10. Novel TITs can be a succesful once a day delivery system for
highly water soluble drugs.
Key words: Milnacipran HCl, Benecel®
, Compritol®
, Artificial Neuron Network,
Lepidium sativum, percolation theory
Introduction
Oral controlled release (CR) systems continue to be the most popular amongst all the
drug delivery systems. Conventional oral drug delivery systems are known to provide an

- 3 -
immediate release of drug, in which one cannot control the release of the drug and
effective concentration at the target site, therefore modulation of drug release is
required.1 The development of oral controlled release delivery systems for highly water
soluble drugs possesses a significant challenge to the formulation scientists.2 Most of
these highly water-soluble drugs, if not formulated properly, may readily release the drug
at a faster rate, and are likely to produce toxic concentration of the drug on oral
administration.3 For highly water-soluble drugs, drug release for a prolonged period
using a hydrophilic matrix system is limited because of rapid diffusion of the dissolved
drug through the hydrophilic gel network or shearing of the hydrated polymer gel layer
by the food present in the gastrointestinal tract, leading to dose dumping.4 The
unpredictable leaching out of the highly water soluble drugs in to gastro intestinal tract
when using conventional sustained release techniques testify the limited success.5
Coating is one of the major technologies to develop controlled release
formulations including sustained release, modified release and delayed release oral
dosage forms. Pan coating using solvent or latex is well established for many decades but
it suffers from disadvantages of significant solvent consumption, long process, and
considerable energy use. On the other hand, there is a considerable challenge to develop
very thick coating using liquid coating for delayed release or erosion-based controlled
delivery. Compression coating is more environment friendly, is perceived to have the
potential to eliminate some of the drawbacks of wet coating.6 From manufacturing
viewpoint, the compression coated tablets are extremely acceptable to industry because
they are prepared using conventional manufacturing methods.7

- 4 -
In recent years, a growing interest has developed in designing drug delivery
systems that include an immediate release (IR) component to CR dosages. The addition
of an IR component allows one to design delivery systems having optimal
pharmacokinetic profiles.8 Milnacipran HCl (MH) which is wonderful new weapon in the
fight against both depression and pain. It has essentially equal potency for inhibiting the
reuptake of both serotonin and noradrenaline, with no affinity for any neurotransmitter
receptor. It is well absorbed following oral administration with an absolute bioavailability
of 85%.9 MH is a highly water soluble molecule, (aqueous solubility 800 mg/mL). The
base form of Milnacipran is very unstable so it cannot be use for pharmaceutical use. As
MH has a short half life (8 hrs) its immediate release formulation may not be suitable for
a once a dosing regimen.10
Compritol®
ATO 888 (Glyceryl behenate), a waxy material with low fusion point,
has gained wide acceptance as a novel modified-release excipient. Formulation scientists
have explored the potential use of glyceryl behenate in sustained release formulations as
a lipophilic matrix or as a hot melt coating agent11-13
.11–13
Hydroxypropyl methylcellulose (HPMC) is one of the most commonly used
hydrophilic excipients for developing matrix tablet because it works as a pH-independent
gelling agent14-17
.14–17
The viscosity grade of HPMC influences drug release profiles by
modifying the diffusion and erosion behavior of the matrix system. Benecel®
is an ultra
high viscosity grade of HPMC as its 2% solution at 20°C shows 150,000 - 280,000 cps
range of viscosity.
Artificial neural network (ANN) resembles the human brain in the way in which
knowledge is acquired by the network from its environment through a learning process

- 5 -
and interneuron connection strengths. ANN could be applied to quantify a non linear
relationship between causal factors and pharmaceutical responses by means of iterative
training of data obtained from a designed experiment.18
The drug release for extended duration, particularly for highly water-soluble
drugs, using a hydrophilic matrix system is restricted due to rapid diffusion of the
dissolved drug through the hydrophilic gel network. The solely use of hydrophobic
polymer as a matrixing agent is not recommended as it repel water molecules and
subsequently water diffusion inside the matrix. So, in the proposed research, novel
‘Tablet in Tablet’ system (TITs) was fabricated using polymer blend of hydrophilic
polymer (Benecel®
) and hydrophobic polymer (Compritol®
) for release modulation of
highly water soluble drug MH. TITs is a press coated tablet where dual release
components (immediate release and sustained release) are incorporated in different
layers.
Materials and Methods
Materials
Milnacipran HCl, a highly water soluble drug was received as a gift sample from Torrent
Research Center (Gandhinagar, India). Hydroxypropylmethylcellulose K200M
(Benecel®
) was received as gift sample from Amneal pharmaceuticals (Ahmedabad,
India). Compritol ATO 888®
was gifted from Alembic Pharmaceuticals (Baroda, India).
Magnesium stearate, lactose and talc were purchased from Laser Laboratories (India).
The seeds of Lepidium sativum were procured from local market. The other chemicals
were of laboratory grade.
Methods

- 6 -
Drug analysis and preparation of calibration curve
A double-beam UV spectrophotometer (Shimadzu-1800, Kyoto, Japan) was used for drug
analysis. A known detectible amount of MH (10 µg/mL) was taken and dissolved in the
dissolution medium and analyzed at 220 nm. Standard concentrations in the Beer-
Lambert’s range of 1-50 µg/mL were prepared and studied for 3 days for interday and
intraday variations. Statistical test (linearity test) was applied to authenticate the standard
curve.19
Calculation of total dose and immediate part released (IPR)
The total dose of MH was calculated by the following equation using available
pharmacokinetics data20
:
DR = Css × ClT
FX0/λ= Css× ClT
Where, X0 is oral dose, l is dosing interval, F is fractional bioavailability, DR is
the dosing ate, Css is the steady state plasma concentration and ClT is total renal
clearance. From the above equation, Css for the MH is 0.0885 mg/L.
IPR = (Css* Vd) / F = 33.11 ~33 mg
Dose = IPR [1 + (0.693 * t/t1/2)] =101.95~102 mg
Where t is time up to which controlled release is required and t1/2 is the drug half-
life. Hence, the formulation should release 33 mg of the drug within initial hour and
remaining dose up to 18-20 hrs in a controlled manner.
Preparation of TITs

- 7 -
The TITs was prepared in three steps: (1) Preparation of cup (2) Preparation of core tablet
(3) Preparation of TITs. The graphical presentation of preparation of TITs is given in
Figure 1.
Slow release component (core tablet)
Core tablets containing 77 mg MH were prepared by direct compression. Accurately
weighed amount of MH, matrixing polymers (Compritol®
and Benecel®
), magnesium
stearate and talc were mixed thoroughly in double cone blender (Wintech Pharmchem
equipments, India) for 30 minutes. The resultant powder blend was compressed into core
tablets using a rotary tablet machine equipped with 8 mm round, flat, and plain punches
(Karnawati Engineering, India). The force of compression was adjusted so that hardness
of all the prepared core tablets ranged from 5-6 kg/cm2. The detailed composition of core
tablet is presented in Table 1.
Fast release component (coat layer)
The powder used to enrobe the core was formulated to obtain a quick release of the drug.
Half of the fast releasing powder was placed into die and compressed using modified
punch to obtain a cup. The core tablet was placed in the cup. The remaining half quantity
of powder was filled in the die and contents were compressed using 11 mm round and
concave punches. The force of compression was adjusted so that hardness of all the
prepared tablets ranged from 5 to 6 kg/cm2 (Karnawati Engineering, India). The detailed
composition of coat layer is presented in Tables 1. The dimensions and design of
modified punch is given in Figure 2.
Optimization of TITs

- 8 -
Factorial design (FD)
A 32 full factorial design was employed for optimization of the formulation. The amount
of Benecel® (X1) and Compritol®
(X2) were selected as independent variables whereas
the responses (Y1 = time required to release 50% of the drug, Y2 = time required to
release 75% of the drug and Y3= time required to release 90% of the drug) were selected
as dependent variables. Table 2 shows the design layout and responses of factorial
batches.
Criteria for optimized batch
Two limits were arbitrarily selected: (i) Y1: time required to release 50% of the drug
should be equal to 6 ± 0.25 hrs, (ii) Y2: time required to release 75% of the drug should
be equal to 12 ± 0.25 hrs and (iii) Y3: time required to release 90% of the drug should be
equal to 18 ± 0.25 hrs
Artificial neural network (ANN)
Commercial software, Neurosolutions Version 5.0 (NeuroDimension, Inc., Gainesville,
FL, USA) was used throughout the study. The software combines a modular, icon-based
network design interface with an implementation of advanced-learning procedures
including recurrent back propagation, back propagation through time and genetic
optimization. Neurosolutions allow the user to select the number of hidden layers, hidden
layer nodes (neurons), iterations used during the model training, learning algorithm, and
transfer functions. In the present work, a multi-layer perceptron neural network was used
to predict dependent variables (Y1 = time required to release 50% of the drug, Y2 = time
required to release 75% of the drug and Y3 = time required to release 90% of the drug of
two batches A10 and A11. The network architecture comprised of two inputs (X1 and X2)

- 9 -
and three outputs (Y1, Y2 and Y3) processing elements (PEs) and one hidden layer. The
hidden layer contained four PEs with TanhAxon transfer. The learning rule was kept at
momentum with step size of 1.0. The output layer contained three PEs with TanhAxon
transfer. The learning rule was again kept as momentum with a step size of 0.1. The
maximum numbers of epochs allowed were 1000. The program was designed to
terminate the training program using minimum function when mean squared error drops
below specified threshold of 0.01. The dependent and independent variables of 32 full
factorial design (batches A1–A9) were used for training. The dependent (Y1, Y2 and Y3)
and independent variables (X1 and X2) of batches A10, A11 and A12 were used for
validation of the trained network.
Normalized error determination
The quantitative relationship established by both techniques (ANN and FD) was
confirmed by preparing experimentally three TITs by random selection of causal factors.
Cumulative percentage drug release predicted from the ANN and FD were compared
with those generated from physical experiment using Normalized Error (NE). The
equation of NE is expressed as follows21
:
NE = [Σ{(Pr – Er)/Er}2]1/2
Where, Pr and Er represent predicted and experimental response, respectively.
Characterization of TITs
Physical characterization of core tablets and TITs
Core tablets and TITs were characterized for weight variation (analytical balance,
Sartorius, CP-224S, Germany), thickness (electronic digital micrometer, Palmer, Browne

- 10 -
and Sharpe, North Kingstown, RI), crushing strength (Erweka, model TBH 28,
Heusenstamm, Germany), and friability (Roche-type friabilometer, 25 rpm for 4 minutes,
Sotax model F1 friabilator, Basel, Switzerland).22
In vitro dissolution study
The TITs were subjected to in vitro drug release for 24 hrs in a calibrated USP
dissolution test apparatus (Electrolab, Model TDT 06-T, Mumbai, India) equipped with
paddle employing 900 mL dissolution media. The dissolution media was changed after 2
h from 0.1N HCl (pH 1.2) to phosphate buffer (pH 6.8). The paddles were rotated at 50
rpm and the dissolution medium was maintained at a temperature of 37 ± 0.5°C
throughout the experiment. Five ml aliquots were withdrawn and analyzed by
spectrophotometric method as mentioned above. Five ml of fresh dissolution medium
was added after each withdrawal to maintain the volume of dissolution media. The study
was carried out in triplicate.
Drug release kinetics
To investigate the kinetics of drug release from TITs, the data of in vitro drug release
were fitted to different models. In house developed FORTRAN language based program
was used to fit zero order, first order, Higuchi, Hixson-Crowell, Korsmeyer-Peppas, and
Weibull models. Appropriate drug release kinetic model was selected based on least SSR,
least Fisher’s ratio (F) and maximum R2.14
Stability study
The optimized TITs were charged for the accelerated stability studies as per ICH
guidelines (40±2°C and 75±5% RH) for a period of 3 months in stability chambers
(Model-TH 90 S, Thermolab, India). They were placed in flint vials and hermetically

- 11 -
sealed with rubber plugs and aluminum caps. The samples were taken out at 30, 60 and
90 days and evaluated for the various physicochemical parameters.
FTIR spectroscopy
The pure drug MH and physical mixture of optimized formulation A10 were analyzed for
determination of drug excipients compatibility by Fourier Transformed Infrared
Spectroscopy (FTIR, 8400S, Shimadzu, Germany). The IR spectra were done against the
KBr background. Spectral scanning was done in the range between 4000 cm-1
- 400 cm-1
.
Result and Discussion
Drug analysis and preparation of calibration curve
The drug solution in phosphate buffer pH 6.8 showed a λmax of 220 nm with 2.049 ×10⁴
L/mol×cm molar absorptivity. Calibration curves (2-45 µg/mL) were made using freshly
prepared solutions for 3 consecutive days to study the reproducibility of the standard
curve. The coefficient of variation (CV) determined on the basis of the absorbance for six
triplicate measurements were found to be between 0.0905 % and 0.0504 % for Inter-day
assay precision and Intraday precision respectively. The low % CV values suggested that
the standard curve was reproducible. A high degree of correlation was observed between
the concentrations taken and the respective absorbance obtained (R2 = 0.999). Linearity
test was applied to check whether the obtained regressed line was a straight or a curve.
The test showed perfect linearity for the regressed line at 95% confidence interval (p
value = 0.0384).
Factorial design

- 12 -
A two-factor, three-level full factorial design was employed for optimization of the
formulation using amounts of Benecel®
(X1) and amount of Compritol®
(X2) as
independent variables. Table 2 shows the design layout, ranges and responses of the
formulation batches and Figure 3 shows the in vitro drug release profiles of the same.
The responses (Y1 = time required to release 50% of the drug, Y2 = time required to
release 75% of the drug and Y3= time required to release 90% of the drug varied from
1.6–12.3 hrs, 4-20.4 hrs and 8.2-30 hrs, respectively. The applied design was further
validated by standard error graph. Standard error graph is a contour plot showing the
standard error of prediction for areas in the design space. These values are reflective of
the design only, not of the response data. For acceptable criterion this graphs to have
relatively low standard error (approximately 1.0 or lower) across the region of interest.
Figure 4 shows the standard error graph of applied 32 full factorial design which indicates
the standard error maximally 0.6 reflecting efficacious prediction power of proposed
factorial design. The results of analysis of variance (ANOVA) for the responses Y1, Y2
and Y3 are shown in Table 3. The multiple linear regression equations relating
independent variables and responses are shown as follows:
Y1 = 4.96+1.63*X1+3.48*X2+1.02*X1X2+1.23*X12-0.59*X2
2 (6)
Y2 = 10.43+2.52*X1+5.67*X2+0.75*X1X2+2.89*X12-1.96*X2
2 (7)
Y3 = 14.47+4.35*X1+6.42*X2+2.25*X1X2+4.51*X12-1.89*X2
2 (8)
Based on the results of ANOVA, it was concluded that the full model including all
termsX1, X2, X1X2, X12 and X2
2 is unnecessary, and that refined reduced models

- 13 -
involving fewer significant terms (p < 0.05) will be appropriate. For all three responses
Y1, Y2 and Y3 the terms X1 and X2 are significant (p < 0.05) (Table 3).
In order to make prediction of responses (Y1, Y2 and Y3), mathematical models
were evolved excluding the insignificant terms by adopting multiple regression analysis.
Equations 9, 10 and 11 represent reduced models for responses Y1, Y2 and Y3 with the
values of R2, Fisher’s ratio (F) and probability value.
Y1 = 5.35+1.63*X1+3.48*X2 (R2=0.987,
Y2 = 10.99+2.52*X1+5.67*X2 (R2=0.991, F= 20.27, p=0.0012) (10)
Y3 = 16.04+4.35*X1+6.42*X2 (R2 =0.989, F= 12.01, p= 0.0055) (11)
As the interaction/polynomial terms are insignificant, the conclusions can be drawn by
considering the magnitude of coefficient of the main effects X1 and X2. For further
support contour plots were drawn to investigate the influence of significant variables. An
interaction is said to occur when the effect of one factor on a particular response varies
with change in another factor. But this was not observed with the selected model. The
perturbation plot assisted to compare the effect of all the factors at a particular point in
the design space. The response was plotted by changing only one factor over its range,
while holding the other factors constant. A steep slope or curvature in a factor shows that
the response is sensitive to that factor. Figure 5 depicts the steep slope of lines presenting
the effect of X1 and X2 variables on responses Y1, Y2 and Y3 proved sensitivity of
dependent variables on the independent variables X1 and X2. Moreover, the magnitude of
influence of factor X2 on responses Y1, Y2 and Y3 is higher than factor X1 as the
perturbation lines of X2 resides above that of X1 perturbation lines.

- 14 -
The critical observation of the overlaid contour plots of Y1, Y2 and Y3 (Figure 6)
exhibits that by varying X1 from 0.18 to 0.89 and X2 from -0.26 to 0.14 one can achieve
desired region of acceptability in terms of Y1 (6 ± 0.25 hrs), Y2 (12± 0.25 hrs) and Y3 (18
± 0.25 hrs). A check-point batch (Table 1, A10) was formulated. For model validation, an
additional check-point batch A11, lying outside the region of acceptability and within the
design space, was also formulated. The theoretical and experimental responses of Y1, Y2
and Y3 for batch A10 were 5.9, 11.9, 18.11 and 5.83, 12.19, 17.79 hrs respectively,
whereas that of batch A11 were 4.38, 9.83, 15.16 and 4.89, 10.86, 16.44 hrs respectively,
confirming predictive capability of the evolved models. Based on the results of in vitro
drug release, batch A10 was considered as an optimized batch satisfying predetermined
criteria in terms of time required to release 50%, 75% and 90% of MH from TITs.
These findings are due to the nature of polymers used in the formulation. It is
inferred from the polynomial equations and perturbation plots that concentration of
Compritol®
greatly controls the release of drug from polymer backbone. As MH is highly
water soluble molecule, release extension for 24 hrs from solely hydrophilic polymer
(Benecel®
) matrix is not possible. After initial hours, once the hydrophilic polymer is
hydrated, creates channels for drug to diffuse out from dosage form. As the time elapses,
the solubilized molecules generate pores within matrix and facilitate drug release from
tablet. This phenomenon is responsible for up-liftment of curvature of in-vitro dissolution
profile after few hours. Incorporation of hydrophobic materials into hydrophilic matrix
hinders drug diffusion from the system. Subsequently, the in-vitro drug release profile
approaches to linear line. This contribution of Benecel®
and Compritol®
in release
modulation of highly water soluble drugs works independently. On contact with aqueous

- 15 -
media, Benecel®
hydrates and expands which hasten drug release while Compritol®
resists the diffusion of drug from tablet. Mutual action of both polymers can be a key
factor in release extension. Both polymers work on their independent way. This finding is
witnessed by absence of interaction term in reduced model obtained from multiple linear
regressions of independent and dependent variables. Moreover, the perturbation plots
maintain steep slope of both perturbation lines over the entire range of design space.
The drug release from the developed (TITs) can be easily explained by the
concept of percolation theory.23
It further signifies the role of Compritol ATO 888 in the
proposed system for modulation of drug release. The drug release from matrix tablet is
majorly through pores generated in the system. The percolation theory explains the role
of porosity in governing the drug release. The release mechanism of pore diffusion-
controlled involves diffusion of the drug through water acquired pores within the matrix.
The pore structure is generally obtained from the dissolution process associated with the
drug and the inherent pore spaces associated with the matrix. The total porosity of the
system is a summation of drug porosity and the inherent porosity of the matrix (porosity
before any dissolution). On dissolution and release of drug from the matrix, the leached
porous region of the matrix grows on account of the undissolved drug-polymer region.
The process can be graphically illustrated by plots of porosity Vs Log time
(Figure 7). The term єd presents the inherent porosity of the matrix system (due to nature
of material and air composition). The term єc stands for the percolation threshold which
should be overcome for diffusion to be manifested. Exceeding the porosity beyond to єc,
make the volume of system accessible to percolate the drug. The volume fraction
accessible is denoted by єa which progressively increased proportional to the time. The

- 16 -
plot clarifies that for drug to leach out from the system the magnitude of porous network
must be exceeds the percolation threshold. Applying the percolation concept to out
proposed system, the maximum possible volume fraction of drug loaded is 0.240 (i.e.
porosity due to MH). Considering the higher solubility of MH (800 mg/mL), it facilitates
the ceasing of sample spanning pore networks. This value is relatively high and
additionally if matrix is composed of solely Benecel®
then volume fraction accessible can
be achieved fast in couples of initial hours. This communicates the external environment
via narrow throats. This phenomenon is responsible for higher drug release of highly
water soluble drug from hydrophilic matrix after initial hours. The path through which
MH travels in matrix is significantly considered as another important factor which is
expressed by tortuosity factor τ. It further reflects in percolation theory. The fate of TITs
can be understood by fig.8, where after ingesion of TITs, the coat layer immediately
disintegrates to release fast release component (25mg). Initially, core tablet (batch A10)
released 8 mg MH in 15 minutes. Further, the cumulative amount of MH released in the
dissolution media cumulates to 33 mg (25mg coat + 8 mg core), which corresponds to the
required loading dose calculated as per equation 3. The core tablet is then exposed to
gastrointestinal environment where in presence of gastrointestinal fluid, the core tablet
progressively hydrates followed by axial and radial swelling. The magnified view of
swollen core table and possible diffusion path arrangement is shown in Figure 8. The
straight channel indicates unit probability for percolation of MH. This condition is
practically impossible for TITs. Other possibility of diffusion can be considered through
circuitous pathway where presence of Compritol®
in the formulation meaningfully build
circuitous path, which suppress the kinetic energy of fluid carrying drug molecule and

- 17 -
aids in the extension of release of MH for 24 hrs. Similar results were reported by Li FQ
et al and Zhang YE et al who have investigated the effects of melt granulation techniques
using Compritol®
888 ATO or the effects of post-compression sintering to re-distribute
the melted waxy material, increase tortuosity of the matrix and thus further retard drug
release24-25
.24,25
Moreover the diffusivity of MH from solely Benecel®
is higher as compared to
mixture of Benecel®
and Compritol®
. This finding can be correlated to the partitioning of
MH between GIT fluid/Benecel®
and GIT fluid/Benecel®
/Compritol®
. The wax
component of Compritol®
reduces the partition and sustains MH in polymer backbone.
The esterification of glycerol by long-chain fatty acids and the absence of poly ethylene
glycol esters give Compritol®
hydrophobic character.26
Though its hydrophobicity, being
a nonionic surfactant, it was assumed that the presence of a surfactant increases the
wettability of the particles in an aqueous dissolution system.27
This fact further can be supported by micro porous structure of tablet at different
time internal after dissolution (Figure 9). SEM study confirmed both diffusion and
erosion mechanisms to be operative during drug release from the batch A10. SEM
photomicrographs of the TITs taken at different time intervals after dissolution
experiment showed intactness of matrix and rubbery gelling structure with restricted
swelling. The hydrophilic chains were could not relaxed properly due to presence of
Compritol®
.
The performance of sustained-release dosage forms is considerably influenced by
anatomical and physiological constraints. The sustained dosage forms should attain a
mechanical strength to prevent the undesired burst effect caused by gastrointestinal

- 18 -
motility. The incorporation of Compritol®
in the proposed formulation supports the
structural integrity.
The presence of Lepidium sativum mucilage lyophilized (LSML) powder (5%
w/w) in coat layer exhibited remarkable effect for release of loading dose (Disintegration
time = 55 sec). This material was extracted from seeds of Lepidium sativum after
overnight soaking. The mucilage was collected and finally lyophilized (Lyophilizer,
Acm-78097 S, ACMAS technology Pvt Ltd, India). Lepidium sativum mucilage
lyophilized powder was characterized for various physicochemical and microbial testing
and results were found satisfactory for its further use in direct compression. Lepidium
sativum mucilage lyophilized powder exhibited swelling and subsequently rupture of coat
layer of TITs. Table 4 depicts the results of in house specifications of TITs (batches A1-
A11) and all were found in the acceptable range.
Artificial neural network
During development of pharmaceutical dosage form, optimization of formulation
variables is very critical. Multiple linear regression analysis is a widely used method for
optimization28-29
.28,29
However, since the prediction of pharmaceutical responses based
on polynomial equation of multiple linear regressions (MLR) is often limited to low
levels, prediction power of the MLR is poor. To overcome disadvantages of MLR,
artificial neural networks were introduced30-31
.30,31
Artificial neural networks (ANN) are
highly distributed interconnections of adaptive nonlinear processing elements (PEs).
When employed in digital hardware, the PE is a simple sum of products followed by non
linearity (McCulloch-Pitts neuron). The connection strengths of PEs are adapted to match
networks output with desired response. Different type of artificial neural networks like

- 19 -
multilayer perceptron, Jordan/Elmannetwork, principal component analysis, generalized
feed forward, generalized regression neural network, self organizing feature map
network, modular neural network, time lag recurrent network, recurrent network, fuzzy
logic network, etc. are available for prediction. In the present study, multi-layer
perceptron was used. Multi-layer perceptrons are a layered feed forward network which
is trained with static back propagation. The design of the feed forward back propagation
network used in the study is presented in Figure 10. The dependent variables (Y1, Y2 and
Y3) and independent variables (X1 and X2) of 32 full factorial design (batches A1–A9)
were used for training whereas those of batches A10, A11 and A12 were used for
validation of the trained network. Predicted ANN responses of batches A10, A11 and
A12 are shown in Table.5.
Comparison of ANN and FD
Both ANN and FD visualized similar results, and their predictions regarding dependent
variables (Y1, Y2 and Y3) coincided very well. To check the accuracy of these predictions,
check point batches were prepared experimentally by random selection of causal factors.
As an evaluation standard between ANN and FD, the Normalized Error (NE) between the
predicted and experimental response variables was employed. The NE values observed
with the optimal ANN structure and second order polynomial equations (FD) are depicted
in Table 6. Statistically, the practical and predicted responses of batches A10, A11 and
A12 were insignificant with Fcal<Fcrit at 5% level of significance. A close look at both
ANN and FD presents following facts. The normalized error obtained from ANN was
less, compared with the multiple regression analysis, and exhibits the higher accuracy in
prediction. ANN can easily handle more input variables and is extremely useful when the

- 20 -
number of experiments is greater, but in the case of factorial design, a large number of
input variables lead to a polynomial with many coefficients, make the computation
tedious.
Effect of alcohol
The FDA has recently suggested the testing of modified release dosage forms in
dissolution media containing ethanol. The FDA specifies that the potentially fatal
interaction of a modified release system might be observed on consumption of alcohol
which results in impairment of the formulation and dose dumping.32
Ten percent ethanol,
typical of those found in alcoholic beverages, was added in dissolution media (PBS 6.8)
and the drug release of batch A10 was tested. The similarity factor (f2) value of
dissolution profiles in phoshphate buffer with and without ethanol was 79.13±0.057.
There were no any significant physical changes observed in TITs when immersed in
hydro alcoholic medium.
Effect of pH
The possible changes in the drug release profile of a formulation in dissolution media of
different pH can be attributed to two factors. One is pH dependent solubility of drug
molecule and the other is variation in polymer characteristics in different media. To study
the effect of above mentioned variable, release profile of batch A10 was determined in
sequential gastrointestinal fluid (pH 1.2, 4.5, 6.8,) and in distilled water. No significant
difference was observed in the drug release in different dissolution media. Owing to pKa
value 9.7, MH remains predominantly in non ionic state in the pH range studied and
solubility does not change significantly at pH values of 1.2-7.433
. Therefore, effect of
alteration in pH of the media is not significant on drug release profile.

- 21 -
Drug release kinetics
In vitro dissolution data of the optimized formulation A10 was fitted to various
mathematical models (zero order, first order, Higuchi, Hixson-Crowell, Korsmeyer-
Peppas, and Weibull) in order to describe the kinetics of drug release. Drug release from
optimized formulation (A10) fitted well into Higuchi kinetics with least sum of square of
residuals (SSR =192.51), Fischer’s ratio (F =19.25) and maximum R2 value 0.990 (Table
7). The value of drug release exponent (n) was less than 0.45 indicated fickian diffusion.
Stability study
The optimized formulations subjected to short term stability study were evaluated for
physical appearance, hardness, friability, in vitro drug release study and drug content.
There was no any change in physical appearance of TITs. There was insignificant change
in drug release profiles before and after stability study period. (f2 = 77.14±0.015, t test, p
value = 0.027). Table 8 depicts the results various evaluation parameters of batch A10
before and after stability study which were found to be in official limits.
FTIR Spectroscopy
Figure 11 shows the IR spectra of MH and physical mixture of optimized formulation
A10. An IR spectrum of MH shows a peak at 3151 cm-1
due to N-H stretching of amine.
The band obtained at 3070 cm-1
due to aromatic C-H stretching. Other sharp peaks were
seen at 2970, 2921 and 2813 cm-1
are due to methyl and methylene symmetrical and
asymmetrical stretching vibrations. The peak obtained at 1610 cm-1
due to amide
carbonyl stretching. The peaks at 744 and 690 cm-1
which are due to mono substituted
aromatic ring and at 1363 cm-1
due to symmetrical methyl bending (umbrella bend). The

- 22 -
IR spectrum of the optimized formulation showed the characteristic absorption bands of
MH at 3151, 3070, 2970, 2921, 2812, 1610, 1363, 744 and 690 cm-1
. In addition to this,
the IR spectrum of the optimized formulation showed the major characteristic absorption
bands of the excipients with negligible difference of absorption band values. The peak at
3500 to 3400 cm-1
was due to OH vibrational stretching. The symmetric stretching mode
of methyl and hydroxypropyl groups was found in the range 2916 cm-1
. The peak at
2550-2500 cm-1
was assigned to OH stretching vibration. The band between 1650 and
1600 cm-1
indicated the presence of stretching vibration of C-O for six membered cyclic
rings. The band between 1400 and 1350 cm-1
suggested C-O-C of cyclic anhydrides. The
peak at 1300-1250 cm-1
was due to C-O-C cyclic epoxide. These aforementioned peaks
were due to presence of Benecel® in the formulation34-38
.34–38
The characteristic peaks
obtained at 1735 cm-1
(C=O stretching of carbonyl group) and 1464 cm-1
were due to
Compritol®39
.
The characteristic peaks obtained at 1463, 2854 and 2918 cm-1
which were due to
magnesium stearate. The characteristic IR frequencies of talc were seen at 1024, 667 and
604 cm-1
. From the results, it is clear that, there is no significant change in the positions
of the characteristic peaks of the drug along with the IR spectrum of the optimized
formulation derived during the present investigation. So, it can be inferred that the drug
maintains its identity without any chemical interaction with the excipients used.
Conclusion
The proposed modified release TITs for MH was confirmed to be a successful tool for
providing the desired drug release pattern characterized by initial burst release followed
by its prolonged release for 24 hours. The role of Compritol®
was appeared to be key

- 23 -
factor for release modulation of highly water soluble drugs. The study highlighted that
the factorial design and artificial neural network are useful tools to understand the effects
of the various formulation parameters in the development of TITs and to predict the best
composition for a particular response. Desirable goals can be thus achieved by a
systematic formulation approach in the shortest possible time with a reduced number of
experiments, thereby reducing the cost of development of the formulations. The proposed
system was found to be stable in the presence of alcohol. In future, its application to
drugs of higher solubility should be studied to substantiate its ability as a delivery system
and its application on a commercial scale to a wide variety of drugs needs to be explored.
Table 1. Detail composition of factorial batches of TITs.
Composition of MH TITs
Composition of the core tablets
(320 mg)
Composition of the coat layer
(240 mg) Batch code
MH
(mg)
Compritol®
(mg)
Benecel®
(mg)
DCP
(mg)
MH
(mg)
Lactose
(mg)
LSML
(%w/w)
A1 77 150 75 25 5
A2 77 150 50 25 5
A3 77 150 25 25 5
A4 77 125 75 25 5
A5 77 125 50 25 5
A6 77 125 25 25 5
A7 77 100 75 25 5
A8 77 100 50 25 5
A9 77 100 25 25 5
A10 77 141 46 25 5
A11 77 144.5 38.5
q.s. to
320
25
q.s. to
240
5
(In both part of TITs: core tablet and coat layer, 2% magnesium stearate and 1% talc were added, DCP:
dicalcium phoshphate, LSML: Lepidium sativum mucilage lyophilized powder)
Tables 2. 32 full factorial design layout and observed responses for core tablets
Batch Transformed values Actual Responses

- 24 -
values code
X1 X2 X1 X2 Y1 Y2 Y3
A1 1 1 150 75 12.3 20.4 30
A2 1 0 150 50 8 17.1 26
A3 1 -1 150 25 2 6.1 10.2
A4 0 1 125 75 6.11 12.5 17
A5 0 0 125 50 5.4 10.6 14
A6 0 -1 125 25 1.75 4.1 9.1
A7 -1 1 100 75 7.6 15.3 19
A8 -1 0 100 50 3.5 9.2 12.9
A9 -1 -1 100 25 1.6 4 8.2
A10 0.64 -0.16 141 46 5.92 11.9 18.11
A11 0.78 -0.46 144.5 38.5 4.38 9.83 15.16
Table 3.Result of analysis of variance (ANOVA) of batches A1–A9
Response Source SS DF MS F Prob>F Nature
X1 16.01 1 16.01 8.48 0.0436 S
X2 72.52 1 72.52 38.43 0.0034 S
X1 X2 4.20 1 4.20 2.23 0.2099 NS
X12 3.55 1 3.55 1.88 0.2423 NS
Y1
X22 0.80 1 0.80 0.43 0.5495 NS
X1 38.00 1 38.00 11.8
5 0.0262 S
X2 192.6
7 1
192.6
7 60.10
0.001
5 S
X1 X2 2.25 1 2.25 0.70 0.4493 NS
X12 19.53 1 19.53 6.09 0.691 NS
Y2
X22 8.94 1 8.94 2.79 0.1703 NS
X1 113.53 1 113.53 13.23 0.0220 S
X2 247.0
4 1
247.0
4
28.7
9
0.005
8 S
X1 X2 20.25 1 20.25 2.36 0.1993 NS
X12 47.40 1 47.40 5.52 0.0785 NS
Y3
X22 8.36 1 8.36 0.97 0.3795 NS
(SS, DF, MS, SN and NS indicate sum of square, degree of freedom, mean square difference, significant
and non-significant, respectively)
Table 4. Physicochemical evaluation of TITs

- 25 -
Batch Thickness*
(mm)
Hardness**
(kg/cm2)
Friability**
(%)
Weight
Variation *** (%) Drug content*(%)
A1 4.11±0.065 6.64 ± 0.492 0.70 ± 0.037 3.42±0.043 99.33±0.048
A2 4.64±.0011 6.55 ± 0.248 0.64±0.014 2.24±0.064 98.29±0.026
A3 4.63±0.079 6.46 ± 0.491 0.55± 0.064 2.37±0.021 99.73±0.049
A4 4.67±0.035 6.94 ± 0.467 0.74± 0.046 3.56±0.081 98.92±0.064
A5 4.27±0.058 6.37 ± 0.128 0.81±0.048 2.98±0.064 97.95±0.037
A6 4.51±0.013 6.64 ± 0.578 0.68±0.057 3.64±0.021 98.21±0.046
A7 4.28±0.022 6.43 ± 0.348 0.71±0.024 2.83±0.083 99.87±0.082
A8 4.34±0.049 6.56 ± 0.642 0.57±0.043 3.53±0.043 99.21±0.057
A9 4.91±0.034 6.41 ± 0.247 0.68±0.042 2.91±0.073 98.67±0.016
A10 4.54±0.053 6.76 ± 0.348 0.59±0.029 3.41±0.073 99.46±0.073
A11 4.67±0.052 6.43 ± 0.427 0.76±0.061 3.07±0.054 99.11±0.037
All values are expressed as Mean± SD; * n=3; ** n=6; *** n=20.
Table 5.Validation of the Established Relationships
Responses
Transformed Value Obtained by
experiments Predicted from FD Predicted form ANN
Validation Batch
Code
X1 X2 Y1 Y2 Y3 Y1 Y2 Y3 Y1 Y2 Y3
A10 0.64 -0.16 5.92 11.9 18.11 5.83 12.19 17.79 5.53 12.46 18.37
A11 0.78 -0.46 4.38 9.83 15.16 4.89 10.86 16.44 3.89 9.20 14.79
A12 0.51 -0.14 4.98 11.24 16.14 5.571 11.63 16.84 5.23 12.02 17.18
Table 6. Comparison of ANN and FD by NE
Batches Responses Normalized error by FD Normalized error by ANN
A10 Y1 0.166 0.139
A11 Y2 0.113 0.105
A12 Y3 0.096 0.070
Table 7. Results of kinetics of drug release of batch A10
Parameter Zero orderFirst OrderHiguchi model Hixon –Crowell Korsmeyer -PeppasWeibull
R2 0.945 -0.898 0.989 0.936 0.979 0.908
F* 93.471 184.32 19.251 64.707 22.312 61.595
SSR** 934.708 1843.22 192.513 647.071 200.795 554.350
Slope 3.902 -0.163 19.974 0.141 0.346 0.672
Intercept 26.075 4.705 7.612 0.231 -0.491 -0.503

- 26 -
n 0.346
(*F is Fisher’s ratio,**SSR is sum of square of residuals)
Table 8. Evaluation parameters for optimized batch A10 subjected to stability study
(Mean± SD, n=3)
Time period Parameters
Initial 1 month 2 months 3 months
Drug content (%) 99.46±0.073 98.93±0.054 99.14±0.067 98.67±0.047
Hardness ((kg/cm2)6.76 ± 0.348 6.81 ± 0.62 6.46 ± 0.57 6.37 ± 0.37
Friability 0.59±0.029 0.78±0.47 0.69±0.52 0.77±0.19
T90% (hrs) 17.89±0.045 18.01±0.057 18.05±0.048 17.94±0.073
Figure 1. Design of TITs
Figure 2. Design of punch (a) Conventional upper punch (b) Modified punch
Figure 3. In vitro dissolution profiles of different batches of TITs
Figure 4. Standard error graph of applied 32full factorial design
Figure 5. Perturbation plots relating magnitude of effect of individual independent
variables on individual dependent variables
Figure 6. Overlaid contour plot
Figure 7. Plot of porosity Vs time demonstrating concept of percolation of drug through
matrix
Figure 8. Fate of TITs in gastrointestinal tract and possible drug diffusion pathways
Figure 9. SEM images of TITs (batch A10) in dissolution media after (a) 2 hrs (b) 10 hrs
(c) 24 hrs
Figure 10. The feed forward back propagation network used in the study
Figure 11. Overlay FTIR spectra of drug and optimized formulation
References:

- 27 -
1. Prescott LF, Nimmo WS. 1989. Novel drug delivery and its therapeutic
application. ed., New York: John Wiley and Sons.
2. Mishra M, Mishra B. (2010). Design and evaluation of microporous membrane
coated matrix tablets for a highly water soluble drug. Chem Pharm Bull, 58:995–
1000.
3. Al-Saidan SM, Krishnaiah YS, Satyanarayana V, Bhaskar P, Karthikeyan RS.
(2004). Pharmacokinetic evaluation of guar gum-based three-layer matrix tablets
for oral controlled delivery of highly soluble metoprolol tartrate as a model drug.
Eur J Pharm Biopharm, 58:697–703.
4. Abd El-Halim SM, Amin MM, El-Gazayerly ON, Abd El-Gawad NA. (2010).
Comparative study on the different techniques for the preparation of sustained
release hydrophobic matrices of a highly water-soluble drug. Drug Discover
Thera, 4, (6):484-92.
5. Kotwal PM, Howard SA. 2006. Multilayered controlled release pharmaceutical
dosage form. In USPTO, editor, ed., United States: Ortho Pharmaceutical
corporation, Raritan, NJ.
6. Chen X, Wen H, Park K. 2010. Challenges and new technologies of oral
controlled release. In Wen H, Park K, editors. Oral Controlled Release
Formulation Design and Drug Delivery: Theory to Practice, ed., New Jersey: John
Wiley and Sons. p 257-77.
7. Lopes CM, Lobo JM, Pinto JF, Costa PC. (2007). Compressed matrix core tablet
as a quick/slow dual-component delivery system containing ibuprofen. AAPS
PharmSciTech, 8:E76.

- 28 -
8. Kenneth CH, Leung AK. (1987). Hypospadias: a review. J Singapore Paediatr
Soc, 29:54–56.
9. Puozzo C, Leonard BE. (1996). Pharmacokinetics of milnacipran in comparison
with other antidepressants. Int Clin Psychopharmacol, 11 Suppl 4:15–27.
10. Ansseau M, Papart P, Troisfontaines B, Bartholomé F, Bataille M, Charles G et
al. (1994). Controlled comparison of milnacipran and fluoxetine in major
depression. Psychopharmacology (Berl), 114:131–137.
11. Faham A, Prinderre P, Farah N, Eichler KD, Kalantzis G, Joachim J. (2000). Hot-
melt coating technology. I. Influence of Compritol 888 Ato and granule size on
theophylline release. Drug Dev Ind Pharm, 26:167–176.
12. Sutananta W, Craig DQ, Newton JM. (1995). An evaluation of the mechanisms of
drug release from glyceride bases. J Pharm Pharmacol, 47:182–187.
13. Mirghani A, Idkaidek NM, Salem MS, Najib NM. (2000). Formulation and
release behavior of diclofenac sodium in Compritol 888 matrix beads
encapsulated in alginate. Drug Dev Ind Pharm, 26:791–795.
14. Gohel MC, Parikh RK, Nagori SA, Jena DG. (2009). Fabrication of modified
release tablet formulation of metoprolol succinate using hydroxypropyl
methylcellulose and xanthan gum. AAPS PharmSciTech, 10:62–68.
15. Tiwari SB, Rajabi-Siahboomi AR. 2008. Extended-Release Oral Drug Delivery
Technologies: Monolithic Matrix Systems. In Jain KK, editor Drug Delivery
systems, ed., Totowa, NJ: Humana Press. p 217-43.
16. Rajabi-Siahboomi AR, Jordan MP. (2000). Slow release HPMC matrix systems.
European Pharmaceutical Review, 5:21-23.

- 29 -
17. Mohamed FA, Roberts M, Seton L, Ford JL, Levina M, Rajabi-Siahboomi AR.
(2012). The influence of HPMC concentration on release of theophylline or
hydrocortisone from extended release mini-tablets. Drug Dev Ind Pharm.
18. Gohel M, Nagori SA. (2009). Fabrication and evaluation of captopril modified-
release oral formulation. Pharm Dev Technol, 14:679–686.
19. Parejiya PB, Barot BS, Shelat PK, Patel RC, Shukla AK. (2011). Development
and validation of analytical methods of milnacipran hydrochloride in bulk and
pharmaceutical formulations. Eurasian J Anal Chem, 6, (1):67-75.
20. Patel GM, Patel MM. (2009). Compressed matrix dual-component vaginal drug
delivery system containing metoclopramide hydrochloride. Acta Pharm, 59:273–
288.
21. Subramanian N, Yajnik A, Murthy RS. (2004). Artificial neural network as an
alternative to multiple regression analysis in optimizing formulation parameters of
cytarabine liposomes. AAPS PharmSciTech, 5:E4.
22. IndianPharmacopoeia. 2010. General Monographs. 6th ed., New Delhi:
Government of India.
23. Tongwen X, Binglin H. (1998). Mechanism of sustained drug release in diffusion-
controlled polymer matrix-application of percolation theory. Int J Pharm, 170,
(2):139-49.
24. Li FQ, Hu JH, Deng JX, Su H, Xu S, Liu JY. (2006). In vitro controlled release of
sodium ferulate from Compritol 888 ATO-based matrix tablets. Int J Pharm,
324:152–157.

- 30 -
25. Zhang YE, Schwartz JB. (2003). Melt granulation and heat treatment for wax
matrix-controlled drug release. Drug Dev Ind Pharm, 29:131–138.
26. Hamdani J, Moës AJ, Amighi K. (2003). Physical and thermal characterisation of
Precirol and Compritol as lipophilic glycerides used for the preparation of
controlled-release matrix pellets. Int J Pharm, 260:47–57.
27. Ozyazici M, Gökçe EH, Ertan G. (2006). Release and diffusional modeling of
metronidazole lipid matrices. Eur J Pharm Biopharm, 63:331–339.
28. Levison KK, Takayama K, Isowa K, Okabe K, Nagai T. (1994). Formulation
optimization of indomethacin gels containing a combination of three kinds of
cyclic monoterpenes as percutaneous penetration enhancers. J Pharm Sci,
83:1367–1372.
29. Shirakura O, Yamada M, Hashimoto M, Ishimaru S, Takayama K, Nagai T.
(1991). Particle size design using computer optimization technique. Drug Dev Ind
Pharm, 17, (4):471–83.
30. Takayama K, Morva A, Fujikawa M, Hattori Y, Obata Y, Nagai T. (2000).
Formula optimization of theophylline controlled-release tablet based on artificial
neural networks. J Control Release, 68:175–186.
31. Takahara J, Takayama K, Nagai T. (1997). Multi objective simultaneous
optimization technique based on an artificial neural network in sustained release
formulations. J Control Release, 49, (1):11–20.
32. Traynor MJ, Brown MB, Pannala A, Beck P, Martin GP. (2008). Influence of
alcohol on the release of tramadol from 24-h controlled-release formulations
during in vitro dissolution experiments. Drug Dev Ind Pharm, 34:885–889.

- 31 -
33. Parejiya PB, Barot BS, Patel HK, Shelat PK, Shukla AK. (2012). Development of
platform technology for oral controlled delivery of highly water soluble drugs
using milnacipran HCl as a model drug. Drug Deliv Lett, 2, (1):35-45.
34. Silverstein RM, Webster FX, Kiemle DJ. 2005. Spectrometric Identification of
Organic Compounds. 7th ed., New York: John Wiley and Sons.
35. Dani VR. 1995. Organic spectroscopy. 1st ed., New Delhi: Tata McGraw-Hill
Publishing Company Ltd. .
36. 36 Raj A, Raju K, Varghese HT, Granadeiro CM, Nogueira HIS, Panicker CY.
(2009). IR, Raman and SERS spectra of 2-(methoxycarbonylmethylsulfanyl)-3,5-
dinitrobenzene carboxylic acid. J Braz Chem Soc 20, (3):549-59.
37. Govindarajan M, Periandy S, Ganesan K. (2010). Scaled Quantum FT-IR and FT-
Raman Spectral Analysis of 1-Methoxynaphthalene. E-Journal of Chemistry, 7,
(2):457-64.
38. Ibrahim M, Alaam M, El-Haes H, Jalbout AF, Leon A. (2006). Analysis of the
structure and vibrational spectra of glucose and fructose. Eclética Química, 31:15-
21.
39. Brubach JB, Jannin V, Mahler B, Bourgaux C, Lessieur P, Roy P et al. (2007).
Structural and thermal characterization of glyceryl behenate by X-ray diffraction
coupled to differential calorimetry and infrared spectroscopy. Int J Pharm,
336:248–256.

Drug Delivery Letters, 2012, 2, 000-000 1
2210-3031/12 $58.00+.00 © 2012 Bentham Science Publishers
Development of Platform Technology for Oral Controlled Delivery of Highly Water Soluble Drugs Using Milnacipran HCl as a Model Drug
Punit B. Parejiya*, Bhavesh S. Barot, Hetal K. Patel, Pragna K. Shelat and Arun K. Shukla
K. B. Institute of Pharmaceutical Education and Research, Gandhinagar, India-382023
Abstract: The present study was aimed towards development of porosity controlled osmotic pump as a platform technol-
ogy for delivering highly water soluble drugs using Milnacipran HCl as a model drug. Theoretical zero order drug release
profile (5 mg/hr) was targeted to achieve for fulfilling desired plasma concentration up to 24 hrs. Novel ethyl cellulose
based coating system, Aquarius EKX 19102 SRX-2, was employed in the development of osmotic pump. Influences of
media pH, agitation intensity and osmotic pressure on drug release rate were investigated. Statistical approaches including
mean dissolution time, dissolution efficiency, similarity factor and SeDeM diagram were applied to translate dissolution
profile in to a single value. The Aquarius EKX 19102 SRX-2 coating system at 7% weight gain exhibited zero order drug
release. Scanning electron microscopy confirmed the microporous structure of the film. The results obtained from stability
study, Fourier Transform Infra Red spectra and Differential Scanning Calorimetry study of optimized formulation con-
firmed stable characteristics. This platform technology was further validated using Diltiazem HCl and satisfactory results
were obtained. FORTRAN language based software was applied to assess drug release kinetics and it was found to be
zero order.
Keywords: Aquarius EKX 19102 SRX-2, FORTRAN, Milnacipran HCl, Platform technology, SeDeM diagram.
INTRODUCTION
Oral controlled release (CR) systems continued to be the most popular amongst all the drug delivery systems. Conven-tional oral drug delivery systems are known to provide an immediate release of drug, in which one cannot control the release of the drug and its effective concentration at the tar-get site, therefore modulation of drug release is required [1]. The development of oral controlled release delivery systems for highly water soluble drugs poses a significant challenge to the formulation scientists [2]. Most of these highly water-soluble drugs, if not formulated properly, may instantly re-lease the drug at a faster rate, and are likely to produce toxic concentration of the drug on oral administration [3]. For highly water-soluble drugs, release for a prolonged period using a hydrophilic matrix system is limited because of rapid diffusion of the dissolved drug through the hydrophilic gel network or shearing of the hydrated polymer gel layer by the food present in the gastrointestinal tract, leading to dose dumping [4]. However, factors like pH, presence of food and other physiological factors may affect drug release from conventional CR systems (matrix and reservoir).
Formulation scientist’s focus is always focused on achieving zero order release, which is a prerequisite for ideal drug delivery for highly water soluble drugs. Many tech-nologies are proposed for modified delivery of highly water soluble drugs. Sun Pharma Advanced Research Company Ltd has developed Wrap Matrix Controlled Release Systems as a platform technology for constant release of Metoprolol.
*Address correspondence to this author at the Department of Pharmaceutics, K. B. Institute of Pharmaceutical Education and Research, Sector-23, GH-6
Road, Gandhinagar-382023, Gujarat, India; Tel:+91-9898561832; Fax: 079-232-49069; E-mail: [email protected]
VersatrolTM
, an emulsion-based matrix invented by a Banner Pharmacaps is a successful platform technology for extended release of highly water soluble drugs.
As pharmaceutical agents could be delivered in a con-trolled pattern over a long period by osmotic pressure, there has been an increasing interest in developing osmotic de-vices over the past two decades [5]. Osmotic pumps are con-trolled drug delivery devices based on the principle of osmo-sis [6]. Wide spectrums of osmotic devices are in existence, out of them osmotic pumps are unique, dynamic and widely employed in clinical practice [7]. The porosity controlled osmotic pump (PCOP) is a coated tablet with a semiperme-able membrane (SPM) containing leachable pore forming agents. They are devoid of any aperture to release the drugs; drug release is achieved through the pores, which are formed in the semi permeable wall in situ. In this design the drug after dissolution inside the core is released from the osmotic pump by hydrostatic pressure and diffusion through pores created by the dissolution of pore formers incorporated in the membrane. Drug release from porosity controlled osmotic pump is independent of pH and other physiological parame-ters to a large extent and it is possible to modulate the release characteristics by optimizing the properties of drug and the system [8].
Milnacipran hydrochloride (MH), [10, 11, 52, 94-97], C15H22N2O HCl, molecular weight 282.81 g/mol Fig. (1), is a cyclopropane derivative with the chemical name (±)-[1R(S),2S(R)]-2-(aminomethyl)-N,N-diethyl-1-phenylcyclopropanecarboxamide hydrochloride [9]. It is a wonderful new weapon in the fight against both depression and pain. It has essentially equal potency for inhibiting the reuptake of both serotonin and noradrenaline, with no affin-ity for any neurotransmitter receptor. It is well absorbed

2 Drug Delivery Letters, 2012, Vol. 2, No. 1 Parejiya et al.
following oral administration with an absolute bioavailability of 85% [10]. MH is a highly water soluble molecule, (aque-ous solubility 800 mg/mL). The base form of MH is very unstable, so it cannot be used for pharmaceutical use. As MH has a short half life (8 hrs) its immediate release formulation may not be suitable for a once a day dosing regimen [11].
Fig. (1). Structure of Milnacipran HCl.
Blended polymers play an important role in developing the PCOP. There can be two types of polymers in the blended films: one should remain intact as film, and the other should dissolve and make pores in the intact film, which creates a porous structure for drug release [12]. Aquarius SRX belongs to the family of fully formulated, solvent dis-persible; ethylcellulose (EC) based modified release film coating systems. The Aquarius
® SRX coating systems are
available in three porosity grades which can be matched to drug solubility and/or desired release duration.
In the present study, PCOP was developed as a platform technology for controlled oral delivery of highly water solu-ble drugs MH. A novel Aquarius EKX 19102 SRX–2 coat-ing system was used as a release modulating barrier and its efficiency was compared with blend of Ethocel
®: HPC-L.
The in vitro drug release data were fitted to different mathe-matical models in FORTRAN language based software to predict the drug release kinetics. Moreover, the effect of os-motic pressure, agitation intensity, pH of dissolution media and coat weight gain on drug release were further investi-gated. Various statistical treatments and SeDeM diagram method were employed to compare dissolution profiles. The stability of the optimized formulations was evaluated by short term stability study. The optimized PCOP was further validated by Diltiazem HCl replacing MH and reproducible results were obtained claiming zero order drug release pattern.
MATERIALS AND METHODS
Materials
Milnacipran HCl was received as a gift sample from Tor-rent Research Center (Gandhinagar, India). Aquarius EKX 19102 SRX–2 coating system (low porosity) was received as a gift sample from Zydus Research Center (Ahmedabad, India). Ethylcellulose (EC) (Ethocel*FP Premium, 7 cps viscosity grade with ethoxy content of 48%-49.5%) of aver-age particle size 9.7 μm was a gift from the Dow Chemical Company (Midland, USA). Hydroxypropyl cellulose of three different viscosity grades: HPC-L (6-10 mPa.s), HPC-M (150-400 mPa.s), and HPC-H (1000-4000 mPa.s) were pro-vided as gift samples by Torrent research center (Gandhinagar,
India). Talc and magnesium stearate were procured as a gift sample from Bombay tablets (Gandhinagar, India). Dilti-azem HCl was gifted by Lincoln Pharmaceuticals (Ahmeda-bad, India). Sodium hydroxide (NaOH), dibutyl phthalate (DBT), potassium dihydrogen phosphate (KH2PO4), dihydro calcium phosphate (DCP), sudan red and magnesium sulphate were purchased from commercial sources and used as such.
Methods
Drug Analysis and Preparation of Calibration Curve
A double-beam UV spectrophotometer (Shimadzu-1800, Kyoto, Japan) was used for drug analysis. A known detecti-ble amount of MH (10 μg/mL) was taken and dissolved in the dissolution medium and analyzed at 220 nm. Standard concentrations in the Beer-Lambert's range of 1-50 μg/mL were prepared and studied for 3 days for interday and intra-day variations. Statistical test (linearity test) was applied to authenticate the standard curve [13] .
Preparation of Porosity Controlled Osmotic Pump (PCOP)
The PCOPs were prepared in two steps: 1) Preparation of core tablets and 2) Coating of core tablets. A dry powder
blend of MH, dicalcium phoshphate, magnesium stearate and
talc was mixed for 20 minutes using a cone blender (Riddhi trading, India). This dry blend was directly compressed on a
12 station rotary punch tablet machine (Karnawati Engineer-
ing, India) equipped with 10 mm concave punches. The com-pression force was adjusted to obtain a hardness of 4.5 to 5.5
kg/cm2 in all the batches. The coating solution was prepared
by dissolving AQS in mixture of ethyl alcohol-water mixture (80:20). Sudan red was used as a color (quantity sufficient)
in coating solution. Each batch of 100 convex shaped core
tablets were coated in a conventional standard coating pan (Labtronik, India). The coating conditions were kept as, inlet
air temperature, 40 °C; air flow rate, 1.3 kg/cm2; coating
spray rate, 4-5 ml/min and pan speed, 30 rpm.
Physical Evaluation
The physical mixture of drug-excipients for direct com-pression was evaluated for micrometrical properties. The core
tablets were evaluated for appearance and coated tablets were
visually inspected for film smoothness, uniformity of coating, edge coverage, luster and tablet to tablet variations. The core
tablet and coated tablet were evaluated for weight variation,
hardness and friability. For determination of content uniform-ity, accurately weighed tablets were extracted in distilled wa-
ter and analyzed spectrophometrically after suitable dilutions.
Determination of Coat Tensile Strength
The AQS film was prepared by solvent evaporation tech-
nique in a glass mold [14]. Four percentage w/v polymeric
solution of AQS in ethyl alcohol-water mixture (80:20) were cast on the glass mold followed by overnight drying at 40°C.
The polymeric film (4 cm x1 cm) was cut into the specified
shape and was clamped on the tensile strength testing ma-chine (EIE instruments, India) using flat-faced metal grips.
The tensile strength and elongation percentage were calcu-
lated from the stress–strain profiles.

Development of Platform Technology for Oral Controlled Delivery Drug Delivery Letters, 2012, Vol. 2, No. 1 3
In Vitro Drug Release Study
In vitro drug release of the formulations was carried out using USP-II apparatus (Paddle-type, Electrolab, Model TDT 06-T, Mumbai, India) with rotating speed of 100 rpm, at 37±1°C. The dissolution medium was 0.1N HCl (pH 1.2) (900 mL) for first 2 hrs and phosphate buffer (pH 6.8) (900 mL) for subsequent hours. Samples were withdrawn at speci-fied intervals and were suitably diluted and analyzed imme-diately by UV spectroscopic method.
Statistical Data Treatment
Model independent approaches [i.e., dissolution effi-ciency (DE)
and mean dissolution time (MDT)] were used to
translate the profile differences into a single value [15].
100100
0=
tY
dtY
DE
t
(1)
MDT is a measure of the dissolution rate: the higher the MDT, the slower the release rate.
=
=
=n
j
n
jmid
Mj
Mj
MDT
t
1
1
(2)
where j is the dissolution sample number, n is the number of dissolution sample time, tmid is the time at the midpoint be-tween j and j -1, and M is the amount of drug dissolved between j and j -1[16]. The similarities between two dissolu-tion profiles were assessed by a pair-wise model independent procedure such as similarity factor (f2) [17].
=
+=
n
t
ttt TRwn
f1
5.02
2 }100])(1
1log{[50
(3)
Where n is the number of pull points, wt is an optional weight factor, Rt is the reference profile at time point t, and Tt is the test profile at the same time point; the value of f2 should be between 50 and 100.
Application of SeDeM Diagram
In the dissolution study, higher or lower % drug release than a target value is permitted up to a certain limit. Shah et al proposed that the maximum difference can be 10% (f2=50) for establishing similarity in dissolution [18]. The dissolution profile of theoretical zero order (5 mg/hr release profile) was considered as a reference. Percentage drug release of refer-ence product will get a score of five (ideal) on a scale of zero to ten. The lower and higher permissible % of drug release will get a score of zero and ten respectively. The scores of optimized batch was calculated at each dissolution time point.
( ){ }2/%%5 RtTtScore +=
(4)
Where %Tt is percentage drug released from test product and %Rt is percentage theoretical zero order drug release at the same time.
Morphology of Microporous Film
The polymeric film of AQS (4% w/v) was cast on glass molds as described earlier. The unleached film was then separately kept in a beaker of distilled water for 24 hrs and dried in an oven for 48 hrs to obtain microporous film. Mor-phology of the film was examined by scanning electron mi-croscopy (SEM) (JSM T200, Japan) after sputter coating with gold for 5 to 10 min.
Effect of pH
To study the effect of pH and to investigate a reliable performance of the formulations independent of pH, in vitro release studies were carried out in media of different pH. The dissolution media used in the study were 0.1 N HCl (pH 1.2), acetate buffer (pH 4.5), and phosphate buffer (pH 6.8). Sam-ples were analyzed by UV spectrophotometric method men-tioned earlier.
Effect of Osmotic Pressure
In order to check the effect of osmotic pressure, dissolu-tion study as mentioned earlier was carried out for optimized batch in 2.4% w/v magnesium sulfate solution possessing 6 atm pressure. In contrast to high level of osmotic pressure, the study was also performed in the distilled water at zero atm pressure. The cumulative percentage of released drug in both media was recorded [19].
Effect of Agitation
To study the effect of agitation of the dissolution media, drug release study was performed in dissolution apparatus at various rotational speeds. USP-II type dissolution apparatus (Paddle-type, Electrolab, Model TDT 06-T, Mumbai, India) with rotational speeds of 50, 100, and 150 rpm was used. Phosphate buffer (pH=6.8) was used as dissolution media (pre-equilibrated to 37°C ±1°C). Samples were analyzed by UV spectrophotometric method.
Drug-Release Kinetics
To investigate the kinetics of drug release from PCOP, the in vitro drug release data were fitted to different models such as zero order, first order, Higuchi, Hixson-Crowell, Korsmeyer-Peppas, and Weibull using FORTRAN language based program. Appropriate drug release kinetic model was selected on basis of least SSR, least Fisher’s ratio (F) and maximum R
2 [20].
Stability Study
The PCOPs were subjected to accelerated stability stud-ies as per ICH guidelines (40±2°C and 75±5% RH) for a period of 3 months in stability chambers (Model-TH 90 S, Thermolab, India). They were placed in flint vials and her-metically sealed with rubber plugs and aluminum caps. The samples were taken out at 30, 60 and 90 days and were evaluated for the various parameters depicted in Table 6.
Fourier Transform Infrared Spectroscopy (FTIR)
The pure drug MH and physical mixture of optimized formulation components (MH, AQS, DCP, magnesium

4 Drug Delivery Letters, 2012, Vol. 2, No. 1 Parejiya et al.
stearate and talc) were analyzed for the determination of drug excipients compatibility using Fourier Transformed Infrared Spectroscopy (FTIR, 8400S, Shimadzu, Germany). The IR spectra were done against the KBr background. Spectral scanning was done in the range between 4000 cm
-1 - 400 cm
-1.
Differential Scanning Calorimetry (DSC)
The DSC analysis of pure drug and physical mixture of optimized batches were carried out using DSC TA-60WS (Shimadzu, Japan). Samples (2-8 mg) were accurately weighed using a Sartorius 4503 electronic microbalance (Sartorius, Edgewood, NY) and heated in sealed aluminium pans at a rate of 10°C/min from 50°C to 250°C temperature range under a nitrogen flow of 40 mL/min. Reproducibility was checked by running the sample in triplicate.
RESULT AND DISCUSSION
Drug Analysis and Preparation of Calibration Curve
The drug solution in phosphate buffer pH 6.8 showed a max of 220 nm with 2.049 10
4 L/mol cm molar absorptiv-
ity. Calibration curves (1-50 μg/mL) were made using freshly prepared solutions for 3 consecutive days to study the reproducibility of the standard curve. The coefficient of variation (CV) determined on the basis of the absorbances for six triplicate measurements were found to be 0.0905 % and 0.0504 % for Inter-day assay precision and Intra-day assay precision respectively. The low % CV values sug-gested that the standard curve was reproducible. A high de-gree of correlation was observed between the concentrations taken and the respective absorbances obtained (R
2 = 0.999).
Linearity test was applied to check whether the obtained regressed line was a straight line or a curve (Fig. (2a)). The test showed perfect linearity for the regression line at 95% confidence interval (P value = 0.384). To assess the effect of media pH on drug’s UV absorbance and max, overlapping spectra of drug in different media (pH 1.2, 4.5 and 6.8) were recorded as shown in (Fig. (2b)). There were no any signifi-cant changes in peak and shape of curves, which exhibited stable behavior of drug at different pH and negligible effect of media on UV absorbance.
Physical Evaluation
The results are depicted in Table 4. The results of physi-cal evaluation of batches MH1 and MH2 exhibited poor hardness (i.e. 3.14±0.15 kg/cm
2 for MH1, 3.84±0.29 kg/cm
2
for MH2). To achieve the desired strength, proportion of DCP in batch MH3 was increased and the results showed hardness of 5.98 ± 0.39 kg/cm
2. The precompression study
of powder blend of batch MH3 exhibited optimal micromer-itical properties for direct compression. The weight of core tablet of batch MH3 varied between 298 mg and 307 mg (mean 302.6 ± 3.37) and thickness was between 3.98 mm and 4.05 mm (mean 4.02 ± 0.08). The assay of drug in batch MH3 varied between 97.86 % and 99.98 % (mean 98.91 ± 0.71) and for batch AQ3 was between 97.64% and 99.65 % (mean 98.70 ± 0.67). The results of drug content in core and coated tablet showed negligible loss of material during coat-ing process. Thus, all physical parameters evaluated for core and coated tablets were found to be within official limits.
Fig. (2). (a): Calibration Curve of Milnacipran HCl.
Fig. (2). (b): Overlain UV spectra of Milnacipran HCl in different
media : Ph 1.2 (a), pH 4.5 (b), pH 6.8 (c) at same max.
Mechanical Properties
Ideally the film coat should be hard and tough without being brittle. In the present study mechanical properties of films produced from AQS and blend of Ethocel
®:HPC-L
were separately studied. The tensile strength and elongation at rupture of membrane of Ethocel
®:HPC-L blend without
plasticizer were found to be 30 and 8.6 % respectively; whereas in presence of DBT (5% w/v), the obtained results were 12 and 18 % respectively. Batch AQ3 composed of Aquarius coating system without any plasticizers had a ten-sile strength of 14 and 17.5 % elongation at rupture.
In Vitro Drug Release Study
The criterion of the optimized batch was to acquire drug release profile similar to theoretical zero order release profile (5 mg/hr). To achieve this hypothesis core tablets were coated with AQS. The core tablets (MH3) exhibited more than 80 % drug release in less than 1.5 h. To get efficient pore forming coating, the coating solution systems compris-ing 80:20 parts of ethanol: water was developed for AQS. At higher polymer concentration, the coating solution imparted

Development of Platform Technology for Oral Controlled Delivery Drug Delivery Letters, 2012, Vol. 2, No. 1 5
viscosity and there were instances of clogging the sprayer and difficulty in coating. Therefore, an optimum concentra-tion of 4 % w/v AQS coating solution was chosen for further study.
To assess the efficiency of AQS as a pore forming coat-ing material, study was carried out using batches AQ1-AQ4 (Table 2). AQS is available in three different porosity grades. Considering the solubility of MH (800 mg/mL), low porosity grade Aquarious coating system EKX-2 SRX 19102 was used. Batch AQ1 contains 5% weight gain and has showed 80% drug release within 12 hrs. Application of further coat-ing on core tablet including 6%, 7% and 8% by weight in respective batches AQ2, AQ3 and AQ4 significantly re-tarded cumulative drug release. These findings led to an in-ference that retardation in drug release rate was due to the dense polymer barrier on core tablet. Higher coat thickness offered resistance of SPM to water imbibitions. Suppression in water imbibitions resulted in retardation of drug dissolu-tion in core. Moreover, these results were greatly confirmed by MDT and DE. The MDT values for batches AQ1, AQ2, AQ3 and AQ4 were found to be 6.53±0.024, 7.54±0.086, 9.65±0.047 and 13.10±0.061 respectively while DE values were found to be in descending order as the coat weight gain increases. The order was 7.3±0.054 (AQ4) < 9.99±0.027 (AQ3), 11.05±0.086 (AQ2) < 12.50±0.043 (AQ1). MDT and DE values of batch AQ3 were found to be having close re-semblance to theoretical zero order drug release profile. To endorse this opinion, similarity factor (f2) was calculated between the drug release profile of optimized batch AQ3 and theoretical zero order drug release profile (5 mg/hr). The f2 value was found to be 79.83±0.056. The criterion for select-ing most appropriate batch was successfully satisfied by batch AQ3.
Fig. (3). In vitro drug release study (batches AQ1-AQ4).
Fig. (4). In vitro drug release study (batches EH4-EH7).
.
Table 1. Composition of Core Tablets
Batch Code Ingredients
MH1 MH2 MH3
Milnacipran HCl (mg) 100 100 100
DCP (mg) 95 142.5 191
Talc (%) 2 2 2
Magnesium Stearate (%) 1 1 1
Table.2. Composition of tablets coated with Aquarius EKX 19102 SRX-2 coating system
Batch Code Coating Solution Used (% w/v) Weight Gain (%w/w) Solvent Composition (Ethanol: Water)
AQ1 4 5 80:20
AQ2 4 6 80:20
AQ3 4 7 80:20
AQ4 4 8 80:20
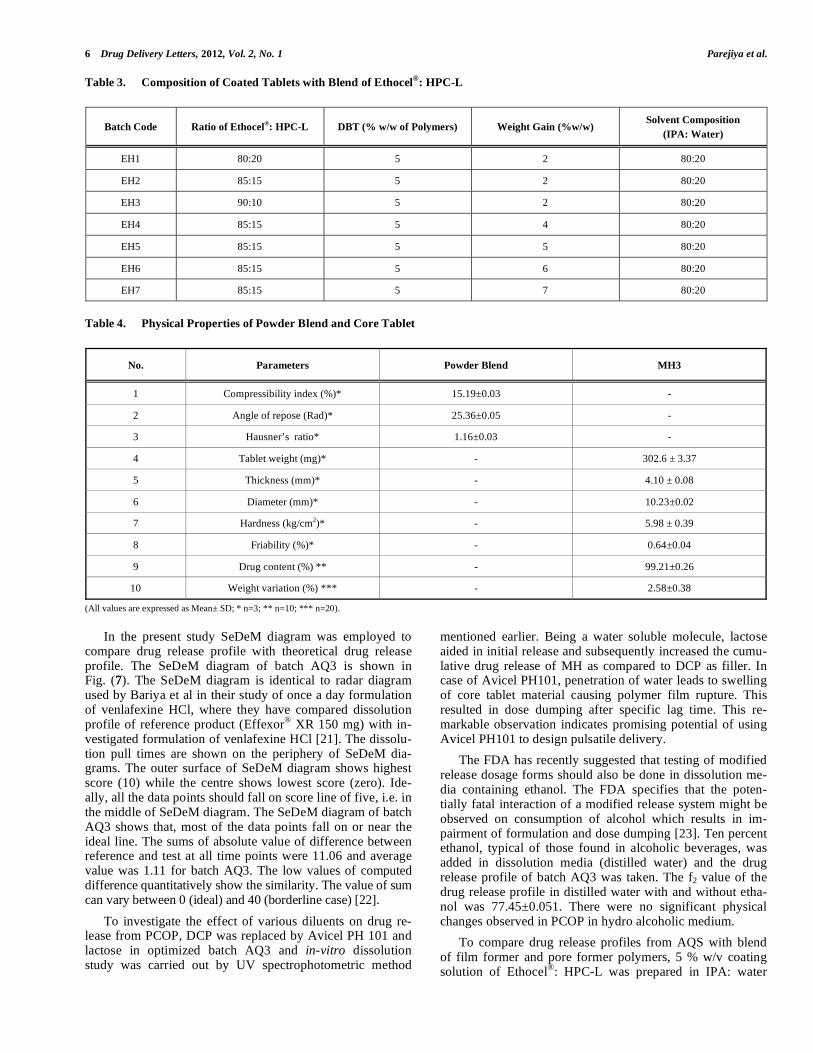
6 Drug Delivery Letters, 2012, Vol. 2, No. 1 Parejiya et al.
Table 3. Composition of Coated Tablets with Blend of Ethocel®
: HPC-L
Batch Code Ratio of Ethocel®: HPC-L DBT (% w/w of Polymers) Weight Gain (%w/w)
Solvent Composition
(IPA: Water)
EH1 80:20 5 2 80:20
EH2 85:15 5 2 80:20
EH3 90:10 5 2 80:20
EH4 85:15 5 4 80:20
EH5 85:15 5 5 80:20
EH6 85:15 5 6 80:20
EH7 85:15 5 7 80:20
Table 4. Physical Properties of Powder Blend and Core Tablet
No. Parameters Powder Blend MH3
1 Compressibility index (%)* 15.19±0.03 -
2 Angle of repose (Rad)* 25.36±0.05 -
3 Hausner’s ratio* 1.16±0.03 -
4 Tablet weight (mg)* - 302.6 ± 3.37
5 Thickness (mm)* - 4.10 ± 0.08
6 Diameter (mm)* - 10.23±0.02
7 Hardness (kg/cm2)* - 5.98 ± 0.39
8 Friability (%)* - 0.64±0.04
9 Drug content (%) ** - 99.21±0.26
10 Weight variation (%) *** - 2.58±0.38
(All values are expressed as Mean± SD; * n=3; ** n=10; *** n=20).
In the present study SeDeM diagram was employed to compare drug release profile with theoretical drug release profile. The SeDeM diagram of batch AQ3 is shown in Fig. (7). The SeDeM diagram is identical to radar diagram used by Bariya et al in their study of once a day formulation of venlafexine HCl, where they have compared dissolution profile of reference product (Effexor
® XR 150 mg) with in-
vestigated formulation of venlafexine HCl [21]. The dissolu-tion pull times are shown on the periphery of SeDeM dia-grams. The outer surface of SeDeM diagram shows highest score (10) while the centre shows lowest score (zero). Ide-ally, all the data points should fall on score line of five, i.e. in the middle of SeDeM diagram. The SeDeM diagram of batch AQ3 shows that, most of the data points fall on or near the ideal line. The sums of absolute value of difference between reference and test at all time points were 11.06 and average value was 1.11 for batch AQ3. The low values of computed difference quantitatively show the similarity. The value of sum can vary between 0 (ideal) and 40 (borderline case) [22].
To investigate the effect of various diluents on drug re-lease from PCOP, DCP was replaced by Avicel PH 101 and lactose in optimized batch AQ3 and in-vitro dissolution study was carried out by UV spectrophotometric method
mentioned earlier. Being a water soluble molecule, lactose aided in initial release and subsequently increased the cumu-lative drug release of MH as compared to DCP as filler. In case of Avicel PH101, penetration of water leads to swelling of core tablet material causing polymer film rupture. This resulted in dose dumping after specific lag time. This re-markable observation indicates promising potential of using Avicel PH101 to design pulsatile delivery.
The FDA has recently suggested that testing of modified release dosage forms should also be done in dissolution me-dia containing ethanol. The FDA specifies that the poten-tially fatal interaction of a modified release system might be observed on consumption of alcohol which results in im-pairment of formulation and dose dumping [23]. Ten percent ethanol, typical of those found in alcoholic beverages, was added in dissolution media (distilled water) and the drug release profile of batch AQ3 was taken. The f2 value of the drug release profile in distilled water with and without etha-nol was 77.45±0.051. There were no significant physical changes observed in PCOP in hydro alcoholic medium.
To compare drug release profiles from AQS with blend of film former and pore former polymers, 5 % w/v coating solution of Ethocel
®: HPC-L was prepared in IPA: water

Development of Platform Technology for Oral Controlled Delivery Drug Delivery Letters, 2012, Vol. 2, No. 1 7
(80:20). A polymer blend with varying ratio of Ethocel®
: HPC-L was used in batches EH1, EH2 and EH3 at constant 2 % weight gain (Table 3). Batch EH1 exhibited extremely poor control on drug release as 90% of drug was released within 8.2 hrs. The excessive drug release is due to the ex-cess amount of leachable polymer (HPC-L) in the coat. In batch EH2, little change in cumulative drug release was ob-served due to reduction in HPC-L content in coating solution (t90 %= 11.1). In contrast, batch EH3 greatly retarded initial release and subsequently slowed down the cumulative re-lease. The cumulative drug release from batch EH3 after 20 hrs was found to be 59.74%. These may be due to poor pore formation. Therefore batch EH2 was further investigated with an aim to impair burst release and improve the degree of curvature of the release profiles. Application of more weight gain of polymer is expected to modulate the drug release and higher mechanical strength of film. This attempt has been made in batches EH4-EH7. It can be clearly seen from the drug release profiles that drug release retardation was directly proportional to the weight gain applied. The initial suppression in drug release after coating in batches (EH4-EH7) could be due to prevention of water penetration into core tablet. These findings were further confirmed by MDT and DE parameters. The higher polymer concentration provided a considerable dense barrier and thus retarding drug release remarkably. The DE of PCOP batches in 20 hrs was found to be in the following order: batch EH7 (8.2± 0.054) < batch EH6 (9.98± 0.047) < batch EH5 (10.52±0.018) < batch EH4 (11.16±0.061). The MDT values for batches EH4, EH5, EH6 and EH7 were 6.38±0.052, 7.44±0.038, 8.23±0.049 and 12.96±0.061 respectively. The results indicated that MDT and DE values of batch EH6 are in close proximity to theo-retical zero order values of MDT (10) and DE (10). No bursting of the PCOP was observed during the dissolution study in any of the formulations.
Comparison of MDT values obtained from dissolution behavior of batches AQ3 (9.99) and EH6 (8.23) proved supe-riority of batch AQ3 over batch EH6 in achieving zero order drug release.
To assess the effect of viscosity and molecular weight of pore forming polymer on drug release profile, HPC-L (6-10 mPa.s) from batch EH3 was replaced by higher viscous grades HPC-M (150-400 mPa.s) and HPC-H (1000-4000 mPa.s.) separately and in vitro dissolution study was per-formed for both the formulations. Results of this study re-vealed insignificant differences in cumulative drug release. This can be explained on the basis of drug-polymer distribu-tion in formulation and its interaction after hydration. In the proposed formulation drug is not distributed in the polymer as in the case of matrix tablet (Fig. (5a)). In matrix tablet, where drug release is affected by three processes with re-spect to polymer (i.e. dissolution of polymer, swelling of polymer and erosion of polymer). Gabriele Betz et al studied effect of different grades of HPC on release of highly water soluble drug Caffeine from matrix tablet and have reported significant change in drug release. This result might be at-tributed to the different swelling behavior of each viscosity grade In this process of drug retardation in matrix system remarkable contribution is given by process of swelling which is not in the case of proposed design of PCOP. In PCOP, drug release is manipulated by pore formation in the
intact film of ethyl cellulose (Fig. (5b)). The pore formation is linearly depending on the solubility of pore forming poly-mer HPC [24].
Fig. (6). In vitro drug release of Diltiazem HCl from optimized
PCOP.
Fig. (5). (a): Matrix tablet. (b): Porosity Controlled Osmotic Pump.
Fig. (7). SeDeM diagram.

8 Drug Delivery Letters, 2012, Vol. 2, No. 1 Parejiya et al.
The optimized PCOP was further validated using well known highly water soluble drug Diltiazem HCl (Aqueous solubility > 590 mg/mL). For validation, similar formula of batch AQ3 was employed replacing MH with Diltiazem HCl. No significant difference in drug release pattern was found between PCOP formulated for Diltiazem HCL and batch AQ3 (t test, P value=0.021). The similarity factor value was 81.65±0.17 for ideal zero order drug release and drug release pattern for Diltiazem HCl PCOP. These result confirmed the applicability of PCOP as a platform technology to deliver highly water soluble drug at a zero order release rate.
Morphology of Microporous Film
Scanning electron microscope was utilized to visualize the possibility of pore formation in film after releasing water soluble part from the film in distilled water. Micrographs clearly exhibited the formation of pores with significant den-sity on an investigated film after dissolution (Fig. (8b)) as compared to the same before dissolution (Fig. (8a)).
Fig. (8). Scanning electron microscopy photographs.
Effect of pH
The possible changes in the drug release profile of a for-
mulation in dissolution media at different pH levels can be
attributed to two factors i.e., the one is pH dependent solubil-
ity of drug molecule and the variation of polymer character-
istics in different media. To study the effect of above men-
tioned variable, release profile of batch AQ3 was determined
in sequential gastrointestinal fluid (pH 1.2, 4.5, 6.8) and in
distilled water. No significant difference was observed in
drug release in different dissolution media. Owing to pKa
value 9.7, MH remains predominantly in non ionic state in
the pH range studied and solubility does not change signifi-
cantly at pH values of 1.2-7.4. Apart from these, in AQS, EC
being cellulose derivative, exert resistance to changes in pH
or ionic content of the medium. Therefore, effect of alteration in pH of the media is not significant on drug release profile.
Effect of Variable Osmotic Pressure
The osmotic pressure of the media was maintained at
higher level than the osmotic pressure generated inside the
core tablet. The in vitro drug release study was carried out in
2.4% w/v magnesium sulfate solution possessing 6 atm pres-
sure. In contrast to high level of osmotic pressure, the study
was also performed in the distilled water at zero atm pres-
sure. The drug release rate were found to be 2.1 mg/hr and
5.2 mg/hr in 2.4% w/v magnesium sulfate solution and dis-
tilled water respectively. This significant difference revealed
that the drug release rate from PCOP is greatly affected by
osmotic pressure of surroundings. This finding inferred that the drug release from PCOP is mainly by osmosis.
Effect of Agitation
There was no significant effect of rotational speed (P
value <0.05) on MH release from developed formulations,
when all the three release profiles were compared. The f2
values were found to be 85.09±0.027 between 50 and 100
rpm, 81.78±0.048 between 100 and 150 rpm, 76.57±0.049
between 50 and 150 rpm. From these findings, it can be ex-
pected that the release from the developed formulation will
be independent of the hydrodynamic conditions of the ab-sorption site.
Drug Release Kinetics
Dissolution data of the optimized formulation AQ3 and
EH6 were fitted to various mathematical models (zero order,
first order, Higuchi, Hixson-Crowell, Korsmeyer-Peppas,
and Weibull) in order to describe the kinetics of drug release.
Drug release from optimized formulation (AQ3) fitted well
into zero-order kinetics with least sum of square of residuals
(SSR =19.22), Fischer’s ratio (F =2.41) and maximum R2
value 0.998 (Table 5). Drug release from optimized formula-
tion (EH6) fitted well into zero-order kinetics with least sum
of square of residuals (SSR = 24.55), Fischer’s ratio (F =
3.07) and maximum R2 value 0.997 (Table 5). These values
evidenced a good agreement with hypothesis for achieving
desired zero order release. Low value of SSR obtained from
batch AQ3 as compared to batch EH6 revealed close proxim-
ity of dissolution profile of batch AQ3 with theoretical zero
order drug release than EH6, which proved superiority of batch AQ3 over EH6.

Development of Platform Technology for Oral Controlled Delivery Drug Delivery Letters, 2012, Vol. 2, No. 1 9
Stability Study
The optimized formulations subjected to short term sta-
bility study were evaluated for physical appearance, hard-
ness, in vitro drug release study and drug content. There was
no alteration in physical appearance of batch AQ3. There
was no significant change in drug release profiles before and
after stability study period. (f2 = 74.21±0.015, t test, P value
= 0.031). Table 6 depicts the results of hardness and drug
content of batch AQ3 before and after stability study which were found to be within the official limits.
FTIR Spectroscopy
Fig. (9) shows the IR spectra of MH and formulation
AQ3. IR spectrum of MH shows a peak at 3153 cm-1
due to
N-H stretching of amine. The band obtained at 3064 cm-1
is
due to aromatic C-H stretching. Other sharp peaks seen at
2970, 2921, 2898, 2813 cm-1
are due to methyl and methyl-
ene symmetrical and asymmetrical stretching vibrations. The
peak obtained at 1610 cm-1
is due to amide carbonyl stretch-
ing. The peaks at 744 and 690 cm-1
are due to mono substi-
tuted aromatic ring and at 1365 cm-1
due to symmetrical
methyl bending (umbrella bend). The IR spectrum of the
optimized formulation showed, the characteristic absorption
bands at 3064, 2970, 2921, 2898, 2813, 1610, 1365, 744 and
690 cm-1
. In addition to this, the IR spectrum of the opti-
mized formulation showed the major characteristic absorp-
tion bands of the excipients with negligible difference of
absorption band values. The sharp peaks obtained at 2900
cm–1
(associated with a CH stretching vibration) and 1093
cm-1
which are due to ethyl-cellulose polymer [25]. The
characteristic peaks obtained at 1463, 2850, 2918 cm-1
which
are due to magnesium stearate. The characteristic IR fre-
quencies of talc are at 1039, 654, 604 and 3677 cm1 [26].
Since there was no change in the nature and position of the
bands in the formulation, it can be inferred that the drug
maintains its identity without any chemical interaction with the excipients used.
Differential Scanning Calorimetry
The DSC was used in order to detect the formulation
incompatibilities due to drug polymer interaction. Any
abrupt or drastic change in the thermal behavior of either the
drug or polymer may indicate a possible drug-polymer inter-
action. The thermograms of pure drug, physical mixture of
excipients of batch AQ3 and physical mixture of excipients
of batch EH6 are shown in (Fig. (10 A, B, C)). It was evident
from the DSC profile (Fig. (10-A)) that MH exhibited a
sharp endothermic peak at 178.7°C which corresponds to the
melting point of the drug. The characteristic, well-
recognizable thermal profile of the drug appeared at 177.15
°C in the physical mixtures of drug with excipients of batch
EH6 (Fig. (10-B)). The same thermal behavior was also ob-
served in drug-excipients physical mixture of batch AQ3
showing MH’s thermal peak at 176.42°C (Fig. (10-C)). This
clearly indicates that there is no drug excipients interaction in the proposed formulations.
CONCLUSION
From this study, it can be concluded that, PCOP is a suc-cessful platform technology for delivering highly water solu-
ble drug at a constant rate. It was observed that drug release
Table 5. Drug Release Kinetics Parameters for Optimized Batches
AQ3 EH6 Kinetic Model
R2 F-Value SSR R
2 F-Value SSR
Hixon-crowell 0.855 134.51 1210.51 0.916 80.83 727.54
Korsmeyer 0.997 3.90 35.06 0.993 7.95 71.59
Weibull 0.903 43.11 344.87 0.938 32.08 256.68
Zero-order 0.999 2.41 19.22 0.997 3.07 24.55
First-order 0.599 2065.82 18592.38 0.754 796.11 7165.00
Higuchi model 0.938 72.23 650.11 0.949 58.51 526.62
Table 6. Evaluation Parameters for Optimized Batch Subjected to Stability Study
AQ3 Parameters
Initial 1 Month 2 Months 3 Months
Drug content (%) 97.86±0.04 98.93±0.05 99.14±0.07 98.67±0.05
Hardness ((kg/cm2) 5.73± 0.23 5.81 ± 0.61 5.46 ± 0.61 5.37 ± 0.61
f2 - 78.15±0.49 69.45±0.82 77.48±0.18
T90% (hrs) 19.57 19.34 19.67 19.42
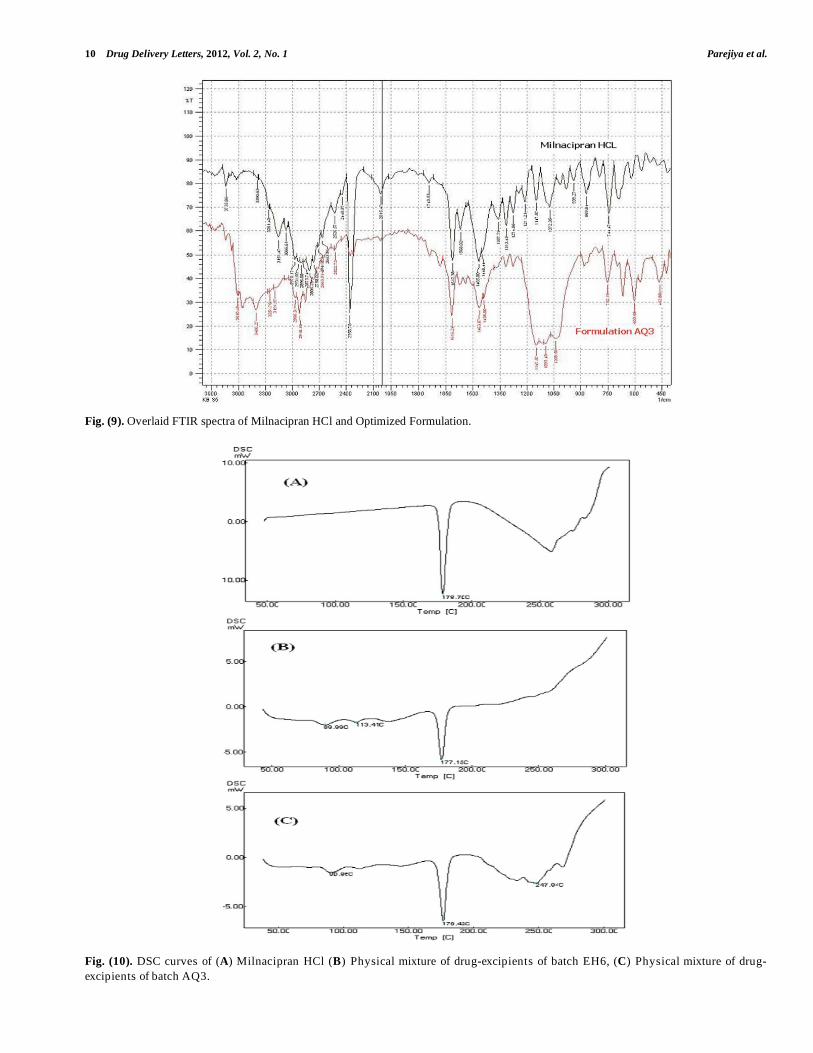
10 Drug Delivery Letters, 2012, Vol. 2, No. 1 Parejiya et al.
Fig. (9). Overlaid FTIR spectra of Milnacipran HCl and Optimized Formulation.
Fig. (10). DSC curves of (A) Milnacipran HCl (B) Physical mixture of drug-excipients of batch EH6, (C) Physical mixture of drug-
excipients of batch AQ3.
Development of Platform Technology for Oral Controlled Delivery Drug Delivery Letters, 2012, Vol. 2, No. 1 11
from PCOP occurs through pores formed in situ. A micro
porous membrane appears to be the key factor with respect to drug release kinetics. Aquarius EKX 19102 SRX-2 coat-
ing system has been optimized to provide predictable release
retardation and stable dissolution profiles. Desired zero order drug release was achieved by batch AQ3 comprising 7%
w/w weight gain on core tablet. In addition, it revealed its
superiority than blend of Ethocel®
: HPC-L as a porosity con-trolled membrane to delivery highly water soluble molecule
in a controlled manner. The dissolution results were consis-
tent with various statistical results and SEM photographs. Mathematical modeling of the release kinetics indicates zero-
order release pattern of MH from PCOP. Overlaid spectra
obtained from DSC study exhibits compatibility of drug with excipients. Results from short term stability study and FTIR
study proves the stable characteristics of PCOP.
ACKNOWLEDGEMENT
Authors are thankful to Torrent Research Center (Gandhinagar, India) for providing gift sample of MH. The authors are grateful to Mrs. Mallika Babu for proof-reading the manuscript for grammatical and spelling errors. This study is a part of research project, carried out at Kadi Sarva Vishwavidyalaya (Gandhinagar, India).
REFERENCES
[1] Prescott, L. F., In Novel Drug Delivery and its Therapeutic Application, John Wiley and Sons: West Susset, UK, 1989; pp 1-11.
[2] Mishra, M.; Mishra, B., Design and evaluation of microporous membrane coated matrix tablets for a highly water soluble drug.
Chem. Pharm. Bull., (Tokyo) 2010, 58 (7), 995-1000. [3] Al-Saidan, S. M.; Krishnaiah, Y. S.; Satyanarayana, V.; Bhaskar,
P.; Karthikeyan, R. S., Pharmacokinetic evaluation of guar gum-based three-layer matrix tablets for oral controlled delivery of
highly soluble metoprolol tartrate as a model drug. Eur. J. Pharm. Biopharm., 2004, 58 (3), 697-703.
[4] Abd El-Halim, S. M.; Amin, M. M.; El-Gazayerly, O. N.; Abd El-Gawad, N. A., Comparative study on the different techniques for
the preparation of sustained release hydrophobic matrices of a highly water-soluble drug. Drug Discover. Thera., 2010, 4 (6),
484-492. [5] Kanagale, P.; Lohray, B. B.; Misra, A.; Davadra, P.; Kini, R.,
Formulation and optimization of porous osmotic pump-based controlled release system of oxybutynin. AAPS PharmSciTech.,
2007, 8 (3), E53. [6] Kumar, P.; Singh, S.; Mishra, B., Development and evaluation of
elementary osmotic pump of highly water soluble drug: tramadol hydrochloride. Curr. Drug Deliv., 2009, 6 (1), 130-9.
[7] Santus, G.; Baker, R., Osmotic drug delivery: a review of the patent literature. J. Control. Release, 1995, (35), 1-21.
[8] Verma, R. K.; Garg, S., Current status of drug delivery technologies and future direction Pharm. Tech., 2001, (25), 1-14.
[9] Dias, C. L.; Rossi, R. C.; Bajerski, L.; Froehlich, P. E., Dissolution method for milnacipran hydrochloride capsules: Development,
validation, and study of changes in dissolution rate after storage. Diss. Tech., 2011, 47-53.
[10] Puozzo, C.; Leonard, B. E., Pharmacokinetics of milnacipran in comparison with other antidepressants. Int. Clin.
Psychopharmacol., 1996, 11 Suppl 4, 15-27. [11] Ansseau, M.; Papart, P.; Troisfontaines, B.; Bartholome, F.;
Bataille, M.; Charles, G.; Schittecatte, M.; Darimont, P.; Devoitille, J. M.; De Wilde, J.; et al., Controlled comparison of milnacipran
and fluoxetine in major depression. Psychopharmacology, (Berl) 1994, 114 (1), 131-137.
[12] Lin, W. J.; Lee, H. K.; Wang, D. M., The influence of plasticizers on the release of theophylline from microporous-controlled tablets.
J Control Release, 2004, 99 (3), 415-421. [13] Parejiya, P. B.; Shelat, P. K.; Patel, R. C.; Barot, B. S.; Shukla, A.
K., Development and validation of UV spectrophotometric method for determination of milnacipran in bulk and pharmaceutical
dosage form. Eur. J. Anal. Chem., 2011, 6 (1), 91-96. [14] Heng, P. W.; Chan, L. W.; Ong, K. T., Influence of storage
conditions and type of plasticizers on ethylcellulose and acrylate films formed from aqueous dispersions. J. Pharm. Pharm. Sci.,
2003, 6 (3), 334-44. [15] Costa, P.; Sousa Lobo, J. M., Modeling and comparison of
dissolution profiles. Eur. J. Pharm. Sci., 2001, 13 (2), 123-33. [16] Banakar, U. V., Pharmaceutical Dissolution Testing. Marcel
Dekker: New York, NY, 1992. [17] Gohel, M. C.; Panchal, M. K., Novel use of similarity factors f2
and Sd for the development of diltiazem HCl modified-release tablets using a 3(2) factorial design. Drug Dev. Ind. Pharm., 2002,
28 (1), 77-87. [18] Shah, V. P.; Tsong, Y.; Sathe, P.; Liu, J. P., In vitro dissolution
profile comparison--statistics and analysis of the similarity factor, f2. Pharm. Res., 1998, 15 (6), 889-96.
[19] Gondaliya, D.; Kilambi, P., The fabrication and evaluation of the formulation variables of a controlled porosity osmotic drug
delivery system with diltiazem hydrochloride. Pharm. Tech., 2003, 58-64.
[20] Gohel, M. C.; Parikh, R. K.; Nagori, S. A.; Jena, D. G., Fabrication of modified release tablet formulation of metoprolol succinate
using hydroxypropyl methylcellulose and xanthan gum. AAPS Pharm. Sci. Tech., 2009, 10 (1), 62-8.
[21] Bariya, S. H.; Gohel, M. C., Formulation of once a day matrix tablet of Venlafaxine Hydrochloride using Polyethylene Oxide. J.
Pharm. Res., 2010, 3 (8), 1848-1852. [22] Sune-Negre, J. M.; Perez-Lozano, P.; Minarro, M.; Roig, M.;
Fuster, R.; Hernandez, C.; Ruhi, R.; Garcia-Montoya, E.; Tico, J. R., Application of the SeDeM Diagram and a new mathematical
equation in the design of direct compression tablet formulation. Eur. J. Pharm. Biopharm., 2008, 69 (3), 1029-1039.
[23] Traynor, M. J.; Brown, M. B.; Pannala, A.; Beck, P.; Martin, G. P., Influence of alcohol on the release of tramadol from 24-h
controlled-release formulations during in vitro dissolution experiments. Drug Dev. Ind. Pharm., 2008, 34 (8), 885-889.
[24] Jeon, I.; Gilli, T.; Betz, G., Evaluation of roll compaction as a preparation method for hydroxypropyl cellulose-based matrix
tablets. J. Pharm. Bioallied. Sci., 2011, 3 (2), 213-220. [25] Mazumder, B.; Dev, S.; Bhattacharya, S.; Sarkar, S.; Mohanta, B.,
Studies on formulation and characterization of cellulose-based microspheres of chlorpheniramine maleate. Arch. Pharm. Sci. Res.,
2009, 1 (1), 373-383. [26] Wang, J.; Somasundaran, P., Study of galactomannose interaction
with solids using AFM, IR and allied techniques. J. Colloid Interface Sci., 2007, 309 (2), 373-383.
Received: ???????????????? Revised: ???????????????? Accepted: ????????????????

Eurasian J Anal Chem 6(1): 91-96, 2011
Development and Validation of UV Spectrophotometric Method for Determination of Milnacipran in bulk and Pharmaceutical Dosage Form
Punit B. Parejiya*, Pragna K. Shelat, Rakshit C. Patel, Bhavesh S. Barot, Arun K. Shukla
K. B. Institute of Pharmaceutical Education and Research, Gandhinagar, India.-382023
Received: 13/11/2009; Accepted: 11/05/2010
Abstract
Milnacipran is an antidepressant drug belonging to the class of serotonin and noradrenaline reuptake inhibitors. A new, rapid, simple and sensitive spectrophotometric method has been developed for the determination of milnacipran in bulk and pharmaceutical formulations. The linearity was observed in the concentration range of 2-45 µg mL-1. The method is based on spectrophotometric determinaiton. Absorbance of milnacipran was determined at 220 nm wavelength. The method was validated in terms of accuracy and precision (intra and interday variations). This method is extended to pharmaceutical preparations. Results of the analysis were validated statistically and by recovery studies. The proposed method was found accurate, reproducible and economical for the routine analysis of milnacipran in bulk and pharmaceutical formulation.
Keywords:
Milnacipran; Spectrophotometric analysis; Validation
1. Introduction Milnacipran ((Z) -1- diethylaminocarbonyl -2- aminomethyl -1- phenyl - cyclopropane
hydrochloride, Ixel®, Toledomin®,Dalcipran®) is an antidepressant synthesized, developed and marketed by Pierre Fabre Medicament. The drug, which has no affinity for post-synaptic neurotransmitter receptors [1], was selected from a family of 1-aryl-2-aminomethyl cyclopropanecarboxylic acid derivatives [2] for its potent inhibition of both noradrenaline and serotonin reuptake [3,4]. In the treatment of major depression, milnacipran has achieved a similar efficacy to tricyclic antidepressants and a similar tolerability to selective serotonin reuptake inhibitors [5].
Several studies on humans and animals are necessary for the development of a new chemical entity in order to gather extensive knowledge on its pharmacokinetics and metabolism. Therefore, a robust and reliable bioanalytical method is of major importance to allow relevant comparison between studies. The availability of a low cost bioanalytical method, easy to transfer and to set up, represents an advantage in therapeutic drug monitoring when required (control of compliance, overdose) [6].
Milnacipran is not official in any pharmacopoeia. Literature review reveals, there is no report of UV-Visible spectrophotometric method for its estimation. Only few analytical techniques including high performance liquid chromatography (HPLC) with fluorescence
* Corresponding Author E-mail: [email protected] ISSN: 1306-3057, Moment Publication ©2011

Parejiya et. al.
92
detection in human plasma and few chiral HPLC methods are available [7,8]. Therefore, an attempt was made to develop a simple spectrophotometric method for the estimation of the present drug in bulk and pharmaceutical formulations.
Fig.1. Chemical Structure of Milnacipran
2. Experimental
2.1. Materials Pharmaceutical grade Milnacipran was obtained from Torrent Research Centre
(Gandhinagar, India). Distilled water was used in all stages. Two brands of capsules, MILBORN-25 (Sun Phrama. Ltd, Gujarat, India) and MILNACE 50 (Torrent Research Centre (Gujarat, India) were procured from the local market.
2.2. Apparatus Spectrophotometric analysis was performed on a Shimadzu UV-1800
spectrophotometer, with a 1.00 cm quartz cells. The instrument settings were optimized to produce a spectrum with about 80% full-scale deflection and acceptable noise level. Each spectrum was recorded in triplicate. For each replicate measurement the cell was refilled with fresh solution.
2.3. Methods
2.3.1. Preparation of Milnacipran standard solutions A stock solution containing 100 µg mL-1 of milnacipran was prepared by dissolving 10
mg of milnacipran in distilled water, then transferring into a 100 mL volumetric flask and diluted up to the mark with distilled water. All measurements were made at room temperature. The standard solutions were prepared by the proper dilutions of the stock standard solution with distilled water to reach concentration range of 2-45 µg mL-1. The determination was conducted in triplicate.
2.3.2. Preparation of sample solution A powder (55.10 mg) equivalent to 10 mg of drug was transferred to 100 mL
volumetric flask. The content was mixed with 50 mL of distilled water. The mixture was sonicated for 20 min. This solution was filtered through the whatman filter paper No.41 and the filtrate and washings were combined and diluted to the 100 mL with distilled water to get solution having milnacipran 100 µg mL-1.

Eurasian J Anal Chem 6(1): 91-96, 2011
93
2.3.3. Preparation of Calibration Curve The standard stock solution of milnacipran was scanned in the wavelength range of
200 nm to 400 nm against distilled water as a blank. A calibration curve was constructed over a concentration range 2-45 µg mL-1. Absorbance of each solution was measured at the wavelength of 220 nm. Calibration curve was constructed for milnacipran by plotting absorbance versus concentration at 220 nm wavelength. The determination was conducted in triplicate.
Fig. 2 (a): Calibration Curve of Milnacipran in Distilled water
Fig. 2 (b): Overlain Spectrum of Milnacipran in Distilled water (2-45 µg mL-1)
2.4. Validation of Method The method was validated with respect to linearity, accuracy, precision, limit of
detection (LOD) and limit of quantitation (LOQ). [9-11]

Parejiya et. al.
94
2.4.1. Linearity To establish linearity of the proposed method, ten separate series of solutions of
Milnacipran (2–45 µg mL-1 in distilled water) were prepared from the stock solutions and analyzed. Least square regression analysis was performed on the obtained data.
2.4.2. Accuracy The accuracy of the method is the closeness of the measured value to the true value for
the sample. To determine the accuracy of the proposed method, different levels of drug concentrations lower concentration (LC, 80%), intermediate concentration (IC, 100%) and higher concentration (HC, 120%) were prepared from independent stock solutions and analyzed (n = 10). Accuracy was assessed as the percentage relative error and mean % recovery (Table 1). To provide an additional support to the accuracy of the developed assay method, a standard addition method was employed, which involved the addition of different concentrations of pure drug (10, 20 and 30 µg mL-1) to a known preanalyzed formulation sample and the total concentration was determined using the proposed method (n = 10 ). The % recovery of the added pure drug was calculated as % recovery = [(Ct–Cs)/Ca] x 100, where Ct is the total drug concentration measured after standard addition; Cs, drug concentration in the formulation sample; Ca, drug concentration added to formulation (Table 1).
Table 1. Recovery studies of Milnacipran capsules (n=3)
Label Claim (mg) Amount added (%) Recovery (%) ± S.D %R.S.D
25 80 99.33 ± 0.0033 0.0032
100 99.96 ± 0.0081 0.0080
120 100.14. ± 0.0068 0.0068
2.4.3. Precision Repeatability was determined by using different levels of drug concentrations (same
concentration levels taken in accuracy study), prepared from independent stock solutions and analyzed (n=10) (Table 2). Inter-day and intra-day variations were studied to determine intermediate precision of the proposed analytical method. Different levels of drug concentrations in triplicates were prepared three different times in a day and studied for intra-day variation. The same procedure was followed for three different days to study inter-day variation (n = 10). The percent relative standard deviation (% R.S.D.) of the predicted concentrations from the regression equation was taken as precision (Table 2). Precision studies were also carried out using the real samples of Milnacipran capsule in a similar way to standard solution to prove the usefulness of the method.
2.4.4. Limit of Detection (LOD) and Limit of Quantitation (LOQ) LOD (k=3.3) and LOQ (k=10) of the method was established according to ICH
definitions (C1=k*So/S, where C1 is LOD or LOQ, So is the mean standard deviation of
blank determination, S is the slope of standard curve and k is the constant related to confidence interval). LOD and LOQ of method are reported in Table 2.
3. Results and Discussion The development of spectrophotometry methods for the determination of drugs has
increased considerable in recent years because of their importance in pharmaceutical analysis.

Eurasian J Anal Chem 6(1): 91-96, 2011
95
Based on the experimental data the standard calibration curve was plotted (Fig.2 (a)). The absorbance range was found to be 0.107-1.879 (Fig. 2(b)). The content of drug was calculated from the equation y = 0.041x + 0.028. These solutions obeyed Beer-Lambert’s law in concentration range of 2-45 µg mL-1 with R2 value of 0.999. The assays were validated by means of ANOVA (Analysis of variance), as described in official literature [12]. This developed method presented no parallelism deviation and no linearity deviation (P < 0.05). The reproducibility of the proposed method was determined by performing capsule assay at different time intervals on same day (Intra-day assay precision) and on three different days (Inter-day precision). Result of intra-day and inter-day precision is expressed in % RSD. Percent RSD for Intraday assay precision was found to be 0.0504. Inter-day assay precision was found to be 0.0905. According to the equation, the LOD and LOQ were found to be 0.27 and 0.82 μg/mL, respectively. This data shows that this method is sensitive for the determination of milnacipran. To ascertain the accuracy of proposed methods, recovery studies were carried out by standard addition method at three different levels (80%, 100% and 120%). Percent recovery for milnacipran, by the proposed method was found in the range of 99.33 % to 100.14 %. Repeatability is based on the results of the method operating over short time interval under same conditions. The low RSD values of intra-day precision (Table 2), recovery (Table 1), and pharmaceutical preparations (Table 3) showed high repeatability.
Table.2. Optical characteristics of Milnacipran
Parameters Values
λmax, nm 220
Beer’s law limit, µg mL-1 2-45 Molar absorptivity, L/mol×cm 2.049 ×10⁴
Regression equation y = 0.041x + 0.028 Slope ± S.D 0.041 ± 0.00014
Intercept ± S.D 0.028 ± 0.0027 Correlation coefficient (r2) 0.999
Limit of Detection (LOD), µg mL-1 0.27 Limit of Quantitation (LOQ), µg mL-1 0.82
Intra day precision (% R.S.D) 0.0504 Inter day precision (% R.S.D) 0.0905
Table 3. Analysis of Milnacipran capsules
Brand name Label claim (mg) % Assay ± S.D %R.S.D
MILBORN-25 25 99.76 ± 0.0087 0.0087
MILNACE-50 50 99.54 ± 0.0079 0.0080
4. Conclusion UV spectrophotometric method developed for milnacipran hydrochloride is simple,
accurate, sensitive, rapid and economic and it can be conveniently employed for the routine analysis and the quality control of milnacipran hydrochloride in pharmaceutical dosage forms.

Parejiya et. al.
96
The method was suitable to determine concentrations in the range 2-45 µg mL-1.The limits of detection and quantitation for milnacipran hydrochloride with a lower concentration were 0.27 and 0.82 µg mL-1 respectively, which are under the lowest expected concentrations in the sample. The sample recovery from the formulation was in good agreement with its respective label claim.
Acknowledgement The authors are thankful to Torrent Research Center, Gujarat, India for providing the
Milnacipran reference standard.
References 1. Assie M B, Charveron M, Palmier C, Puozzo C, Moret C and Briley M (1992)
Effects of prolonged administration of milnacipran, a new antidepressant, on receptors and monoamine uptake in the brain of the rat. Neuropharmacology 31(2):149-55
2. Bonnaud B, Cousse H, Mouzon G, Briley M, Stenger A, Fauran F and Couzinier JP (1987) 1-Aryl-2-(aminomethyl) cyclopropanecarboxylic acid derivatives. A new series of potential antidepressants. J Med Chem 30: 318-325.
3. Stenger A, Couzinier J P and Briley M (1987) Psychopharmacology of milnacipran, 1-phenyl-1-diethyl-amino-carbonyl-2-aminomethylcyclopropane hydrochloride (F2207), a new potential antidepressant. Psychopharmacology 91: 147-153.
4. Palmier C, Puozzo C, Lenehan T and Briley M. (1989) Monoamine uptake inhibition by plasma from healthy volunteers after single oral doses of the antidepressant milnacipran. Eur J Clin Pharmacol 37: 235-238
5. Puech A, Montgomery S A, Prost J F, Solles A and Briley M (1997) Milnacipran, a new serotonin and noradrenaline reuptake inhibitor: an overview of its antidepressant activity and clinical tolerability. Int Clin Psychopharmacol 12: 99-108.
6. Christian P, Christian F and Gregoire Z (2004) Determination of milnacipran, a serotonin and noradrenaline reuptake inhibitor, in human plasma using liquid chromatography with spectrofluorimetric detection. J Chromatogr 806: 221–228.
7. Angela P, Sonia P and Claudia S (2007) Chiral HPLC analysis of milnacipran and its FMOC-derivative on cellulose-based stationary phases. Chirality 20: 63 – 68.
8. Marie Lecoeur L, Raphael D, Jean Paul R and Philippe M (2008) Chiral analysis of milnacipran by a nonchiral HPLC - circular dichroism: Improvement of the linearity of dichroic response by temperature control. J Separ Sci 31: 3009 – 3014.
9. The United States Pharmacopeia (2005) The National Formulary 28, US Pharmacopeial Convention Inc., Rockville, MD,USA: 2748-2751
10. ICH-Q2R1 Validation of Analytical Procedures: Methodology International Conference on Harmonization of Technical Requirements for Registration of Pharmaceuticals for Human Use, Geneva, Switzerland (1996).
11. Cazes J. Update Supplement Encyclopedia of Chromatography (2004) Validation of HPLC Instrumentation.339
12. Armbruster D A, Tillman M D and Hubbs L M (1994) Comparison of the empirical and the statistical methods exemplified with GC-MS assays of abused drugs. Clin Chem 40: 1233-1238

For Peer Review O
nly
Quantitative Determination of Milnacipran HCl in Rabbit
Plasma by HPLC and its Application to Pharmacokinetic Study
Journal: Journal of Liquid Chromatography & Related Technologies
Manuscript ID: LJLC-2012-0377
Manuscript Type: Original Article
Date Submitted by the Author: 10-Jul-2012
Complete List of Authors: Parejiya, Punit; K. B. Institute of Pharmaceutical Education and Research,
Movaliya, Vinit; K. B. Institute of Pharmaceutical Education and Research, Barot, Bhavesh; K. B. Institute of Pharmaceutical Education and Research, Modi, Darshana; K. B. Institute of Pharmaceutical Education and Research, Shelat, Pragna; K. B. Institute of Pharmaceutical Education and Research, Shukla, Arun; K. B. Institute of Pharmaceutical Education and Research,
Keywords: HPLC, Rabbit plasma, Pharmacokinetics study
URL: http://mc.manuscriptcentral.com/ljlc Email: [email protected]
Journal of Liquid Chromatography & Related Technologies

For Peer Review O
nly
Table.1: Mean recovery of Milnacipran HCl in developed method using various solvents at three
concentrations
Method of
sample
preparation
Solvent
Mean amount
recovered (µg) (n=6)
Mean (± SD) % of recovery
(n=6)
Liquid-liquid
extraction
Methanol 2.951 29.51±2.57
Acetonitrile 3.624 36.24±1.94
Protein
precipitation
Pentane 2.759 27.59±0.98
Haptane 2.564 25.64±1.19
Diethyl ether 4.351 43.51±1.04
n-Hexane 4.065 40.65±1.82
Ethyl acetate 4.651 46.51±1.54
Chloroform 7.841 78.41±1.66
Page 1 of 27
URL: http://mc.manuscriptcentral.com/ljlc Email: [email protected]
Journal of Liquid Chromatography & Related Technologies
123456789101112131415161718192021222324252627282930313233343536373839404142434445464748495051525354555657585960

For Peer Review O
nly
Table. 2. Precision and accuracy of method for the estimation of Milnacipran HCl in rabbit
plasma
Concentration
(µg/mL)
Intra-day precision Inter-day precision
Mean
(µg/mL)
RSD
(%)
Accuracy
(%)
Mean
(µg/mL)
RSD
(%)
Accuracy
(%)
0.5 0.497 3.91 99.40 0.498 5.2 99.6
5 4.92 5.71 98.40 5.06 6.8 101.2
20 19.63 7.30 98.15 19.75 10.8 98.75
Page 2 of 27
URL: http://mc.manuscriptcentral.com/ljlc Email: [email protected]
Journal of Liquid Chromatography & Related Technologies
123456789101112131415161718192021222324252627282930313233343536373839404142434445464748495051525354555657585960

For Peer Review O
nly
Table. 3. Stability of Milnacipran HCl in rabbit plasma
Stability (n=6)
Concentration (µg/mL) of Milnacipran HCl in quality control samples
0.5 5 20
Freeze thaw stability
Initial (mean, (ng/mL)) 0.497 4.98 19.92
Final (mean, (ng/mL)) 0.493 5.09 20.14
Deviation (%) -0.811 2.161 1.092
RSD (%) 7.8 8.4 10.7
Accuracy (%) 99.20 102.21 101.10
24 h stability
Initial (mean, (ng/mL)) 0.499 5.04 20.11
Final (mean, (ng/mL)) 0.497 4.97 20.02
Deviation (%) -0.402 -1.408 -0.449
RSD (%) 5.7 9.2 8.7
Accuracy (%) 99.60 98.61 99.55
1 month stability
Initial (mean, (ng/mL)) 0.506 5.06 19.94
Final (mean, (ng/mL)) 0.493 4.94 20.08
Deviation (%) -2.643 -2.431 0.701
RSD (%) 5.7 9.2 8.7
Accuracy (%) 97.43 97.62 100.70
Page 3 of 27
URL: http://mc.manuscriptcentral.com/ljlc Email: [email protected]
Journal of Liquid Chromatography & Related Technologies
123456789101112131415161718192021222324252627282930313233343536373839404142434445464748495051525354555657585960

For Peer Review O
nly
Table.4. Pharmacokinetic parameters of Milnacipran HCl after a single oral dose of 0.07 mg
(n=3, Mean±SD)
Pharmacokinetic parameters Observed value
Maximum plasma concentration, Cmax (ng/mL) 176.24
Time required to reach maximum plasma concentration, Tmax (h) 2
Area under curve at 24h, AUC(0-∞) (ng h/mL) 902.717
Area under momentum curve at 24 h, AUMC (0-∞) (ng h2/mL) 2991.87
Plasma half life (T1/2) (h) 3.69
Absorption rate constant, Ka (h-1
) 1.73
Elimination rate constant, Kel (h-1
) 0.19
Mean residence time, MRT (h) 4.06
Clearance, Cl (L/h) 55.39
Page 4 of 27
URL: http://mc.manuscriptcentral.com/ljlc Email: [email protected]
Journal of Liquid Chromatography & Related Technologies
123456789101112131415161718192021222324252627282930313233343536373839404142434445464748495051525354555657585960

For Peer Review O
nly
Page 5 of 27
URL: http://mc.manuscriptcentral.com/ljlc Email: [email protected]
Journal of Liquid Chromatography & Related Technologies
123456789101112131415161718192021222324252627282930313233343536373839404142434445464748495051525354555657585960

For Peer Review O
nly
Figure Captions:
Figure.1: Chemical structure of Milnacipran HCl
Figure.2.(a): Chromatograph of Milnacipran HCl in Plasma: (a) Blank Plasma
Figure.2. (b): Chromatograph of Milnacipran HCl in Plasma: Plasma spiked with 10 (µg/mL)
Milnacipran HCl and 0.1 (µg/mL) Venlafaxine HCl (internal standard)
Figure.3: Calibration curve for Milnacipran HCl in plasma (n=6)
Figure.4: Representative Milnacipran HCl Pharmacokinetic profile as obtained after a single 0.07
mg oral dose in rabbits
Page 6 of 27
URL: http://mc.manuscriptcentral.com/ljlc Email: [email protected]
Journal of Liquid Chromatography & Related Technologies
123456789101112131415161718192021222324252627282930313233343536373839404142434445464748495051525354555657585960

For Peer Review O
nly
Figure.1
Page 7 of 27
URL: http://mc.manuscriptcentral.com/ljlc Email: [email protected]
Journal of Liquid Chromatography & Related Technologies
123456789101112131415161718192021222324252627282930313233343536373839404142434445464748495051525354555657585960

For Peer Review O
nly
Figure.2.(a)
Page 8 of 27
URL: http://mc.manuscriptcentral.com/ljlc Email: [email protected]
Journal of Liquid Chromatography & Related Technologies
123456789101112131415161718192021222324252627282930313233343536373839404142434445464748495051525354555657585960
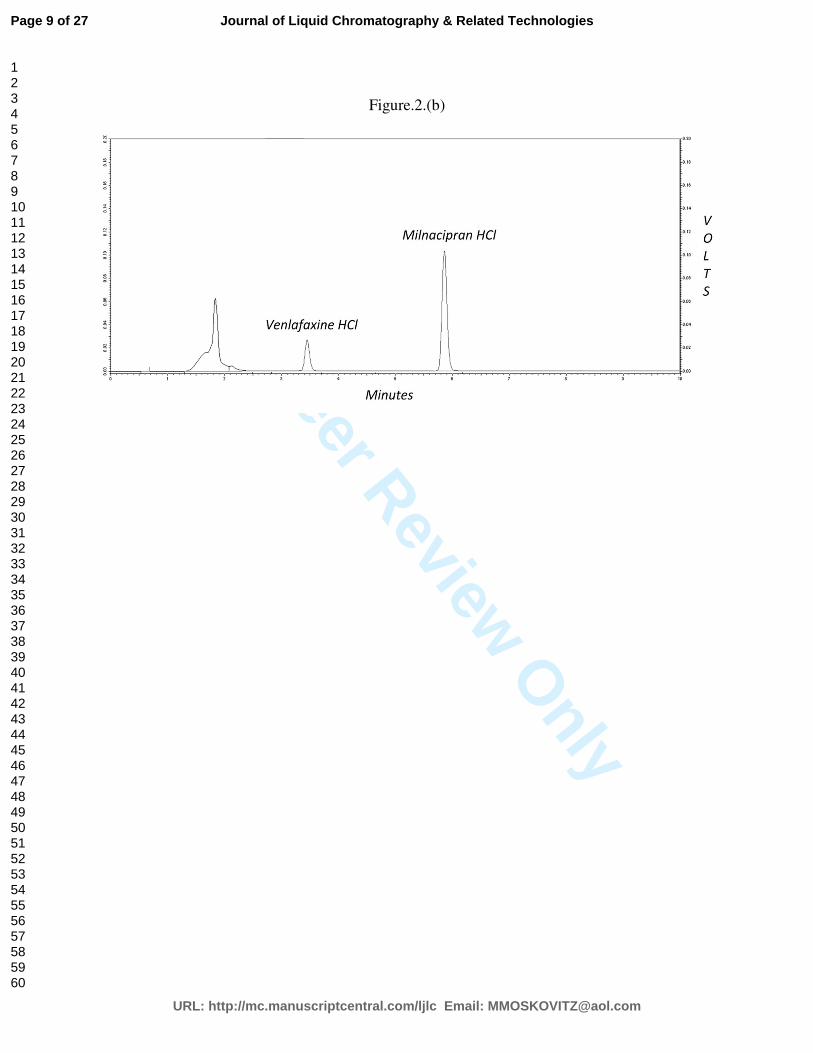
For Peer Review O
nly
Figure.2.(b)
Page 9 of 27
URL: http://mc.manuscriptcentral.com/ljlc Email: [email protected]
Journal of Liquid Chromatography & Related Technologies
123456789101112131415161718192021222324252627282930313233343536373839404142434445464748495051525354555657585960

For Peer Review O
nly
Figure.3
Page 10 of 27
URL: http://mc.manuscriptcentral.com/ljlc Email: [email protected]
Journal of Liquid Chromatography & Related Technologies
123456789101112131415161718192021222324252627282930313233343536373839404142434445464748495051525354555657585960

For Peer Review O
nly
Figure.4
Page 11 of 27
URL: http://mc.manuscriptcentral.com/ljlc Email: [email protected]
Journal of Liquid Chromatography & Related Technologies
123456789101112131415161718192021222324252627282930313233343536373839404142434445464748495051525354555657585960

For Peer Review O
nly
1
Quantitative Determination of Milnacipran HCl in Rabbit Plasma by HPLC and its
Application to Pharmacokinetics Study
Punit B. Parejiya*, Vinit R. Movaliya, Bhavesh S. Barot, Darshana Modi, Pragna K. Shelat,
Arun K. Shukla
K. B. Institute of Pharmaceutical Education and Research, Kadi Sarvavishwavidyalaya,
Gandhinagar, India-382023
* Corresponding Author:
Mr. Punit Parejiya
K. B. Institute of Pharmaceutical Education and Research
Sector-23, GH-6,
Gandhinagar, Gujarat-382023
India.
Email: [email protected]
Running Head: Determination of Milnacipran HCl in Rabbit Plasma by HPLC
Page 12 of 27
URL: http://mc.manuscriptcentral.com/ljlc Email: [email protected]
Journal of Liquid Chromatography & Related Technologies
123456789101112131415161718192021222324252627282930313233343536373839404142434445464748495051525354555657585960

For Peer Review O
nly
2
ABSTRACT
A simple, sensitive and specific reverse phase high performance liquid chromatography (RP-
HPLC) method was developed and validated for the quantification of Milnacipran HCl in rabbit
plasma. Milnacipran HCl and internal standard (IS, Venlafaxine) were extracted by protein
precipitation method with chloroform. The separation was performed on HiQ sil C18 column (250
mm x 4.6 mm i.d., 5 µm). The wavelength was set at 220 nm. The mobile phase was a mixture of
potassium dihydrogen phosphate buffer (0.0125 M) and acetonitrile (72:28 %v/v) with 0.20 %
triethylamine at a flow rate of 1.0 mL/min. The pH of the solution was adjusted to 3.65 with 0.1
M orthophosphoric acid. The calibration curve was linear over the concentration range 0.1–25
µg/mL. The intraday and interday precision was ranged from 3.9 to 7.3 % and 5.2 to 10.8%
respectively. Finally, this proposed method was successfully applied to rabbit pharmacokinetics
study and yielded the most comprehensive data on systemic exposure of Milnacipran HCl to
date.
KEYWORDS: Milnacipran HCl, RP-HPLC, Rabbit Plasma, Pharmacokinetics study
Page 13 of 27
URL: http://mc.manuscriptcentral.com/ljlc Email: [email protected]
Journal of Liquid Chromatography & Related Technologies
123456789101112131415161718192021222324252627282930313233343536373839404142434445464748495051525354555657585960

For Peer Review O
nly
3
INTRODUCTION
Milnacipran HCL (MH) is a selective serotonin reuptake inhibitor (SSRI) and noradrenaline
reuptake inhibitor (SNRI) with a (1R, 2S)-2-(aminomethyl)-N, N diethyl- 1-phenylcyclopropane-
1-carboxamide structure (figure 1). It is known as selective serotonin and norepinephrine dual
reuptake inhibitors and used as antidepressant.[1]
Milnacirpan HCl is also used for the treatment
of chronic pains such as fibromyalgia.[2-3]
Following oral administration, it is rapidly absorbed
with 85% bioavailability. It binds to plasma proteins as 13%.[4-5]
It was reported that therapeutic
plasma concentration of Milnacirpan HCl is changed 100– 300 ng mL-1
. [6]
There are reports
where efficacy, acceptability and tolerability of Milnacirpan HCl were investigated alone or
comparative with other antidepressant drugs such as tricyclic antidepressants (TCAs) or other
selective serotonin reuptake inhibitors (SSRIs).[7-9]
In respect to safety, it has been clearly shown
that Milnacirpan HCl is superior to TCAs and is better tolerated than SSRIs. [5]
Safe and effective
treatment of psychiatric patients depends on monitoring plasma drug concentration.
Several studies on humans and animals are necessary for the development of a new chemical
entity in order to gather extensive knowledge on its pharmacokinetics and metabolism.
Therefore, a robust and reliable bioanalytical method is of major importance to allow relevant
comparison between studies. The availability of a low cost bioanalytical method, easy to transfer
and to set up, represents an advantage in therapeutic drug monitoring when required (control of
compliance, overdose).[10]
Various bioanalytical methods, including gas chromatography and liquid chromatography have
been developed for the determination of Milnacirpan HCl in biological fluids.[6, 10-13]
Ebru
Ucakturk and Cihat Safak have developed a validated GC-MS method for analysis of
Page 14 of 27
URL: http://mc.manuscriptcentral.com/ljlc Email: [email protected]
Journal of Liquid Chromatography & Related Technologies
123456789101112131415161718192021222324252627282930313233343536373839404142434445464748495051525354555657585960

For Peer Review O
nly
4
Milnacirpan HCl in human plasma where Milnacirpan HCl was derivatizated using silylating
agent prior to GC–MS analysis.[14]
However in GC method the thermal instability of the drugs
under GC conditions represents a serious problem and this fact was proven by Christian Puozzo
et al in their study and found lactam cyclization of the molecule due to thermal instability of the
compound. Further they have successfully developed and validated a liquid chromatography
(LC) method with spectrofluorimetric detection for bioanalysis of Milnacirpan HCl. This method
was based on a derivatization reaction between Milnacipran and fluorescamine. A micellar
electrokinetic capillary chromatographic method was developed for separation and determination
of antidepressants and their metabolites in biological fluids[15]
and LC enantioseparation of
Milnacipran HCl was investigated on different cellulose-based chiral stationary phases.[16]
However, these methods are not available for most laboratories because of their specially
requirement and financial reasons. Moreover, these methods are tedious and complex due
involvement of derivatization and other complex reactions.
So, in this study, a simple RP-HPLC method with a simple protein precipitation procedure for
the determination of Milnacipran HCl in rabbit plasma was developed and was successfully
applied to the pharmacokinetics study of Milnacipran HCl in rabbits.
2. EXPERIMENTAL
2.1 Materials
Milnacipran HCl and internal standard (IS, Venlafaxine HCl) were received as gift samples from
Torrent research Center (Gandhinagar, India) and Amneal Pharmaceutical (Ahmedabad, India)
respectively. Methanol, acetone, chloroform, ethyl acetate and diethyl ether of HPLC grade were
purchased from Fisher scientific (Mumbai, India). Pentane, heptane and n-hexane of HPLC
grade were procured from Finar chemicals (Ahmedabad, India). Potassium dihydrogen
Page 15 of 27
URL: http://mc.manuscriptcentral.com/ljlc Email: [email protected]
Journal of Liquid Chromatography & Related Technologies
123456789101112131415161718192021222324252627282930313233343536373839404142434445464748495051525354555657585960

For Peer Review O
nly
5
phoshphate and orthophoshphori acid of HPLC grade were purchased from Sulabh laboratory
(Baroda, India). Water was obtained by double distillation and purified additionally with
Ultrapure Milli- Q system (Millipore Corp., Billerica, MA).
2.2 Animals
Male white New Zealand rabbits were obtained from the Animal Vaccine Institute, Gandhinagar,
India. The rabbits, each weighing around 1.5–2.5 kg, were individually housed with free access
to food and water. The protocol was approved by the Institutional Ethical Committee of K. B.
Institute of Pharmaceutical Education and Research, Gandhinagar, India. The experiments were
conducted as per CPCSEA (Committee for Prevention, Control and Supervision of Experimental
Animals) guidelines.
2.2. Instrumentation and chromatographic conditions
The HPLC system (LC-2010C HT), equipped with system controller (SCL-10AVP), on-line
degasser (DGU-14A), low-pressure gradient flow control valve (FCV-10ALVP), solvent delivery
module (LC-10ADVP), autoinjector (SIL-10 ADVP), column oven (CTO-10AVP),UV/Vis detector
(SPD-10AVP), and CLASS–VP software Version 6.14 SP1 (Shimadzu, Kyoto, Japan). The
chromatographic separations were achieved on HiQ sil C18 column (250 mm x 4.6 mm i.d., 5
µm). The mobile phase was prepared by mixing 720 mL of phoshphate buffer and 280 mL of
acetonitrile. The phosphate buffer was prepared by weighing 1.70 g of potassium dihydrogen
phosphate and dissolving in 1000 mL of water (0.0125 M), to this 0.20 % of triethylamine was
added. The pH of the solution was adjusted to 3.65 with 0.1 M orthophosphoric acid. The mobile
phase was filtered through a 0.45 µ filter (Millipore) and degassed by an ultrasonic bath
(Frontline Electronics, Ahmedabad, India). The eluents were monitored using UV detection at
Page 16 of 27
URL: http://mc.manuscriptcentral.com/ljlc Email: [email protected]
Journal of Liquid Chromatography & Related Technologies
123456789101112131415161718192021222324252627282930313233343536373839404142434445464748495051525354555657585960
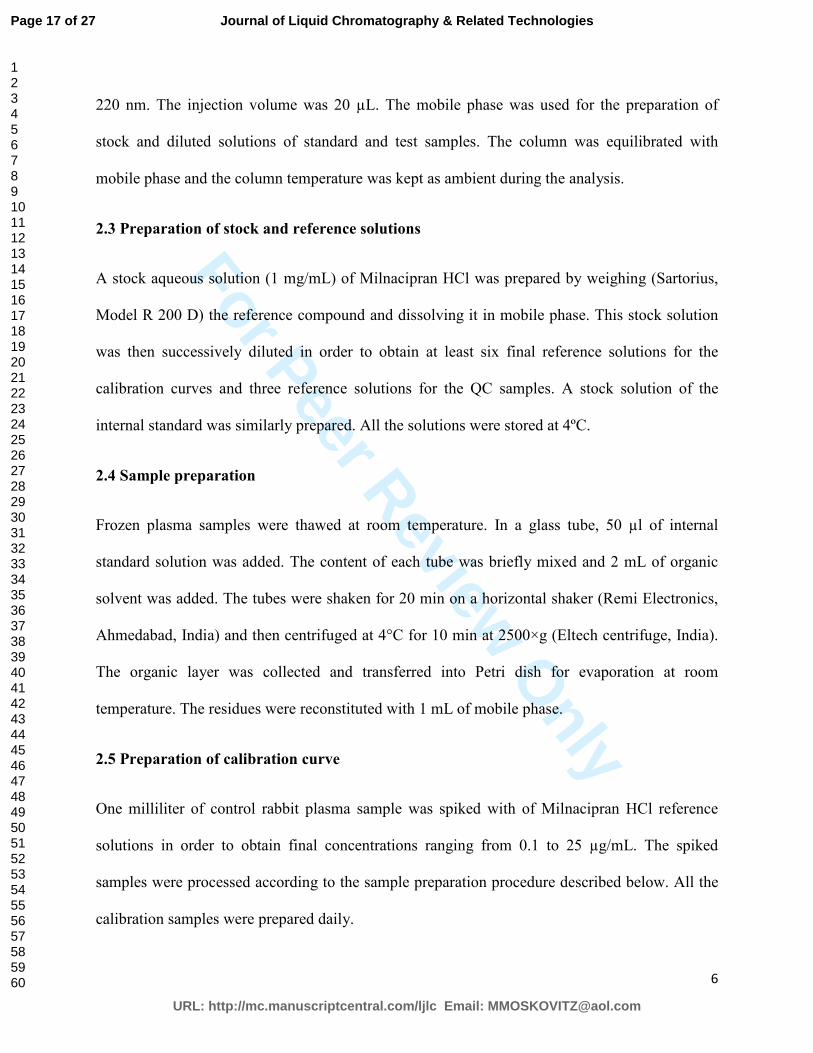
For Peer Review O
nly
6
220 nm. The injection volume was 20 µL. The mobile phase was used for the preparation of
stock and diluted solutions of standard and test samples. The column was equilibrated with
mobile phase and the column temperature was kept as ambient during the analysis.
2.3 Preparation of stock and reference solutions
A stock aqueous solution (1 mg/mL) of Milnacipran HCl was prepared by weighing (Sartorius,
Model R 200 D) the reference compound and dissolving it in mobile phase. This stock solution
was then successively diluted in order to obtain at least six final reference solutions for the
calibration curves and three reference solutions for the QC samples. A stock solution of the
internal standard was similarly prepared. All the solutions were stored at 4ºC.
2.4 Sample preparation
Frozen plasma samples were thawed at room temperature. In a glass tube, 50 µl of internal
standard solution was added. The content of each tube was briefly mixed and 2 mL of organic
solvent was added. The tubes were shaken for 20 min on a horizontal shaker (Remi Electronics,
Ahmedabad, India) and then centrifuged at 4°C for 10 min at 2500×g (Eltech centrifuge, India).
The organic layer was collected and transferred into Petri dish for evaporation at room
temperature. The residues were reconstituted with 1 mL of mobile phase.
2.5 Preparation of calibration curve
One milliliter of control rabbit plasma sample was spiked with of Milnacipran HCl reference
solutions in order to obtain final concentrations ranging from 0.1 to 25 µg/mL. The spiked
samples were processed according to the sample preparation procedure described below. All the
calibration samples were prepared daily.
Page 17 of 27
URL: http://mc.manuscriptcentral.com/ljlc Email: [email protected]
Journal of Liquid Chromatography & Related Technologies
123456789101112131415161718192021222324252627282930313233343536373839404142434445464748495051525354555657585960

For Peer Review O
nly
7
2.6 Preparation of QC samples
One milliliter of control rabbit plasma was spiked with Milnacipran HCl (reference solutions) in
order to achieve the three final concentrations of 0.5, 5 and 20 µg/mL. The QC samples were
processed according to the preparation procedure described below. Batches of QC samples were
prepared at regular intervals and stored at 4ºC until use.
2.7. Validation of methods
The validation of an analytical method confirms the characteristics of the method to satisfy the
requirements of the application. The method was validated following ICH guidelines for
specificity, linearity, accuracy and precision, recovery and stability. Under the validation study
the following parameters were studied.
2.7.1. Specificity
The specificity criterion demonstrates that the results of the method are not affected by the
presence of interference, i.e. whether the compound of interest elutes without interfering with
other compounds and components of plasma. The specificity of the method was determined by
comparing the chromatograms obtained from the aqueous samples of Milnacipran HCl and IS
with those obtained from blank plasma.
2.7.2 Linearity
Quantitative analytical results are highly influenced by the quality of the calibration curve. Six
different concentrations of Milnacipran HCl with fixed concentration of IS in blank plasma were
processed and calibration curve was constructed in the specific concentration range. The
Page 18 of 27
URL: http://mc.manuscriptcentral.com/ljlc Email: [email protected]
Journal of Liquid Chromatography & Related Technologies
123456789101112131415161718192021222324252627282930313233343536373839404142434445464748495051525354555657585960

For Peer Review O
nly
8
calibration curve was plotted between the ratio peak area of Milnacipran HCl and concentration
of Milnacipran HCl.
2.7.3. Accuracy and precision
Both repeatability (within a day precision) and reproducibility (between days precision) were
determined. Three quality control samples were subjected for the study. Five injections of each
of the specified quality control samples at three levels were injected for analysis within the same
day for repeatability, and over a period of 5 days for reproducibility. Mean and relative standard
deviations were calculated and used to predict the accuracy and precision of the method.
2.7.4. Recovery
Recovery of Milnacipran HCl was calculated by comparing the peak area obtained from spiked
biological samples (Six replicates of QC samples: 0.5, 5 and 20 µg/mL) with those from similar
concentration directly injected in aqueous solutions.
2.7.5. Stability
The quality control standards containing 0.5, 5 and 20 µg/mL of Milnacipran HCl were
subjected for detection of stability of the drug in plasma. One set of six samples each was kept in
polypropylene tube and subjected to freeze-thaw cycles each at -20°C and for 24 h. The second
set of six samples each was kept at room temperature for 24 h and the third set of six samples
each was kept at room temperature for 1 month. All the samples were analyzed by standard
chromatographic conditions to determine their peak areas. Samples were considered to be stable
when the final assay values of samples were found similar to that of the initial assay value of the
drug.
Page 19 of 27
URL: http://mc.manuscriptcentral.com/ljlc Email: [email protected]
Journal of Liquid Chromatography & Related Technologies
123456789101112131415161718192021222324252627282930313233343536373839404142434445464748495051525354555657585960

For Peer Review O
nly
9
2.8 Pharmacokinetics study in rabbits
The method described above was applied to quantify the plasma concentration of Milnacipran
HCl. A single-dose pharmacokinetics study was conducted on three white male New Zealand
rabbits. After a single oral administration of 0.07 mg of Milnacipran HCl, 1.5 mL of blood
samples were collected from the marginal ear vein at 0, 0.5, 1, 1.5, 1.66, 1.83, 2, 2.33, 3, 4, 6, 8
and 10 h time points into heparinized collection tubes. The blood was immediately centrifuged at
12,000 rpm for 10 min and stored at -20°C until analysis. The supernatant plasma layer was
separated and stored at -20°C until analyzed. The plasma samples were analyzed for Milnacipran
HCl concentrations as described above. The total area under the observed plasma concentration–
time curve (AUC) was calculated using the linear trapezoidal rule. The first order elimination
rate constant (Kel) was estimated by the least square regression of the points describing the
terminal log–linear decaying phase. Half life was derived from Kel (T1/2 = ln 2/Kel). The
absorption rate constant (Ka) was determined by residual method. The maximum observed
Milnacipran HCl concentration (Cmax) and the time at which Cmax was observed (Tmax) were
reported directly from the profile.
Result and Discussion
3.1. Optimization of chromatographic conditions
The reliability of analytical findings is a matter of great importance in forensic and clinical
toxicology, as it is of course a prerequisite for correct interpretation of pharmacokinetics and
toxicological findings. HPLC analysis of biological samples, such as plasma, requires sample
preparation or clean-up prior to injecting into the HPLC system.
Page 20 of 27
URL: http://mc.manuscriptcentral.com/ljlc Email: [email protected]
Journal of Liquid Chromatography & Related Technologies
123456789101112131415161718192021222324252627282930313233343536373839404142434445464748495051525354555657585960

For Peer Review O
nly
10
The mobile phase in developed RP-HPLC method was optimized and selected by taking
different proportions of aqueous and organic phases which resulted acceptable asymmetry and
theoretical plates. Numbers of mobile phase were tried but phosphate buffer: acetonitrile (72: 28
% v/v) was found to be satisfactory. The presence of two amino groups in the chemical structure
of Milnacipran HCl seems to have tailing peak which was avoided by adding 0.20 % v/v of
triethyleamine. Judicious optimization of pH of the mobile phase at 3.65 found mandatory to
have symmetric and sharp peak as ionization of the drug was found at this pH due to basicity of
drug. The acetonitrile content in the mobile phase was found to be critical in separating
Milnacipran HCl from endogenous compounds, with the best resolution being achieved at a
concentration of 28% (v/v). When the acetonitrile content was increased from 28 % (v/v), the
elution time of the Milnacipran HCl peak was correspondingly reduced and the peak was not
well separated from an adjacent peak. The HPLC system was equilibrated with the initial mobile
phase composition, followed by 10 injections of the same standard. These 10 consecutive
injections were used to evaluate the system suitability on each day of method validation. All
parameters were satisfactory with good specificity for the stability assessment of Milnacipran
HCl.
3.2 Selectivity and specificity
Chromatograms obtained with blank plasma and plasma spiked with Milnacipran HCl are shown
in figure 2.(a) and figure 2.(b) respectively. It can be seen that the Milnacipran HCl peak, with a
retention time of 5.85 min, was well resolved and free of interference from endogenous
compounds in the plasma. The retention time for internal standard Venlafaxine HCl was 3.45
min which was clearly separate than peak of Milnacipran HCl. In addition, the total run time for
each injection /sample was only 10 min.
Page 21 of 27
URL: http://mc.manuscriptcentral.com/ljlc Email: [email protected]
Journal of Liquid Chromatography & Related Technologies
123456789101112131415161718192021222324252627282930313233343536373839404142434445464748495051525354555657585960

For Peer Review O
nly
11
3.3. Selection of extraction solvents and recovery
The solvent which was capable of extracting maximum amount of drug from plasma sample was
selected for processing of the samples. For extraction of Milnacipran HCl from plasma, liquid–
liquid extraction and protein precipitation techniques were tried using different organic solvents.
Initially liquid-liquid extraction was employed to recover Milnacipran HCl from drug spiked
plasma. Acetonitrile and methanol were used to extract the drug from plasma. As Milnacipran
HCl is freely soluble in water, it was observed that extraction yields were very low in both
solvents. The mean extraction recoveries (mean ± SD) of Milnacipran HCl in acetonitrile and
methanol were found to be 36.24±1.94 and 29.51±2.57 respectively. Owing to poor extraction
through liquid-liquid extraction method, further protein precipitation method was used
employing various organic solvents. The percentage recoveries of Milnacipran HCl in various
organic solvent are depicted in Table 1. Highest recovery of drug was found in chloroform
(78.41±1.66) as Milnacipran HCl is freely soluble in chloroform. The order of recovery was
found to be pentane< haptane<diethyl ether<n-hexane< ethyl acetate<chloroform (Table.1). As
chloroform is non polar in nature and it may damage to column, at the end of extraction step the
chloroform was evaporated and the residues were further reconstituted in mobile phase.
3.4. Linearity range
A calibration curve was plotted between peak area of Milnacipran HCl versus Milnacipran HCl
concentration in plasma, which is presented in figure 3. The chromatographic responses were
found to be linear over an analytical range of 0.1-25 µg/mL with regression coefficient value of
0.998. The regression equation of the calibration curve is y = 93542x + 3735. A detection limit
Page 22 of 27
URL: http://mc.manuscriptcentral.com/ljlc Email: [email protected]
Journal of Liquid Chromatography & Related Technologies
123456789101112131415161718192021222324252627282930313233343536373839404142434445464748495051525354555657585960
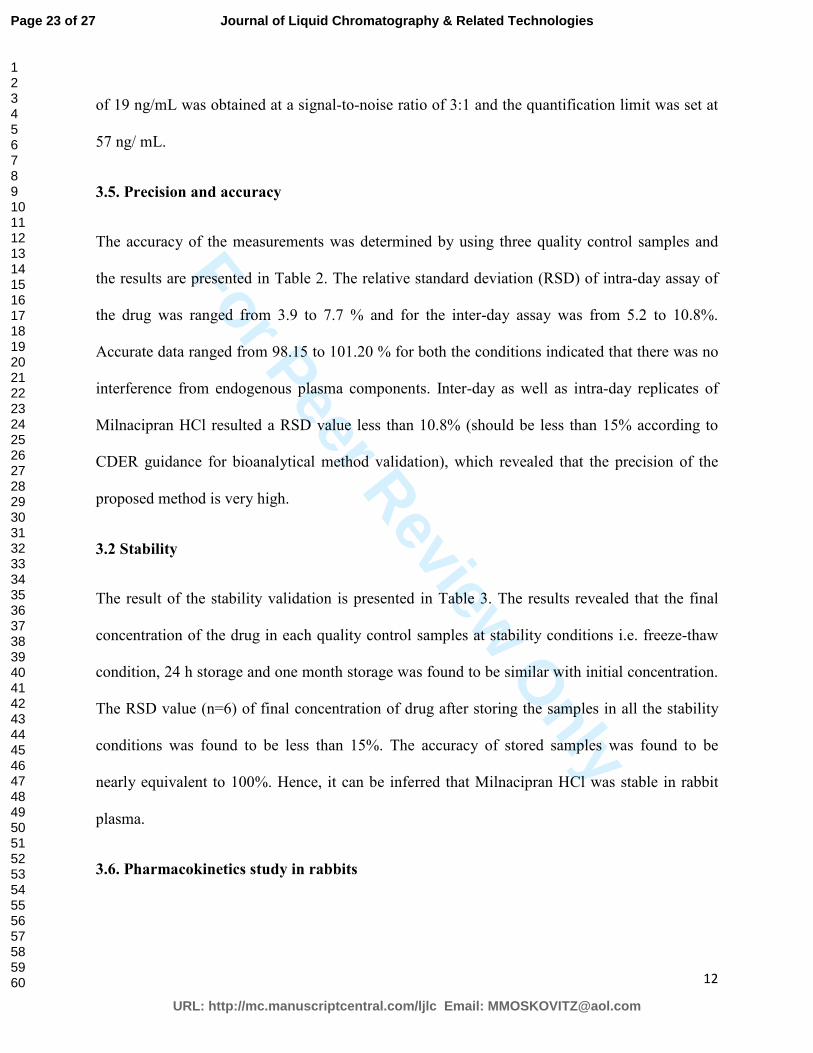
For Peer Review O
nly
12
of 19 ng/mL was obtained at a signal-to-noise ratio of 3:1 and the quantification limit was set at
57 ng/ mL.
3.5. Precision and accuracy
The accuracy of the measurements was determined by using three quality control samples and
the results are presented in Table 2. The relative standard deviation (RSD) of intra-day assay of
the drug was ranged from 3.9 to 7.7 % and for the inter-day assay was from 5.2 to 10.8%.
Accurate data ranged from 98.15 to 101.20 % for both the conditions indicated that there was no
interference from endogenous plasma components. Inter-day as well as intra-day replicates of
Milnacipran HCl resulted a RSD value less than 10.8% (should be less than 15% according to
CDER guidance for bioanalytical method validation), which revealed that the precision of the
proposed method is very high.
3.2 Stability
The result of the stability validation is presented in Table 3. The results revealed that the final
concentration of the drug in each quality control samples at stability conditions i.e. freeze-thaw
condition, 24 h storage and one month storage was found to be similar with initial concentration.
The RSD value (n=6) of final concentration of drug after storing the samples in all the stability
conditions was found to be less than 15%. The accuracy of stored samples was found to be
nearly equivalent to 100%. Hence, it can be inferred that Milnacipran HCl was stable in rabbit
plasma.
3.6. Pharmacokinetics study in rabbits
Page 23 of 27
URL: http://mc.manuscriptcentral.com/ljlc Email: [email protected]
Journal of Liquid Chromatography & Related Technologies
123456789101112131415161718192021222324252627282930313233343536373839404142434445464748495051525354555657585960

For Peer Review O
nly
13
The developed method was applied to quantify Milnacirpan HCl concentration in
pharmacokinetics study carried out on rabbits. The mean plasma concentration versus time
profile following a single oral administration of 0.07 mg Milnacipran HCl in three New Zealand
rabbits is presented in figure 4. Various other pharmacokinetics parameters have been
summarized in Table. 4. It can be seen from the plasma profiles of administered dose that
Milnacipran HCl can still be detectable up to at least 10 h.
4. CONCLUSION
A novel, simple, sensitive and economic RP-HPLC method has been developed and validated for
the estimation of Milnacipran HCl in rabbit plasma using UV-detector. The method was found to
be linear (R2=0.998) within the analytical range of 0.1-25 µg/mL. A maximum recovery of drug
from plasma was obtained using chloroform as extracting solvent in comparisons to other
organic solvents. This method will facilitate the conducting of pharmacokinetics and toxicology
studies of Milnacipran HCl and its formulations by easy quantification and greater precision.
Page 24 of 27
URL: http://mc.manuscriptcentral.com/ljlc Email: [email protected]
Journal of Liquid Chromatography & Related Technologies
123456789101112131415161718192021222324252627282930313233343536373839404142434445464748495051525354555657585960

For Peer Review O
nly
14
REFERENCES
1. Owen, R. T., Milnacipran hydrochloride: its efficacy, safety and tolerability profile in
fibromyalgia syndrome. Drugs Today (Barc) 2008, 44 (9), 653-60.
2. Mease, P. J.; Clauw, D. J.; Gendreau, R. M.; Rao, S. G.; Kranzler, J.; Chen, W.; Palmer,
R. H., The efficacy and safety of milnacipran for treatment of fibromyalgia. a
randomized, double-blind, placebo-controlled trial. J Rheumatol 2009, 36 (2), 398-409;
3. Chang, T. T.; Leng, C. H.; Wu, J. Y.; Lee, S. Y.; Wang, Y. S.; Chen, Y. C.; Lu, R. B.,
Lower side effects of milnacipran than paroxetine in the treatment of major depression
disorder among Han Chinese in Taiwan. Chin J Physiol 2008, 51 (6), 387-93.
4. Rop, P. P.; Sournac, M. H.; Burle, J.; Fornaris, M.; Coiffait, P. E., Blood concentration of
milnacipran in a case of a fatal automobile accident. J Anal Toxicol 2002, 26 (2), 123-6;
5. Delini-Stula, A., Milnacipran: an antidepressant with dual selectivity of action on
noradrenaline and serotonin uptake. Hum Psychopharmacol 2000, 15 (4), 255-260.
6. Tournel, G.; Houdret, N.; Hedouin, V.; Deveau, M.; Gosset, D.; Lhermitte, M., High-
performance liquid chromatographic method to screen and quantitate seven selective
serotonin reuptake inhibitors in human serum. J Chromatogr B Biomed Sci Appl 2001,
761 (2), 147-58.
7. Mizukami, K.; Hatanaka, K.; Tanaka, Y.; Sato, S.; Asada, T., Therapeutic effects of the
selective serotonin noradrenaline reuptake inhibitor milnacipran on depressive symptoms
in patients with Alzheimer's disease. Prog Neuropsychopharmacol Biol Psychiatry 2009,
33 (2), 349-52;
Page 25 of 27
URL: http://mc.manuscriptcentral.com/ljlc Email: [email protected]
Journal of Liquid Chromatography & Related Technologies
123456789101112131415161718192021222324252627282930313233343536373839404142434445464748495051525354555657585960

For Peer Review O
nly
15
8. Sechter, D.; Vandel, P.; Weiller, E.; Pezous, N.; Cabanac, F.; Tournoux, A., A
comparative study of milnacipran and paroxetine in outpatients with major depression. J
Affect Disord 2004, 83 (2-3), 233-6;
9. Clerc, G., Antidepressant efficacy and tolerability of milnacipran, a dual serotonin and
noradrenaline reuptake inhibitor: a comparison with fluvoxamine. Int Clin
Psychopharmacol 2001, 16 (3), 145-51.
10. Puozzo, C.; Filaquier, C.; Zorza, G., Determination of milnacipran, a serotonin and
noradrenaline reuptake inhibitor, in human plasma using liquid chromatography with
spectrofluorimetric detection. J Chromatogr B Analyt Technol Biomed Life Sci 2004, 806
(2), 221-8.
11. Lacassie, E.; Gaulier, J. M.; Marquet, P.; Rabatel, J. F.; Lachatre, G., Methods for the
determination of seven selective serotonin reuptake inhibitors and three active
metabolites in human serum using high-performance liquid chromatography and gas
chromatography. J Chromatogr B Biomed Sci Appl 2000, 742 (2), 229-38;
12. Duverneuil, C.; de la Grandmaison, G. L.; de Mazancourt, P.; Alvarez, J. C., A high-
performance liquid chromatography method with photodiode-array UV detection for
therapeutic drug monitoring of the nontricyclic antidepressant drugs. Ther Drug Monit
2003, 25 (5), 565-73;
13. Shinozuka, T.; Terada, M.; Tanaka, E., Solid-phase extraction and analysis of 20
antidepressant drugs in human plasma by LC/MS with SSI method. Forensic Sci Int
2006, 162 (1-3), 108-12.
14. Ucakturk, E.; Safak, C., Determination of Milnacipran in Human Plasma Using GC–MS.
Chromatographia 2010, 72, 111-119.
Page 26 of 27
URL: http://mc.manuscriptcentral.com/ljlc Email: [email protected]
Journal of Liquid Chromatography & Related Technologies
123456789101112131415161718192021222324252627282930313233343536373839404142434445464748495051525354555657585960

For Peer Review O
nly
16
15. Labat, L.; Deveaux, M.; Dallet, P.; Dubost, J. P., Separation of new antidepressants and
their metabolites by micellar electrokinetic capillary chromatography. J Chromatogr B
Analyt Technol Biomed Life Sci 2002, 773 (1), 17-23.
16. Patti, A.; Pedotti, S.; Sanfilippo, C., Comparative HPLC enantioseparation of
ferrocenylalcohols on two cellulose-based chiral stationary phases. Chirality 2007, 19
(5), 344-51.
Page 27 of 27
URL: http://mc.manuscriptcentral.com/ljlc Email: [email protected]
Journal of Liquid Chromatography & Related Technologies
123456789101112131415161718192021222324252627282930313233343536373839404142434445464748495051525354555657585960