Embed Size (px)
Citation preview

For Peer Review
In-context interpretation: Avoiding pitfalls in
misidentification of igneous bodies in seismic data
Journal: Interpretation
Manuscript ID Draft
Manuscript Type: 2017-09 Interpretation pitfalls
Date Submitted by the Author: n/a
Complete List of Authors: Infante-Paez, Lennon; The University of Oklahoma, Geology and Geophyscis, College of Earth and Energy Marfurt, Kurt; University of Oklahoma, College of Earth and Energy;
Keywords: volcanics, Seismic geomorphology, interpretation, carbonate, Facies
Subject Areas: Tutorials/pitfalls and lessons learned, Case studies, Integrated workflows and best practices (with broad applicability), Interpretation concepts,
algorithms, methods, and tools
https://mc.manuscriptcentral.com/interpretation
Interpretation
For Peer Review
In-context interpretation: Avoiding pitfalls in misidentification of igneous
bodies in seismic data
Lennon Infante-Paez and Kurt J. Marfurt
The University of Oklahoma, School of Geology and Geophysics.
ABSTRACT
In the past decades, many exploration wells have drilled into igneous rocks whereas the
anticipated target exhibiting a similar seismic expression were porous carbonate mounds, sheet
sands or deepwater sand-prone sinuous channels. In cases where sedimentary features such as
channels or fans cannot be clearly delineated, the interpretation may be driven primarily by
bright spot anomalies; a poor understanding of the wavelet polarity may compound this
problem. While many wells that are drilled into igneous rocks were based on interpretation of
2D seismic data, misinterpretation still occurs today using high quality 3D seismic data. To
address this challenge, we analyze the seismic expression of andesitic volcanoes in Taranaki
Basin, New Zealand along with other misinterpreted igneous bodies in different parts of the
world. We then propose an in-context interpretation workflow in which the seismic interpreter
looks for key clues above, below and around the target of interest that may alert the
interpreter to the presence of igneous facies.
Page 1 of 50
https://mc.manuscriptcentral.com/interpretation
Interpretation
123456789101112131415161718192021222324252627282930313233343536373839404142434445464748495051525354555657585960

For Peer Review
Introduction
While igneous rocks are common in Australia, Argentina, Brazil, the UK-Norway
continental margin, Indonesia, New Zealand, China and other oil provinces around the world,
there is only limited documentation of the seismic expression of igneous bodies in 3D seismic
data. Furthermore, more than 90 % of the documentation that does exists is focused on mafic
intrusions, (mainly sills) as those described by Planke et al. (1999), Hansen and Cartwright
(2006), Miles and Cartwright (2010), Klarner (2011), Schofield et al. (2012), Holford et al. (2013),
Jackson et al. (2013), Alves et al. (2015), Magee et al. (2016),Cortez and Santos (2016), and
more recently by McLean et al. (2017), Hafeez et al. (2017), Gao et al (2017), Schmiedel et al.
(2017) and Rabbel et al. (2018). Most of these studies focus on the magma mechanisms of
emplacement into the sedimentary overburden, the deformation associated with it and the
subvolcanic plumbing system. Moreover, the published literature is based towards the
European side of the North Atlantic continental margin (UK-Norway), Australia and Brazil with
only few studies related to the identification of igneous rocks in seismic data (Klarner, 2011) to
avoid misinterpreting them as common sedimentary exploration targets.
With the availability of modern 3D seismic surveys provided for research and education,
we now have some documented examples of igneous bodies that mimic common sedimentary
exploration targets such as carbonate mounds, sinuous channels, and bright spots. To avoid
such pitfalls, the interpreter needs to place the interpretation in context, identifying clues that
may indicate the presence of igneous features. For example, in the Faroe-Shetland Basin, North
Page 2 of 50
https://mc.manuscriptcentral.com/interpretation
Interpretation
123456789101112131415161718192021222324252627282930313233343536373839404142434445464748495051525354555657585960

For Peer Review
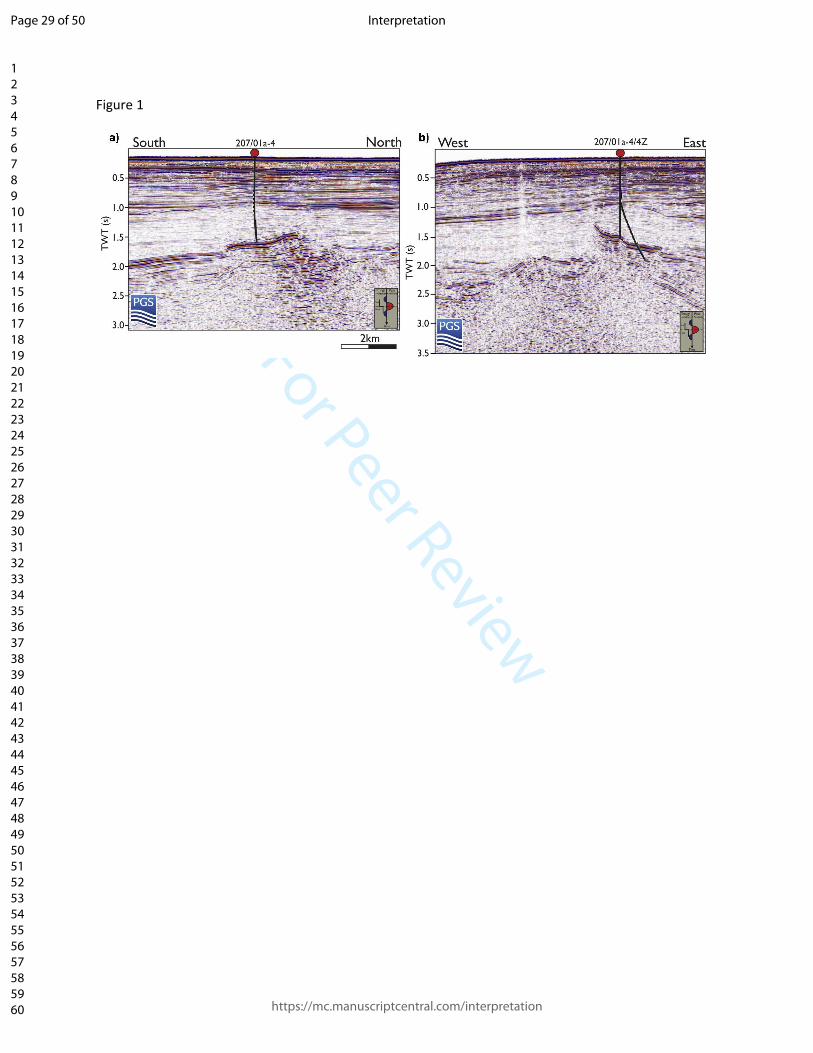
East Atlantic, exploration companies looking for Carboniferous/Devonian, Jurassic, and Lower
Cretaceous sandstones have drilled mafic igneous sills based on high amplitudes observed in
seismic data (Mark et al., 2017) (Figure 1). Similarly, in the San Jorge Basin, Argentina,
exploration/development wells targeting sand prone meandering channels have drilled mafic
lava flows filling a preexisting meander valley (Figure 2). In the Bass Basin, Australia, basaltic
volcanoes were drilled by at least two exploration wells which were originally intended to test
the hydrocarbon potential of a Miocene “reef complex” at a depth of 790 m., (Holford et al.,
2017; Reynolds et al., 2018). Figure (3).
Given these examples where clastic, carbonate and igneous bodies exhibit similar
characteristics, it is clear that we should not limit our interpretation solely on the geometry or
seismic expression of our preconceived or desired model, doing so, would make us a victim of
confirmation bias. Krueger and Funder (2004) define confirmation bias as “actively looking for
opinions and evidences that support one’s own beliefs or hypotheses” (see Bond et al., (2007)
for examples of confirmation bias in seismic interpretation). Such confirmation bias concept
was unconsciously executed in the previous examples from Argentina, Faroe Shetland and
Australia (Figures 1-3) where the explorationists believed to have found in their seismic data
the expression of the conceptual geological target model they had in mind. Counterintuitively,
the best way for an interpreter to avoid confirmation bias is to gain a deeper understanding of
features they are not interested in drilling, which in this paper, is a better understanding of the
seismic expression and geomorphology of igneous intrusive and extrusive features.
Page 3 of 50
https://mc.manuscriptcentral.com/interpretation
Interpretation
123456789101112131415161718192021222324252627282930313233343536373839404142434445464748495051525354555657585960

For Peer Review
Our primary objective in documenting the seismic expression of igneous bodies is to
alert the interpretation community of potential pitfalls when exploring for hydrocarbons in a
sedimentary basin affected by volcanism. e.g.., misinterpreting igneous features as
hydrocarbon bright spots, carbonate mounds, or meandering channels. Perhaps the best way to
avoid such a pitfall is to do in-context interpretation. This is essentially the identification of
subtler or potentially architectural elements of igneous system (Klarner et al., 2006; Klarner et
at., 2011). Specifically, the presence of deeper sills, associated forced folds, velocity pull ups
and poorly imaged vertical dykes near the shallower volcanic vents serve as key warnings that
the mound or channel-like features may not be a carbonate buildup or a channelized turbidite.
For this reason, our goal is to document how igneous rocks appear in seismic data.
Specifically, this study documents the seismic expression of andesitic (intermediate magma
composition) volcanoes in Taranaki basin, New Zealand, because they have been drilled by
exploration wells from the 1980’s. Moreover, we link the presence of igneous sills, dykes, and
forced folds below and around volcanoes to the same magmatic episode responsible for
building the edifices. Finally, we propose an in-context interpretation workflow in which the
seismic interpreter looks for key clues above, below and around the target of interest that may
alert the interpreter to the presence of igneous facies.
Page 4 of 50
https://mc.manuscriptcentral.com/interpretation
Interpretation
123456789101112131415161718192021222324252627282930313233343536373839404142434445464748495051525354555657585960

For Peer Review
Tectonic background of Taranaki Basin, New Zealand
The focus area of our study is in the Northern Graben of the Taranaki Basin, New
Zealand (Figure 4). A summary of the tectonic history of the Taranaki Basin, New Zealand is
described in a paper by Infante-Paez and Marfurt (2017) (Figure 1).” Although very extensive
and complex, the evolution of the Taranaki Basin can be briefly summarized in three major
phases of deformation. Phase one: Cretaceous to Paleocene (~84-55 ma) extension. Phase two:
Eocene to Recent (~40-0ma) shortening, and Phase three: Late Miocene to Recent (~12-ma)
extension (Giba et al., 2010). Late Cretaceous extension was the responsible for the breakup of
Gondwana (King and Thrasher, 1992, 1996), while shortening in the Taranaki Basin is thought to
have formed as a consequence of the subduction of the oceanic Pacific plate with the
continental Australian Plate (Demets et al., 1994; Beavan et al., 2002). The last phase of
deformation in the Taranaki Basin was the Miocene and younger extension. It was accompanied
by volcanism that commenced at about 16 Ma and continues at Mt Taranaki today (Neall et al.,
1986; Hayward et al., 1987; Bergman et al., 1992; King and Thrasher, 1992).These volcanic
center are mainly stratovolcanoes, of mostly low-medium K andesitic composition and,
together with their NNE-trending alignment (Figure 1) parallel to the late Miocene subduction
margin, suggest that magmas are derived from the subducting Pacific Plate beneath the basin
(Bergman et al., 1992).”
For the convenience of the reader, we will use a black-red color bar when using the Kora
3D seismic survey which has the highest quality (highest signal to noise ratio) and blue to yellow
when displaying other surveys.
Page 5 of 50
https://mc.manuscriptcentral.com/interpretation
Interpretation
123456789101112131415161718192021222324252627282930313233343536373839404142434445464748495051525354555657585960

For Peer Review
Extrusive Igneous bodies in Taranaki Basin, New Zealand
Andesitic Volcanoes
Some of the andesitic stratovolcanoes that form the Mohakatino Volcanic Belt (MVB)
described by Bergman et al., (1992) and King and Thrasher (1996) have been penetrated in the
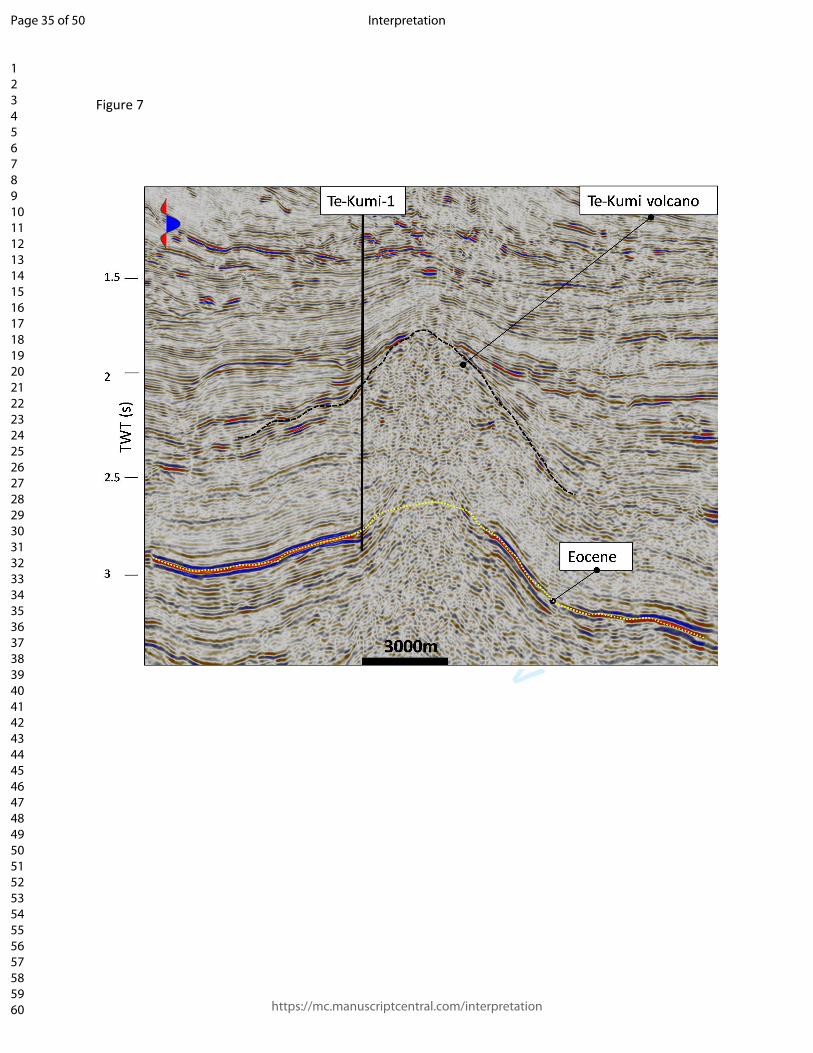
early to late 1980’s by exploration wells: Manga-1, Te-Kumi-1, Tua-Tua-1, and Kora1-4 (Figures
5-8b). To give geological meaning to the features observed in seismic data, the wells were tied
to the seismic data using conventional well to seismic tie techniques. According to the well
series reports, the paleo seafloor where the volcanoes built was mid bathyal depths with water
depth from 800-1300m.
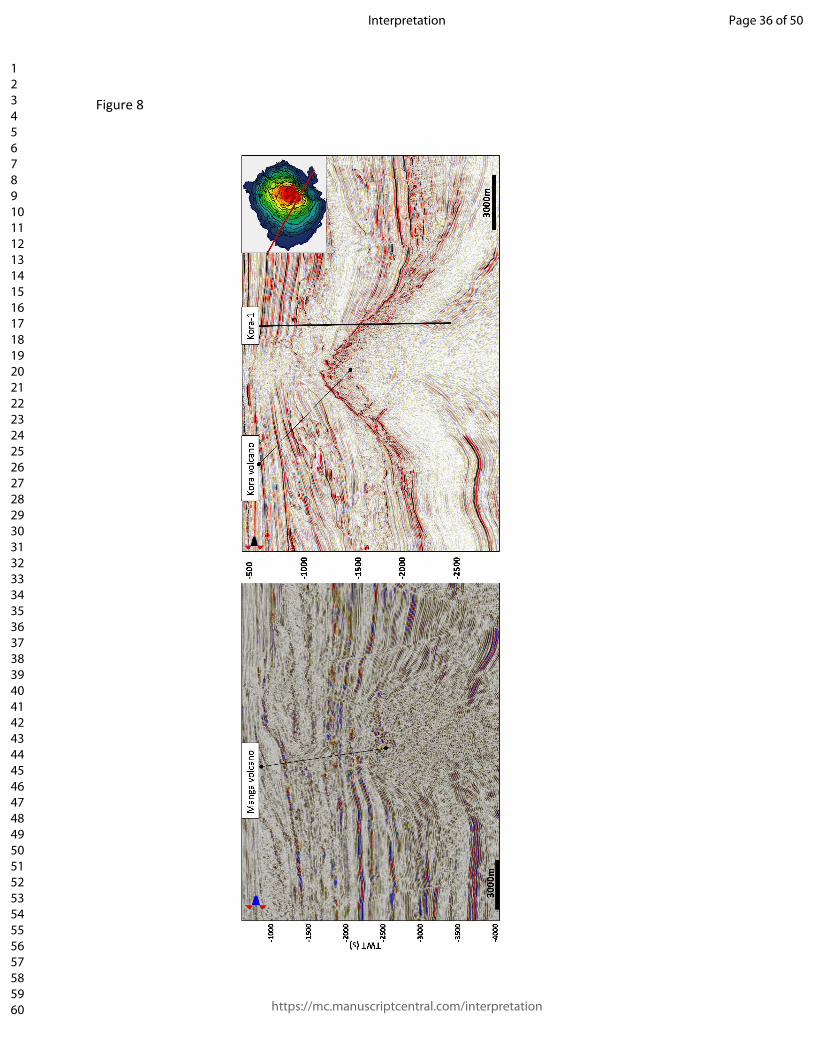
The quality of the volcanoes images depends on the quality of the seismic data, with 3D
surveys acquired more recently (2006) providing superior images to 2D surveys acquired in
1995. (Figure 8). On time migrated seismic data, they show a trapezoidal to mounded geometry
with moderate to high continuous amplitude reflectors on the flanks, and a chaotic “salt and
pepper” internal configuration (Figures 5-8). According to the well completion reports, wells
that penetrated these volcanic cones encounter sequences of andesitic detritus composed of
tuff to poorly sorted lapilli and breccias, with plagioclase and hornblende being major mineral
components along with clay and rock fragments (Manga-1, Te-Kumi-1, Tua-Tua-1 and Kora-1-4
well series reports).
Page 6 of 50
https://mc.manuscriptcentral.com/interpretation
Interpretation
123456789101112131415161718192021222324252627282930313233343536373839404142434445464748495051525354555657585960

For Peer Review
The exact lateral extension of the volcanoes is difficult to make out because the
limitations of the 2D data and the lack of sufficiently dense lines to confidently map the igneous
body, thus the vertical sections could slice the volcanic cone on its flanks, and in this case not
pass through the summit, masking its true height and extent. Given this limitation, the
volcanoes are approximately 4-5 km in radius rising between 500 m - 800 m above sea floor
(well series report).
Whether analyzing 2D or 3D seismic surveys, the onlap of sediments onto the volcano
flanks show that they were either volcanic islands or seamounts, where the age of the
onlapping sediments indicate the relative age of the igneous bodies. Giba et al., (2013) used
biostratigraphic dating of the sediment layers provided by offshore Taranaki basin exploration
wells to constrain the age of the Tua-Tua, Te-Kumi, Manga and Kora volcanoes (Figures 5-8) to
be between 33.7-10; 12-8; 12-5.5, and 12-5.5 Ma respectively.
The well control through several coned to mound like structures seen on seismic data
calibrates the unique external and internal seismic patterns of andesitic volcanoes which can be
used to interpret similar undrilled seismic patterns nearby (Figure 9). First, volcanoes exhibit a
cone to mounded structure ranging from 500-600 ms in two-way travel time. While seamounts
may retain their cone shape, subaerially exposed volcanic islands will be eroded resulting in a
more mounded appearance. Steep dip flanks, internal heterogeneity, and higher velocity than
the surrounding sediments give rise to imaging problems, resulting in a nearly complete
disruption on the continuity of the reflectors immediately below the volcanoes. Using a 3D
Page 7 of 50
https://mc.manuscriptcentral.com/interpretation
Interpretation
123456789101112131415161718192021222324252627282930313233343536373839404142434445464748495051525354555657585960

For Peer Review
seismic survey from Santos Basin, offshore Brazil, Cortez and Santos (2016) attribute a similar
lack of continuity of the reflectors to the difficulties in velocity analysis associated with the
complex plumbing system below the volcano . In seismic data volumes from Taranaki Basin, this
disruption continues horizontally some 3000 m below the paleo seafloor at the time of
eruption, which is inconsistent with vertical pipe feeder models that range of only hundreds of
meters (Morley, 2018, in review). Examining the deeper reflectors below the volcanic cones in
Figures 4-9, note that the flanks exhibit clear doming, where the deeper reflectors are pulled up
along with those concordant with the top of the volcano surface. For this reason, while velocity
heterogeneity may lead to a poor image, most of the doming is structural (Figure 10), rather
than a velocity pull-up artifact (Infante-Paez 2018).
Intrusive Igneous Bodies in Taranaki Basin
Igneous sills
Although not extensively documented because they are not exploration objectives, the
most common features related to igneous bodies seen in seismic data are intrusive sills ( Planke
et al. (1999); Hansen and Cartwright (2006); Miles and Cartwright (2010) ; Holford et al. (2013),
Jackson et al. (2013), Alves et al., (2015), Magee et al., (2106), Cortez and Santos (2016),
Naviset et al. ( 2017),McLean et al. (2017), (Hafeez et al., 2017), (Gao et al., 2017), Infante-Paez
and Marfurt (2017), Mark et al.( 2017), Schofield et al. (2017), and more recently by Rabbel et
al. (2018), and Morley (2018) in review).
Page 8 of 50
https://mc.manuscriptcentral.com/interpretation
Interpretation
123456789101112131415161718192021222324252627282930313233343536373839404142434445464748495051525354555657585960

For Peer Review
A good example of episodic Miocene magmatism is the Kora volcano (Figure 10).
Vertical sections around this edifice show multiple high amplitude, continuous (2-3 km) dimeter
saucer- shaped reflectors below the volcano that cross cut stratigraphy (Figures 11). The spatial
distribution of these reflectors around the Kora volcano is illustrated using a set of co-rendered
time slices through the instantaneous envelope attribute. Figure 12 shows the semicircular
distribution of these high amplitude reflectors below and around the volcano. The spatial
relationship to the Kora volcano supports the hypothesis they are igneous bodies related to the
same magmatic event that created the Kora volcano in the Early-Mid Miocene (Bergman et al.,
1992; Giba et al., 2013). These saucers shaped high amplitude exhibit the same morphology as
those documented by Du Toit (1920), Plank et al. (2005) and others from the rifted European
side of the North Atlantic margin, Brazil and Australia, where rifting facilitates mafic magmatism
due to decompression and partial melting of the ultramafic mantle. Furthermore, Sarkar and
Marfurt, (2017) describe similar andesitic saucer-shaped sills drilled and logged on the way
down to deeper turbidites in the Chicontepec Basin of eastern Mexico. Regardless of their
composition, the appearance of these sills is similar to those due to extension and subduction-
related magmatism Given these morphological analogues in both mafic and intermediate
provinces, we interpreter the saucer-shaped high amplitudes in the Kora3D survey to be sills
(Figures 11). Importantly, the host rocks into which these igneous bodies intrude may be of
interest in hydrocarbon exploration. Figure 11 illustrates a vertical slice through seismic
amplitude section showing multiple ~2 km sills and possible laccoliths that thermally modify the
Paleocene source rock, such as described by Delpino and Bermudez (2009). In this scenario,
Page 9 of 50
https://mc.manuscriptcentral.com/interpretation
Interpretation
123456789101112131415161718192021222324252627282930313233343536373839404142434445464748495051525354555657585960

For Peer Review
heat from the sills place immature source rocks within the oil window. Igneous intrusion will
produce contact metamorphism in the host rocks nearby the intrusion. These thermally altered
rocks or “hornfels” like those studied in outcrop by Liborius and Tazzo (2012), and Sarkar et al.
(2017) are often fractured. Hydrocarbons can then migrate into the fractured igneous bodies
(Rodriguez Monreal et al., 2009; Delpino and Bermudez, 2009; Senger et al. , 2017; Rabbel et
al., 2018)
Sills and forced folds
Another key parameter to identify these igneous intrusions is to look for deformation of
the host rock. Jackson et al. (2013), Magee et al. (2014), Alves et al. (2015), and Schmiedel et al.
(2017) and other, report the occurrence of these structures (forced folds) in seismic data.
According to Hansen and Cartwright (2006) most sills form folds because either the volume of
the magma displaces that of the sediments or due to differential compaction of the sediments
deposited above the sill. Since the sill is more rigid that the host rock, sediments deposited
around the sills would compact more than sediments deposited above the sill, thus creating a
fold. Therefore, the emplacement of these sills in the upper Crust may deform the host rock via
Syn-emplacement mechanisms such as elastic bending and/or fluidization (Hansen and
Cartwright 2006) or by Post-emplacement processes, such as differential compaction which also
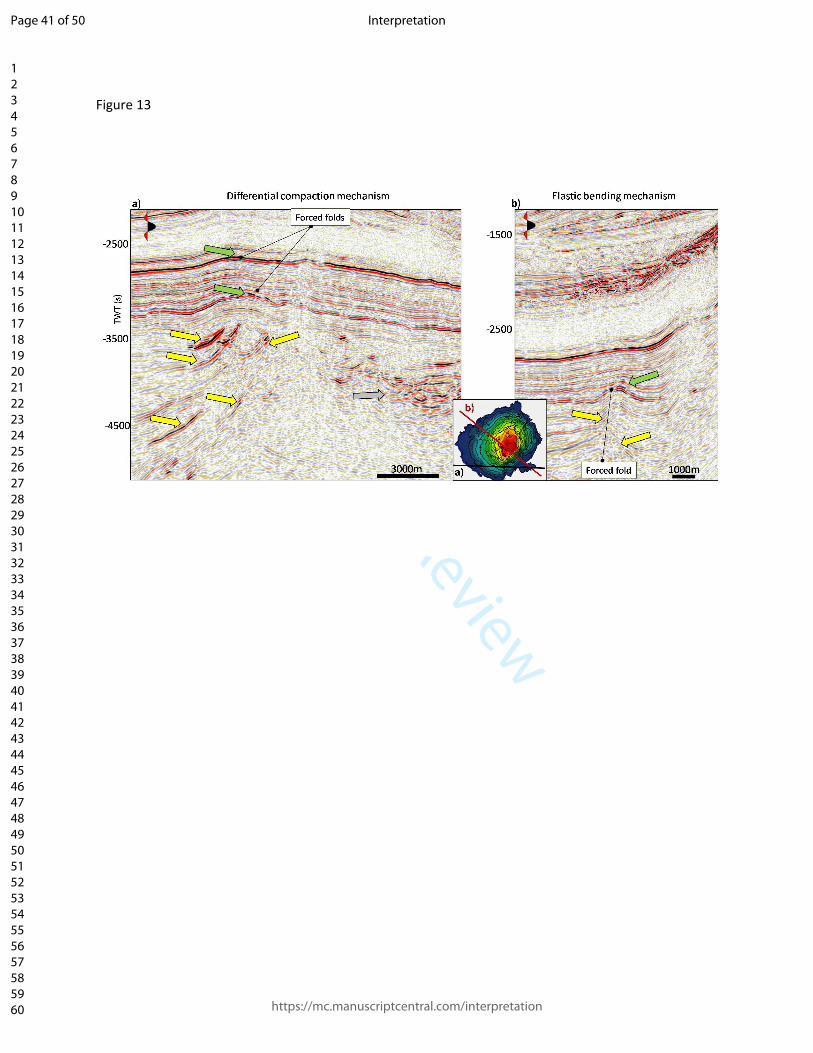
gives rise to folds (Schmiedel et al., 2017). Figures 13a shows an example of post-emplacement
deformation where a sill complex in the Upper Cretaceous sequence and corresponding forced
fold can be observed in the section directly above the igneous intrusions. The wavelength of the
Page 10 of 50
https://mc.manuscriptcentral.com/interpretation
Interpretation
123456789101112131415161718192021222324252627282930313233343536373839404142434445464748495051525354555657585960
For Peer Review
fold appears to be linked to the lateral extent of the sills, while the amplitude of the fold seems
to be related to the cumulative thickness. A crucial clue is that the amplitude of the fold
deformation decreases stratigraphically up, suggesting the deformation occurred post-
emplacement of the sill, probably due to differential compaction about the flanks (Schmiedel et
al., 2017) and that the sill was emplaced in a zone of high pore fluid volume that may have been
fluidized to accommodate the volume of the magma. In contrast, Figure (13 b) shows an
example of a forced fold where terminations can be seen to lap onto the fold, suggesting a syn-
emplacement deformation thereby defining the time of the initial intrusion (Hansen and
Cartwright 2006). Often, sills show evidence of both syn- and post-emplacement deformation
and small to no deformation respectively (Figure 13a grey arrow). Magee et al. (2016) find that
sometimes sill emplacement shows little to no deformation, suggesting fluidization. For this
reason, while deformation is an indicator of the emplacement of igneous bodies not all igneous
intrusions generate such features.
Igneous Dykes
In magmatic systems, dykes are near vertical intrusions commonly tens of meters thick
and up to a few kilometers in extent (e.g. Thomson, 2007; Holdford et al., 2017; Reynolds et al.,
2018) that cross-cut pre-existent strata, usually intruding into zones of weakness such as faults
and mechanically weaker layers. The imaging of these igneous bodies in seismic data is
challenging since seismic data will not image near vertical features (Thomson, 2007).
Page 11 of 50
https://mc.manuscriptcentral.com/interpretation
Interpretation
123456789101112131415161718192021222324252627282930313233343536373839404142434445464748495051525354555657585960

For Peer Review
Nevertheless, evidence of dykes can still be observed in seismic data. (Holdford et al., 2017,
Reynolds et al., 2018)
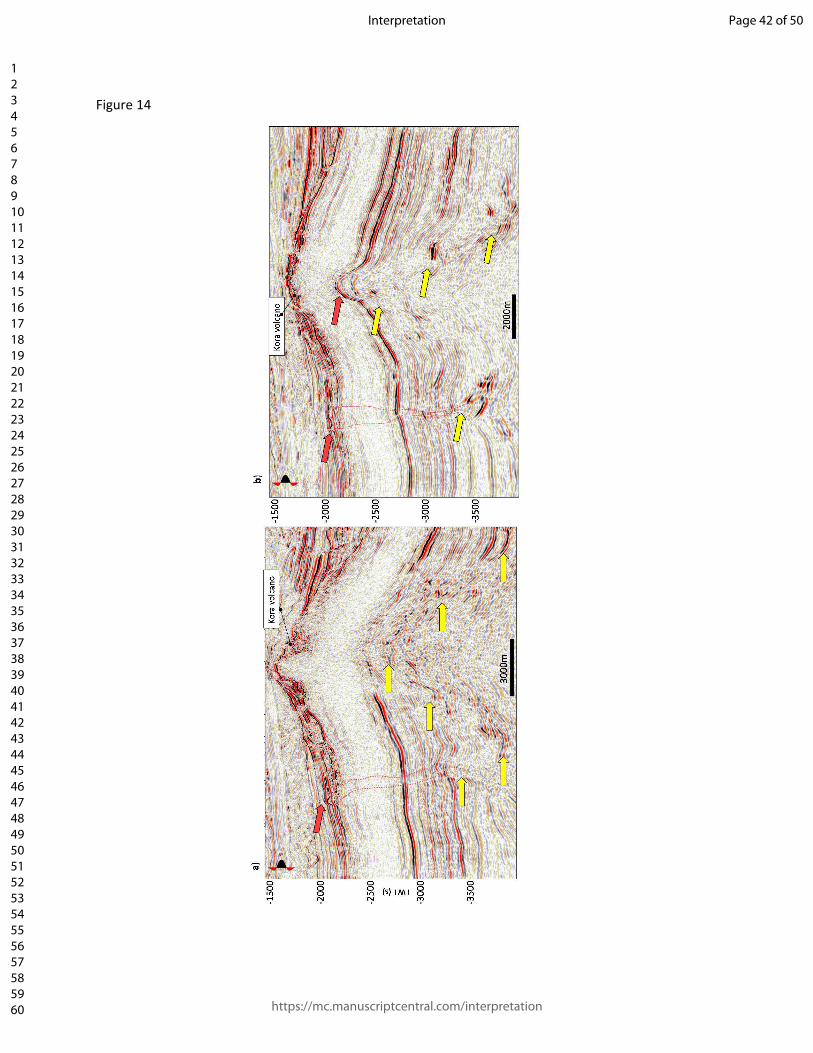
A series of near vertical, narrow, low amplitude reflectors can be seen below the flanks
Kora volcano (reddish dotted lines in Figure 14). They create a pattern that is very difficult to
distinguish from low signal/noise zones where amplitudes may have been affected by
absorption or just by low fold traces. However, they only cover a certain portion of the seismic
section e.g., 2000-3500 ms TWT (Figure 14). The second criteria are that they appear to be
terminating on sections of the flank of the Kora Volcano where reflectors with small coned
shape appear (Figure 14). A coherency and dip magnitude stratal slice near the base of the
flank of the Kora shows this feature to be semi-circular (Figures 15 a) and b)). Given the spatial
and temporal relationship of these events, I interpret the near vertical, narrow, low amplitude
pattern to be a near vertical dykes that feed the above mentioned small conic vent. This is
consistent with the model proposed by Bischoff et al., (2017).
Implication for avoiding pitfalls in seismic interpretation
The previous section illustrated the seismic expression of igneous bodies where wells
have penetrated the mound to coned shaped structures so that it is possible to know they are
igneous volcanoes. However, like stated before. This cone to mound-like geometry is very
similar to carbonate reefs that are common exploration targets. Furthermore, Figure (16) shows
Page 12 of 50
https://mc.manuscriptcentral.com/interpretation
Interpretation
123456789101112131415161718192021222324252627282930313233343536373839404142434445464748495051525354555657585960

For Peer Review
examples of igneous bodies, both intrusive and extrusive, that mimic the seismic expression of
other common exploration targets. Based on their facies alone, one should not be able to
distinguish igneous bodies from their clastic counterparts with 100% accuracy (we would
encourage the reader to make and educated guess before reading the figure caption).
Given these examples where clastic, carbonate and igneous bodies exhibit similar
characteristics, it is clear that we should not limit our interpretation solely on the geometry or
seismic expression of our preconceived or desired model, doing so, would make us a victim of
confirmation bias. Confirmation bias it’s a psychology concept that refers to actively looking for
opinions and evidences that support one’s own beliefs or hypotheses (Bond et al., 2007). For a
complete definition of bias, bias types and their origins see Krueger and Funder (2004). We
think that this confirmation bias concept was unconsciously executed in the previous examples
from Argentina, Faroe Shetland and Australia (Figures 1-3) where the explorationist believed to
have found in their seismic data the expression of the conceptual geological target model they
had in mind. Counterintuitively, the best way for an interpreter to avoid confirmation bias is to
gain a deeper understanding of features they are not interested in drilling, which in this paper,
is a better understanding of the seismic expression and geomorphology of igneous intrusive
and extrusive features.
To help mitigate the confirmation bias concept, we examine a few seismic amplitude
sections of the Akira 2007 2D seismic survey acquired over the Taranaki Basin, New Zealand.
The seismic data depicts a series of cone-to-mound geometry with chaotic internal reflection
configurations and moderate to high amplitudes on the top (Figure 17). Immediately below the
Page 13 of 50
https://mc.manuscriptcentral.com/interpretation
Interpretation
123456789101112131415161718192021222324252627282930313233343536373839404142434445464748495051525354555657585960

For Peer Review
mound-like features there is a disruption in the reflections just like in the volcanoes in Figures
5-10. The mounds exhibit base lengths of approximately 2000 meters with “steep” flanks and
appear to be laterally interconnected. Based only on their geometry, these features are similar
to “carbonate mounds” (Holdford et al., 2017; Reynolds et al., 2018;) or even to mud volcanoes.
the only unequivocal way to determine the composition of these mounds would be by drilling a
well through them and study an extracted core or even cuttings. An alternative way would be
to use potential field methods to differentiate between generally magnetic igneous rocks and
non-magnetic sedimentary rocks. However, remnant magnetization may confuse the
interpretation (e.g. Pena et al., 2009) while diagenesis may result in magnetic volcanic tuff
being converted to nonmagnetic montmorillonite (personal communication with former
colleagues at AGIP). An alternative and inexpensive method is to apply in-context
interpretation. In this study, in-context interpretation refers to the concept implemented by
Posamentier (per. Comm., 2018), in which he looks at the pattern of the features of interest as
well as the surrounding elements (e.g., what’s below, what’s above and what’s around). To
illustrate this concept, we cite National Geographic’s Brain Games TV show analogy illustrated
in Figure (18). In this image, we see headshots of two former U. S.A leaders. We can easily
recognize former vice president Dick Cheney on the left and former president George W. Bush
on the right side. Detailed examination of this image shows that they both have the same face
(analogous to the ambiguous pattern of interest in geology e.g., carbonate mounds, or volcanic
mounds) with minor alterations. So, how is it that the same face gives two completely different
persons? (analogous to two different interpretations) It is the context, (what’s above, what’s
below and what’s around) where the key to differentiation lies. In this case, the context is given
Page 14 of 50
https://mc.manuscriptcentral.com/interpretation
Interpretation
123456789101112131415161718192021222324252627282930313233343536373839404142434445464748495051525354555657585960

For Peer Review
by the glasses, the different hair style, hair and skin color that allows us to distinguish ex-vice
president Cheney from ex-president Bush in the Figure (18).
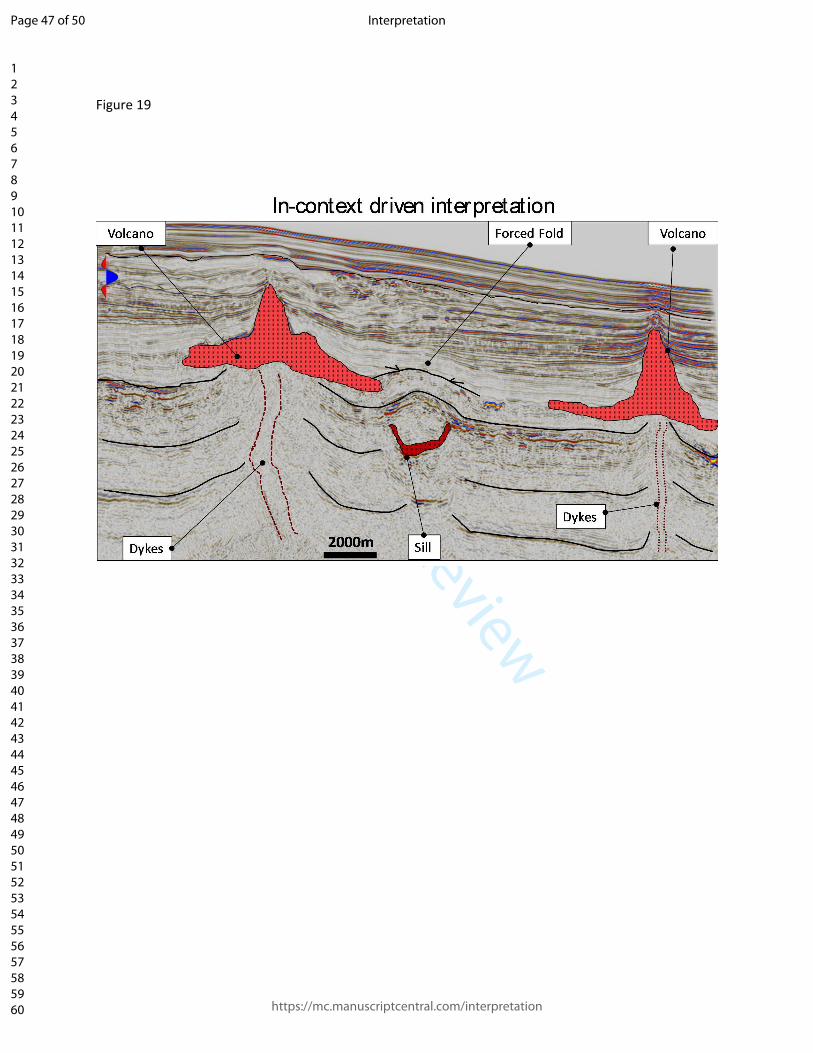
Applying the same in-context interpretation concept to Figure 17, we recognize other
key clues that would help infer the composition of the mound-like features. Among these clues
are: (1) saucer-shaped high amplitude (similar to Figure 13) around the mounds (2) forced folds
that are formed due to the emplacement of the sills (Hansen and Cartwright 2006; Holford et
al., 2012; Jackson et al., 2013; Magee et al., 2014; Infante-Paez and Marfurt, 2017; Schmiedel
et al., 2017; Magee et al., 2017; Schofield et al., 2017) (red arrows) and (3) a sub-vertical
narrow low amplitude pattern in the section below these mounds that appears to disrupt the
reflectors for significant vertical distances (2250-3500 ms TWT, or more than 1km) just below
the mounds. Implementing the before mentioned strategy of in-context interpretation, the
presence of all these elements (saucer shaped sills, forced folds) indicates an igneous
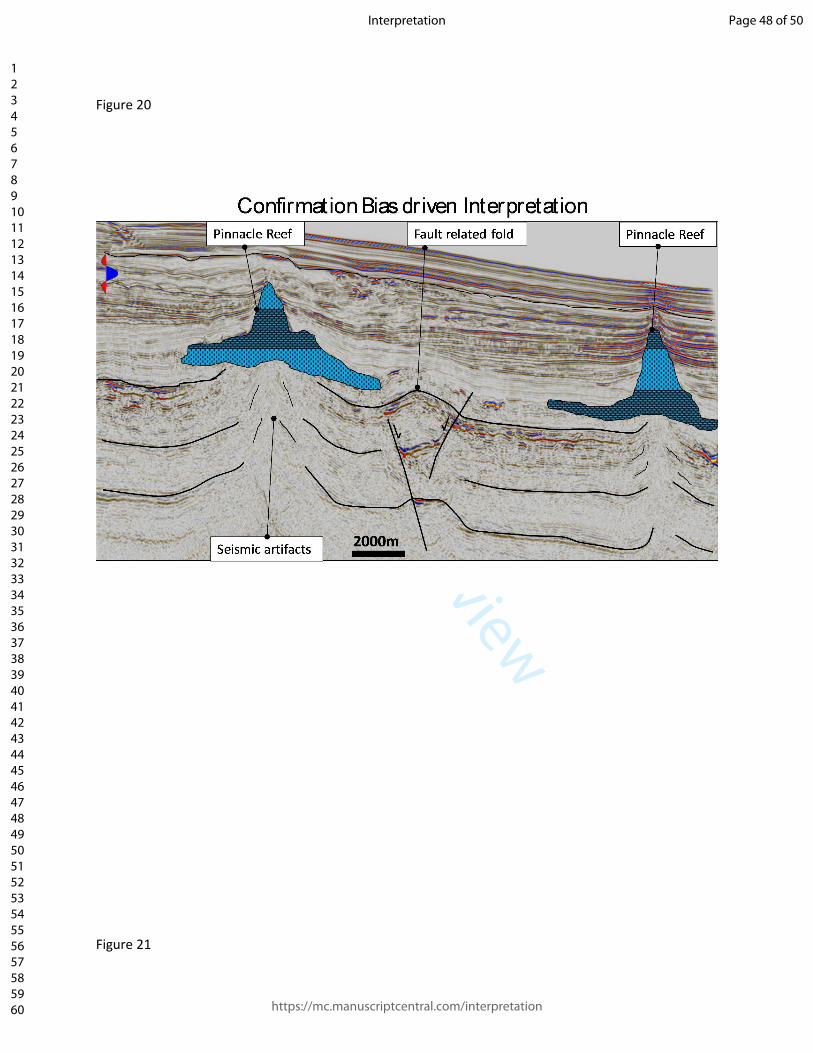
composition of the mounds (Figure 19). In contrast, an interpretation driven by confirmation
bias (Figure 20) where the objective is to identify carbonates build-ups to test their reservoir
potential might misinterpret the mound-like features to be pinnacle reefs, as appeared to be
the case documented by Holford et al., (2017) and Reynolds et al., (2018) in the Bass Basin,
Australia. Figure (21) summarizes a proposed workflow to avoid interpretation pitfalls in the
presence of igneous intrusions and extrusions. Key to this workflow is not to stop when we find
what we are looking for (finding the feature of interest from our conceptual geological model),
thereby confirming our bias. Rather, we perform in-context interpretation to try to match the
evidence of the context to our exploration target, like the igneous evidence found in Figure
(19). Additionally, Further examination of the literature supports the igneous interpretation
Page 15 of 50
https://mc.manuscriptcentral.com/interpretation
Interpretation
123456789101112131415161718192021222324252627282930313233343536373839404142434445464748495051525354555657585960

For Peer Review
where Jackson et al. (2013) and Magee et al. (2013) found similar features in the Ceduna sub-
basin of Australia to be volcanoes.
Conclusions
Igneous bodies can mimic the geometry and morphology of important exploration
targets such as carbonate mounds, sinuous channels and bright spots. For this reason, the
interpreter cannot rely on seismic morphology and geometry alone. Whenever possible, seismic
data should be complemented with other geophysical methods such as gravity and magnetic
surveys to avoid drilling features like volcanic cones or lava flows. An alternative and
inexpensive method to avoid such pitfalls is in-context interpretation where the interpreter
examines not only the pattern of the features of interest but also the patterns of the
surrounding elements, in simpler terms, we need to not only identify features we want to find,
but also to identify neighboring features we don’t want to find.
By understanding the context of volcanic systems, one can avoid interpreting them as
something else. Important clues that help to distinguish a volcano from a carbonate mound in
seismic data are the disruption of reflectors immediately below the mound-like features and
the igneous sills forming forced folds nearby and below the edifice. From the multiple seismic
surveys (old and new vintage) that we have analyzed in Taranaki Basin, New Zealand, this
disruption on the reflectors and igneous sills are common denominators in all the seismic
sections that image the andesitic volcanoes from the Taranaki Basin, New Zealand. Finally,
Page 16 of 50
https://mc.manuscriptcentral.com/interpretation
Interpretation
123456789101112131415161718192021222324252627282930313233343536373839404142434445464748495051525354555657585960
For Peer Review
though the examples presented in this study are specific to volcanoes created by subduction of
oceanic crust underneath continental crust (andesitic volcanoes), other tectonic settings would
also present similar volcanic architectural elements (sills, dykes, forced folds). Thus, it is
inspiring how we can avoid interpretation pitfalls when we apply in-context interpretation in
our routinely seismic analysis. It is our hope that the ideas presented in this paper can help
other interpreters to avoid the misidentification of igneous bodies in seismic data in different
sedimentary basins.
Page 17 of 50
https://mc.manuscriptcentral.com/interpretation
Interpretation
123456789101112131415161718192021222324252627282930313233343536373839404142434445464748495051525354555657585960

For Peer Review
References
Alves, T., K. Omosanya, and P. Gowling, 2015, Volume rendering of enigmatic high-amplitude
anomalies in southeast Brazil: A workflow to distinguish lithologic features from fluid
accumulations: Interpretation, 3, A1-A14.
Beavan, J., P. Tregoning, M. Bevis, T. Kato, and C. Meertens, 2002, Motion and rigidity of the
Pacific Plate and implications for plate boundary deformation: Journal of Geophysical
Research, 107, ETG 19-1, doi: 10 .1029/2001JB000282.
Bergman, S. C., J. P. Talbot, and P. R. Thompson, 1992, The Kora Miocene submarine andesite
stratovolcano hydrocarbon reservoir, Northern Taranaki Basin, New Zealand: New
Zealand Oil Exploration Conference Proceedings, Ministry of Commerce, 178–206.
Bischoff, A. P., A. Nicol, and M. Beggs, 2017, Stratigraphy of architectural elements in a buried
volcanic system and implications for hydrocarbon exploration: Interpretation, 5, no. 3,
SK141-SK159, doi:10.1190/INT-2016-0201.1.
Bond, C. E., A. D. Gibbs, Z. K. Shipton, and S. Jones, 2007, What do you think this is?
“Conceptual uncertainty” In geoscience interpretation: GSA Today, v. 17, no. 11, p. 4–10,
doi:10.1130/GSAT01711A.1.
Page 18 of 50
https://mc.manuscriptcentral.com/interpretation
Interpretation
123456789101112131415161718192021222324252627282930313233343536373839404142434445464748495051525354555657585960

For Peer Review
Cortez, M. M. M., and M. A. C. Santos, 2016, Seismic interpretation, attribute analysis, and
illumination study for targets below a volcanic-sedimentary succession, Santos Basin,
offshore Brazil: Interpretation, v. 4, no. 1, p. 37–50, doi:10.1190/INT-2015-0097.1.
Gao, Z., W. Tian, L. Wang, Y. Shi, and M. Pan, 2017, Emplacement of intrusions of the Tarim
Flood Basalt Province and their impacts on oil and gas reservoirs: A 3D seismic reflection
study in Yingmaili fields, Tarim Basin, northwest China: Interpretation, v. 5, no. 3, p. SK51-
SK63, doi:10.1190/INT-2016-0165.1.
Giba, M., J. J. Walsh, A. Nicol, V. Mouslopoulou, and H. Seebeck, 2013, Investigation of the
spatio-temporal relationship between normal faulting and arc volcanism on million-year
time scales: Journal of the Geological Society, v. 170, no. 6, p. 951–962,
doi:10.1144/jgs2012-121.
Hafeez, A., S. Planke, D. A. Jerram, J. M. Millett, D. Maharjan, and T. Prestvik, 2017, Upper
paleocene ultramafic igneous rocks offshore mid-Norway: Re-interpretation of the
vestbrona formation as a sill complex: Interpretation, v. 5, no. 3, doi:10.1190/int-2016-
0143.1.
Holford, S., N. Schofield, J. MacDonald, I. Duddy, and P. Green, 2012, Seismic analysis of igneous
systems in sedimentary basins and their impacts on hydrocarbon prospectivity: examples
from the southern Australian margin: The APPEA Journal, v. 52, no. 1, p. 229,
doi:10.1071/AJ11017.
Holford, S. P., N. Schofield, and P. Reynolds, 2017, Subsurface fluid flow focused by buried
volcanoes in sedimentary basins: Evidence from 3D seismic data, Bass Basin, offshore
Page 19 of 50
https://mc.manuscriptcentral.com/interpretation
Interpretation
123456789101112131415161718192021222324252627282930313233343536373839404142434445464748495051525354555657585960

For Peer Review
southeastern Australia: Interpretation, v. 5, no. 3, p. SK39-SK50, doi:10.1190/INT-2016-
0205.1.
Infante-Paez, L., and K. J. Marfurt, 2017, Seismic expression and geomorphology of igneous
bodies: A Taranaki Basin, New Zealand, case study: Interpretation, v. 5, no. 3, p. SK121-
SK140, doi:10.1190/INT-2016-0244.1.
J. Krueger, D. F., 2004, Towards a Balanced Social Psychology:Causes, Consequences and Cures
for the Problem-seeking\rApproach to Social Behavior and Cognition: Behavioral and Brain
Sciences, no. 2004, p. 313–376.
Jackson, C. A. L., N. Schofield, and B. Golenkov, 2013, Geometry and controls on the
development of igneous sill-related forced folds: A 2-D seismic reflection case study from
offshore southern Australia: Bulletin of the Geological Society of America, v. 125, no. 11–
12, p. 1874–1890, doi:10.1130/B30833.1.
Klarner, S., O. Klarner, 2011, World â€TM
s largest Science , Technology & Medicine Open
Access book publisher : Capsaicin Sensitive Neural Afferentation and the Gastrointestinal
Tract from Bench to Bedside.
Magee, C. et al., 2016, Lateral magma flow in mafic sill complexes: Geosphere, v. 12, no. 3, p.
809–841, doi:10.1130/GES01256.1.
Magee, C., E. Hunt-Stewart, and C. A. L. Jackson, 2013, Volcano growth mechanisms and the
role of sub-volcanic intrusions: Insights from 2D seismic reflection data: Earth and
Planetary Science Letters, v. 373, p. 41–53, doi:10.1016/j.epsl.2013.04.041.
Page 20 of 50
https://mc.manuscriptcentral.com/interpretation
Interpretation
123456789101112131415161718192021222324252627282930313233343536373839404142434445464748495051525354555657585960

For Peer Review
Magee, C., C. A.-L. Jackson, J. P. Hardman, and M. T. Reeve, 2017, Decoding sill emplacement
and forced fold growth in the Exmouth Sub-basin, offshore northwest Australia:
Implications for hydrocarbon exploration: Interpretation, v. 5, no. 3, p. SK11-SK22,
doi:10.1190/INT-2016-0133.1.
Magee, C., C. A. L. Jackson, and N. Schofield, 2014, Diachronous sub-volcanic intrusion along
deep-water margins: Insights from the Irish Rockall Basin: Basin Research, v. 26, no. 1, p.
85–105, doi:10.1111/bre.12044.
Mark, N. J., N. Schofield, S. Pugliese, D. Watson, S. Holford, D. Muirhead, R. Brown, and D.
Healy, 2017, Igneous intrusions in the Faroe Shetland basin and their implications for
hydrocarbon exploration; new insights from well and seismic data: Marine and Petroleum
Geology, no. November, doi:10.1016/j.marpetgeo.2017.12.005.
McLean, C. E., N. Schofield, D. J. Brown, D. W. Jolley, and A. Reid, 2017, 3D seismic imaging of
the shallow plumbing system beneath the Ben Nevis Monogenetic Volcanic Field: Faroe–
Shetland Basin: Journal of the Geological Society, v. 174, no. 3, p. 468–485,
doi:10.1144/jgs2016-118.
Miles, A., and J. Cartwright, 2010, Hybrid flow sills: A new mode of igneous sheet intrusion:
Geology, v. 38, no. 4, p. 343–346, doi:10.1130/G30414.1.
Naviset, S., C. K. Morley, D. H. Naghadeh, and J. Ghosh, 2017, Sill emplacement during rifting
and inversion from threedimensional seismic and well data, Phitsanulok Basin, Thailand:
Geosphere, v. 13, no. 6, p. 2017–2040, doi:10.1130/GES01466.1.
Page 21 of 50
https://mc.manuscriptcentral.com/interpretation
Interpretation
123456789101112131415161718192021222324252627282930313233343536373839404142434445464748495051525354555657585960
For Peer Review
Rabbel, O., O. Galland, K. Mair, I. Lecomte, K. Senger, J. B. Spacapan, and R. Manceda, 2018,
From field analogues to realistic seismic modelling : a case study of an oil-producing
andesitic sill complex in the Neuquén Basin , Argentina.
Reynolds, P., N. Schofield, R. J. Brown, and S. P. Holford, 2018, The architecture of submarine
monogenetic volcanoes – insights from 3D seismic data: Basin Research, v. 30, p. 437–451,
doi:10.1111/bre.12230.
Sarkar, S., and K. J. Marfurt, 2017, Effect of volcanic bodies on hydrocarbon reservoirs in the
northeastern part of the Chicontepec Foredeep, Mexico: Interpretation, v. 5, no. 3, p. SK1-
SK10, doi:10.1190/INT-2016-0110.1.
Schmiedel, T., S. Kjoberg, S. Planke, C. Magee, O. Galland, N. Schofield, C. A.-L. Jackson, and D.
A. Jerram, 2017, Mechanisms of overburden deformation associated with the
emplacement of the Tulipan sill, mid-Norwegian margin: Interpretation, v. 5, no. 3, p.
SK23-SK38, doi:10.1190/INT-2016-0155.1.
Schofield, N. et al., 2017, Regional magma plumbing and emplacement mechanisms of the
Faroe-Shetland Sill Complex: implications for magma transport and petroleum systems
within sedimentary basins: Basin Research, v. 29, no. 1, p. 41–63, doi:10.1111/bre.12164.
Senger, K., J. Millett, S. Planke, K. Ogata, C. H. Eide, M. Festøy, O. Galland, and D. A. Jerram,
2017, Effects of igneous intrusions on the petroleum system: a review: First Break, v. 35,
no. 6, p. 47–56, doi:10.3997/1365-2397.2017011.
Thomson, K., 2007, Determining magma flow in sills, dykes and laccoliths and their implications
Page 22 of 50
https://mc.manuscriptcentral.com/interpretation
Interpretation
123456789101112131415161718192021222324252627282930313233343536373839404142434445464748495051525354555657585960

For Peer Review
for sill emplacement mechanisms: Bulletin of Volcanology, v. 70, no. 2, p. 183–201,
doi:10.1007/s00445-007-0131-8.
AKNOWLEDGMENTS
We would like to thank New Zealand Petroleum and Minerals and specifically Hamish
Cameron for his friendly support in providing the Akira and Kora 3D seismic surveys to OU for
use in research and education. Financial support for this effort is provided by the sponsors of
the Attribute-Assisted Seismic Processing and Interpretation (AASPI) Consortium at the
University of Oklahoma. We thank our colleagues, David Lubo, Gabriel Machado, and Justin
McDonald for their valuable input and suggestions. We would also like to thank Dr. Christopher
Jackson, for his insightful comments. All the 3D seismic displays were made using licenses of
Petrel provided to the University of Oklahoma for research and education courtesy of
Schlumberger. We also would like to thank Elizabeth Da Silva for her time and dedication with
the interpretation of the Kora horizon, Andreina Liborius for her QC in the interpretation, Dr.
Stephen Schutter and Dr. Henry Posamentier for their excellent feedback and kind support,
Simon Holdford, Niall Mark, Peter Reynolds, Nick Schofield, Fathiyah Jamaludin, and Luis
Vernengo for granting permission to use their figures.
Page 23 of 50
https://mc.manuscriptcentral.com/interpretation
Interpretation
123456789101112131415161718192021222324252627282930313233343536373839404142434445464748495051525354555657585960

For Peer Review
Figure Captions
Figure 1. Exploration well drilling into mafic igneous sills, Seismic data courtesy of PGS.
Reprinted from Igneous intrusions in the Faroe Shetland basin and their implications for
hydrocarbon exploration; new insights from well and seismic data, In Press N.J. Mark, N.
Schofield, S. Pugliese, D. Watson, S. Holford D. Muirhead R. Brown D. Healy,1-21, Copyright (2017),
with permission from Elsevier.
Figure 2. Envelope attributes in time slices and amplitude vertical section showing development
wells drilled into channel-like features. The wells ended up drilling basaltic lava flows that were
confined to meander valleys. Figure Courtesy of Luis Vernengo, Pan American Petroleum.
Figure 3. Vertical amplitude sections showing exploration wells drilling into mound-like
features. The wells drilling a basaltic volcano rather than a carbonate buildup. Map on bottom
left is the top of the volcanic units. Notice the dome-like shape. After Reynolds et al., 2017.
Figure 4. a) location map of New Zealand showing Taranaki Basin and the size and distribution
of the Mohakatino Volcanic Belt (MVB) in red. b) Onshore younger andesitic volcanoes and 3D
seismic sections showing Kora Volcano. After Giba et al., 2013 and Bischoff et al., 2017.
Page 24 of 50
https://mc.manuscriptcentral.com/interpretation
Interpretation
123456789101112131415161718192021222324252627282930313233343536373839404142434445464748495051525354555657585960

For Peer Review
Figure 5. Seismic section from P95 2D seismic Survey showing Well Tua-Tua-1 drilling an
andesitic volcano; the Tua-Tua-1 Volcano. Projected. Seismic data courtesy of NZP&M
Figure 6. Seismic section from P95 seismic survey showing well Manga-1 drilling an andesitic
volcano; the Manga Volcano. Seismic data courtesy of NZP&M.
Figure 7. Seismic section from P95 Survey showing well Te Kumi-1 drilling an andesitic volcano;
Te-Kumi Volcano. Seismic data courtesy of NZP&M.
Figure 8. Signal/ratio comparison between: a) legacy 2D ES-89 seismic survey and b) modern
3D Kora 3D PSTM 2006 seismic survey. Notice the higher quality image of the Kora volcano
compared to the Manga volcano. Seismic data courtesy of NZP&M.
Figure 9. Seismic section from P95 Seismic survey showing multiple un-drilled mound-like
structures interpreted as andesitic volcanoes.
Seismic data courtesy of NZP&M.
Figure 10. Seismic section from Kora 3D seismic survey showing the Kora volcano and the uplift
of the reflectors beneath the edifice as well as the disruption of the reflectors (shadow zone).
Seismic data courtesy of NZP&M.
Figure 11. Seismic section from the Kora 3D seismic survey showing interpreted saucer-shaped
sills intruding into the Paleocene Waipawa marine source rock and possibly creating an atypical
petroleum system like the one proposed by Del Pino and Bermudez (2009). After Infante-Paez
and Marfurt 2017. Seismic data courtesy of NZP&M.
Page 25 of 50
https://mc.manuscriptcentral.com/interpretation
Interpretation
123456789101112131415161718192021222324252627282930313233343536373839404142434445464748495051525354555657585960

For Peer Review
Figure.12. Map view of envelope attribute in a co-rendered window of 250ms showing spatial
distribution of Igneous sills around Kora. after Infante-Paez and Marfurt 2017.
Seismic data courtesy of NZP&M
Figure 13. Seismic sections from Kora 3D seismic survey illustrating different mechanisms of
forced folds: a) Post- emplacement and b) Syn-emplacement. Yellow arrows point to the sills,
green arrows to the forced folds and the grey arrow points to a sill complex with no evidence of
forced folding. Seismic data courtesy of NZP&M.
Figure 14 Seismic sections from Kora 3D survey showing interpreted igneous sills below the
Kora volcano and a sub vertical low signal/noise zone above the sills (Dotted reddish lines).
Note the small-scale mound-cone structures on the flanks of Kora. a) and b) show different
orientations. Yellow arrows point to the sills whereas reddish arrow point to the small cones.
The Dotted reddish line represents the dykes and laccoliths. Seismic data courtesy of NZP&M.
Figure 15. Map view of a) Coherency and b) Dip magnitude attributes extracted close to the top
of the Kora volcano. Reddish arrows point to small circular features in both attributes that
represent the small cones. Yellow dotted line in the insert figure represents a reflector close to
the base of Kora. Radial low Coherency are normal faults. Seismic data courtesy of NZP&M.
Figure 16. Geomorphology of igneous bodies. Vertical amplitude sections and horizon slices
showing envelope attribute. In each of the four panels there are igneous bodies. Can you guess
correctly which one they are? a) Hybrid igneous flow. b) clastic channelized turbidities from
Parihaka 3D, seismic survey courtesy of NZP&M c) Igneous volcano (andesitic? from Akira 2D,
seismic survey courtesy of NZP&M d) Carbonate build- up. e) andesitic volcanoes from Parihaka
Page 26 of 50
https://mc.manuscriptcentral.com/interpretation
Interpretation
123456789101112131415161718192021222324252627282930313233343536373839404142434445464748495051525354555657585960

For Peer Review
3D, seismic survey courtesy of NZP&M f) Jurassic-Early Cretaceous carbonate platform, from:
https://www.geoexpro.com/articles/2015/07/offshore-senegal-sud-profond-3d-illustrates-
potential April 10th, 2018. g) bright spot (gas sand?) from Parihaka 3D, seismic survey courtesy
of NZP&M. h) igneous sill, from Kora 3D, seismic survey courtesy of NZP&M.
Figure 17 a) b) and c) Different seismic amplitude sections from Akira 2D seismic survey
showing mound-like structures (yellow arrows) with similar geometry to the ones in Bass, Basin
Australia in Figure 24. Red arrows represent clues for in-context interpretation. Seismic data
courtesy of NZP&M.
Figure 18. In-context interpretation analogy. Former U.S.A leader headshot captured from
National Geographic TV show: “Brain Games”.
Figure 19. In-context interpretation suggest the mound-like features are Volcanoes. Seismic
data courtesy of NZP&M.
Figure 20. Biased interpretation suggests the mound-like features are carbonate build-ups.
Seismic data courtesy of NZP&M.
Figure 21. Propose In-Context Interpretation Workflow.
Page 27 of 50
https://mc.manuscriptcentral.com/interpretation
Interpretation
123456789101112131415161718192021222324252627282930313233343536373839404142434445464748495051525354555657585960

For Peer Review
Page 28 of 50
https://mc.manuscriptcentral.com/interpretation
Interpretation
123456789101112131415161718192021222324252627282930313233343536373839404142434445464748495051525354555657585960
For Peer Review
Figure 1
Page 29 of 50
https://mc.manuscriptcentral.com/interpretation
Interpretation
123456789101112131415161718192021222324252627282930313233343536373839404142434445464748495051525354555657585960

For Peer Review
Figure 2
Page 30 of 50
https://mc.manuscriptcentral.com/interpretation
Interpretation
123456789101112131415161718192021222324252627282930313233343536373839404142434445464748495051525354555657585960

For Peer Review
Figure 3
Page 31 of 50
https://mc.manuscriptcentral.com/interpretation
Interpretation
123456789101112131415161718192021222324252627282930313233343536373839404142434445464748495051525354555657585960

For Peer Review
Figure 4
Page 32 of 50
https://mc.manuscriptcentral.com/interpretation
Interpretation
123456789101112131415161718192021222324252627282930313233343536373839404142434445464748495051525354555657585960

For Peer Review
Figure 5
Page 33 of 50
https://mc.manuscriptcentral.com/interpretation
Interpretation
123456789101112131415161718192021222324252627282930313233343536373839404142434445464748495051525354555657585960

For Peer Review
Figure 6
Page 34 of 50
https://mc.manuscriptcentral.com/interpretation
Interpretation
123456789101112131415161718192021222324252627282930313233343536373839404142434445464748495051525354555657585960
For Peer Review
Figure 7
Page 35 of 50
https://mc.manuscriptcentral.com/interpretation
Interpretation
123456789101112131415161718192021222324252627282930313233343536373839404142434445464748495051525354555657585960
For Peer Review
Figure 8
Page 36 of 50
https://mc.manuscriptcentral.com/interpretation
Interpretation
123456789101112131415161718192021222324252627282930313233343536373839404142434445464748495051525354555657585960

For Peer Review
Figure 9
Page 37 of 50
https://mc.manuscriptcentral.com/interpretation
Interpretation
123456789101112131415161718192021222324252627282930313233343536373839404142434445464748495051525354555657585960

For Peer Review
Figure 10
Page 38 of 50
https://mc.manuscriptcentral.com/interpretation
Interpretation
123456789101112131415161718192021222324252627282930313233343536373839404142434445464748495051525354555657585960

For Peer Review
Figure 11
Page 39 of 50
https://mc.manuscriptcentral.com/interpretation
Interpretation
123456789101112131415161718192021222324252627282930313233343536373839404142434445464748495051525354555657585960

For Peer Review
Figure 12
Page 40 of 50
https://mc.manuscriptcentral.com/interpretation
Interpretation
123456789101112131415161718192021222324252627282930313233343536373839404142434445464748495051525354555657585960
For Peer Review
Figure 13
Page 41 of 50
https://mc.manuscriptcentral.com/interpretation
Interpretation
123456789101112131415161718192021222324252627282930313233343536373839404142434445464748495051525354555657585960
For Peer Review
Figure 14
Page 42 of 50
https://mc.manuscriptcentral.com/interpretation
Interpretation
123456789101112131415161718192021222324252627282930313233343536373839404142434445464748495051525354555657585960

For Peer Review
Figure 15
Page 43 of 50
https://mc.manuscriptcentral.com/interpretation
Interpretation
123456789101112131415161718192021222324252627282930313233343536373839404142434445464748495051525354555657585960

For Peer Review
Figure 16
Page 44 of 50
https://mc.manuscriptcentral.com/interpretation
Interpretation
123456789101112131415161718192021222324252627282930313233343536373839404142434445464748495051525354555657585960

For Peer Review
Figure 17
Page 45 of 50
https://mc.manuscriptcentral.com/interpretation
Interpretation
123456789101112131415161718192021222324252627282930313233343536373839404142434445464748495051525354555657585960

For Peer Review
Figure 18
Page 46 of 50
https://mc.manuscriptcentral.com/interpretation
Interpretation
123456789101112131415161718192021222324252627282930313233343536373839404142434445464748495051525354555657585960
For Peer Review
Figure 19
Page 47 of 50
https://mc.manuscriptcentral.com/interpretation
Interpretation
123456789101112131415161718192021222324252627282930313233343536373839404142434445464748495051525354555657585960
For Peer Review
Figure 20
Figure 21
Page 48 of 50
https://mc.manuscriptcentral.com/interpretation
Interpretation
123456789101112131415161718192021222324252627282930313233343536373839404142434445464748495051525354555657585960

For Peer Review
Scavenger hunt the
geological target on
seismic data
Define exploration
target
Do seismic
data show
geometry of
the geological
target?
Define exploration
target
Do seismic
data show
geometry of
the geological
target?
Scavenger hunt the
geological target on
seismic data
Yes
NoNo
Yes
Perform In context
interpretation
Does
geometry of
geological
target match
the context?
Expected target
drilled
YesUnexpected target
drilled
Propose exploration
well
Propose exploration
well
No
Simplified typical exploration
well proposal workflowRecommended workflow
Do not Propose
exploration well
Page 49 of 50
https://mc.manuscriptcentral.com/interpretation
Interpretation
123456789101112131415161718192021222324252627282930313233343536373839404142434445464748495051525354555657585960

For Peer Review
Page 50 of 50
https://mc.manuscriptcentral.com/interpretation
Interpretation
123456789101112131415161718192021222324252627282930313233343536373839404142434445464748495051525354555657585960