Embed Size (px)
Citation preview
1
ABN: 66 000 375 048
Appendix 4E: Preliminary Final Report
For the 12 months ended 30 June 2015
Released 31 August 2015
This report comprises information given to the ASX under listing rule 4.3
For
per
sona
l use
onl
y
ASPERMONT LIMITED AND ITS CONTROLLED ENTITIES 30 JUNE 2015
Preliminary Final Report
2
CONTENTS
Corporate Directory 3
Commentary on Results 4
Consolidated Income Statement 7
Consolidated Statement of Comprehensive Income 8
Consolidated Statement of Financial Position 9
Consolidated Statement of Changes in Equity 10
Consolidated Statement of Cash Flows 11
Notes to the Consolidated Financial Statements 12
For
per
sona
l use
onl
y
ASPERMONT LIMITED AND ITS CONTROLLED ENTITIES 30 JUNE 2015
Corporate Directory
3
Directors Solicitors
Andrew Leslie Kent Williams and Hughes
Charbel Nader Level 1, 25 Richardson Street
John Stark West Perth WA 6005
Lewis George Cross
Colm O’Brien Auditors
Alex Kent BDO Audit (WA) Pty Ltd
Rhoderic Whyte 38 Station Street
Subiaco WA 6008
Company Secretary
John Detwiler Share Registry
Advanced Share Registry Services
Key Management Personnel 110 Stirling Hwy
Alex Kent – Managing Director Nedlands WA 6009
Matthew Howes – Chief Financial Officer, Group
Robin Booth – General Manager Publishing Bankers
Ajit Patel – Chief Operating Officer, Group ANZ Banking Group Limited
Chris Maybury - Executive Chairman Beacon Events 7/77 St Georges Terrace
Perth WA 6000
Registered Office
613-619 Wellington St Australian Stock Exchange Limited
Perth WA 6000 ASX Code : ASP
Telephone: (08) 6263 9100
Facsimile: (08) 6263 9148 Website
www.aspermont.com
Postal Address
PO Box 78
Leederville WA 6902
For
per
sona
l use
onl
y
ASPERMONT LIMITED AND ITS CONTROLLED ENTITIES
Commentary on Results for the year ended 30 June 2015
4
The directors are pleased to report on the preliminary results for the year ended 30 June 2015. Key points to the year include:
The group has continued to progress with its transformation, particularly in publishing with
centralisation of IT, Production and Marketing including the centralisation of the head office
function in London;
As part of this transformation we are undertaking a strategic restructuring of our overall cost
base and core product offering to deliver more sustainable outcomes to shareholders in the
future;
The annual results include a prudent $8.5 million intangible impairment charge related to the
goodwill recorded for the print and events businesses;
The Events division has now under performed for three years against the prior years and
budgeted plans. We anticipate appointing a new CEO for the division, and resolving the
minority shareholders issues in this business. Once this occurs we anticipate a recovery in the
performance of the business;
Overall decrease in revenue year on year was 17% ($6.2m), this decrease is primarily
attributable to the Events and Print publishing divisions;
Digital revenues have conversely grown 11% ($0.54m) over the period;
EBITDA continues to remain under pressure, due to the revenue decline and the fixed cost base
in the Events and Publishing business units;
We are nearing completion of the of the restructure of the Publishing business;
Year on year Media EBITDA declined from a loss of $0.8 million to a loss of $3.1 million. This
includes approximately $350k of one-time restructuring costs related to the reduction of our
workforce by 15-20 staff.
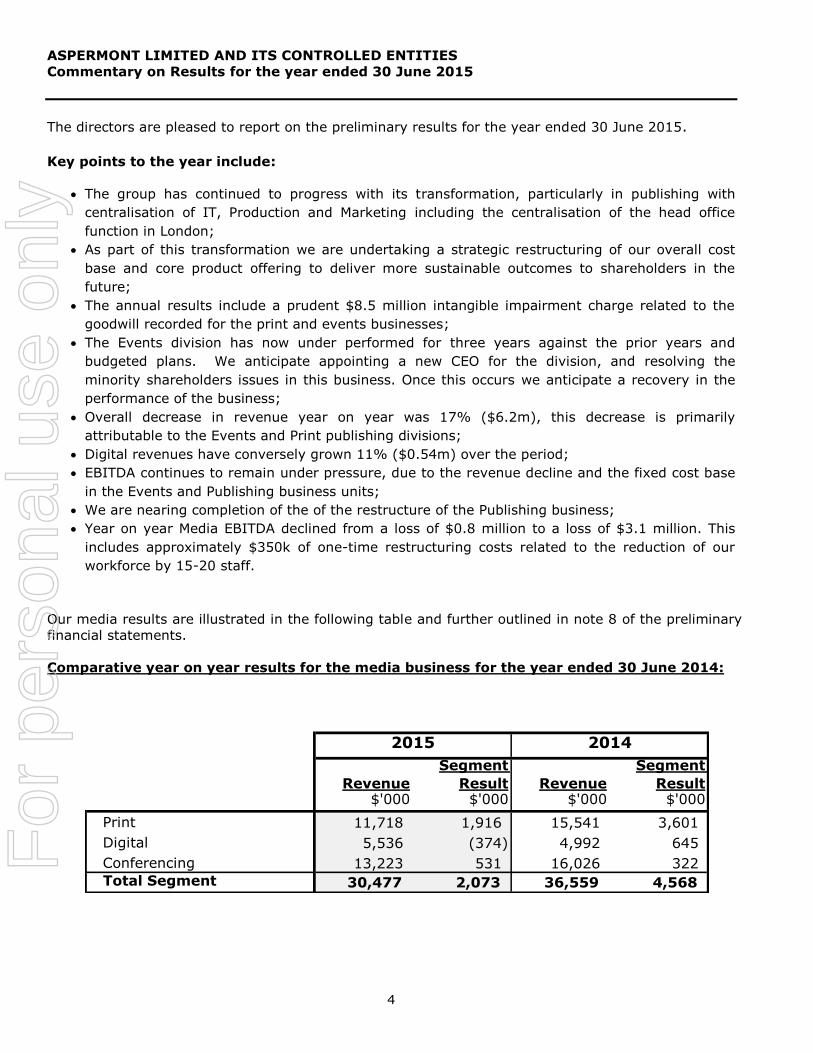
Our media results are illustrated in the following table and further outlined in note 8 of the preliminary
financial statements.
Comparative year on year results for the media business for the year ended 30 June 2014:
Revenue
Segment
Result Revenue
Segment
Result$'000 $'000 $'000 $'000
Print 11,718 1,916 15,541 3,601
Digital 5,536 (374) 4,992 645
Conferencing 13,223 531 16,026 322
Total Segment 30,477 2,073 36,559 4,568
2015 2014
For
per
sona
l use
onl
y
ASPERMONT LIMITED AND ITS CONTROLLED ENTITIES
Commentary on Results for the year ended 30 June 2015
5
Outlook for the upcoming 2015/2016 year
We expect continuity in existing market conditions for the upcoming year, so whilst we are
anticipating relatively flat revenue growth, a return to profit is anticipated through the reshaping of
the business. As the current cost cutting and rationalisation phase yields results, the business will
focus on our iconic industry brands and further development of higher value digital and recurring
subscription revenue streams.
The complete overhaul of our legacy systems (namely Project Horizon), is scheduled to conclude in
December 2015. Currently 3 of our 10 key brands have fully migrated over to the full platform with a
further 3 migrations coming through this month. From a subscription systems perspective we have
now successfully moved the entire portfolio onto the new platform.
The Company has new management in place at every regional location - we are confident they are
capable to deliver on the business plan.
UK Publishing, having implemented its new process and technology framework last year, is well
placed to build on its performance from last year and generate the largest growth for the Group. It
has provided a blueprint for the roll out to other areas.
The Australian publishing recovery is underway and recent cost restructuring in that business unit will
show markedly improved margin over the next period. Australia’s technology development path is
also following the UK track over the upcoming year.
After a number of years of underperformance, our Events business looks forward to the introduction
of a new CEO and management team and a wholesale transformation of its back office functions
similar to what has been undertaken and achieved in our publishing divisions over the last twelve
months. The new CEO will also have significant focus on developing new event revenue streams. The
ability to transform our Events business remains subject to difficulties created by the involvement of
minority shareholders who have been historically involved in the management of the business.
At the executive level we have been able to achieve significant cuts in headcount and cost by
streamlining and centralising Executive management of the business in the UK.
The development of new automated marketing solutions – enabled by our new technology platform –
is resulting in improved client acquisition, engagement and retention performance in our subscription
processes. This year the UK business generated over 30% of its new subscriptions revenue through
its marketing systems and turned an otherwise perennial cost centre into a significant profit driver.
We expect to see the next wave of enhancement and innovation driving performance this year.
Strong growth in the subscriptions income of the business is core to the company’s mid-term strategy
of delivering more stable revenue. Subscription revenues also act as key drivers of our premium
advertising and events revenue streams.
Based on our plans we expect that print advertising will only represent 25% of overall revenues,
further mitigating our exposure to that segment of the industry.
Rationalisation and consolidation of support services including IT, marketing, and production, will
drive greater efficiency in the delivery of our products.
For
per
sona
l use
onl
y
ASPERMONT LIMITED AND ITS CONTROLLED ENTITIES
Commentary on Results for the year ended 30 June 2015
6
Going Concern Disclosure
At 30 June 2015 and at the date of this report the Company is in the midst of further capital raising
activities to add further working capital to the balance sheet. The Company is targeting a total
amount of approximately $0.8 million that will likely be in the form of convertible debentures.
The funds raised and actions taken will reduce the Company’s debt exposure for the incoming
financial year and provide working capital to accelerate the repositioning of the business.
The Company’s bank debt with the Australian and New Zealand Banking Corporation (“ANZ”) is
secured by registered company charges and fixed and floating charges over the assets of the
consolidated entity. The facility is subject to annual review with the next review date on 30
September 2015.
At the current time the Company is in breach of the financial covenants of the facility for the
calculation of the Senior Debt to EBITDA (earnings before interest, taxes, depreciation and
amortisation) ratio and the minimum EBITDA and revenue on a year to date basis. As a consequence
the debt has been classified as current.
The Company is in regular communications with ANZ to restructure the facility. The bank is
supportive of the Company’s capital raising activities. There are no matters existing to indicate that
the Company will be unable to successfully restructure the facility.
Yours sincerely,
Alexander Kent
Managing Director
For
per
sona
l use
onl
y
ASPERMONT LIMITED AND ITS CONTROLLED ENTITIES
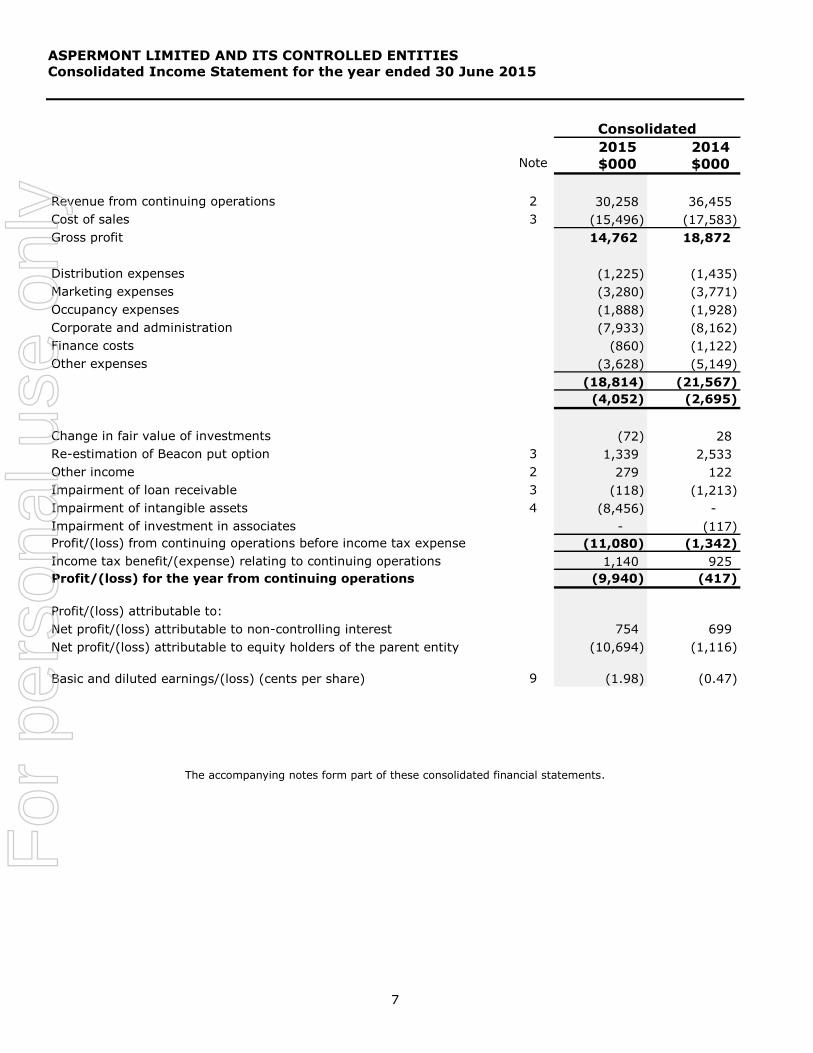
Consolidated Income Statement for the year ended 30 June 2015
7
2015 2014 Note $000 $000
Revenue from continuing operations 2 30,258 36,455
Cost of sales 3 (15,496) (17,583)
Gross profit 14,762 18,872
Distribution expenses (1,225) (1,435)
Marketing expenses (3,280) (3,771)
Occupancy expenses (1,888) (1,928)
Corporate and administration (7,933) (8,162)
Finance costs (860) (1,122)
Other expenses (3,628) (5,149)
(18,814) (21,567)
(4,052) (2,695)
Change in fair value of investments (72) 28
Re-estimation of Beacon put option 3 1,339 2,533
Other income 2 279 122
Impairment of loan receivable 3 (118) (1,213)
Impairment of intangible assets 4 (8,456) -
Impairment of investment in associates - (117)
Profit/(loss) from continuing operations before income tax expense (11,080) (1,342)
Income tax benefit/(expense) relating to continuing operations 1,140 925
Profit/(loss) for the year from continuing operations (9,940) (417)
Profit/(loss) attributable to:
Net profit/(loss) attributable to non-controlling interest 754 699
Net profit/(loss) attributable to equity holders of the parent entity (10,694) (1,116)
Basic and diluted earnings/(loss) (cents per share) 9 (1.98) (0.47)
Consolidated
The accompanying notes form part of these consolidated financial statements.
For
per
sona
l use
onl
y
ASPERMONT LIMITED AND ITS CONTROLLED ENTITIES
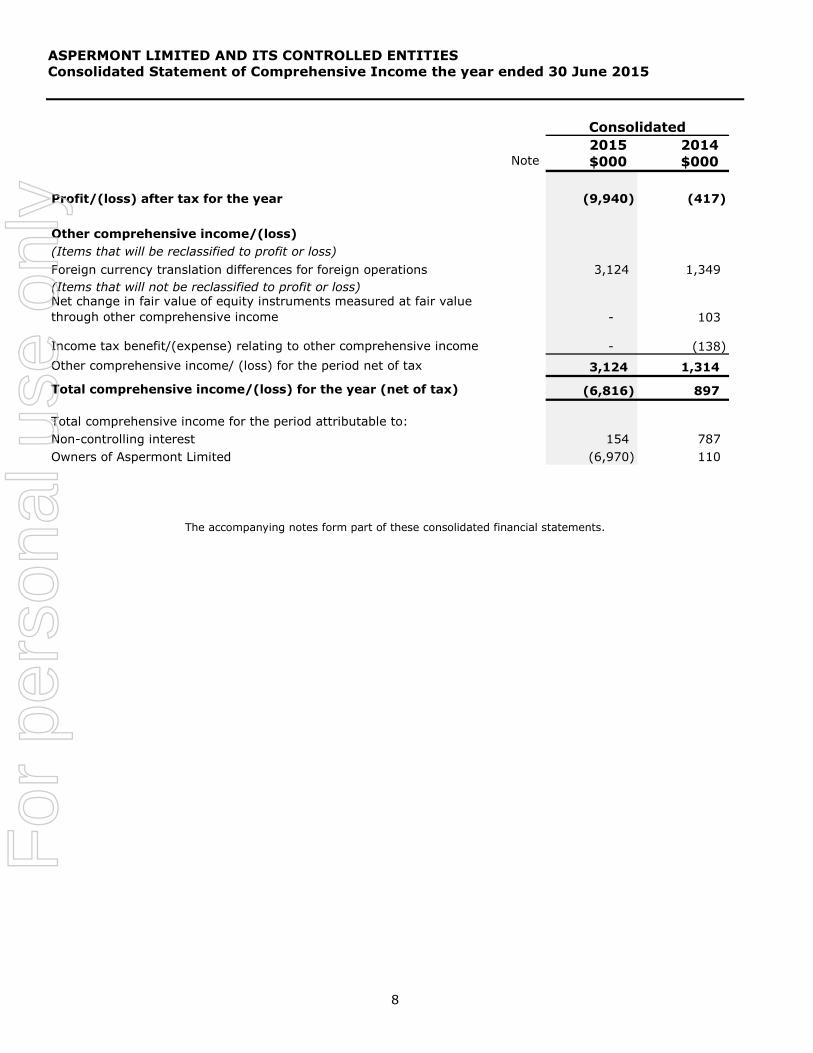
Consolidated Statement of Comprehensive Income the year ended 30 June 2015
8
2015 2014 Note $000 $000
Profit/(loss) after tax for the year (9,940) (417)
Other comprehensive income/(loss)
(Items that will be reclassified to profit or loss)
Foreign currency translation differences for foreign operations 3,124 1,349
(Items that will not be reclassified to profit or loss)Net change in fair value of equity instruments measured at fair value
through other comprehensive income - 103
Income tax benefit/(expense) relating to other comprehensive income - (138)
Other comprehensive income/ (loss) for the period net of tax 3,124 1,314
Total comprehensive income/(loss) for the year (net of tax) (6,816) 897
Total comprehensive income for the period attributable to:
Non-controlling interest 154 787
Owners of Aspermont Limited (6,970) 110
Consolidated
The accompanying notes form part of these consolidated financial statements.
For
per
sona
l use
onl
y
ASPERMONT LIMITED AND ITS CONTROLLED ENTITIES
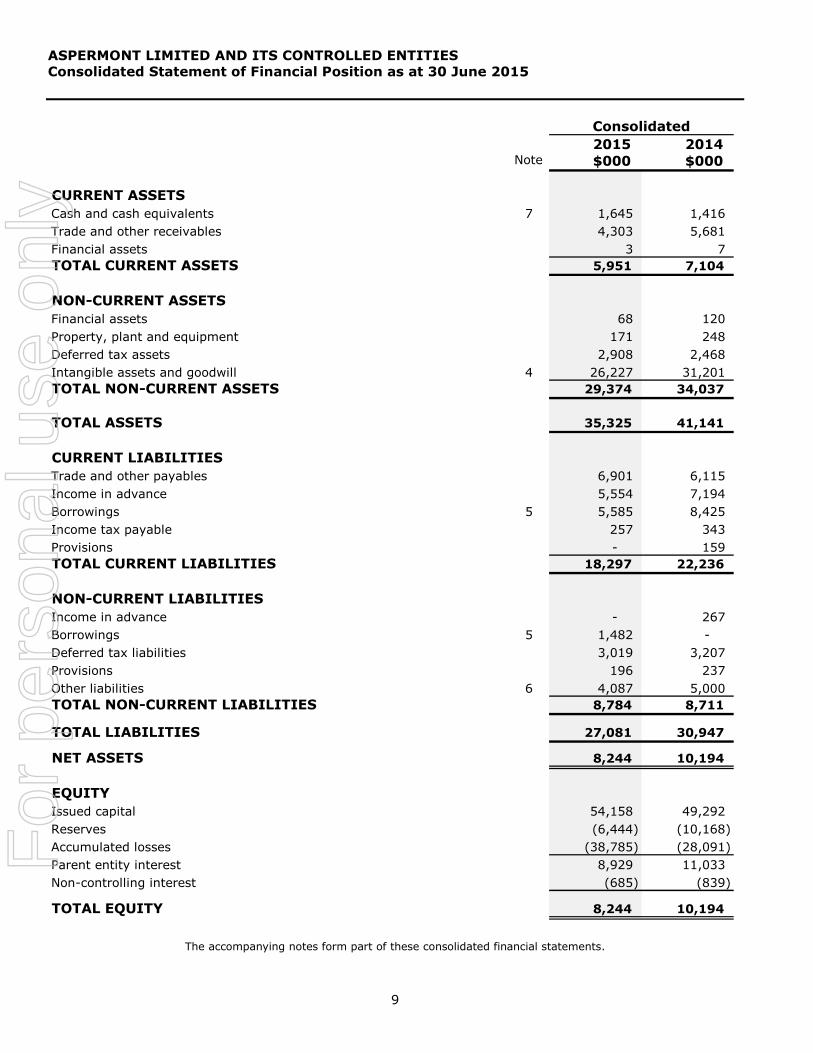
Consolidated Statement of Financial Position as at 30 June 2015
9
2015 2014 Note $000 $000
CURRENT ASSETS
Cash and cash equivalents 7 1,645 1,416
Trade and other receivables 4,303 5,681
Financial assets 3 7
TOTAL CURRENT ASSETS 5,951 7,104
NON-CURRENT ASSETS
Financial assets 68 120
Property, plant and equipment 171 248
Deferred tax assets 2,908 2,468
Intangible assets and goodwill 4 26,227 31,201
TOTAL NON-CURRENT ASSETS 29,374 34,037
TOTAL ASSETS 35,325 41,141
CURRENT LIABILITIES
Trade and other payables 6,901 6,115
Income in advance 5,554 7,194
Borrowings 5 5,585 8,425
Income tax payable 257 343
Provisions - 159
TOTAL CURRENT LIABILITIES 18,297 22,236
NON-CURRENT LIABILITIES
Income in advance - 267
Borrowings 5 1,482 -
Deferred tax liabilities 3,019 3,207
Provisions 196 237
Other liabilities 6 4,087 5,000
TOTAL NON-CURRENT LIABILITIES 8,784 8,711
TOTAL LIABILITIES 27,081 30,947
NET ASSETS 8,244 10,194
EQUITY
Issued capital 54,158 49,292
Reserves (6,444) (10,168)
Accumulated losses (38,785) (28,091)
Parent entity interest 8,929 11,033
Non-controlling interest (685) (839)
TOTAL EQUITY 8,244 10,194
Consolidated
The accompanying notes form part of these consolidated financial statements.
For
per
sona
l use
onl
y
ASPERMONT LIMITED AND ITS CONTROLLED ENTITIES
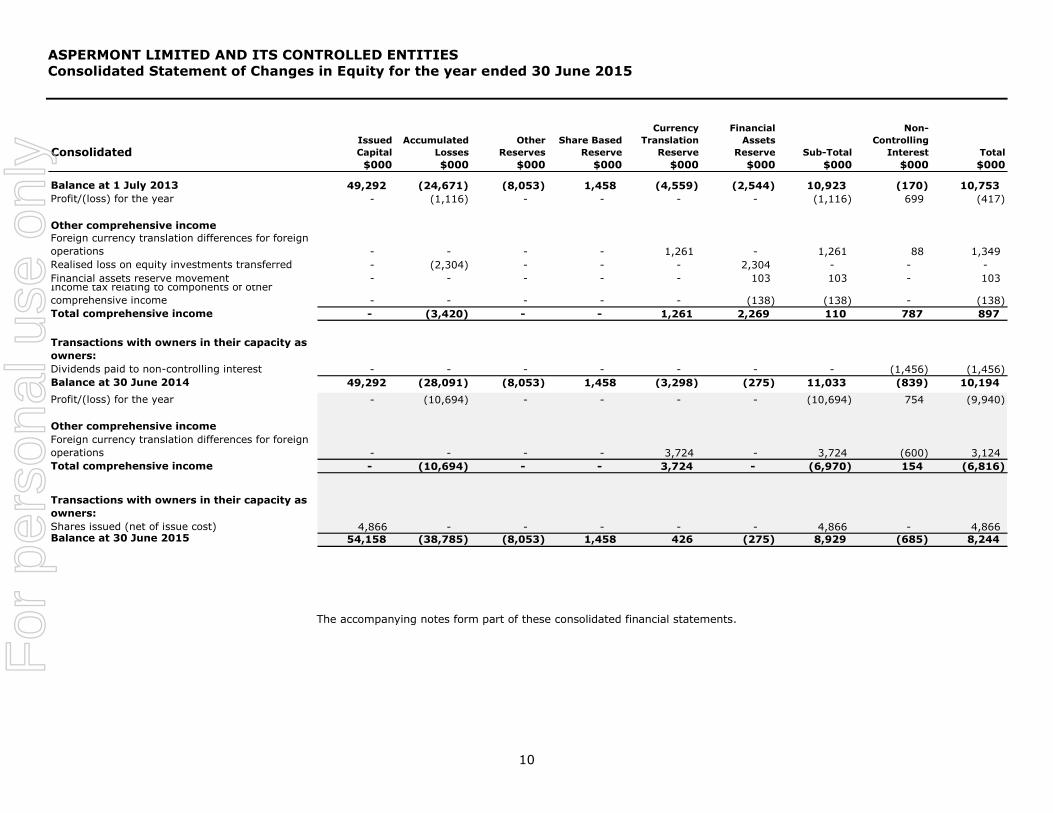
Consolidated Statement of Changes in Equity for the year ended 30 June 2015
10
Consolidated Issued
Capital
Accumulated
Losses
Other
Reserves
Share Based
Reserve
Currency
Translation
Reserve
Financial
Assets
Reserve Sub-Total
Non-
Controlling
Interest Total
$000 $000 $000 $000 $000 $000 $000 $000 $000
Balance at 1 July 2013 49,292 (24,671) (8,053) 1,458 (4,559) (2,544) 10,923 (170) 10,753
Profit/(loss) for the year - (1,116) - - - - (1,116) 699 (417)
Other comprehensive income
Foreign currency translation differences for foreign
operations - - - - 1,261 - 1,261 88 1,349
Realised loss on equity investments transferred - (2,304) - - - 2,304 - - -
Financial assets reserve movement - - - - - 103 103 - 103 Income tax relating to components of other
comprehensive income - - - - - (138) (138) - (138)
Total comprehensive income - (3,420) - - 1,261 2,269 110 787 897
Transactions with owners in their capacity as
owners:
Dividends paid to non-controlling interest - - - - - - - (1,456) (1,456)
Balance at 30 June 2014 49,292 (28,091) (8,053) 1,458 (3,298) (275) 11,033 (839) 10,194
Profit/(loss) for the year - (10,694) - - - - (10,694) 754 (9,940)
Other comprehensive income
Foreign currency translation differences for foreign
operations - - - - 3,724 - 3,724 (600) 3,124
Total comprehensive income - (10,694) - - 3,724 - (6,970) 154 (6,816)
Transactions with owners in their capacity as
owners:
Shares issued (net of issue cost) 4,866 - - - - - 4,866 - 4,866 Balance at 30 June 2015 54,158 (38,785) (8,053) 1,458 426 (275) 8,929 (685) 8,244
The accompanying notes form part of these consolidated financial statements.
For
per
sona
l use
onl
y
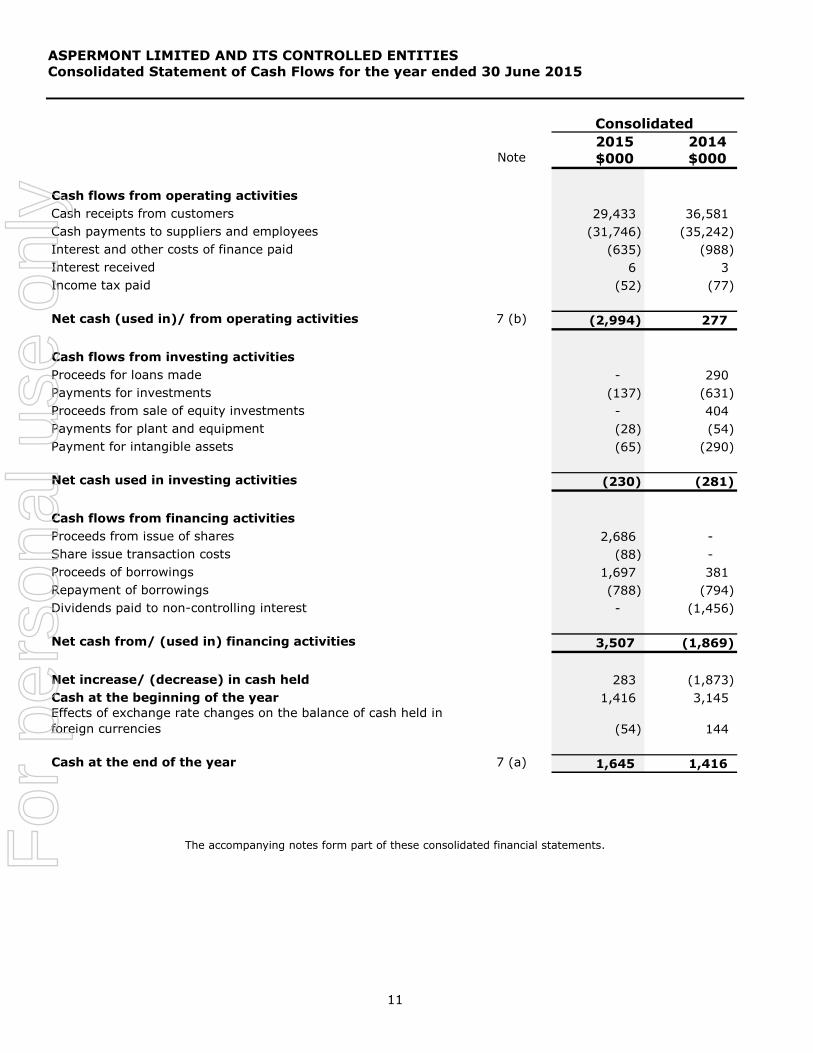
ASPERMONT LIMITED AND ITS CONTROLLED ENTITIES
Consolidated Statement of Cash Flows for the year ended 30 June 2015
11
2015 2014 Note $000 $000
Cash flows from operating activities
Cash receipts from customers 29,433 36,581
Cash payments to suppliers and employees (31,746) (35,242)
Interest and other costs of finance paid (635) (988)
Interest received 6 3
Income tax paid (52) (77)
Net cash (used in)/ from operating activities 7 (b) (2,994) 277
Cash flows from investing activities
Proceeds for loans made - 290
Payments for investments (137) (631)
Proceeds from sale of equity investments - 404
Payments for plant and equipment (28) (54)
Payment for intangible assets (65) (290)
Net cash used in investing activities (230) (281)
Cash flows from financing activities
Proceeds from issue of shares 2,686 -
Share issue transaction costs (88) -
Proceeds of borrowings 1,697 381
Repayment of borrowings (788) (794)
Dividends paid to non-controlling interest - (1,456)
Net cash from/ (used in) financing activities 3,507 (1,869)
Net increase/ (decrease) in cash held 283 (1,873)
Cash at the beginning of the year 1,416 3,145
Effects of exchange rate changes on the balance of cash held in
foreign currencies (54) 144
Cash at the end of the year 7 (a) 1,645 1,416
Consolidated
The accompanying notes form part of these consolidated financial statements. For
per
sona
l use
onl
y
ASPERMONT LIMITED AND ITS CONTROLLED ENTITIES
Notes to the Consolidated Financial Statements for the year ended 30 June 2015
12
1. Significant accounting policies
Basis of Preparation
The Appendix 4E – Preliminary Final Report has been prepared in accordance with ASX Listing
Rule 4.3A and the disclosure requirements of ASX Appendix 4E. The report has been prepared in
accordance with Accounting Standards, Urgent Issues Group Consensus Views, other
authoritative pronouncements of the Australian Accounting Standards Board and the Corporations
Act 2001.
Where required by accounting standards comparative figures have been adjusted to conform with
changes in presentation for the current financial year. The accounting policies have been
consistently applied by the consolidated entity and, except where there has been a change in
accounting policy, are consistent with those of the previous year.
The preliminary final report does not include full disclosures of the type normally included in the
annual financial report. It is recommended that this report be read in conjunction with the annual
financial report for the year ended 30 June 2014, the 31 December 2014 half year report, and
any public announcements made by Aspermont Limited during the financial year.
Accounting Policies
(a) Principles of Consolidation
The consolidated accounts comprise the accounts of Aspermont Limited (the “Company”) and all
of its controlled entities (the “Group”). A controlled entity is any entity that Aspermont has the
power to control the financial and operating policies of so as to obtain benefits from its activities.
A list of controlled entities is contained in the notes to the full year accounts. All inter-company
balances and transactions between entities in the economic entity, including any unrealised
profits or losses, have been eliminated on consolidation. Where controlled entities have entered
or left the economic entity during the year, their operating results have been included from the
date control was obtained or until the date control ceased. Outside interests in the equity and
results of the entities that are controlled are shown as a separate item in the consolidated
accounts.
(b) Intangible Assets
Goodwill
Goodwill and goodwill on consolidation are initially recorded at the amount by which the purchase
price for a business exceeds the fair value attributed to its net assets at date of acquisition.
Goodwill is tested annually for impairment and carried at cost less accumulated impairment
losses.
Mastheads
Mastheads acquired separately are capitalised at cost and from a business combination are
capitalised at fair value as at the date of acquisition. Following initial recognition, the cost model
is applied to the class of intangible assets.
Mastheads are tested for impairment where an indicator of impairment exists, and the carrying
amount is reviewed annually by the directors to ensure that it is not in excess of the recoverable
amount. The recoverable amount is assessed based upon the present value of expected future
cash flow.
For
per
sona
l use
onl
y
ASPERMONT LIMITED AND ITS CONTROLLED ENTITIES
Notes to the Consolidated Financial Statements for the year ended 30 June 2015
13
(b) Intangible Assets (continued)
IT development and software
Costs incurred in developing products or systems and costs incurred in acquiring software and
licenses that will contribute to future period financial benefits through revenue generation and/or
cost reduction are capitalised to software and systems. Costs capitalised include direct payroll
and payroll related costs of employees time spent on the project. Amortisation is calculated on a
diminishing value basis over periods generally ranging from 3 to 5 years.
IT development costs include only those costs directly attributable to the development phase and
are only recognised following completion of technical feasibility and where the group has an
intention and ability to use the asset.
Intangible assets acquired as part of an acquisition
Intangible assets acquired as part of an acquisition of a business are capitalised separately from
goodwill if the asset is separable or arises from contractual or legal rights, and the fair value can
be measured reliably on initial recognition. Purchased intangible assets are initially recorded at
cost and finite life intangible assets are amortised over their useful economic lives on a straight
line basis.
Where amortisation is calculated on a straight line basis, the following useful lives have been
determined for classes of intangible assets:
Trademarks: 10 years
Customer & Subscription Contracts: 5 years
(c) Borrowings
Borrowings are initially recognised at fair value, net of transaction costs incurred. Borrowings are
subsequently measured at amortised cost. Fees paid on the establishment of loan facilities are
recognised as transaction costs of the loan to the extent that it is probable that some or all of the
facility will be drawn down. Borrowing costs incurred for the construction of any qualifying asset
are capitalised during the period of time that is required to complete and prepare the asset for
intended use or sale. Other borrowing costs are expensed.
Borrowings are classified as current liabilities unless the Group has an unconditional right to defer
settlement of the liability for at least 12 months after reporting date.
(d) Critical accounting estimates and judgments
The directors evaluate estimates and judgments incorporated into the financial report based on
historical knowledge and best available current information. Estimates assume a reasonable
expectation of future events and are based on current trends and economic data, obtained both
externally and within the Group.
Key Estimates — Impairment
The Group assesses impairment at each reporting date by evaluating conditions specific to the
Group that may lead to impairment of assets. Where an impairment trigger exists, the
recoverable amount of the asset is determined.
Value-in-use calculations performed in assessing recoverable amounts incorporate a number of
key estimates. Key assumptions used for value-in-use calculations are disclosed in note 4 (b).
For
per
sona
l use
onl
y
ASPERMONT LIMITED AND ITS CONTROLLED ENTITIES
Notes to the Consolidated Financial Statements for the year ended 30 June 2015
14
(d) Critical accounting estimates and judgments (continued)
Key Estimates — Fair Value of intangible assets acquired in a business combination
The Group has identified intangible values for customer contracts and relationships as well as
trademarks acquired in line with the requirements of AASB3. These assets will be amortised over
a useful life of 5 and 10 years, respectively.
Key Estimates — Re-estimation of put option
The amortised value is calculated based on the present value of the future estimated liability for
the purchase of the remaining 40% interest in Beacon Events Limited ("Beacon"). The principal
US dollar estimated liability is determined based on a gross profit formula of the Beacon business
in fiscal 2017. The 2017 estimated liability is discounted to the present using Aspermont’s
borrowing rate of interest at the reporting date and adjusted for any foreign exchange
movements between the underlying US dollar liability and the Australian dollar.
(e) Earnings per share
(i) Basic earnings per share
Basic earnings per share is calculated by dividing:
the profit attributable to owners of the company, excluding any costs of servicing equity other
than ordinary shares
by the weighted average number of ordinary shares outstanding during the financial year,
adjusted for bonus entitlements in ordinary shares issued during the year and excluding
treasury shares.
(f) Earnings per share (continued)
(ii) Diluted earnings per share
Diluted earnings per share adjusts the figures used in the determination of basic earnings per
share to take into account:
the after income tax effect of interest and other financing costs associated with dilutive
potential ordinary shares, and
the weighted average number of additional ordinary shares that would have been outstanding
assuming the conversion of all dilutive potential ordinary shares.
(g) Rounding of amounts
The parent entity has applied the relief available to it under ASIC Class Order 98/100 and
accordingly, amounts in the financial report and directors’ report have been rounded off to the
nearest $1,000.
For
per
sona
l use
onl
y
ASPERMONT LIMITED AND ITS CONTROLLED ENTITIES
Notes to the Consolidated Financial Statements for the year ended 30 June 2015
15
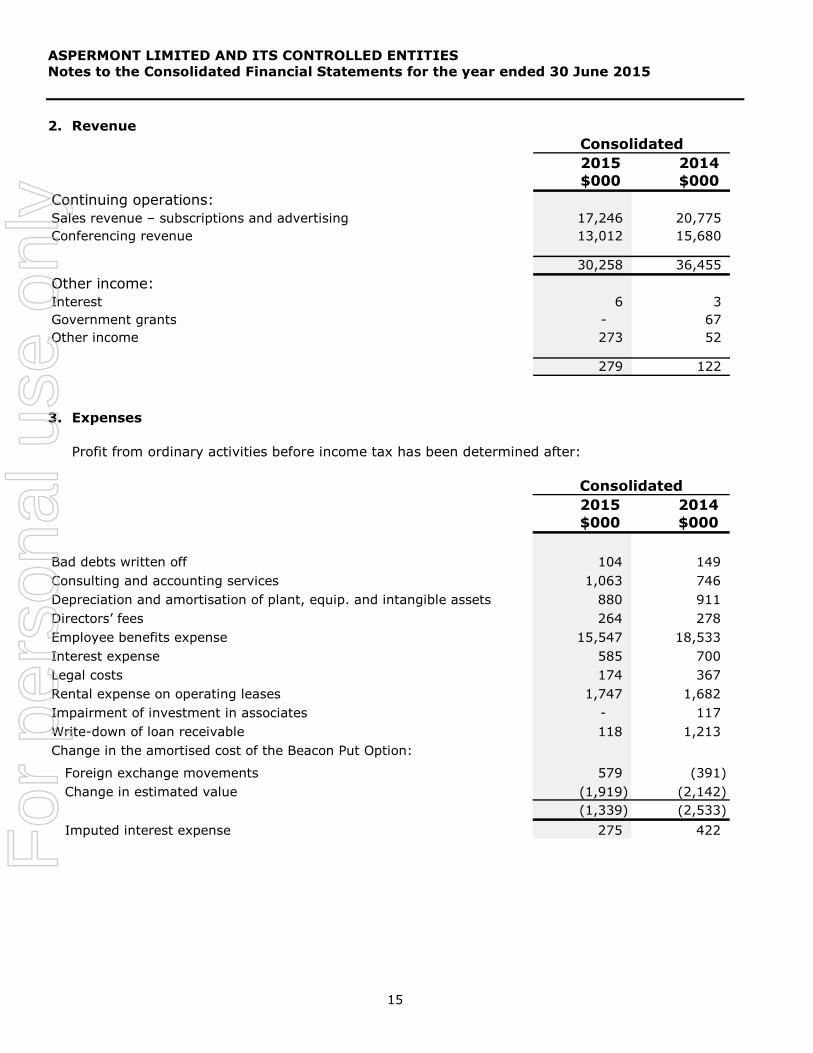
2. Revenue
2015 2014
$000 $000
Continuing operations:
Sales revenue – subscriptions and advertising 17,246 20,775
Conferencing revenue 13,012 15,680
30,258 36,455
Other income:
Interest 6 3
Government grants - 67
Other income 273 52
279 122
Consolidated
3. Expenses
Profit from ordinary activities before income tax has been determined after:
2015 2014
$000 $000
Bad debts written off 104 149
Consulting and accounting services 1,063 746
Depreciation and amortisation of plant, equip. and intangible assets 880 911
Directors’ fees 264 278
Employee benefits expense 15,547 18,533
Interest expense 585 700
Legal costs 174 367
Rental expense on operating leases 1,747 1,682
Impairment of investment in associates - 117
Write-down of loan receivable 118 1,213
Change in the amortised cost of the Beacon Put Option:
Foreign exchange movements 579 (391)
Change in estimated value (1,919) (2,142)
(1,339) (2,533)
Imputed interest expense 275 422
Consolidated
F
or p
erso
nal u
se o
nly
ASPERMONT LIMITED AND ITS CONTROLLED ENTITIES
Notes to the Consolidated Financial Statements for the year ended 30 June 2015
16
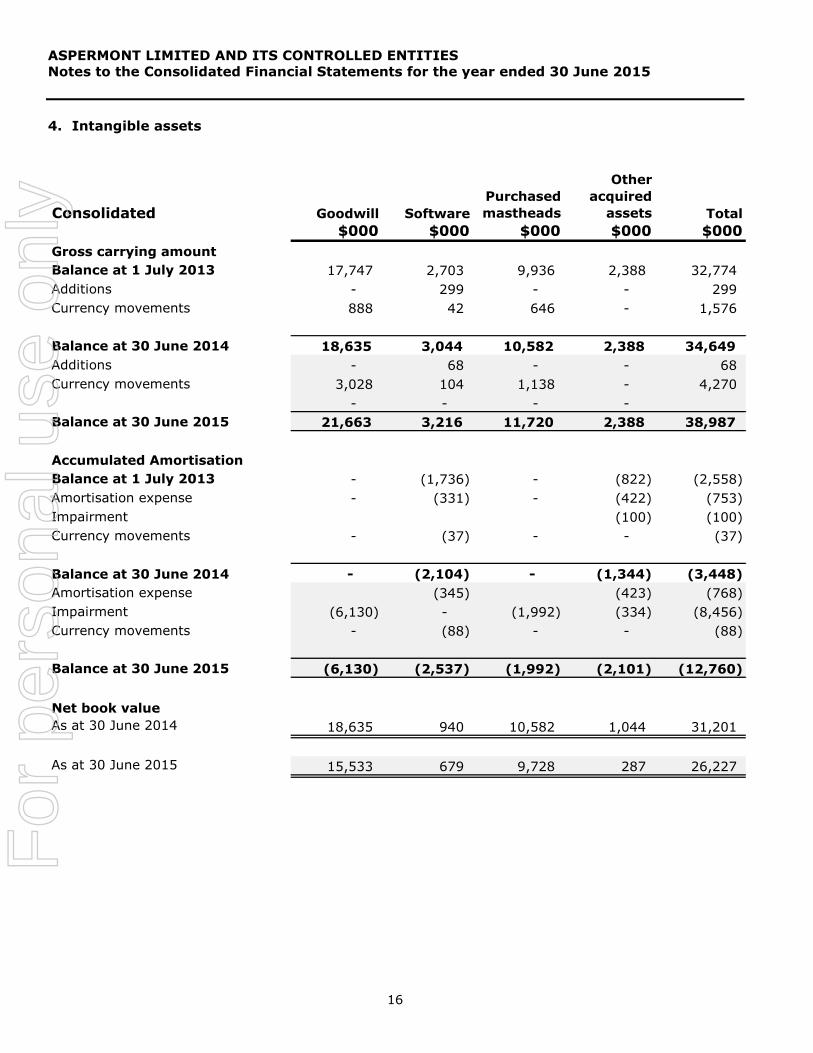
4. Intangible assets
ConsolidatedPurchased
mastheads
Other
acquired
assets
$000 $000 $000 $000 $000
Gross carrying amount
Balance at 1 July 2013 17,747 2,703 9,936 2,388 32,774
Additions - 299 - - 299
Currency movements 888 42 646 - 1,576
Balance at 30 June 2014 18,635 3,044 10,582 2,388 34,649
Additions - 68 - - 68
Currency movements 3,028 104 1,138 - 4,270
- - - -
Balance at 30 June 2015 21,663 3,216 11,720 2,388 38,987
Accumulated Amortisation
Balance at 1 July 2013 - (1,736) - (822) (2,558)
Amortisation expense - (331) - (422) (753)
Impairment (100) (100)
Currency movements - (37) - - (37)
Balance at 30 June 2014 - (2,104) - (1,344) (3,448)
Amortisation expense (345) (423) (768)
Impairment (6,130) - (1,992) (334) (8,456)
Currency movements - (88) - - (88)
Balance at 30 June 2015 (6,130) (2,537) (1,992) (2,101) (12,760)
Net book value
As at 30 June 2014 18,635 940 10,582 1,044 31,201
As at 30 June 2015 15,533 679 9,728 287 26,227
Goodwill Software Total
For
per
sona
l use
onl
y
ASPERMONT LIMITED AND ITS CONTROLLED ENTITIES
Notes to the Consolidated Financial Statements for the year ended 30 June 2015
17
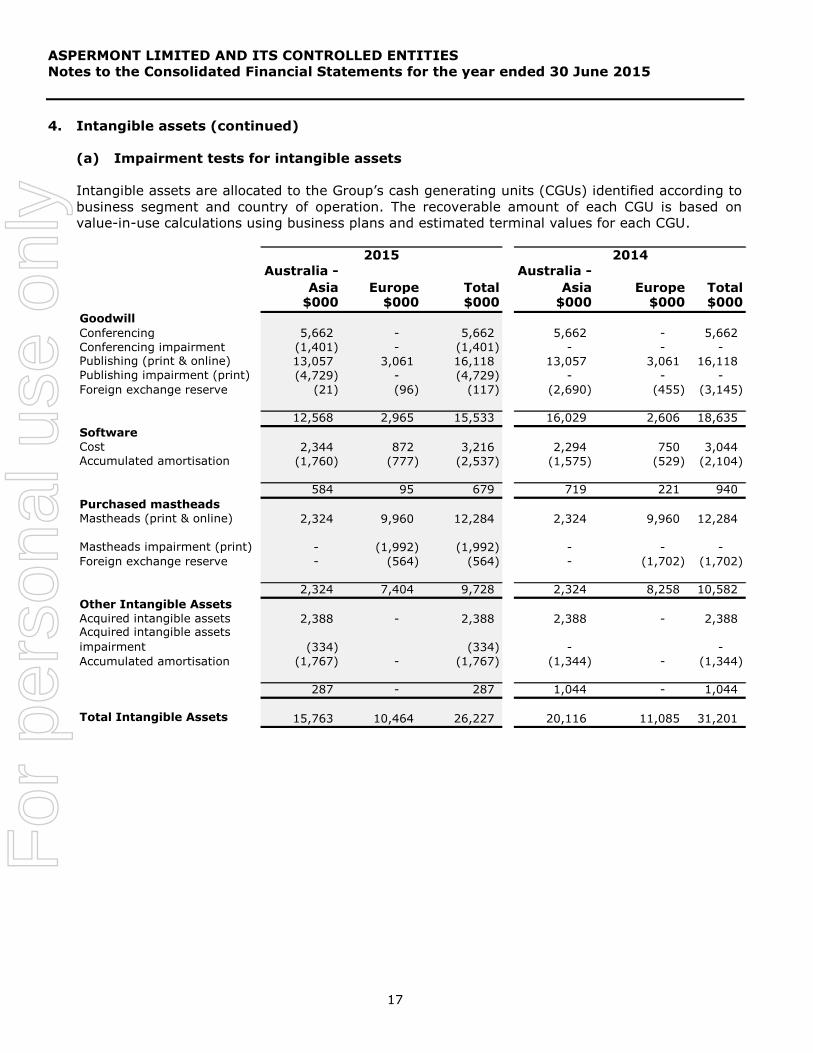
4. Intangible assets (continued)
(a) Impairment tests for intangible assets
Intangible assets are allocated to the Group’s cash generating units (CGUs) identified according to
business segment and country of operation. The recoverable amount of each CGU is based on
value-in-use calculations using business plans and estimated terminal values for each CGU.
Australia -
Asia Europe Total
Australia -
Asia Europe Total$000 $000 $000 $000 $000 $000
Goodwill
Conferencing 5,662 - 5,662 5,662 - 5,662
Conferencing impairment (1,401) - (1,401) - - - Publishing (print & online) 13,057 3,061 16,118 13,057 3,061 16,118 Publishing impairment (print) (4,729) - (4,729) - - -
Foreign exchange reserve (21) (96) (117) (2,690) (455) (3,145)
12,568 2,965 15,533 16,029 2,606 18,635
Software
Cost 2,344 872 3,216 2,294 750 3,044 Accumulated amortisation (1,760) (777) (2,537) (1,575) (529) (2,104)
584 95 679 719 221 940
Purchased mastheads
Mastheads (print & online) 2,324 9,960 12,284 2,324 9,960 12,284
Mastheads impairment (print) - (1,992) (1,992) - - -
Foreign exchange reserve - (564) (564) - (1,702) (1,702)
2,324 7,404 9,728 2,324 8,258 10,582
Other Intangible Assets
Acquired intangible assets 2,388 - 2,388 2,388 - 2,388 Acquired intangible assets
impairment (334) (334) - -
Accumulated amortisation (1,767) - (1,767) (1,344) - (1,344)
287 - 287 1,044 - 1,044
Total Intangible Assets 15,763 10,464 26,227 20,116 11,085 31,201
2015 2014
For
per
sona
l use
onl
y
ASPERMONT LIMITED AND ITS CONTROLLED ENTITIES
Notes to the Consolidated Financial Statements for the year ended 30 June 2015
18
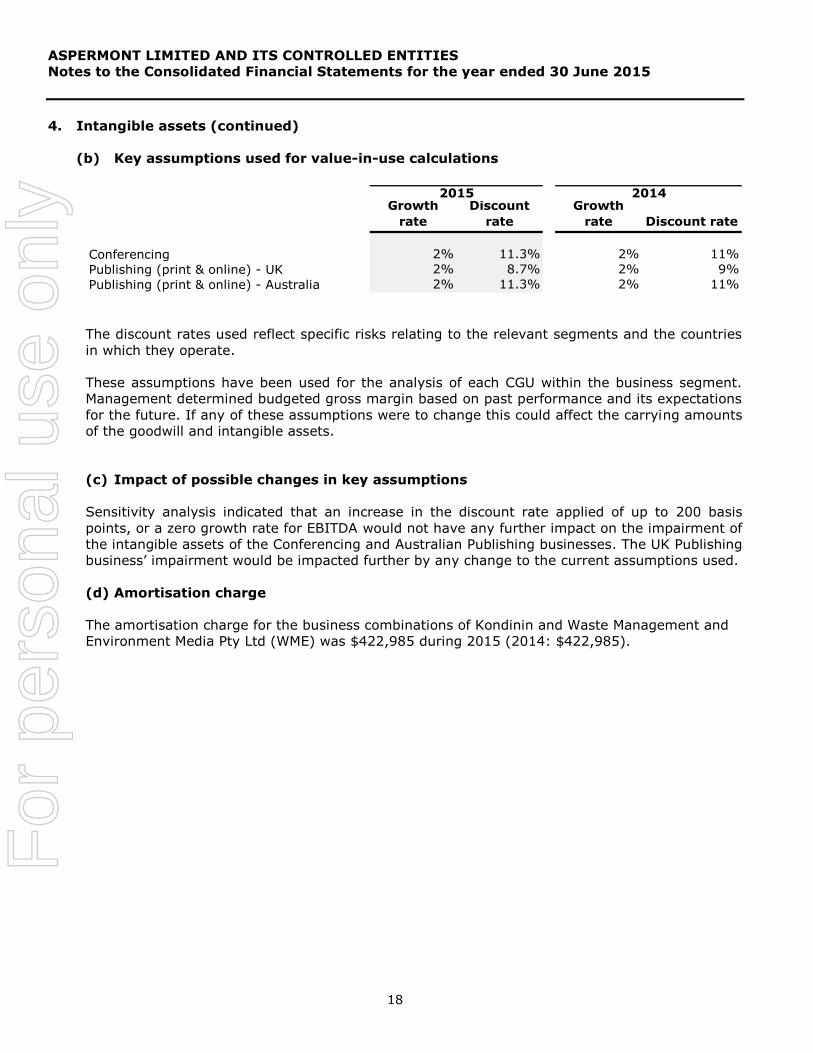
4. Intangible assets (continued)
(b) Key assumptions used for value-in-use calculations
Growth
rate
Discount
rate
Growth
rate Discount rate
Conferencing 2% 11.3% 2% 11%
2% 8.7% 2% 9%
Publishing (print & online) - Australia 2% 11.3% 2% 11%
2015 2014
Publishing (print & online) - UK
The discount rates used reflect specific risks relating to the relevant segments and the countries
in which they operate.
These assumptions have been used for the analysis of each CGU within the business segment.
Management determined budgeted gross margin based on past performance and its expectations
for the future. If any of these assumptions were to change this could affect the carrying amounts
of the goodwill and intangible assets.
(c) Impact of possible changes in key assumptions
Sensitivity analysis indicated that an increase in the discount rate applied of up to 200 basis
points, or a zero growth rate for EBITDA would not have any further impact on the impairment of
the intangible assets of the Conferencing and Australian Publishing businesses. The UK Publishing
business’ impairment would be impacted further by any change to the current assumptions used.
(d) Amortisation charge
The amortisation charge for the business combinations of Kondinin and Waste Management and
Environment Media Pty Ltd (WME) was $422,985 during 2015 (2014: $422,985).
For
per
sona
l use
onl
y
ASPERMONT LIMITED AND ITS CONTROLLED ENTITIES
Notes to the Consolidated Financial Statements for the year ended 30 June 2015
19
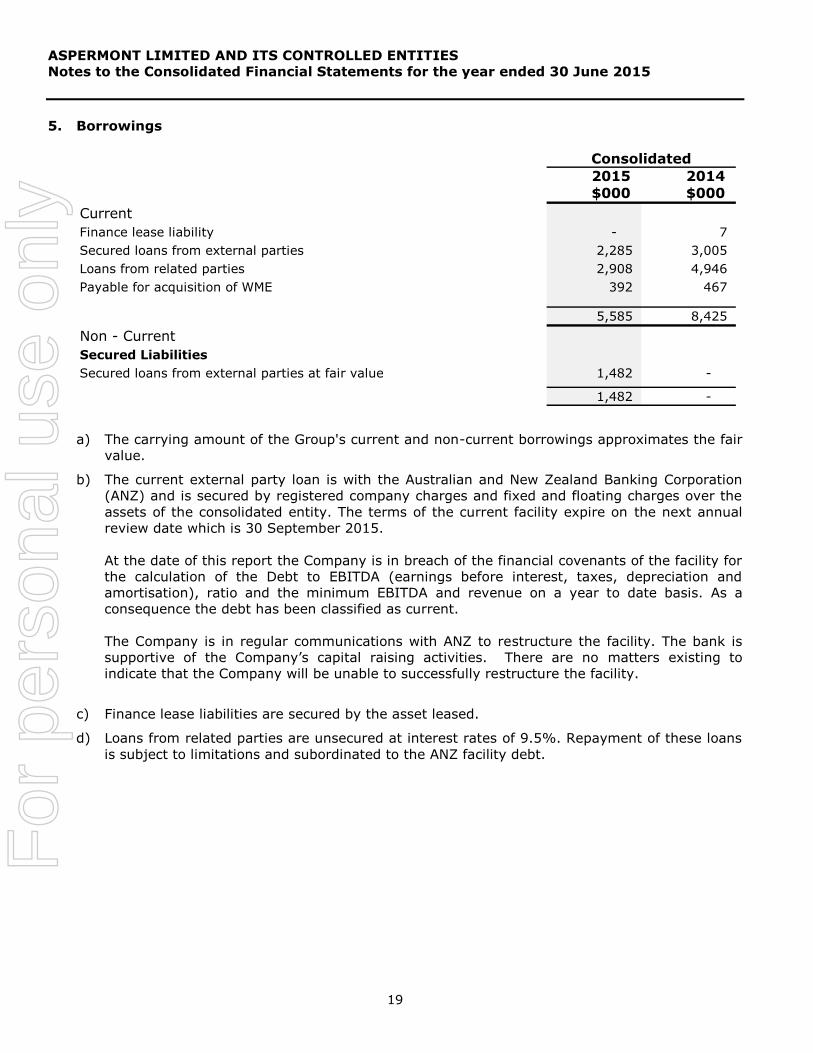
5. Borrowings
2015 2014
$000 $000
Current
Finance lease liability - 7
Secured loans from external parties 2,285 3,005
Loans from related parties 2,908 4,946
Payable for acquisition of WME 392 467
5,585 8,425
Non - Current
Secured Liabilities
Secured loans from external parties at fair value 1,482 -
1,482 -
Consolidated
a) The carrying amount of the Group's current and non-current borrowings approximates the fair
value.
b) The current external party loan is with the Australian and New Zealand Banking Corporation
(ANZ) and is secured by registered company charges and fixed and floating charges over the
assets of the consolidated entity. The terms of the current facility expire on the next annual
review date which is 30 September 2015.
At the date of this report the Company is in breach of the financial covenants of the facility for
the calculation of the Debt to EBITDA (earnings before interest, taxes, depreciation and
amortisation), ratio and the minimum EBITDA and revenue on a year to date basis. As a
consequence the debt has been classified as current.
The Company is in regular communications with ANZ to restructure the facility. The bank is
supportive of the Company’s capital raising activities. There are no matters existing to
indicate that the Company will be unable to successfully restructure the facility.
c) Finance lease liabilities are secured by the asset leased.
d) Loans from related parties are unsecured at interest rates of 9.5%. Repayment of these loans
is subject to limitations and subordinated to the ANZ facility debt.
For
per
sona
l use
onl
y
ASPERMONT LIMITED AND ITS CONTROLLED ENTITIES
Notes to the Consolidated Financial Statements for the year ended 30 June 2015
20
5. Borrowings (continued)
e) Non – Current loans represent the liability in respect of convertible debentures issued during
the year. The principal terms of the convertible debentures include:
The debentures mature in June 2020,
The debentures carry annual interest at the higher of 10% or BBSW + 5%,
Holders have the option, after December 2015, to exchange a debenture for:
o an ordinary share in the Company for a price of the lower of $0.0175 or the share issue
price for any future capital raising before the maturity of the debentures, and
o an additional option with each share obtained in the conversion, to acquire an ordinary
share in the Company at $0.03 within five years from the debenture conversion date.
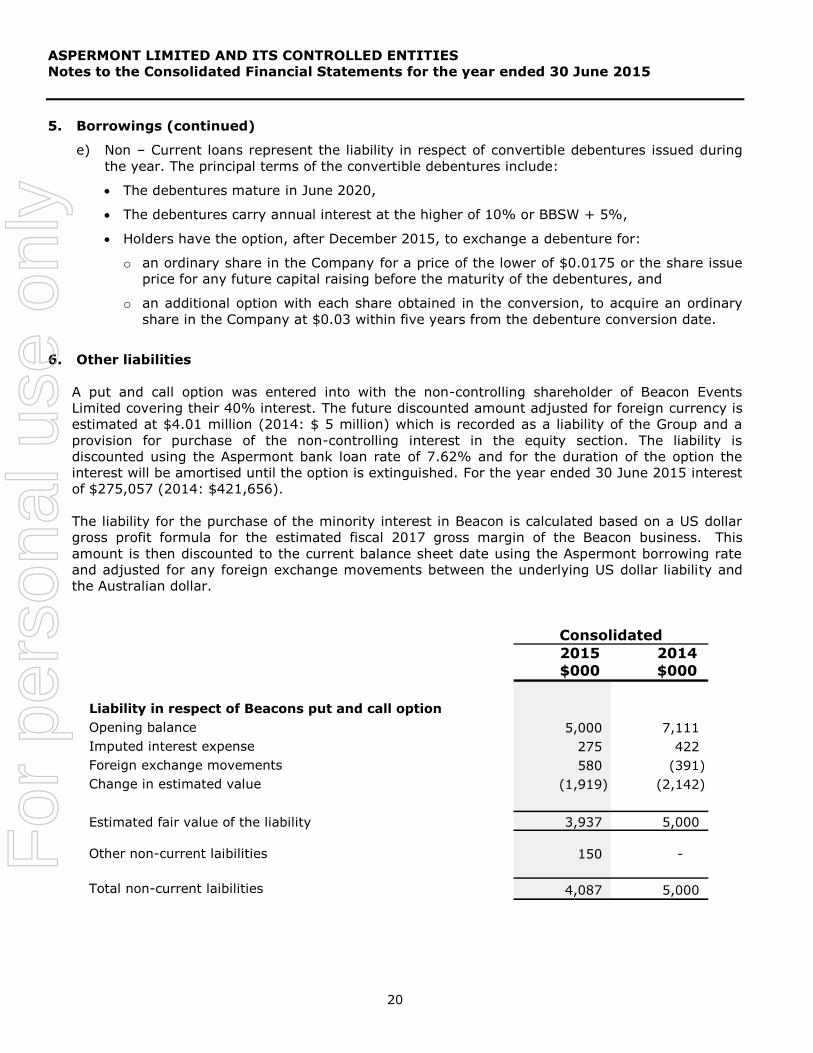
6. Other liabilities
A put and call option was entered into with the non-controlling shareholder of Beacon Events
Limited covering their 40% interest. The future discounted amount adjusted for foreign currency is
estimated at $4.01 million (2014: $ 5 million) which is recorded as a liability of the Group and a
provision for purchase of the non-controlling interest in the equity section. The liability is
discounted using the Aspermont bank loan rate of 7.62% and for the duration of the option the
interest will be amortised until the option is extinguished. For the year ended 30 June 2015 interest
of $275,057 (2014: $421,656).
The liability for the purchase of the minority interest in Beacon is calculated based on a US dollar
gross profit formula for the estimated fiscal 2017 gross margin of the Beacon business. This
amount is then discounted to the current balance sheet date using the Aspermont borrowing rate
and adjusted for any foreign exchange movements between the underlying US dollar liability and
the Australian dollar.
2015 2014
$000 $000
Liability in respect of Beacons put and call option
Opening balance 5,000 7,111
Imputed interest expense 275 422
Foreign exchange movements 580 (391)
Change in estimated value (1,919) (2,142)
Estimated fair value of the liability 3,937 5,000
Other non-current laibilities 150 -
Total non-current laibilities 4,087 5,000
Consolidated
For
per
sona
l use
onl
y
ASPERMONT LIMITED AND ITS CONTROLLED ENTITIES
Notes to the Consolidated Financial Statements for the year ended 30 June 2015
21
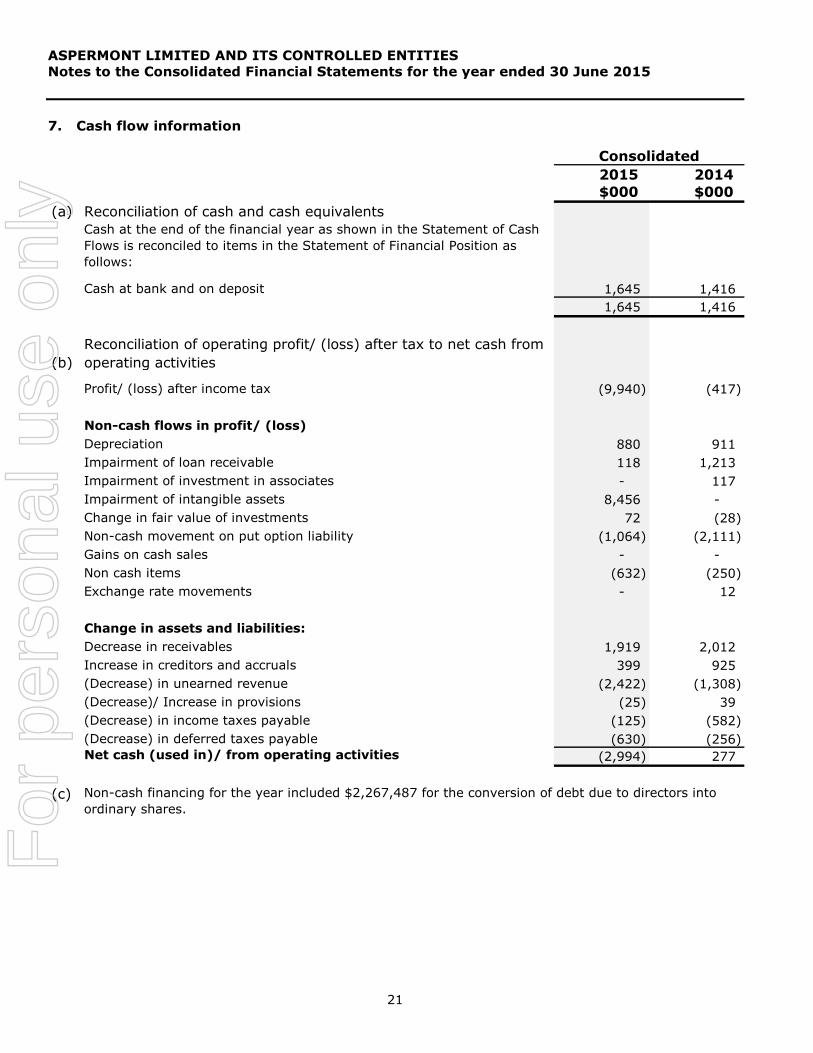
7. Cash flow information
2015 2014
$000 $000
(a) Reconciliation of cash and cash equivalents
Cash at the end of the financial year as shown in the Statement of Cash
Flows is reconciled to items in the Statement of Financial Position as
follows:
Cash at bank and on deposit 1,645 1,416
1,645 1,416
(b)
Reconciliation of operating profit/ (loss) after tax to net cash from
operating activities
Profit/ (loss) after income tax (9,940) (417)
Non-cash flows in profit/ (loss)
Depreciation 880 911
Impairment of loan receivable 118 1,213
Impairment of investment in associates - 117
Impairment of intangible assets 8,456 -
Change in fair value of investments 72 (28)
Non-cash movement on put option liability (1,064) (2,111)
Gains on cash sales - -
Non cash items (632) (250)
Exchange rate movements - 12
Change in assets and liabilities:
Decrease in receivables 1,919 2,012
Increase in creditors and accruals 399 925
(Decrease) in unearned revenue (2,422) (1,308)
(Decrease)/ Increase in provisions (25) 39
(Decrease) in income taxes payable (125) (582)
(Decrease) in deferred taxes payable (630) (256)
Net cash (used in)/ from operating activities (2,994) 277
(c)
Consolidated
Non-cash financing for the year included $2,267,487 for the conversion of debt due to directors into
ordinary shares.
For
per
sona
l use
onl
y
ASPERMONT LIMITED AND ITS CONTROLLED ENTITIES
Notes to the Consolidated Financial Statements for the year ended 30 June 2015
22
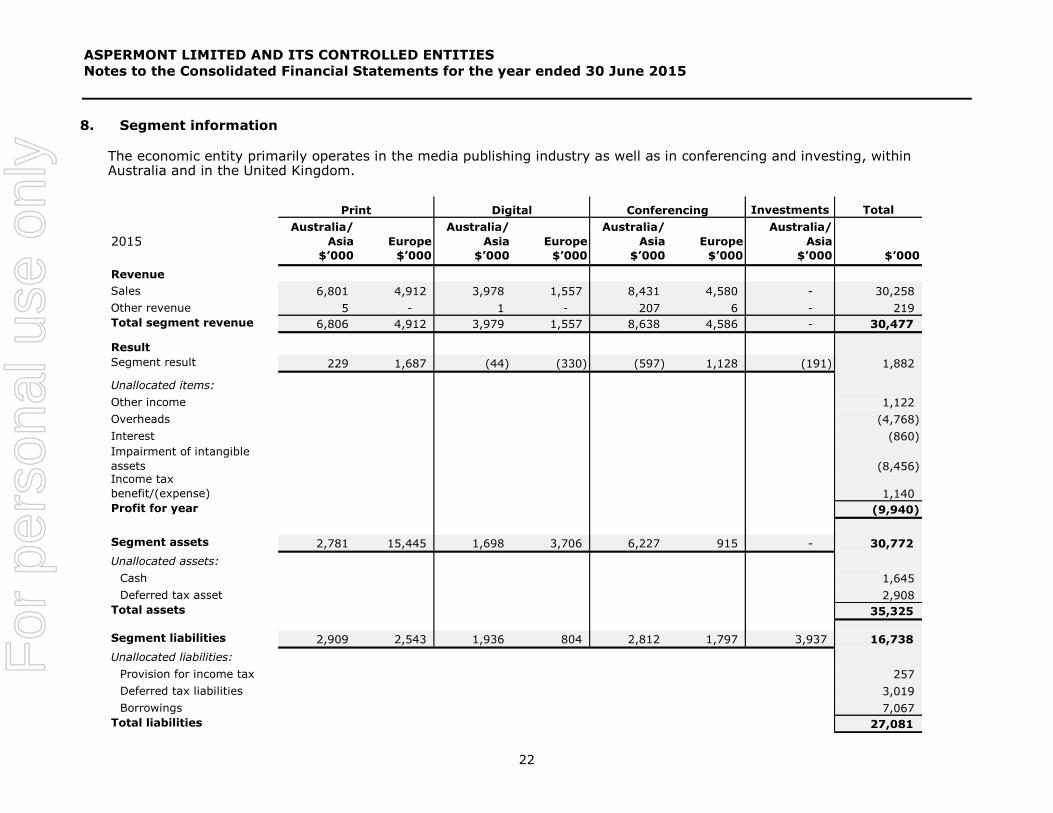
8. Segment information
The economic entity primarily operates in the media publishing industry as well as in conferencing and investing, within Australia and in the United Kingdom.
Investments Total
2015Australia/
Asia Europe
Australia/
Asia Europe
Australia/
Asia Europe
Australia/
Asia
$’000 $’000 $’000 $’000 $’000 $’000 $’000 $’000
Revenue
Sales 6,801 4,912 3,978 1,557 8,431 4,580 - 30,258
Other revenue 5 - 1 - 207 6 - 219
Total segment revenue 6,806 4,912 3,979 1,557 8,638 4,586 - 30,477
Result
Segment result 229 1,687 (44) (330) (597) 1,128 (191) 1,882
Unallocated items:
Other income 1,122
Overheads (4,768)
Interest (860)
Impairment of intangible
assets (8,456) Income tax
benefit/(expense) 1,140
Profit for year (9,940)
Segment assets 2,781 15,445 1,698 3,706 6,227 915 - 30,772
Unallocated assets:
Cash 1,645
Deferred tax asset 2,908
Total assets 35,325
Segment liabilities 2,909 2,543 1,936 804 2,812 1,797 3,937 16,738
Unallocated liabilities:
Provision for income tax 257
Deferred tax liabilities 3,019
Borrowings 7,067
Total liabilities 27,081
Print Digital Conferencing
For
per
sona
l use
onl
y
ASPERMONT LIMITED AND ITS CONTROLLED ENTITIES
Notes to the Consolidated Financial Statements for the year ended 30 June 2015
23
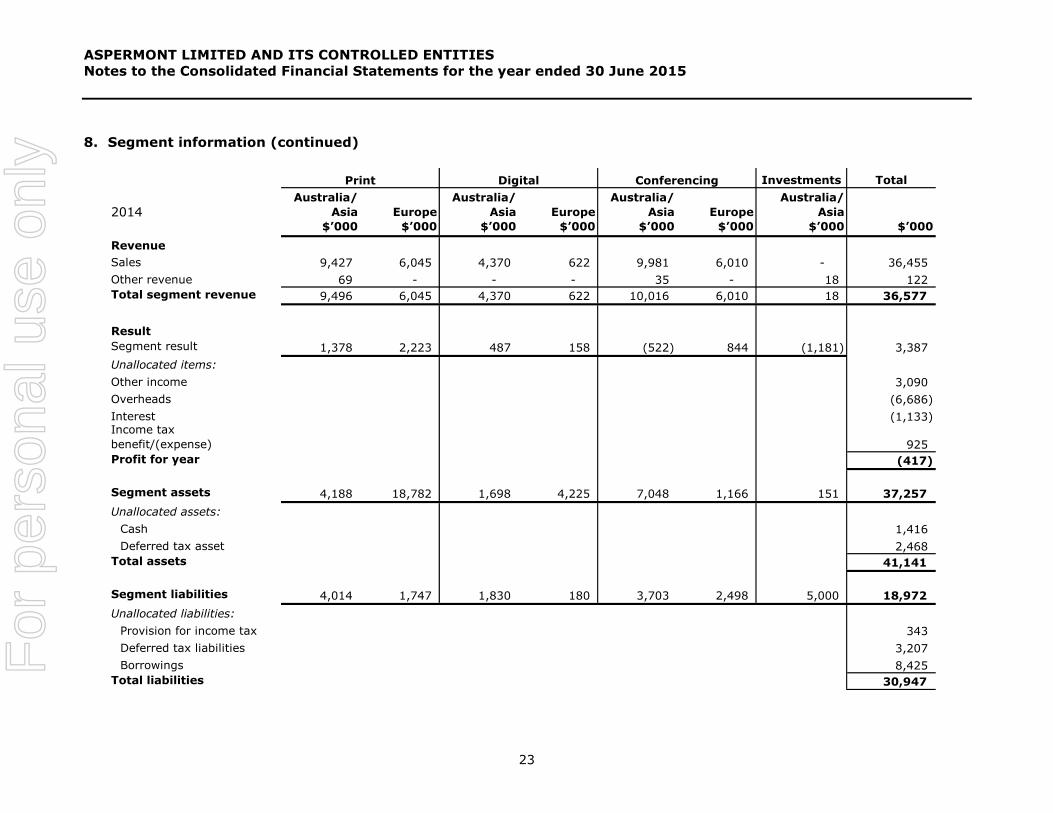
8. Segment information (continued)
Investments Total
2014Australia/
Asia Europe
Australia/
Asia Europe
Australia/
Asia Europe
Australia/
Asia
$’000 $’000 $’000 $’000 $’000 $’000 $’000 $’000
Revenue
Sales 9,427 6,045 4,370 622 9,981 6,010 - 36,455
Other revenue 69 - - - 35 - 18 122
Total segment revenue 9,496 6,045 4,370 622 10,016 6,010 18 36,577
Result
Segment result 1,378 2,223 487 158 (522) 844 (1,181) 3,387
Unallocated items:
Other income 3,090
Overheads (6,686)
Interest (1,133) Income tax
benefit/(expense) 925
Profit for year (417)
Segment assets 4,188 18,782 1,698 4,225 7,048 1,166 151 37,257
Unallocated assets:
Cash 1,416
Deferred tax asset 2,468
Total assets 41,141
Segment liabilities 4,014 1,747 1,830 180 3,703 2,498 5,000 18,972
Unallocated liabilities:
Provision for income tax 343
Deferred tax liabilities 3,207
Borrowings 8,425
Total liabilities 30,947
Print Digital Conferencing
For
per
sona
l use
onl
y
ASPERMONT LIMITED AND ITS CONTROLLED ENTITIES
Notes to the Consolidated Financial Statements for the year ended 30 June 2015
24
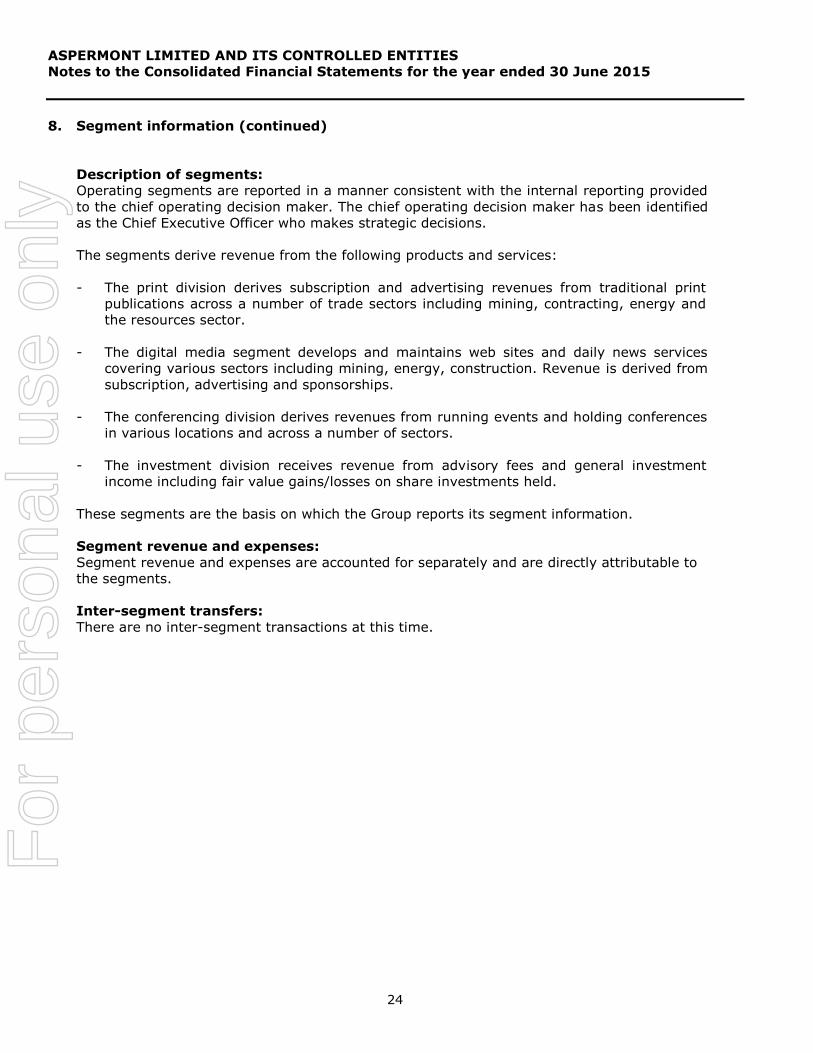
8. Segment information (continued)
Description of segments:
Operating segments are reported in a manner consistent with the internal reporting provided
to the chief operating decision maker. The chief operating decision maker has been identified
as the Chief Executive Officer who makes strategic decisions.
The segments derive revenue from the following products and services:
- The print division derives subscription and advertising revenues from traditional print
publications across a number of trade sectors including mining, contracting, energy and
the resources sector.
- The digital media segment develops and maintains web sites and daily news services
covering various sectors including mining, energy, construction. Revenue is derived from
subscription, advertising and sponsorships.
- The conferencing division derives revenues from running events and holding conferences
in various locations and across a number of sectors.
- The investment division receives revenue from advisory fees and general investment
income including fair value gains/losses on share investments held.
These segments are the basis on which the Group reports its segment information.
Segment revenue and expenses:
Segment revenue and expenses are accounted for separately and are directly attributable to
the segments.
Inter-segment transfers:
There are no inter-segment transactions at this time.
For
per
sona
l use
onl
y
ASPERMONT LIMITED AND ITS CONTROLLED ENTITIES
Notes to the Consolidated Financial Statements for the year ended 30 June 2015
25
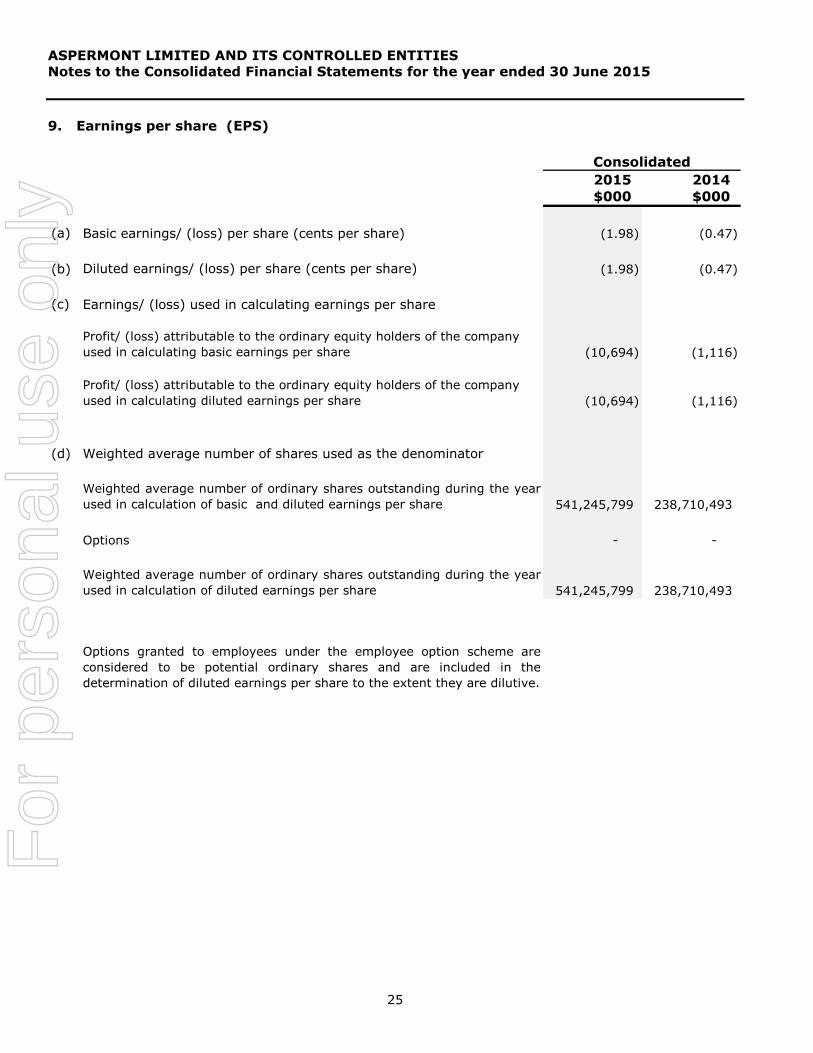
9. Earnings per share (EPS)
2015 2014
$000 $000
(a) Basic earnings/ (loss) per share (cents per share) (1.98) (0.47)
(b) Diluted earnings/ (loss) per share (cents per share) (1.98) (0.47)
(c) Earnings/ (loss) used in calculating earnings per share
Profit/ (loss) attributable to the ordinary equity holders of the company
used in calculating basic earnings per share (10,694) (1,116)
Profit/ (loss) attributable to the ordinary equity holders of the company
used in calculating diluted earnings per share (10,694) (1,116)
(d) Weighted average number of shares used as the denominator
Weighted average number of ordinary shares outstanding during the year
used in calculation of basic and diluted earnings per share 541,245,799 238,710,493
Options - -
Weighted average number of ordinary shares outstanding during the year
used in calculation of diluted earnings per share 541,245,799 238,710,493
Options granted to employees under the employee option scheme are
considered to be potential ordinary shares and are included in the
determination of diluted earnings per share to the extent they are dilutive.
Consolidated
For
per
sona
l use
onl
y