Embed Size (px)
Citation preview
ALE Property Group ASX Appendix 4E – Full Year Report
For the year ended 30 June 2018 Stapling Arrangement ALE Property Group (“ALE”) was established for the purpose of facilitating a joint quotation of Australian Leisure and Entertainment Property Management Limited (“Company”) (ABN 45 105 275 278) and Australian Leisure and Entertainment Property Trust (“Trust”) (ABN 92 648 441 429) and its controlled entities on the Australian Securities Exchange. The Company is the Responsible Entity of the Trust.
2018
$’000 2017 $’000
Variance
Rental Income Interest Income Total revenue
58,095 1,049
59,144
57,007 1,324
58,331
1.9% (20.8%)
1.4% Other income 54,273 103,899 (44.7%) Profit before income tax attributable to stapled security holders, before net gain from fair value adjustments of investment properties and derivatives (interest rate swaps), amortisation of borrowing costs and other non cash expenses (refer to note 4.6 of the attached Financial Statements – “Distributable Profit”)
29,025
29,118
(0.3%)
Operating Profit after tax attributable to members 75,090 130,043 (42.2%) $ $ Net assets per security (including derivatives) 3.17 2.99 6.0% Operating profit after tax increased due to:
Total revenue was up by 1.4%. Rent received from properties was up 1.9% due to CPI rent reviews during the year. Interest income decreased due to lower funds on deposit
Fair value adjustments to investment properties decreased to $54.3 million in the current year due to rental growth and a lower reduction in capitalisation rates
Fair value adjustments to derivatives liabilities decreased from a $14.3 million increment in 2017 to a $4.8 million decrement in the current year as long term interest rates decreased slightly
Finance costs were higher due to increased borrowings Management costs increased during the year due to costs associated with property related projects
and preparation for the FY19 market rent review. Profit after tax attributable to members was down $54.9 million mainly due to the impact of fair value
increments to properties and derivatives. Distributable profit (adjusted for non-cash items) was primarily impacted by the same cash items that
affected Operating Profit, namely changes in rent, finance costs and management expenses. The attached Financial Statements contain further explanations of the results. Distributions
Amount per stapled security
Franked amount per stapled security
Final distribution Interim distribution Total distribution
10.35 cents 10.45 cents
20.80 cents
0.0 cents 0.0 cents 0.0 cents
The total amount per stapled security is comprised of 20.80 cents of Trust distributions and no company dividend. The final distribution of 10.45 cents will be paid to stapled securityholders on 5 September 2018. The full year distribution of 20.80 cents will be 100% tax deferred. Record date for determining entitlements to the distribution 5pm, 29 June 2018
This report is based on accounts which have been audited.
Detail of reporting period Current: 1 July 2017 to 30 June 2018
For
per
sona
l use
onl
y
ANNUAL REPORT
2018
VALUECURRENT INCOME
FUTURE INCOME
LONG TERM VALUE
15 YEARS OF ADDING
For
per
sona
l use
onl
y
FRONT COVER: GEPPS CROSS HOTEL, ADELAIDE SA
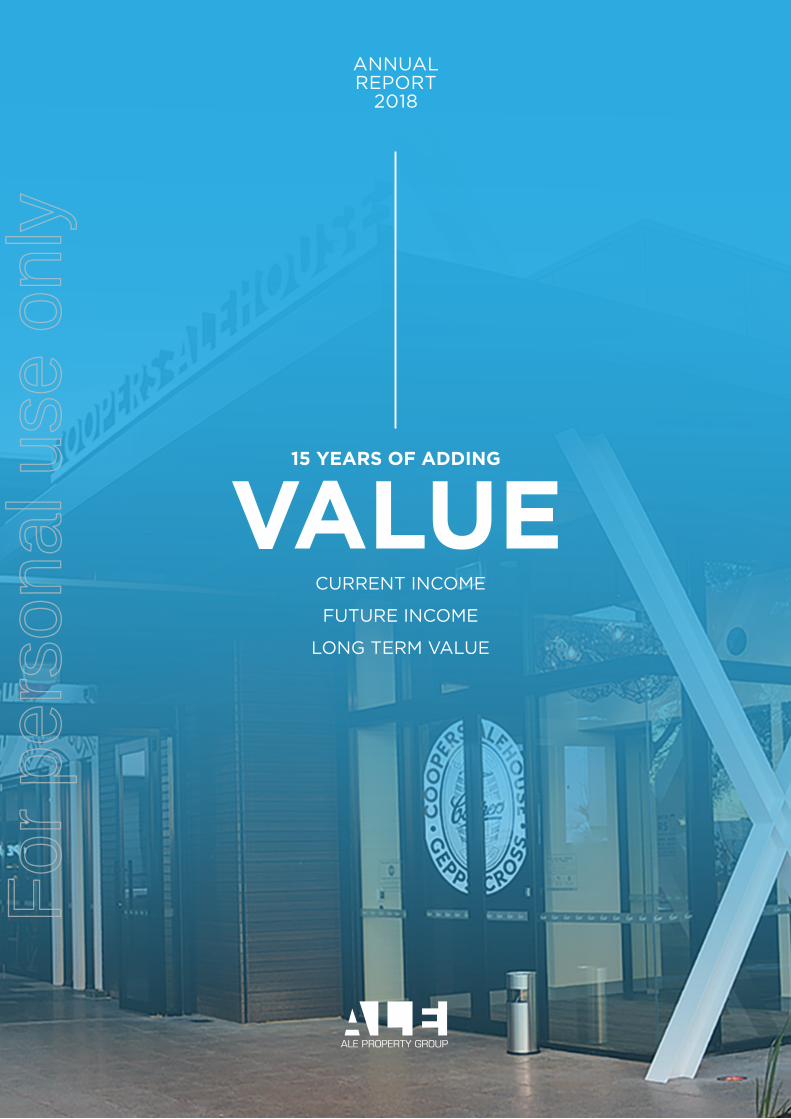
ROBERT MACTIER
“We maintained our core strategy of ensuring that we preserve, enhance and extract maximum value for our securityholders from our existing portfolio.”
* balance escalates with CPI
2.50%0%
100%
80%
60%
40%
20% 2.75%
3.00%
3.25%
3.50%
3.75%
Ave
rag
e F
ixed
/ H
edg
ed B
ase
Rat
e
% Net Debt Hedged(LHS)
ExpiresNov 25
Avg Fixed andHedged Base Rates
(RHS)
100% of forecast net debt is hedged to November 2025
FY19 FY20 FY21 FY22 FY23 FY24 FY25 FY26
$150m $151m*
$225m
DEBT MATURITIES AND HEDGING PROFILE
1.9%
Rental income growth
4.98%
Average cap rate
4.26%All up cash interest rate
41.6%
Gearing
3.7 years
Average debt maturity
7.4 years
Hedge maturity
$1,136.3m
Statutory property values
10.3 years
Average lease term
20.8cps
Distribution
100% Tax deferred
For
per
sona
l use
onl
y
ABN 92 648 441 429
WWW.ALEGROUP.COM.AU
02 Directors' Report
20 Auditor's Independence Declaration
21 Financial Statements
22 Statement of Comprehensive Income
23 Statement of Financial Position
24 Statement of Changes in Equity
25 Statement of Cash Flows
26 Notes to the Financial Statements
49 Directors' Declaration
50 Independent Auditors Report
54 Investor Information
ALE Property Group is the owner of Australia's largest portfolio of freehold pub properties. Established in November 2003, ALE owns a portfolio of 86
pub properties across the five mainland states of Australia. All the properties are leased to Australian Leisure and Hospitality Group Pty
Limited (ALH).
Contents
ALE Property Group
Comprising Australian Leisure and Entertainment
Report For the Year ended 30 June 2018Property Trust and its controlled entities
ANNUAL REPORT
2018ALE Property Group (ASX: LEP)
For
per
sona
l use
onl
y
DIRECTORS' REPORTFor the Year ended 30 June 2018
The registered office and principal place of business of the Company is:Level 106 O'Connell StreetSydney NSW 2000
NameRobert Mactier, B.Ec, MAICD Appointed: 28 November 2016 Appointed Chair: 23 May 2017Independent Non Executive DirectorChairman of the Board
Appointed: 26 November 2013 Appointed Chair of ACRMC: 26 October 2015
Independent Non Executive Director
Prior to joining Goldman Sachs in 2004, Ms Downes was a director and the Head of Equity Derivatives Trading at Deutsche Bank in Sydney. When Morgan Stanley was starting its equity franchise in Australia in 1998 she was hired to set up the Derivative and Proprietary Trading business based in Hong Kong and Australia. Ms Downes started her career working for Swiss Bank O’Connor on the Floor of the Pacific Coast Stock Exchange in San Francisco, followed by the Philadelphia Stock Exchange before returning to work in Sydney as a director for UBS.
Pippa graduated from the University of California at Berkeley with a Bachelor of Science in Business Administration majoring and Finance and Accounting. Pippa also completed a Masters of Applied Finance from Macquarie University in 1998. Ms Downes is a member of The AICD and Women Corporate Directors and in 2016 was named as a Women of Influence in the AFR/Westpac awards.
Phillipa (Pippa) is a Director of the Australian Technology Innovators (Infotrack, LEAP Legal software), Windlab Limited, the ASX Clearing and Settlement companies and the Sydney Olympic Park Authority. Pippa is also on the panel of the ASX Appeals Tribunal and is a director of the Pinnacle Foundation. Ms Downes was a Managing Director and Equity Partner of Goldman Sachs in Australia until October 2011, working in the Proprietary Investment division. Pippa has had a successful international banking and finance career spanning over 20 years where she has led the local investment, derivative and trading arms of several of the world’s leading Investment Banks. She has extensive experience in Capital Markets and Derivatives and strong analytical skills investing across the capital structures of companies and across multiple asset classes.
Robert's other current roles include Chairman of ASX-listed WPP AUNZ Limited (since 2006) and Consultant to UBS AG in Australia (since June 2007). Between 2006 and January 2017 he served as a non-executive Director of NASDAQ listed Melco Resorts and Entertainment Limited.
Robert began his career at KPMG and from January 1986 to April 1990 worked across their audit, management consulting and corporate finance practices. He has extensive investment banking experience in Australia, having previously worked for Ord Minnett Securities, E.L. & C. Baillieu and Citigroup between 1990 and 2006.
Robert holds a Bachelor’s degree in economics from the University of Sydney and has been a Member of the Australian Institute of Company Directors since 2007.
Member of the Nominations CommitteeMember of the Remuneration Committee
ALE Property Group ("ALE") comprises Australian Leisure and Entertainment Property Trust (“Trust”) and its controlled entities including ALE Direct Property Trust ("Sub Trust"), ALE Finance Company Pty Limited ("Finance Company") and Australian Leisure and Entertainment Property Management Limited ("Company") as the responsible entity of the Trust.
The directors of the Company present their report, together with the financial statements of ALE, for the year ended 30 June 2018.
1. DIRECTORSThe following individuals were directors of the Company during the year and up to the date of this report unless otherwise stated:
Member of the Audit, Compliance and Risk Management Committee (ACRMC)
Experience, responsibilities and other directorships
Member of the Nominations CommitteeMember of the Remuneration Committee
Phillipa Downes, BSc (Bus Ad), MAppFin, GAICD Chair of the ACRMC
Page 2 ALE Property Group
For
per
sona
l use
onl
y

DIRECTORS' REPORTFor the Year ended 30 June 2018
Name
Nancy Milne, OAM, LLB, FAICD Appointed: 6 February 2015Independent Non Executive Director
Appointed: 24 September 2014Independent Non Executive Director
Appointed: 26 June 2003
Non Executive Director
Appointed: 15 February 2018
Non Executive Director
Paul has over 30 years’ experience in commercial and residential property management, development and real estate transactions with major multinational institutions. Paul was Chief Investment Officer at Dexus Property Group from 2007 to 2012. Prior to that he was with Lend Lease Corporation for 11 years in various positions culminating with being the Head of Corporate Finance. Paul is a director of Frasers Logistic & Industrial Trust (SGX listed) and was previously a director of GPT Metro Office Fund.
Paul has a Graduate Diploma in Finance and Investment and a Graduate Diploma in Financial Planning. He is a Fellow of the Royal Institute of Chartered Surveyors, Fellow of the Australian Property Institute and a Licensed Real Estate Agent (NSW, VIC and QLD).
James McNally B.Bus (Land Economy), Dip. Law
James is an executive and founding director of the company. James has over 20 years’ experience in the funds management industry, having worked in both property trust administration and compliance roles for Perpetual Trustees Australia Limited and MIA Services Pty Limited, a company that specialises in compliance services to the funds management industry. James’ qualifications include a Bachelor of Business in land economy and a Diploma of Law. James is also a registered valuer and licensed real estate agent.
Michael’s academic qualifications include; Bachelor of Arts from the University of Sydney, Bachelor of Laws from University of New South Wales, Master of Business Administration from New York University, Master of Business Systems from Monash University, Master of Computer Science from University of Illinois at Urbana - Champaign / Columbia University, and Master of Criminology and Master of Laws from University of Sydney.
James is not considered an Independent Director as he has held an Executive Director position with ALE for the last three years to 15 April 2017.
Michael is a founding Director of Adexum Capital Limited, a private equity company investing in both public and private mid-market companies. Michael is also Vice Chairman of Pyrolyx AG, a dual listed German and Australian company involved in recycling.
Mr Triguboff has a background in equity funds management with groups including MIR and Lazard Asset Management Pacific, Lazard Asia Funds and was a global partner of Lazard Freres & Co. He was previously based in the USA and held positions with Quantum Funds and Equity Investments with a focus on principal investments in both public and private companies.
Michael Triguboff BA (Syd), LLB (UNSW)
Chair of the Remuneration Committee
Paul Say, FRICS, FAPI
Member of the ACRMC
Experience, responsibilities and other directorships
Member of the Nominations CommitteeMember of the Remuneration Committee
Nancy has a Bachelor of Laws from the University of Sydney. She is a member of the NSW Council of the Australian Institute of Company Directors and the Institute’s Law Committee.
Member of the ACRMCChair of the Nominations Committee
Nancy has been a professional non-executive director for over a decade. She is a former lawyer with over 30 years’ experience with primary areas of legal expertise in insurance, risk management and corporate governance. She was a partner with Clayton Utz until 2003 and a consultant until 2012. She is currently Chairman of the Securities Exchange Guarantee Corporation and deputy chairman of the State Insurance Regulatory Authority. She was previously a director of Australand Property Group, Crowe Horwarth Australasia, State Plus and Novion Property Group (now Vicinity Centres).
Page 3 ALE Property Group
For
per
sona
l use
onl
y
DIRECTORS' REPORTFor the Year ended 30 June 2018
Name
Appointed: 16 November 2004Chief Executive Officer and Managing Director of the Company
Managing Director
2. OTHER OFFICERS
Name Experience
Appointed: 30 June 2016
David Lawler B.Bus, CPA Appointed: 9 December 2005 Resigned: 6 December 2017
3. INFORMATION ON DIRECTORS AND KEY MANAGEMENT PERSONNEL
Director Directorships of listed entities TypeResigned as Director
R W Mactier WPP AUNZ Limited Non-executiveR W Mactier Melco Resorts and Entertainment Limited (Nasdaq listed) Non-executive January 2017P G Say GPT Metro Office Fund Non-executive August 2014 September 2016P G Say Non-executive June 2016P J Downes Non-executive July 2017M P Triguboff Non-executive February 2015
Windlab LimitedPyrolyx AG
Frasers Logistic & Industrial Trust (SGX listed)
Appointed as Director
Company Secretary and Finance Manager
Experience, responsibilities and other directorships
Michael has over 30 years’ experience in accounting, taxation and financial management. Michael previously held senior financial positions with subsidiaries of listed public companies and spent 12 years working for Grant Thornton. He has also owned and managed his own accounting practice.
Independent member of ACRMCDavid was appointed to ALE’s ACRMC on 9 December 2005 and has over 25 years’ experience in internal auditing in the banking and finance industry. He was the Chief Audit Executive for Citibank in the Philippines, Italy, Switzerland, Mexico, Brazil, Australia and Hong Kong. David was Group Auditor for the Commonwealth Bank of Australia. David is the Chairman of the Australian Trade and Investment Commission Audit and Risk Committee, and the National Mental Health Commission Audit Committee, and is an audit committee member of the Australian Office of Financial Management, Cancer Australia, the Department of Foreign Affairs and Trade, the Australian Sports Anti-Doping Authority, and the Australian Maritime Safety Authority. David is Chairman of Australian Settlements Limited. David has a Bachelor of Business Studies from Manchester Metropolitan University in the UK. He is a Fellow of CPA Australia and a past President of the Institute of Internal Auditors – Australia.
Michael Clarke BCom, MMan, CA, ACIS
December 2006December 2006
The following director held directorships of other listed entities within the last three years and from the date appointed up to the date of this report unless otherwise stated:
Directorships of listed entities within the last three years
Michael joined ALE in October 2006 and was appointed Company Secretary on 30 June 2016. Michael has a Bachelor of Commerce from the University of New South Wales and a Masters of Management from the Macquarie Graduate School of Management. He is an associate member of both the Governance Institute of Australia and the Institute of Chartered Accountants in Australia and New Zealand.
Andrew Wilkinson B.Bus, CFTP, MAICD
Responsible Manager of the Company under the Company’s Australian Financial Services Licence (AFSL)
Andrew was appointed Managing Director of the Company in November 2004. He joined ALE as Chief Executive Officer at the time of its listing in November 2003. Andrew has around 35 years’ experience in banking, corporate finance and funds management. He was previously a corporate finance partner with PricewaterhouseCoopers and spent 15 years in finance and investment banking with organisations including ANZ Capel Court and Schroders.
Page 4 ALE Property Group
For
per
sona
l use
onl
y
DIRECTORS' REPORTFor the Year ended 30 June 2018
Role
Number held at the start of the year
Net movement
Number held at the end of
the yearR W Mactier Non-executive Director 50,000 - 50,000 P J Downes Non-executive Director 189,110 - 189,110 P G Say Non-executive Director 25,000 - 25,000 N J Milne Non-executive Director 20,000 - 20,000 J T McNally Non-executive Director 55,164 - 55,164 M P Triguboff Non-executive Director - - - A F O Wilkinson Executive Director 367,737 63,732 431,469 A J Slade Capital Manager 60,000 - 60,000 M J Clarke Company Secretary and Finance Manager 18,000 - 18,000 D J Shipway Asset Manager 12,825 (6,325) 6,500
Role
Number held at the start of the
year
Granted during the
year
Lapsed / Delivered
during the year
Number held at the end of
the year
A F O Wilkinson Executive Director 124,117 34,082 (63,732) 94,467 A J Slade Capital Manager 60,773 18,475 (31,375) 47,873 M J Clarke Finance Manager 19,445 4,870 (7,844) 16,471 D J Shipway Asset Manager 10,657 3,044 (3,922) 9,779
Director Held1 Attended Held1 Attended Held1 AttendedR W Mactier 11 11 7 7 5 5P J Downes 11 11 7 7 5 5P G Say 11 10 7 7 5 5N J Milne 11 11 7 7 5 5J T McNally 11 10 n/a n/a n/a n/aM P Triguboff 5 4 n/a n/a n/a n/aA F O Wilkinson 11 11 n/a n/a n/a n/a
Member of Audit, Compliance and Risk Management Committee D J Lawler n/a n/a 4 3 n/a n/a
1 “Held” reflects the number of meetings which the director or member was eligible to attend.
Directors’ and key management personnel interests in stapled securities and ESSS rights
in the nature of these activities during the year.The principal activities of ALE consist of investment in property and property funds management. There has been no significant change4. PRINCIPAL ACTIVITIES
Board
The number of meetings of the Company’s Board of Directors held and of each Board committee during the year ended 30 June 2018 andthe number of meetings attended by each director at the time the director held office during the year were:
Nominations Committee and Remuneration
Committee
Meetings of directors
The following directors, key management personnel and their associates held or currently hold the following stapled security interests in ALE:
ESSS RightsName
The following key management personnel currently hold rights over stapled securities in ALE:
ACRMC
Name
Page 5 ALE Property Group
For
per
sona
l use
onl
y
DIRECTORS' REPORTFor the Year ended 30 June 2018
5. OPERATIONAL AND FINANCIAL REVIEW
Background
••
•••
Significant changes in the state of affairs
••
Current year performance
•
•
•
•••
In the opinion of the directors, the following significant changes in the state of affairs of ALE occurred during the year:The 86 individual property values increased by an average of 5.0% to $1,136.3 million; andNet Assets increased by 5.8% to $620.1 million and net borrowings (total borrowings less cash) as a percentage of assets (total assets less cash, derivatives and deferred tax assets) decreased from 42.7% to 41.6%.
Fair value adjustments to investment properties decreased from $89.6 million to $54.3 million in the current year due to lower reductions in capitalisation rates;
There is a full open market rent review (no cap and collar) in November 2028.
Interest income was lower due to lower average funds on deposit;Finance costs were higher due to the higher net borrowings; and
ALE Property Group is the owner of Australia's largest portfolio of freehold pub properties. Established in November 2003, ALE owns a portfolio of 86 pub properties across the five mainland states of Australia. All of the properties in the portfolio are leased to Australian Leisure and Hospitality Group Pty Limited (ALH) for an average remaining initial lease term of 10.3 years plus options for ALH to extend.
ALE's high quality freehold pubs have long term leases that include a number of unique features that add to the security of net income and opportunity for rental growth. Some of the significant features of the leases (for 83 of the 86 properties) are as follows:
For most of the properties the leases commenced in November 2003 with an initial term of 25 years to 2028;
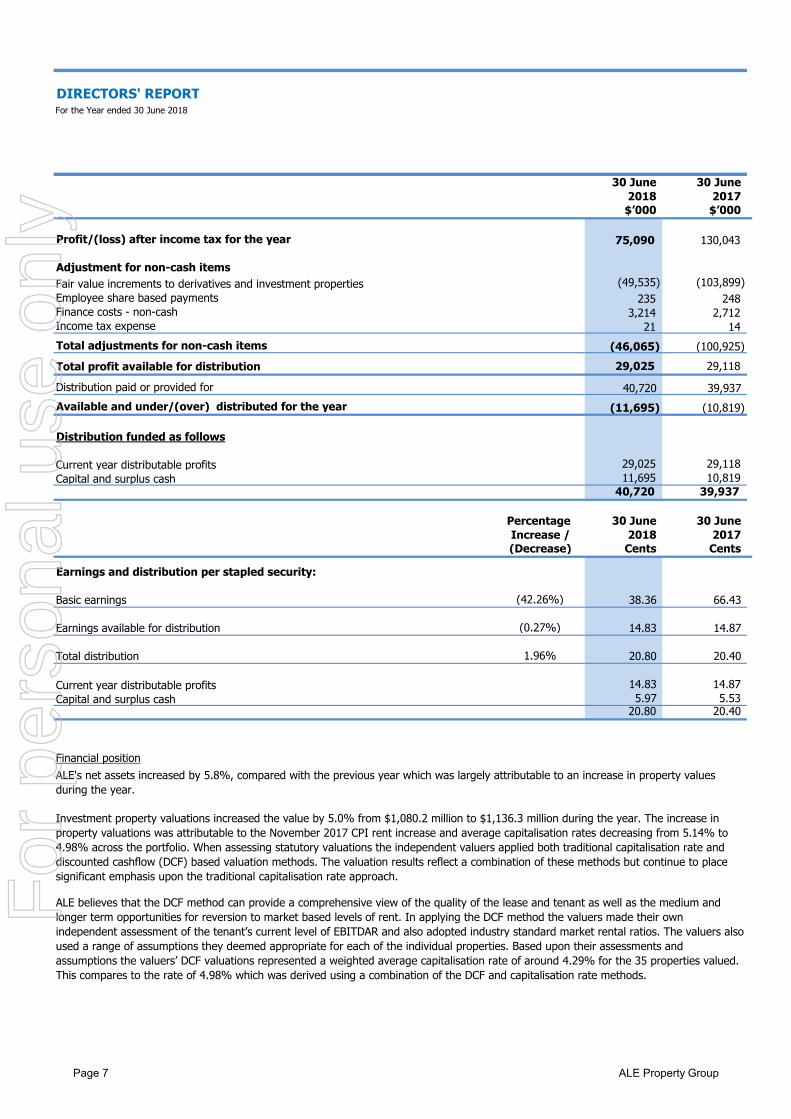
During the financial year ALE produced a distributable profit of $29.0 million compared to $29.1 million in the previous financial year. The table below separates the cash components of ALE's profit that are available for distribution from the non-cash components. The directors believe this will assist stapled securityholders in understanding the results of operations and distributions of ALE. Distributable Profit was primarily impacted by the same cash items that affected Operating Profit, namely changes in rent, finance costs and management expenses.
ALE has a policy of paying distributions which are subject to the minimum requirement to distribute taxable income of the trust under the Trust Deed. Distributable Profit is a non-IFRS measure that shows how free cash flow is calculated by ALE. Distributable Profit excludes items such as unrealised fair value (increments)/decrements arising from the effect of revaluing derivatives and investment property, non-cash expenses and non-cash financing costs.
ALE produced a profit after tax of $75.1 million for the year ended 30 June 2018 compared to a profit of $130.0 million for the year ended 30 June 2017. The decrease is primarily due to:
Annual CPI rent increases are not subject to any cap and rents do not decline with negative CPI;There is a market rent review in November 2018 that is capped and collared within 10% of the 2017 rent; and
The leases are triple net which require ALH to take responsibility for rates, insurance and essentially all structural repairs and maintenance, as well as land tax in all states except Queensland (three of the 86 properties are double net);
Management costs increased during the year due to costs associated with various rent review and property related projects. ALE's management expense ratio continues to be one of the lowest in the A-REIT sector.
Rental income increased by 1.9% due to the full year impact of the November 2016 rent review of 1.4% and the part year impact of the November 2017 rent review of 1.9%;
Fair value adjustments to derivatives liabilities decreased from a $14.3 million increment in the prior year to a $4.7 million decrement in the current year as long term interest rates decreased;
Page 6 ALE Property Group
For
per
sona
l use
onl
y
DIRECTORS' REPORTFor the Year ended 30 June 2018
30 June 30 June 2018 2017 $’000 $’000
Profit/(loss) after income tax for the year 75,090 130,043
Adjustment for non-cash itemsFair value increments to derivatives and investment properties (49,535) (103,899) Employee share based payments 235 248 Finance costs - non-cash 3,214 2,712 Income tax expense 21 14 Total adjustments for non-cash items (46,065) (100,925)Total profit available for distribution 29,025 29,118
Distribution paid or provided for 40,720 39,937 Available and under/(over) distributed for the year (11,695) (10,819)
Distribution funded as follows
Current year distributable profits 29,025 29,118 Capital and surplus cash 11,695 10,819
40,720 39,937
Percentage 30 June 30 June Increase / 2018 2017 (Decrease) Cents Cents
Earnings and distribution per stapled security:
(42.26%) 38.36 66.43
(0.27%) 14.83 14.87
1.96% 20.80 20.40
Current year distributable profits 14.83 14.87 Capital and surplus cash 5.97 5.53
20.80 20.40
Financial positionALE's net assets increased by 5.8%, compared with the previous year which was largely attributable to an increase in property values during the year.
Total distribution
Investment property valuations increased the value by 5.0% from $1,080.2 million to $1,136.3 million during the year. The increase in property valuations was attributable to the November 2017 CPI rent increase and average capitalisation rates decreasing from 5.14% to 4.98% across the portfolio. When assessing statutory valuations the independent valuers applied both traditional capitalisation rate and discounted cashflow (DCF) based valuation methods. The valuation results reflect a combination of these methods but continue to place significant emphasis upon the traditional capitalisation rate approach.
ALE believes that the DCF method can provide a comprehensive view of the quality of the lease and tenant as well as the medium and longer term opportunities for reversion to market based levels of rent. In applying the DCF method the valuers made their own independent assessment of the tenant’s current level of EBITDAR and also adopted industry standard market rental ratios. The valuers also used a range of assumptions they deemed appropriate for each of the individual properties. Based upon their assessments and assumptions the valuers’ DCF valuations represented a weighted average capitalisation rate of around 4.29% for the 35 properties valued. This compares to the rate of 4.98% which was derived using a combination of the DCF and capitalisation rate methods.
Earnings available for distribution
Basic earnings
Page 7 ALE Property Group
For
per
sona
l use
onl
y
DIRECTORS' REPORTFor the Year ended 30 June 2018
ALE‘s debt capital structure continues to be characterised by the following positive features:
investment grade credit rating of Baa2 (stable); debt maturity dates that are diversified over the next 5.4 years; 100% of forecast net debt hedged for the next 7.4 years; interest cover ratio well above covenant level at 2.6 times; all up cash interest rate of 4.26% p.a. fixed until the next refinancing in August 2020; and lower covenent gearing of 41.6% (2017: 42.7%).
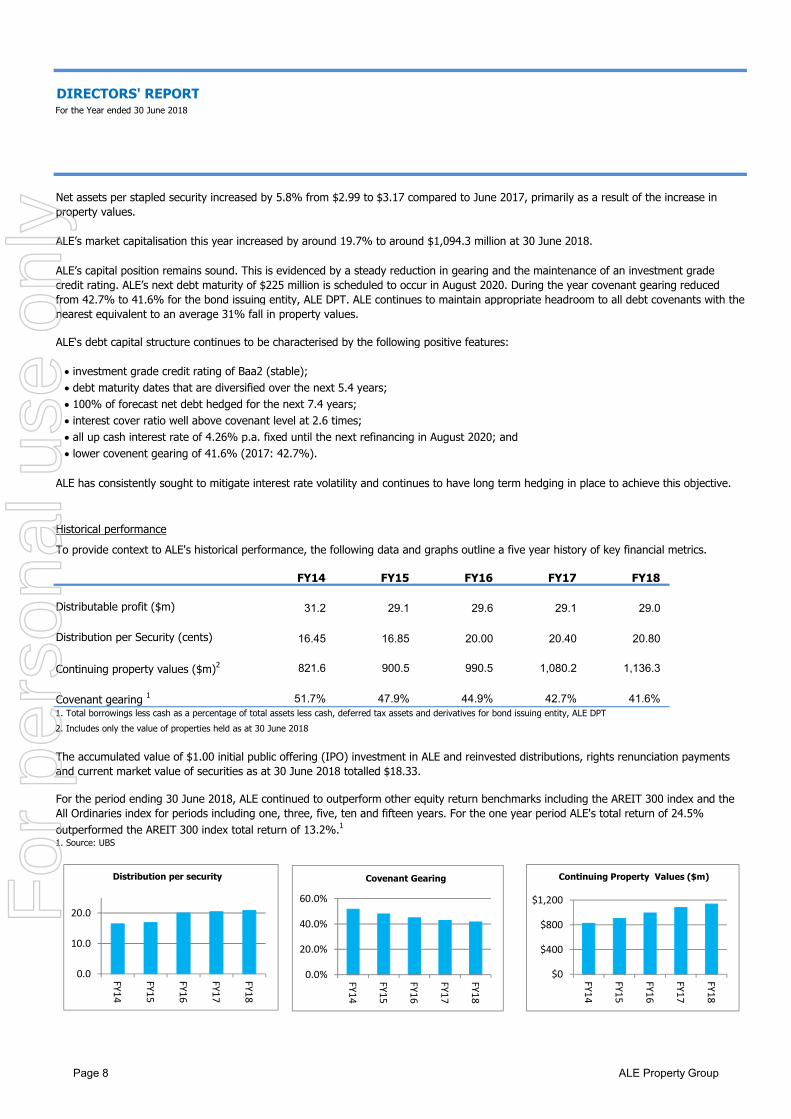
Historical performance
FY14 FY15 FY16 FY17 FY18
31.2 29.1 29.6 29.1 29.0
16.45 16.85 20.00 20.40 20.80
821.6 900.5 990.5 1,080.2 1,136.3
51.7% 47.9% 44.9% 42.7% 41.6%1. Total borrowings less cash as a percentage of total assets less cash, deferred tax assets and derivatives for bond issuing entity, ALE DPT2. Includes only the value of properties held as at 30 June 2018
To provide context to ALE's historical performance, the following data and graphs outline a five year history of key financial metrics.
Net assets per stapled security increased by 5.8% from $2.99 to $3.17 compared to June 2017, primarily as a result of the increase in property values.
ALE’s market capitalisation this year increased by around 19.7% to around $1,094.3 million at 30 June 2018.
ALE’s capital position remains sound. This is evidenced by a steady reduction in gearing and the maintenance of an investment grade credit rating. ALE’s next debt maturity of $225 million is scheduled to occur in August 2020. During the year covenant gearing reduced from 42.7% to 41.6% for the bond issuing entity, ALE DPT. ALE continues to maintain appropriate headroom to all debt covenants with the nearest equivalent to an average 31% fall in property values.
ALE has consistently sought to mitigate interest rate volatility and continues to have long term hedging in place to achieve this objective.
Distributable profit ($m)
Continuing property values ($m)2
Covenant gearing 1
The accumulated value of $1.00 initial public offering (IPO) investment in ALE and reinvested distributions, rights renunciation payments and current market value of securities as at 30 June 2018 totalled $18.33.
For the period ending 30 June 2018, ALE continued to outperform other equity return benchmarks including the AREIT 300 index and the All Ordinaries index for periods including one, three, five, ten and fifteen years. For the one year period ALE's total return of 24.5% outperformed the AREIT 300 index total return of 13.2%.1
Distribution per Security (cents)
1. Source: UBS
0.0
10.0
20.0
FY14
FY15
FY16
FY17
FY18
Distribution per security
0.0%
20.0%
40.0%
60.0%
FY14
FY15
FY16
FY17
FY18
Covenant Gearing
$0
$400
$800
$1,200
FY14
FY15
FY16
FY17
FY18
Continuing Property Values ($m)
Page 8 ALE Property Group
For
per
sona
l use
onl
y
DIRECTORS' REPORTFor the Year ended 30 June 2018
1.Includes ALE’s equity market price of $5.59 as at 30 June 2018 and reinvestment of distributions and 2009 renunciation payment2.All Ordinaries Accumulation Index3.BAIC0 Index - Australian credit inflation-linked securities4.UBS S&P REIT 300 Index5.BAMST0 Index- composite of the Composite Bond, Inflation and Credit FRN indices
Business strategies and future prospects
Material business risks
ALE has continued to preserve the quality of the existing property portfolio. The current debt structure and long term hedging position provides significant certainty around a stable distribution profile for the medium term.
ALE is subject to a number of material business risks that may have an impact on the financial prospects of ALE. These risks and how ALE manages them include:
The following chart shows the total annual return of an ALE security since listing in November 2003.
Property valuation risk - the properties that ALE owns have values that are exposed to movements in the Australian commercial property markets, changes in market rent and the general levels of long and short term interest rates. ALE is unable to control the market forces that impact ALE's property values however ALE constantly monitors the property market to assess general trends in property values. ALE undertakes on-going condition and compliance audits of our properties and has independent valuers perform valuations on one third of the property portfolio on an annual basis. Declines in ALE's property values will reduce NTA and could also reduce headroom to debt covenants. At 30 June 2018 the closest debt covenant would be triggered by a decline of around 31% in property values and a resultant average capitalisation rate of 7.26%. By way of comparison it should be noted that in the last 10 years the highest average capitalisation rate of ALE properties has been 6.60%. ALE therefore considers it has sufficient headroom in it's debt covenants.
ALE will continue to seek acquisition opportunities that are of a high quality, meet all specified criteria and represent an accretive value opportunity for securityholders. ALE will also continue to work constructively with ALH with a focus on maintaining and exploring the potential to further enhance the properties' existing strong profitability through development or better site utilisation.
ALE's objective is to continue to grow distributions at least in line with increases in the CPI.
ALE continues to hold a positive outlook for the market rent prospects for the portfolio. In November 2018 the first major review is due with the market rent capped and collared within 10% of the November 2017 rent for the majority of properties. There is also a full open market rent review (no caps or collars) in November 2028.
Page 9 ALE Property Group
For
per
sona
l use
onl
y
DIRECTORS' REPORTFor the Year ended 30 June 2018
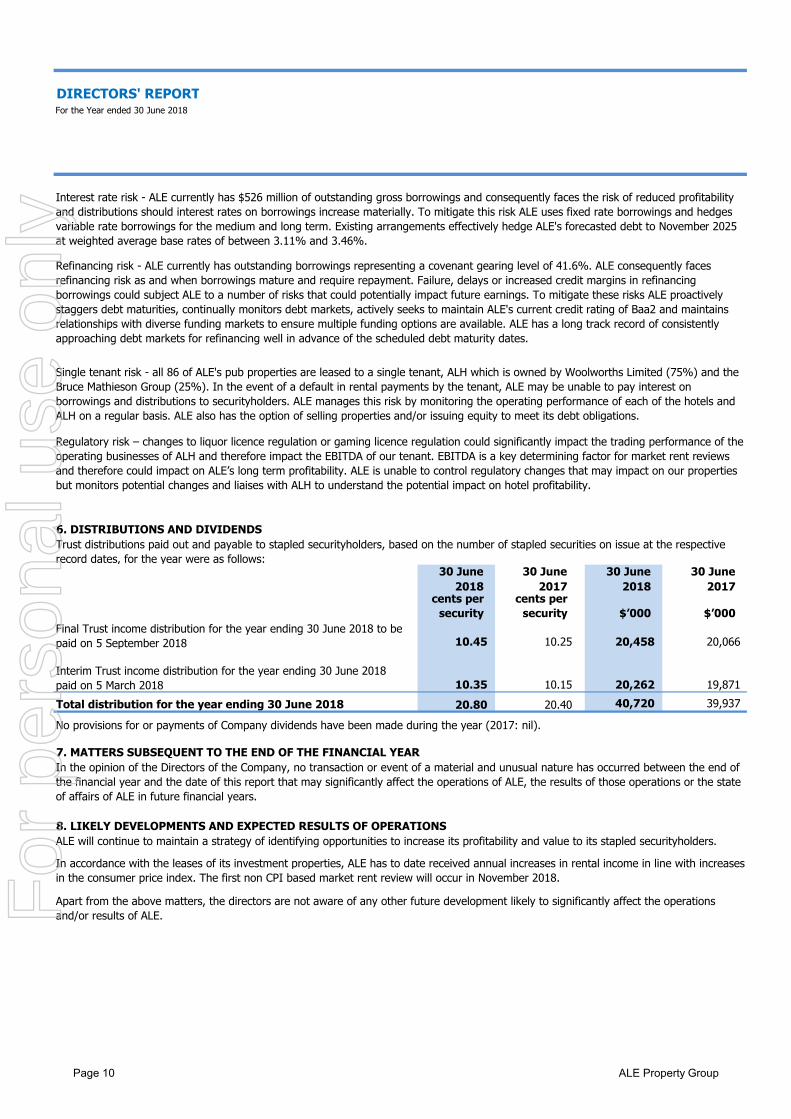
6. DISTRIBUTIONS AND DIVIDENDS
30 June 30 June 30 June 30 June2018 2017 2018 2017
cents per security
cents per security $’000 $’000
10.45 10.25 20,458 20,066
10.35 10.15 20,262 19,871 20.80 20.40 40,720 39,937
7. MATTERS SUBSEQUENT TO THE END OF THE FINANCIAL YEAR
8. LIKELY DEVELOPMENTS AND EXPECTED RESULTS OF OPERATIONS
In accordance with the leases of its investment properties, ALE has to date received annual increases in rental income in line with increases in the consumer price index. The first non CPI based market rent review will occur in November 2018.
Apart from the above matters, the directors are not aware of any other future development likely to significantly affect the operations and/or results of ALE.
ALE will continue to maintain a strategy of identifying opportunities to increase its profitability and value to its stapled securityholders.
Interim Trust income distribution for the year ending 30 June 2018 paid on 5 March 2018Total distribution for the year ending 30 June 2018
No provisions for or payments of Company dividends have been made during the year (2017: nil).
In the opinion of the Directors of the Company, no transaction or event of a material and unusual nature has occurred between the end of the financial year and the date of this report that may significantly affect the operations of ALE, the results of those operations or the state of affairs of ALE in future financial years.
Trust distributions paid out and payable to stapled securityholders, based on the number of stapled securities on issue at the respective record dates, for the year were as follows:
Final Trust income distribution for the year ending 30 June 2018 to be paid on 5 September 2018
Regulatory risk – changes to liquor licence regulation or gaming licence regulation could significantly impact the trading performance of the operating businesses of ALH and therefore impact the EBITDA of our tenant. EBITDA is a key determining factor for market rent reviews and therefore could impact on ALE’s long term profitability. ALE is unable to control regulatory changes that may impact on our properties but monitors potential changes and liaises with ALH to understand the potential impact on hotel profitability.
Interest rate risk - ALE currently has $526 million of outstanding gross borrowings and consequently faces the risk of reduced profitability and distributions should interest rates on borrowings increase materially. To mitigate this risk ALE uses fixed rate borrowings and hedges variable rate borrowings for the medium and long term. Existing arrangements effectively hedge ALE's forecasted debt to November 2025 at weighted average base rates of between 3.11% and 3.46%.
Refinancing risk - ALE currently has outstanding borrowings representing a covenant gearing level of 41.6%. ALE consequently faces refinancing risk as and when borrowings mature and require repayment. Failure, delays or increased credit margins in refinancing borrowings could subject ALE to a number of risks that could potentially impact future earnings. To mitigate these risks ALE proactively staggers debt maturities, continually monitors debt markets, actively seeks to maintain ALE's current credit rating of Baa2 and maintains relationships with diverse funding markets to ensure multiple funding options are available. ALE has a long track record of consistently approaching debt markets for refinancing well in advance of the scheduled debt maturity dates.
Single tenant risk - all 86 of ALE's pub properties are leased to a single tenant, ALH which is owned by Woolworths Limited (75%) and the Bruce Mathieson Group (25%). In the event of a default in rental payments by the tenant, ALE may be unable to pay interest on borrowings and distributions to securityholders. ALE manages this risk by monitoring the operating performance of each of the hotels and ALH on a regular basis. ALE also has the option of selling properties and/or issuing equity to meet its debt obligations.
Page 10 ALE Property Group
For
per
sona
l use
onl
y
DIRECTORS' REPORTFor the Year ended 30 June 2018
9 REMUNERATION REPORT (Audited)
9.1 Remuneration Objectives and Approach
●●●
●
●●●●
●
9.2 Remuneration Committee
●●●
P G SayP J DownesN J MilneR W Mactier
The Remuneration Report presented below is the remuneration report included in the Directors' Report of Australian Leisure and Entertainment Property Management Limited (the “Company”). This report provides details on ALE's remuneration structure, decisions and outcomes for the year ended 30 June 2018 for employees of ALE including the directors, the Managing Director and key management personnel. This information has been audited as required by section 308(3C) of the Act.
In determining a remuneration framework, the Board aims to ensure the following:attract, reward and retain high calibre executives;motivate executives to achieve performance that creates value for stapled securityholders; and
The framework aligns executive reward with achievement of strategic objectives and creation of value for stapled securityholders. To do thisthe Board endeavours to ensure that executive reward satisfies the following objectives:
alignment with ALE's financial, operational, compliance and risk management objectives so as to achieve alignment with positiveoutcomes for stapled securityholders;alignment with ALE's overall performance;transparent, reasonable and acceptable to employees and securityholders;rewards the responsibility, capability, experience and contribution made by executives;
ensure there is an appropriate mix between fixed and "at risk" remuneration.
Page 2 of this report provides information on the skills, experience and expertise of the Committee members.
Non-executive Director Chairman of Remuneration Committee
The Committee operates independently of management in its recommendations to the Board and engages remuneration consultants independently of management. During the year ended 30 June 2018, the Committee consisted of the following:
Non-executive Director
link remuneration to performance and outcomes achieved.
The Remuneration Committee ("the Committee") is a committee comprising non-executive directors of the Company. The Committee strives to ensure that ALE's remuneration structure strikes an appropriate balance between the interests of ALE securityholders and rewarding, motivating and retaining employees.
The framework provides a mix of fixed and variable remuneration. Since the year ending 30 June 2012 the variable remuneration has been provided through the Executive Incentive Scheme (EIS). Any award under the EIS is paid 50% in cash following the year end and 50% in stapled securities with delivery deferred three years.
market competitive and complementary to the reward strategy of the organisation.
reward executive performance against agreed strategic objectives;encourage alignment of the interests of executives and stapled securityholders; and
The Committee's charter sets out its role and responsibilities. The charter is reviewed on an annual basis. In fulfilling its role the Committeeendeavours to ensure the remuneration framework established will:
recognises individual executive's contributions towards value accretive outcomes when measured against Key Performance Indicators (KPI's); and
Non-executive DirectorNon-executive Director
Conari Partners was paid $16,000 for its services.
The number of meetings held by the Committee and the members' attendance at them is set out on page 5.
The Committee considers advice from a wide range of external advisors in performing its role. During the current financial year the Committee engaged Conari Partners to review remuneration.
Page 11 ALE Property Group
For
per
sona
l use
onl
y
DIRECTORS' REPORTFor the Year ended 30 June 2018
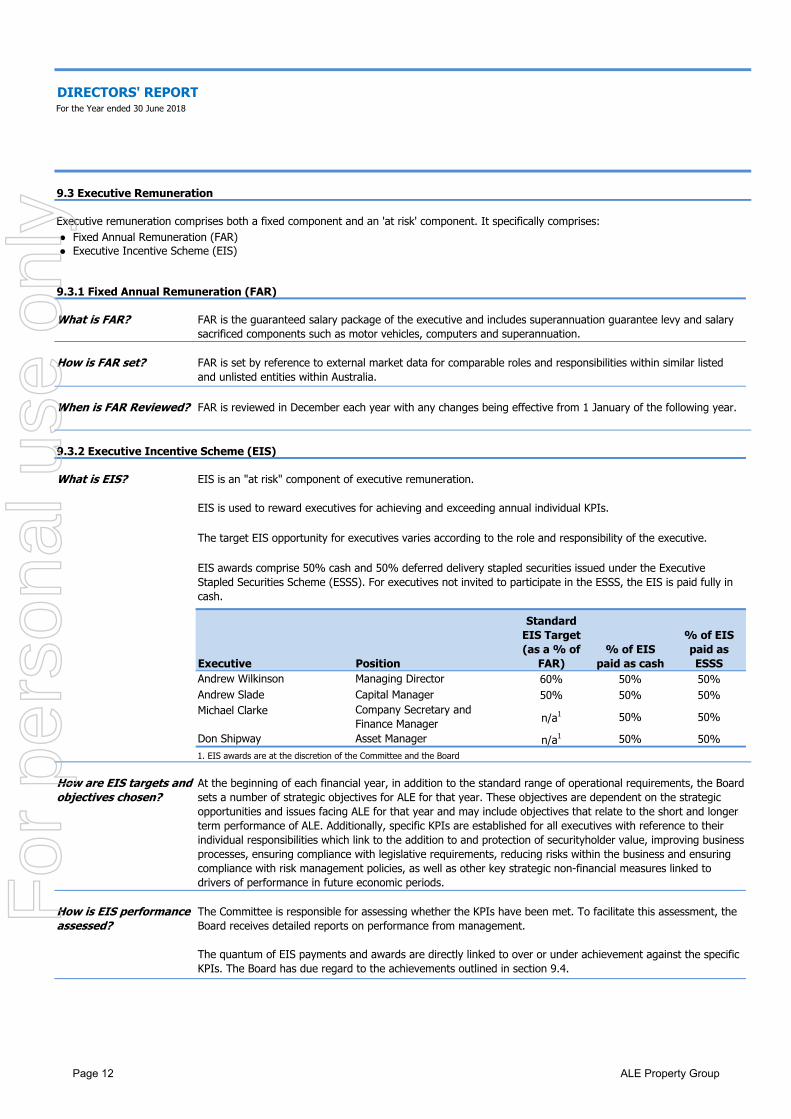
9.3 Executive Remuneration
●●
9.3.1 Fixed Annual Remuneration (FAR)
What is FAR?
How is FAR set?
When is FAR Reviewed?
9.3.2 Executive Incentive Scheme (EIS)
What is EIS? EIS is an "at risk" component of executive remuneration.
Executive Position
Standard EIS Target (as a % of
FAR)% of EIS
paid as cash
% of EIS paid as ESSS
60% 50% 50%50% 50% 50%
n/a1 50% 50%
n/a1 50% 50%
At the beginning of each financial year, in addition to the standard range of operational requirements, the Board sets a number of strategic objectives for ALE for that year. These objectives are dependent on the strategic opportunities and issues facing ALE for that year and may include objectives that relate to the short and longer term performance of ALE. Additionally, specific KPIs are established for all executives with reference to their individual responsibilities which link to the addition to and protection of securityholder value, improving business processes, ensuring compliance with legislative requirements, reducing risks within the business and ensuring compliance with risk management policies, as well as other key strategic non-financial measures linked to drivers of performance in future economic periods.
The Committee is responsible for assessing whether the KPIs have been met. To facilitate this assessment, the Board receives detailed reports on performance from management.
The quantum of EIS payments and awards are directly linked to over or under achievement against the specific KPIs. The Board has due regard to the achievements outlined in section 9.4.
Managing DirectorCapital Manager
FAR is the guaranteed salary package of the executive and includes superannuation guarantee levy and salary sacrificed components such as motor vehicles, computers and superannuation.
FAR is set by reference to external market data for comparable roles and responsibilities within similar listed and unlisted entities within Australia.
FAR is reviewed in December each year with any changes being effective from 1 January of the following year.
Andrew WilkinsonAndrew Slade
EIS awards comprise 50% cash and 50% deferred delivery stapled securities issued under the Executive Stapled Securities Scheme (ESSS). For executives not invited to participate in the ESSS, the EIS is paid fully in cash.
Fixed Annual Remuneration (FAR)Executive Incentive Scheme (EIS)
Company Secretary and Finance ManagerAsset Manager
Michael Clarke
Executive remuneration comprises both a fixed component and an 'at risk' component. It specifically comprises:
Don Shipway1. EIS awards are at the discretion of the Committee and the Board
EIS is used to reward executives for achieving and exceeding annual individual KPIs.
The target EIS opportunity for executives varies according to the role and responsibility of the executive.
How are EIS targets and objectives chosen?
How is EIS performance assessed?
Page 12 ALE Property Group
For
per
sona
l use
onl
y
DIRECTORS' REPORTFor the Year ended 30 June 2018
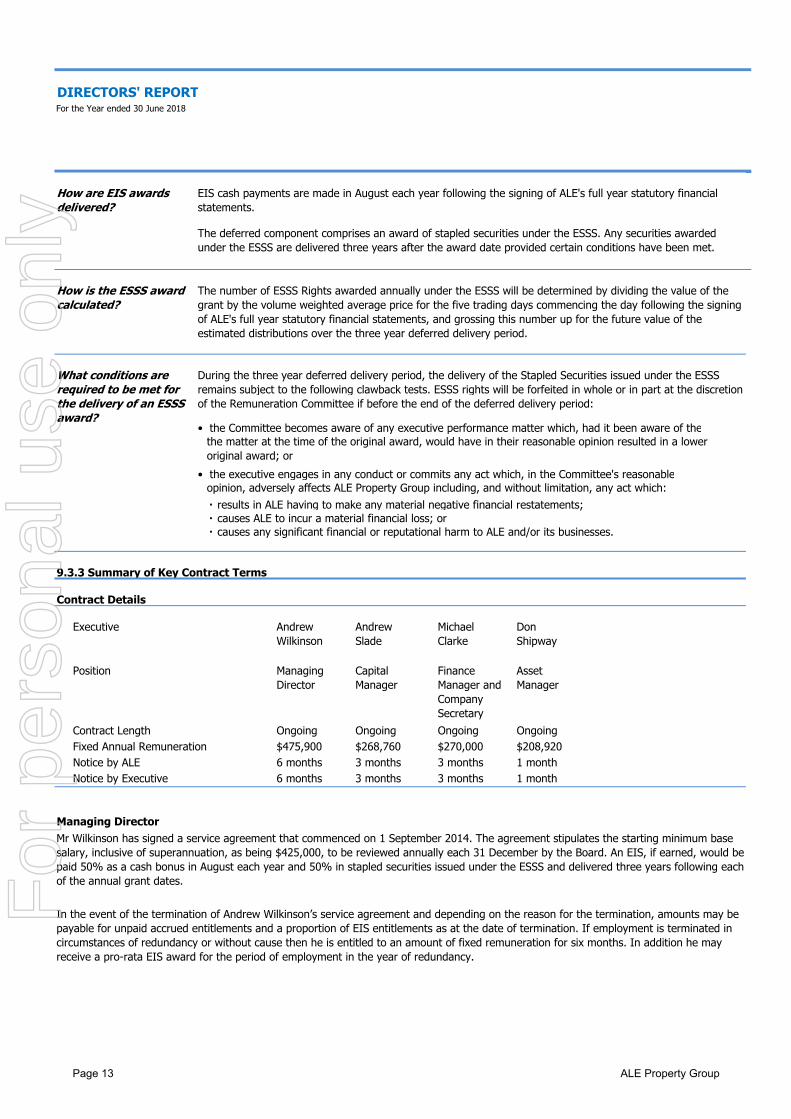
Contract Details
Executive Andrew Wilkinson
Andrew Slade
Michael Clarke
Don Shipway
Position Managing Director
Capital Manager
Finance Manager and Company Secretary
Asset Manager
Contract Length Ongoing Ongoing Ongoing Ongoing$475,900 $268,760 $270,000 $208,920
Notice by ALE 6 months 3 months 3 months 1 monthNotice by Executive 6 months 3 months 3 months 1 month
Managing Director
In the event of the termination of Andrew Wilkinson’s service agreement and depending on the reason for the termination, amounts may be payable for unpaid accrued entitlements and a proportion of EIS entitlements as at the date of termination. If employment is terminated in circumstances of redundancy or without cause then he is entitled to an amount of fixed remuneration for six months. In addition he may receive a pro-rata EIS award for the period of employment in the year of redundancy.
Fixed Annual Remuneration
Mr Wilkinson has signed a service agreement that commenced on 1 September 2014. The agreement stipulates the starting minimum base salary, inclusive of superannuation, as being $425,000, to be reviewed annually each 31 December by the Board. An EIS, if earned, would be paid 50% as a cash bonus in August each year and 50% in stapled securities issued under the ESSS and delivered three years following each of the annual grant dates.
causes any significant financial or reputational harm to ALE and/or its businesses.・
9.3.3 Summary of Key Contract Terms
• the executive engages in any conduct or commits any act which, in the Committee's reasonable
results in ALE having to make any material negative financial restatements;・ causes ALE to incur a material financial loss; or・
• the Committee becomes aware of any executive performance matter which, had it been aware of thethe matter at the time of the original award, would have in their reasonable opinion resulted in a lower original award; or
opinion, adversely affects ALE Property Group including, and without limitation, any act which:
How are EIS awards delivered?
During the three year deferred delivery period, the delivery of the Stapled Securities issued under the ESSS remains subject to the following clawback tests. ESSS rights will be forfeited in whole or in part at the discretion of the Remuneration Committee if before the end of the deferred delivery period:
EIS cash payments are made in August each year following the signing of ALE's full year statutory financial statements.
The deferred component comprises an award of stapled securities under the ESSS. Any securities awarded under the ESSS are delivered three years after the award date provided certain conditions have been met.
The number of ESSS Rights awarded annually under the ESSS will be determined by dividing the value of the grant by the volume weighted average price for the five trading days commencing the day following the signing of ALE's full year statutory financial statements, and grossing this number up for the future value of the estimated distributions over the three year deferred delivery period.
What conditions are required to be met for the delivery of an ESSS award?
How is the ESSS award calculated?
Page 13 ALE Property Group
For
per
sona
l use
onl
y
DIRECTORS' REPORTFor the Year ended 30 June 2018
9.4 Executive Remuneration outcome for year ended 30 June 2018
The amount of remuneration paid to Directors and Key Management Personnel is detailed in the table on page 17.
Executive Incentive Scheme Outcomes
●
●
●●●
●
●●
●
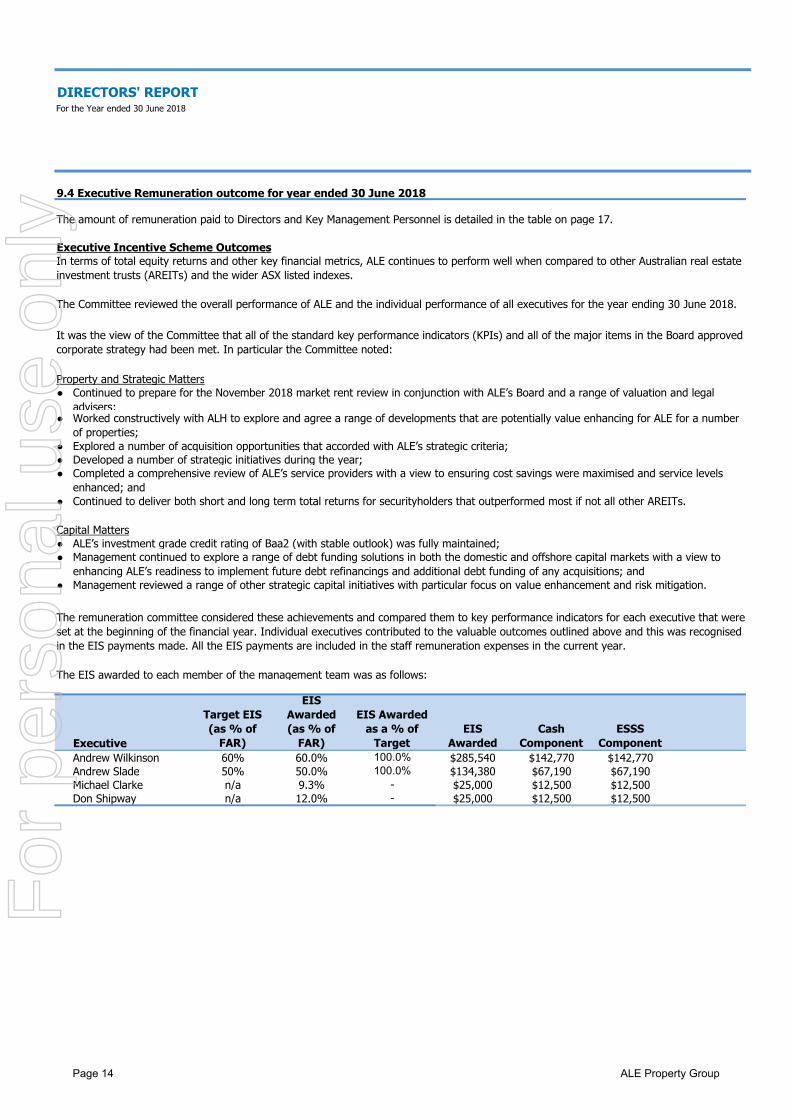
The EIS awarded to each member of the management team was as follows:
Executive
Target EIS (as % of
FAR)
EIS Awarded (as % of
FAR)
EIS Awarded as a % of
TargetEIS
Awarded Cash
ComponentESSS
ComponentAndrew Wilkinson 60% 60.0% 100.0% $285,540 $142,770 $142,770Andrew Slade 50% 50.0% 100.0% $134,380 $67,190 $67,190Michael Clarke n/a 9.3% - $25,000 $12,500 $12,500Don Shipway n/a 12.0% - $25,000 $12,500 $12,500
Continued to prepare for the November 2018 market rent review in conjunction with ALE’s Board and a range of valuation and legal advisers;
ALE’s investment grade credit rating of Baa2 (with stable outlook) was fully maintained;
Management reviewed a range of other strategic capital initiatives with particular focus on value enhancement and risk mitigation.
Explored a number of acquisition opportunities that accorded with ALE’s strategic criteria;
In terms of total equity returns and other key financial metrics, ALE continues to perform well when compared to other Australian real estate investment trusts (AREITs) and the wider ASX listed indexes.
The Committee reviewed the overall performance of ALE and the individual performance of all executives for the year ending 30 June 2018.
It was the view of the Committee that all of the standard key performance indicators (KPIs) and all of the major items in the Board approved corporate strategy had been met. In particular the Committee noted:
Capital Matters
Management continued to explore a range of debt funding solutions in both the domestic and offshore capital markets with a view to enhancing ALE’s readiness to implement future debt refinancings and additional debt funding of any acquisitions; and
Property and Strategic Matters
Developed a number of strategic initiatives during the year;Completed a comprehensive review of ALE’s service providers with a view to ensuring cost savings were maximised and service levels enhanced; andContinued to deliver both short and long term total returns for securityholders that outperformed most if not all other AREITs.
The remuneration committee considered these achievements and compared them to key performance indicators for each executive that were set at the beginning of the financial year. Individual executives contributed to the valuable outcomes outlined above and this was recognised in the EIS payments made. All the EIS payments are included in the staff remuneration expenses in the current year.
Worked constructively with ALH to explore and agree a range of developments that are potentially value enhancing for ALE for a number of properties;
Page 14 ALE Property Group
For
per
sona
l use
onl
y
DIRECTORS' REPORTFor the Year ended 30 June 2018
Consequences of performance on securityholder wealth
9.5 Disclosures relating to equity instruments granted as compensation
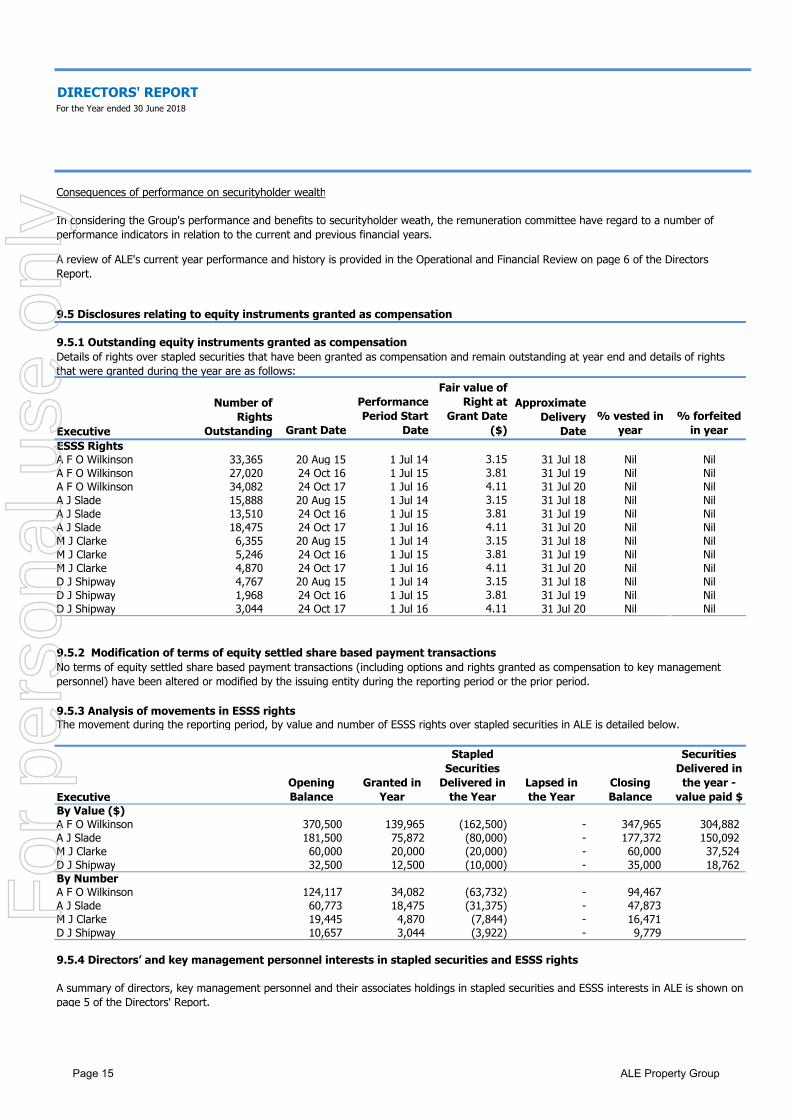
9.5.1 Outstanding equity instruments granted as compensation
Executive Grant Date
Performance Period Start
Date
Fair value of Right at
Grant Date ($)
% vested in year
% forfeited in year
ESSS RightsA F O Wilkinson 33,365 20 Aug 15 1 Jul 14 3.15 31 Jul 18 Nil NilA F O Wilkinson 27,020 24 Oct 16 1 Jul 15 3.81 31 Jul 19 Nil NilA F O Wilkinson 34,082 24 Oct 17 1 Jul 16 4.11 31 Jul 20 Nil NilA J Slade 15,888 20 Aug 15 1 Jul 14 3.15 31 Jul 18 Nil NilA J Slade 13,510 24 Oct 16 1 Jul 15 3.81 31 Jul 19 Nil NilA J Slade 18,475 24 Oct 17 1 Jul 16 4.11 31 Jul 20 Nil NilM J Clarke 6,355 20 Aug 15 1 Jul 14 3.15 31 Jul 18 Nil NilM J Clarke 5,246 24 Oct 16 1 Jul 15 3.81 31 Jul 19 Nil NilM J Clarke 4,870 24 Oct 17 1 Jul 16 4.11 31 Jul 20 Nil NilD J Shipway 4,767 20 Aug 15 1 Jul 14 3.15 31 Jul 18 Nil NilD J Shipway 1,968 24 Oct 16 1 Jul 15 3.81 31 Jul 19 Nil NilD J Shipway 3,044 24 Oct 17 1 Jul 16 4.11 31 Jul 20 Nil Nil
9.5.2 Modification of terms of equity settled share based payment transactions
9.5.3 Analysis of movements in ESSS rightsThe movement during the reporting period, by value and number of ESSS rights over stapled securities in ALE is detailed below.
ExecutiveOpening Balance
Granted in Year
Stapled Securities
Delivered in the Year
Lapsed in the Year
Closing Balance
Securities Delivered in the year -
value paid $By Value ($)A F O Wilkinson 370,500 139,965 (162,500) - 347,965 304,882 A J Slade 181,500 75,872 (80,000) - 177,372 150,092 M J Clarke 60,000 20,000 (20,000) - 60,000 37,524 D J Shipway 32,500 12,500 (10,000) - 35,000 18,762 By NumberA F O Wilkinson 124,117 34,082 (63,732) - 94,467 A J Slade 60,773 18,475 (31,375) - 47,873 M J Clarke 19,445 4,870 (7,844) - 16,471 D J Shipway 10,657 3,044 (3,922) - 9,779
Details of rights over stapled securities that have been granted as compensation and remain outstanding at year end and details of rights that were granted during the year are as follows:
Number of Rights
Outstanding
Approximate Delivery
Date
No terms of equity settled share based payment transactions (including options and rights granted as compensation to key management personnel) have been altered or modified by the issuing entity during the reporting period or the prior period.
A review of ALE's current year performance and history is provided in the Operational and Financial Review on page 6 of the Directors Report.
In considering the Group's performance and benefits to securityholder weath, the remuneration committee have regard to a number of performance indicators in relation to the current and previous financial years.
9.5.4 Directors’ and key management personnel interests in stapled securities and ESSS rights
A summary of directors, key management personnel and their associates holdings in stapled securities and ESSS interests in ALE is shown on page 5 of the Directors' Report.
Page 15 ALE Property Group
For
per
sona
l use
onl
y
DIRECTORS' REPORTFor the Year ended 30 June 2018
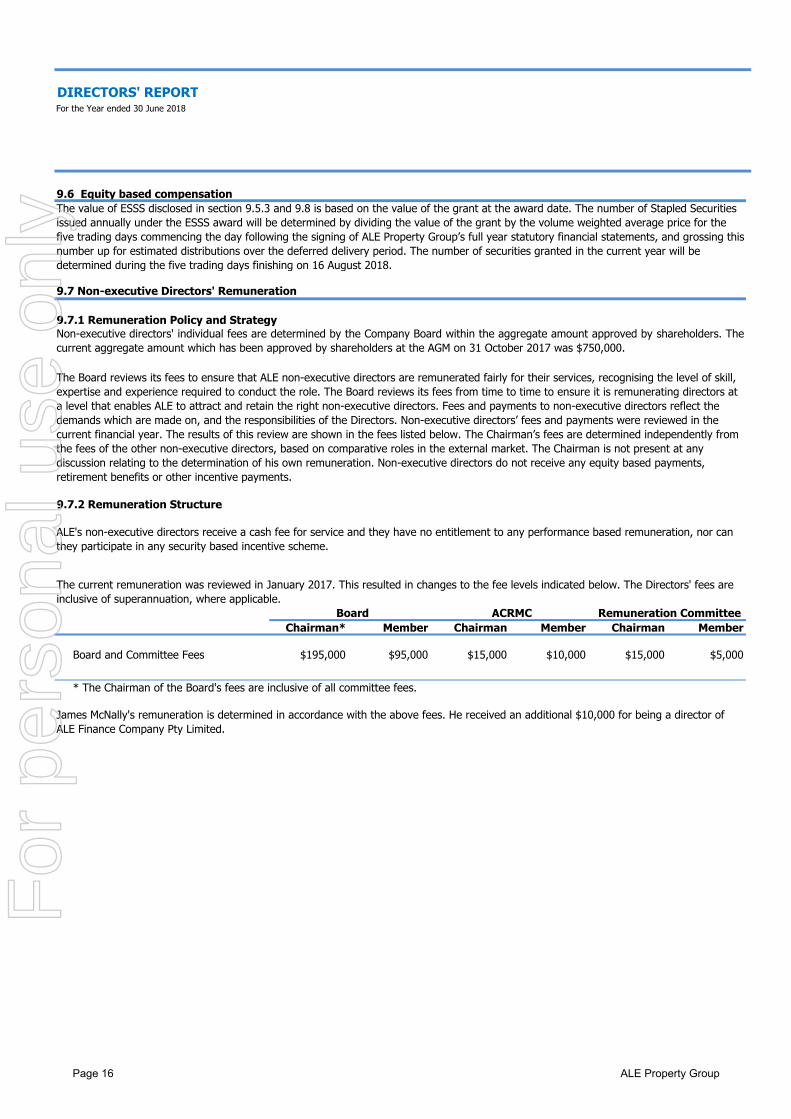
9.7 Non-executive Directors' Remuneration
Chairman* Member Chairman Member Chairman Member
Board and Committee Fees $195,000 $95,000 $15,000 $10,000 $15,000 $5,000
* The Chairman of the Board's fees are inclusive of all committee fees.
James McNally's remuneration is determined in accordance with the above fees. He received an additional $10,000 for being a director of ALE Finance Company Pty Limited.
The value of ESSS disclosed in section 9.5.3 and 9.8 is based on the value of the grant at the award date. The number of Stapled Securities issued annually under the ESSS award will be determined by dividing the value of the grant by the volume weighted average price for the five trading days commencing the day following the signing of ALE Property Group’s full year statutory financial statements, and grossing this number up for estimated distributions over the deferred delivery period. The number of securities granted in the current year will be determined during the five trading days finishing on 16 August 2018.
9.7.1 Remuneration Policy and StrategyNon-executive directors' individual fees are determined by the Company Board within the aggregate amount approved by shareholders. Thecurrent aggregate amount which has been approved by shareholders at the AGM on 31 October 2017 was $750,000.
The Board reviews its fees to ensure that ALE non-executive directors are remunerated fairly for their services, recognising the level of skill, expertise and experience required to conduct the role. The Board reviews its fees from time to time to ensure it is remunerating directors at a level that enables ALE to attract and retain the right non-executive directors. Fees and payments to non-executive directors reflect the demands which are made on, and the responsibilities of the Directors. Non-executive directors’ fees and payments were reviewed in the current financial year. The results of this review are shown in the fees listed below. The Chairman’s fees are determined independently from the fees of the other non-executive directors, based on comparative roles in the external market. The Chairman is not present at any discussion relating to the determination of his own remuneration. Non-executive directors do not receive any equity based payments, retirement benefits or other incentive payments.
9.7.2 Remuneration Structure
ALE's non-executive directors receive a cash fee for service and they have no entitlement to any performance based remuneration, nor can they participate in any security based incentive scheme.
The current remuneration was reviewed in January 2017. This resulted in changes to the fee levels indicated below. The Directors' fees are inclusive of superannuation, where applicable.
Board ACRMC Remuneration Committee
9.6 Equity based compensation
Page 16 ALE Property Group
For
per
sona
l use
onl
y
DIRECTORS' REPORTFor the Year ended 30 June 2018
Post employment benefits
Equity based payment
Name Role Salary & Fees STI Cash BonusNon monetary
benefits TotalSuperannuation
benefitsOther long term
benefitsTermination
benefits ESSS Total$ $ $ $ $ $ $ $ $ $ $
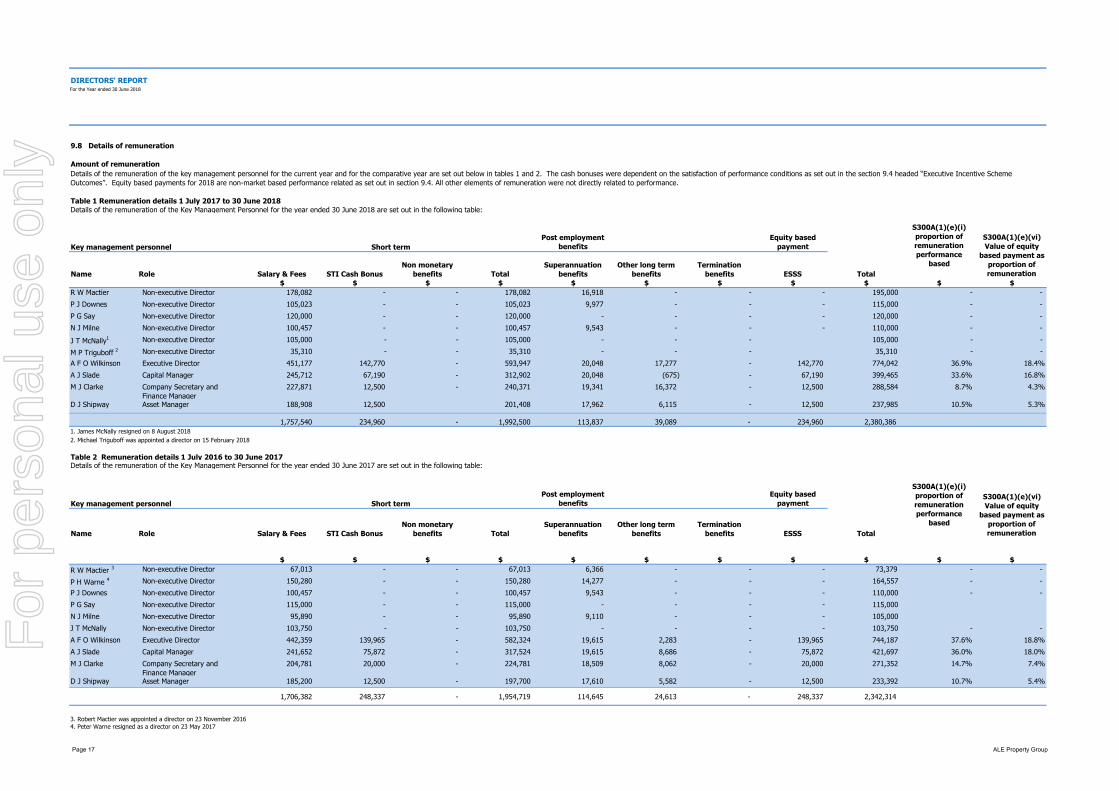
Non-executive Director 178,082 - - 178,082 16,918 - - - 195,000 - - 105,023 - - 105,023 9,977 - - - 115,000 - - 120,000 - - 120,000 - - - - 120,000 - - 100,457 - - 100,457 9,543 - - - 110,000 - - 105,000 - - 105,000 - - - 105,000 - - 35,310 - - 35,310 - - - 35,310 - -
Executive Director 451,177 142,770 - 593,947 20,048 17,277 - 142,770 774,042 36.9% 18.4%Capital Manager 245,712 67,190 - 312,902 20,048 (675) - 67,190 399,465 33.6% 16.8%Company Secretary and Finance Manager
227,871 12,500 - 240,371 19,341 16,372 - 12,500 288,584 8.7% 4.3%
Asset Manager 188,908 12,500 201,408 17,962 6,115 - 12,500 237,985 10.5% 5.3%
1,757,540 234,960 - 1,992,500 113,837 39,089 - 234,960 2,380,386 1. James McNally resigned on 8 August 20182. Michael Triguboff was appointed a director on 15 February 2018
Post employment benefits
Equity based payment
Name Role Salary & Fees STI Cash BonusNon monetary
benefits TotalSuperannuation
benefitsOther long term
benefitsTermination
benefits ESSS Total
$ $ $ $ $ $ $ $ $ $ $Non-executive Director 67,013 - - 67,013 6,366 - - - 73,379 - -
150,280 - - 150,280 14,277 - - - 164,557 - - 100,457 - - 100,457 9,543 - - - 110,000 - - 115,000 - - 115,000 - - - - 115,000 95,890 - - 95,890 9,110 - - - 105,000
103,750 - - 103,750 - - - - 103,750 - - Executive Director 442,359 139,965 - 582,324 19,615 2,283 - 139,965 744,187 37.6% 18.8%Capital Manager 241,652 75,872 - 317,524 19,615 8,686 - 75,872 421,697 36.0% 18.0%Company Secretary and Finance Manager
204,781 20,000 - 224,781 18,509 8,062 - 20,000 271,352 14.7% 7.4%
Asset Manager 185,200 12,500 - 197,700 17,610 5,582 - 12,500 233,392 10.7% 5.4%
1,706,382 248,337 - 1,954,719 114,645 24,613 - 248,337 2,342,314
3. Robert Mactier was appointed a director on 23 November 20164. Peter Warne resigned as a director on 23 May 2017
9.8 Details of remuneration
Amount of remuneration
M J Clarke
A F O Wilkinson
Details of the remuneration of the key management personnel for the current year and for the comparative year are set out below in tables 1 and 2. The cash bonuses were dependent on the satisfaction of performance conditions as set out in the section 9.4 headed “Executive Incentive Scheme Outcomes”. Equity based payments for 2018 are non-market based performance related as set out in section 9.4. All other elements of remuneration were not directly related to performance.
Details of the remuneration of the Key Management Personnel for the year ended 30 June 2018 are set out in the following table:Table 1 Remuneration details 1 July 2017 to 30 June 2018
P J Downes
S300A(1)(e)(vi) Value of equity
based payment as proportion of remuneration
Key management personnel
R W Mactier
Short term
S300A(1)(e)(i) proportion of remuneration performance
based
Non-executive Director
S300A(1)(e)(i) proportion of remuneration performance
based
P G Say
J T McNally Non-executive Director
Short term
Non-executive Director
Non-executive Director
P H Warne 4
A F O Wilkinson
Non-executive Director
R W Mactier 3
Non-executive DirectorN J Milne
Key management personnel
J T McNally1
M P Triguboff 2 Non-executive Director
Non-executive Director
A J Slade
Details of the remuneration of the Key Management Personnel for the year ended 30 June 2017 are set out in the following table:
D J Shipway
M J Clarke
Table 2 Remuneration details 1 July 2016 to 30 June 2017
P J Downes Non-executive DirectorP G Say Non-executive DirectorN J Milne
S300A(1)(e)(vi) Value of equity
based payment as proportion of remuneration
D J Shipway
A J Slade
Page 17 ALE Property Group
For
per
sona
l use
onl
y
DIRECTORS' REPORTFor the Year ended 30 June 2018
30 June 30 June 2018 2017
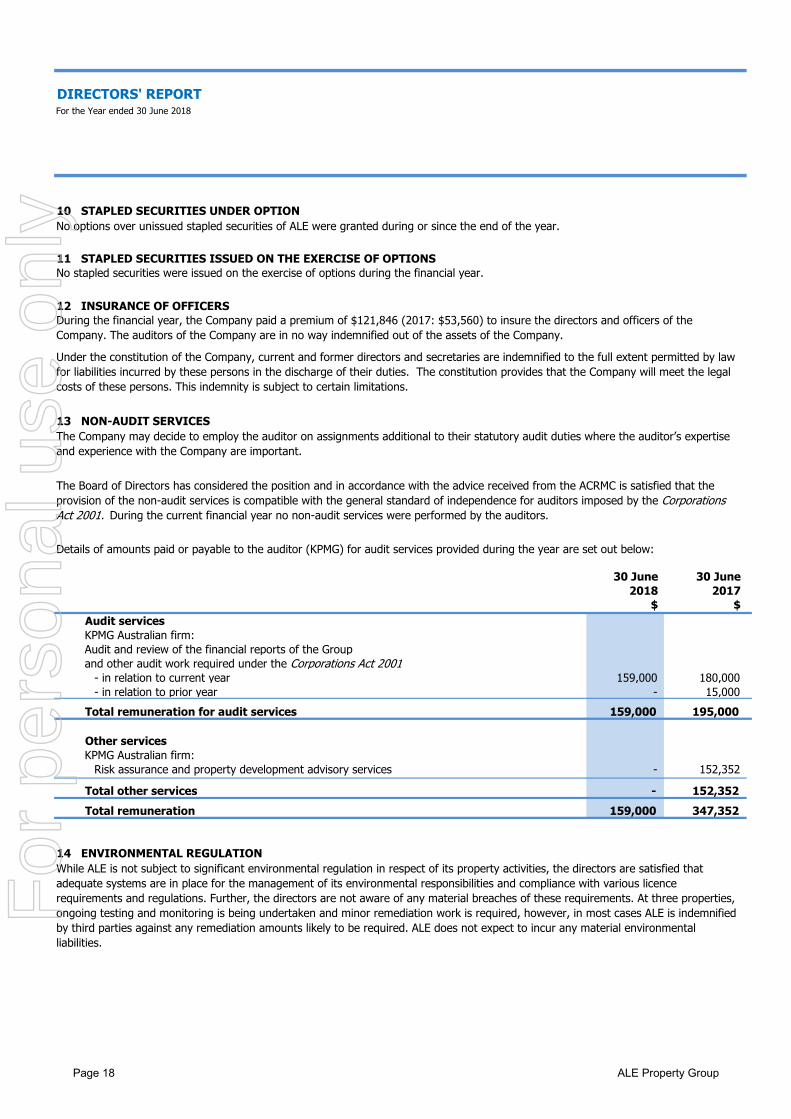
$ $ Audit services KPMG Australian firm:Audit and review of the financial reports of the Group and other audit work required under the Corporations Act 2001
- in relation to current year 159,000 180,000 - in relation to prior year - 15,000
Total remuneration for audit services 159,000 195,000
Other servicesKPMG Australian firm:
Risk assurance and property development advisory services - 152,352
Total other services - 152,352 Total remuneration 159,000 347,352
While ALE is not subject to significant environmental regulation in respect of its property activities, the directors are satisfied that adequate systems are in place for the management of its environmental responsibilities and compliance with various licence requirements and regulations. Further, the directors are not aware of any material breaches of these requirements. At three properties, ongoing testing and monitoring is being undertaken and minor remediation work is required, however, in most cases ALE is indemnified by third parties against any remediation amounts likely to be required. ALE does not expect to incur any material environmental liabilities.
10 STAPLED SECURITIES UNDER OPTION No options over unissued stapled securities of ALE were granted during or since the end of the year.
During the financial year, the Company paid a premium of $121,846 (2017: $53,560) to insure the directors and officers of the Company. The auditors of the Company are in no way indemnified out of the assets of the Company.
11 STAPLED SECURITIES ISSUED ON THE EXERCISE OF OPTIONS No stapled securities were issued on the exercise of options during the financial year.
12 INSURANCE OF OFFICERS
13 NON-AUDIT SERVICES
14 ENVIRONMENTAL REGULATION
Under the constitution of the Company, current and former directors and secretaries are indemnified to the full extent permitted by law for liabilities incurred by these persons in the discharge of their duties. The constitution provides that the Company will meet the legal costs of these persons. This indemnity is subject to certain limitations.
The Company may decide to employ the auditor on assignments additional to their statutory audit duties where the auditor’s expertise and experience with the Company are important.
The Board of Directors has considered the position and in accordance with the advice received from the ACRMC is satisfied that the provision of the non-audit services is compatible with the general standard of independence for auditors imposed by the Corporations Act 2001. During the current financial year no non-audit services were performed by the auditors.
Details of amounts paid or payable to the auditor (KPMG) for audit services provided during the year are set out below:
Page 18 ALE Property Group
For
per
sona
l use
onl
y
DIRECTORS' REPORTFor the Year ended 30 June 2018
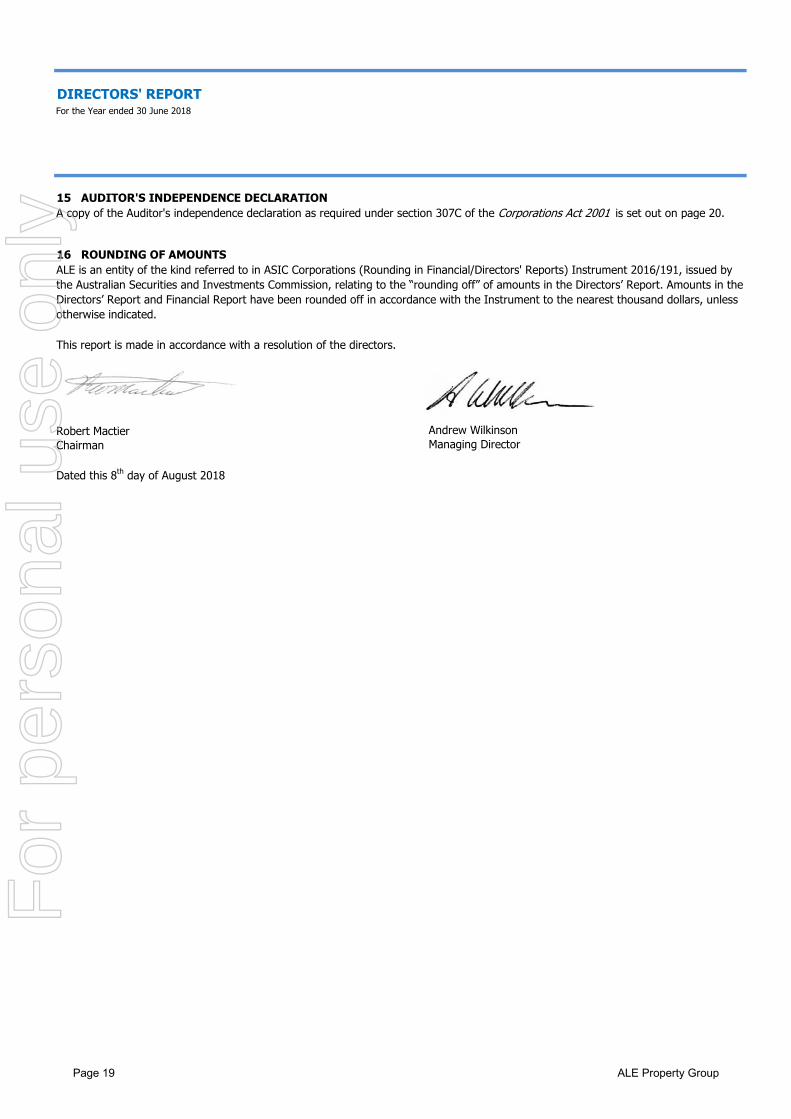
This report is made in accordance with a resolution of the directors.
Andrew WilkinsonManaging Director
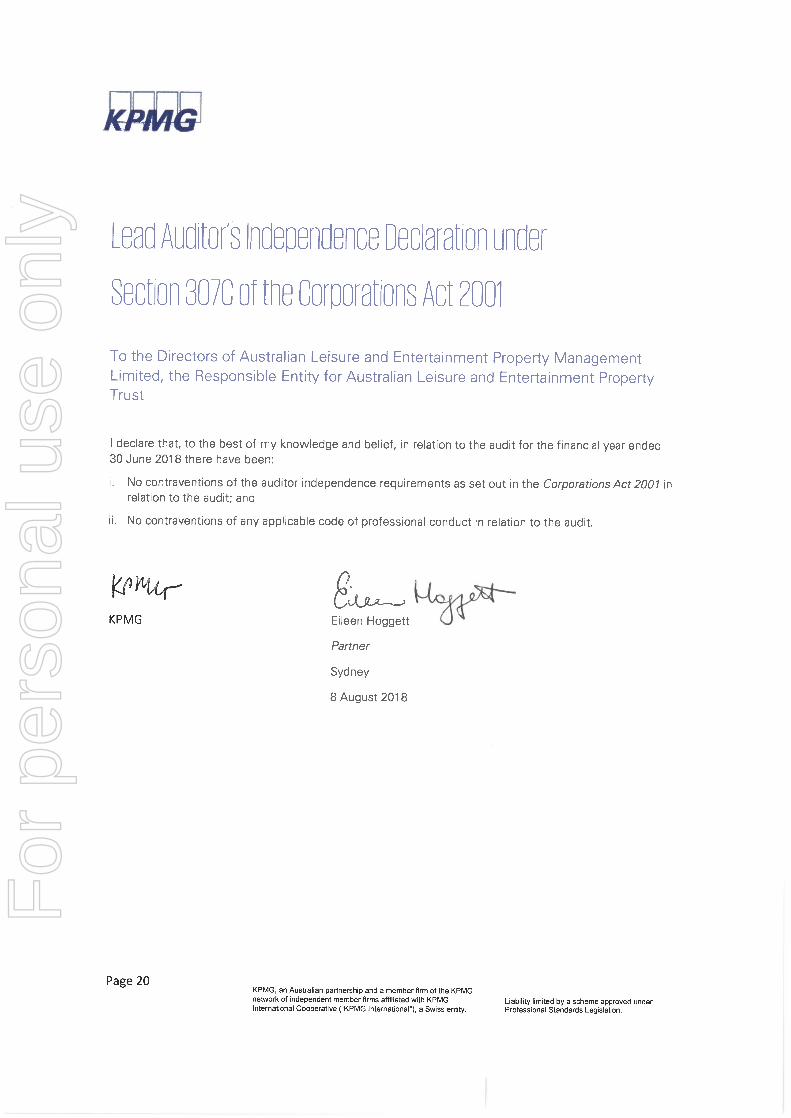
A copy of the Auditor's independence declaration as required under section 307C of the Corporations Act 2001 is set out on page 20. 15 AUDITOR'S INDEPENDENCE DECLARATION
16 ROUNDING OF AMOUNTS
Dated this 8th day of August 2018
Robert MactierChairman
ALE is an entity of the kind referred to in ASIC Corporations (Rounding in Financial/Directors' Reports) Instrument 2016/191, issued by the Australian Securities and Investments Commission, relating to the “rounding off” of amounts in the Directors’ Report. Amounts in the Directors’ Report and Financial Report have been rounded off in accordance with the Instrument to the nearest thousand dollars, unless otherwise indicated.
Page 19 ALE Property Group
For
per
sona
l use
onl
y
For
per
sona
l use
onl
y
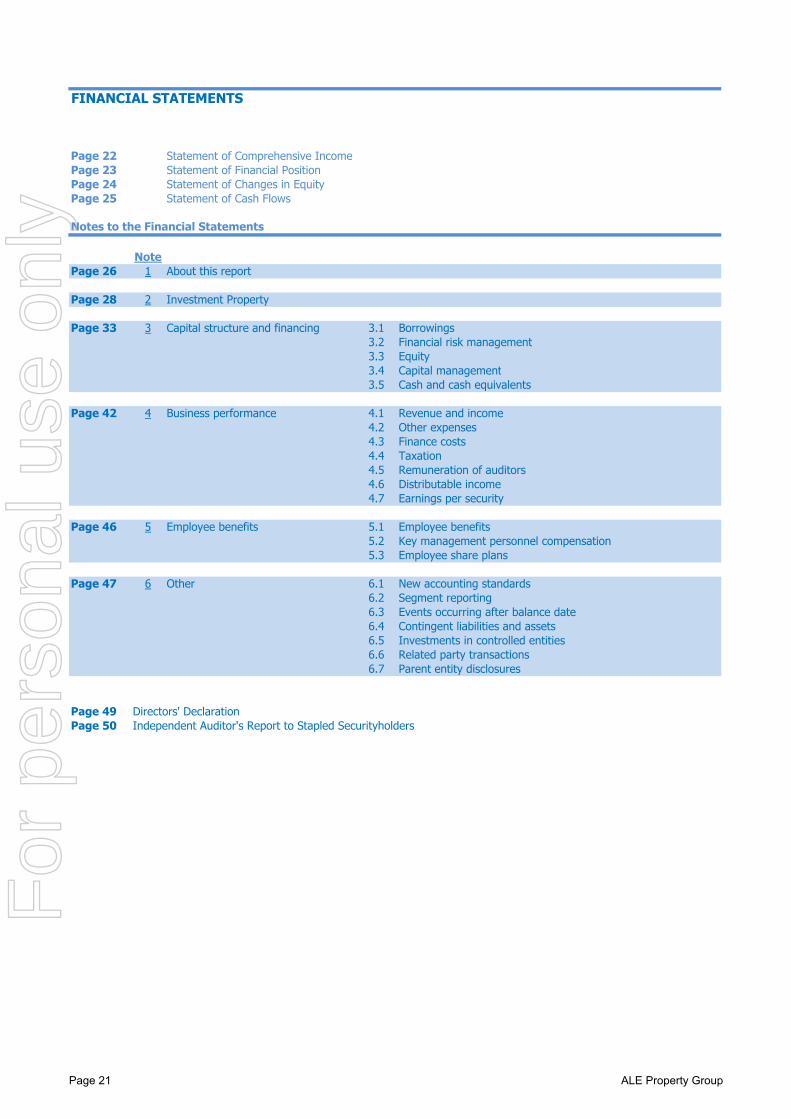
FINANCIAL STATEMENTS
Page 22 Statement of Comprehensive IncomePage 23 Statement of Financial PositionPage 24 Statement of Changes in EquityPage 25 Statement of Cash Flows
Notes to the Financial Statements
NotePage 26 1 About this report
Page 28 2 Investment Property
Page 33 3 Capital structure and financing 3.1 Borrowings3.2 Financial risk management3.3 Equity3.4 Capital management3.5 Cash and cash equivalents
Page 42 4 Business performance 4.1 Revenue and income4.2 Other expenses4.3 Finance costs4.4 Taxation4.5 Remuneration of auditors4.6 Distributable income4.7 Earnings per security
Page 46 5 Employee benefits 5.1 Employee benefits5.2 Key management personnel compensation5.3 Employee share plans
Page 47 6 Other 6.1 New accounting standards6.2 Segment reporting6.3 Events occurring after balance date6.4 Contingent liabilities and assets6.5 Investments in controlled entities6.6 Related party transactions6.7 Parent entity disclosures
Page 49 Directors' DeclarationPage 50 Independent Auditor's Report to Stapled Securityholders
Page 21 ALE Property Group
For
per
sona
l use
onl
y
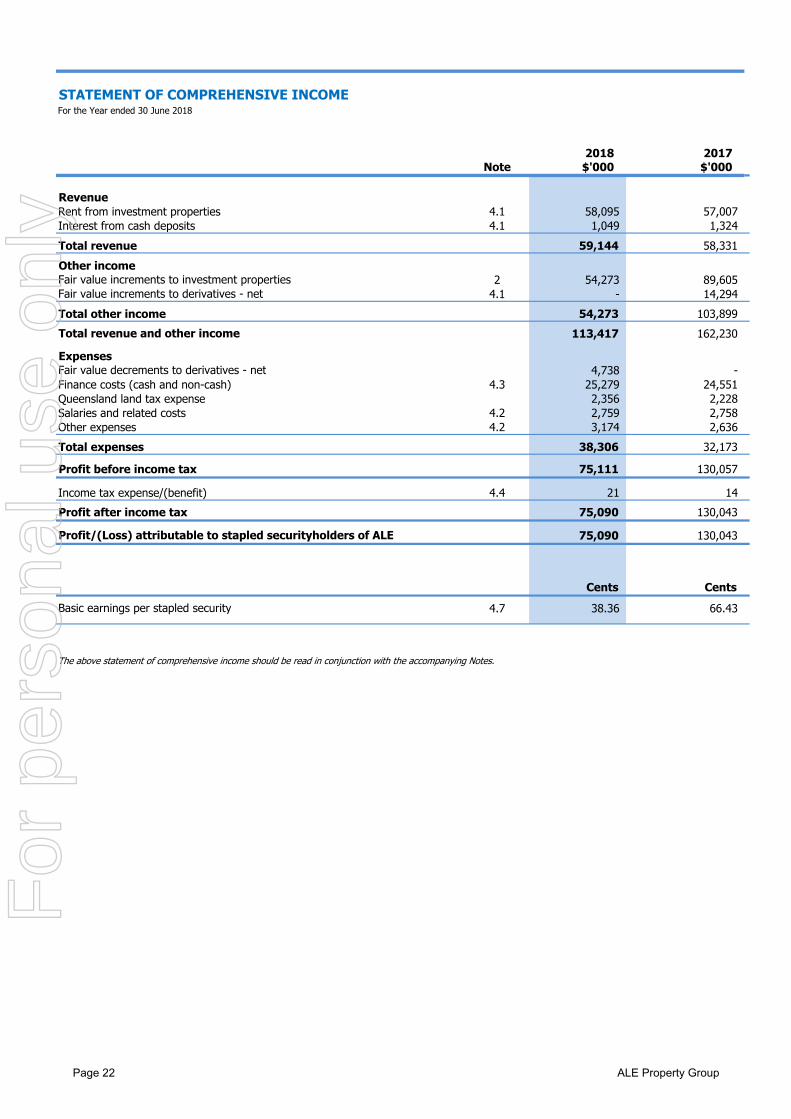
STATEMENT OF COMPREHENSIVE INCOMEFor the Year ended 30 June 2018
2018 2017Note $'000 $'000
RevenueRent from investment properties 4.1 58,095 57,007 Interest from cash deposits 4.1 1,049 1,324 Total revenue 59,144 58,331 Other incomeFair value increments to investment properties 2 54,273 89,605 Fair value increments to derivatives - net 4.1 - 14,294 Total other income 54,273 103,899 Total revenue and other income 113,417 162,230
ExpensesFair value decrements to derivatives - net 4,738 - Finance costs (cash and non-cash) 4.3 25,279 24,551 Queensland land tax expense 2,356 2,228 Salaries and related costs 4.2 2,759 2,758 Other expenses 4.2 3,174 2,636 Total expenses 38,306 32,173
Profit before income tax 75,111 130,057
Income tax expense/(benefit) 4.4 21 14 Profit after income tax 75,090 130,043
75,090 130,043
Cents CentsBasic earnings per stapled security 4.7 38.36 66.43
The above statement of comprehensive income should be read in conjunction with the accompanying Notes.
Profit/(Loss) attributable to stapled securityholders of ALE
Page 22 ALE Property Group
For
per
sona
l use
onl
y
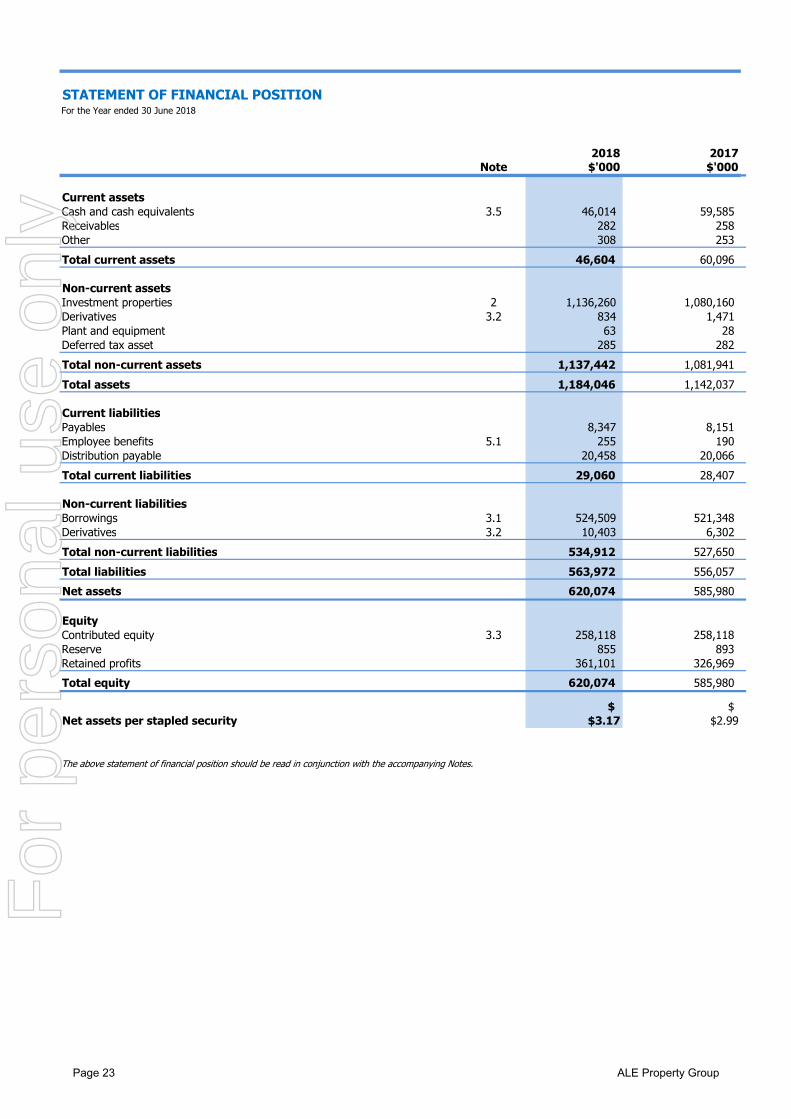
STATEMENT OF FINANCIAL POSITIONFor the Year ended 30 June 2018
2018 2017Note $'000 $'000
Current assetsCash and cash equivalents 3.5 46,014 59,585 Receivables 282 258 Other 308 253 Total current assets 46,604 60,096
Non-current assetsInvestment properties 2 1,136,260 1,080,160 Derivatives 3.2 834 1,471 Plant and equipment 63 28 Deferred tax asset 285 282 Total non-current assets 1,137,442 1,081,941 Total assets 1,184,046 1,142,037
Current liabilitiesPayables 8,347 8,151 Employee benefits 5.1 255 190 Distribution payable 20,458 20,066 Total current liabilities 29,060 28,407
Non-current liabilitiesBorrowings 3.1 524,509 521,348 Derivatives 3.2 10,403 6,302 Total non-current liabilities 534,912 527,650 Total liabilities 563,972 556,057 Net assets 620,074 585,980
EquityContributed equity 3.3 258,118 258,118 Reserve 855 893 Retained profits 361,101 326,969 Total equity 620,074 585,980
$ $Net assets per stapled security $3.17 $2.99
The above statement of financial position should be read in conjunction with the accompanying Notes.
Page 23 ALE Property Group
For
per
sona
l use
onl
y
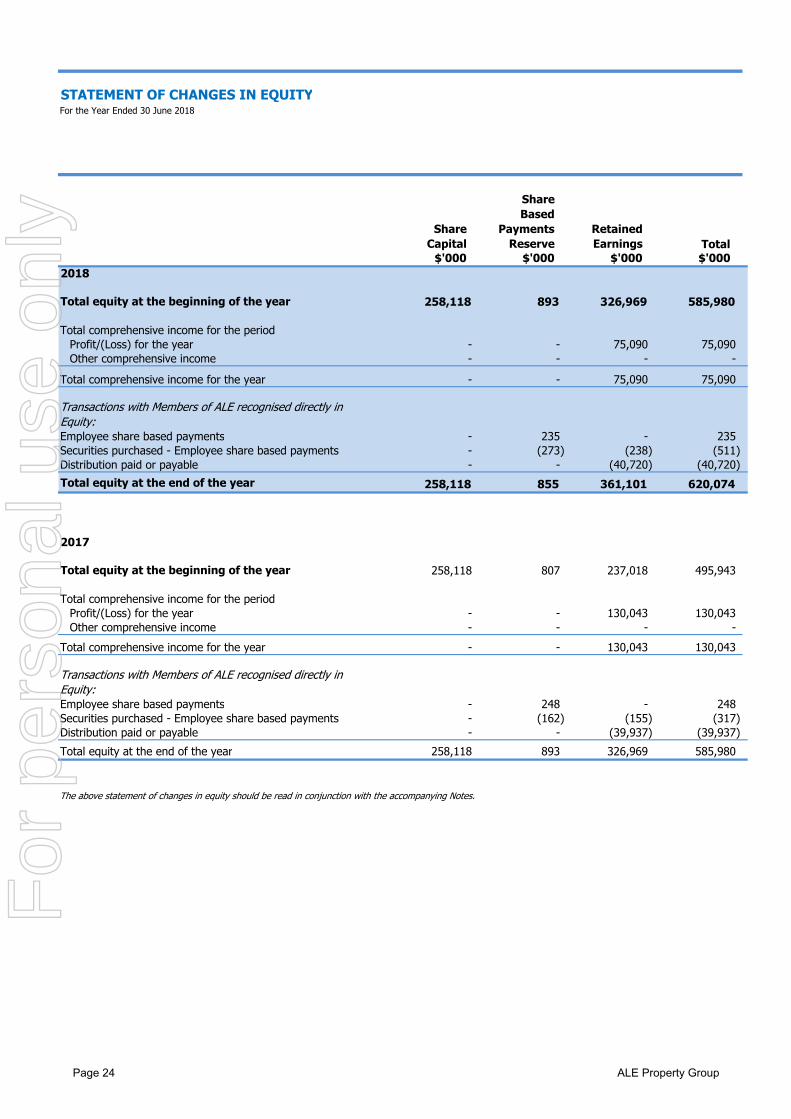
STATEMENT OF CHANGES IN EQUITYFor the Year Ended 30 June 2018
Share Capital
Share Based
Payments Reserve
Retained Earnings Total
$'000 $'000 $'000 $'0002018
Total equity at the beginning of the year 258,118 893 326,969 585,980
Total comprehensive income for the periodProfit/(Loss) for the year - - 75,090 75,090 Other comprehensive income - - - -
Total comprehensive income for the year - - 75,090 75,090
Transactions with Members of ALE recognised directly in Equity:Employee share based payments - 235 - 235 Securities purchased - Employee share based payments - (273) (238) (511) Distribution paid or payable - - (40,720) (40,720) Total equity at the end of the year 258,118 855 361,101 620,074
2017
Total equity at the beginning of the year 258,118 807 237,018 495,943
Total comprehensive income for the periodProfit/(Loss) for the year - - 130,043 130,043 Other comprehensive income - - - -
Total comprehensive income for the year - - 130,043 130,043
Transactions with Members of ALE recognised directly in Equity:Employee share based payments - 248 - 248 Securities purchased - Employee share based payments - (162) (155) (317) Distribution paid or payable - - (39,937) (39,937) Total equity at the end of the year 258,118 893 326,969 585,980
The above statement of changes in equity should be read in conjunction with the accompanying Notes.
Page 24 ALE Property Group
For
per
sona
l use
onl
y
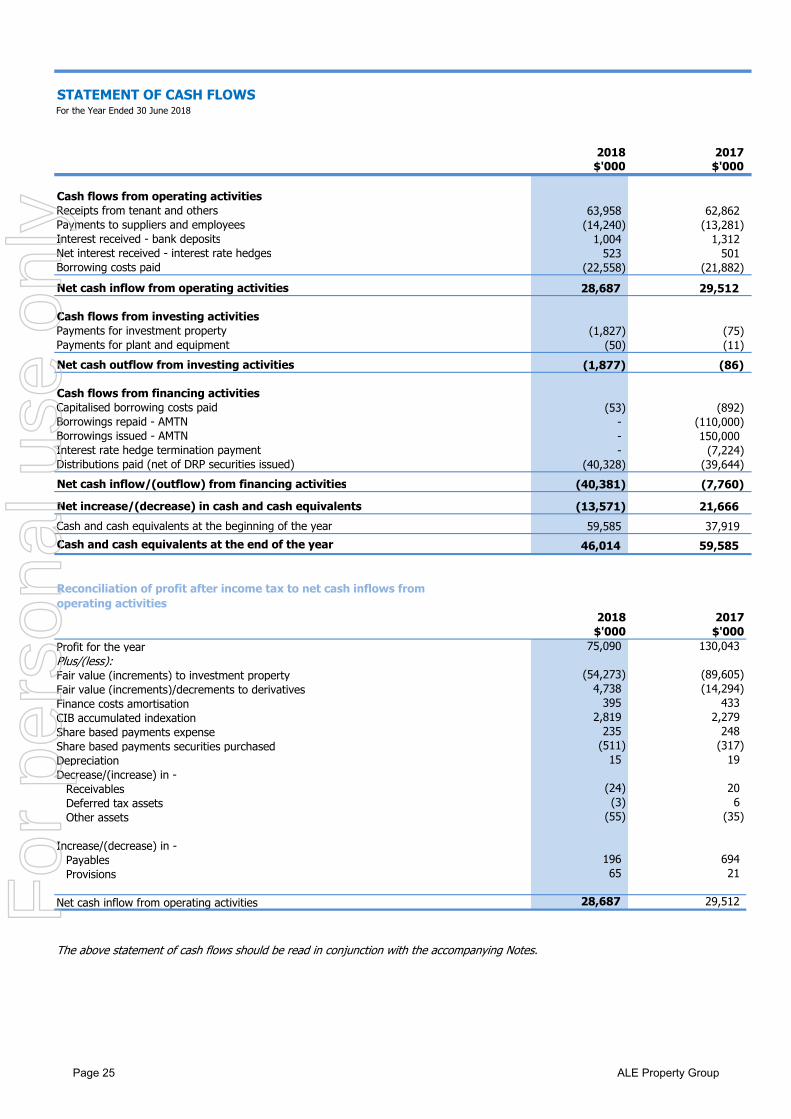
STATEMENT OF CASH FLOWS
2018 2017$'000 $'000
Cash flows from operating activitiesReceipts from tenant and others 63,958 62,862 Payments to suppliers and employees (14,240) (13,281) Interest received - bank deposits 1,004 1,312 Net interest received - interest rate hedges 523 501 Borrowing costs paid (22,558) (21,882) Net cash inflow from operating activities 28,687 29,512
Cash flows from investing activitiesPayments for investment property (1,827) (75) Payments for plant and equipment (50) (11) Net cash outflow from investing activities (1,877) (86)
Cash flows from financing activitiesCapitalised borrowing costs paid (53) (892) Borrowings repaid - AMTN - (110,000) Borrowings issued - AMTN - 150,000 Interest rate hedge termination payment - (7,224) Distributions paid (net of DRP securities issued) (40,328) (39,644) Net cash inflow/(outflow) from financing activities (40,381) (7,760)
Net increase/(decrease) in cash and cash equivalents (13,571) 21,666 Cash and cash equivalents at the beginning of the year 59,585 37,919 Cash and cash equivalents at the end of the year 46,014 59,585
2018 2017$'000 $'000
Profit for the year 75,090 130,043 Plus/(less):Fair value (increments) to investment property (54,273) (89,605) Fair value (increments)/decrements to derivatives 4,738 (14,294) Finance costs amortisation 395 433 CIB accumulated indexation 2,819 2,279
235 248 (511) (317)
Depreciation 15 19
Receivables (24) 20 (3) 6
(55) (35)
Payables 196 694 Provisions 65 21
Net cash inflow from operating activities 28,687 29,512
The above statement of cash flows should be read in conjunction with the accompanying Notes.
Increase/(decrease) in -
Decrease/(increase) in -
Share based payments securities purchasedShare based payments expense
For the Year Ended 30 June 2018
Reconciliation of profit after income tax to net cash inflows from operating activities
Other assetsDeferred tax assets
Page 25 ALE Property Group
For
per
sona
l use
onl
y
NOTES TO THE FINANCIAL STATEMENTSFor the Year ended 30 June 2018
1.About this report
Reporting Entity Accounting estimates and judgements
Accounting estimates and judgements NoteInvestment property 2Financial instruments 3Income taxes 4Measurement of share based payments 5
Significant accounting policies
The Company is the Responsible Entity of the Trust.
Statement of compliance
(a) Principles of consolidation
Basis of preparation
Rounding of amounts
ALE is domiciled in Australia. ALE, the stapled entity, was formed by stapling together the units in the Trust and the shares in the Company. For the purposes of financial reporting, the stapled entity reflects the consolidated entity. The parent entity and deemed acquirer in this arrangement is the Trust. The results reflect the performance of the Trust and its subsidiaries including the Company from 1 July 2017 to 30 June 2018.
The stapled securities of ALE are quoted on the Australian Securities Exchange under the code LEP and comprise one unit in the Trust and one share in the Company. The unit and the share are stapled together under the terms of their respective constitutions and cannot be traded separately. Each entity forming part of ALE is a separate legal entity in its own right under the Corporations Act 2001 and Australian Accounting Standards. The ALE Property Group is a for-profit entity.
The preparation of financial statements requires management to make judgements, estimates and assumptions that affect the application of accounting policies and the reported amounts of assets, liabilities, income and expenses. Actual results may differ from these estimates. Estimates and underlying assumptions are reviewed on an ongoing basis. Revisions to accounting estimates are recognised in the period in which the estimate is revised and in any future periods affected.
The consolidated financial statements are general purpose financial statements which have been prepared in accordance with Australian Accounting Standards (AASBs) adopted by the Australian Accounting Standards Board (AASB) and the Corporations Act 2001. The financial statements also comply with the International Financial Reporting Standards (IFRS) and interpretations adopted by the International Accounting Standards Board.
The consolidated financial statements were authorised for issue by the Board of Directors on 8th August 2018.
The Financial Report has been prepared on an historical cost basis, except for the revaluation of investment properties and certain financial instruments. Cost is based on the fair values of the consideration given in exchange for assets. All amounts are represented in Australian dollars, unless otherwise noted.
ALE is an entity of a kind referred to in ASIC Corporations (Rounding in Financial/Directors' Reports) Instrument 2016/191 and in accordance with that Instrument, all financial information presented in Australian dollars has been rounded to the nearest thousand unless otherwise stated.
Accounting policies are selected and applied in a manner that ensures that the resulting financial information satisfies the concepts of relevance and reliability, thereby ensuring that the substance of the underlying transactions or other events is reported. Other significant accounting policies are contained in the notes to the financial statements to which they relate to.
The financial statements incorporate the assets and liabilities of all subsidiaries as at balance date and the results for the period then ended. The Trust and its controlled entities together are referred to collectively in this financial report as ALE. Entities are fully consolidated from the date on which control is transferred to the Trust; where applicable, entities are deconsolidated from the date that control ceases.
Subsidiaries are all those entities (including special purpose entities) over which ALE has the power to govern the financial and operating policies, generally accompanying a shareholding of more than one half of the voting rights. The existence and effect of potential voting rights that are currently exercisable or convertible are considered when assessing whether ALE controls another entity.
All balances and effects of transactions between the subsidiaries of ALE have been eliminated in full.
Page 26 ALE Property Group
For
per
sona
l use
onl
y
Notes to the financial statements (continued)For the Year ended 30 June 2018
1. About this report
Measurement of fair values
When measuring the fair value of an asset or a liability, ALE uses market observable data as far as possible. Fair values are:Level 1: quoted prices (unadjusted) in active markets for identical assets or liabilities;Level 2: inputs other than quoted prices included in Level 1 that are observable for the asset or liability, either directly (i.e as prices) or indirectly (i.e derived from prices);Level 3: inputs for the asset or liability that are not based on observable market data (unobservable inputs).
The Group has an established control framework with respect to the measurement of fair values. Senior management regularly reviews significant unobservable inputs and valuation adjustments. If third party information, such as bank valuations or independent valuations, is used to measure fair values then management assess the evidence obtained from the third parties to support the conclusion that such valuations meet the requirements of IFRS, including the level in the fair value hierarchy in which such valuations should be classified.
Significant valuation issues are reported to the Audit, Compliance and Risk Management Committee.
A number of the Group's accounting policies and disclosures require the measurement of fair values, for both financial and non-financial assets and liabilities.
Page 27 ALE Property Group
For
per
sona
l use
onl
y
Notes to the financial statements (continued)For the Year ended 30 June 2018
2.Investment property
2018 2017$'000 $'000
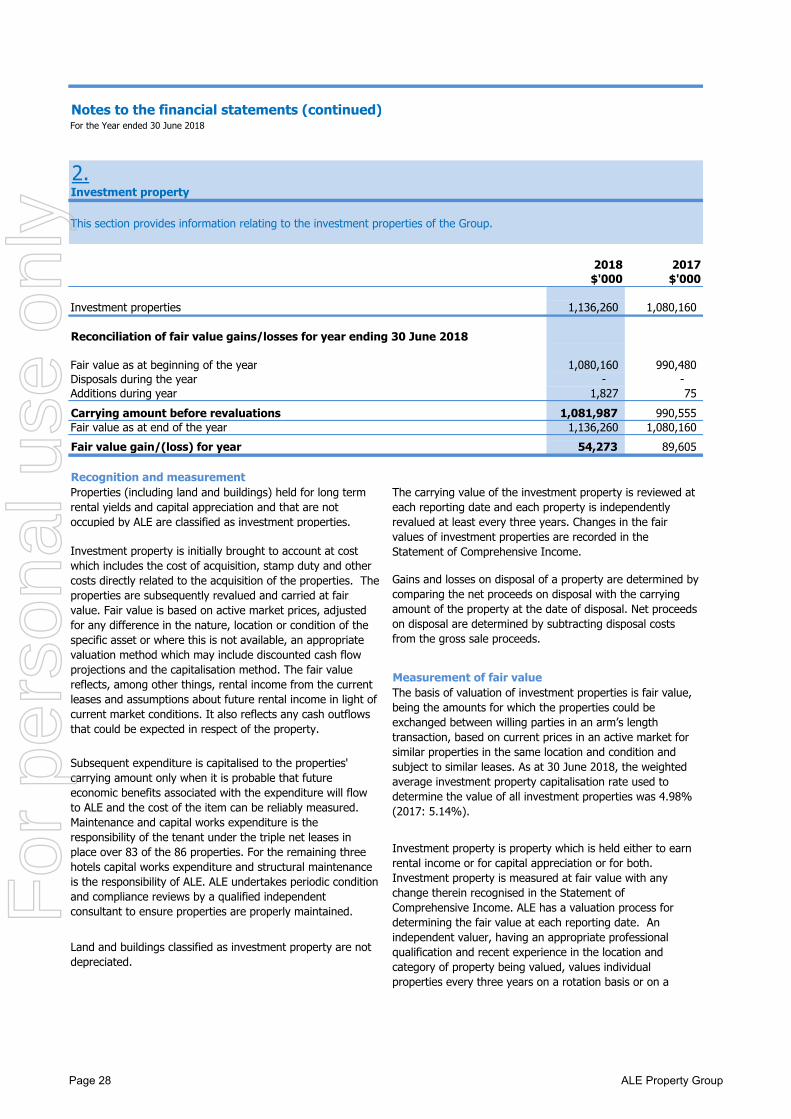
Investment properties 1,136,260 1,080,160
Fair value as at beginning of the year 1,080,160 990,480 Disposals during the year - - Additions during year 1,827 75 Carrying amount before revaluations 1,081,987 990,555 Fair value as at end of the year 1,136,260 1,080,160 Fair value gain/(loss) for year 54,273 89,605
Recognition and measurement
Measurement of fair value
This section provides information relating to the investment properties of the Group.
Reconciliation of fair value gains/losses for year ending 30 June 2018
Properties (including land and buildings) held for long term rental yields and capital appreciation and that are not occupied by ALE are classified as investment properties.
The basis of valuation of investment properties is fair value, being the amounts for which the properties could be exchanged between willing parties in an arm’s length transaction, based on current prices in an active market for similar properties in the same location and condition and subject to similar leases. As at 30 June 2018, the weighted average investment property capitalisation rate used to determine the value of all investment properties was 4.98% (2017: 5.14%).
Investment property is property which is held either to earn rental income or for capital appreciation or for both. Investment property is measured at fair value with any change therein recognised in the Statement of Comprehensive Income. ALE has a valuation process for determining the fair value at each reporting date. An independent valuer, having an appropriate professional qualification and recent experience in the location and category of property being valued, values individual properties every three years on a rotation basis or on a
The carrying value of the investment property is reviewed at each reporting date and each property is independently revalued at least every three years. Changes in the fair values of investment properties are recorded in the Statement of Comprehensive Income.
Gains and losses on disposal of a property are determined by comparing the net proceeds on disposal with the carrying amount of the property at the date of disposal. Net proceeds on disposal are determined by subtracting disposal costs from the gross sale proceeds.
Investment property is initially brought to account at cost which includes the cost of acquisition, stamp duty and other costs directly related to the acquisition of the properties. The properties are subsequently revalued and carried at fair value. Fair value is based on active market prices, adjusted for any difference in the nature, location or condition of the specific asset or where this is not available, an appropriate valuation method which may include discounted cash flow projections and the capitalisation method. The fair value reflects, among other things, rental income from the current leases and assumptions about future rental income in light of current market conditions. It also reflects any cash outflows that could be expected in respect of the property.
Subsequent expenditure is capitalised to the properties' carrying amount only when it is probable that future economic benefits associated with the expenditure will flow to ALE and the cost of the item can be reliably measured. Maintenance and capital works expenditure is the responsibility of the tenant under the triple net leases in place over 83 of the 86 properties. For the remaining three hotels capital works expenditure and structural maintenance is the responsibility of ALE. ALE undertakes periodic condition and compliance reviews by a qualified independent consultant to ensure properties are properly maintained.
Land and buildings classified as investment property are not depreciated.
Page 28 ALE Property Group
For
per
sona
l use
onl
y
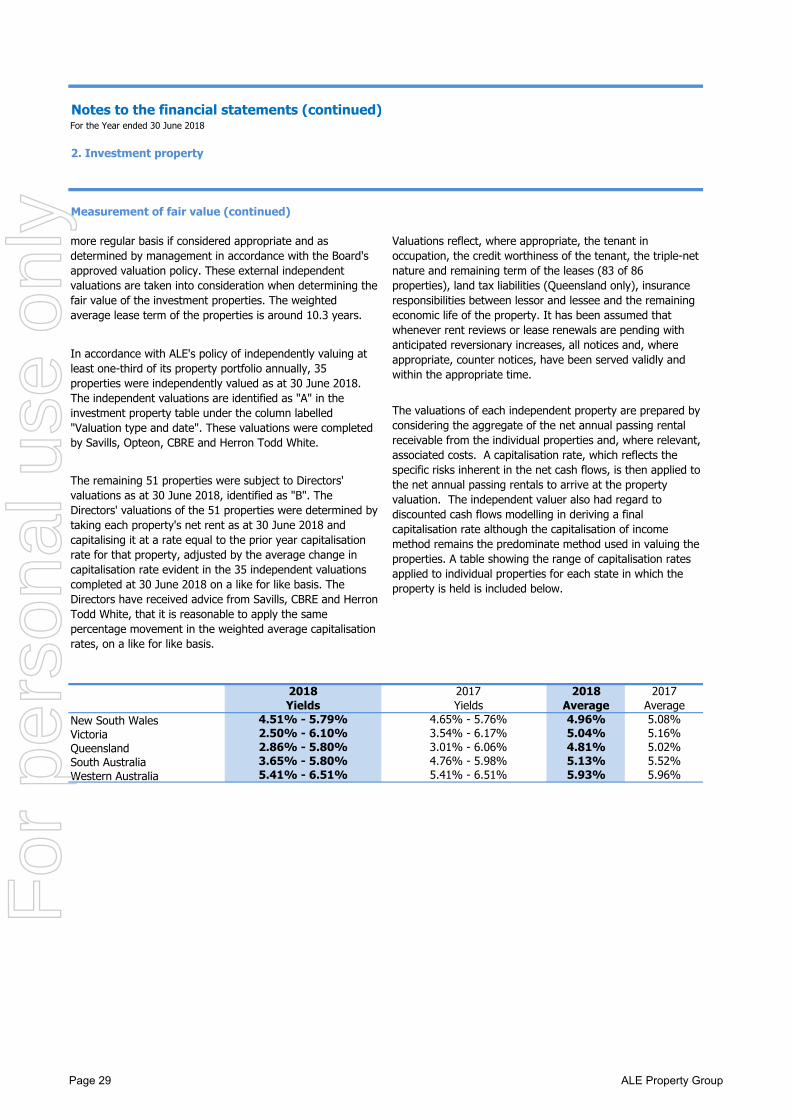
Notes to the financial statements (continued)For the Year ended 30 June 2018
2. Investment property
Measurement of fair value (continued)
2018 2017Average Average4.96% 5.08%5.04% 5.16%4.81% 5.02%5.13% 5.52%5.93% 5.96%
2017
South AustraliaWestern Australia
New South WalesVictoriaQueensland
5.41% - 6.51%4.76% - 5.98%5.41% - 6.51%
3.01% - 6.06%
Yields4.65% - 5.76%3.54% - 6.17%
Yields
2.86% - 5.80%
Valuations reflect, where appropriate, the tenant in occupation, the credit worthiness of the tenant, the triple-net nature and remaining term of the leases (83 of 86 properties), land tax liabilities (Queensland only), insurance responsibilities between lessor and lessee and the remaining economic life of the property. It has been assumed that whenever rent reviews or lease renewals are pending with anticipated reversionary increases, all notices and, where appropriate, counter notices, have been served validly and within the appropriate time.
The valuations of each independent property are prepared by considering the aggregate of the net annual passing rental receivable from the individual properties and, where relevant, associated costs. A capitalisation rate, which reflects the specific risks inherent in the net cash flows, is then applied to the net annual passing rentals to arrive at the property valuation. The independent valuer also had regard to discounted cash flows modelling in deriving a final capitalisation rate although the capitalisation of income method remains the predominate method used in valuing the properties. A table showing the range of capitalisation rates applied to individual properties for each state in which the property is held is included below.
more regular basis if considered appropriate and as determined by management in accordance with the Board's approved valuation policy. These external independent valuations are taken into consideration when determining the fair value of the investment properties. The weighted average lease term of the properties is around 10.3 years.
3.65% - 5.80%
2018
4.51% - 5.79%2.50% - 6.10%
In accordance with ALE's policy of independently valuing at least one-third of its property portfolio annually, 35 properties were independently valued as at 30 June 2018. The independent valuations are identified as "A" in the investment property table under the column labelled "Valuation type and date". These valuations were completed by Savills, Opteon, CBRE and Herron Todd White.
The remaining 51 properties were subject to Directors' valuations as at 30 June 2018, identified as "B". The Directors' valuations of the 51 properties were determined by taking each property's net rent as at 30 June 2018 and capitalising it at a rate equal to the prior year capitalisation rate for that property, adjusted by the average change in capitalisation rate evident in the 35 independent valuations completed at 30 June 2018 on a like for like basis. The Directors have received advice from Savills, CBRE and Herron Todd White, that it is reasonable to apply the same percentage movement in the weighted average capitalisation rates, on a like for like basis.
Page 29 ALE Property Group
For
per
sona
l use
onl
y
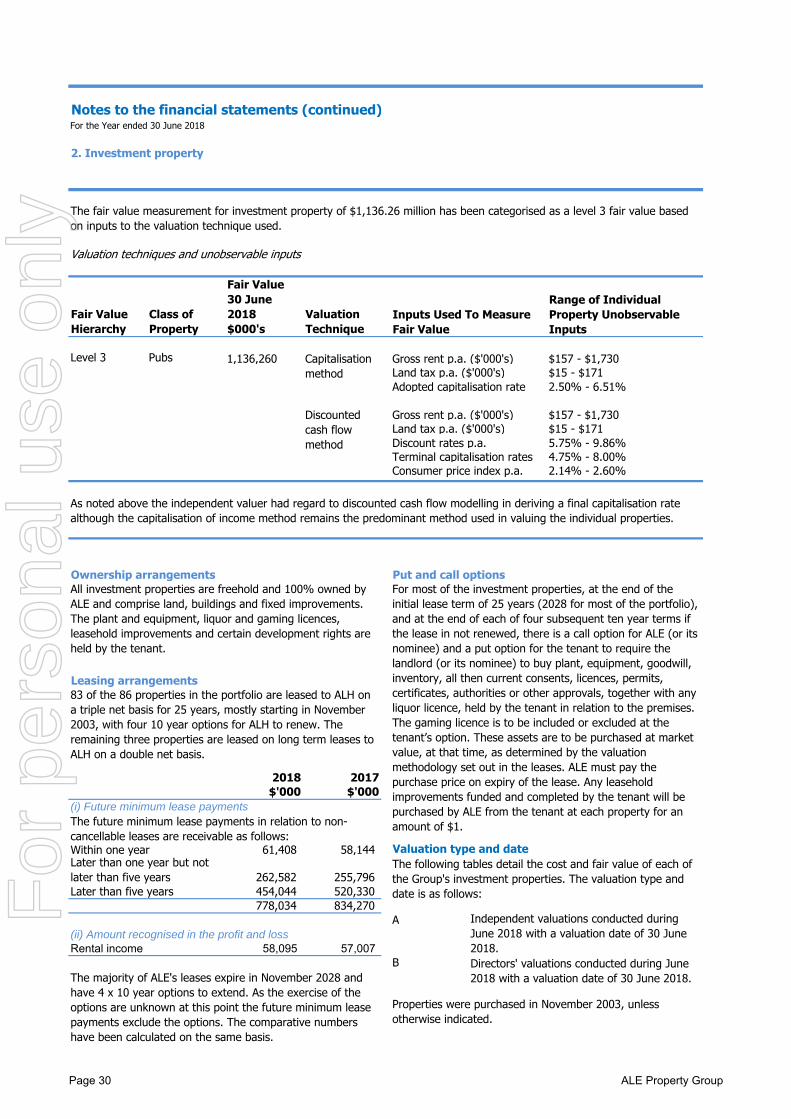
Notes to the financial statements (continued)For the Year ended 30 June 2018
2. Investment property
Valuation techniques and unobservable inputs
Fair Value Hierarchy
Class of Property
Fair Value 30 June 2018 $000's
Valuation Technique
Level 3 Pubs 1,136,260 Gross rent p.a. ($'000's) $157 - $1,730Land tax p.a. ($'000's) $15 - $171Adopted capitalisation rate
Gross rent p.a. ($'000's) $157 - $1,730Land tax p.a. ($'000's) $15 - $171Discount rates p.a.Terminal capitalisation ratesConsumer price index p.a.
2018 2017$'000 $'000
61,408 58,144 Valuation type and date
262,582 255,796 Later than five years 454,044 520,330
778,034 834,270 A
Rental income 58,095 57,007 B
Properties were purchased in November 2003, unless otherwise indicated.
The fair value measurement for investment property of $1,136.26 million has been categorised as a level 3 fair value based on inputs to the valuation technique used.
Inputs Used To Measure Fair Value
Put and call options
Leasing arrangements
Ownership arrangements
Independent valuations conducted during June 2018 with a valuation date of 30 June 2018.
83 of the 86 properties in the portfolio are leased to ALH on a triple net basis for 25 years, mostly starting in November 2003, with four 10 year options for ALH to renew. The remaining three properties are leased on long term leases to ALH on a double net basis.
For most of the investment properties, at the end of the initial lease term of 25 years (2028 for most of the portfolio), and at the end of each of four subsequent ten year terms if the lease in not renewed, there is a call option for ALE (or its nominee) and a put option for the tenant to require the landlord (or its nominee) to buy plant, equipment, goodwill, inventory, all then current consents, licences, permits, certificates, authorities or other approvals, together with any liquor licence, held by the tenant in relation to the premises. The gaming licence is to be included or excluded at the tenant’s option. These assets are to be purchased at market value, at that time, as determined by the valuation methodology set out in the leases. ALE must pay the purchase price on expiry of the lease. Any leasehold improvements funded and completed by the tenant will be purchased by ALE from the tenant at each property for an amount of $1.
Directors' valuations conducted during June 2018 with a valuation date of 30 June 2018.
(ii) Amount recognised in the profit and loss
The future minimum lease payments in relation to non-cancellable leases are receivable as follows:
(i) Future minimum lease payments
The following tables detail the cost and fair value of each of the Group's investment properties. The valuation type and date is as follows:
The majority of ALE's leases expire in November 2028 and have 4 x 10 year options to extend. As the exercise of the options are unknown at this point the future minimum lease payments exclude the options. The comparative numbers have been calculated on the same basis.
Range of Individual Property Unobservable Inputs
Capitalisation method
Within one yearLater than one year but not later than five years
All investment properties are freehold and 100% owned by ALE and comprise land, buildings and fixed improvements. The plant and equipment, liquor and gaming licences, leasehold improvements and certain development rights are held by the tenant.
2.50% - 6.51%
5.75% - 9.86%4.75% - 8.00%2.14% - 2.60%
Discounted cash flow method
As noted above the independent valuer had regard to discounted cash flow modelling in deriving a final capitalisation rate although the capitalisation of income method remains the predominant method used in valuing the individual properties.
Page 30 ALE Property Group
For
per
sona
l use
onl
y
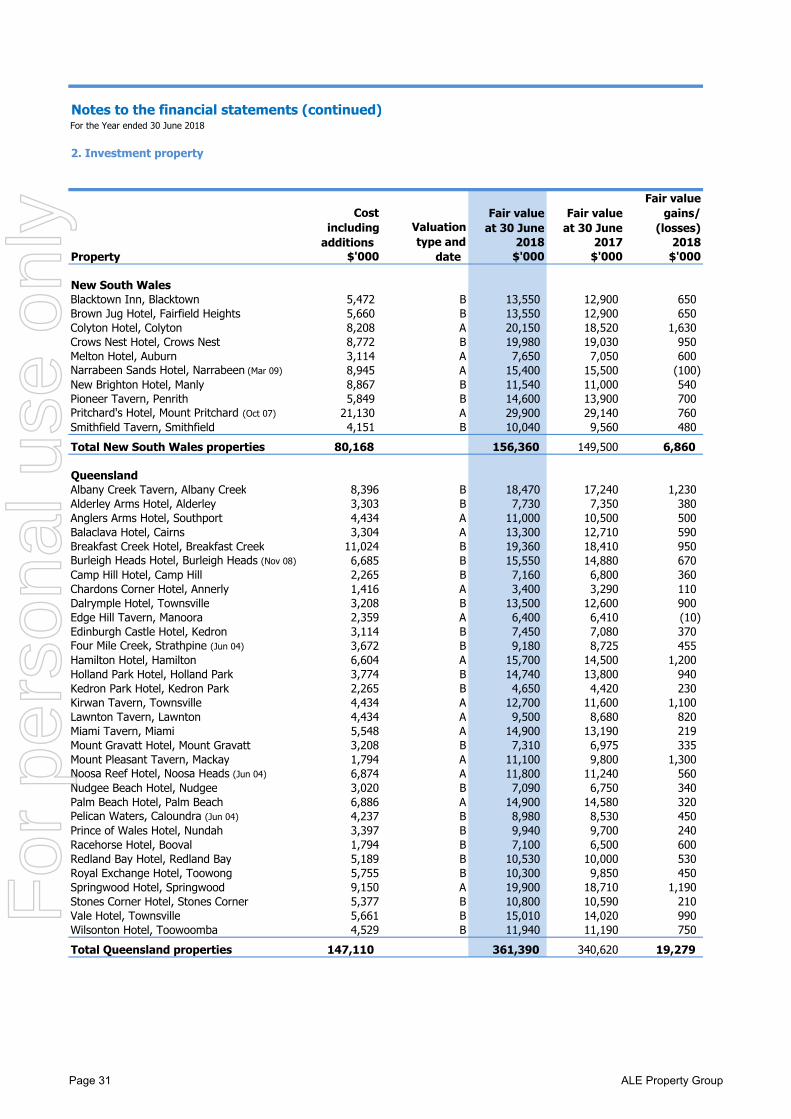
Notes to the financial statements (continued)For the Year ended 30 June 2018
2. Investment property
Fair value at 30 June
Fair value at 30 June
Fair value gains/
(losses) 2018 2017 2018
Property $'000 $'000 $'000 $'000
New South WalesBlacktown Inn, Blacktown 5,472 B 13,550 12,900 650 Brown Jug Hotel, Fairfield Heights 5,660 B 13,550 12,900 650 Colyton Hotel, Colyton 8,208 A 20,150 18,520 1,630 Crows Nest Hotel, Crows Nest 8,772 B 19,980 19,030 950 Melton Hotel, Auburn 3,114 A 7,650 7,050 600 Narrabeen Sands Hotel, Narrabeen (Mar 09) 8,945 A 15,400 15,500 (100) New Brighton Hotel, Manly 8,867 B 11,540 11,000 540 Pioneer Tavern, Penrith 5,849 B 14,600 13,900 700 Pritchard's Hotel, Mount Pritchard (Oct 07) 21,130 A 29,900 29,140 760 Smithfield Tavern, Smithfield 4,151 B 10,040 9,560 480 Total New South Wales properties 80,168 156,360 149,500 6,860
QueenslandAlbany Creek Tavern, Albany Creek 8,396 B 18,470 17,240 1,230 Alderley Arms Hotel, Alderley 3,303 B 7,730 7,350 380 Anglers Arms Hotel, Southport 4,434 A 11,000 10,500 500 Balaclava Hotel, Cairns 3,304 A 13,300 12,710 590 Breakfast Creek Hotel, Breakfast Creek 11,024 B 19,360 18,410 950 Burleigh Heads Hotel, Burleigh Heads (Nov 08) 6,685 B 15,550 14,880 670 Camp Hill Hotel, Camp Hill 2,265 B 7,160 6,800 360 Chardons Corner Hotel, Annerly 1,416 A 3,400 3,290 110 Dalrymple Hotel, Townsville 3,208 B 13,500 12,600 900 Edge Hill Tavern, Manoora 2,359 A 6,400 6,410 (10) Edinburgh Castle Hotel, Kedron 3,114 B 7,450 7,080 370 Four Mile Creek, Strathpine (Jun 04) 3,672 B 9,180 8,725 455 Hamilton Hotel, Hamilton 6,604 A 15,700 14,500 1,200 Holland Park Hotel, Holland Park 3,774 B 14,740 13,800 940 Kedron Park Hotel, Kedron Park 2,265 B 4,650 4,420 230 Kirwan Tavern, Townsville 4,434 A 12,700 11,600 1,100 Lawnton Tavern, Lawnton 4,434 A 9,500 8,680 820 Miami Tavern, Miami 5,548 A 14,900 13,190 219 Mount Gravatt Hotel, Mount Gravatt 3,208 B 7,310 6,975 335 Mount Pleasant Tavern, Mackay 1,794 A 11,100 9,800 1,300 Noosa Reef Hotel, Noosa Heads (Jun 04) 6,874 A 11,800 11,240 560 Nudgee Beach Hotel, Nudgee 3,020 B 7,090 6,750 340 Palm Beach Hotel, Palm Beach 6,886 A 14,900 14,580 320 Pelican Waters, Caloundra (Jun 04) 4,237 B 8,980 8,530 450 Prince of Wales Hotel, Nundah 3,397 B 9,940 9,700 240 Racehorse Hotel, Booval 1,794 B 7,100 6,500 600 Redland Bay Hotel, Redland Bay 5,189 B 10,530 10,000 530 Royal Exchange Hotel, Toowong 5,755 B 10,300 9,850 450 Springwood Hotel, Springwood 9,150 A 19,900 18,710 1,190 Stones Corner Hotel, Stones Corner 5,377 B 10,800 10,590 210 Vale Hotel, Townsville 5,661 B 15,010 14,020 990 Wilsonton Hotel, Toowoomba 4,529 B 11,940 11,190 750 Total Queensland properties 147,110 361,390 340,620 19,279
Cost including
additions)Valuation type and
date)
Page 31 ALE Property Group
For
per
sona
l use
onl
y
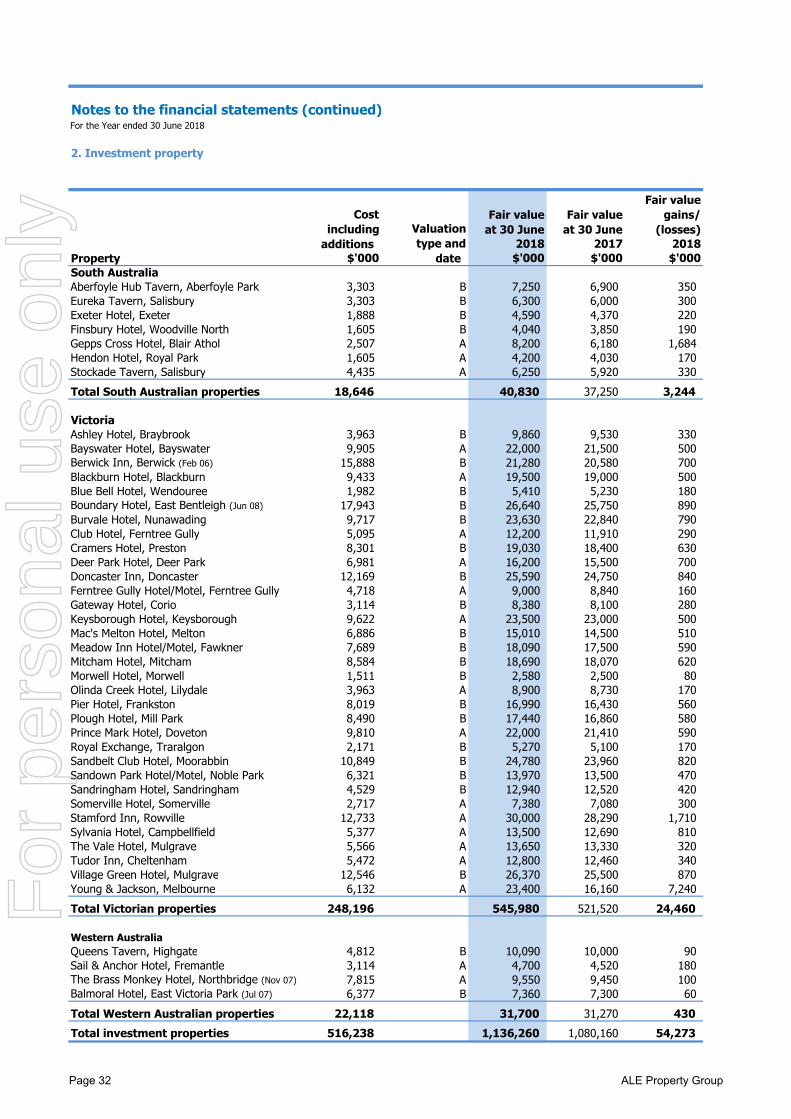
Notes to the financial statements (continued)For the Year ended 30 June 2018
2. Investment property
Fair value at 30 June
Fair value at 30 June
Fair value gains/
(losses) 2018 2017 2018
Property $'000 $'000 $'000 $'000South AustraliaAberfoyle Hub Tavern, Aberfoyle Park 3,303 B 7,250 6,900 350 Eureka Tavern, Salisbury 3,303 B 6,300 6,000 300 Exeter Hotel, Exeter 1,888 B 4,590 4,370 220 Finsbury Hotel, Woodville North 1,605 B 4,040 3,850 190 Gepps Cross Hotel, Blair Athol 2,507 A 8,200 6,180 1,684 Hendon Hotel, Royal Park 1,605 A 4,200 4,030 170 Stockade Tavern, Salisbury 4,435 A 6,250 5,920 330 Total South Australian properties 18,646 40,830 37,250 3,244
VictoriaAshley Hotel, Braybrook 3,963 B 9,860 9,530 330 Bayswater Hotel, Bayswater 9,905 A 22,000 21,500 500 Berwick Inn, Berwick (Feb 06) 15,888 B 21,280 20,580 700 Blackburn Hotel, Blackburn 9,433 A 19,500 19,000 500 Blue Bell Hotel, Wendouree 1,982 B 5,410 5,230 180 Boundary Hotel, East Bentleigh (Jun 08) 17,943 B 26,640 25,750 890 Burvale Hotel, Nunawading 9,717 B 23,630 22,840 790 Club Hotel, Ferntree Gully 5,095 A 12,200 11,910 290 Cramers Hotel, Preston 8,301 B 19,030 18,400 630 Deer Park Hotel, Deer Park 6,981 A 16,200 15,500 700 Doncaster Inn, Doncaster 12,169 B 25,590 24,750 840 Ferntree Gully Hotel/Motel, Ferntree Gully 4,718 A 9,000 8,840 160 Gateway Hotel, Corio 3,114 B 8,380 8,100 280 Keysborough Hotel, Keysborough 9,622 A 23,500 23,000 500 Mac's Melton Hotel, Melton 6,886 B 15,010 14,500 510 Meadow Inn Hotel/Motel, Fawkner 7,689 B 18,090 17,500 590 Mitcham Hotel, Mitcham 8,584 B 18,690 18,070 620 Morwell Hotel, Morwell 1,511 B 2,580 2,500 80 Olinda Creek Hotel, Lilydale 3,963 A 8,900 8,730 170 Pier Hotel, Frankston 8,019 B 16,990 16,430 560 Plough Hotel, Mill Park 8,490 B 17,440 16,860 580 Prince Mark Hotel, Doveton 9,810 A 22,000 21,410 590 Royal Exchange, Traralgon 2,171 B 5,270 5,100 170 Sandbelt Club Hotel, Moorabbin 10,849 B 24,780 23,960 820 Sandown Park Hotel/Motel, Noble Park 6,321 B 13,970 13,500 470 Sandringham Hotel, Sandringham 4,529 B 12,940 12,520 420 Somerville Hotel, Somerville 2,717 A 7,380 7,080 300 Stamford Inn, Rowville 12,733 A 30,000 28,290 1,710 Sylvania Hotel, Campbellfield 5,377 A 13,500 12,690 810 The Vale Hotel, Mulgrave 5,566 A 13,650 13,330 320 Tudor Inn, Cheltenham 5,472 A 12,800 12,460 340 Village Green Hotel, Mulgrave 12,546 B 26,370 25,500 870 Young & Jackson, Melbourne 6,132 A 23,400 16,160 7,240 Total Victorian properties 248,196 545,980 521,520 24,460
Western AustraliaQueens Tavern, Highgate 4,812 B 10,090 10,000 90 Sail & Anchor Hotel, Fremantle 3,114 A 4,700 4,520 180 The Brass Monkey Hotel, Northbridge (Nov 07) 7,815 A 9,550 9,450 100 Balmoral Hotel, East Victoria Park (Jul 07) 6,377 B 7,360 7,300 60 Total Western Australian properties 22,118 31,700 31,270 430 Total investment properties 516,238 1,136,260 1,080,160 54,273
Cost including
additions)Valuation type and
date)
Page 32 ALE Property Group
For
per
sona
l use
onl
y
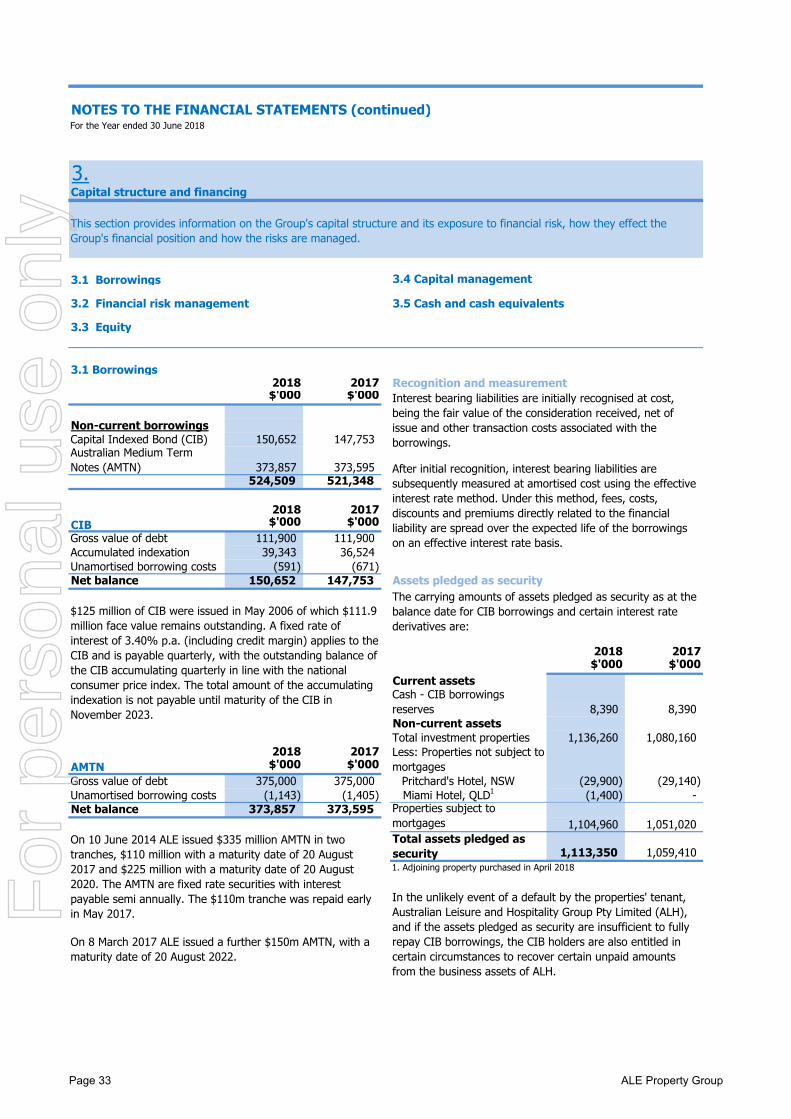
NOTES TO THE FINANCIAL STATEMENTS (continued)For the Year ended 30 June 2018
3.Capital structure and financing
3.1 Borrowings 3.4 Capital management
3.2 Financial risk management 3.5 Cash and cash equivalents
3.3 Equity
3.1 Borrowings2018 2017 Recognition and measurement$'000 $'000
Non-current borrowingsCapital Indexed Bond (CIB) 150,652 147,753
373,857 373,595 524,509 521,348
2018 2017CIB $'000 $'000Gross value of debt 111,900 111,900 Accumulated indexation 39,343 36,524 Unamortised borrowing costs (591) (671) Net balance 150,652 147,753 Assets pledged as security
2018 2017$'000 $'000
Current assets
8,390 8,390 Non-current assetsTotal investment properties 1,136,260 1,080,160
2018 2017AMTN $'000 $'000Gross value of debt 375,000 375,000 Pritchard's Hotel, NSW (29,900) (29,140) Unamortised borrowing costs (1,143) (1,405) (1,400) - Net balance 373,857 373,595
1,104,960 1,051,020
1,113,350 1,059,410
Australian Medium Term Notes (AMTN)
$125 million of CIB were issued in May 2006 of which $111.9 million face value remains outstanding. A fixed rate of interest of 3.40% p.a. (including credit margin) applies to the CIB and is payable quarterly, with the outstanding balance of the CIB accumulating quarterly in line with the national consumer price index. The total amount of the accumulating indexation is not payable until maturity of the CIB in November 2023.
The carrying amounts of assets pledged as security as at the balance date for CIB borrowings and certain interest rate derivatives are:
Cash - CIB borrowings reserves
Less: Properties not subject to mortgages
Total assets pledged as security
Interest bearing liabilities are initially recognised at cost, being the fair value of the consideration received, net of issue and other transaction costs associated with the borrowings.
Properties subject to mortgages
Miami Hotel, QLD1
On 10 June 2014 ALE issued $335 million AMTN in two tranches, $110 million with a maturity date of 20 August 2017 and $225 million with a maturity date of 20 August 2020. The AMTN are fixed rate securities with interest payable semi annually. The $110m tranche was repaid early in May 2017.
On 8 March 2017 ALE issued a further $150m AMTN, with a maturity date of 20 August 2022.
This section provides information on the Group's capital structure and its exposure to financial risk, how they effect the Group's financial position and how the risks are managed.
After initial recognition, interest bearing liabilities are subsequently measured at amortised cost using the effective interest rate method. Under this method, fees, costs, discounts and premiums directly related to the financial liability are spread over the expected life of the borrowings on an effective interest rate basis.
1. Adjoining property purchased in April 2018
In the unlikely event of a default by the properties' tenant, Australian Leisure and Hospitality Group Pty Limited (ALH), and if the assets pledged as security are insufficient to fully repay CIB borrowings, the CIB holders are also entitled in certain circumstances to recover certain unpaid amounts from the business assets of ALH.
Page 33 ALE Property Group
For
per
sona
l use
onl
y
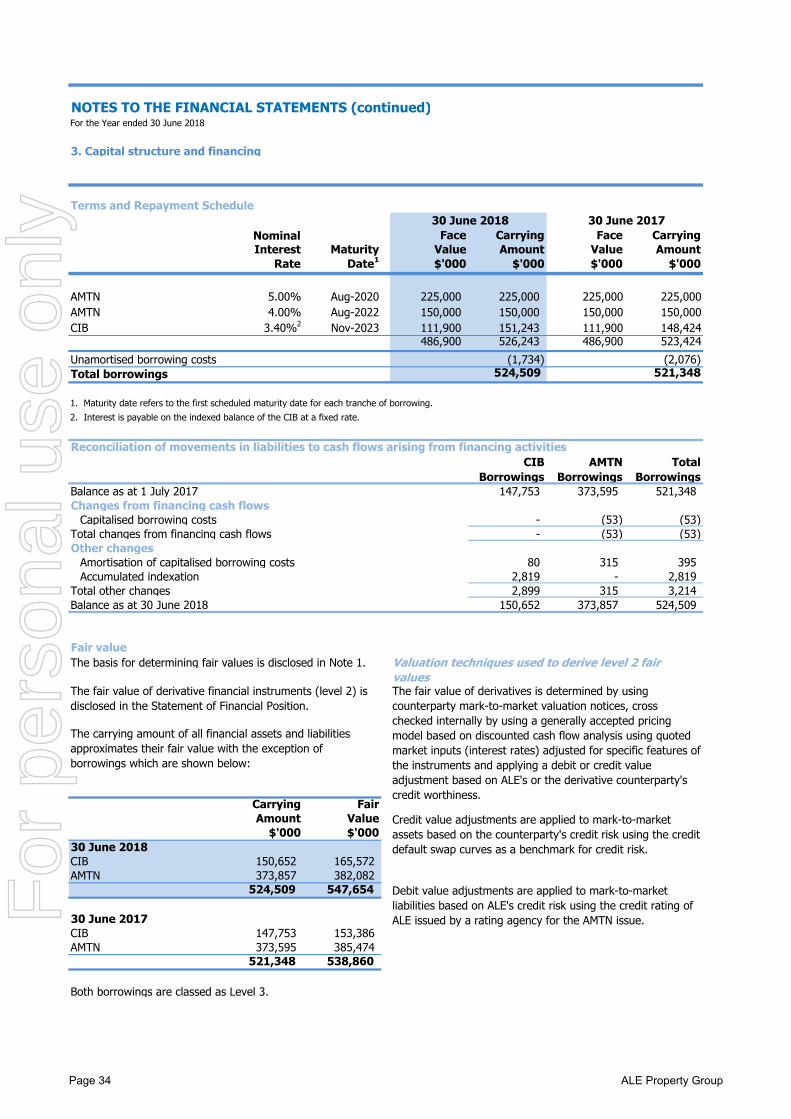
NOTES TO THE FINANCIAL STATEMENTS (continued)For the Year ended 30 June 2018
3. Capital structure and financing
Terms and Repayment Schedule
Nominal Face Carrying Face Carrying Interest Maturity Value Amount Value Amount
Rate Date1 $'000 $'000 $'000 $'000
AMTN 5.00% Aug-2020 225,000 225,000 225,000 225,000 AMTN 4.00% Aug-2022 150,000 150,000 150,000 150,000 CIB 3.40%2 Nov-2023 111,900 151,243 111,900 148,424
486,900 526,243 486,900 523,424 Unamortised borrowing costs (1,734) (2,076) Total borrowings 524,509 521,348
Reconciliation of movements in liabilities to cash flows arising from financing activitiesCIB
BorrowingsAMTN
BorrowingsTotal
BorrowingsBalance as at 1 July 2017 147,753 373,595 521,348 Changes from financing cash flows
Capitalised borrowing costs - (53) (53) Total changes from financing cash flows - (53) (53) Other changes
Amortisation of capitalised borrowing costs 80 315 395 Accumulated indexation 2,819 - 2,819
Total other changes 2,899 315 3,214 Balance as at 30 June 2018 150,652 373,857 524,509
Fair valueThe basis for determining fair values is disclosed in Note 1.
Carrying FairAmount Value
$'000 $'00030 June 2018CIB 150,652 165,572 AMTN 373,857 382,082
524,509 547,654
30 June 2017CIB 147,753 153,386 AMTN 373,595 385,474
521,348 538,860
Both borrowings are classed as Level 3.
Valuation techniques used to derive level 2 fair values
Credit value adjustments are applied to mark-to-market assets based on the counterparty's credit risk using the credit default swap curves as a benchmark for credit risk.
30 June 2017
The fair value of derivatives is determined by using counterparty mark-to-market valuation notices, cross checked internally by using a generally accepted pricing model based on discounted cash flow analysis using quoted market inputs (interest rates) adjusted for specific features of the instruments and applying a debit or credit value adjustment based on ALE's or the derivative counterparty's credit worthiness.
Debit value adjustments are applied to mark-to-market liabilities based on ALE's credit risk using the credit rating of ALE issued by a rating agency for the AMTN issue.
1. Maturity date refers to the first scheduled maturity date for each tranche of borrowing. 2. Interest is payable on the indexed balance of the CIB at a fixed rate.
30 June 2018
The fair value of derivative financial instruments (level 2) is disclosed in the Statement of Financial Position.
The carrying amount of all financial assets and liabilities approximates their fair value with the exception of borrowings which are shown below:
Page 34 ALE Property Group
For
per
sona
l use
onl
y
NOTES TO THE FINANCIAL STATEMENTS (continued)For the Year ended 30 June 2018
3. Capital structure and financing
3.2 Financial Risk ManagementTrade and other receivables
● credit risk● market risk● liquidity risk
Market risk
Interest rate risk
Credit risk
Cash
The Trust and Group have exposure to the following risks from their use of financial instruments:
This note presents information about ALE's exposure to each of the above risks, its objectives, policies and processes for measuring and managing risk and the management of capital. Further quantitative disclosures are included throughout this financial report.
Risk management policies are established to identify and analyse the risks faced by ALE, to set appropriate risk limits and controls, and to monitor risks and adherence to limits. Risk management policies and systems are reviewed regularly to reflect changes in market conditions and ALE’s activities. ALE, through its training and management standards and procedures, has developed a disciplined and constructive control environment in which all employees understand their roles and obligations.
The Audit, Compliance and Risk Management Committee oversees how management monitors compliance with ALE’s risk management policies and procedures and reviews the adequacy of the risk management framework.
Credit risk on cash is managed through ensuring all cash deposits are held with authorised deposit taking institutions.
ALE’s exposure to credit risk is influenced mainly by the individual characteristics of its tenant. ALE has one tenant (Australian Leisure and Hospitality Group Pty Limited) and therefore there is significant concentration of credit risk with that company. Credit risk of the tenant is constantly monitored to ensure the tenant has appropriate financial standing. There are also cross default provisions in the leases and the properties are essential to the tenant's business operations and those of the tenant's shareholders.
Market risk is the risk that changes in market prices, such as the consumer price index and interest rates, will affect ALE’s income or the value of its holdings of leases and financial instruments. The objective of market risk management is to manage and control market risk exposures within acceptable parameters, while optimising the return.
ALE enters into derivatives and financial liabilities in order to manage market risks. All such transactions are carried out within the guidelines set by the Audit, Compliance and Risk Management Committee.
Potential variability in future distributions arise predominantly from financial assets and liabilities bearing variable interest rates. For example, if financial liabilities exceed financial assets and interest rates rise, to the extent that interest rate derivatives (hedges) are not available to fully hedge the exposure, distribution levels would be expected to decline from the levels that they would otherwise have been.
The Group has considered the collectability and recoverability of trade receivables. Where warranted, an allowance for doubtful debts has been made for the estimated irrecoverable trade receivable amounts arising from the past rendering of services, determined by reference to past default experience.
Credit risk is the risk of financial loss to ALE if its tenant or counterparty to a financial instrument fails to meet its contractual obligations and arises principally from ALE’s receivables from the tenant, investment securities and derivatives contracts.
ALE adopts a policy of ensuring that short and medium term exposure to changes in interest rates on borrowings are hedged. This is achieved by entering into interest rate hedges to fix the interest rates or by issuing fixed rate borrowings.
The Board of Directors has overall responsibility for the establishment and oversight of the risk management framework. The Board has established an Audit, Compliance and Risk Management Committee, which is responsible for developing and monitoring risk management policies. The committee reports regularly to the Board of Directors on its activities.
Page 35 ALE Property Group
For
per
sona
l use
onl
y
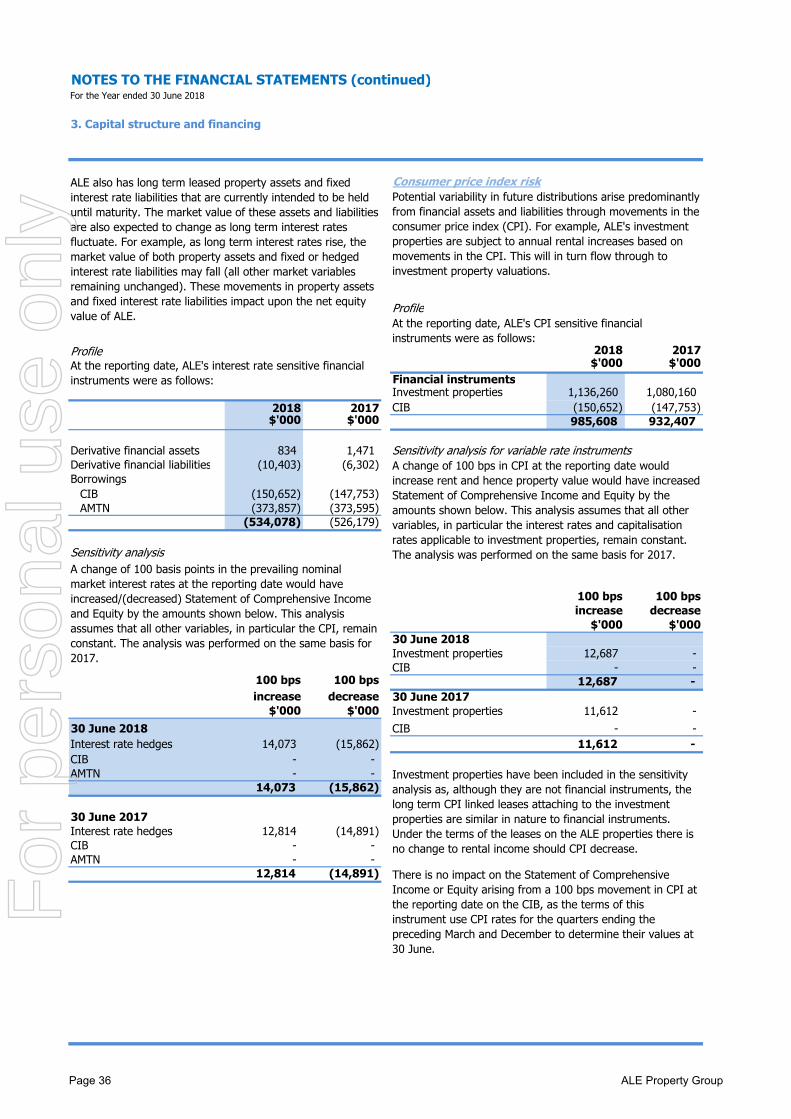
NOTES TO THE FINANCIAL STATEMENTS (continued)For the Year ended 30 June 2018
3. Capital structure and financing
Consumer price index risk
Profile
Profile 2018 2017$'000 $'000
Financial instrumentsInvestment properties 1,136,260 1,080,160
2018 2017 CIB (150,652) (147,753) $'000 $'000 985,608 932,407
Derivative financial assets 834 1,471 Sensitivity analysis for variable rate instrumentsDerivative financial liabilities (10,403) (6,302) Borrowings
CIB (150,652) (147,753) AMTN (373,857) (373,595)
(534,078) (526,179)
Sensitivity analysis
100 bps 100 bpsincrease decrease
$'000 $'00030 June 2018Investment properties 12,687 - CIB - -
100 bps 100 bps 12,687 - increase decrease 30 June 2017
$'000 $'000 Investment properties 11,612 - 30 June 2018 CIB - - Interest rate hedges 14,073 (15,862) 11,612 - CIB - - AMTN - -
14,073 (15,862)
30 June 2017Interest rate hedges 12,814 (14,891) CIB - - AMTN - -
12,814 (14,891) There is no impact on the Statement of Comprehensive Income or Equity arising from a 100 bps movement in CPI at the reporting date on the CIB, as the terms of this instrument use CPI rates for the quarters ending the preceding March and December to determine their values at 30 June.
At the reporting date, ALE's interest rate sensitive financial instruments were as follows:
Potential variability in future distributions arise predominantly from financial assets and liabilities through movements in the consumer price index (CPI). For example, ALE's investment properties are subject to annual rental increases based on movements in the CPI. This will in turn flow through to investment property valuations.
At the reporting date, ALE's CPI sensitive financial instruments were as follows:
A change of 100 bps in CPI at the reporting date would increase rent and hence property value would have increased Statement of Comprehensive Income and Equity by the amounts shown below. This analysis assumes that all other variables, in particular the interest rates and capitalisation rates applicable to investment properties, remain constant. The analysis was performed on the same basis for 2017.
A change of 100 basis points in the prevailing nominal market interest rates at the reporting date would have increased/(decreased) Statement of Comprehensive Income and Equity by the amounts shown below. This analysis assumes that all other variables, in particular the CPI, remain constant. The analysis was performed on the same basis for 2017.
Investment properties have been included in the sensitivity analysis as, although they are not financial instruments, the long term CPI linked leases attaching to the investment properties are similar in nature to financial instruments. Under the terms of the leases on the ALE properties there is no change to rental income should CPI decrease.
ALE also has long term leased property assets and fixed interest rate liabilities that are currently intended to be held until maturity. The market value of these assets and liabilities are also expected to change as long term interest rates fluctuate. For example, as long term interest rates rise, the market value of both property assets and fixed or hedged interest rate liabilities may fall (all other market variables remaining unchanged). These movements in property assets and fixed interest rate liabilities impact upon the net equity value of ALE.
Page 36 ALE Property Group
For
per
sona
l use
onl
y
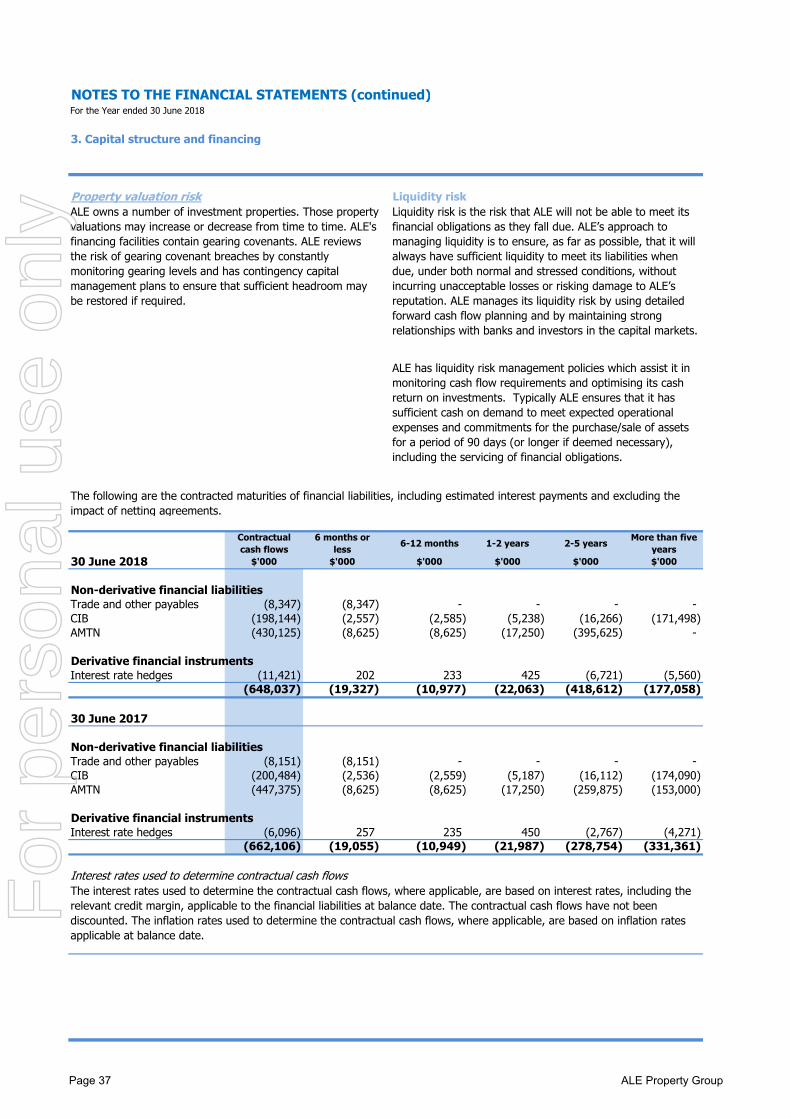
NOTES TO THE FINANCIAL STATEMENTS (continued)For the Year ended 30 June 2018
3. Capital structure and financing
Property valuation risk Liquidity risk
Contractual cash flows
6 months or less 6-12 months 1-2 years 2-5 years More than five
years30 June 2018 $'000 $'000 $'000 $'000 $'000 $'000
Non-derivative financial liabilities Trade and other payables (8,347) (8,347) - - - - CIB (198,144) (2,557) (2,585) (5,238) (16,266) (171,498) AMTN (430,125) (8,625) (8,625) (17,250) (395,625) -
Derivative financial instruments Interest rate hedges (11,421) 202 233 425 (6,721) (5,560)
(648,037) (19,327) (10,977) (22,063) (418,612) (177,058)
30 June 2017
Non-derivative financial liabilities Trade and other payables (8,151) (8,151) - - - - CIB (200,484) (2,536) (2,559) (5,187) (16,112) (174,090) AMTN (447,375) (8,625) (8,625) (17,250) (259,875) (153,000)
Derivative financial instruments Interest rate hedges (6,096) 257 235 450 (2,767) (4,271)
(662,106) (19,055) (10,949) (21,987) (278,754) (331,361)
Interest rates used to determine contractual cash flows
The following are the contracted maturities of financial liabilities, including estimated interest payments and excluding the impact of netting agreements.
ALE has liquidity risk management policies which assist it in monitoring cash flow requirements and optimising its cash return on investments. Typically ALE ensures that it has sufficient cash on demand to meet expected operational expenses and commitments for the purchase/sale of assets for a period of 90 days (or longer if deemed necessary), including the servicing of financial obligations.
Liquidity risk is the risk that ALE will not be able to meet its financial obligations as they fall due. ALE’s approach to managing liquidity is to ensure, as far as possible, that it will always have sufficient liquidity to meet its liabilities when due, under both normal and stressed conditions, without incurring unacceptable losses or risking damage to ALE’s reputation. ALE manages its liquidity risk by using detailed forward cash flow planning and by maintaining strong relationships with banks and investors in the capital markets.
The interest rates used to determine the contractual cash flows, where applicable, are based on interest rates, including the relevant credit margin, applicable to the financial liabilities at balance date. The contractual cash flows have not been discounted. The inflation rates used to determine the contractual cash flows, where applicable, are based on inflation rates applicable at balance date.
ALE owns a number of investment properties. Those property valuations may increase or decrease from time to time. ALE's financing facilities contain gearing covenants. ALE reviews the risk of gearing covenant breaches by constantly monitoring gearing levels and has contingency capital management plans to ensure that sufficient headroom may be restored if required.
Page 37 ALE Property Group
For
per
sona
l use
onl
y
NOTES TO THE FINANCIAL STATEMENTS (continued)For the Year ended 30 June 2018
3. Capital structure and financing
Interest rate hedgesRecognition and measurement
2018 2017$'000 $'000
Current assets - - Non current assets 834 1,471 Total assets 834 1,471
Current liabilities - - Non current liabilities (10,403) (6,302) Total liabilities (10,403) (6,302) Net assets/(liabilities) (9,569) (4,831)
Current year fair value adjustments to derivatives 2018 2017$'000 $'000
(4,738) 14,294
At 30 June 2018, the notional principal amounts and periods of expiry of the interest rate hedge contracts are as follows:
2018 2017 2018 2017 2018 2017$'000 $'000 $'000 $'000 $'000 $'000
Less than 1 year - - - - - - 1 - 2 years - - (30,000) - (30,000) - 2 - 3 years - - - (30,000) - (30,000) 3 - 4 years - - - - - - 4 - 5 years - - - - - - Greater than 5 years 506,000 506,000 - - 506,000 506,000
ALE uses derivative financial instruments, being interest rate hedges, to manage its exposure to interest rate risk on borrowings. As at balance date, ALE has hedged all fixed rate debt past the maturity date to November 2025 through interest rate hedges.
The current forward start borrowing hedge commences on the date of the maturity of the fixed rate August 2020 AMTN borrowing and increases on maturity of the fixed rate August 2022 AMTN borrowings, extending out to November 2025.
Borrowing Interest Rate Hedges
Deposit Interest Rate Hedges
Interest rate hedges are initially recognised at fair value and are subsequently remeasured to their fair value at each reporting date. Any gains or losses arising from the change in fair value of the interest rate hedges are recognised in the Statement of Comprehensive Income.
To date, ALE has not designated any of its derivatives as cash flow hedges and accordingly ALE has valued them all at fair value with movements recorded in the Statement of Comprehensive Income.
The gain or loss from marking to market the interest rate hedges (derivatives) at fair value is taken directly to the Statement of Comprehensive Income.
ALE documents, at the inception of any hedging transaction, the relationship between hedging instruments and hedged items, as well as its risk management objective and strategy for undertaking various hedge transactions. ALE also documents its assessment, both at hedge inception and on an ongoing basis, of whether the derivatives that are used in hedging transactions have been and will continue to be highly effective in offsetting changes in fair values or cash flows of hedged items.
Fair value increments/ (decrements) to interest rate hedge derivatives
Net Hedge Position
ALE has a series of forward start borrowing hedges in place and a deposit hedge that is currently active.
The hedge contracts require settlement of net interest receivable or payable on a quarterly basis. The settlement dates coincide with the dates on which interest is payable on the underlying borrowings. The contracts are settled on a net basis.
The average term of the interest rate hedges and fixed rate securities in relation to the total borrowings of ALE is 7.4 years at 30 June 2018.
Page 38 ALE Property Group
For
per
sona
l use
onl
y
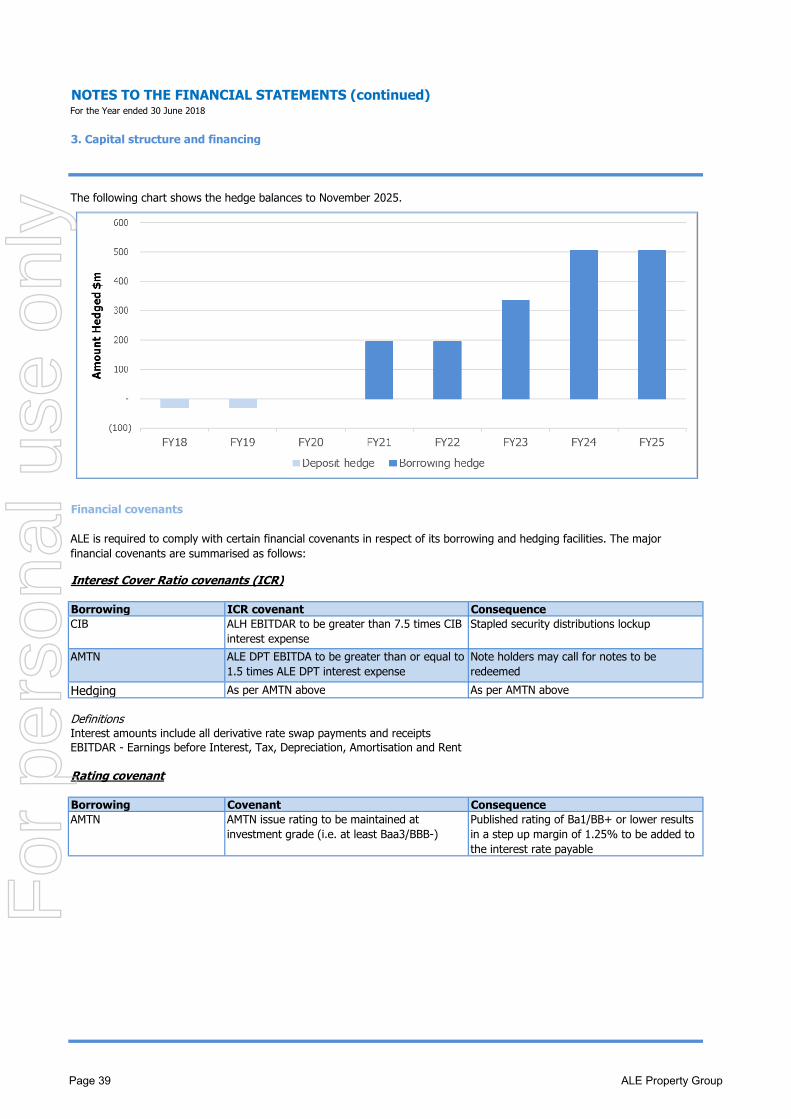
NOTES TO THE FINANCIAL STATEMENTS (continued)For the Year ended 30 June 2018
3. Capital structure and financing
Financial covenants
Interest Cover Ratio covenants (ICR)
Borrowing ICR covenant ConsequenceCIB
AMTN
Hedging
DefinitionsInterest amounts include all derivative rate swap payments and receiptsEBITDAR - Earnings before Interest, Tax, Depreciation, Amortisation and Rent
Rating covenant
Borrowing Covenant ConsequenceAMTN Published rating of Ba1/BB+ or lower results
in a step up margin of 1.25% to be added to the interest rate payable
ALH EBITDAR to be greater than 7.5 times CIB interest expense
Note holders may call for notes to be redeemed
ALE DPT EBITDA to be greater than or equal to 1.5 times ALE DPT interest expense
As per AMTN aboveAs per AMTN above
Stapled security distributions lockup
The following chart shows the hedge balances to November 2025.
ALE is required to comply with certain financial covenants in respect of its borrowing and hedging facilities. The major financial covenants are summarised as follows:
AMTN issue rating to be maintained at investment grade (i.e. at least Baa3/BBB-)
Page 39 ALE Property Group
For
per
sona
l use
onl
y
NOTES TO THE FINANCIAL STATEMENTS (continued)For the Year ended 30 June 2018
3. Capital structure and financing
Loan to Value Ratio covenants (LVR)
Consequence
DefinitionsNet Total Assets Total Assets less Cash less Derivative Assets less Deferred Tax Assets. (ALE DPT)
Net Priority Debt
Net Finance Debt
3.3 Equity Stapled securities2018 2017$'000 $'000
258,118 258,118
- - 258,118 258,118
2018 2017Number Number
No income voting units (NIVUS)Opening balance 195,769,080 195,769,080
- - Closing balance 195,769,080 195,769,080
Measurement and recognition
As per AMTN above
AMTN
ALE Finance Company Pty Limited (ALEFC) borrowings less Cash held against the ALEFC borrowings, divided by Total Assets less Cash less Derivative Assets less Deferred Tax Assets
The Trust issued 9,080,010 of no income voting units (NIVUS) to the Company, fully paid at $1.00 each in November 2003. The NIVUS are not stapled to shares in the Company, have an issue and withdrawal price of $1.00, carry no rights to income from the Trust and entitle the holder to no more than $1.00 per NIVUS upon the winding-up of the Trust. The Company has a voting power of 4.43% in the Trust as a result of the issue of NIVUS. The NIVUS are disclosed in the Company and the Trust financial reports but are not disclosed in the ALE Property Group financial report as they are eliminated on consolidation.
Each stapled security comprises one share in the Company and one unit in the Trust. They cannot be traded or dealt with separately. Stapled securities entitle the holder to participate in dividends/distributions and the proceeds on any winding-up of ALE in proportion to the number of, and amounts paid on, the securities held. On a show of hands every holder of stapled securities present at a meeting in person or by proxy, is entitled to one vote. On a poll, each ordinary shareholder is entitled to one vote for each fully paid share and each unit holder is entitled to one vote for each fully paid unit.
Net Finance Debt not to exceed 60% of Net Total AssetsNet Finance Debt not to exceed 65% of Net Total Assets
AMTN
Outstanding value of CIB not to exceed 66.6% of the value of properties held as security
All covenants exclude the mark to market value of derivatives. CIB covenants relate to ALE FC. AMTN and hedging covenants relate to ALE DPT.
Hedging
BorrowingCIB
CIB
AMTN
ALE currently considers that significant headroom exists with respect of all the above covenants. At all times during the years ended 30 June 2018 and 30 June 2017, ALE and its subsidiaries were in compliance with all the above covenants.
Note holders may call for notes to be redeemed
Note holders may call for notes to be redeemedNote holders may call for notes to be redeemedStapled Security distribution lockup
Note holders may call for notes to be redeemedAs per AMTN above
The issuance of new CIB is not permitted if the indexed value of the resultant total CIB exceeds 25% of the value of properties held as security
The new issuance of Net Priority Debt is not permitted to exceed 20% of Net Total Assets
Movements in the number of fully paid stapled securities during the year
No movement
Ordinary units and ordinary shares are classified as contributed equity.
Incremental costs directly attributable to the issue of new units, shares or options are shown in Contributed Equity as a deduction, net of tax, from the proceeds.
Balance at the beginning of the period
No movement
Total Borrowings less Cash, divided by Total Assets less Cash less Derivative Assets less Deferred Tax Assets. (ALE DPT)
LVR Covenant
Page 40 ALE Property Group
For
per
sona
l use
onl
y
NOTES TO THE FINANCIAL STATEMENTS (continued)For the Year ended 30 June 2018
3. Capital structure and financing
3.5 Cash and cash equivalents2018 2017$'000 $'000
Cash at bank and in hand 2,551 4,1223.4 Capital management Deposits at call 35,073 47,073
Cash reserve 8,390 8,390Capital management 46,014 59,585
Recognition and measurement
Cash obligations
For the purposes of the cash flow statement, cash and cash equivalents includes cash at bank, deposits at call and short term money market securities which are readily convertible to cash.
An amount of $8.39 million is required to be held as a cash reserve as part of the terms of the CIB issue in order to provide liquidity for CIB obligations to scheduled maturity of 20 November 2023.
ALE monitors securityholder equity and manages it to address risks and add value where appropriate.
An amount of $2.00 million is required to be held in a term deposit by the Company to meet minimum net tangible asset requirements of the AFSL licence.
The covenent gearing ratios (gross borrowings less cash as a percentage of total assets less cash, derivatives and deferred tax assets of ALE DPT) at 30 June 2018 and 30 June 2017 were 41.6% and 42.7% respectively.
The Board’s policy is to maintain a strong capital base so as to maintain investor, creditor and market confidence and to sustain the future development of the business. The Board of Directors monitors the return on capital, which ALE defines as distributable income divided by total contributed equity, excluding minority interests. The Board of Directors also monitors the level of gearing.
The Board seeks to maintain a balance between the higher returns that may be achieved with higher levels of borrowings and the advantages and security afforded by a sound capital position. While ALE does not have a specific return on capital target, it seeks to ensure that capital is being most efficiently used at all times. In seeking to manage its capital efficiently, ALE from time to time may undertake on-market buybacks of ALE stapled securities. ALE has also from time to time made distributions from surplus cash or capital to stapled securityholders on a fully transparent basis. Additionally, the available total returns on all new acquisitions are tested against the anticipated weighted cost of capital at the time of the acquisition.
ALE assesses the adequacy of its capital requirements, cost of capital and gearing as part of its broader strategic plan.
Gearing ratios are monitored in the context of any increase or decrease from time to time based on existing property value movements, acquisitions completed, the levels of debt financing used and a range of prudent financial metrics, both at the time and on a projected basis going forward.
The outcomes of the ALE strategic planning process plays an important role in determining acquisition and financing priorities over time.
The total gearing ratios (total liabilities as a percentage of total assets) at 30 June 2018 and 30 June 2017 were 47.7% and 48.7% respectively.
The NIVUS were issued to ensure the Responsible Entity maintained sufficient Net Tangible Assets to satisfy the requirements of the company's AFSL Licence.
During the year ended 30 June 2018 all cash assets were placed on deposit with various banks. As at 30 June 2018, the weighted average interest rate on all cash assets was 2.46% (2017:2.30%).
Page 41 ALE Property Group
For
per
sona
l use
onl
y
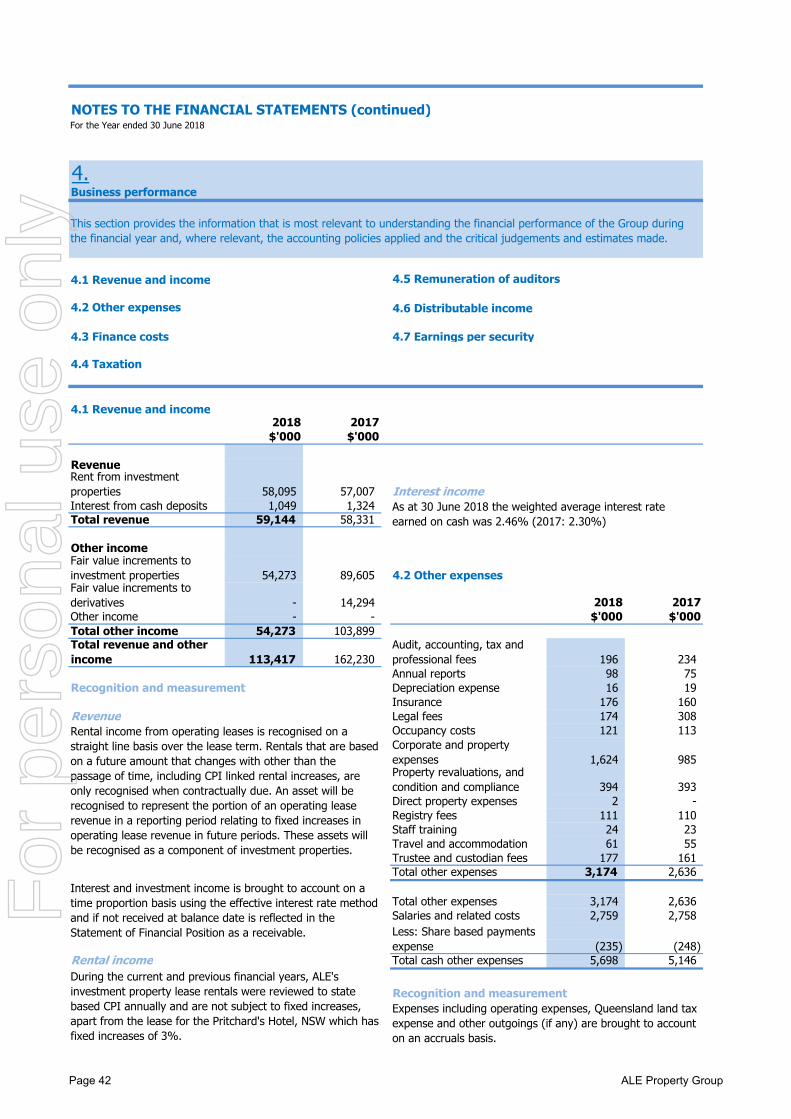
NOTES TO THE FINANCIAL STATEMENTS (continued)For the Year ended 30 June 2018
4.Business performance
4.1 Revenue and income 4.5 Remuneration of auditors
4.2 Other expenses 4.6 Distributable income
4.3 Finance costs 4.7 Earnings per security
4.4 Taxation
4.1 Revenue and income2018 2017$'000 $'000
Revenue
58,095 57,007 Interest incomeInterest from cash deposits 1,049 1,324 Total revenue 59,144 58,331
Other income
54,273 89,605 4.2 Other expenses
- 14,294 2018 2017Other income - - $'000 $'000Total other income 54,273 103,899
113,417 162,230 196 234 Annual reports 98 75
Recognition and measurement Depreciation expense 16 19 Insurance 176 160
Revenue Legal fees 174 308 Occupancy costs 121 113
1,624 985
394 393 Direct property expenses 2 - Registry fees 111 110 Staff training 24 23 Travel and accommodation 61 55 Trustee and custodian fees 177 161 Total other expenses 3,174 2,636
Total other expenses 3,174 2,636 Salaries and related costs 2,759 2,758
(235) (248) Rental income Total cash other expenses 5,698 5,146
Recognition and measurement
Rent from investment properties
Fair value increments to investment properties
Total revenue and other income
As at 30 June 2018 the weighted average interest rate earned on cash was 2.46% (2017: 2.30%)
Audit, accounting, tax and professional fees
Fair value increments to derivatives
During the current and previous financial years, ALE's investment property lease rentals were reviewed to state based CPI annually and are not subject to fixed increases, apart from the lease for the Pritchard's Hotel, NSW which has fixed increases of 3%.
Interest and investment income is brought to account on a time proportion basis using the effective interest rate method and if not received at balance date is reflected in the Statement of Financial Position as a receivable.
Expenses including operating expenses, Queensland land tax expense and other outgoings (if any) are brought to account on an accruals basis.
Less: Share based payments expense
This section provides the information that is most relevant to understanding the financial performance of the Group duringthe financial year and, where relevant, the accounting policies applied and the critical judgements and estimates made.
Corporate and property expensesProperty revaluations, and condition and compliance
Rental income from operating leases is recognised on a straight line basis over the lease term. Rentals that are based on a future amount that changes with other than the passage of time, including CPI linked rental increases, are only recognised when contractually due. An asset will be recognised to represent the portion of an operating lease revenue in a reporting period relating to fixed increases in operating lease revenue in future periods. These assets will be recognised as a component of investment properties.
Page 42 ALE Property Group
For
per
sona
l use
onl
y
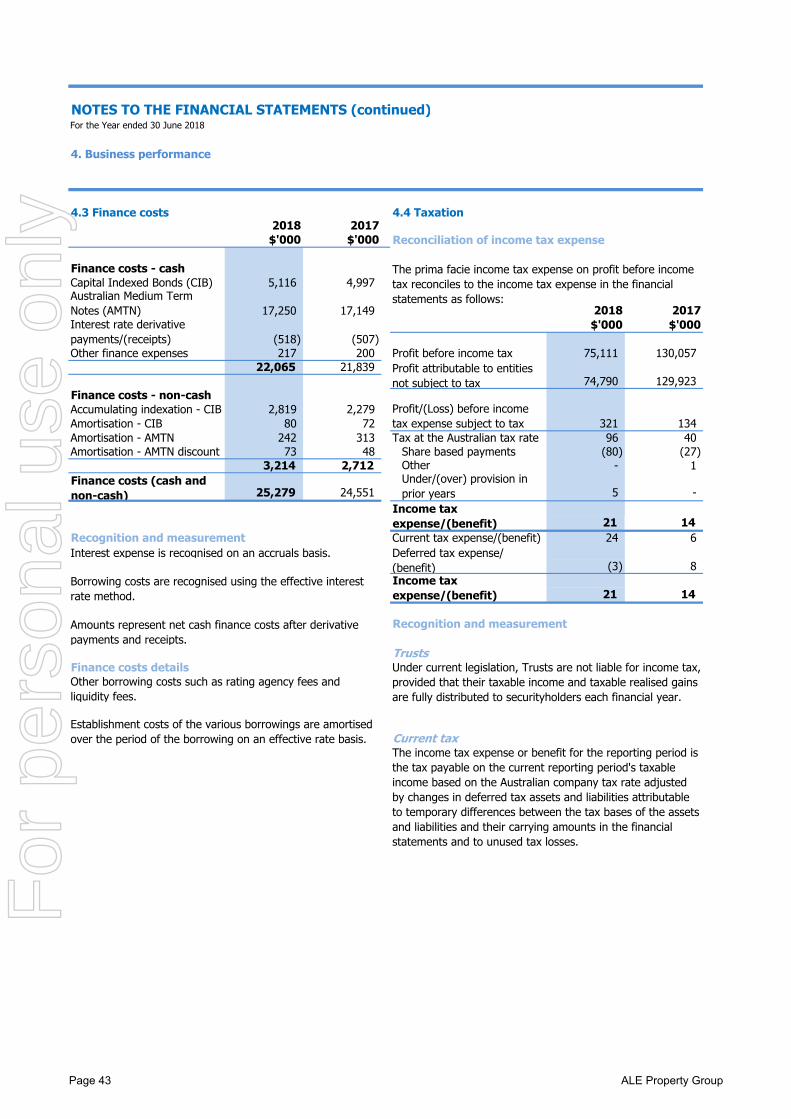
NOTES TO THE FINANCIAL STATEMENTS (continued)For the Year ended 30 June 2018
4. Business performance
4.3 Finance costs 4.4 Taxation2018 2017$'000 $'000 Reconciliation of income tax expense
Finance costs - cash5,116 4,997
17,250 17,149 2018 2017$'000 $'000
(518) (507) Other finance expenses 217 200 75,111 130,057
22,065 21,839 74,790 129,923
Finance costs - non-cashAccumulating indexation - CIB 2,819 2,279 Amortisation - CIB 80 72 321 134 Amortisation - AMTN 242 313 Tax at the Australian tax rate 96 40 Amortisation - AMTN discount 73 48 (80) (27)
3,214 2,712 Other - 1
25,279 24,551 5 -
21 14 Recognition and measurement Current tax expense/(benefit) 24 6 Interest expense is recognised on an accruals basis.
(3) 8
21 14
Recognition and measurement
TrustsFinance costs details
Current tax
Income tax expense/(benefit)
Share based payments
Under/(over) provision in prior years
Profit before income tax
The prima facie income tax expense on profit before incometax reconciles to the income tax expense in the financialstatements as follows:
Interest rate derivative payments/(receipts)
Australian Medium Term Notes (AMTN)
Deferred tax expense/ (benefit)
Borrowing costs are recognised using the effective interest rate method.
The income tax expense or benefit for the reporting period is the tax payable on the current reporting period's taxable income based on the Australian company tax rate adjusted by changes in deferred tax assets and liabilities attributable to temporary differences between the tax bases of the assets and liabilities and their carrying amounts in the financial statements and to unused tax losses.
Profit attributable to entities not subject to tax
Profit/(Loss) before income tax expense subject to tax
Capital Indexed Bonds (CIB)
Finance costs (cash and non-cash)
Income tax expense/(benefit)
Under current legislation, Trusts are not liable for income tax, provided that their taxable income and taxable realised gains are fully distributed to securityholders each financial year.
Establishment costs of the various borrowings are amortised over the period of the borrowing on an effective rate basis.
Amounts represent net cash finance costs after derivative payments and receipts.
Other borrowing costs such as rating agency fees and liquidity fees.
Page 43 ALE Property Group
For
per
sona
l use
onl
y
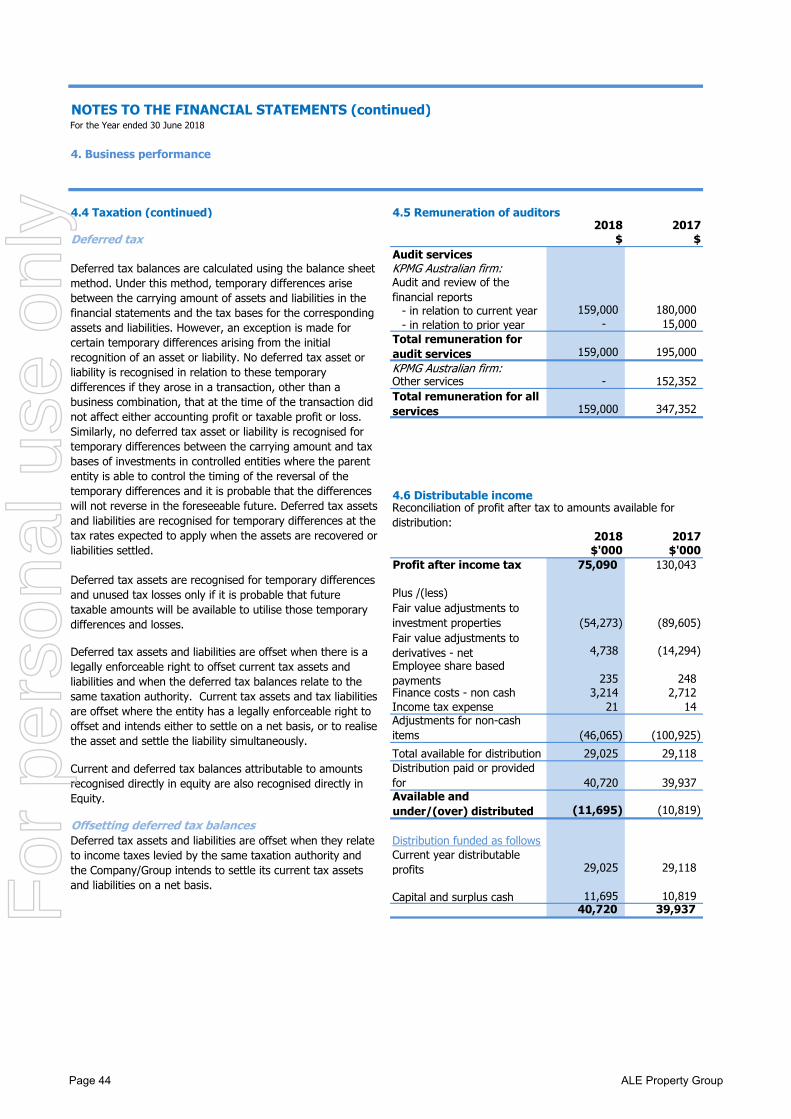
NOTES TO THE FINANCIAL STATEMENTS (continued)For the Year ended 30 June 2018
4. Business performance
4.4 Taxation (continued) 4.5 Remuneration of auditors2018 2017
Deferred tax $ $Audit servicesKPMG Australian firm:
- in relation to current year 159,000 180,000 - in relation to prior year - 15,000
159,000 195,000 KPMG Australian firm:Other services - 152,352
159,000 347,352
4.6 Distributable income
2018 2017$'000 $'000
Profit after income tax 75,090 130,043
Plus /(less)
(54,273) (89,605)
4,738 (14,294)
235 248 Finance costs - non cash 3,214 2,712 Income tax expense 21 14
(46,065) (100,925) 29,025 29,118
40,720 39,937
(11,695) (10,819) Offsetting deferred tax balances
Distribution funded as follows
29,025 29,118
Capital and surplus cash 11,695 10,819 40,720 39,937
Current year distributable profits
Current and deferred tax balances attributable to amounts recognised directly in equity are also recognised directly in Equity.
Deferred tax assets and liabilities are offset when they relate to income taxes levied by the same taxation authority and the Company/Group intends to settle its current tax assets and liabilities on a net basis.
Audit and review of the financial reports
Employee share based payments
Fair value adjustments to investment propertiesFair value adjustments to derivatives - net
Adjustments for non-cash items
Total remuneration for audit services
Deferred tax balances are calculated using the balance sheet method. Under this method, temporary differences arise between the carrying amount of assets and liabilities in the financial statements and the tax bases for the corresponding assets and liabilities. However, an exception is made for certain temporary differences arising from the initial recognition of an asset or liability. No deferred tax asset or liability is recognised in relation to these temporary differences if they arose in a transaction, other than a business combination, that at the time of the transaction did not affect either accounting profit or taxable profit or loss. Similarly, no deferred tax asset or liability is recognised for temporary differences between the carrying amount and tax bases of investments in controlled entities where the parent entity is able to control the timing of the reversal of the temporary differences and it is probable that the differences will not reverse in the foreseeable future. Deferred tax assets and liabilities are recognised for temporary differences at the tax rates expected to apply when the assets are recovered or liabilities settled.
Deferred tax assets are recognised for temporary differences and unused tax losses only if it is probable that future taxable amounts will be available to utilise those temporary differences and losses.
Distribution paid or provided forAvailable and under/(over) distributed
Total remuneration for all services
Reconciliation of profit after tax to amounts available for distribution:
Total available for distribution
Deferred tax assets and liabilities are offset when there is a legally enforceable right to offset current tax assets and liabilities and when the deferred tax balances relate to the same taxation authority. Current tax assets and tax liabilities are offset where the entity has a legally enforceable right to offset and intends either to settle on a net basis, or to realise the asset and settle the liability simultaneously.
Page 44 ALE Property Group
For
per
sona
l use
onl
y
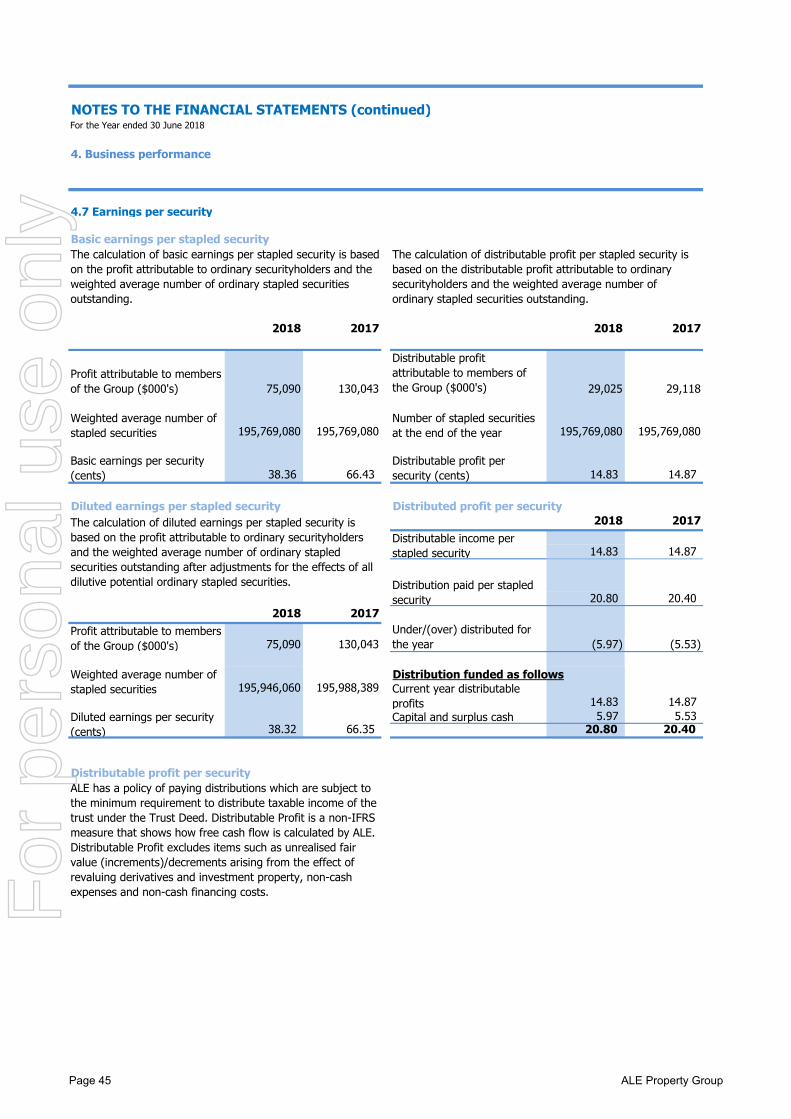
NOTES TO THE FINANCIAL STATEMENTS (continued)For the Year ended 30 June 2018
4. Business performance
4.7 Earnings per security
Basic earnings per stapled security
2018 2017 2018 2017
75,090 130,043 29,025 29,118
195,769,080 195,769,080 195,769,080 195,769,080
38.36 66.43 14.83 14.87
Diluted earnings per stapled security Distributed profit per security2018 2017
14.83 14.87
20.80 20.402018 2017
75,090 130,043 (5.97) (5.53)
Distribution funded as follows195,946,060 195,988,389
14.83 14.87 Capital and surplus cash 5.97 5.53
38.32 66.35 20.80 20.40
Distributable profit per security
The calculation of diluted earnings per stapled security is based on the profit attributable to ordinary securityholders and the weighted average number of ordinary stapled securities outstanding after adjustments for the effects of all dilutive potential ordinary stapled securities.
ALE has a policy of paying distributions which are subject to the minimum requirement to distribute taxable income of the trust under the Trust Deed. Distributable Profit is a non-IFRS measure that shows how free cash flow is calculated by ALE. Distributable Profit excludes items such as unrealised fair value (increments)/decrements arising from the effect of revaluing derivatives and investment property, non-cash expenses and non-cash financing costs.
Distributable profit attributable to members of the Group ($000's)
The calculation of basic earnings per stapled security is based on the profit attributable to ordinary securityholders and the weighted average number of ordinary stapled securities outstanding.
Weighted average number of stapled securities
Diluted earnings per security (cents)
Basic earnings per security (cents)
The calculation of distributable profit per stapled security is based on the distributable profit attributable to ordinary securityholders and the weighted average number of ordinary stapled securities outstanding.
Under/(over) distributed for the year
Current year distributable profits
Number of stapled securities at the end of the year
Distributable profit per security (cents)
Distributable income per stapled security
Distribution paid per stapled security
Profit attributable to members of the Group ($000's)
Profit attributable to members of the Group ($000's)
Weighted average number of stapled securities
Page 45 ALE Property Group
For
per
sona
l use
onl
y
NOTES TO THE FINANCIAL STATEMENTS (continued)For the Year ended 30 June 2018
5.Employee benefits
5.1 Employee benefits 5.3 Employee share plans
5.2 Key management personnel compensation
5.1 Employee benefits2018 2017 Long service leave$'000 $'000
Employee benefits provision:Current 255 190
Recognition and measurement
Retirement benefit obligations5.2 Key management personnel compensation
2018 2017$ $
Short term employee benefits 1,992,500 1,954,719 Post employment benefits 113,837 114,645 Other long term benefits 39,089 24,613 Share based payments 234,960 248,337 Termination benefits - - 5.3 Employee share plans
2,380,386 2,342,314 Executive Stapled Security Scheme (ESSS)
Recognition and measurement
Wages and salaries, annual leave and sick leave
Bonus and incentive plansLiabilities and expenses for bonuses and incentives are recognised where contractually obliged or where there is a past practice that may create a constructive obligation.
The fair value at grant date is determined as the value of the ESSS Rights in the year in which they are awarded. The number of ESSS Rights issued annually under the ESSS will be determined by dividing the value of the grant by the volume weighted average price for the five trading days commencing the day following the signing of ALE Property Group’s full year statutory financial statements and grossing this number up for the future value of the estimated distributions over the three year deferred delivery period. Upon the exercise of ESSS rights, the balance of the share based payments reserve relating to those rights is transferred to Contributed Equity.
This section provides a breakdown of the various programs ALE uses to reward and recognise employees and key executives, including Key Management Personnel (KMP). ALE believes that these programs reinforce the value of ownership and incentives and drive performance both individually and collectively to deliver better returns to securityholders.
ALE pays fixed contributions to employee nominated superannuation funds and ALE's legal or constructive obligations are limited to these contributions. The contributions are recognised as an expense as they become payable. Prepaid contributions are recognised as an asset to the extent that a cash refund or a reduction in the future payments is available.
The ESSS was established in 2012. The grant date fair value of ESSS Rights granted to employees is recognised as an employee expense, with a corresponding increase in equity, over the period that the employees become unconditionally entitled to the ESSS rights. The amount recognised as an expense is adjusted to reflect the actual number of ESSS Rights that vest.
The employee benefits liability represents accrued wages and salaries, leave entitlements and other incentives recognised in respect of employees’ services up to the end of the reporting period. These liabilities are measured at the amounts expected to be paid when they are settled and include related on-costs, such as workers compensation insurance, superannuation and payroll tax.
ALE recognises liabilities for long service leave when employees reach a qualifying period of continuous service (five years). The liability for long service leave is recognised in the provision for employee benefits and measured as the present value of expected future payments to be made in respect of services provided by employees up to the reporting date. Consideration is given to expected future wage and salary levels, experience of employee departures and periods of service. Expected future payments are discounted using market yields at the reporting date on national government bonds with the terms to maturity and currency that match, as closely as possible, the estimated future cash flow.
Liabilities for wages and salaries, including non-monetary benefits and annual leave due to be settled within 12 months of the reporting date, are recognised as a current liability in respect of employees' services up to the reporting date, and are measured at the amounts expected to be paid when the liabilities are settled. Liabilities for accumulated sick leave are recognised as an expense when the leave is taken and measured at the rates paid or payable.
Page 46 ALE Property Group
For
per
sona
l use
onl
y
Notes to the financial statements (continued)For the Year ended 30 June 2018
6.Other
6.1 New accounting standards 6.5 Investments in controlled entities
6.2 Segment reporting 6.6 Related party transactions
6.3 Events occurring after balance date 6.7 Parent Entity Disclosures
6.4 Contingent liabilities and contingent assets
6.1 New accounting standards
AASB 15 Revenue from Contracts with Customers
Other standards
Other standards
AASB16 Leasing
This section provides details on other required disclosures relating to the Group to comply with the accounting standardsand other pronouncements.
A number of new standards, amendments to standards and interpretations are effective for annual periods beginning after 1 January 2018 and have not been applied in preparing these financial statements. Those which may be relevant to the Group are set out below. The Group does not plan to adopt these standards early.
AASB 9 Financial Instruments (2010), AASB 9 Financial Instruments (2009)AASB 9, published in July 2014, replaces the existing guidance in IAS 39 Financial Instruments: Recognition and Measurement. AASB 9 includes revised guidance on the classification and measurement of financial instruments, including a new expected credit loss model for calculating impairment on financial assets, and the new general hedge accounting requirements. It also carries forward the guidance on recognition and derecognition of financial instruments from IAS 39. AASB 9 is effective for annual reporting periods beginning on or after 1 January 2018, with early adoption permitted.
The following amended standards and interpretations are not expected to have a significant impact on the Company’s financial statements:
The following amended standards and interpretations are not expected to have a significant impact on the Company’s financial statements:
The Group has completed an assessment of the potential impact of the adoption of AASB 15 on its financial statements and there will be no significant changes.
AASB 15 is effective for annual reporting periods beginning on or after 1 January 2018, with early adoption permitted.
AASB 15 establishes a comprehensive framework for determining whether, how much and when revenue is recognised. It replaces existing revenue recognition guidance, including IAS 18 Revenue, IAS 11 Construction Contracts and IFRIC 13 Customer Loyalty Programmes.
The Company has assessed the potential impact on its financial statements resulting from the application of AASB 16 to be immaterial.
The Group has assessed the potential impact on its consolidated financial statement resulting from the application of AASB 9 based on its positions as at 30 June 2018 and hedging arrangements during 2018 under IAS 39. Based on its assessment the new classification and measurement approach for financial assets, financial liabilities or the impairment requirements for financial assets will not have a material impact on the financial statements.
Classification and Measurement of Share-based Payment Transactions ( Amendments to IFRS 2).
Annual Improvements to IFRSs 2014-2016 Cycle – Amendments to IFRS 1 and IAS 28
IFRIC 23 Uncertainty over Income Tax Treatments
IFRIC 22 Foreign Currency Transactions and Advance Consideration
AABS 16 establishes a comprehensive framework the accounting policies and disclosures applicable to leases, both for lessees and lessors. AABS 16 is effective for annual reporting periods beginning on or after 1 January 2019, with early adoption permitted.
Page 47 ALE Property Group
For
per
sona
l use
onl
y
Notes to the financial statements (continued)For the Year ended 30 June 2018
6. Other
6.2 Segment reporting
Business segment Transactions with related parties
Terms and conditions
6.3 Events occurring after balance date
6.7 Parent Entity Disclosures
6.4 Contingent liabilities and contingent assets2018 2017
Bank guarantee $'000 $'000
Profit for the year 29,026 29,155
6.5 Investments in controlled entities Financial position of the parent entityCurrent assets
Cash 21 196
Non current assets
275,656 275,656 Total assets 275,677 275,852
Payables 26,690 15,563 Provisions 20,458 20,066
47,148 35,6296.6 Related party transactions Net assets 228,529 240,223
Parent entity and subsidiaries Issued units 252,431 252,431Details are set out in Note 6.5 and 6.7. Retained earnings (23,902) (12,208)
Total equity 228,529 240,223 Key management personnelKey management personnel and their compensation are set out in the Remuneration Report on Page 17.
ALE has entered into a bank guarantee of $73,273 in respect of the office tenancy at Level 10, 6 O'Connell Street, Sydney.
The Trust owns 100% of the issued units of the Sub Trust. The Sub Trust owns 100% of the issued shares of the Finance Company. The Trust owns none of the issued shares of the Company, but is deemed to be its "acquirer" under AASB.
Total liabilities
Investments in controlled entities
Current liabilitiesIn addition, the Trust owns 100% of the issued units of ALE Direct Property Trust No.3, which in turns owns 100% of the issued shares of ALE Finance Company No.3 Pty Limited. Both of these Trust subsidiaries are non operating.
There has not arisen in the interval between the end of the financial year and the date of this report, any transaction or event of a material and unusual nature likely, in the opinion of the Directors of the Company, to affect significantly the operations of the Group, the results of those operations, or the state of affairs of the Group, in future financial years. As at, and throughout, the financial year ending 30 June
2018 the parent entity of ALE was Australian Leisure and Entertainment Property Trust.
All related party transactions are conducted on normal commercial terms and conditions.
For the year ended 30 June 2018, the Company received $4,359,742 of expense reimbursement from the Trust (2017: $4,460,628), and the Finance Company charged the Sub Trust $8,033,147 interest (2017: $7,366,400).
The results and financial position of ALE's single operating segment, ALE Strategic Business Unit, are prepared for the Managing Director on a quarterly basis. The strategic business unit covers the operations of the responsible entity for the ALE Property Group.
Comparative information has been presented in conformity with the requirements of AASB 8 Operating Segments.
Robert Mactier is a consultant to UBS AG. UBS AG has provided debt lead management services to ALE in the past and may continue to do so in the future. Mr Mactier does not take part in any decisions to appoint UBS AG in relation to debt lead management services provided by UBS AG to ALE.
All of ALE Property Group's pub properties are leased to members of the ALH Group, and accordingly 100% of the rental income is received from ALH (2017: 100%). Non pub rental income comprises less than 1% of total revenue.
Outstanding balances are unsecured and are repayable in cash and callable on demand.
Page 48 ALE Property Group
For
per
sona
l use
onl
y
DIRECTORS' DECLARATIONFor the Year ended 30 June 2018
(a)
(i)
(ii)
(b)
(c )
(d)
This declaration is made in accordance with a resolution of the Directors.
Robert Mactier Andrew WilkinsonChairman Managing Director
In the opinion of the directors of the Company:
The directors have been given the declarations required by Section 295A of the Corporations Act 2001 from the Managing Director, Finance Manager, and Company Secretary as required for the financial year ended 30 June 2018.
The directors draw attention to Note 1 to the financial statements, which includes a statement of compliance with International Financial Reporting Standards.
Dated this 8th day of August 2018
the financial statements and notes that are set out on pages 22 to 48 and the Remuneration report contained in Section 9 of the Directors’ report, are in accordance with the Corporations Act 2001 , including
there are reasonable grounds to believe that ALE will be able to pay its debts as and when they become due and payable.
giving a true and fair view of ALE’s financial position as at 30 June 2018 and of its performance for the financial year ended on that date; and
complying with Australian Accounting Standards and the Corporations Regulations 2001;
Page 49 ALE Property Group
For
per
sona
l use
onl
y
Page 50
For
per
sona
l use
onl
y
Page 51
For
per
sona
l use
onl
y
Page 52
For
per
sona
l use
onl
y
Page 53
For
per
sona
l use
onl
y
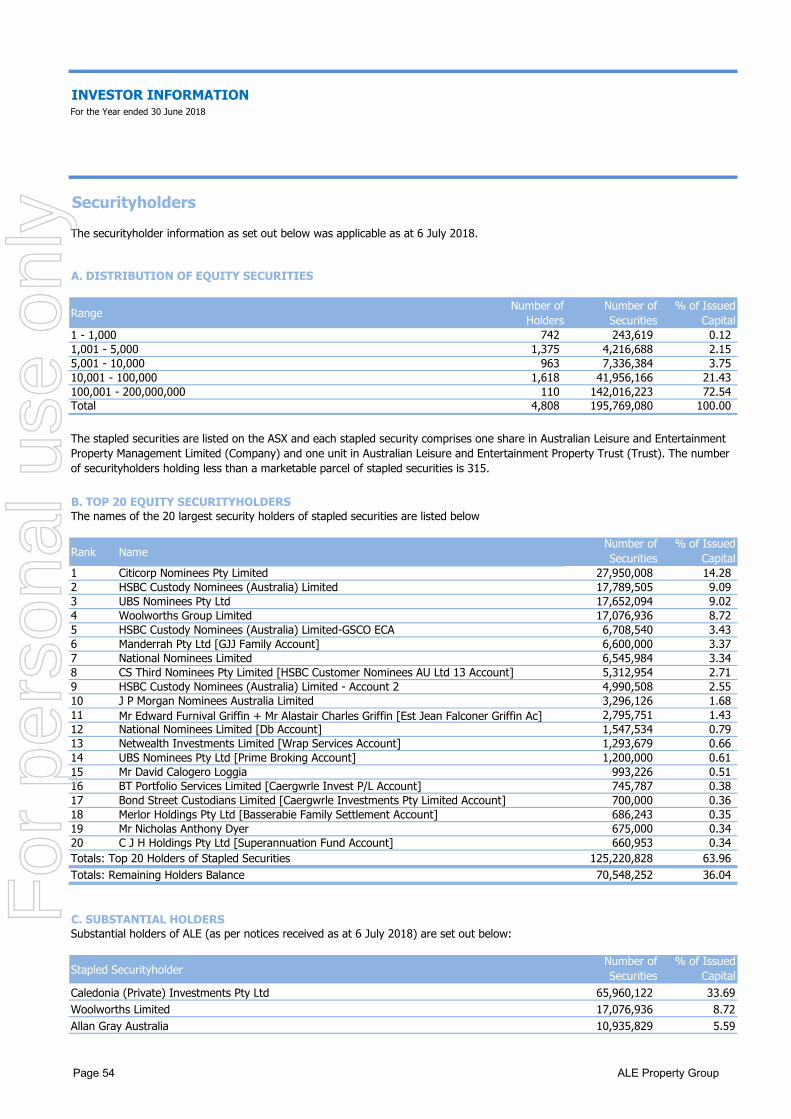
INVESTOR INFORMATIONFor the Year ended 30 June 2018
Securityholders
The securityholder information as set out below was applicable as at 6 July 2018.
A. DISTRIBUTION OF EQUITY SECURITIES
Range Number of Holders
Number of Securities
% of Issued Capital
1 - 1,000 742 243,619 0.12 1,001 - 5,000 1,375 4,216,688 2.15 5,001 - 10,000 963 7,336,384 3.75 10,001 - 100,000 1,618 41,956,166 21.43 100,001 - 200,000,000 110 142,016,223 72.54 Total 4,808 195,769,080 100.00
B. TOP 20 EQUITY SECURITYHOLDERSThe names of the 20 largest security holders of stapled securities are listed below
Rank NameNumber of Securities
% of Issued Capital
1 Citicorp Nominees Pty Limited 27,950,008 14.28 2 HSBC Custody Nominees (Australia) Limited 17,789,505 9.09 3 UBS Nominees Pty Ltd 17,652,094 9.02 4 Woolworths Group Limited 17,076,936 8.72 5 HSBC Custody Nominees (Australia) Limited-GSCO ECA 6,708,540 3.43 6 Manderrah Pty Ltd [GJJ Family Account] 6,600,000 3.37 7 National Nominees Limited 6,545,984 3.34 8 CS Third Nominees Pty Limited [HSBC Customer Nominees AU Ltd 13 Account] 5,312,954 2.71 9 HSBC Custody Nominees (Australia) Limited - Account 2 4,990,508 2.55 10 J P Morgan Nominees Australia Limited 3,296,126 1.68 11 2,795,751 1.43 12 National Nominees Limited [Db Account] 1,547,534 0.79 13 Netwealth Investments Limited [Wrap Services Account] 1,293,679 0.66 14 UBS Nominees Pty Ltd [Prime Broking Account] 1,200,000 0.61 15 Mr David Calogero Loggia 993,226 0.51 16 BT Portfolio Services Limited [Caergwrle Invest P/L Account] 745,787 0.38 17 Bond Street Custodians Limited [Caergwrle Investments Pty Limited Account] 700,000 0.36 18 Merlor Holdings Pty Ltd [Basserabie Family Settlement Account] 686,243 0.35 19 Mr Nicholas Anthony Dyer 675,000 0.34 20 C J H Holdings Pty Ltd [Superannuation Fund Account] 660,953 0.34 Totals: Top 20 Holders of Stapled Securities 125,220,828 63.96 Totals: Remaining Holders Balance 70,548,252 36.04
C. SUBSTANTIAL HOLDERSSubstantial holders of ALE (as per notices received as at 6 July 2018) are set out below:
Stapled SecurityholderNumber of Securities
% of Issued Capital
Caledonia (Private) Investments Pty Ltd 65,960,122 33.69Woolworths Limited 17,076,936 8.72Allan Gray Australia 10,935,829 5.59
The stapled securities are listed on the ASX and each stapled security comprises one share in Australian Leisure and Entertainment Property Management Limited (Company) and one unit in Australian Leisure and Entertainment Property Trust (Trust). The number of securityholders holding less than a marketable parcel of stapled securities is 315.
Mr Edward Furnival Griffin + Mr Alastair Charles Griffin [Est Jean Falconer Griffin Ac]
Page 54 ALE Property Group
For
per
sona
l use
onl
y
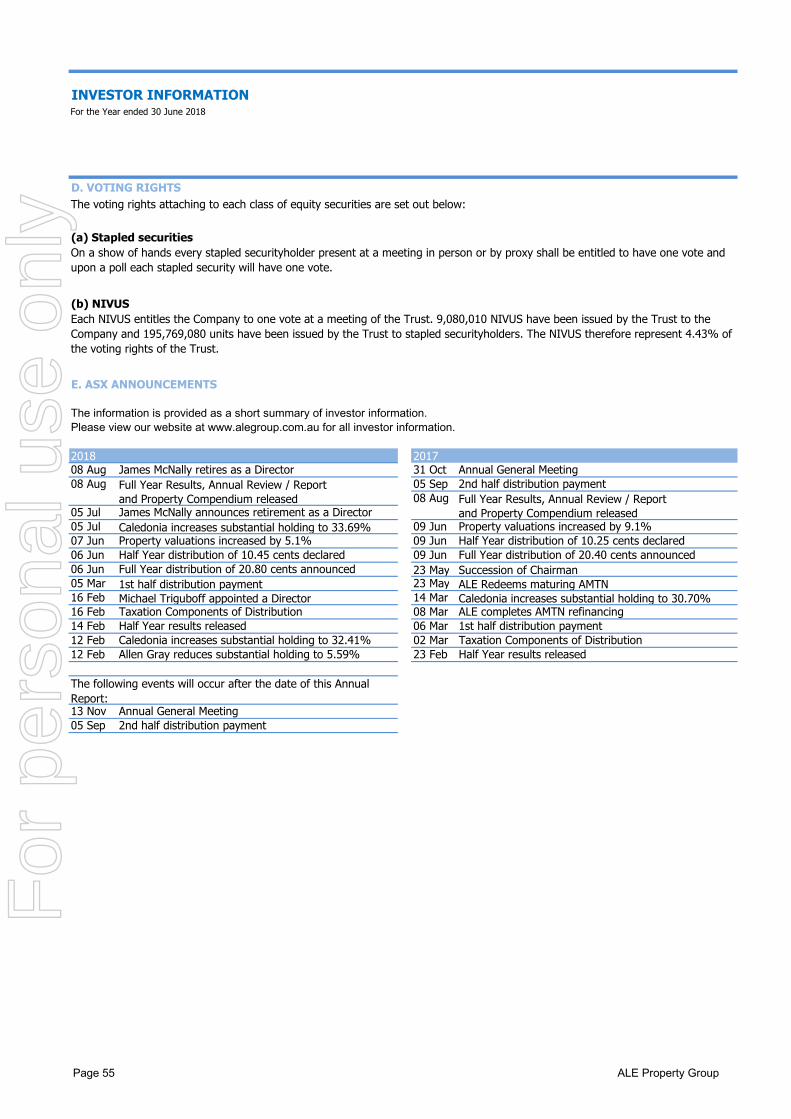
INVESTOR INFORMATIONFor the Year ended 30 June 2018
D. VOTING RIGHTSThe voting rights attaching to each class of equity securities are set out below:
(a) Stapled securities
(b) NIVUS
E. ASX ANNOUNCEMENTS
The information is provided as a short summary of investor information.Please view our website at www.alegroup.com.au for all investor information.
2018 201708 Aug James McNally retires as a Director 31 Oct Annual General Meeting08 Aug Full Year Results, Annual Review / Report 05 Sep 2nd half distribution payment
and Property Compendium released 08 Aug Full Year Results, Annual Review / Report 05 Jul James McNally announces retirement as a Director and Property Compendium released05 Jul Caledonia increases substantial holding to 33.69% 09 Jun Property valuations increased by 9.1% 07 Jun Property valuations increased by 5.1% 09 Jun Half Year distribution of 10.25 cents declared06 Jun Half Year distribution of 10.45 cents declared 09 Jun Full Year distribution of 20.40 cents announced06 Jun Full Year distribution of 20.80 cents announced 23 May Succession of Chairman05 Mar 1st half distribution payment 23 May ALE Redeems maturing AMTN16 Feb Michael Triguboff appointed a Director 14 Mar Caledonia increases substantial holding to 30.70%16 Feb Taxation Components of Distribution 08 Mar ALE completes AMTN refinancing14 Feb Half Year results released 06 Mar 1st half distribution payment12 Feb Caledonia increases substantial holding to 32.41% 02 Mar Taxation Components of Distribution12 Feb Allen Gray reduces substantial holding to 5.59% 23 Feb Half Year results released
13 Nov Annual General Meeting05 Sep 2nd half distribution payment
The following events will occur after the date of this Annual Report:
On a show of hands every stapled securityholder present at a meeting in person or by proxy shall be entitled to have one vote andupon a poll each stapled security will have one vote.
Each NIVUS entitles the Company to one vote at a meeting of the Trust. 9,080,010 NIVUS have been issued by the Trust to theCompany and 195,769,080 units have been issued by the Trust to stapled securityholders. The NIVUS therefore represent 4.43% ofthe voting rights of the Trust.
Page 55 ALE Property Group
For
per
sona
l use
onl
y
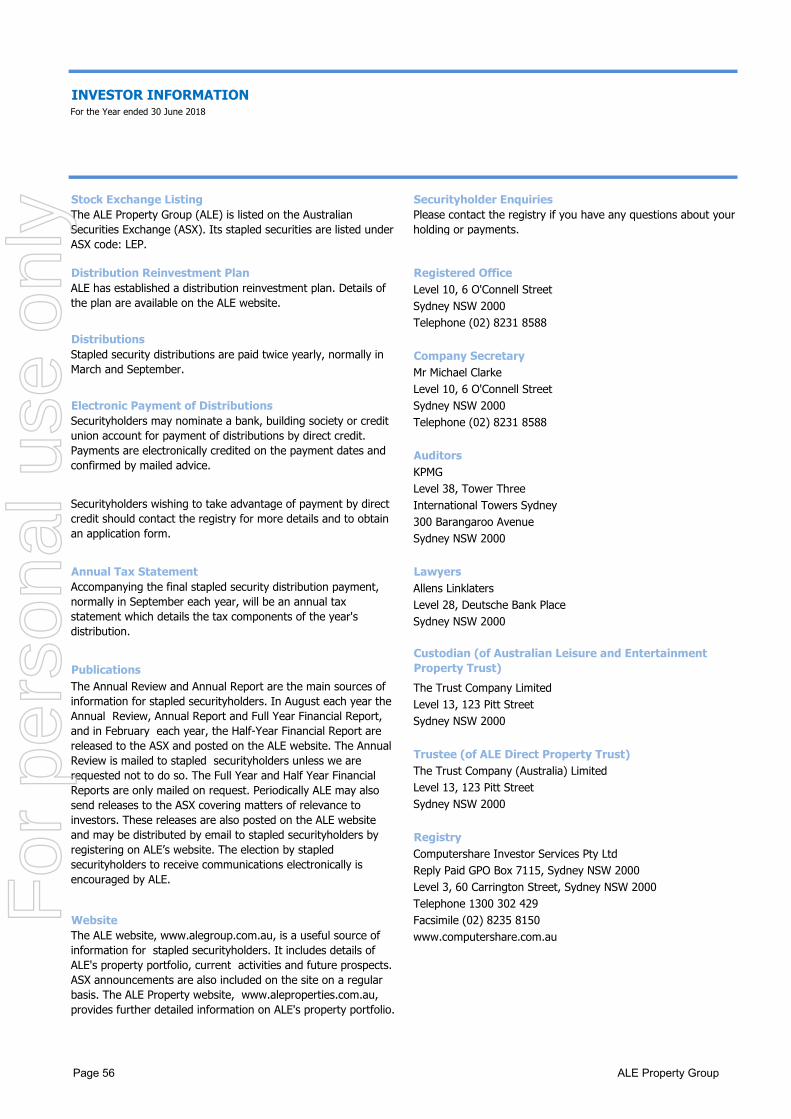
INVESTOR INFORMATIONFor the Year ended 30 June 2018
Stock Exchange Listing Securityholder Enquiries
Distribution Reinvestment Plan Registered OfficeLevel 10, 6 O'Connell StreetSydney NSW 2000Telephone (02) 8231 8588
DistributionsCompany SecretaryMr Michael ClarkeLevel 10, 6 O'Connell Street
Electronic Payment of Distributions Sydney NSW 2000Telephone (02) 8231 8588
AuditorsKPMGLevel 38, Tower ThreeInternational Towers Sydney300 Barangaroo AvenueSydney NSW 2000
Annual Tax Statement LawyersAllens LinklatersLevel 28, Deutsche Bank PlaceSydney NSW 2000
PublicationsThe Trust Company LimitedLevel 13, 123 Pitt StreetSydney NSW 2000
Trustee (of ALE Direct Property Trust)The Trust Company (Australia) LimitedLevel 13, 123 Pitt StreetSydney NSW 2000
RegistryComputershare Investor Services Pty LtdReply Paid GPO Box 7115, Sydney NSW 2000Level 3, 60 Carrington Street, Sydney NSW 2000Telephone 1300 302 429
Website Facsimile (02) 8235 8150www.computershare.com.au
Securityholders may nominate a bank, building society or credit union account for payment of distributions by direct credit. Payments are electronically credited on the payment dates and confirmed by mailed advice.
The ALE Property Group (ALE) is listed on the Australian Securities Exchange (ASX). Its stapled securities are listed under ASX code: LEP.
Custodian (of Australian Leisure and Entertainment Property Trust)
The Annual Review and Annual Report are the main sources of information for stapled securityholders. In August each year the Annual Review, Annual Report and Full Year Financial Report, and in February each year, the Half-Year Financial Report are released to the ASX and posted on the ALE website. The Annual Review is mailed to stapled securityholders unless we are requested not to do so. The Full Year and Half Year Financial Reports are only mailed on request. Periodically ALE may also send releases to the ASX covering matters of relevance to investors. These releases are also posted on the ALE website and may be distributed by email to stapled securityholders by registering on ALE’s website. The election by stapled securityholders to receive communications electronically is encouraged by ALE.
The ALE website, www.alegroup.com.au, is a useful source of information for stapled securityholders. It includes details of ALE's property portfolio, current activities and future prospects. ASX announcements are also included on the site on a regular basis. The ALE Property website, www.aleproperties.com.au, provides further detailed information on ALE's property portfolio.
Please contact the registry if you have any questions about your holding or payments.
ALE has established a distribution reinvestment plan. Details of the plan are available on the ALE website.
Stapled security distributions are paid twice yearly, normally in March and September.
Securityholders wishing to take advantage of payment by direct credit should contact the registry for more details and to obtain an application form.
Accompanying the final stapled security distribution payment, normally in September each year, will be an annual tax statement which details the tax components of the year's distribution.
Page 56 ALE Property Group
For
per
sona
l use
onl
y

MIAMI TAVERN, GOLD COAST QLD
For
per
sona
l use
onl
y
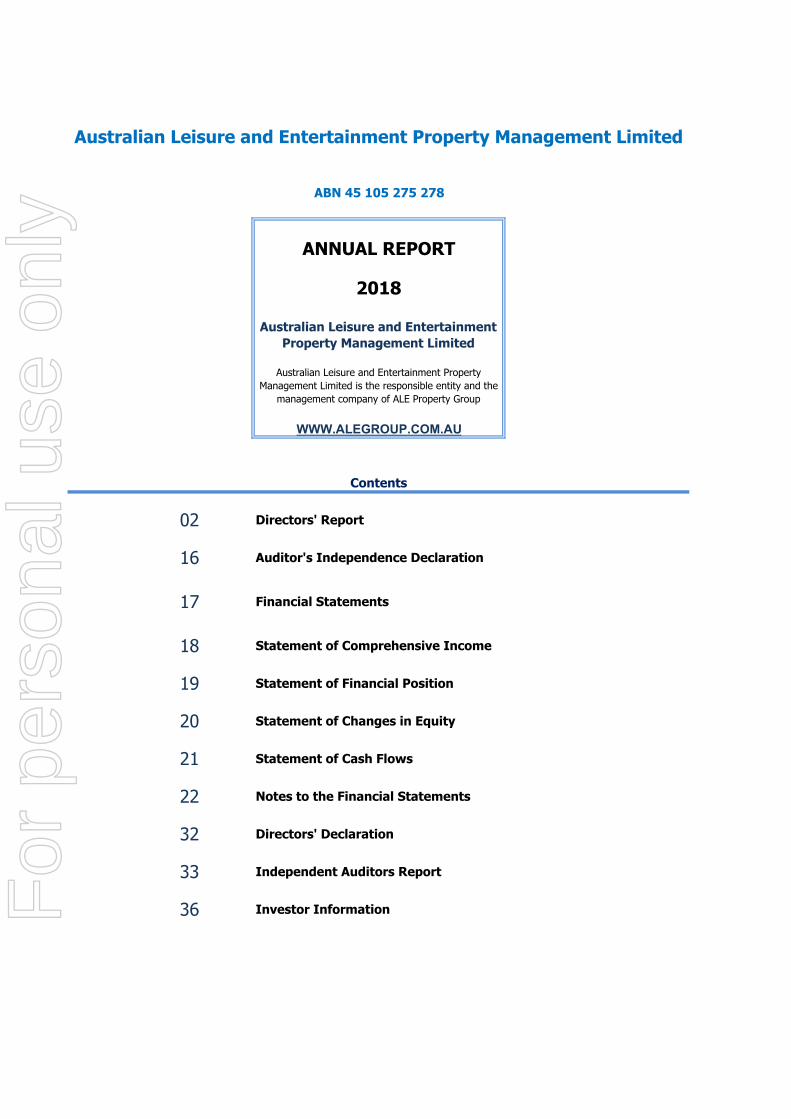
ABN 45 105 275 278
ANNUAL REPORT
2018
WWW.ALEGROUP.COM.AU
Contents
02 Directors' Report
16 Auditor's Independence Declaration
17 Financial Statements
18 Statement of Comprehensive Income
19 Statement of Financial Position
20 Statement of Changes in Equity
21 Statement of Cash Flows
22 Notes to the Financial Statements
32 Directors' Declaration
33 Independent Auditors Report
36 Investor Information
Australian Leisure and Entertainment Property Management Limited
Australian Leisure and Entertainment Property Management Limited
Australian Leisure and Entertainment Property Management Limited is the responsible entity and the
management company of ALE Property Group
For
per
sona
l use
onl
y
DIRECTORS' REPORTFor the Year ended 30 June 2018
The registered office and principal place of business of the Company is:
Level 106 O'Connell StreetSydney NSW 2000
NameRobert Mactier, B.Ec, MAICD Appointed: 28 November 2016 Appointed Chair: 23 May 2017Independent Non Executive DirectorChairman of the Board
Appointed: 26 November 2013 Appointed Chair of ACRMC: 26 October 2015
Independent Non Executive Director
Pippa graduated from the University of California at Berkeley with a Bachelor of Science in Business Administration majoring and Finance and Accounting. Pippa also completed a Masters of Applied Finance from Macquarie University in 1998. Ms Downes is a member of The AICD and Women Corporate Directors and in 2016 was named as a Women of Influence in the AFR/Westpac awards.
Robert began his career at KPMG and from January 1986 to April 1990 worked across their audit, management consulting and corporate finance practices. He has extensive investment banking experience in Australia, having previously worked for Ord Minnett Securities, E.L. & C. Baillieu and Citigroup between 1990 and 2006.
Robert holds a Bachelor’s degree in economics from the University of Sydney and has been a Member of the Australian Institute of Company Directors since 2007.
The Directors of Australian Leisure and Entertainment Property Management Limited (the "Company") present their report for the year ended 30 June 2018.
1. DIRECTORSThe following persons were directors of the Company during the year and up to the date of this report unless otherwise stated:
Experience, responsibilities and other directorships
Member of the Audit, Compliance and Risk Management Committee (ACRMC)Member of the Nominations CommitteeMember of the Remuneration Committee
Phillipa Downes, BSc (Bus Ad), MAppFin, GAICD Chair of the ACRMC
Member of the Nominations CommitteeMember of the Remuneration Committee
Phillipa (Pippa) is a Director of the Australian Technology Innovators (Infotrack, LEAP Legal software), Windlab Limited, the ASX Clearing and Settlement companies and the Sydney Olympic Park Authority. Pippa is also on the panel of the ASX Appeals Tribunal and is a director of the Pinnacle Foundation. Ms Downes was a Managing Director and Equity Partner of Goldman Sachs in Australia until October 2011, working in the Proprietary Investment division. Pippa has had a successful international banking and finance career spanning over 20 years where she has led the local investment, derivative and trading arms of several of the world’s leading Investment Banks. She has extensive experience in Capital Markets and Derivatives and strong analytical skills investing across the capital structures of companies and across multiple asset classes.
Robert’s other current roles include Chairman of ASX-listed WPP AUNZ Limited (since 2006) and Consultant to UBS AG in Australia (since June 2007). Between 2006 and January 2017 he served as a non-executive Director of NASDAQ listed Melco Resorts and Entertainment Limited.
Prior to joining Goldman Sachs in 2004, Ms Downes was a director and the Head of Equity Derivatives Trading at Deutsche Bank in Sydney. When Morgan Stanley was starting its equity franchise in Australia in 1998 she was hired to set up the Derivative and Proprietary Trading business based in Hong Kong and Australia. Ms Downes started her career working for Swiss Bank O’Connor on the Floor of the Pacific Coast Stock Exchange in San Francisco, followed by the Philadelphia Stock Exchange before returning to work in Sydney as a director for UBS.
Page 2 Australian Leisure and Entertainment Property Management Limited
For
per
sona
l use
onl
y
DIRECTORS' REPORTFor the Year ended 30 June 2018
Name
Nancy Milne, OAM, LLB, FAICD Appointed: 6 February 2015Independent Non Executive Director
Appointed: 24 September 2014Independent Non Executive Director
Appointed: 26 June 2003
Non Executive Director
Michael Triguboff Appointed: 15 February 2018Independent Non Executive Director
Paul has over 30 years’ experience in commercial and residential property management, development and real estate transactions with major multinational institutions. Paul was Chief Investment Officer at Dexus Property Group from 2007 to 2012. Prior to that he was with Lend Lease Corporation for 11 years in various positions culminating with being the Head of Corporate Finance. Paul is a director of Frasers Logistic & Industrial Trust (SGX listed) and was previously a director of GPT Metro Office Fund.
Paul has a Graduate Diploma in Finance and Investment and a Graduate Diploma in Financial Planning. He is a Fellow of the Royal Institute of Chartered Surveyors, Fellow of the Australian Property Institute and a Licensed Real Estate Agent (NSW, VIC and QLD).
James McNally B.Bus (Land Economy), Dip. Law
Mr Triguboff has a background in equity funds management with groups including MIR and Lazard Asset Management Pacific, Lazard Asia Funds and was a global partner of Lazard Freres & Co. He was previously based in the USA and held positions with Quantum Funds and Equity Investments with a focus on principal investments in both public and private companies.
Michael’s academic qualifications include; Bachelor of Arts from the University of Sydney, Bachelor of Laws from University of New South Wales, Master of Business Administration from New York University, Master of Business Systems from Monash University, Master of Computer Science from University of Illinois at Urbana - Champaign / Columbia University, and Master of Criminology and Master of Laws from University of Sydney.
James is not considered an Independent Director as he has held an Executive Director position with ALE for the last three years to 15 April 2017.
Michael is a founding Director of Adexum Capital Limited, a private equity company investing in both public and private mid-market companies. Michael is also Vice Chairman of Pyrolyx AG, a dual listed German and Australian company involved in recycling.
James is an executive and founding director of the company. James has over 20 years’ experience in the funds management industry, having worked in both property trust administration and compliance roles for Perpetual Trustees Australia Limited and MIA Services Pty Limited, a company that specialises in compliance services to the funds management industry. James’ qualifications include a Bachelor of Business in land economy and a Diploma of Law. James is also a registered valuer and licensed real estate agent.
Paul Say, FRICS, FAPIMember of the ACRMCChair of the Nominations CommitteeChair of the Remuneration Committee
Member of the ACRMC
Member of the Remuneration CommitteeMember of the Nominations Committee
Nancy has been a professional non-executive director for over a decade. She is a former lawyer with over 30 years’ experience with primary areas of legal expertise in insurance, risk management, and corporate governance She was a partner with Clayton Utz until 2003 and a consultant until 2012. She is currently Chairman of the Securities Exchange Guarantee Corporation and deputy chairman of the State Insurance Regulatory Authority. She was previously a director of Australand Property Group, Crowe Horwarth Australasia, State Plus and Novion Property Group (now Vicinity Centres).
Nancy has a Bachelor of Laws from the University of Sydney. She is a member of the NSW Council of the Australian Institute of Company Directors and the Institute’s Law Committee.
Experience, responsibilities and other directorships
Page 3 Australian Leisure and Entertainment Property Management Limited
For
per
sona
l use
onl
y
DIRECTORS' REPORTFor the Year ended 30 June 2018
Name
Appointed: 16 November 2004Chief Executive Officer and Managing Director of the Company
Managing Director
2. OTHER OFFICERS
Name Experience
Appointed: 30 June 2016
David Lawler B.Bus, CPA Appointed: 9 December 2005 Resigned: 6 December 2017
3. INFORMATION ON DIRECTORS AND KEY MANAGEMENT PERSONNEL
Director Directorships of listed entities TypeResigned as Director
R W Mactier WPP AUNZ Limited Non-executiveR W Mactier Melco Resorts and Entertainment Limited (Nasdaq listed) Non-executive January 2017P G Say GPT Metro Office Fund Non-executive August 2014 September 2016P G Say Non-executive June 2016P J Downes Non-executive July 2017M P Triguboff Non-executive February 2015
Windlab LimitedPyrolyx AG
Andrew was appointed Managing Director of the Company in November 2004. He joined ALE as Chief Executive Officer at the time of its listing in November 2003. Andrew has around 35 years’ experience in banking, corporate finance and funds management. He was previously a corporate finance partner with PricewaterhouseCoopers and spent 15 years in finance and investment banking with organisations including ANZ Capel Court and Schroders.
Experience, responsibilities and other directorships
Michael Clarke BCom, MMan, CA, ACIS
Michael joined ALE in October 2006 and was appointed Company Secretary on 30 June 2016. Michael has a Bachelor of Commerce from the University of New South Wales and a Masters of Management from the Macquarie Graduate School of Management. He is an associate member of both the Governance Institute of Australia and the Institute of Chartered Accountants in Australia and New Zealand.
Directorships of listed entities within the last three years The following director held directorships of other listed entities within the last three years and from the date appointed up to the date of this report unless otherwise stated:
Appointed as Director
Frasers Logistic & Industrial Trust (SGX listed)
David was appointed to ALE’s ACRMC on 9 December 2005 and has over 25 years’ experience in internal auditing in the banking and finance industry. He was the Chief Audit Executive for Citibank in the Philippines, Italy, Switzerland, Mexico, Brazil, Australia and Hong Kong. David was Group Auditor for the Commonwealth Bank of Australia. David is the Chairman of the Australian Trade and Investment Commission Audit and Risk Committee, and the National Mental Health Commission Audit Committee, and is an audit committee member of the Australian Office of Financial Management, Cancer Australia, the Department of Foreign Affairs and Trade, the Australian Sports Anti-Doping Authority, and the Australian Maritime Safety Authority. David is Chairman of Australian Settlements Limited. David has a Bachelor of Business Studies from Manchester Metropolitan University in the UK. He is a Fellow of CPA Australia and a past President of the Institute of Internal Auditors – Australia.
December 2006December 2006
Andrew Wilkinson B.Bus, CFTP, MAICD
Responsible Manager of the Company under the Company’s Australian Financial Services Licence (AFSL)
Michael has over 30 years’ experience in accounting, taxation and financial management. Michael previously held senior financial positions with subsidiaries of listed public companies and spent 12 years working for Grant Thornton. He has also owned and managed his own accounting practice.
Independent member of ACRMC
Company Secretary and Finance Manager
Page 4 Australian Leisure and Entertainment Property Management Limited
For
per
sona
l use
onl
y
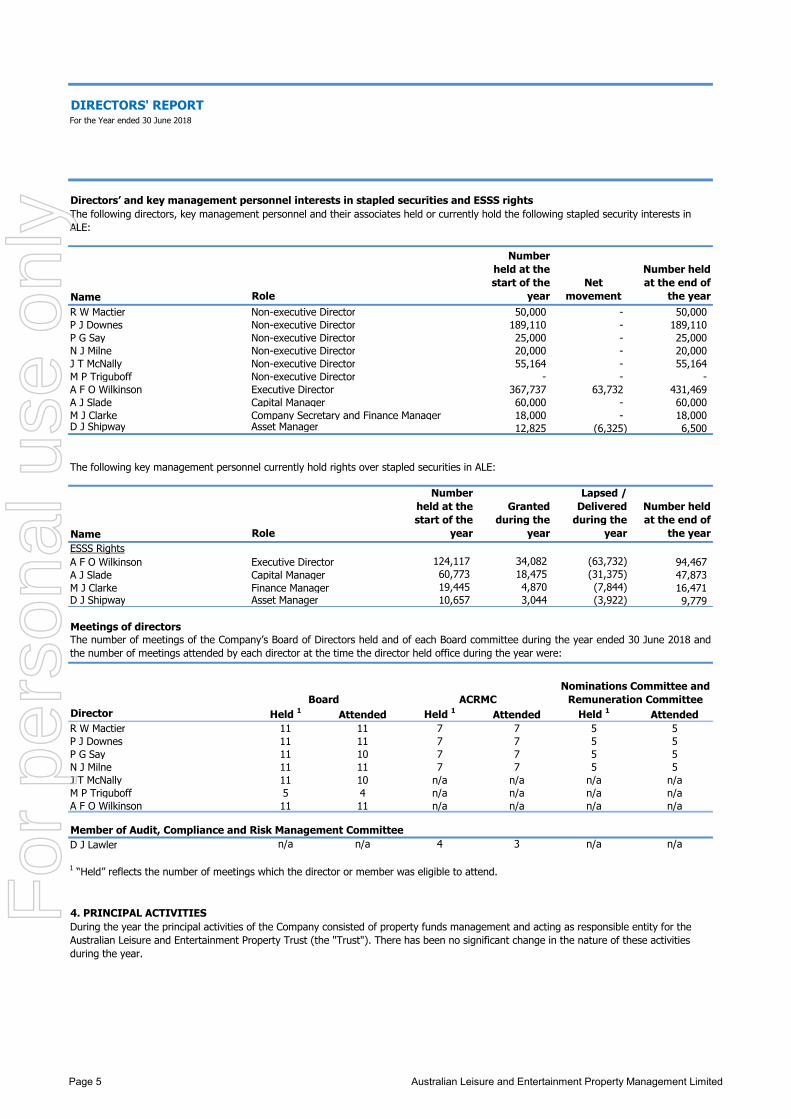
DIRECTORS' REPORTFor the Year ended 30 June 2018
Role
Number held at the start of the
yearNet
movement
Number held at the end of
the yearR W Mactier Non-executive Director 50,000 - 50,000 P J Downes Non-executive Director 189,110 - 189,110 P G Say Non-executive Director 25,000 - 25,000 N J Milne Non-executive Director 20,000 - 20,000 J T McNally Non-executive Director 55,164 - 55,164 M P Triguboff Non-executive Director - - - A F O Wilkinson Executive Director 367,737 63,732 431,469 A J Slade Capital Manager 60,000 - 60,000 M J Clarke Company Secretary and Finance Manager 18,000 - 18,000 D J Shipway Asset Manager 12,825 (6,325) 6,500
Role
Number held at the start of the
year
Granted during the
year
Lapsed / Delivered
during the year
Number held at the end of
the year
A F O Wilkinson Executive Director 124,117 34,082 (63,732) 94,467 A J Slade Capital Manager 60,773 18,475 (31,375) 47,873 M J Clarke Finance Manager 19,445 4,870 (7,844) 16,471 D J Shipway Asset Manager 10,657 3,044 (3,922) 9,779
Director Held 1 Attended Held 1 Attended Held 1 AttendedR W Mactier 11 11 7 7 5 5P J Downes 11 11 7 7 5 5P G Say 11 10 7 7 5 5N J Milne 11 11 7 7 5 5J T McNally 11 10 n/a n/a n/a n/aM P Triguboff 5 4 n/a n/a n/a n/aA F O Wilkinson 11 11 n/a n/a n/a n/a
Member of Audit, Compliance and Risk Management Committee D J Lawler n/a n/a 4 3 n/a n/a
1 “Held” reflects the number of meetings which the director or member was eligible to attend.
Name
Directors’ and key management personnel interests in stapled securities and ESSS rights The following directors, key management personnel and their associates held or currently hold the following stapled security interests in ALE:
Name
The following key management personnel currently hold rights over stapled securities in ALE:
4. PRINCIPAL ACTIVITIESDuring the year the principal activities of the Company consisted of property funds management and acting as responsible entity for the Australian Leisure and Entertainment Property Trust (the "Trust"). There has been no significant change in the nature of these activities during the year.
ESSS Rights
Meetings of directors The number of meetings of the Company’s Board of Directors held and of each Board committee during the year ended 30 June 2018 andthe number of meetings attended by each director at the time the director held office during the year were:
Board ACRMCNominations Committee and
Remuneration Committee
Page 5 Australian Leisure and Entertainment Property Management Limited
For
per
sona
l use
onl
y
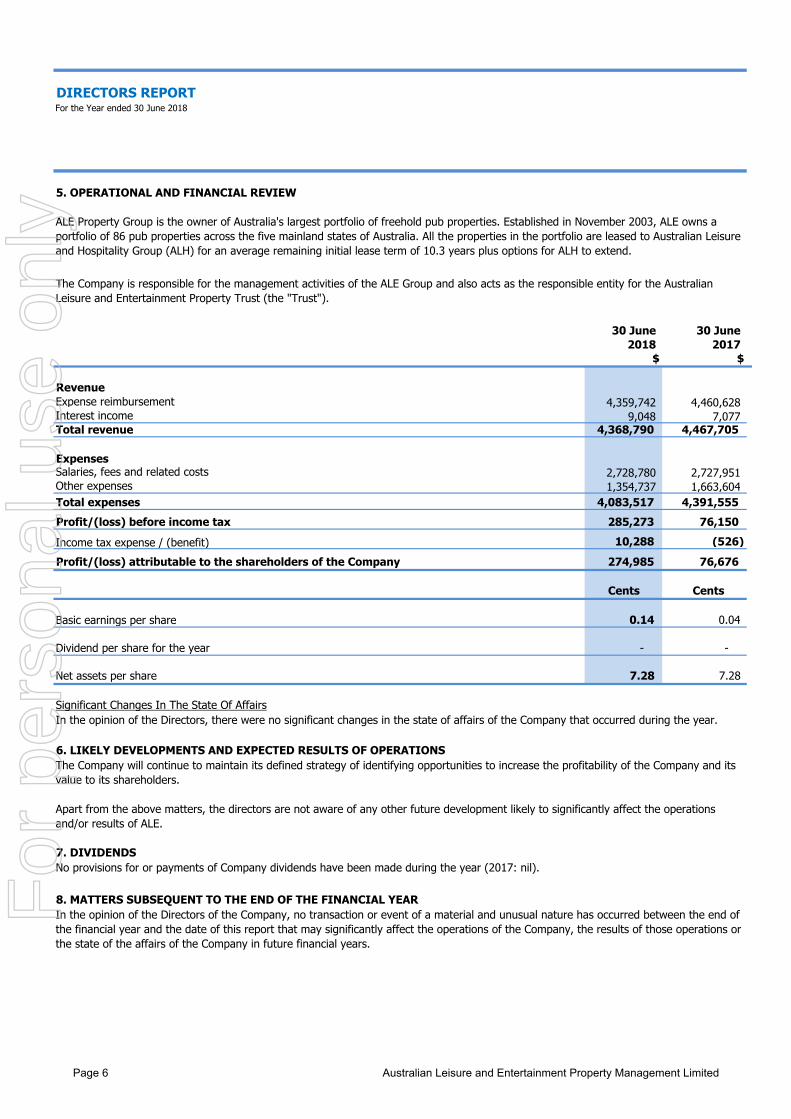
DIRECTORS REPORTFor the Year ended 30 June 2018
5. OPERATIONAL AND FINANCIAL REVIEW
30 June 30 June 2018 2017
$ $
Revenue Expense reimbursement 4,359,742 4,460,628 Interest income 9,048 7,077 Total revenue 4,368,790 4,467,705
Salaries, fees and related costs 2,728,780 2,727,951 Other expenses 1,354,737 1,663,604 Total expenses 4,083,517 4,391,555 Profit/(loss) before income tax 285,273 76,150
10,288 (526) Profit/(loss) attributable to the shareholders of the Company 274,985 76,676
Cents Cents
0.14 0.04
Dividend per share for the year - -
Net assets per share 7.28 7.28
Significant Changes In The State Of Affairs
6. LIKELY DEVELOPMENTS AND EXPECTED RESULTS OF OPERATIONS
7. DIVIDENDS
8. MATTERS SUBSEQUENT TO THE END OF THE FINANCIAL YEAR
In the opinion of the Directors, there were no significant changes in the state of affairs of the Company that occurred during the year.
No provisions for or payments of Company dividends have been made during the year (2017: nil).
In the opinion of the Directors of the Company, no transaction or event of a material and unusual nature has occurred between the end of the financial year and the date of this report that may significantly affect the operations of the Company, the results of those operations or the state of the affairs of the Company in future financial years.
Apart from the above matters, the directors are not aware of any other future development likely to significantly affect the operations and/or results of ALE.
The Company will continue to maintain its defined strategy of identifying opportunities to increase the profitability of the Company and its value to its shareholders.
Expenses
Income tax expense / (benefit)
Basic earnings per share
ALE Property Group is the owner of Australia's largest portfolio of freehold pub properties. Established in November 2003, ALE owns a portfolio of 86 pub properties across the five mainland states of Australia. All the properties in the portfolio are leased to Australian Leisure and Hospitality Group (ALH) for an average remaining initial lease term of 10.3 years plus options for ALH to extend.
The Company is responsible for the management activities of the ALE Group and also acts as the responsible entity for the Australian Leisure and Entertainment Property Trust (the "Trust").
Page 6 Australian Leisure and Entertainment Property Management Limited
For
per
sona
l use
onl
y
DIRECTORS' REPORTFor the Year ended 30 June 2018
9 REMUNERATION REPORT (Audited)
9.1 Remuneration Objectives and Approach
●●●
●
●●●●
●
9.2 Remuneration Committee
●●●
P G SayP J DownesN J MilneR W Mactier
Conari Partners was paid $16,000 for its services.
This report provides details on ALE's remuneration structure, decisions and outcomes for the year ended 30 June 2018 for employees of ALE including the directors, the Managing Director and key management personnel. This information has been audited as required by section 308(3C) of the Act.
In determining a remuneration framework, the Board aims to ensure the following:attract, reward and retain high calibre executives;motivate executives to achieve performance that creates value for stapled securityholders; and
The framework aligns executive reward with achievement of strategic objectives and creation of value for stapled securityholders. To do thisthe Board endeavours to ensure that executive reward satisfies the following objectives:
alignment with ALE's financial, operational, compliance and risk management objectives so as to achieve alignment with positiveoutcomes for stapled securityholders;alignment with ALE's overall performance;transparent, reasonable and acceptable to employees and securityholders;rewards the responsibility, capability, experience and contribution made by executives;
link remuneration to performance and outcomes achieved.
market competitive and complementary to the reward strategy of the organisation.
reward executive performance against agreed strategic objectives;
ensure there is an appropriate mix between fixed and "at risk" remuneration.encourage alignment of the interests of executives and stapled securityholders; and
The Committee's charter sets out its role and responsibilities. The charter is reviewed on an annual basis. In fulfilling its role the Committeeendeavours to ensure the remuneration framework established will:
Chairman of Remuneration Committee
recognises individual executive's contributions towards value accretive outcomes when measured against Key Performance Indicators (KPI's); and
Page 2 of this report provides information on the skills, experience and expertise of the Committee members.
The Committee operates independently of management in its recommendations to the Board and engages remuneration consultants independently of management. During the year ended 30 June 2018, the Committee consisted of the following:
Non-executive Director
Non-executive Director
The number of meetings held by the Committee and the members' attendance at them is set out on page 5.
The Committee considers advice from a wide range of external advisors in performing its role. During the current financial year the Committee engaged Conari Partners to review remuneration.
Non-executive DirectorNon-executive Director
The Remuneration Committee ("the Committee") is a committee comprising non-executive directors of the Company. The Committee strives to ensure that ALE's remuneration structure strikes an appropriate balance between the interests of ALE securityholders and rewarding, motivating and retaining employees.
The framework provides a mix of fixed and variable remuneration. Since the year ending 30 June 2012 the variable remuneration has been provided through the Executive Incentive Scheme (EIS). Any award under the EIS is paid 50% in cash following the year end and 50% in stapled securities with delivery deferred three years.
Page 7 Australian Leisure and Entertainment Property Management Limited
For
per
sona
l use
onl
y
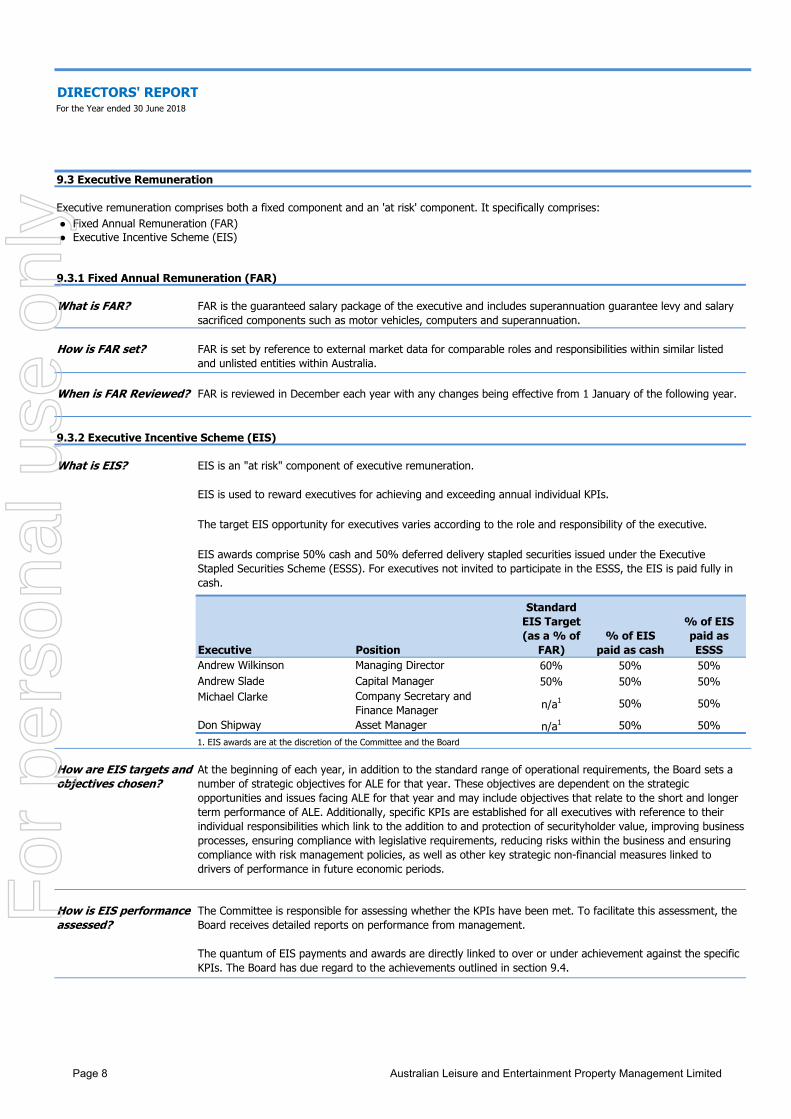
DIRECTORS' REPORTFor the Year ended 30 June 2018
9.3 Executive Remuneration
●●
9.3.1 Fixed Annual Remuneration (FAR)
What is FAR?
How is FAR set?
When is FAR Reviewed?
9.3.2 Executive Incentive Scheme (EIS)
What is EIS? EIS is an "at risk" component of executive remuneration.
Executive Position
Standard EIS Target (as a % of
FAR)% of EIS
paid as cash
% of EIS paid as ESSS
60% 50% 50%50% 50% 50%
n/a1 50% 50%
n/a1 50% 50%
Andrew Wilkinson
Executive remuneration comprises both a fixed component and an 'at risk' component. It specifically comprises:
Company Secretary and Finance ManagerAsset Manager
EIS is used to reward executives for achieving and exceeding annual individual KPIs.
How is EIS performance assessed?
The Committee is responsible for assessing whether the KPIs have been met. To facilitate this assessment, the Board receives detailed reports on performance from management.
The quantum of EIS payments and awards are directly linked to over or under achievement against the specific KPIs. The Board has due regard to the achievements outlined in section 9.4.
Andrew SladeMichael Clarke
Don Shipway1. EIS awards are at the discretion of the Committee and the Board
FAR is the guaranteed salary package of the executive and includes superannuation guarantee levy and salary sacrificed components such as motor vehicles, computers and superannuation.
FAR is set by reference to external market data for comparable roles and responsibilities within similar listed and unlisted entities within Australia.
FAR is reviewed in December each year with any changes being effective from 1 January of the following year.
The target EIS opportunity for executives varies according to the role and responsibility of the executive.
How are EIS targets and objectives chosen?
At the beginning of each year, in addition to the standard range of operational requirements, the Board sets a number of strategic objectives for ALE for that year. These objectives are dependent on the strategic opportunities and issues facing ALE for that year and may include objectives that relate to the short and longer term performance of ALE. Additionally, specific KPIs are established for all executives with reference to their individual responsibilities which link to the addition to and protection of securityholder value, improving business processes, ensuring compliance with legislative requirements, reducing risks within the business and ensuring compliance with risk management policies, as well as other key strategic non-financial measures linked to drivers of performance in future economic periods.
EIS awards comprise 50% cash and 50% deferred delivery stapled securities issued under the Executive Stapled Securities Scheme (ESSS). For executives not invited to participate in the ESSS, the EIS is paid fully in cash.
Fixed Annual Remuneration (FAR)Executive Incentive Scheme (EIS)
Managing DirectorCapital Manager
Page 8 Australian Leisure and Entertainment Property Management Limited
For
per
sona
l use
onl
y
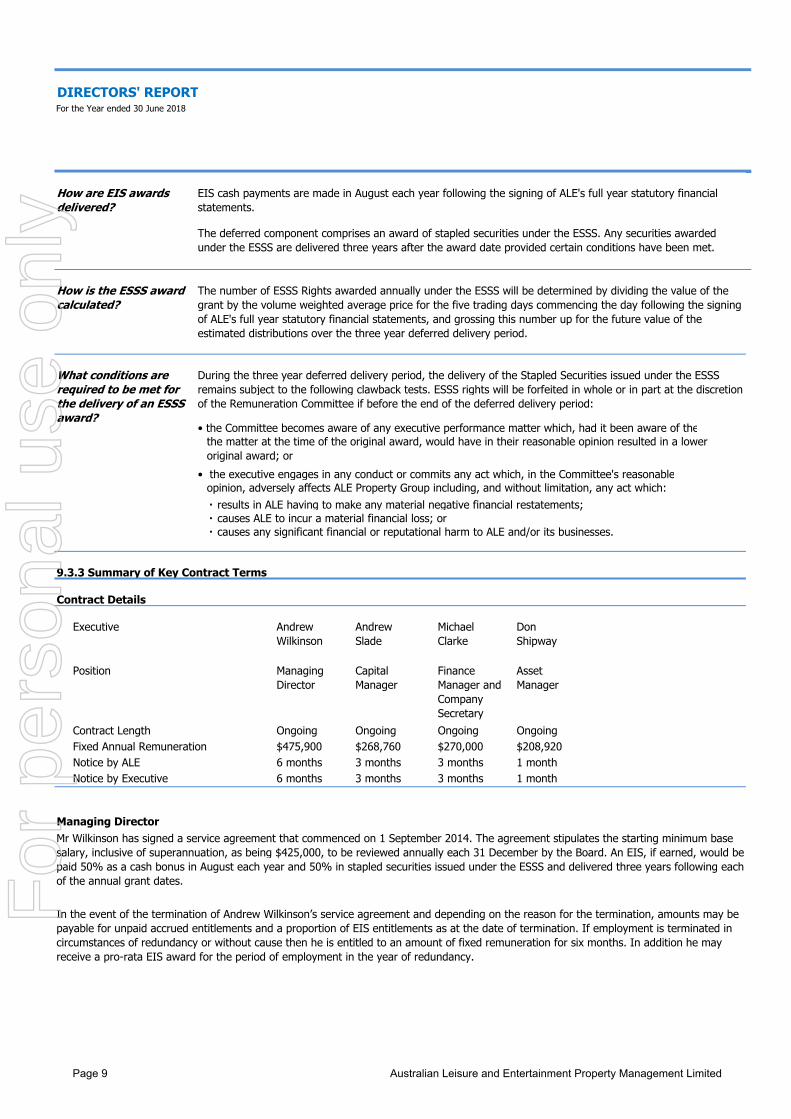
DIRECTORS' REPORTFor the Year ended 30 June 2018
Contract Details
Executive Andrew Wilkinson
Andrew Slade
Michael Clarke
Don Shipway
Position Managing Director
Capital Manager
Finance Manager and Company Secretary
Asset Manager
Contract Length Ongoing Ongoing Ongoing Ongoing$475,900 $268,760 $270,000 $208,920
Notice by ALE 6 months 3 months 3 months 1 monthNotice by Executive 6 months 3 months 3 months 1 month
Managing Director
causes any significant financial or reputational harm to ALE and/or its businesses.・
9.3.3 Summary of Key Contract Terms
Fixed Annual Remuneration
In the event of the termination of Andrew Wilkinson’s service agreement and depending on the reason for the termination, amounts may be payable for unpaid accrued entitlements and a proportion of EIS entitlements as at the date of termination. If employment is terminated in circumstances of redundancy or without cause then he is entitled to an amount of fixed remuneration for six months. In addition he may receive a pro-rata EIS award for the period of employment in the year of redundancy.
How are EIS awards delivered?
EIS cash payments are made in August each year following the signing of ALE's full year statutory financial statements.
The deferred component comprises an award of stapled securities under the ESSS. Any securities awarded under the ESSS are delivered three years after the award date provided certain conditions have been met.
How is the ESSS award calculated?
The number of ESSS Rights awarded annually under the ESSS will be determined by dividing the value of the grant by the volume weighted average price for the five trading days commencing the day following the signing of ALE's full year statutory financial statements, and grossing this number up for the future value of the estimated distributions over the three year deferred delivery period.
What conditions are required to be met for the delivery of an ESSS award?
causes ALE to incur a material financial loss; or・ results in ALE having to make any material negative financial restatements;・
Mr Wilkinson has signed a service agreement that commenced on 1 September 2014. The agreement stipulates the starting minimum base salary, inclusive of superannuation, as being $425,000, to be reviewed annually each 31 December by the Board. An EIS, if earned, would be paid 50% as a cash bonus in August each year and 50% in stapled securities issued under the ESSS and delivered three years following each of the annual grant dates.
• the Committee becomes aware of any executive performance matter which, had it been aware of the
• the executive engages in any conduct or commits any act which, in the Committee's reasonableopinion, adversely affects ALE Property Group including, and without limitation, any act which:
During the three year deferred delivery period, the delivery of the Stapled Securities issued under the ESSS remains subject to the following clawback tests. ESSS rights will be forfeited in whole or in part at the discretion of the Remuneration Committee if before the end of the deferred delivery period:
the matter at the time of the original award, would have in their reasonable opinion resulted in a lower original award; or
Page 9 Australian Leisure and Entertainment Property Management Limited
For
per
sona
l use
onl
y
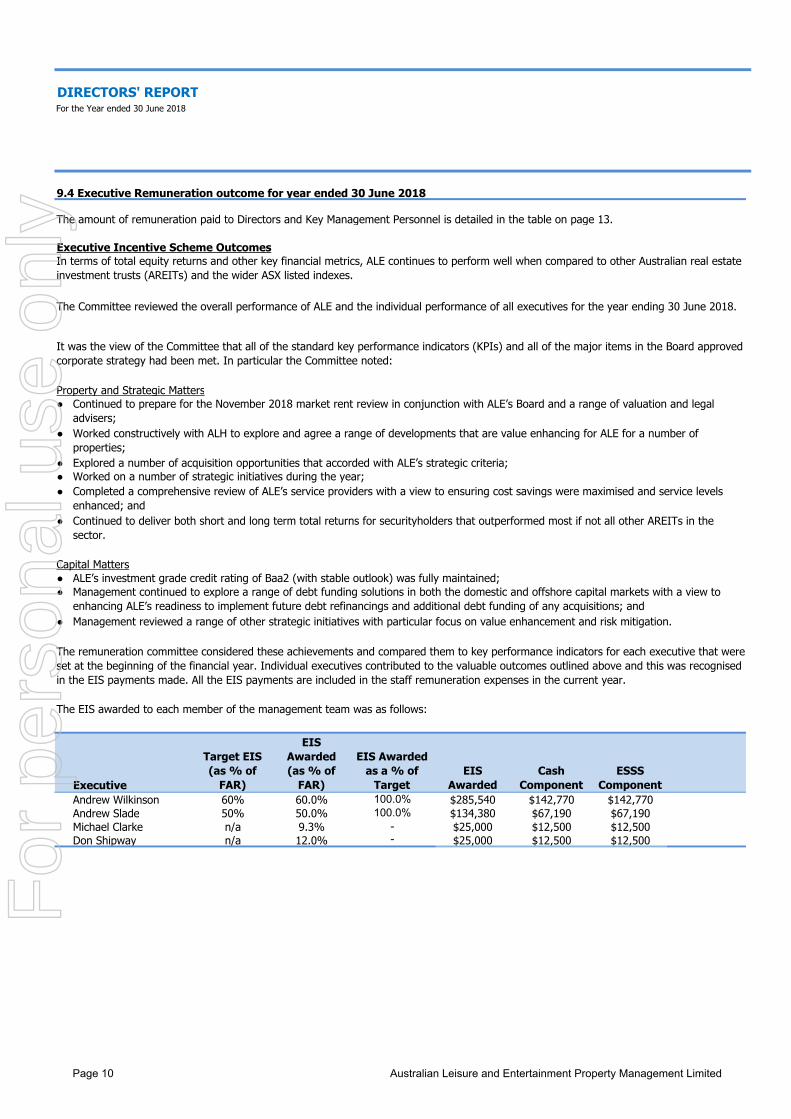
DIRECTORS' REPORTFor the Year ended 30 June 2018
9.4 Executive Remuneration outcome for year ended 30 June 2018
The amount of remuneration paid to Directors and Key Management Personnel is detailed in the table on page 13.
Executive Incentive Scheme Outcomes
●
●
●●●
●
●●
●
The EIS awarded to each member of the management team was as follows:
Executive
Target EIS (as % of
FAR)
EIS Awarded (as % of
FAR)
EIS Awarded as a % of
TargetEIS
Awarded Cash
ComponentESSS
ComponentAndrew Wilkinson 60% 60.0% 100.0% $285,540 $142,770 $142,770Andrew Slade 50% 50.0% 100.0% $134,380 $67,190 $67,190Michael Clarke n/a 9.3% - $25,000 $12,500 $12,500Don Shipway n/a 12.0% - $25,000 $12,500 $12,500
The Committee reviewed the overall performance of ALE and the individual performance of all executives for the year ending 30 June 2018.
Management reviewed a range of other strategic initiatives with particular focus on value enhancement and risk mitigation.
Worked constructively with ALH to explore and agree a range of developments that are value enhancing for ALE for a number of properties;
Continued to prepare for the November 2018 market rent review in conjunction with ALE’s Board and a range of valuation and legal advisers;
Management continued to explore a range of debt funding solutions in both the domestic and offshore capital markets with a view to enhancing ALE’s readiness to implement future debt refinancings and additional debt funding of any acquisitions; and
Explored a number of acquisition opportunities that accorded with ALE’s strategic criteria;
It was the view of the Committee that all of the standard key performance indicators (KPIs) and all of the major items in the Board approved corporate strategy had been met. In particular the Committee noted:
Completed a comprehensive review of ALE’s service providers with a view to ensuring cost savings were maximised and service levels enhanced; andContinued to deliver both short and long term total returns for securityholders that outperformed most if not all other AREITs in the sector.
Capital Matters
Property and Strategic Matters
Worked on a number of strategic initiatives during the year;
In terms of total equity returns and other key financial metrics, ALE continues to perform well when compared to other Australian real estate investment trusts (AREITs) and the wider ASX listed indexes.
ALE’s investment grade credit rating of Baa2 (with stable outlook) was fully maintained;
The remuneration committee considered these achievements and compared them to key performance indicators for each executive that were set at the beginning of the financial year. Individual executives contributed to the valuable outcomes outlined above and this was recognised in the EIS payments made. All the EIS payments are included in the staff remuneration expenses in the current year.
Page 10 Australian Leisure and Entertainment Property Management Limited
For
per
sona
l use
onl
y
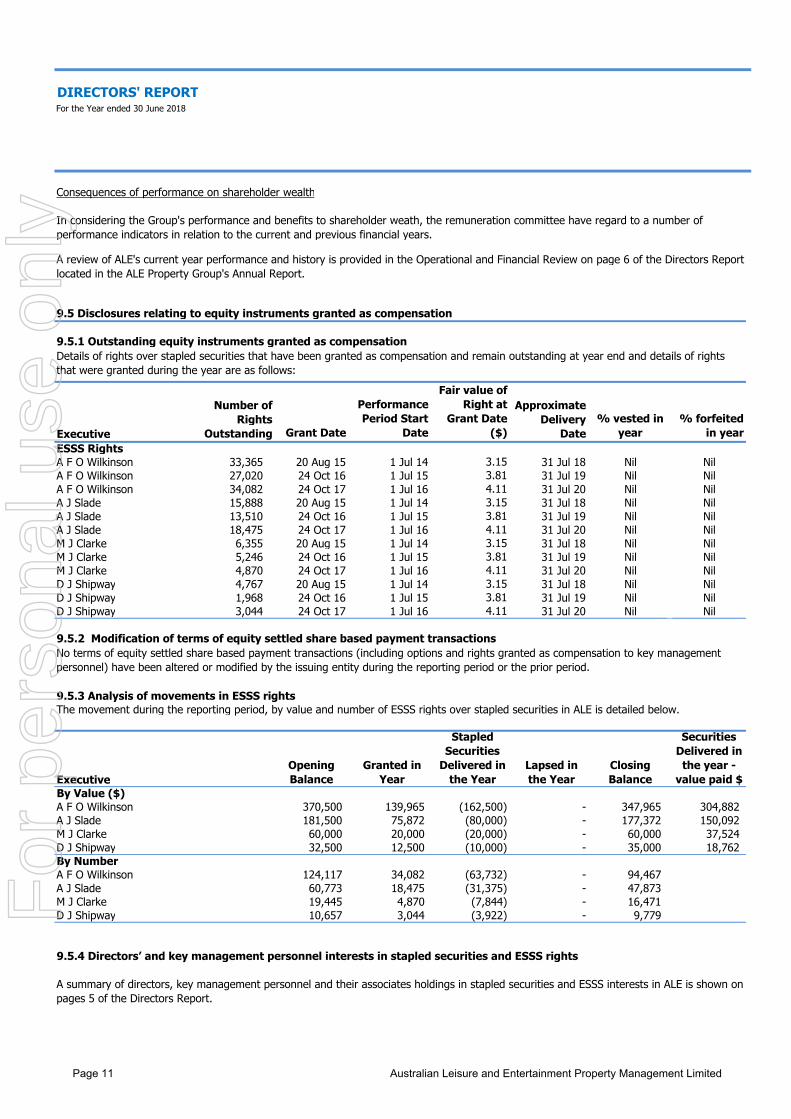
DIRECTORS' REPORTFor the Year ended 30 June 2018
Consequences of performance on shareholder wealth
9.5 Disclosures relating to equity instruments granted as compensation
9.5.1 Outstanding equity instruments granted as compensation
Executive Grant Date
Performance Period Start
Date
Fair value of Right at
Grant Date ($)
% vested in year
% forfeited in year
ESSS RightsA F O Wilkinson 33,365 20 Aug 15 1 Jul 14 3.15 31 Jul 18 Nil NilA F O Wilkinson 27,020 24 Oct 16 1 Jul 15 3.81 31 Jul 19 Nil NilA F O Wilkinson 34,082 24 Oct 17 1 Jul 16 4.11 31 Jul 20 Nil NilA J Slade 15,888 20 Aug 15 1 Jul 14 3.15 31 Jul 18 Nil NilA J Slade 13,510 24 Oct 16 1 Jul 15 3.81 31 Jul 19 Nil NilA J Slade 18,475 24 Oct 17 1 Jul 16 4.11 31 Jul 20 Nil NilM J Clarke 6,355 20 Aug 15 1 Jul 14 3.15 31 Jul 18 Nil NilM J Clarke 5,246 24 Oct 16 1 Jul 15 3.81 31 Jul 19 Nil NilM J Clarke 4,870 24 Oct 17 1 Jul 16 4.11 31 Jul 20 Nil NilD J Shipway 4,767 20 Aug 15 1 Jul 14 3.15 31 Jul 18 Nil NilD J Shipway 1,968 24 Oct 16 1 Jul 15 3.81 31 Jul 19 Nil NilD J Shipway 3,044 24 Oct 17 1 Jul 16 4.11 31 Jul 20 Nil Nil
9.5.2 Modification of terms of equity settled share based payment transactions
9.5.3 Analysis of movements in ESSS rightsThe movement during the reporting period, by value and number of ESSS rights over stapled securities in ALE is detailed below.
ExecutiveOpening Balance
Granted in Year
Stapled Securities
Delivered in the Year
Lapsed in the Year
Closing Balance
Securities Delivered in the year -
value paid $By Value ($)A F O Wilkinson 370,500 139,965 (162,500) - 347,965 304,882 A J Slade 181,500 75,872 (80,000) - 177,372 150,092 M J Clarke 60,000 20,000 (20,000) - 60,000 37,524 D J Shipway 32,500 12,500 (10,000) - 35,000 18,762 By NumberA F O Wilkinson 124,117 34,082 (63,732) - 94,467 A J Slade 60,773 18,475 (31,375) - 47,873 M J Clarke 19,445 4,870 (7,844) - 16,471 D J Shipway 10,657 3,044 (3,922) - 9,779
A summary of directors, key management personnel and their associates holdings in stapled securities and ESSS interests in ALE is shown on pages 5 of the Directors Report.
Details of rights over stapled securities that have been granted as compensation and remain outstanding at year end and details of rights that were granted during the year are as follows:
Number of Rights
Outstanding
Approximate Delivery
Date
No terms of equity settled share based payment transactions (including options and rights granted as compensation to key management personnel) have been altered or modified by the issuing entity during the reporting period or the prior period.
In considering the Group's performance and benefits to shareholder weath, the remuneration committee have regard to a number of performance indicators in relation to the current and previous financial years.
A review of ALE's current year performance and history is provided in the Operational and Financial Review on page 6 of the Directors Report located in the ALE Property Group's Annual Report.
9.5.4 Directors’ and key management personnel interests in stapled securities and ESSS rights
Page 11 Australian Leisure and Entertainment Property Management Limited
For
per
sona
l use
onl
y
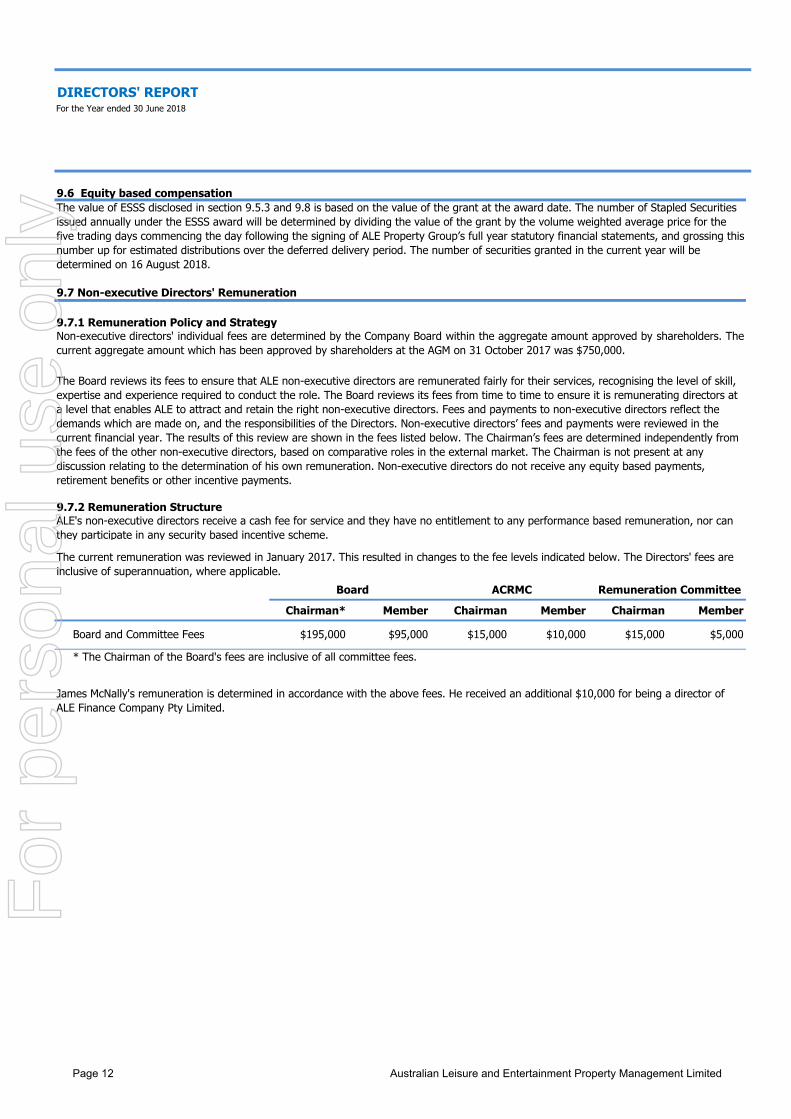
DIRECTORS' REPORTFor the Year ended 30 June 2018
9.7 Non-executive Directors' Remuneration
Chairman* Member Chairman Member Chairman Member
Board and Committee Fees $195,000 $95,000 $15,000 $10,000 $15,000 $5,000
* The Chairman of the Board's fees are inclusive of all committee fees.
James McNally's remuneration is determined in accordance with the above fees. He received an additional $10,000 for being a director of ALE Finance Company Pty Limited.
The Board reviews its fees to ensure that ALE non-executive directors are remunerated fairly for their services, recognising the level of skill, expertise and experience required to conduct the role. The Board reviews its fees from time to time to ensure it is remunerating directors at a level that enables ALE to attract and retain the right non-executive directors. Fees and payments to non-executive directors reflect the demands which are made on, and the responsibilities of the Directors. Non-executive directors’ fees and payments were reviewed in the current financial year. The results of this review are shown in the fees listed below. The Chairman’s fees are determined independently from the fees of the other non-executive directors, based on comparative roles in the external market. The Chairman is not present at any discussion relating to the determination of his own remuneration. Non-executive directors do not receive any equity based payments, retirement benefits or other incentive payments.
9.6 Equity based compensation
9.7.2 Remuneration StructureALE's non-executive directors receive a cash fee for service and they have no entitlement to any performance based remuneration, nor can they participate in any security based incentive scheme.
The current remuneration was reviewed in January 2017. This resulted in changes to the fee levels indicated below. The Directors' fees are inclusive of superannuation, where applicable.
Board ACRMC Remuneration Committee
The value of ESSS disclosed in section 9.5.3 and 9.8 is based on the value of the grant at the award date. The number of Stapled Securities issued annually under the ESSS award will be determined by dividing the value of the grant by the volume weighted average price for the five trading days commencing the day following the signing of ALE Property Group’s full year statutory financial statements, and grossing this number up for estimated distributions over the deferred delivery period. The number of securities granted in the current year will be determined on 16 August 2018.
9.7.1 Remuneration Policy and StrategyNon-executive directors' individual fees are determined by the Company Board within the aggregate amount approved by shareholders. Thecurrent aggregate amount which has been approved by shareholders at the AGM on 31 October 2017 was $750,000.
Page 12 Australian Leisure and Entertainment Property Management Limited
For
per
sona
l use
onl
y
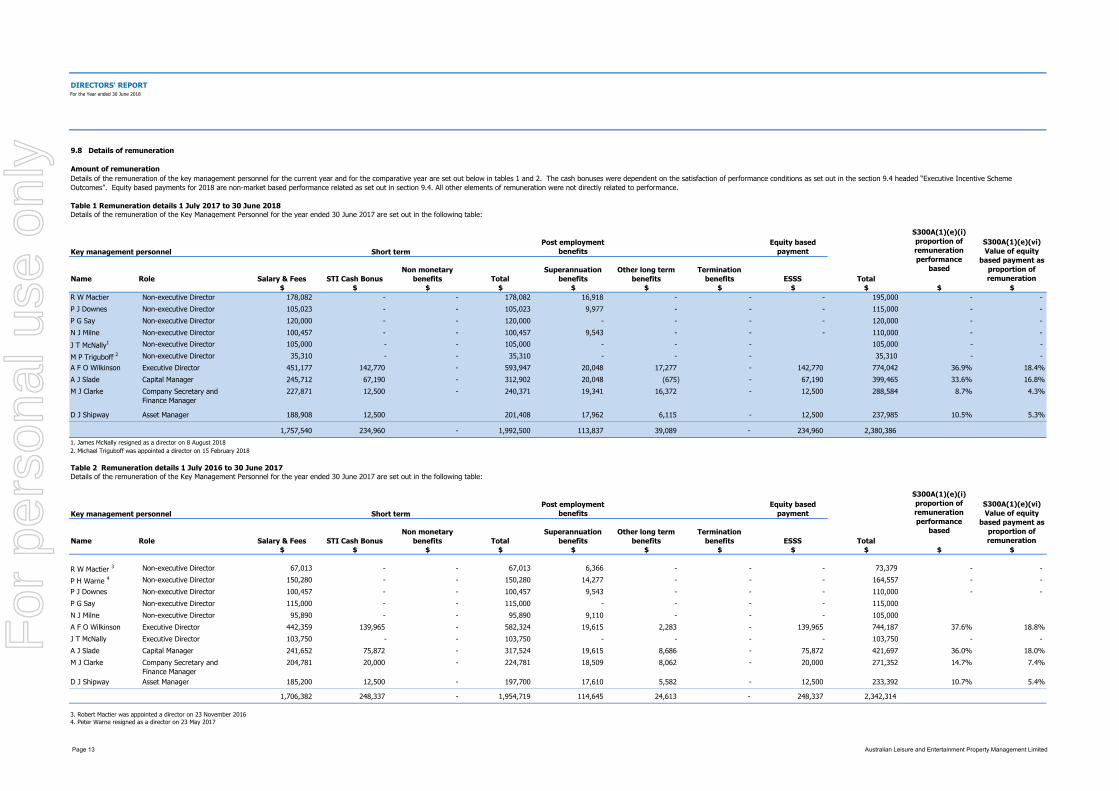
DIRECTORS' REPORTFor the Year ended 30 June 2018
Post employment benefits
Equity based payment
Name Role Salary & Fees STI Cash BonusNon monetary
benefits TotalSuperannuation
benefitsOther long term
benefitsTermination
benefits ESSS Total$ $ $ $ $ $ $ $ $ $ $
Non-executive Director 178,082 - - 178,082 16,918 - - - 195,000 - - 105,023 - - 105,023 9,977 - - - 115,000 - - 120,000 - - 120,000 - - - - 120,000 - - 100,457 - - 100,457 9,543 - - - 110,000 - - 105,000 - - 105,000 - - - 105,000 - - 35,310 - - 35,310 - - - 35,310 - -
Executive Director 451,177 142,770 - 593,947 20,048 17,277 - 142,770 774,042 36.9% 18.4%Capital Manager 245,712 67,190 - 312,902 20,048 (675) - 67,190 399,465 33.6% 16.8%Company Secretary and Finance Manager
227,871 12,500 - 240,371 19,341 16,372 - 12,500 288,584 8.7% 4.3%
Asset Manager 188,908 12,500 201,408 17,962 6,115 - 12,500 237,985 10.5% 5.3%
1,757,540 234,960 - 1,992,500 113,837 39,089 - 234,960 2,380,386 1. James McNally resigned as a director on 8 August 20182. Michael Triguboff was appointed a director on 15 February 2018
Post employment benefits
Equity based payment
Name Role Salary & Fees STI Cash BonusNon monetary
benefits TotalSuperannuation
benefitsOther long term
benefitsTermination
benefits ESSS Total$ $ $ $ $ $ $ $ $ $ $
Non-executive Director 67,013 - - 67,013 6,366 - - - 73,379 - - 150,280 - - 150,280 14,277 - - - 164,557 - - 100,457 - - 100,457 9,543 - - - 110,000 - - 115,000 - - 115,000 - - - - 115,000 95,890 - - 95,890 9,110 - - - 105,000
Executive Director 442,359 139,965 - 582,324 19,615 2,283 - 139,965 744,187 37.6% 18.8%Executive Director 103,750 - - 103,750 - - - - 103,750 - - Capital Manager 241,652 75,872 - 317,524 19,615 8,686 - 75,872 421,697 36.0% 18.0%Company Secretary and Finance Manager
204,781 20,000 - 224,781 18,509 8,062 - 20,000 271,352 14.7% 7.4%
Asset Manager 185,200 12,500 - 197,700 17,610 5,582 - 12,500 233,392 10.7% 5.4%
1,706,382 248,337 - 1,954,719 114,645 24,613 - 248,337 2,342,314
3. Robert Mactier was appointed a director on 23 November 20164. Peter Warne resigned as a director on 23 May 2017
Non-executive DirectorNon-executive DirectorNon-executive Director
A J Slade M J Clarke
N J Milne
P H Warne 4
A F O Wilkinson
P G SayP J Downes
J T McNally
Non-executive Director
D J Shipway
R W Mactier 3
A F O Wilkinson A J Slade M J Clarke
D J Shipway
Table 2 Remuneration details 1 July 2016 to 30 June 2017Details of the remuneration of the Key Management Personnel for the year ended 30 June 2017 are set out in the following table:
Key management personnel Short term
S300A(1)(e)(i) proportion of remuneration performance
based
S300A(1)(e)(vi) Value of equity
based payment as proportion of remuneration
9.8 Details of remuneration
Amount of remuneration Details of the remuneration of the key management personnel for the current year and for the comparative year are set out below in tables 1 and 2. The cash bonuses were dependent on the satisfaction of performance conditions as set out in the section 9.4 headed “Executive Incentive Scheme Outcomes”. Equity based payments for 2018 are non-market based performance related as set out in section 9.4. All other elements of remuneration were not directly related to performance.
Table 1 Remuneration details 1 July 2017 to 30 June 2018Details of the remuneration of the Key Management Personnel for the year ended 30 June 2017 are set out in the following table:
Non-executive DirectorM P Triguboff 2 Non-executive Director
Key management personnel Short term
J T McNally1
S300A(1)(e)(i) proportion of remuneration performance
based
S300A(1)(e)(vi) Value of equity
based payment as proportion of remuneration
Non-executive Director
P J Downes Non-executive DirectorNon-executive Director
R W Mactier
P G SayN J Milne
Page 13 Australian Leisure and Entertainment Property Management Limited
For
per
sona
l use
onl
y
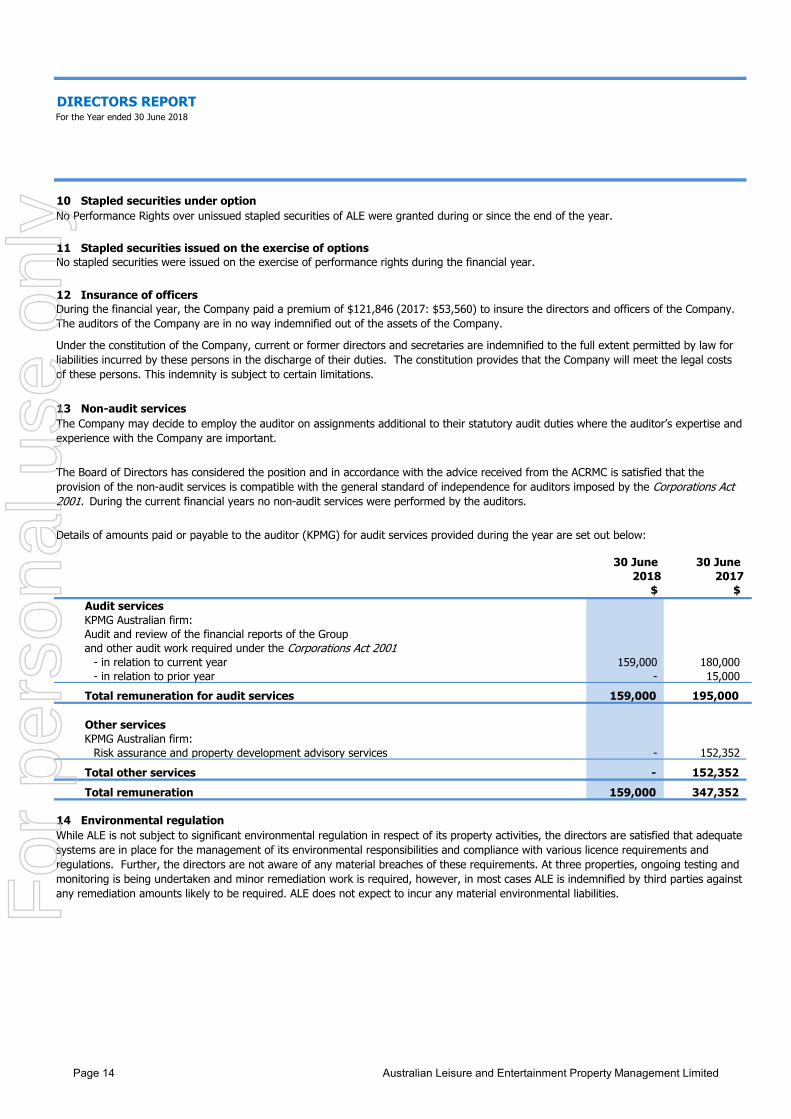
DIRECTORS REPORTFor the Year ended 30 June 2018
30 June 30 June 2018 2017
$ $ Audit services KPMG Australian firm:Audit and review of the financial reports of the Group and other audit work required under the Corporations Act 2001
- in relation to current year 159,000 180,000 - in relation to prior year - 15,000
Total remuneration for audit services 159,000 195,000
Other servicesKPMG Australian firm:
Risk assurance and property development advisory services - 152,352 Total other services - 152,352 Total remuneration 159,000 347,352
14 Environmental regulation
Details of amounts paid or payable to the auditor (KPMG) for audit services provided during the year are set out below:
While ALE is not subject to significant environmental regulation in respect of its property activities, the directors are satisfied that adequate systems are in place for the management of its environmental responsibilities and compliance with various licence requirements and regulations. Further, the directors are not aware of any material breaches of these requirements. At three properties, ongoing testing and monitoring is being undertaken and minor remediation work is required, however, in most cases ALE is indemnified by third parties against any remediation amounts likely to be required. ALE does not expect to incur any material environmental liabilities.
13 Non-audit services The Company may decide to employ the auditor on assignments additional to their statutory audit duties where the auditor’s expertise and experience with the Company are important.
The Board of Directors has considered the position and in accordance with the advice received from the ACRMC is satisfied that the provision of the non-audit services is compatible with the general standard of independence for auditors imposed by the Corporations Act 2001. During the current financial years no non-audit services were performed by the auditors.
10 Stapled securities under option
Under the constitution of the Company, current or former directors and secretaries are indemnified to the full extent permitted by law for liabilities incurred by these persons in the discharge of their duties. The constitution provides that the Company will meet the legal costs of these persons. This indemnity is subject to certain limitations.
No Performance Rights over unissued stapled securities of ALE were granted during or since the end of the year.
During the financial year, the Company paid a premium of $121,846 (2017: $53,560) to insure the directors and officers of the Company. The auditors of the Company are in no way indemnified out of the assets of the Company.
11 Stapled securities issued on the exercise of options
12 Insurance of officers
No stapled securities were issued on the exercise of performance rights during the financial year.
Page 14 Australian Leisure and Entertainment Property Management Limited
For
per
sona
l use
onl
y
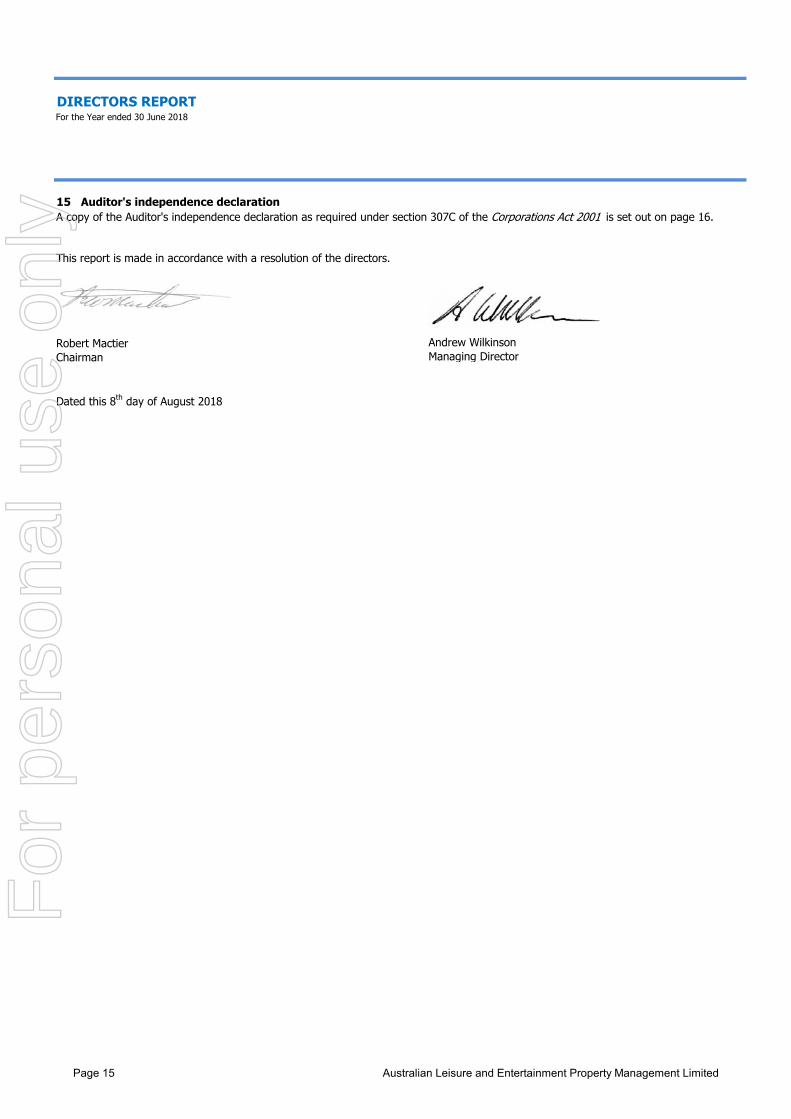
DIRECTORS REPORTFor the Year ended 30 June 2018
15 Auditor's independence declaration
This report is made in accordance with a resolution of the directors.
Andrew WilkinsonManaging Director
A copy of the Auditor's independence declaration as required under section 307C of the Corporations Act 2001 is set out on page 16.
Dated this 8th day of August 2018
Robert MactierChairman
Page 15 Australian Leisure and Entertainment Property Management Limited
For
per
sona
l use
onl
y
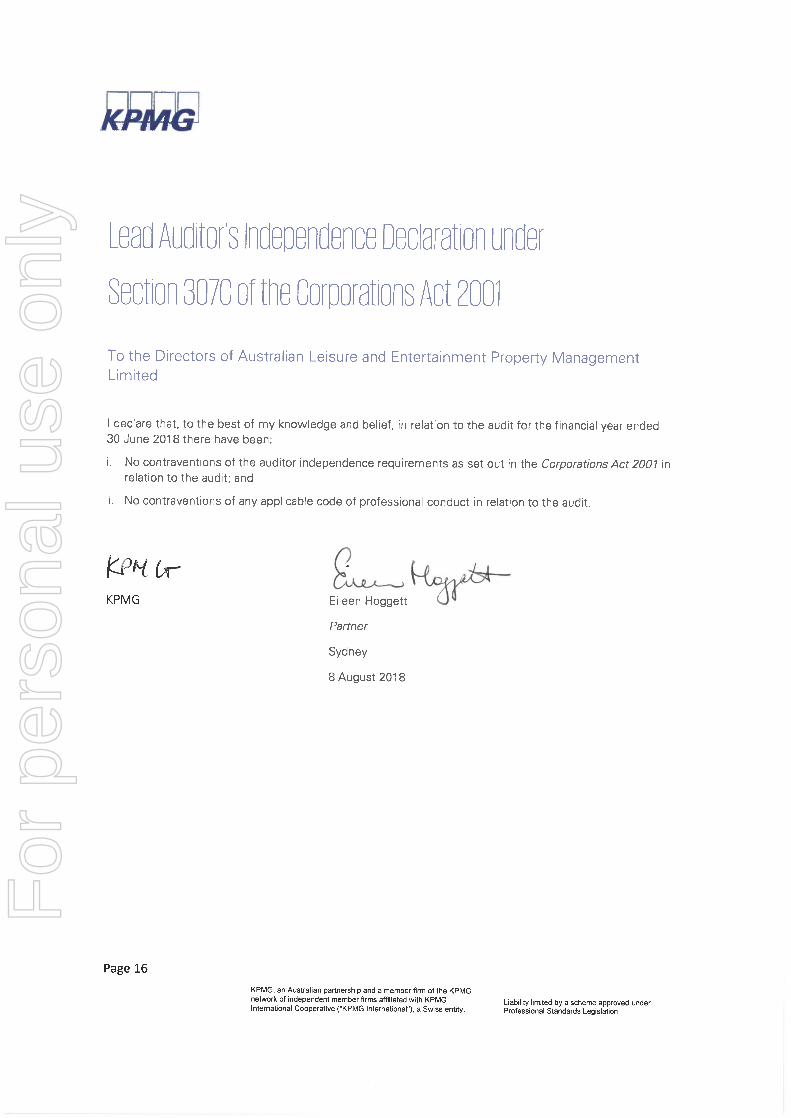
For
per
sona
l use
onl
y
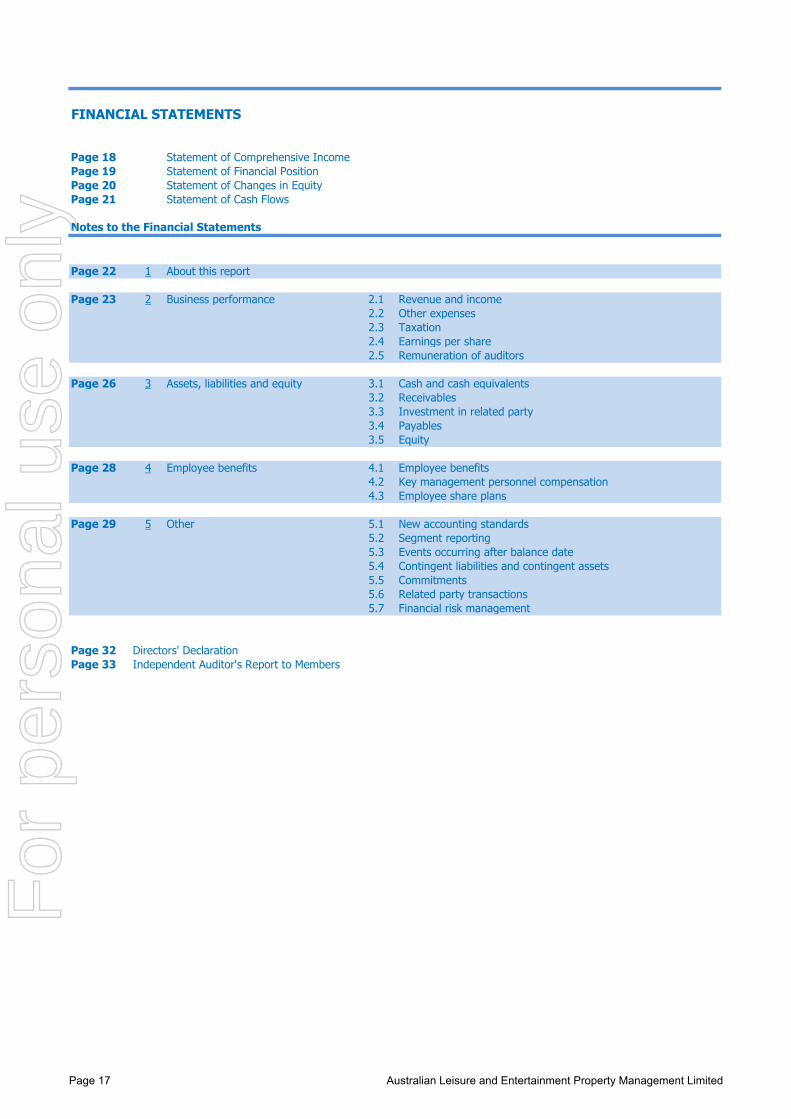
FINANCIAL STATEMENTS
Page 18 Statement of Comprehensive IncomePage 19 Statement of Financial PositionPage 20 Statement of Changes in EquityPage 21 Statement of Cash Flows
Notes to the Financial Statements
Page 22 1 About this report
Page 23 2 Business performance 2.1 Revenue and income2.2 Other expenses2.3 Taxation2.4 Earnings per share2.5 Remuneration of auditors
Page 26 3 Assets, liabilities and equity 3.1 Cash and cash equivalents3.2 Receivables3.3 Investment in related party3.4 Payables3.5 Equity
Page 28 4 Employee benefits 4.1 Employee benefits4.2 Key management personnel compensation4.3 Employee share plans
Page 29 5 Other 5.1 New accounting standards5.2 Segment reporting5.3 Events occurring after balance date5.4 Contingent liabilities and contingent assets5.5 Commitments5.6 Related party transactions5.7 Financial risk management
Page 32 Directors' DeclarationPage 33 Independent Auditor's Report to Members
Page 17 Australian Leisure and Entertainment Property Management Limited
For
per
sona
l use
onl
y
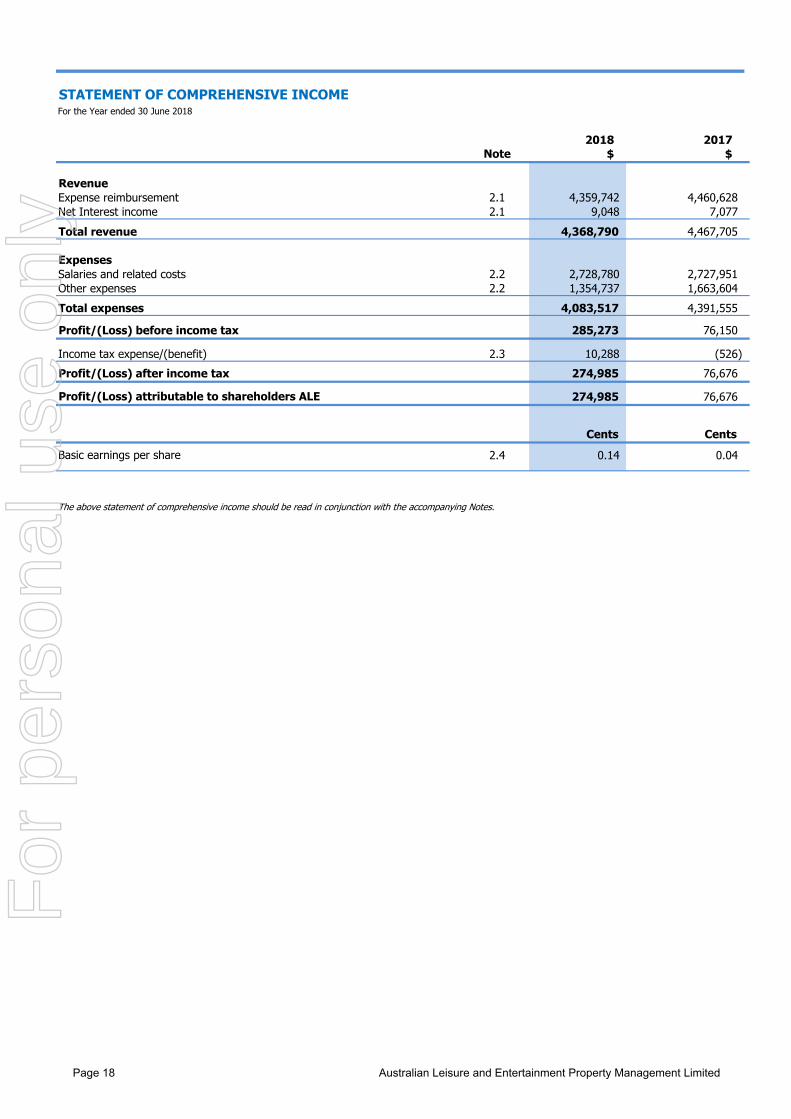
STATEMENT OF COMPREHENSIVE INCOMEFor the Year ended 30 June 2018
2018 2017Note $ $
RevenueExpense reimbursement 2.1 4,359,742 4,460,628 Net Interest income 2.1 9,048 7,077 Total revenue 4,368,790 4,467,705
ExpensesSalaries and related costs 2.2 2,728,780 2,727,951 Other expenses 2.2 1,354,737 1,663,604 Total expenses 4,083,517 4,391,555
Profit/(Loss) before income tax 285,273 76,150
Income tax expense/(benefit) 2.3 10,288 (526) Profit/(Loss) after income tax 274,985 76,676
274,985 76,676
Cents CentsBasic earnings per share 2.4 0.14 0.04
The above statement of comprehensive income should be read in conjunction with the accompanying Notes.
Profit/(Loss) attributable to shareholders ALE
Page 18 Australian Leisure and Entertainment Property Management Limited
For
per
sona
l use
onl
y
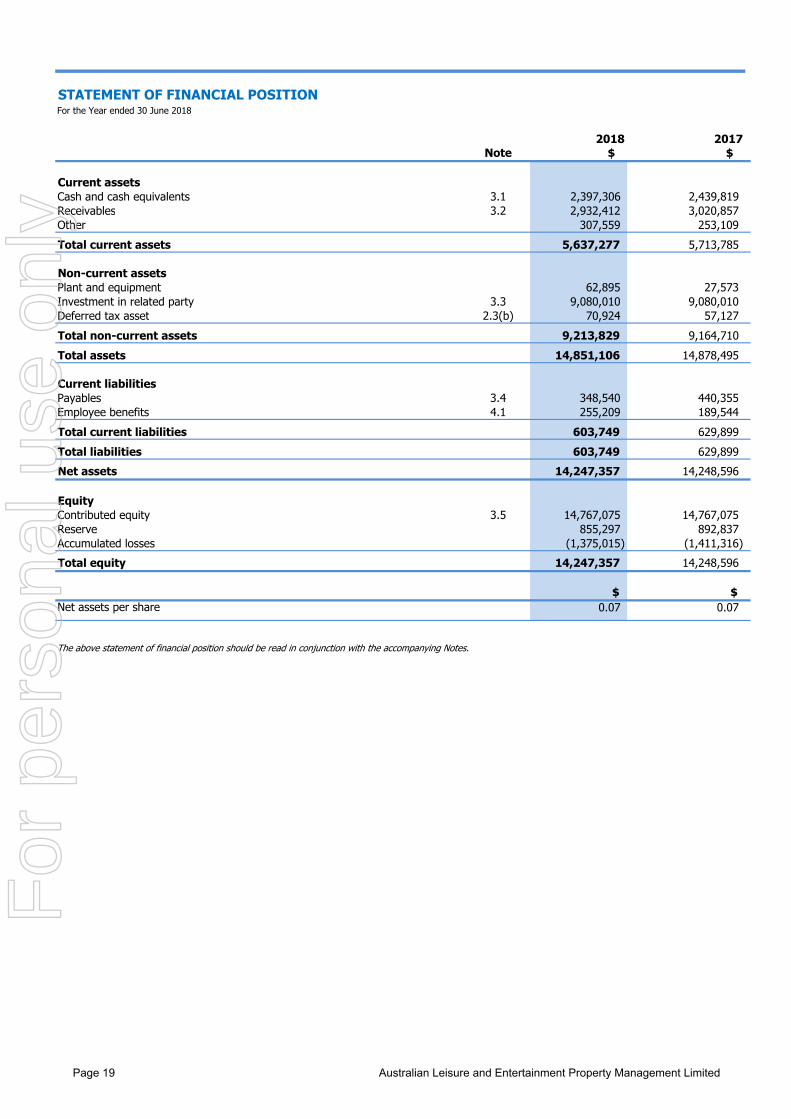
STATEMENT OF FINANCIAL POSITIONFor the Year ended 30 June 2018
2018 2017Note $ $
Current assetsCash and cash equivalents 3.1 2,397,306 2,439,819 Receivables 3.2 2,932,412 3,020,857 Other 307,559 253,109 Total current assets 5,637,277 5,713,785
Non-current assetsPlant and equipment 62,895 27,573 Investment in related party 3.3 9,080,010 9,080,010 Deferred tax asset 2.3(b) 70,924 57,127 Total non-current assets 9,213,829 9,164,710 Total assets 14,851,106 14,878,495
Current liabilitiesPayables 3.4 348,540 440,355 Employee benefits 4.1 255,209 189,544 Total current liabilities 603,749 629,899 Total liabilities 603,749 629,899 Net assets 14,247,357 14,248,596
EquityContributed equity 3.5 14,767,075 14,767,075 Reserve 855,297 892,837 Accumulated losses (1,375,015) (1,411,316) Total equity 14,247,357 14,248,596
$ $Net assets per share 0.07 0.07
The above statement of financial position should be read in conjunction with the accompanying Notes.
Page 19 Australian Leisure and Entertainment Property Management Limited
For
per
sona
l use
onl
y
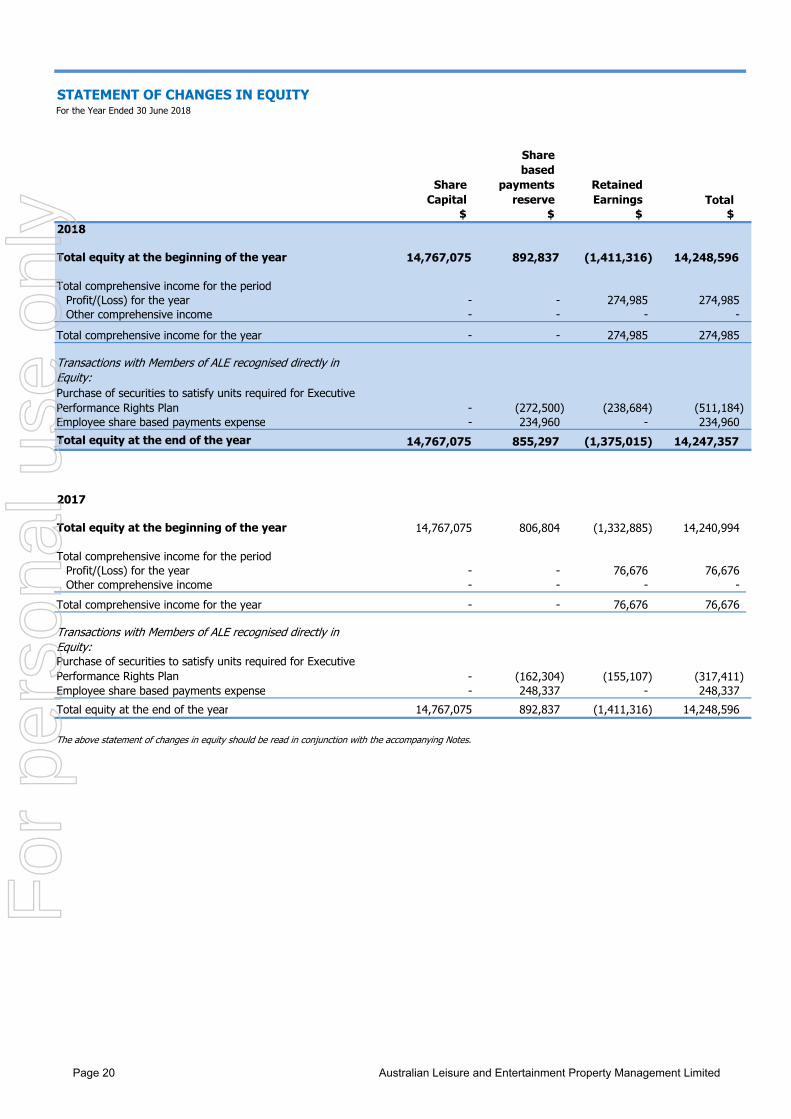
STATEMENT OF CHANGES IN EQUITYFor the Year Ended 30 June 2018
Share Capital
Share based
payments reserve
Retained Earnings Total
$ $ $ $2018
Total equity at the beginning of the year 14,767,075 892,837 (1,411,316) 14,248,596
Total comprehensive income for the periodProfit/(Loss) for the year - - 274,985 274,985 Other comprehensive income - - - -
Total comprehensive income for the year - - 274,985 274,985
Transactions with Members of ALE recognised directly in Equity:Purchase of securities to satisfy units required for Executive Performance Rights Plan - (272,500) (238,684) (511,184) Employee share based payments expense - 234,960 - 234,960 Total equity at the end of the year 14,767,075 855,297 (1,375,015) 14,247,357
2017
Total equity at the beginning of the year 14,767,075 806,804 (1,332,885) 14,240,994
Total comprehensive income for the periodProfit/(Loss) for the year - - 76,676 76,676 Other comprehensive income - - - -
Total comprehensive income for the year - - 76,676 76,676
Transactions with Members of ALE recognised directly in Equity:Purchase of securities to satisfy units required for Executive Performance Rights Plan - (162,304) (155,107) (317,411) Employee share based payments expense - 248,337 - 248,337 Total equity at the end of the year 14,767,075 892,837 (1,411,316) 14,248,596
The above statement of changes in equity should be read in conjunction with the accompanying Notes.
Page 20 Australian Leisure and Entertainment Property Management Limited
For
per
sona
l use
onl
y
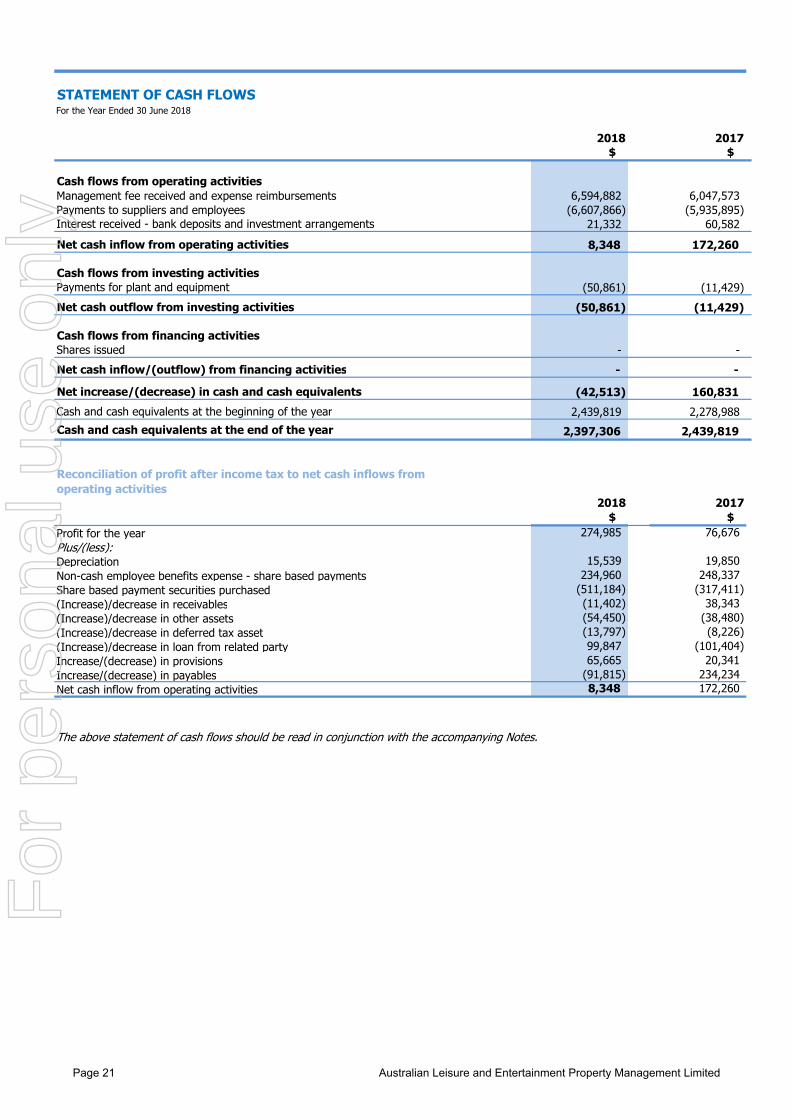
STATEMENT OF CASH FLOWS
2018 2017$ $
Cash flows from operating activitiesManagement fee received and expense reimbursements 6,594,882 6,047,573 Payments to suppliers and employees (6,607,866) (5,935,895) Interest received - bank deposits and investment arrangements 21,332 60,582 Net cash inflow from operating activities 8,348 172,260
Cash flows from investing activitiesPayments for plant and equipment (50,861) (11,429) Net cash outflow from investing activities (50,861) (11,429)
Cash flows from financing activitiesShares issued - - Net cash inflow/(outflow) from financing activities - -
Net increase/(decrease) in cash and cash equivalents (42,513) 160,831 Cash and cash equivalents at the beginning of the year 2,439,819 2,278,988 Cash and cash equivalents at the end of the year 2,397,306 2,439,819
2018 2017$ $
Profit for the year 274,985 76,676 Plus/(less):Depreciation 15,539 19,850 Non-cash employee benefits expense - share based payments 234,960 248,337 Share based payment securities purchased (511,184) (317,411) (Increase)/decrease in receivables (11,402) 38,343 (Increase)/decrease in other assets (54,450) (38,480) (Increase)/decrease in deferred tax asset (13,797) (8,226) (Increase)/decrease in loan from related party 99,847 (101,404) Increase/(decrease) in provisions 65,665 20,341 Increase/(decrease) in payables (91,815) 234,234 Net cash inflow from operating activities 8,348 172,260
The above statement of cash flows should be read in conjunction with the accompanying Notes.
For the Year Ended 30 June 2018
Reconciliation of profit after income tax to net cash inflows from operating activities
Page 21 Australian Leisure and Entertainment Property Management Limited
For
per
sona
l use
onl
y
NOTES TO THE FINANCIAL STATEMENTSFor the Year ended 30 June 2018
1.About this report
Reporting Entity Accounting estimates and judgements
Accounting estimates and judgements NoteIncome taxes 2.3
The Company is the Responsible Entity of the Trust. Employee benefits 4
Statement of complianceSignificant accounting policies
Basis of preparationThe Financial Report has been prepared on a historical costs basis, except for the revaluation of investment properties and certain financial instruments. Cost is based on the fair values of the consideration given in exchange for assets. All amounts are represented in Australian dollars, unless otherwise noted.
Accounting policies are selected and applied in a manner that ensures that the resulting financial information satisfies the concepts of relevance and reliability, thereby ensuring that the substance of the under lying transactions or other events is reported. Other significant accounting policies are contained in the notes to the financial statements to which they relate to.
The preparation of financial statements requires management to make judgements, estimates and assumptions that affect the application of accounting policies and the reported amounts of assets, liabilities, income and expenses. Actual results may differ from these estimates. Estimates and underlying assumptions are reviewed on an ongoing basis. Revisions to accounting estimates are recognised in the period in which the estimate is revised and in any future periods affected.
Australian Leisure and Entertainment Property Management Limited (the Company) is domiciled in Australia.
The stapled securities of ALE are quoted on the Australian Securities Exchange under the code LEP and comprise one unit in Australian Leisure and Entertainment Property Trust and one share in the Company. The unit and the share are stapled together under the terms of their respective constitutions and can not be traded separately. Each entity forming part of ALE is a separate legal entity in its own right under the Corporations Act 2001 and Australian Accounting Standards. The ALE Property Group is a for-profit entity.
The financial statements were authorised for issue by the Board of Directors on 8th August 2018.
The financial statements are general purpose financial statements which have been prepared in accordance with Australian Accounting Standards (AASBs) adopted by the Australian Accounting Standards Board (AASB) and the Corporations Act 2001. The financial statements also comply with the International Financial Reporting Standards (IFRS) and interpretations adopted by the International Accounting Standards Board.
Page 22 Australian Leisure and Entertainment Property Management Limited
For
per
sona
l use
onl
y
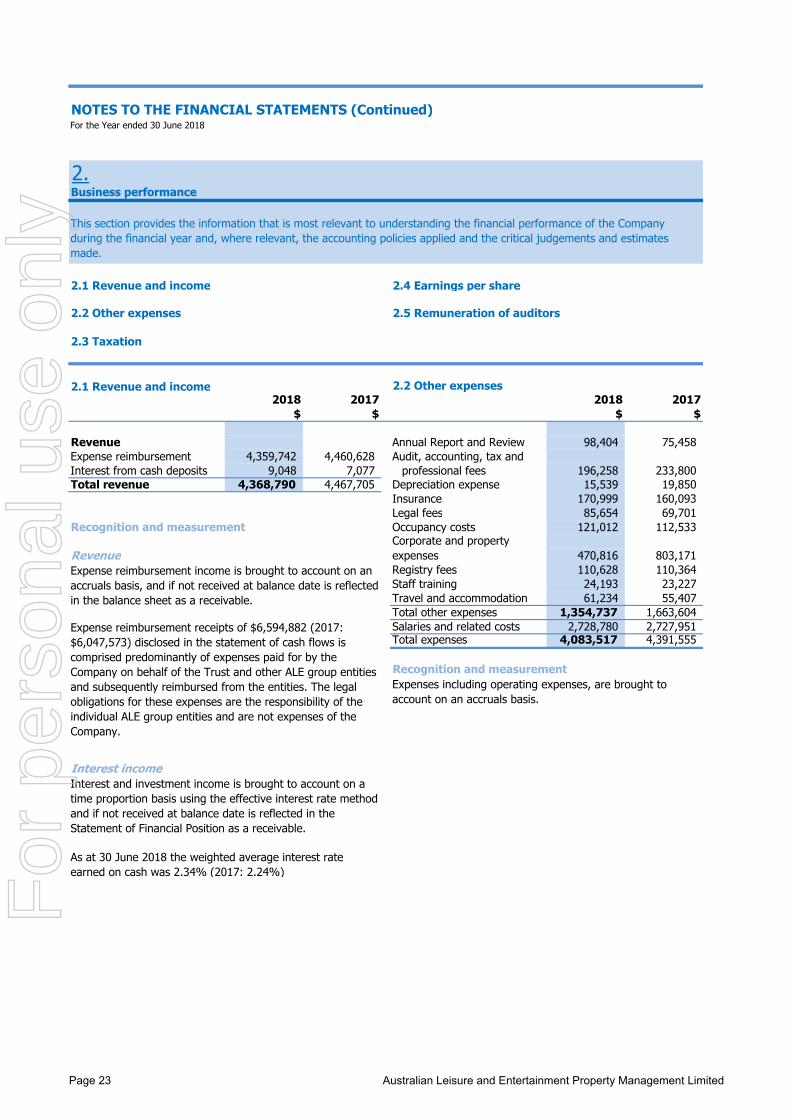
NOTES TO THE FINANCIAL STATEMENTS (Continued)For the Year ended 30 June 2018
2.Business performance
2.1 Revenue and income 2.4 Earnings per share
2.2 Other expenses 2.5 Remuneration of auditors
2.3 Taxation
2.1 Revenue and income 2.2 Other expenses2018 2017 2018 2017
$ $ $ $
Revenue Annual Report and Review 98,404 75,458 4,359,742 4,460,628 Audit, accounting, tax and
Interest from cash deposits 9,048 7,077 professional fees 196,258 233,800 Total revenue 4,368,790 4,467,705 Depreciation expense 15,539 19,850
Insurance 170,999 160,093 Legal fees 85,654 69,701
Recognition and measurement Occupancy costs 121,012 112,533
Revenue 470,816 803,171 Registry fees 110,628 110,364 Staff training 24,193 23,227 Travel and accommodation 61,234 55,407 Total other expenses 1,354,737 1,663,604 Salaries and related costs 2,728,780 2,727,951 Total expenses 4,083,517 4,391,555
Recognition and measurement
Interest income
This section provides the information that is most relevant to understanding the financial performance of the Company during the financial year and, where relevant, the accounting policies applied and the critical judgements and estimates made.
As at 30 June 2018 the weighted average interest rate earned on cash was 2.34% (2017: 2.24%)
Expense reimbursement income is brought to account on an accruals basis, and if not received at balance date is reflected in the balance sheet as a receivable.
Expense reimbursement
Expense reimbursement receipts of $6,594,882 (2017: $6,047,573) disclosed in the statement of cash flows is comprised predominantly of expenses paid for by the Company on behalf of the Trust and other ALE group entities and subsequently reimbursed from the entities. The legal obligations for these expenses are the responsibility of the individual ALE group entities and are not expenses of the Company.
Interest and investment income is brought to account on a time proportion basis using the effective interest rate method and if not received at balance date is reflected in the Statement of Financial Position as a receivable.
Corporate and property expenses
Expenses including operating expenses, are brought to account on an accruals basis.
Page 23 Australian Leisure and Entertainment Property Management Limited
For
per
sona
l use
onl
y
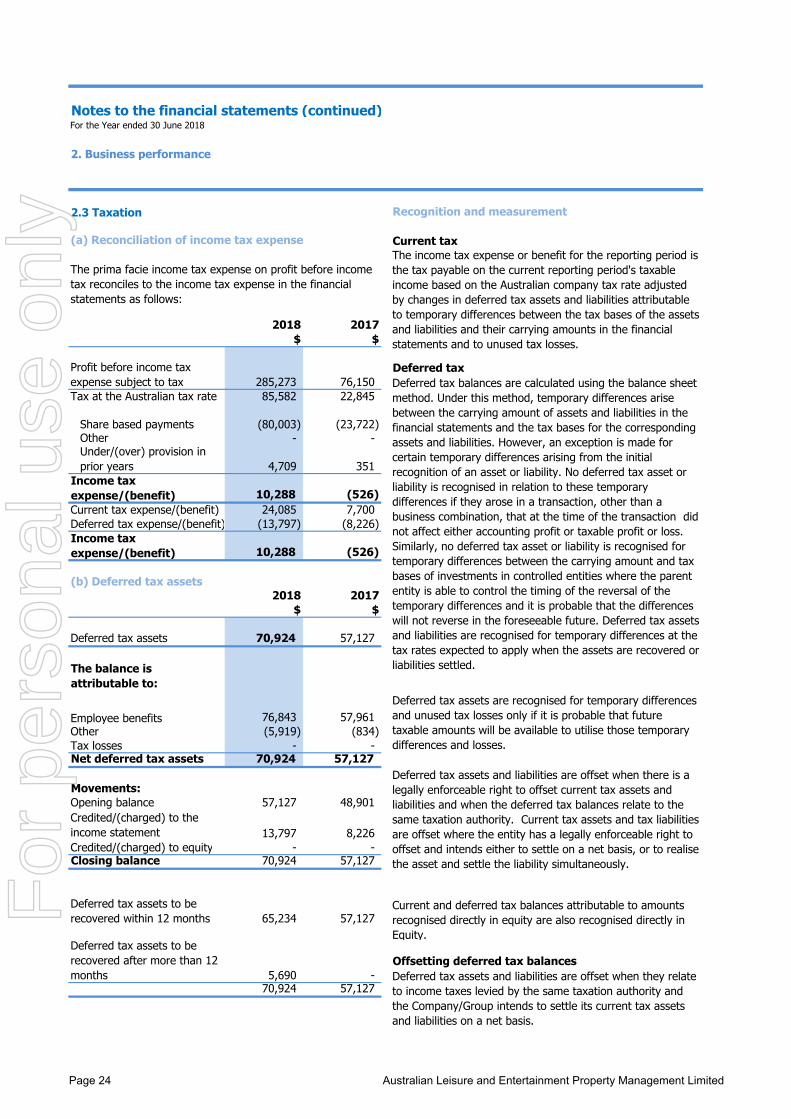
Notes to the financial statements (continued)For the Year ended 30 June 2018
2. Business performance
2.3 Taxation Recognition and measurement
(a) Reconciliation of income tax expense Current tax
2018 2017$ $
Deferred tax285,273 76,150
Tax at the Australian tax rate 85,582 22,845
(80,003) (23,722) Other - -
4,709 351
10,288 (526) Current tax expense/(benefit) 24,085 7,700 Deferred tax expense/(benefit) (13,797) (8,226)
10,288 (526)
(b) Deferred tax assets2018 2017
$ $
Deferred tax assets 70,924 57,127
Employee benefits 76,843 57,961 Other (5,919) (834) Tax losses - - Net deferred tax assets 70,924 57,127
Movements:Opening balance 57,127 48,901
13,797 8,226 Credited/(charged) to equity - - Closing balance 70,924 57,127
65,234 57,127
Offsetting deferred tax balances5,690 -
70,924 57,127
The balance is attributable to:
Share based payments
Under/(over) provision in prior years
Income tax expense/(benefit)
Income tax expense/(benefit)
The prima facie income tax expense on profit before incometax reconciles to the income tax expense in the financialstatements as follows:
Profit before income tax expense subject to tax Deferred tax balances are calculated using the balance sheet
method. Under this method, temporary differences arise between the carrying amount of assets and liabilities in the financial statements and the tax bases for the corresponding assets and liabilities. However, an exception is made for certain temporary differences arising from the initial recognition of an asset or liability. No deferred tax asset or liability is recognised in relation to these temporary differences if they arose in a transaction, other than a business combination, that at the time of the transaction did not affect either accounting profit or taxable profit or loss. Similarly, no deferred tax asset or liability is recognised for temporary differences between the carrying amount and tax bases of investments in controlled entities where the parent entity is able to control the timing of the reversal of the temporary differences and it is probable that the differences will not reverse in the foreseeable future. Deferred tax assets and liabilities are recognised for temporary differences at the tax rates expected to apply when the assets are recovered or liabilities settled.
The income tax expense or benefit for the reporting period is the tax payable on the current reporting period's taxable income based on the Australian company tax rate adjusted by changes in deferred tax assets and liabilities attributable to temporary differences between the tax bases of the assets and liabilities and their carrying amounts in the financial statements and to unused tax losses.
Current and deferred tax balances attributable to amounts recognised directly in equity are also recognised directly in Equity.
Deferred tax assets and liabilities are offset when they relate to income taxes levied by the same taxation authority and the Company/Group intends to settle its current tax assets and liabilities on a net basis.
Deferred tax assets to be recovered within 12 months
Deferred tax assets to be recovered after more than 12 months
Deferred tax assets and liabilities are offset when there is a legally enforceable right to offset current tax assets and liabilities and when the deferred tax balances relate to the same taxation authority. Current tax assets and tax liabilities are offset where the entity has a legally enforceable right to offset and intends either to settle on a net basis, or to realise the asset and settle the liability simultaneously.
Deferred tax assets are recognised for temporary differences and unused tax losses only if it is probable that future taxable amounts will be available to utilise those temporary differences and losses.
Credited/(charged) to the income statement
Page 24 Australian Leisure and Entertainment Property Management Limited
For
per
sona
l use
onl
y
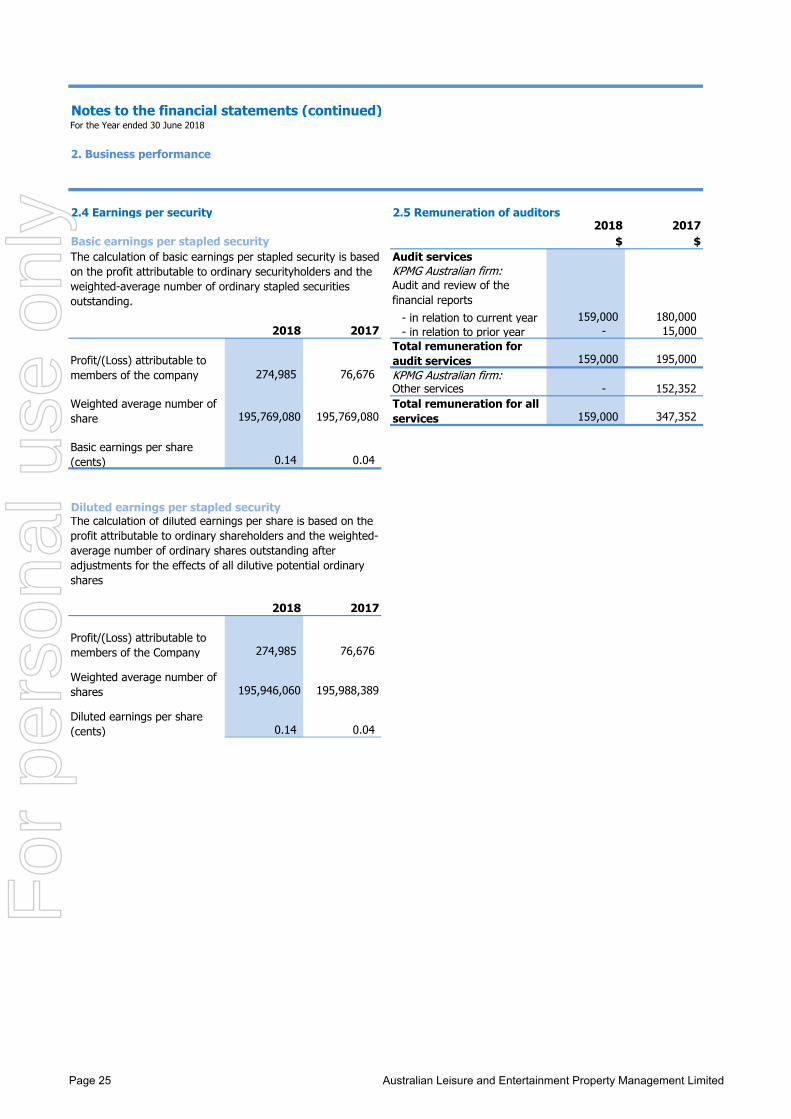
Notes to the financial statements (continued)For the Year ended 30 June 2018
2. Business performance
2.4 Earnings per security 2.5 Remuneration of auditors2018 2017
Basic earnings per stapled security $ $Audit servicesKPMG Australian firm:
- in relation to current year 159,000 180,000 2018 2017 - in relation to prior year - 15,000
159,000 195,000 274,985 76,676 KPMG Australian firm:
Other services - 152,352
195,769,080 195,769,080 159,000 347,352
0.14 0.04
Diluted earnings per stapled security
2018 2017
274,985 76,676
195,946,060 195,988,389
0.14 0.04
Weighted average number of shares
Diluted earnings per share (cents)
The calculation of diluted earnings per share is based on the profit attributable to ordinary shareholders and the weighted-average number of ordinary shares outstanding after adjustments for the effects of all dilutive potential ordinary shares
The calculation of basic earnings per stapled security is based on the profit attributable to ordinary securityholders and the weighted-average number of ordinary stapled securities outstanding.
Profit/(Loss) attributable to members of the company
Profit/(Loss) attributable to members of the Company
Weighted average number of share
Basic earnings per share (cents)
Audit and review of the financial reports
Total remuneration for audit services
Total remuneration for all services
Page 25 Australian Leisure and Entertainment Property Management Limited
For
per
sona
l use
onl
y
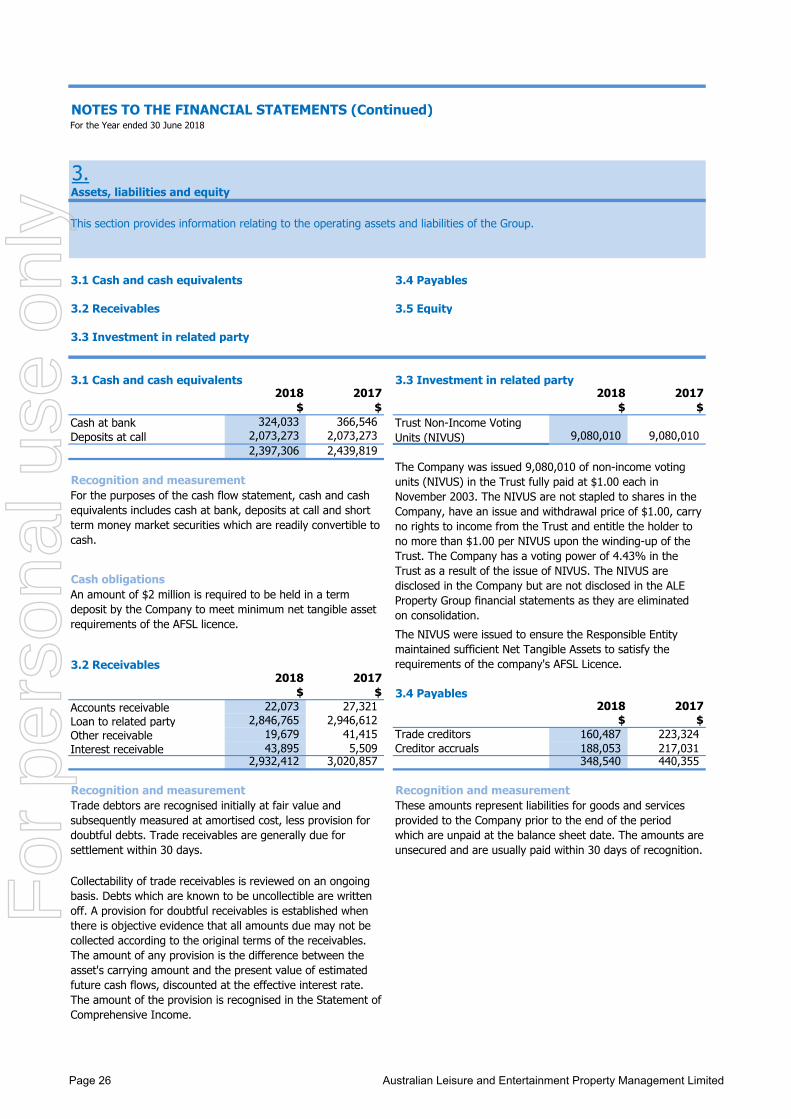
NOTES TO THE FINANCIAL STATEMENTS (Continued)For the Year ended 30 June 2018
3.Assets, liabilities and equity
3.1 Cash and cash equivalents 3.4 Payables
3.2 Receivables 3.5 Equity
3.3 Investment in related party
3.1 Cash and cash equivalents 3.3 Investment in related party2018 2017 2018 2017
$ $ $ $Cash at bank 324,033 366,546 Deposits at call 2,073,273 2,073,273 9,080,010 9,080,010
2,397,306 2,439,819
Recognition and measurement
Cash obligations
3.2 Receivables2018 2017
$ $ 3.4 PayablesAccounts receivable 22,073 27,321 2018 2017Loan to related party 2,846,765 2,946,612 $ $Other receivable 19,679 41,415 Trade creditors 160,487 223,324 Interest receivable 43,895 5,509 Creditor accruals 188,053 217,031
2,932,412 3,020,857 348,540 440,355
Recognition and measurement Recognition and measurement
Trust Non-Income Voting Units (NIVUS)
The Company was issued 9,080,010 of non-income voting units (NIVUS) in the Trust fully paid at $1.00 each in November 2003. The NIVUS are not stapled to shares in the Company, have an issue and withdrawal price of $1.00, carry no rights to income from the Trust and entitle the holder to no more than $1.00 per NIVUS upon the winding-up of the Trust. The Company has a voting power of 4.43% in the Trust as a result of the issue of NIVUS. The NIVUS are disclosed in the Company but are not disclosed in the ALE Property Group financial statements as they are eliminated on consolidation.
This section provides information relating to the operating assets and liabilities of the Group.
For the purposes of the cash flow statement, cash and cash equivalents includes cash at bank, deposits at call and short term money market securities which are readily convertible to cash.
An amount of $2 million is required to be held in a term deposit by the Company to meet minimum net tangible asset requirements of the AFSL licence.
Trade debtors are recognised initially at fair value and subsequently measured at amortised cost, less provision for doubtful debts. Trade receivables are generally due for settlement within 30 days.
Collectability of trade receivables is reviewed on an ongoing basis. Debts which are known to be uncollectible are written off. A provision for doubtful receivables is established when there is objective evidence that all amounts due may not be collected according to the original terms of the receivables. The amount of any provision is the difference between the asset's carrying amount and the present value of estimated future cash flows, discounted at the effective interest rate. The amount of the provision is recognised in the Statement of Comprehensive Income.
These amounts represent liabilities for goods and services provided to the Company prior to the end of the period which are unpaid at the balance sheet date. The amounts are unsecured and are usually paid within 30 days of recognition.
The NIVUS were issued to ensure the Responsible Entity maintained sufficient Net Tangible Assets to satisfy the requirements of the company's AFSL Licence.
Page 26 Australian Leisure and Entertainment Property Management Limited
For
per
sona
l use
onl
y
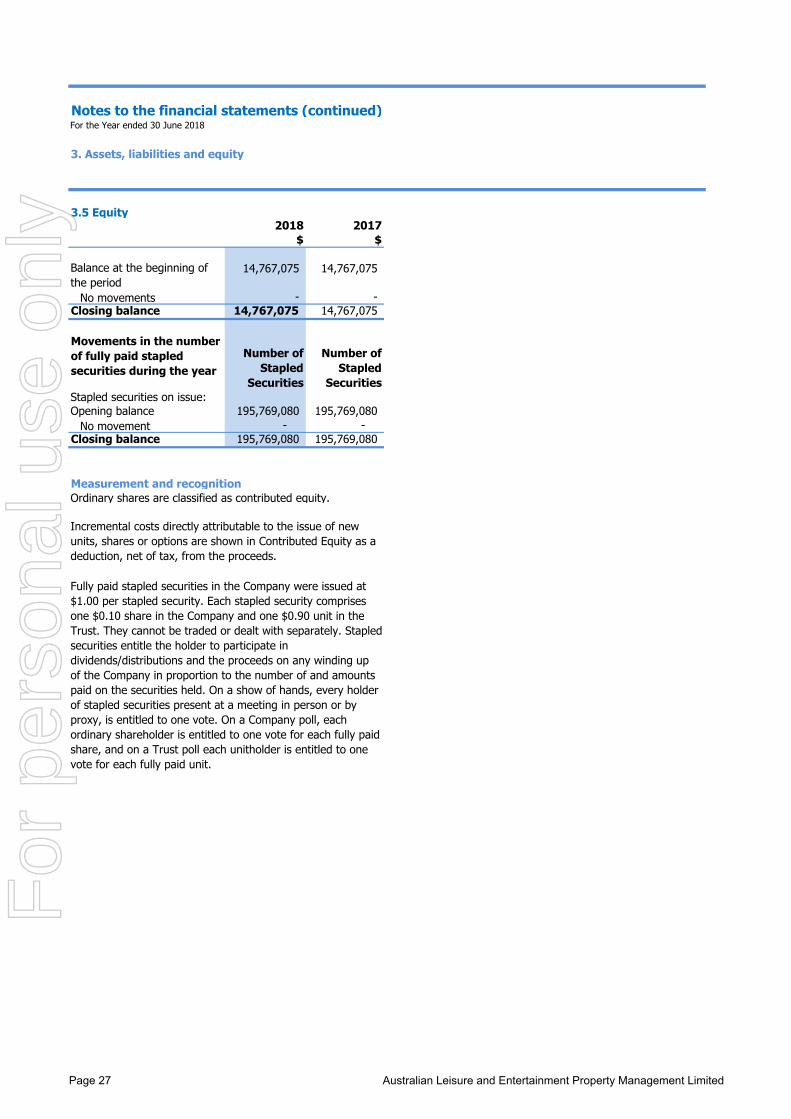
Notes to the financial statements (continued)For the Year ended 30 June 2018
3. Assets, liabilities and equity
3.5 Equity2018 2017
$ $
14,767,075 14,767,075
- - Closing balance 14,767,075 14,767,075
Stapled securities on issue:Opening balance 195,769,080 195,769,080
- - Closing balance 195,769,080 195,769,080
Measurement and recognitionOrdinary shares are classified as contributed equity.
Fully paid stapled securities in the Company were issued at $1.00 per stapled security. Each stapled security comprises one $0.10 share in the Company and one $0.90 unit in the Trust. They cannot be traded or dealt with separately. Stapled securities entitle the holder to participate in dividends/distributions and the proceeds on any winding up of the Company in proportion to the number of and amounts paid on the securities held. On a show of hands, every holder of stapled securities present at a meeting in person or by proxy, is entitled to one vote. On a Company poll, each ordinary shareholder is entitled to one vote for each fully paid share, and on a Trust poll each unitholder is entitled to one vote for each fully paid unit.
Balance at the beginning of the period
No movements
Movements in the number of fully paid stapled securities during the year
Number of Stapled
Securities
Number of Stapled
Securities
No movement
Incremental costs directly attributable to the issue of new units, shares or options are shown in Contributed Equity as a deduction, net of tax, from the proceeds.
Page 27 Australian Leisure and Entertainment Property Management Limited
For
per
sona
l use
onl
y
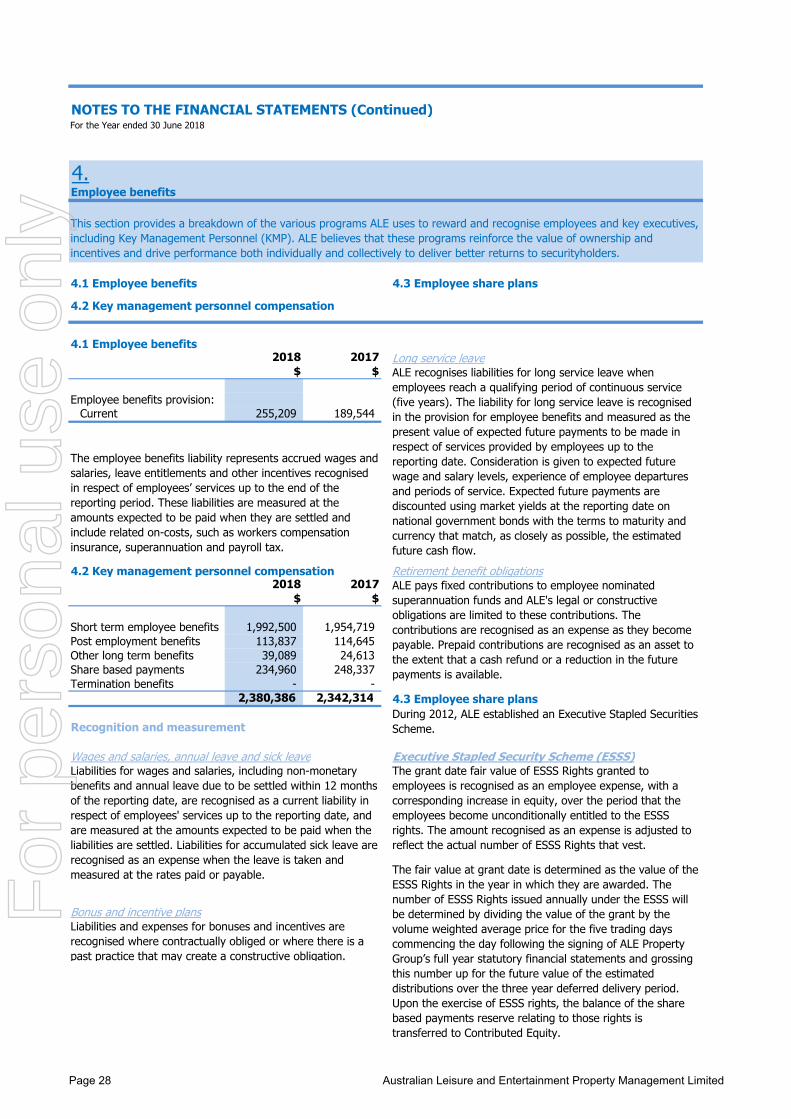
NOTES TO THE FINANCIAL STATEMENTS (Continued)For the Year ended 30 June 2018
4.Employee benefits
4.1 Employee benefits 4.3 Employee share plans
4.2 Key management personnel compensation
4.1 Employee benefits2018 2017 Long service leave
$ $
Employee benefits provision:Current 255,209 189,544
4.2 Key management personnel compensation Retirement benefit obligations2018 2017
$ $
Short term employee benefits 1,992,500 1,954,719 Post employment benefits 113,837 114,645 Other long term benefits 39,089 24,613 Share based payments 234,960 248,337 Termination benefits - -
2,380,386 2,342,314 4.3 Employee share plans
Recognition and measurement
Wages and salaries, annual leave and sick leave
Bonus and incentive plans
Executive Stapled Security Scheme (ESSS)
This section provides a breakdown of the various programs ALE uses to reward and recognise employees and key executives, including Key Management Personnel (KMP). ALE believes that these programs reinforce the value of ownership and incentives and drive performance both individually and collectively to deliver better returns to securityholders.
The employee benefits liability represents accrued wages and salaries, leave entitlements and other incentives recognised in respect of employees’ services up to the end of the reporting period. These liabilities are measured at the amounts expected to be paid when they are settled and include related on-costs, such as workers compensation insurance, superannuation and payroll tax.
Liabilities and expenses for bonuses and incentives are recognised where contractually obliged or where there is a past practice that may create a constructive obligation.
ALE recognises liabilities for long service leave when employees reach a qualifying period of continuous service (five years). The liability for long service leave is recognised in the provision for employee benefits and measured as the present value of expected future payments to be made in respect of services provided by employees up to the reporting date. Consideration is given to expected future wage and salary levels, experience of employee departures and periods of service. Expected future payments are discounted using market yields at the reporting date on national government bonds with the terms to maturity and currency that match, as closely as possible, the estimated future cash flow.
Liabilities for wages and salaries, including non-monetary benefits and annual leave due to be settled within 12 months of the reporting date, are recognised as a current liability in respect of employees' services up to the reporting date, and are measured at the amounts expected to be paid when the liabilities are settled. Liabilities for accumulated sick leave are recognised as an expense when the leave is taken and measured at the rates paid or payable.
During 2012, ALE established an Executive Stapled Securities Scheme.
ALE pays fixed contributions to employee nominated superannuation funds and ALE's legal or constructive obligations are limited to these contributions. The contributions are recognised as an expense as they become payable. Prepaid contributions are recognised as an asset to the extent that a cash refund or a reduction in the future payments is available.
The grant date fair value of ESSS Rights granted to employees is recognised as an employee expense, with a corresponding increase in equity, over the period that the employees become unconditionally entitled to the ESSS rights. The amount recognised as an expense is adjusted to reflect the actual number of ESSS Rights that vest.
The fair value at grant date is determined as the value of the ESSS Rights in the year in which they are awarded. The number of ESSS Rights issued annually under the ESSS will be determined by dividing the value of the grant by the volume weighted average price for the five trading days commencing the day following the signing of ALE Property Group’s full year statutory financial statements and grossing this number up for the future value of the estimated distributions over the three year deferred delivery period. Upon the exercise of ESSS rights, the balance of the share based payments reserve relating to those rights is transferred to Contributed Equity.
Page 28 Australian Leisure and Entertainment Property Management Limited
For
per
sona
l use
onl
y
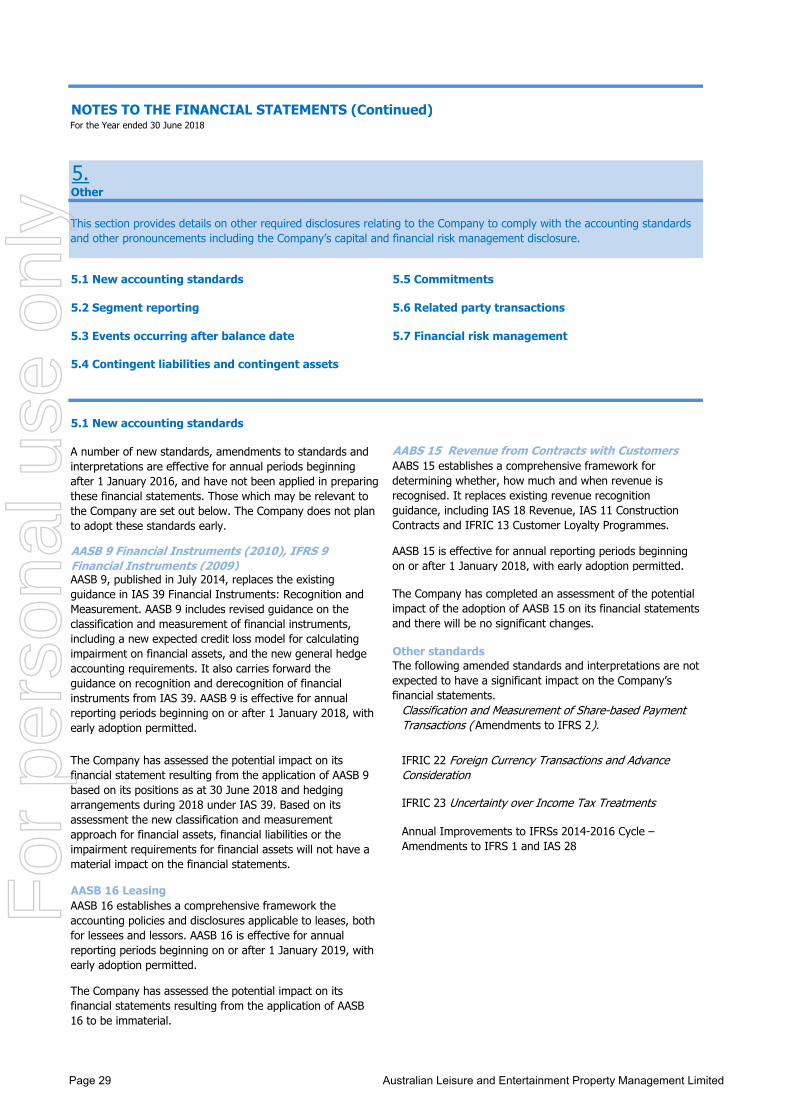
NOTES TO THE FINANCIAL STATEMENTS (Continued)For the Year ended 30 June 2018
5.Other
5.1 New accounting standards 5.5 Commitments
5.2 Segment reporting 5.6 Related party transactions
5.3 Events occurring after balance date 5.7 Financial risk management
5.4 Contingent liabilities and contingent assets
5.1 New accounting standards
AABS 15 Revenue from Contracts with Customers
Other standards
AASB 16 Leasing
AASB 9, published in July 2014, replaces the existing guidance in IAS 39 Financial Instruments: Recognition and Measurement. AASB 9 includes revised guidance on the classification and measurement of financial instruments, including a new expected credit loss model for calculating impairment on financial assets, and the new general hedge accounting requirements. It also carries forward the guidance on recognition and derecognition of financial instruments from IAS 39. AASB 9 is effective for annual reporting periods beginning on or after 1 January 2018, with early adoption permitted.
Annual Improvements to IFRSs 2014-2016 Cycle – Amendments to IFRS 1 and IAS 28
The Company has completed an assessment of the potential impact of the adoption of AASB 15 on its financial statements and there will be no significant changes.
AASB 16 establishes a comprehensive framework the accounting policies and disclosures applicable to leases, both for lessees and lessors. AASB 16 is effective for annual reporting periods beginning on or after 1 January 2019, with early adoption permitted.
The Company has assessed the potential impact on its financial statement resulting from the application of AASB 9 based on its positions as at 30 June 2018 and hedging arrangements during 2018 under IAS 39. Based on its assessment the new classification and measurement approach for financial assets, financial liabilities or the impairment requirements for financial assets will not have a material impact on the financial statements.
The Company has assessed the potential impact on its financial statements resulting from the application of AASB 16 to be immaterial.
The following amended standards and interpretations are not expected to have a significant impact on the Company’s financial statements.
Classification and Measurement of Share-based Payment Transactions ( Amendments to IFRS 2).
IFRIC 22 Foreign Currency Transactions and Advance Consideration
IFRIC 23 Uncertainty over Income Tax Treatments
This section provides details on other required disclosures relating to the Company to comply with the accounting standards and other pronouncements including the Company’s capital and financial risk management disclosure.
A number of new standards, amendments to standards and interpretations are effective for annual periods beginning after 1 January 2016, and have not been applied in preparing these financial statements. Those which may be relevant to the Company are set out below. The Company does not plan to adopt these standards early.
AASB 9 Financial Instruments (2010), IFRS 9 Financial Instruments (2009)
AASB 15 is effective for annual reporting periods beginning on or after 1 January 2018, with early adoption permitted.
AABS 15 establishes a comprehensive framework for determining whether, how much and when revenue is recognised. It replaces existing revenue recognition guidance, including IAS 18 Revenue, IAS 11 Construction Contracts and IFRIC 13 Customer Loyalty Programmes.
Page 29 Australian Leisure and Entertainment Property Management Limited
For
per
sona
l use
onl
y
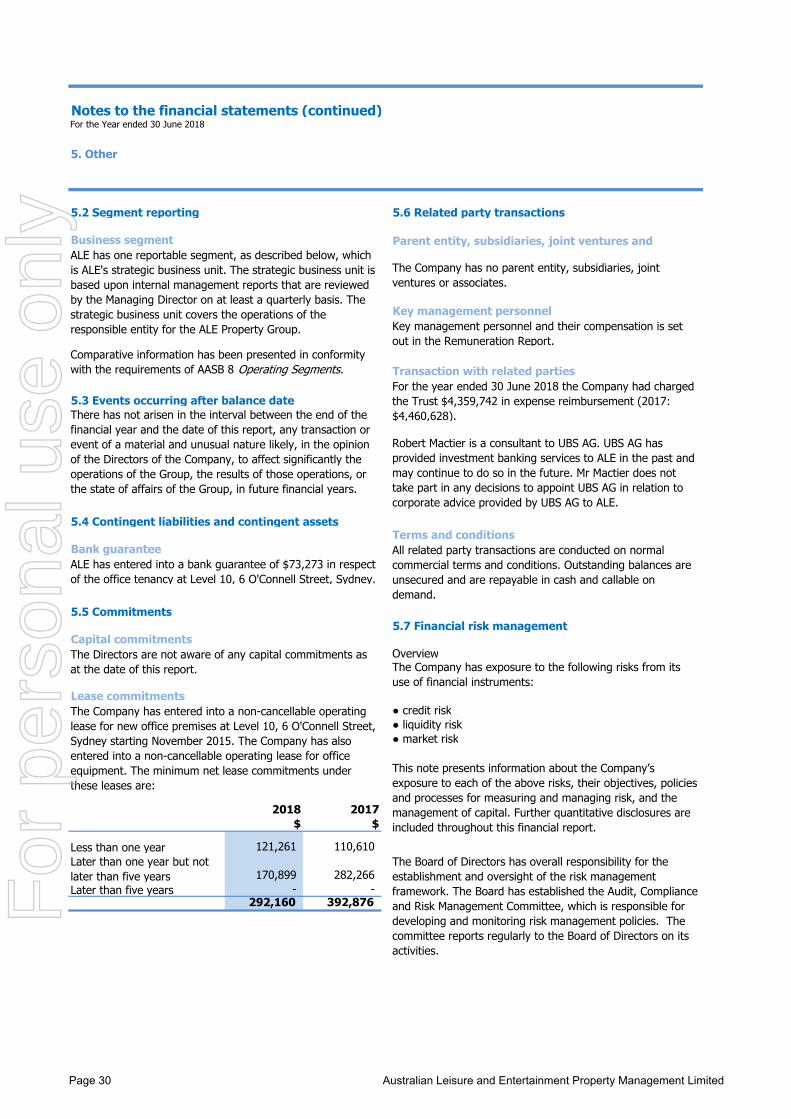
Notes to the financial statements (continued)For the Year ended 30 June 2018
5. Other
5.2 Segment reporting 5.6 Related party transactions
Business segment
Key management personnel
Transaction with related parties
5.3 Events occurring after balance date
5.4 Contingent liabilities and contingent assetsTerms and conditions
Bank guarantee
5.5 Commitments5.7 Financial risk management
Capital commitmentsOverview
Lease commitments● credit risk● liquidity risk● market risk
2018 2017$ $
Less than one year 121,261 110,610
170,899 282,266 - -
292,160 392,876
ALE has one reportable segment, as described below, which is ALE's strategic business unit. The strategic business unit is based upon internal management reports that are reviewed by the Managing Director on at least a quarterly basis. The strategic business unit covers the operations of the responsible entity for the ALE Property Group.
This note presents information about the Company’s exposure to each of the above risks, their objectives, policies and processes for measuring and managing risk, and the management of capital. Further quantitative disclosures are included throughout this financial report.
Later than one year but not later than five years
All related party transactions are conducted on normal commercial terms and conditions. Outstanding balances are unsecured and are repayable in cash and callable on demand.
The Company has exposure to the following risks from its use of financial instruments:
The Directors are not aware of any capital commitments as at the date of this report.
Key management personnel and their compensation is set out in the Remuneration Report.
For the year ended 30 June 2018 the Company had charged the Trust $4,359,742 in expense reimbursement (2017: $4,460,628).
Robert Mactier is a consultant to UBS AG. UBS AG has provided investment banking services to ALE in the past and may continue to do so in the future. Mr Mactier does not take part in any decisions to appoint UBS AG in relation to corporate advice provided by UBS AG to ALE.
The Board of Directors has overall responsibility for the establishment and oversight of the risk management framework. The Board has established the Audit, Compliance and Risk Management Committee, which is responsible for developing and monitoring risk management policies. The committee reports regularly to the Board of Directors on its activities.
Later than five years
The Company has entered into a non-cancellable operating lease for new office premises at Level 10, 6 O'Connell Street, Sydney starting November 2015. The Company has also entered into a non-cancellable operating lease for office equipment. The minimum net lease commitments under these leases are:
There has not arisen in the interval between the end of the financial year and the date of this report, any transaction or event of a material and unusual nature likely, in the opinion of the Directors of the Company, to affect significantly the operations of the Group, the results of those operations, or the state of affairs of the Group, in future financial years.
ALE has entered into a bank guarantee of $73,273 in respect of the office tenancy at Level 10, 6 O'Connell Street, Sydney.
Parent entity, subsidiaries, joint ventures and
The Company has no parent entity, subsidiaries, joint ventures or associates.
Comparative information has been presented in conformity with the requirements of AASB 8 Operating Segments.
Page 30 Australian Leisure and Entertainment Property Management Limited
For
per
sona
l use
onl
y
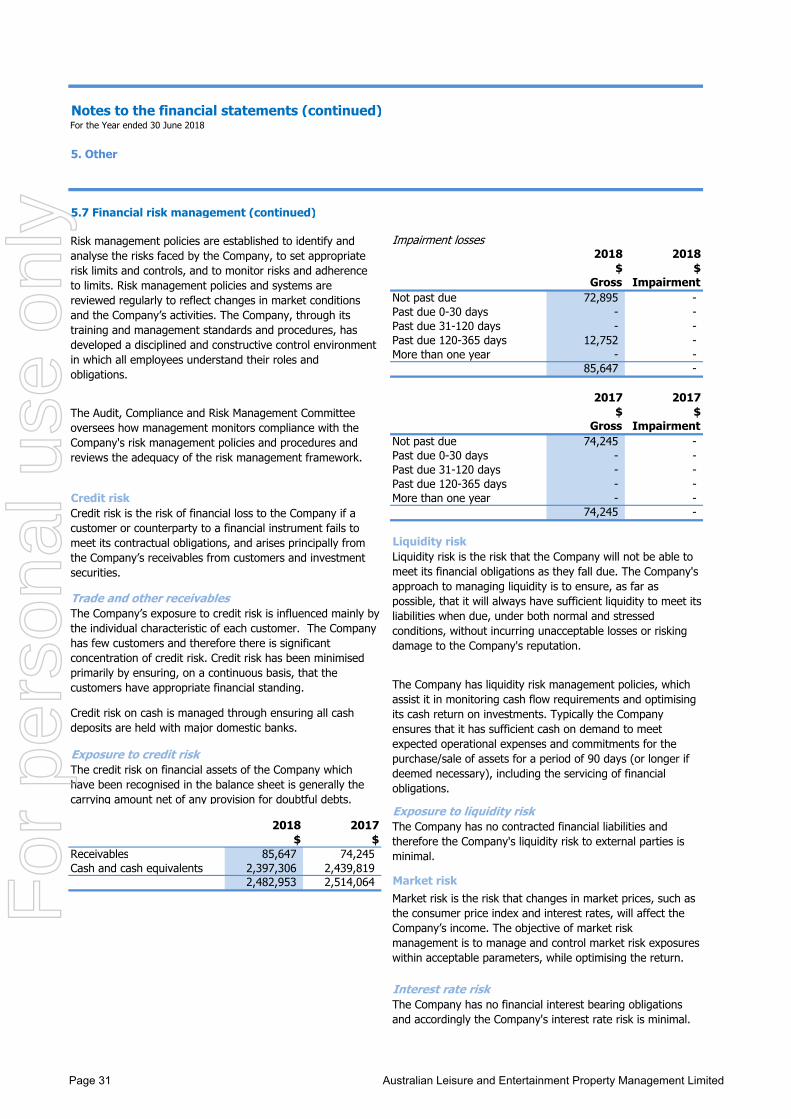
Notes to the financial statements (continued)For the Year ended 30 June 2018
5. Other
5.7 Financial risk management (continued)
Impairment losses2018 2018
$ $Gross Impairment
Not past due 72,895 - Past due 0-30 days - - Past due 31-120 days - - Past due 120-365 days 12,752 - More than one year - -
85,647 -
2017 2017$ $
Gross ImpairmentNot past due 74,245 - Past due 0-30 days - - Past due 31-120 days - - Past due 120-365 days - -
Credit risk More than one year - - 74,245 -
Liquidity risk
Trade and other receivables
Exposure to credit risk
Exposure to liquidity risk2018 2017
$ $Receivables 85,647 74,245 Cash and cash equivalents 2,397,306 2,439,819
2,482,953 2,514,064 Market risk
Interest rate riskThe Company has no financial interest bearing obligations and accordingly the Company's interest rate risk is minimal.
The credit risk on financial assets of the Company which have been recognised in the balance sheet is generally the carrying amount net of any provision for doubtful debts.
The Company has liquidity risk management policies, which assist it in monitoring cash flow requirements and optimising its cash return on investments. Typically the Company ensures that it has sufficient cash on demand to meet expected operational expenses and commitments for the purchase/sale of assets for a period of 90 days (or longer if deemed necessary), including the servicing of financial obligations.
The Company has no contracted financial liabilities and therefore the Company's liquidity risk to external parties is minimal.
Market risk is the risk that changes in market prices, such as the consumer price index and interest rates, will affect the Company’s income. The objective of market risk management is to manage and control market risk exposures within acceptable parameters, while optimising the return.
Credit risk on cash is managed through ensuring all cash deposits are held with major domestic banks.
The Company’s exposure to credit risk is influenced mainly by the individual characteristic of each customer. The Company has few customers and therefore there is significant concentration of credit risk. Credit risk has been minimised primarily by ensuring, on a continuous basis, that the customers have appropriate financial standing.
Liquidity risk is the risk that the Company will not be able to meet its financial obligations as they fall due. The Company's approach to managing liquidity is to ensure, as far as possible, that it will always have sufficient liquidity to meet its liabilities when due, under both normal and stressed conditions, without incurring unacceptable losses or risking damage to the Company's reputation.
The Audit, Compliance and Risk Management Committee oversees how management monitors compliance with the Company's risk management policies and procedures and reviews the adequacy of the risk management framework.
Credit risk is the risk of financial loss to the Company if a customer or counterparty to a financial instrument fails to meet its contractual obligations, and arises principally from the Company’s receivables from customers and investment securities.
Risk management policies are established to identify and analyse the risks faced by the Company, to set appropriate risk limits and controls, and to monitor risks and adherence to limits. Risk management policies and systems are reviewed regularly to reflect changes in market conditions and the Company’s activities. The Company, through its training and management standards and procedures, has developed a disciplined and constructive control environment in which all employees understand their roles and obligations.
Page 31 Australian Leisure and Entertainment Property Management Limited
For
per
sona
l use
onl
y
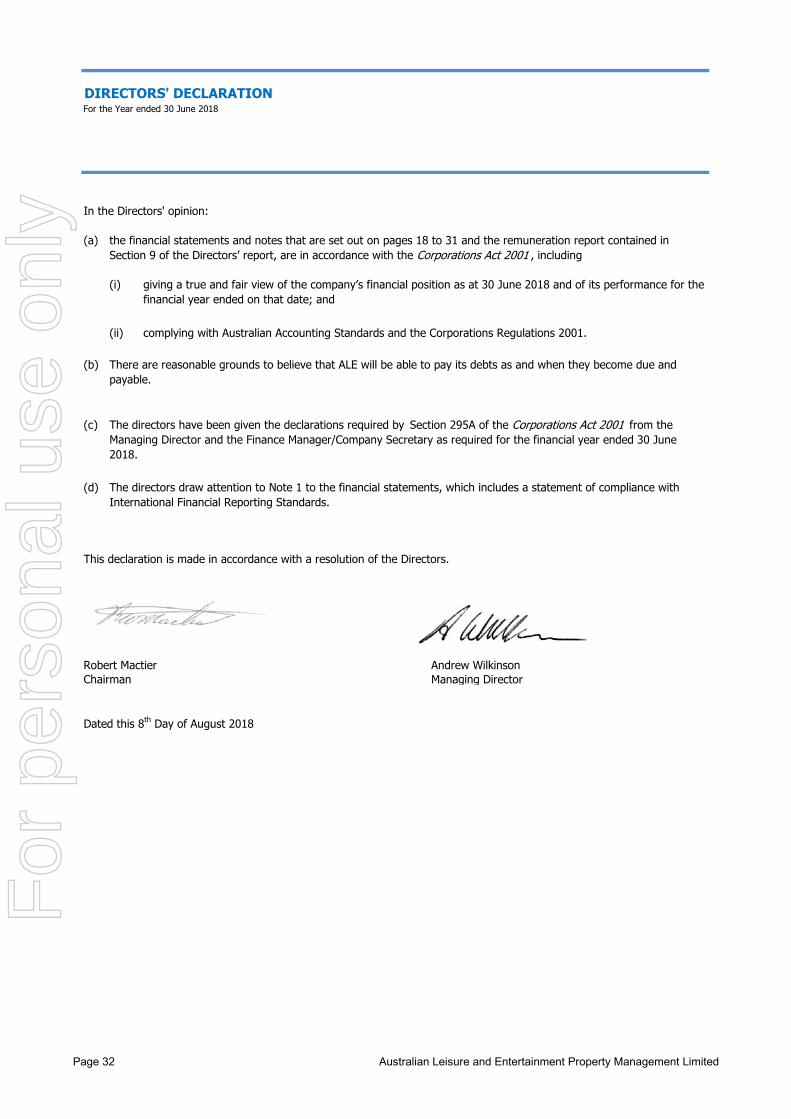
DIRECTORS' DECLARATIONFor the Year ended 30 June 2018
In the Directors' opinion:
(a)
(i)
(ii)
(b)
(c )
(d)
This declaration is made in accordance with a resolution of the Directors.
Robert Mactier Andrew WilkinsonChairman Managing Director
Dated this 8th Day of August 2018
the financial statements and notes that are set out on pages 18 to 31 and the remuneration report contained in Section 9 of the Directors’ report, are in accordance with the Corporations Act 2001 , including
There are reasonable grounds to believe that ALE will be able to pay its debts as and when they become due and payable.
The directors have been given the declarations required by Section 295A of the Corporations Act 2001 from the Managing Director and the Finance Manager/Company Secretary as required for the financial year ended 30 June 2018.
The directors draw attention to Note 1 to the financial statements, which includes a statement of compliance with International Financial Reporting Standards.
complying with Australian Accounting Standards and the Corporations Regulations 2001.
giving a true and fair view of the company’s financial position as at 30 June 2018 and of its performance for the financial year ended on that date; and
Page 32 Australian Leisure and Entertainment Property Management Limited
For
per
sona
l use
onl
y
For
per
sona
l use
onl
y
For
per
sona
l use
onl
y
For
per
sona
l use
onl
y
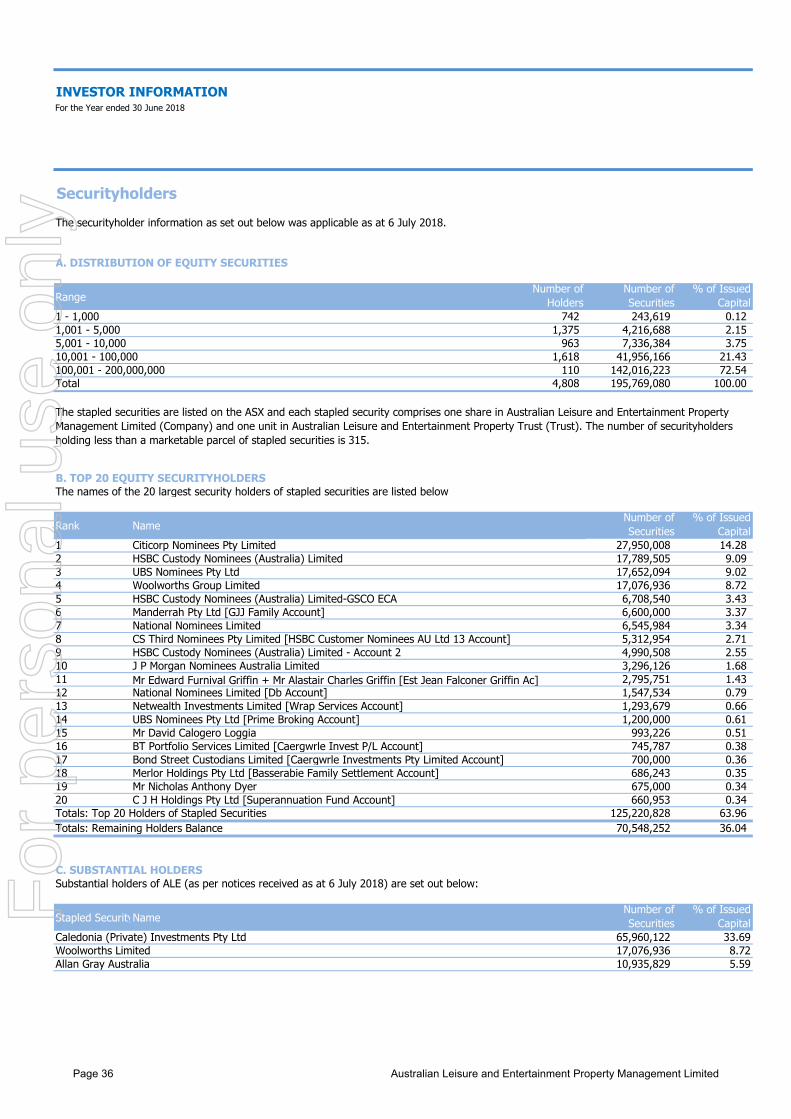
INVESTOR INFORMATIONFor the Year ended 30 June 2018
SecurityholdersThe securityholder information as set out below was applicable as at 6 July 2018.
A. DISTRIBUTION OF EQUITY SECURITIES
RangeNumber of
HoldersNumber of Securities
% of Issued Capital
1 - 1,000 742 243,619 0.12 1,001 - 5,000 1,375 4,216,688 2.15 5,001 - 10,000 963 7,336,384 3.75 10,001 - 100,000 1,618 41,956,166 21.43 100,001 - 200,000,000 110 142,016,223 72.54 Total 4,808 195,769,080 100.00
B. TOP 20 EQUITY SECURITYHOLDERSThe names of the 20 largest security holders of stapled securities are listed below
Rank NameNumber of Securities
% of Issued Capital
1 Citicorp Nominees Pty Limited 27,950,008 14.28 2 HSBC Custody Nominees (Australia) Limited 17,789,505 9.09 3 UBS Nominees Pty Ltd 17,652,094 9.02 4 Woolworths Group Limited 17,076,936 8.72 5 HSBC Custody Nominees (Australia) Limited-GSCO ECA 6,708,540 3.43 6 Manderrah Pty Ltd [GJJ Family Account] 6,600,000 3.37 7 National Nominees Limited 6,545,984 3.34 8 CS Third Nominees Pty Limited [HSBC Customer Nominees AU Ltd 13 Account] 5,312,954 2.71 9 HSBC Custody Nominees (Australia) Limited - Account 2 4,990,508 2.55 10 J P Morgan Nominees Australia Limited 3,296,126 1.68 11 2,795,751 1.43 12 National Nominees Limited [Db Account] 1,547,534 0.79 13 Netwealth Investments Limited [Wrap Services Account] 1,293,679 0.66 14 UBS Nominees Pty Ltd [Prime Broking Account] 1,200,000 0.61 15 Mr David Calogero Loggia 993,226 0.51 16 BT Portfolio Services Limited [Caergwrle Invest P/L Account] 745,787 0.38 17 Bond Street Custodians Limited [Caergwrle Investments Pty Limited Account] 700,000 0.36 18 Merlor Holdings Pty Ltd [Basserabie Family Settlement Account] 686,243 0.35 19 Mr Nicholas Anthony Dyer 675,000 0.34 20 C J H Holdings Pty Ltd [Superannuation Fund Account] 660,953 0.34 Totals: Top 20 Holders of Stapled Securities 125,220,828 63.96 Totals: Remaining Holders Balance 70,548,252 36.04
C. SUBSTANTIAL HOLDERSSubstantial holders of ALE (as per notices received as at 6 July 2018) are set out below:
Stapled SecurityNameNumber of Securities
% of Issued Capital
Caledonia (Private) Investments Pty Ltd 65,960,122 33.69Woolworths Limited 17,076,936 8.72Allan Gray Australia 10,935,829 5.59
The stapled securities are listed on the ASX and each stapled security comprises one share in Australian Leisure and Entertainment Property Management Limited (Company) and one unit in Australian Leisure and Entertainment Property Trust (Trust). The number of securityholders holding less than a marketable parcel of stapled securities is 315.
Mr Edward Furnival Griffin + Mr Alastair Charles Griffin [Est Jean Falconer Griffin Ac]
Page 36 Australian Leisure and Entertainment Property Management Limited
For
per
sona
l use
onl
y
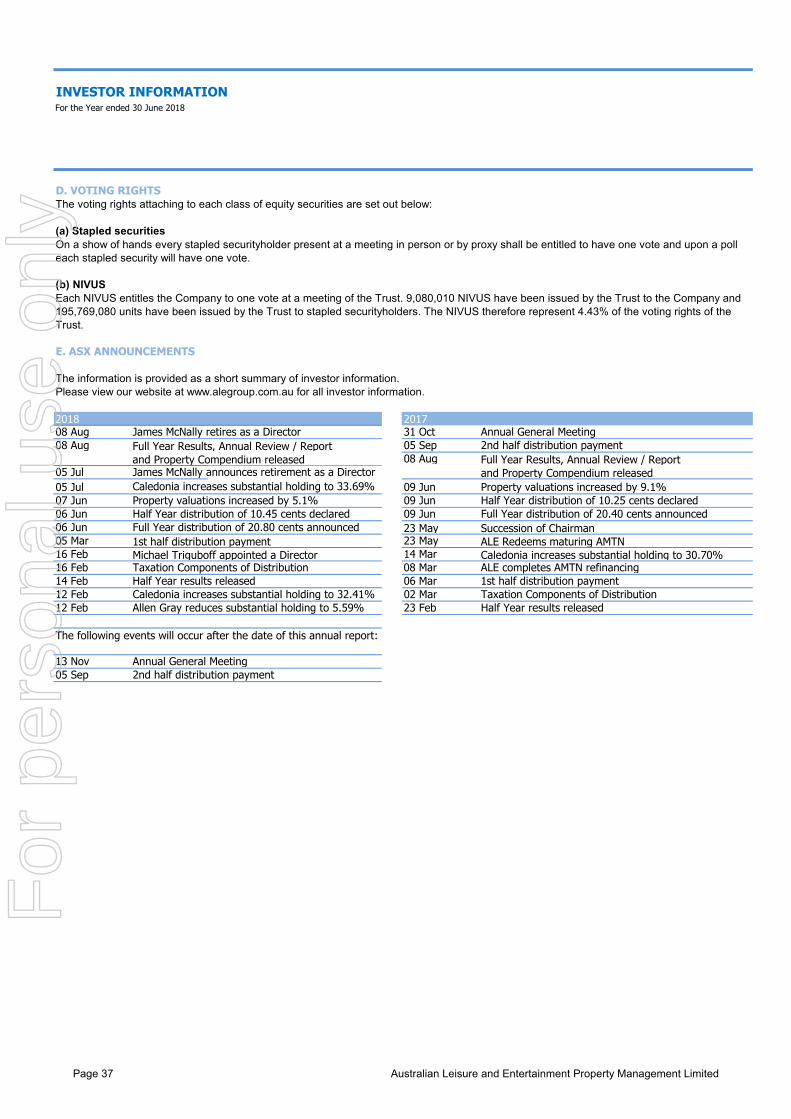
INVESTOR INFORMATIONFor the Year ended 30 June 2018
D. VOTING RIGHTSThe voting rights attaching to each class of equity securities are set out below:
(a) Stapled securities
(b) NIVUS
E. ASX ANNOUNCEMENTS
The information is provided as a short summary of investor information.Please view our website at www.alegroup.com.au for all investor information.
2018 201708 Aug James McNally retires as a Director 31 Oct Annual General Meeting08 Aug Full Year Results, Annual Review / Report 05 Sep 2nd half distribution payment
and Property Compendium released 08 Aug Full Year Results, Annual Review / Report 05 Jul James McNally announces retirement as a Director and Property Compendium released05 Jul Caledonia increases substantial holding to 33.69% 09 Jun Property valuations increased by 9.1% 07 Jun Property valuations increased by 5.1% 09 Jun Half Year distribution of 10.25 cents declared06 Jun Half Year distribution of 10.45 cents declared 09 Jun Full Year distribution of 20.40 cents announced06 Jun Full Year distribution of 20.80 cents announced 23 May Succession of Chairman05 Mar 1st half distribution payment 23 May ALE Redeems maturing AMTN16 Feb Michael Triguboff appointed a Director 14 Mar Caledonia increases substantial holding to 30.70%16 Feb Taxation Components of Distribution 08 Mar ALE completes AMTN refinancing14 Feb Half Year results released 06 Mar 1st half distribution payment12 Feb Caledonia increases substantial holding to 32.41% 02 Mar Taxation Components of Distribution12 Feb Allen Gray reduces substantial holding to 5.59% 23 Feb Half Year results released
13 Nov Annual General Meeting05 Sep 2nd half distribution payment
On a show of hands every stapled securityholder present at a meeting in person or by proxy shall be entitled to have one vote and upon a poll each stapled security will have one vote.
Each NIVUS entitles the Company to one vote at a meeting of the Trust. 9,080,010 NIVUS have been issued by the Trust to the Company and 195,769,080 units have been issued by the Trust to stapled securityholders. The NIVUS therefore represent 4.43% of the voting rights of the Trust.
The following events will occur after the date of this annual report:
Page 37 Australian Leisure and Entertainment Property Management Limited
For
per
sona
l use
onl
y
INVESTOR INFORMATIONFor the Year ended 30 June 2018
Stock Exchange Listing SecurityHolder Enquiries
Distribution Reinvestment Plan Registered OfficeLevel 10, 6 O'Connell StreetSydney NSW 2000Telephone (02) 8231 8588
DistributionsCompany SecretaryMr Michael ClarkeLevel 10, 6 O'Connell Street
Electronic Payment of Distributions Sydney NSW 2000Telephone (02) 8231 8588
AuditorsKPMGLevel 38, Tower ThreeInternational Towers Sydney300 Barangaroo AvenueSydney NSW 2000
Annual Tax Statement LawyersAllens LinklatersLevel 28, Deutsche Bank PlaceSydney NSW 2000
PublicationsThe Trust Company LimitedLevel 13, 123 Pitt StreetSydney NSW 2000
Trustee (of ALE Direct Property Trust)The Trust Company (Australia) LimitedLevel 13, 123 Pitt StreetSydney NSW 2000
RegistryComputershare Investor Services Pty LtdReply Paid GPO Box 7115, Sydney NSW 2000Level 3, 60 Carrington Street, Sydney NSW 2000Telephone 1300 302 429Facsimile (02) 8235 8150www.computershare.com.au
WebsiteThe ALE website, www.alegroup.com.au, is a useful source of information for stapled securityholders. It includes details of ALE's property portfolio, current activities and future prospects. ASX announcements are also included on the site on a regular basis. The ALE Property website, www.aleproperties.com.au, provides further detailed information on ALE's property portfolio.
The Annual Review and Annual Report are the main sources of information for stapled securityholders. In August each year the Annual Review, Annual Report and Full Year Financial Report, and in February each year, the Half-Year Financial Report are released to the ASX and posted on the ALE website. The Annual Review is mailed to stapled securityholders unless we are requested not to do so. The Full Year and Half-Year Financial Reports are only mailed on request. Periodically ALE may also send releases to the ASX covering matters of relevance to investors. These releases are also posted on the ALE website and may be distributed by email to stapled securityholders by registering on ALE’s website. The election by stapled securityholders to receive communications electronically is encouraged by ALE.
Please contact the registry if you have any questions about your holding or payments.
ALE has established a distribution reinvestment plan. Details of the plan are available on the ALE website.
Stapled security distributions are paid twice yearly, normally in March and September.
Securityholders may nominate a bank, building society or credit union account for payment of distributions by direct credit. Payments are electronically credited on the payment dates and confirmed by mailed advice.
Securityholders wishing to take advantage of payment by direct credit should contact the registry for more details and to obtain an application form.
The ALE Property Group (ALE) is listed on the Australian Securities Exchange (ASX). Its stapled securities are listed under ASX code: LEP.
Custodian (of Australian Leisure and Entertainment Property Trust)
Accompanying the final stapled security distribution payment, normally in September each year, will be an annual tax statement which details the tax components of the year's distribution.
Page 38 Australian Leisure and Entertainment Property Management Limited
For
per
sona
l use
onl
y

GEPPS CROSS HOTEL, ADELAIDE SA
For
per
sona
l use
onl
y

For
per
sona
l use
onl
y

REGISTERED OFFICELevel 10, Norwich House6 O’Connell StreetSydney NSW 2000Telephone (02) 8231 8588
COMPANY SECRETARYMr Michael ClarkeLevel 10, Norwich House6 O’Connell StreetSydney NSW 2000Telephone (02) 8231 8588
REGISTRYComputershare InvestorServices Pty LtdReply Paid GPO Box 7115Sydney NSW 2000Level 3, 60 Carrington StreetSydney NSW 2000Telephone 1300 302 429Facsimile (02) 8235 8150www.computershare.com.au AUDITORSKPMGLevel 38Tower 3International Towers, Sydney300 Barangaroo AvenueSydney NSW 2000
For more information visit our 2018 Annual Review website
Review our properties online
Visit us online today
aleproperty2018.reportonline.com.au
aleproperties.com.au
alegroup.com.au
For
per
sona
l use
onl
y


![[XLS] · Web viewnic ord egov.o nice systems adr rep 1 ord nice.o nicholas financial ord nick.o ... pdf solutions ord pdfs.o pdi ord pdii.o pdl biopharma ord pdli.o peabody energy](https://img.pdfslide.net/doc/110x75/5aa5a2747f8b9a7c1a8daa6b/xls-viewnic-ord-egovo-nice-systems-adr-rep-1-ord-niceo-nicholas-financial-ord.jpg)