Embed Size (px)
Citation preview

�
Annual Report 2008
For
per
sona
l use
onl
y
Contents
About Orica 1
Chairman’s Report 2
Managing Director’s Report 3
Review of Operations and Financial Performance 4
Review of Business Segment Performance 8
Board Members 12
Group Executive Team 13
Corporate Governance 14
Sustainability 18
Financial Report 19
Director’s Report 21
Remuneration Report 24
Lead Auditor’s Independance Declaration 38
Income Statements 39
Statements of Recognised Income and Expense 40
Balance Sheets 41
Statements of Cash Flows 42
Notes to the Financial Statements 43
Director’s Declaration on the Financial Report set out on pages 39 to 120 121
Auditor’s Report 122
Shareholder’s Statistics 124
Ten Year Financial Statistics 126
Shareholder Information 128
Orica Limited ABN 24 004 145 868
For
per
sona
l use
onl
y
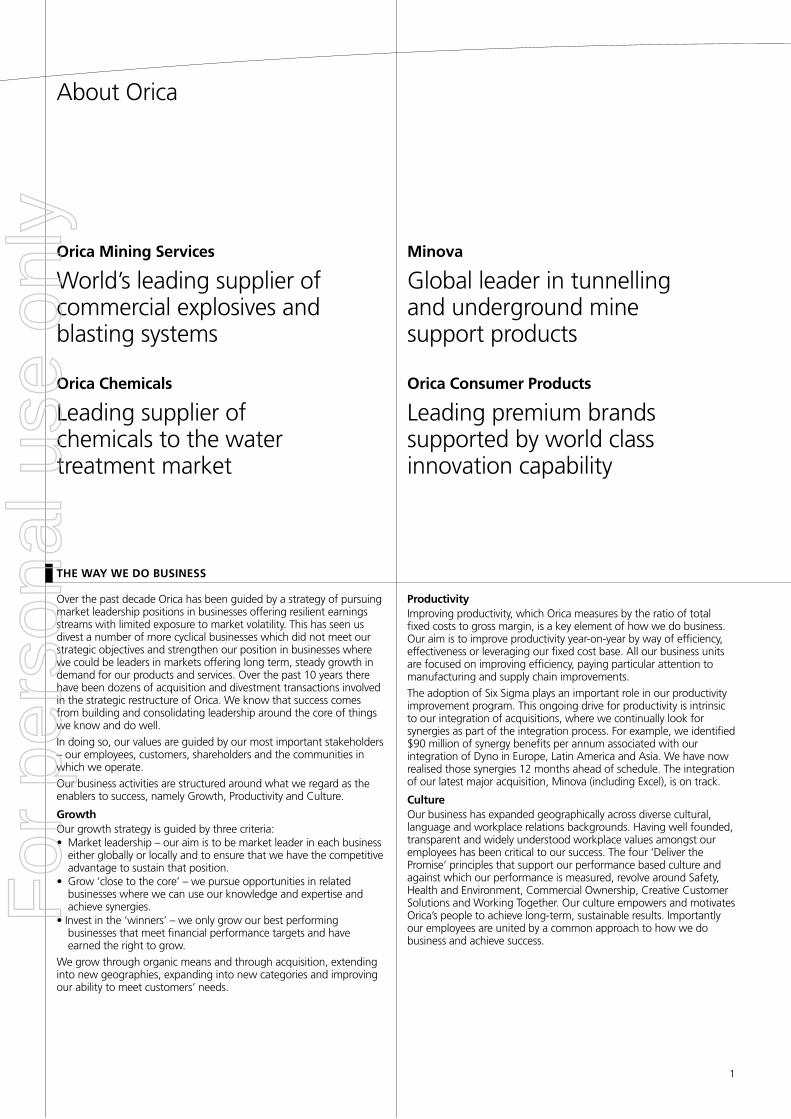
About Orica
Over the past decade Orica has been guided by a strategy of pursuing market leadership positions in businesses offering resilient earnings streams with limited exposure to market volatility. This has seen us divest a number of more cyclical businesses which did not meet our strategic objectives and strengthen our position in businesses where we could be leaders in markets offering long term, steady growth in demand for our products and services. Over the past 10 years there have been dozens of acquisition and divestment transactions involved in the strategic restructure of Orica. We know that success comes from building and consolidating leadership around the core of things we know and do well.
In doing so, our values are guided by our most important stakeholders – our employees, customers, shareholders and the communities in which we operate.
Our business activities are structured around what we regard as the enablers to success, namely Growth, Productivity and Culture.
Growth Our growth strategy is guided by three criteria:• Market leadership – our aim is to be market leader in each business
either globally or locally and to ensure that we have the competitive advantage to sustain that position.
• Grow ‘close to the core’ – we pursue opportunities in related businesses where we can use our knowledge and expertise and achieve synergies.
• Invest in the ‘winners’ – we only grow our best performing businesses that meet financial performance targets and have earned the right to grow.
We grow through organic means and through acquisition, extending into new geographies, expanding into new categories and improving our ability to meet customers’ needs.
Productivity Improving productivity, which Orica measures by the ratio of total fixed costs to gross margin, is a key element of how we do business. Our aim is to improve productivity year-on-year by way of efficiency, effectiveness or leveraging our fixed cost base. All our business units are focused on improving efficiency, paying particular attention to manufacturing and supply chain improvements.
The adoption of Six Sigma plays an important role in our productivity improvement program. This ongoing drive for productivity is intrinsic to our integration of acquisitions, where we continually look for synergies as part of the integration process. For example, we identified $90 million of synergy benefits per annum associated with our integration of Dyno in Europe, Latin America and Asia. We have now realised those synergies 12 months ahead of schedule. The integration of our latest major acquisition, Minova (including Excel), is on track.
Culture Our business has expanded geographically across diverse cultural, language and workplace relations backgrounds. Having well founded, transparent and widely understood workplace values amongst our employees has been critical to our success. The four ‘Deliver the Promise’ principles that support our performance based culture and against which our performance is measured, revolve around Safety, Health and Environment, Commercial Ownership, Creative Customer Solutions and Working Together. Our culture empowers and motivates Orica’s people to achieve long-term, sustainable results. Importantly our employees are united by a common approach to how we do business and achieve success.
THE WAY WE DO BUSINESS
Global leader in tunnelling and underground mine support products
Minova
Leading supplier of chemicals to the water treatment market
Orica Chemicals
Leading premium brands supported by world class innovation capability
Orica Consumer Products
World’s leading supplier of commercial explosives and blasting systems
Orica Mining Services
1
For
per
sona
l use
onl
y
2
I am pleased to report that this year your company continued to grow and achieve excellent results.
In an eventful year for Orica and in the face of quite challenging market conditions, your company’s underlying earnings for the year improved with net profit after tax and before significant items up 15% on the full year result for 2007 to a record $572 million. Net profit after tax and significant items was up by 11% to $540 million from the previous year.
The Board has declared a final dividend of 55 cents per share, franked at 20 cents per share. This brings the total dividend for the year to 94 cents per share, an increase of 6% on the 2007 dividend.
This is Orica’s seventh year of consecutive profit growth and the achievement was company wide with each of our business divisions achieving record profits.
In July, the Board announced its intention to demerge the Consumer Products business so that it could pursue its own strategic path away from the shadow of the larger mining services businesses. However, due to extreme volatility in equity and financial markets the Board decided in November 2008 to defer the demerger indefinitely. The opportunity will surely recur.
Consumer Products’ strength as a stand alone business is once again evident in its 2008 performance. In the face of subdued market conditions the business achieved a record result and increased its market share. Investment in our brands, new product innovation and a strong commitment to customer service have driven record sales growth. The business also expanded its presence in Asia with the most recent acquisition of Sopel based in Shanghai, China.
Orica continues to focus its business on the mining, infrastructure and, to a lesser extent, chemicals sectors. This is part of a very deliberate journey, begun almost a decade ago, towards a business portfolio exposed to sectors offering steady, above GDP growth with limited exposure to the volatility of
commodity cycles. Along the way we have consciously sought and achieved leadership positions in our chosen markets.
During the year we completed the acquisition of Strata Control Systems in Australia and the US based Excel Mining Systems. Both are now an integral part of the Minova business platform which has been further complemented by some smaller bolt-on acquisitions in Europe and Africa. Minova is the global leader in strata control products for the mining, tunnelling and civil infrastructure industries. As a leader with global scale, the business is well positioned to take advantage of the gradual trend towards underground mining and the increased focus on safety, particularly in the emerging markets of China and Eastern Europe, where it is experiencing strong growth. The business is already proving a valuable addition to the Orica portfolio and is meeting our expectations with earnings growth achieved during the year.
The Mining Services business achieved record results across all regions reflecting strong volumes and ongoing firm demand for ammonium nitrate. Our exposure to the volume side of mining rather than commodity prices has produced a relatively resilient earnings stream and, although likely to be tested, has us well positioned for ongoing growth in the face of some challenging market conditions. This very good result was assisted by the successful integration of the former Dyno Nobel businesses, a full 12 months ahead of schedule, and achieving synergies in excess of the $90 million target.
The Chemicals division is a global leader in the supply of sodium cyanide to the gold mining sector and this year achieved record earnings. Strategic investments, including increased capacity at our Yarwun plant, have allowed us to take advantage of strong demand for sodium cyanide.
Your Board remains confident that the strategic path taken in the past decade has positioned Orica so that demand for its products and expertise will grow steadily.
Prudent management of our balance sheet remains a priority. We remain committed to retaining a BBB+ rating. Following the successful $900 million capital raising completed in August 2008, at year end Orica had more than $2 billion in un-drawn bank debt facilities. This provides financial flexibility to pursue growth opportunities and to take advantage of the privileged competitive positions we have developed in each of our businesses.
In 2008, earnings per share (EPS) before significant items increased 14% over the 2007 full year to $1.70. This is the seventh consecutive year of EPS growth.
As in previous years, I would like to take this opportunity on behalf of the Board to thank Orica’s employees, each of whom has worked hard to achieve outstanding results despite some headwinds. By empowering our employees to succeed and rewarding them accordingly, we have been able to recruit and retain talented people at all levels of the company.
Our growth strategy combined with strict financial discipline, steered by a high calibre workforce, gives us confidence that we can provide superior rewards to our shareholders over time.
Don Mercer Chairman
Chairman’s Report
For
per
sona
l use
onl
y
�
This year Orica delivered its seventh consecutive year of underlying profit growth with all of our business platforms achieving at least double digit growth. This strong result was achieved despite some challenging market conditions during 2008, including unfavourable foreign exchange movements and rising input costs.
Orica Mining Services achieved a record result with earnings up 11% to $6�6 million. This reflected record earnings growth in all regions as a result of increasing volumes and benefits from increasing ammonium nitrate prices. Sales growth for the year was 14%, taking it to $�.6 billion. The former Dyno Nobel businesses are now embedded within Orica and have delivered in excess of their synergy targets a full 12 months ahead of schedule.
This successful integration model is now being used to incorporate the Minova business into Orica and we are on track to achieve our targeted synergies of $45 million. I’m pleased to report that Minova, which now includes Excel Mining Systems, has made a very good contribution in its first full year under Orica ownership. This year we continued on our growth path with the completion of the acquisition of Strata Control Systems. As a leading provider of underground support systems to the tunnelling and mining markets, this business is highly complementary to our recently acquired Minova and Excel businesses.
In July 2008 we took the decision to combine the former Chemical Services and Chemnet platforms into one single Chemicals business platform. We believe this will deliver improved customer service, increased efficiency and improved productivity. The combined Chemicals platform increased its earnings by 15% to a record $146 million and achieved sales of $1.4 billion. A record result for the Mining Chemicals division was driven by strong demand globally for sodium cyanide and the benefit of increased capacity at the recently expanded Yarwun plant. We also saw continued growth in the MIEX® water treatment business and stronger volumes in Chemnet’s bulk chemicals business.
Orica Consumer Products performed strongly this year achieving record earnings growth in relatively subdued market conditions. Sales grew 6% to $875 million and underlying earnings grew to a record $12� million. Perhaps most pleasingly, strong investment in brands, innovation and customer service saw market share increase across each of our consumer products divisions. The Yates restructure has delivered positive results.
This year Orica continued its strategic growth path. Combined with a relentless drive for productivity, it has delivered ongoing profit growth. Each of our businesses is accountable for delivering year-on-year productivity improvements and this year has been no exception.
A strong focus on productivity improvement is supported by our high performance culture where people are rewarded for ‘finding a better way’ to achieve solutions that best meet our customers’ needs. Another key ingredient to these good results is strong financial discipline and, particularly pleasing this year, is the excellent cash performance. Cash flow from operating activities was up by 41% as a result of business profit growth and very good discipline across all of our businesses in managing working capital. Orica employees understand that maintaining this focus is important for our future growth prospects.
As our operations around the world have grown, our commitment to an injury-free workplace has stayed constant. We continue our journey towards the goal of ‘no injuries to anyone, ever’ and we investigate every incident to ensure that we take corrective action to prevent a recurrence.
I am saddened at the tragic death of one of our valued employees in a motor vehicle accident in Malaysia in November 2008. The impact of this on friends, family and colleagues is immeasurable.
The focus on sustainability is long standing and more important than ever. Many of our operations are energy and resource intensive and we have set ourselves challenging hurdles towards becoming a business that does no harm to people or the environment. We monitor greenhouse gas emissions, water use, waste production and energy use. It is pleasing that we have met our targets in all of these areas in 2008.
An important part of our environmental commitment is remediating the damage done at our sites from past manufacturing practices. The groundwater treatment plant at Botany continues to operate at a level well in excess of that required to contain
the contaminated plume. Recycled water is being used by our own plant at Botany and some neighbouring operations. We continue to pursue options to export the store of hexachlorobenzene to specialised destruction facilities in Europe. Even though this has taken longer than anticipated, we remain confident of a satisfactory resolution.
Orica would not be what it is today without the talented people employed at all levels of the organisation and I thank them for their invaluable contribution. Recruitment, professional development and talent management programmes are very important to our ongoing success and are best reflected in our succession planning.
Since my last report there have been several changes within the Group Executive team. Andrew Coleman, General Manager Chemicals, has retired. Greg Witcombe, previously Orica’s General Manager, People and the Community, has been appointed to this role. I would like to welcome Michael Reich who earlier in the year was appointed CEO of Minova and Craig Elkington who has been appointed President of Orica Mining Services, North America.
Despite some market uncertainty, Orica has continued to deliver record results. We are confident that the strategy of building on our strengths, pursuing opportunities in markets offering relatively stable long term growth – combined with very strong financial discipline – will deliver continued success and superior value to our shareholders. I look forward to the next opportunity to update you on Orica’s progress.
Graeme Liebelt Managing Director and Chief Executive Officer 10 November 2008
PostscriptEffective 1� November 2008, Philippe Etienne, CEO of Orica Mining Services, stepped down from his position due to illness and John Beevers, previously General Manager of OMS Australia and Asia, has taken over this position.
Managing Director’s Report
For
per
sona
l use
onl
y

4
Review of Operations and Financial Performance
Net profit after tax (NPAT) and significant items for the year ended �0 September 2008 was up 11% to $540M, compared with the previous corresponding period (pcp) of $488M. The loss on significant items was $�2.7M ($10.1M loss in the pcp).
Orica’s net profit after tax before significant items of $572M was up 15% compared with the pcp.
FINANCIAl HIGHlIGHTS• Sales revenue up 18% to $6.5B. Underlying
sales growth was 14% (excluding major acquisitions and divestments).
• EBIT up 19% to $970M (1).
• Earnings per ordinary share (1) up 14% to $1.70.
• Post the rights issue, return on shareholders’ funds (1) at 16.9% is down from 19.2% the pcp.
• Gearing (2) at 19.1%, down from ��.2% in the pcp.
• Final ordinary dividend is 55 cents per share (cps) – franked at 20 cps. Total ordinary dividend for 2008 is 94 cps, an increase of 6% over the pcp (89 cps).
(1) Before significant/individually material items. (2) Net debt/(net debt + book equity).
BUSINESS HIGHlIGHTS • Record result in Mining Services with EBIT up
11% to $6�6M, reflecting earnings growth in most regions from increasing volumes, benefits from increasing ammonium nitrate (AN) prices and the successful integration of the former Dyno Nobel businesses.
• Minova EBIT was 144% ahead of the pcp at $150M driven by underlying growth and a full years earnings contribution from Minova (nine months pcp) as well as earnings from Excel Mining Systems LLC (Excel) from November 2007 in line with expectations.
• Record performance in Consumer Products with EBIT up 21% to $12�M driven by increasing market share in Australia due to continuing investment in our brands and productivity.
• The record result for Chemicals of $146M (comprised of Chemical Services and Chemnet) was 15% ahead of last year, with a record result in Mining Chemicals in firm market conditions for sodium cyanide, and improving volumes in Watercare and Chemnet’s bulk chemicals businesses.
• Earnings for business platforms were adversely impacted by net unfavourable foreign exchange movements totalling $�8M.
OUTlOOk – 2009• Orica’s businesses have performed strongly
and we are confident they will continue to do so. Accordingly, Group net profit (before significant items) in 2009 is expected to be higher than that reported in 2008. This is subject to global economic conditions and particularly their impact on demand in developing nations.
REvENUESales revenue increased by $1.0B (+18%) to $6.5B. Major items were:• Revenue (excluding major acquisitions and
divestments) of $6.�B improved $780M (+14%), driven primarily by:
– ongoing growth in Mining Services due to firm demand in most regions, increasing AN prices from both increasing market prices and pass through of rising input costs;
– a full 12 month contribution from the Minova businesses (nine months in the pcp);
– market share increases for Consumer Products in Australia;
– increased volumes and firm market conditions for sodium cyanide and watercare products and an improvement across most Chemnet businesses; and
– partly offset by unfavourable movements in exchange rates of $247M.
• Sales revenue from the acquired Excel business was $275M.
• Sales revenue of the divested Adhesives and Resins (A&R) in the pcp was $�8M.
• Other income decreased $7.7M on the pcp reflecting the profit on sale of the A&R business in the pcp.
EARNINGS BEFORE INTEREST AND TAx (EBIT)• Total EBIT increased 19% to $970M
(pcp: $81�M) primarily due to: – improvement in earnings from Mining
Services of $61M (11%) to a record $6�6M, reflecting growth in all regions, benefits from improved AN pricing and generally favourable trading conditions;
– underlying growth and a full 12 month contribution from Minova, increasing earnings by $�4M and a net incremental EBIT from Excel of $56M; and
– record earnings in Consumer Products (market share, margin and productivity) and Chemicals (volume and margin).
Partly offset by: – a net negative impact from unfavourable
foreign exchange rates of $�8M; and – increased Corporate and Support costs
of $�1M mainly due to a discretionary one-off bonus for all employees ($15M), cost of the preference share buy-back ($8M) and a break even insurance result (pcp – gain of $9M).
INTEREST • Net interest expense of $158M increased
by $�5M from the pcp, mainly due to: – higher average net debt levels ($66M)
and higher average interest rates ($1M); offset by
– interest income includes $24M from income on the Excel net investment hedge (closed out during the financial year) and favourable foreign exchange impacts ($8M).
• Interest cover was 6.1 times (pcp 6.6 times).
TAx• Tax expense was $212M with an effective
tax rate of 26.1% (pcp: 24.1%). The higher effective rate was primarily as a result of a proportional movement in earnings to countries with higher tax rates and lower favourable adjustments compared with prior years.
NET PROFIT• Net profit after tax before significant items
increased 15% to $572M (pcp: $498M).
• Net profit after tax and significant items was up 11% to $540M (pcp: $488M).
SIGNIFICANT ITEMS• Significant items for the period resulted in a
loss after tax of $��M (pcp: loss of $10M). Major items in the current period related to the restructuring of the Chemicals business ($14.7M) and the ongoing integration of Dyno Nobel ($9M) and Minova/Excel ($9M).
DIvIDEND• Directors have increased the final ordinary
dividend by 6% to 55 cps (pcp: 5� cps) – franked at 20 cps; and
• Franking capacity in the near term is forecast not to exceed 40%.
BANk DEBT REFINANCING• In addition to the successful refinancing in
December 2007, Orica has recently extended $1.0B of its bank debt facilities until October 2009.
• A further total of $1.1B of bank debt facilities have maturity dates in December 2010 and 2012.
• Following the rights issue, no bank debt was drawn under any of the above facilities at year end.
• The facilities are multi currency, flexible and cancellable at Orica’s option.
• Facility costs on the 1 year facility have increased by approximately 45 bps in line with current market conditions. Facility costs on the 2 year and 4 year tranches remain unchanged.
For
per
sona
l use
onl
y

5
MERGERS & ACqUISITIONS, DEvElOPMENT• The purchase of Excel for approximately
$781M was completed on 26 October 2007.
• Minova acquired Strata Control Systems (SCS) in May 2008 and in the September quarter has acquired more small complementary bolt-on businesses in Africa, Germany and Poland.
• Mining Services is progressing well on the development of the �00ktpa AN manufacturing facility in Bontang, Indonesia with cumulative spend to date of $76M.
• Given the tight market conditions, other AN expansion options continue to be progressed.
• Mining Services announced the Nanling Initiating Systems JV in China with a new plant expected in 2010, a JV with Southwest Energy in the USA and the acquisition of an additional 49% interest (taking Orica’s interest to 99%) in Samex, an explosives distribution business in Peru (to be completed in November 2008).
• Consumer Products has made steady progress in developing a business in China and in November 2008 acquired Sopel, a small decorative coatings company.
• Chemical Services’ Watercare division continues to successfully work on the commercialisation of new technologies with MIEX® and Advanced Water Treatment’s product and services offerings continuing to gain market acceptance.
BAlANCE SHEET• Key balance sheet movements since
September 2007 were: – the increase in trade working capital
(TWC) was $87M from the pcp, partly due to the impact of the acquisition of Excel ($26M) and the impact of FX translation on TWC ($44M). An increase in underlying TWC due to business growth was offset by improvement in TWC management;
– rolling TWC to sales has marginally improved to 14.5% (pcp: 14.6%);
– net property, plant and equipment (PP&E) is $�09M up on the pcp mainly due to increased spend on growth projects. Of significance, Mining Services growth projects including Bontang ($68M), EBS project at Brownsburg ($22M) and Emirates plant relocation ($10M); Chemnet sulphuric acid storage tanks in Darwin ($20M); new OCP powder coatings site ($12M) and Gladstone caustic soda storage tanks ($12M). Additionally, acquisitions including Excel, contributed $�7M and foreign exchange translation increased PP&E by $�1M;
– intangible assets are up $957M mainly due to the acquisition of Excel ($747M), other acquisitions ($69M) and impact of foreign exchange translation to intangible assets ($171M) offset by amortisation of $41M;
– net other liabilities decreased by $52M mainly due to the mark to market of net derivative assets ($50M), net provision movements ($27M) and an increase in prepayments ($26M), partly offset by an increase in non-trade creditors ($41M);
– net debt decreased by $285M as a result of operating cash flows and proceeds from the rights issue offset by the acquisition of Excel and various growth projects;
– Orica shareholders equity increased by $1,655M, mainly due to an increase in share capital of $1,179M (primarily from the rights issue ($885M) and shares issued from the underwritten Orica Dividend Reinvestment Plan (DRP) ($286M)). Other contributing factors include an increase in retained earnings ($196M) and an increase in the foreign currency translation reserve ($26�M); and
– minority interests have increased by $�6M due to capital contributions and higher business profits offset by dividends paid.
• Key balance sheet movements since March 2008 were:
– TWC decreased by $87M, largely due to a focused effort. TWC to sales improved to 14.5% from 14.9%;
– net property, plant and equipment is up $211M mainly due to acquisitions ($15M), ongoing development of Bontang ($46M), the EBS project at Brownsburg ($14M), new powder coatings site ($12M), Gladstone caustic soda storage ($12M) and foreign exchange translation adjustment ($�2M);
– intangible assets increased by $206M, mainly arising from acquisitions ($49M) and foreign exchange translation impacts on intangibles ($174M) offset by amortisation of $21M; and
– net debt decreased by $1,164M primarily due to funds flowing from the rights issue ($885M). Other contributing factors include dividend payments replaced by shares issued from the underwritten Orica DRP ($12�M) and a reduction in trade working capital requirement ($87M).
GEARING• Post the successful rights issue, accounting
gearing (net debt/(net debt + equity)) decreased to 19.1% from ��.2% in September 2007. In accordance with accounting standards, the Step-Up Preference Securities (SPS) are recognised as equity.
• Adjusted gearing, which treats the SPS as 50% equity and 50% debt (Standard & Poors credit rating treatment), was 2�.8% (pcp �9.6%).
CASH FlOW • Net operating cash inflows increased by
$21�M to $7�7M, compared with the pcp mainly due to:
– EBITDA growth of $19�M to $1,189M (pcp $996M);
– a reduction in non-trade working capital outflows of $89M, partly due to reduced spend, in comparative terms, on environmental, restructuring and decommissioning provisions ($27M), an increase in non-trade creditors and foreign exchange movements; and
– a reduction in trade working capital outflows of $19M.
Partly offset by: – $40M increase in interest paid, mainly
due to the higher net average debt level during the year following the acquisition of Excel; and
– $49M increase in income tax paid due to earnings growth and the timing of payments.
• Net investing cash outflows of $1,270M increased by $98M from $1,172M in the pcp. The increase was mainly due to:
– $98M reduction in proceeds from surplus asset sales and businesses. The pcp inflow was mainly due to the Adhesives and Resins divestment; and
– increased capital spending of $89M.
Partly offset by: – $89M decreased spending on
acquisitions, with the current period spending mainly due to the Excel acquisition and various smaller bolt-on acquisitions. The pcp cash outflow was mainly attributable to the Minova acquisition.
• Net financing cash inflows increased by $440M to $465M mainly due to:
– proceeds from share issues including underwritten DRP ($1,069M);
– there was no share buyback program in the current year ($115M in pcp);
– cash dividends paid to Orica shareholders decreased by $97M primarily due to an increase in the Orica DRP acceptance rate; and
– a reduction of $�2M for shares required for the LTEIP (Long Term Executive Incentive Plan) program. In the current period, new shares were issued to satisfy the majority of LTEIP requirements whereas in the pcp, shares were acquired on market.
Partly offset by: – a reduction in borrowings of $�90M.
Review of Operations and Financial Performance
For
per
sona
l use
onl
y
6
Review of Operations and Financial Performance
ORICA STEP-UP PREFERENCE SECURITIES (SPS)• Two further distributions on the SPS were
paid during the period totalling $41.5M.
• The distributions are unfranked and the distribution rate is calculated as the sum of the 180 Bank Bill Swap Rate (BBSW) plus a margin of 1.�5%. The distribution rate for the current period ending 29 November 2008 is 9.�8%.
STRATEGYOrica’s strategy for sustainable profit growth and strong return on investment is driven by three fundamental rules:• securing market leadership positions in
its chosen growth markets. This enables the Company to better service customers, develop and retain technological advantage and achieve benefits of scale;
• growing only those businesses that have “earned the right to grow”; and
• growing “close to the core”.
We are disciplined in assessing growth opportunities against our strict financial criteria (including 18% RONA in the third full year of operation/ownership) and by performing thorough due diligence.This strategy has been successful and a key part of delivering seven years of profit growth. It is a relatively low risk approach that has the potential to produce superior returns for shareholders in the longer term.
2008 REvIEW OF INITIATIvESWe were pleased to have successfully completed our $900M capital raising in August this year.
As a result of this injection of funds and the ongoing focus on operating cash generation from our businesses, Orica has a very strong balance sheet and is well poised for investment in growth opportunities as they emerge over the coming years.
Orica has seen profit growth coming from four key areas: • industry and organic growth; • productivity improvement; • expansion capital expenditure; and• smaller scale “bolt-on” mergers and
acquisitions (M&A).
The emphasis has been on investing in initiatives that play to our businesses’ competitive advantages.
Given the significant large scale M&A activity over the past two years, we have predominantly been in a period of consolidation.
Mining Services (OMS): • OMS continues to leverage its position
as the pre-eminent global commercial explosives player and has a number of significant growth opportunities ahead.
• With increasing global demand for ammonium nitrate (AN) and a tightening supply side position, OMS has three large scale organic AN growth projects in the pipeline. OMS has already announced the commencement of construction of a �00 ktpa AN plant in Bontang, Indonesia. This project is progressing to plan and we have invested approximately $76M thus far. Market demand in Indonesia is already in excess of the plant’s capacity.
• Two other large scale AN projects are currently in development or concept phase. At our integrated (natural gas feedstock) AN plant at Kooragang Island, NSW, we have lodged the appropriate planning applications for a brownfield expansion. Secondly, a feasibility study is progressing on the concept of establishing a greenfield (ammonia feedstock) AN plant in Latin America, most likely in Peru. We expect to be in a position to move to the development phase during 2009.
• On a smaller scale, OMS will continue to invest in growing the business organically as its customers increase output, adopt new technologies and open new mines. For example, to support the growth of new technologies, we completed the uprate of the Electronic Blasting Systems (EBS) plant at Brownsburg, Canada for a total investment of $42M.
• Having established a strong track record of successfully integrating businesses, OMS will continue to pursue strategic joint ventures and small bolt-on acquisitions. In the current year we announced the establishment of the Nanling Initiating Systems JV in China (April), entered into a 50/50 JV with South West Energy, a distributor in the USA at the end of September and acquired 49% of the Samex explosives distribution business in Peru (to be completed in November 2008).
Minova: • To complement the acquisition of Minova,
on 26 October 2007, Orica completed the acquisition of Excel Mining Systems LLC (Excel). Excel is the leading supplier of metal based strata reinforcement products for underground mining in the USA.
• The integration of Minova/Excel is progressing to plan and we are confident we have the right management team in place to deliver on productivity, combined product offering (resin and steel) and geographic growth opportunities that exist.
• Minova completed the acquisition of Strata Control Systems in Australia (May 2008), recently acquired two small steel bolt producers, Arnall in Poland and BWZ in Germany and has entered a global distribution agreement with Atlas Copco.
Chemicals: • To enable improved customer service,
reduce duplication of effort and improve productivity in our chemicals businesses, the Chemnet and Chemical Services divisions were combined in July.
• Plans have been developed that will deliver annual EBIT improvement of approximately $14M by 2010 at an after tax cost of approximately $15M (significant items in 2008). A number of these initiatives have already been implemented.
• Chemicals’ Mining Chemicals division continues to pursue growth opportunities with the benefit of last year’s successful 80ktpa sodium cyanide uprate at Yarwun delivered this year. Geographic expansion for sodium cyanide and the potential to uprate Yarwun further continues to be assessed.
• Watercare is successfully introducing its expanded capability in new geographies and downstream water treatment solutions. The commercialisation of MIEX® continues to gather momentum, albeit the geographic extent of the demand required additional investment during 2008.
Consumer Products: • In light of the extreme volatility currently
being experienced in equity and financial markets, on 7 November, Orica announced it has deferred the proposed demerger of Consumer Products indefinitely.
• OCP has been steadily developing a presence in China and in November 2008 acquired a small decorative coatings business, based in Shanghai.
• OCP has maintained its leadership position in Australia and New Zealand and continues to invest in brands and research and development.
Corporate Centre & Support Costs• Corporate Centre costs of $46M were $7M
higher than the pcp mainly due to the costs of the cancellation of the 5% preference shares ($8M).
• Other support costs of $�8M were $24M higher than the pcp, primarily due to the costs associated with a discretionary one-off bonus for all Orica employees globally ($15M) and the prior year including a positive insurance result of $9M (the current year was break even after costs associated with the incident in Mexico in September 2007).
For
per
sona
l use
onl
y
7
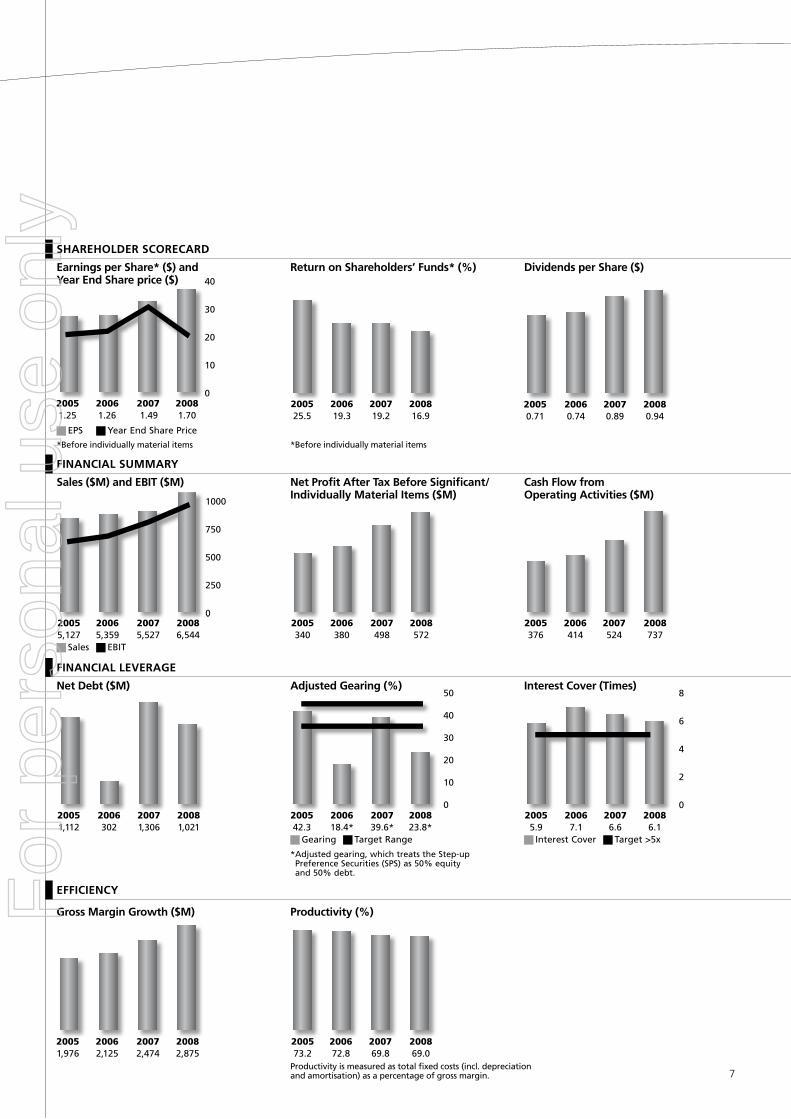
Earnings per Share* ($) and Year End Share price ($)
Return on Shareholders’ Funds* (%) Dividends per Share ($)
Sales ($M) and EBIT ($M) Net Profit After Tax Before Significant/Individually Material Items ($M)
Cash Flow from Operating Activities ($M)
Net Debt ($M) Adjusted Gearing (%) Interest Cover (Times)
Sales EBIT
Gearing TargetRange InterestCover Target>5x
*Adjustedgearing,whichtreatstheStep-upPreferenceSecurities(SPS)as50%equityand50%debt.
EPS YearEndSharePrice
*Beforeindividuallymaterialitems
SHAREHOlDER SCORECARD
FINANCIAl SUMMARY
FINANCIAl lEvERAGE
Gross Margin Growth ($M) Productivity (%)
EFFICIENCY
*Beforeindividuallymaterialitems
Productivityismeasuredastotalfixedcosts(incl.depreciationandamortisation)asapercentageofgrossmargin.
20051,112
2006 2007 2008302 1,306 1,021
20051,112
2006 2007 2008302 1,306 1,021
200542.3
2006 2007 200818.4* 39.6* 23.8*
0
10
20
30
40
50
200542.3
2006 2007 200818.4* 39.6* 23.8*
0
10
20
30
40
50
200542.3
2006 2007 200818.4* 39.6* 23.8*
0
10
20
30
40
50
20055.9
2006 2007 20087.1 6.6 6.1
0
2
4
6
8
20055.9
2006 2007 20087.1 6.6 6.1
0
2
4
6
8
20055.9
2006 2007 20087.1 6.6 6.1
0
2
4
6
8
20051.25 1.26
2006 2007 20081.49 1.70
0
10
20
30
40
20051.25 1.26
2006 2007 20081.49 1.70
0
10
20
30
40
20051.25 1.26
2006 2007 20081.49 1.70
0
10
20
30
40
200525.5
2006 2007 200819.3 19.2 16.9
200525.5
2006 2007 200819.3 19.2 16.9
20050.71
2006 2007 20080.74 0.89 0.94
20050.71
2006 2007 20080.74 0.89 0.94
2005340
2006 2007 2008380 498 572
2005340
2006 2007 2008380 498 572
2005376
2006 2007 2008414 524 737
2005376
2006 2007 2008414 524 737
20055,127
2006 2007 20085,359 5,527 6,544
0
250
500
750
1000
20055,127
2006 2007 20085,359 5,527 6,544
0
250
500
750
1000
20055,127
2006 2007 20085,359 5,527 6,544
0
250
500
750
1000
20051,976
2006 2007 20082,125 2,474 2,875
20051,976
2006 2007 20082,125 2,474 2,875
200573.2
2006 2007 200872.8 69.8 69.0
200573.2
2006 2007 200872.8 69.8 69.0
For
per
sona
l use
onl
y
8
Review of Business Segment Performance
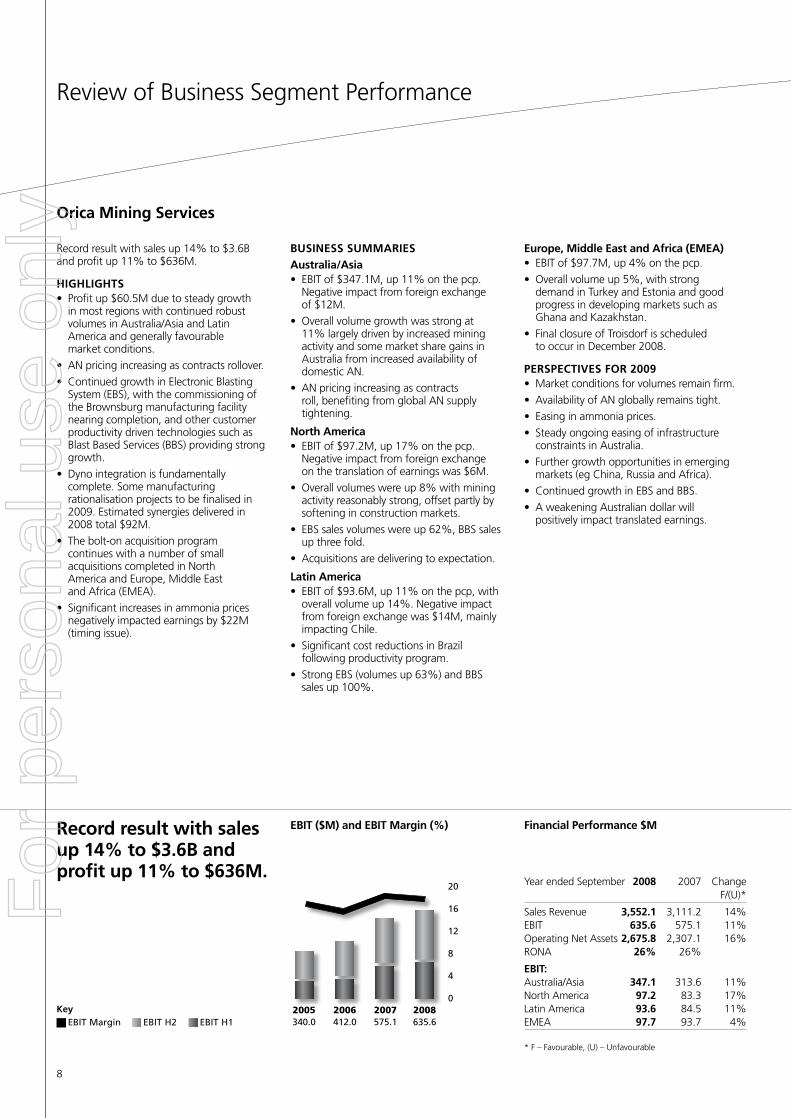
Record result with sales up 14% to $�.6B and profit up 11% to $6�6M.
HIGHlIGHTS• Profit up $60.5M due to steady growth
in most regions with continued robust volumes in Australia/Asia and Latin America and generally favourable market conditions.
• AN pricing increasing as contracts rollover.
• Continued growth in Electronic Blasting System (EBS), with the commissioning of the Brownsburg manufacturing facility nearing completion, and other customer productivity driven technologies such as Blast Based Services (BBS) providing strong growth.
• Dyno integration is fundamentally complete. Some manufacturing rationalisation projects to be finalised in 2009. Estimated synergies delivered in 2008 total $92M.
• The bolt-on acquisition program continues with a number of small acquisitions completed in North America and Europe, Middle East and Africa (EMEA).
• Significant increases in ammonia prices negatively impacted earnings by $22M (timing issue).
BUSINESS SUMMARIES
Australia/Asia• EBIT of $�47.1M, up 11% on the pcp.
Negative impact from foreign exchange of $12M.
• Overall volume growth was strong at 11% largely driven by increased mining activity and some market share gains in Australia from increased availability of domestic AN.
• AN pricing increasing as contracts roll, benefiting from global AN supply tightening.
North America• EBIT of $97.2M, up 17% on the pcp.
Negative impact from foreign exchange on the translation of earnings was $6M.
• Overall volumes were up 8% with mining activity reasonably strong, offset partly by softening in construction markets.
• EBS sales volumes were up 62%, BBS sales up three fold.
• Acquisitions are delivering to expectation.
latin America• EBIT of $9�.6M, up 11% on the pcp, with
overall volume up 14%. Negative impact from foreign exchange was $14M, mainly impacting Chile.
• Significant cost reductions in Brazil following productivity program.
• Strong EBS (volumes up 6�%) and BBS sales up 100%.
Europe, Middle East and Africa (EMEA)• EBIT of $97.7M, up 4% on the pcp.
• Overall volume up 5%, with strong demand in Turkey and Estonia and good progress in developing markets such as Ghana and Kazakhstan.
• Final closure of Troisdorf is scheduled to occur in December 2008.
PERSPECTIvES FOR 2009• Market conditions for volumes remain firm.
• Availability of AN globally remains tight.
• Easing in ammonia prices.
• Steady ongoing easing of infrastructure constraints in Australia.
• Further growth opportunities in emerging markets (eg China, Russia and Africa).
• Continued growth in EBS and BBS.
• A weakening Australian dollar will positively impact translated earnings.
Orica Mining Services
* F – Favourable, (U) – Unfavourable
Record result with sales up 14% to $3.6B and profit up 11% to $636M.
key EBITMargin EBITH2 EBITH1
2005340.0
2006 2007 2008412.0 575.1 635.6
0
4
8
12
16
20
2005340.0
2006 2007 2008412.0 575.1 635.6
0
4
8
12
16
20
2005340.0
2006 2007 2008412.0 575.1 635.6
0
4
8
12
16
20Year ended September 2008 2007 Change
F/(U)*
Sales Revenue 3,552.1 �,111.2 14%EBIT 635.6 575.1 11%Operating Net Assets 2,675.8 2,�07.1 16%RONA 26% 26%
EBIT:Australia/Asia 347.1 �1�.6 11%North America 97.2 8�.� 17%Latin America 93.6 84.5 11%EMEA 97.7 9�.7 4%
EBIT ($M) and EBIT Margin (%) Financial Performance $M
For
per
sona
l use
onl
y

9
Earnings growth continues for Minova with EBIT growth of 144% to $150M.
HIGHlIGHTS• Minova brand has been
adopted worldwide.
• Succession of key management is complete. Global team in place based out of Melbourne.
• Most mining markets continue to have a steady outlook.
• Tunnelling activity has been much stronger in the second half with some significant projects completed by our expert team in Europe.
• Excel was acquired effective 26 October 2007.
• Excel earnings contribution to date (including a stronger second half) and the progress on the integration is in line with expectations.
• Several small bolt-on acquisitions completed.
• Global distribution agreement has been entered into with Atlas Copco.
• Solid growth in earnings continues in emerging markets including the Commonwealth of Independent States (CIS), Africa and China.
• The EBIT result is inclusive of an additional three months from Minova, a one-off negative acquisition stock adjustment of $2M ($7M in the pcp for Minova) and additional amortisation of $1�M.
• Rising steel prices have impacted margins (primarily a timing issue).
BUSINESS SUMMARIES
Minova Americas:• The management structure in the US has
settled since April and sound progress has been made on developing the combined resin/steel product offering for the market as well as looking at productivity initiatives in manufacturing.
• The Cadiz site has been closed and corporate functions have been consolidated in Georgetown, Kentucky.
• A small operation has been established in Canada and the study of the feasibility of entering Latin America is well underway.
Minova Europe:• EBIT growth in Europe came primarily
from the following: – organic growth in mature mining
markets such as Poland and the UK; – improved tunnelling activity in
Switzerland and the Czech Republic; – organic growth in emerging markets
of CIS, Ukraine and Kazakhstan; and – benefits from small complementary
bolt-on acquisitions (steel bolt businesses) in Germany (BWZ) and Poland (Arnall); offset by
– a slowing German coal business and delays in tunnelling projects in Spain.
Australia Pacific and Africa (APA):• Minova Australia improved EBIT in
generally firm conditions.
• Acquisition of Strata Control Systems (SCS), producer of steel bolts for hard rock markets, was completed in May and has contributed slightly ahead of expectation.
• The South African business completed a couple of minor acquisitions which have added much needed scale to its operations.
• Our 55/45 joint venture in China, Ruichy Minova, continues to gather momentum and is successfully penetrating the Chinese resin market. To complement our offering, a steel bolt plant is in the process of being constructed and is expected to be operating in early 2009.
PERSPECTIvES FOR 2009• Demand for resources in emerging
markets including CIS, Eastern Europe, Africa, Latin America and China is positive.
• Further benefit from a combined Orica capability in the tunnelling and mining markets.
• Continuing progress on the integration of acquisitions.
• A weakening Australian dollar will positively impact translated earnings.
Minova
(1) 2007 EBIT excl $7M IFRS acquisition adjs and extrapolated to 12 months. RONA calc incl $�8.6M taxation and financial structuring benefits in 2008
* F – Favourable, (U) – Unfavourable
Earnings growth continues for Minova with EBIT growth of 144% to $150M.
Financial Performance $M
Year ended September 2008 2007 ChangeF/(U)*
Sales Revenue 794.2 ��2.1 1�9%EBIT 150.1 61.6 144%Operating Net Assets 1,873.8 905.6 107%RONA(1) 13.6% 10.1%
For
per
sona
l use
onl
y
10
Review of Business Segment Performance continued
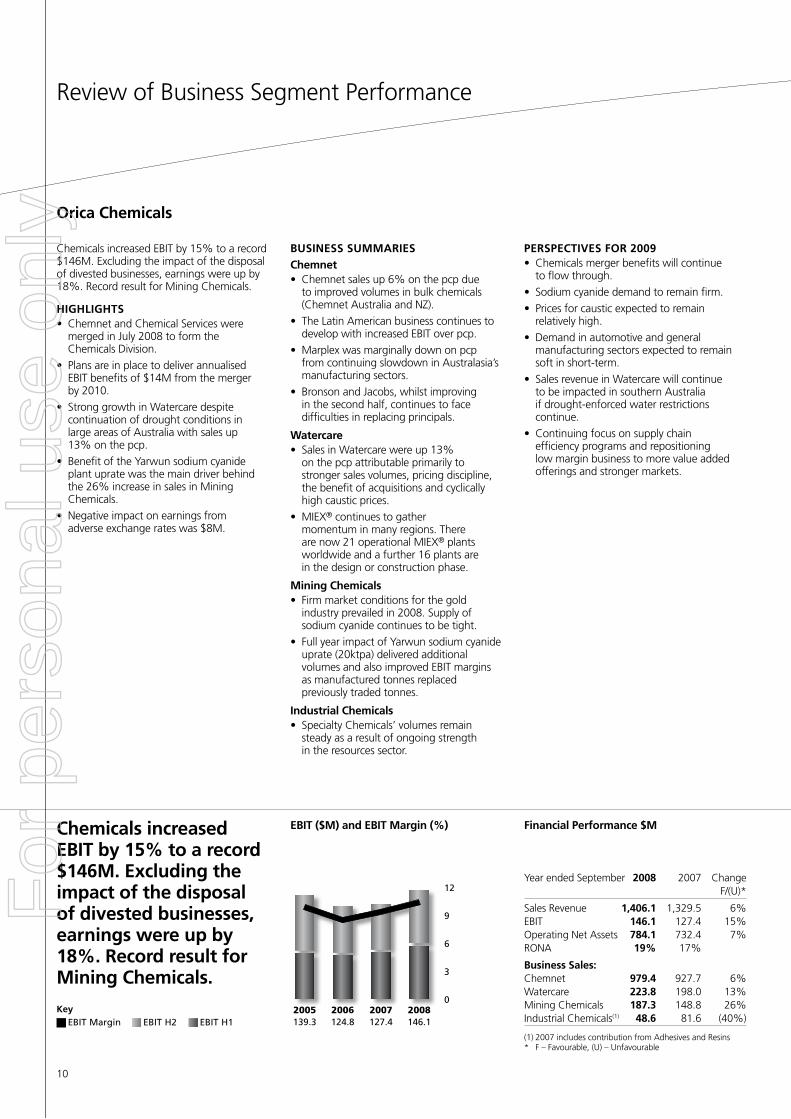
Chemicals increased EBIT by 15% to a record $146M. Excluding the impact of the disposal of divested businesses, earnings were up by 18%. Record result for Mining Chemicals.
HIGHlIGHTS• Chemnet and Chemical Services were
merged in July 2008 to form the Chemicals Division.
• Plans are in place to deliver annualised EBIT benefits of $14M from the merger by 2010.
• Strong growth in Watercare despite continuation of drought conditions in large areas of Australia with sales up 1�% on the pcp.
• Benefit of the Yarwun sodium cyanide plant uprate was the main driver behind the 26% increase in sales in Mining Chemicals.
• Negative impact on earnings from adverse exchange rates was $8M.
BUSINESS SUMMARIES
Chemnet• Chemnet sales up 6% on the pcp due
to improved volumes in bulk chemicals (Chemnet Australia and NZ).
• The Latin American business continues to develop with increased EBIT over pcp.
• Marplex was marginally down on pcp from continuing slowdown in Australasia’s manufacturing sectors.
• Bronson and Jacobs, whilst improving in the second half, continues to face difficulties in replacing principals.
Watercare• Sales in Watercare were up 1�%
on the pcp attributable primarily to stronger sales volumes, pricing discipline, the benefit of acquisitions and cyclically high caustic prices.
• MIEX® continues to gather momentum in many regions. There are now 21 operational MIEX® plants worldwide and a further 16 plants are in the design or construction phase.
Mining Chemicals• Firm market conditions for the gold
industry prevailed in 2008. Supply of sodium cyanide continues to be tight.
• Full year impact of Yarwun sodium cyanide uprate (20ktpa) delivered additional volumes and also improved EBIT margins as manufactured tonnes replaced previously traded tonnes.
Industrial Chemicals• Specialty Chemicals’ volumes remain
steady as a result of ongoing strength in the resources sector.
PERSPECTIvES FOR 2009• Chemicals merger benefits will continue
to flow through.
• Sodium cyanide demand to remain firm.
• Prices for caustic expected to remain relatively high.
• Demand in automotive and general manufacturing sectors expected to remain soft in short-term.
• Sales revenue in Watercare will continue to be impacted in southern Australia if drought-enforced water restrictions continue.
• Continuing focus on supply chain efficiency programs and repositioning low margin business to more value added offerings and stronger markets.
Orica Chemicals
Review of Business Segment Performance
(1) 2007 includes contribution from Adhesives and Resins* F – Favourable, (U) – Unfavourable
EBIT ($M) and EBIT Margin (%) Financial Performance $MChemicals increased EBIT by 15% to a record $146M. Excluding the impact of the disposal of divested businesses, earnings were up by 18%. Record result for Mining Chemicals.
key EBITMargin EBITH2 EBITH1
2005139.3
2006 2007 2008124.8 127.4 146.1
0
3
6
9
12
2005139.3
2006 2007 2008124.8 127.4 146.1
0
3
6
9
12
2005139.3
2006 2007 2008124.8 127.4 146.1
0
3
6
9
12Year ended September 2008 2007 Change
F/(U)*
Sales Revenue 1,406.1 1,�29.5 6%EBIT 146.1 127.4 15%Operating Net Assets 784.1 7�2.4 7%RONA 19% 17%
Business Sales:Chemnet 979.4 927.7 6%Watercare 223.8 198.0 1�%Mining Chemicals 187.3 148.8 26%Industrial Chemicals(1) 48.6 81.6 (40%)
For
per
sona
l use
onl
y
11
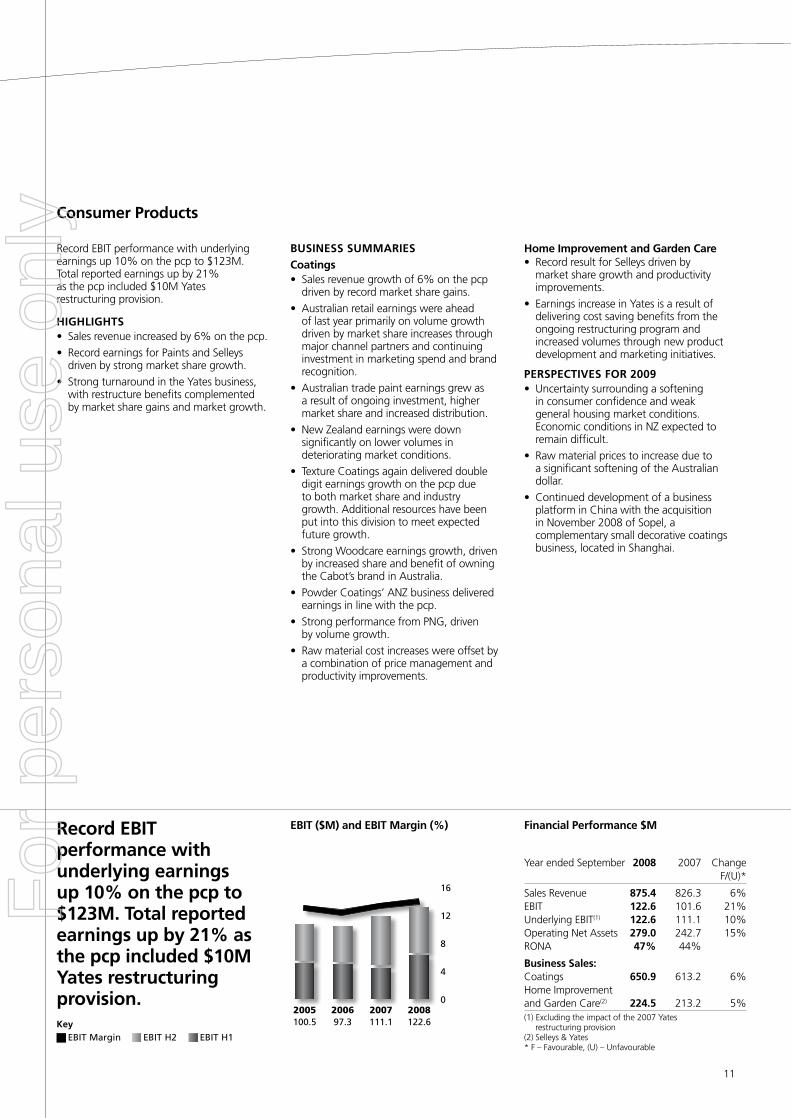
Record EBIT performance with underlying earnings up 10% on the pcp to $12�M. Total reported earnings up by 21% as the pcp included $10M Yates restructuring provision.
HIGHlIGHTS• Sales revenue increased by 6% on the pcp.
• Record earnings for Paints and Selleys driven by strong market share growth.
• Strong turnaround in the Yates business, with restructure benefits complemented by market share gains and market growth.
BUSINESS SUMMARIES
Coatings• Sales revenue growth of 6% on the pcp
driven by record market share gains.
• Australian retail earnings were ahead of last year primarily on volume growth driven by market share increases through major channel partners and continuing investment in marketing spend and brand recognition.
• Australian trade paint earnings grew as a result of ongoing investment, higher market share and increased distribution.
• New Zealand earnings were down significantly on lower volumes in deteriorating market conditions.
• Texture Coatings again delivered double digit earnings growth on the pcp due to both market share and industry growth. Additional resources have been put into this division to meet expected future growth.
• Strong Woodcare earnings growth, driven by increased share and benefit of owning the Cabot’s brand in Australia.
• Powder Coatings’ ANZ business delivered earnings in line with the pcp.
• Strong performance from PNG, driven by volume growth.
• Raw material cost increases were offset by a combination of price management and productivity improvements.
Home Improvement and Garden Care• Record result for Selleys driven by
market share growth and productivity improvements.
• Earnings increase in Yates is a result of delivering cost saving benefits from the ongoing restructuring program and increased volumes through new product development and marketing initiatives.
PERSPECTIvES FOR 2009• Uncertainty surrounding a softening
in consumer confidence and weak general housing market conditions. Economic conditions in NZ expected to remain difficult.
• Raw material prices to increase due to a significant softening of the Australian dollar.
• Continued development of a business platform in China with the acquisition in November 2008 of Sopel, a complementary small decorative coatings business, located in Shanghai.
Consumer Products
(1) Excluding the impact of the 2007 Yates restructuring provision
(2) Selleys & Yates* F – Favourable, (U) – Unfavourable
EBIT ($M) and EBIT Margin (%) Financial Performance $M
Year ended September 2008 2007 Change F/(U)*
Sales Revenue 875.4 826.� 6%EBIT 122.6 101.6 21%Underlying EBIT(1) 122.6 111.1 10%Operating Net Assets 279.0 242.7 15%RONA 47% 44%
Business Sales:Coatings 650.9 61�.2 6%Home Improvement and Garden Care(2) 224.5 21�.2 5%
2005100.5
2006 2007 200897.3 111.1 122.6
0
4
8
12
16
2005100.5
2006 2007 200897.3 111.1 122.6
0
4
8
12
16
2005100.5
2006 2007 200897.3 111.1 122.6
0
4
8
12
16
Record EBIT performance with underlying earnings up 10% on the pcp to $123M. Total reported earnings up by 21% as the pcp included $10M Yates restructuring provision. key EBITMargin EBITH2 EBITH1
For
per
sona
l use
onl
y

12
Board Members
Donald P Mercer BSc (Hons) MA (Econ)
Chairman, Non-Executive Director since October 1997, Chairman since May 2001. Chair of the Board’s Remuneration and Appointments Committee and Corporate Governance and Nominations Committee.
Chairman of Newcrest Mining Limited, Australia Pacific Airports Corporation Limited, Air Liquide Australia Limited and Orchestra Victoria Limited. Former Chairman of Australian Institute of Company Directors Ltd. Former Managing Director and Chief Executive Officer of ANZ Banking Group.
Graeme R liebelt BEc (Hons)
Managing Director and Chief Executive Officer (CEO) since September 2005. Executive Director since July 1997. Member of Corporate Governance and Nominations Committee.
Director of Melbourne Business School Limited. Board member of The Global Foundation. Former CEO of Orica Mining Services, Chairman and Director of Incitec Limited, General Manager of Plastics and Managing Director of Dulux.
Noel A Meehan BSc (Hons), CPA
Executive Director Finance since September 2005. Former Chief Financial Officer of Orica Chemicals, Orica Group Investor Relations Manager and Corporate Reporting Manager.
Prior to joining Orica, he held a variety of finance roles both within Qantas Airways Limited and Australian Airlines Limited.
Michael E Beckett BSc, FIMM, FRSA
Non-Executive Director since July 2002. Member of the Remuneration and Appointments Committee, Corporate Governance and Nominations Committee and the Safety, Health and Environment Committee.
Chairman of Coalcorp Limited and Deputy Chairman of Thomas Cook Group plc. Director of Northam Platinum Limited (South Africa), Mvelaphanda Resources Limited (South Africa), Egypt Trust Limited and Endeavour Mining Capital Corp. Former Chairman of London Clubs International (UK) plc and WBB Minerals Limited.
Peter J B DuncanBChE (Hons) GradDip (Bus)
Non-Executive Director since June 2001. Chairman of the Audit and Risk Committee. Member of the Remuneration and Appointments Committee and Corporate Governance and Nominations Committee.
Chairman of Cranlana Programme Foundation and Scania Australia. Former director of National Australia Bank Limited, GasNet Australia Limited and CSIRO and former member of Siemens Australia Advisory Board. Former Chief Executive Officer of the Shell Group of Companies in Australia.
Garry A Hounsell BBus (Accounting) FCA, CPA, FAICD
Non-Executive Director since September 2004. Member of the Audit and Risk Committee and Remuneration and Appointments Committee.
Chairman of PanAust Limited and Deputy Chairman of Mitchell Communication Group Limited. Director of Qantas Airways Limited and Nufarm Limited. He is also Chairman of Investec Global Aircraft Fund, Prudentia Investments Pty Ltd and a Director of Ingeus Limited, The Macfarlane Burnet Institute for Medical Research and Public Health Limited. Board Member of law firm Freehills. Former Chief Executive Officer and Country Managing Partner of Arthur Andersen and former Senior Partner of Ernst & Young.
Peter M kirby BEc (Hons), MA (Econ) MBA
Non-Executive Director since July 200�. Chairman of the Safety, Health and Environment Committee. Member of the Remunerations and Appointments Committee and Corporate Governance and Nominations Committee.
Director of Macquarie Bank Limited. Former Chairman of Medibank Private Limited and Director of the Business Council of Australia. Former Managing Director and Chief Executive Officer of CSR Limited and former Chief Executive Officer of ICI Paints and member of the Executive Board of ICI plc.
Nora ScheinkestelPh D, LLB (Hons), FAICD, Centenary Medal
Non-Executive Director since August 2006. Member of the Audit and Risk Committee and Remuneration and Appointments Committee.
Director of AMP Limited, AMP Capital Group, and PaperlinX Limited. Associate Professor Melbourne Business School. Former director of Newcrest Mining Limited, Mayne Group Ltd, Mayne Pharma Limited, North Ltd, MBF Health Fund, Docklands Authority, IOOF Funds Management and a number of utilities across the gas, water and electricity sector. Also former Chairman of South East Water and Energy 21 and Stratus Group.
Michael Tilley GradDip, BA
Non-Executive Director since November 200�. Member of the Remuneration and Appointments Committee.
Former Managing Director and Chief Executive Officer of Challenger Financial Services Group Limited. Former member of the Takeovers Panel. Former Non-Executive Director of Incitec Ltd and former Vice-Chairman of JP Morgan.
Catherine M WalterAM, LLB (Hons) LLM MBA
Non-Executive Director since October 1998. Member of the Remuneration and Appointments Committee and the Safety, Health and Environment Committee.
Chairman of the Australian Synchrotron and a Director of James Hardie Industries N.V., Australian Foundation Investment Company, Payment Systems Board and Financial Reporting Council. A director of a number of not-for-profit entities including Melbourne Business School, Walter and Eliza Hall Institute of Medical Research and Melbourne International Arts Festival. Former Director of Australian Stock Exchange and National Australia Bank Limited.
Russell R CaplanLLB, FAICD
Non-Executive Director since October 2007. Member of the Remuneration and Appointments Committee and the Safety, Health and Environment Committee.
Chairman of the Shell Group of Companies in Australia and the Melbourne and Olympic Parks Trust. Director of the Australian Institute of Petroleum and the Australian Science Media Centre. Board member of The Global Foundation. Former Director of Woodside Petroleum Limited.
Annette M Cook Dip Bus (Accounting), Dip Bus (Data Processing), CPA
Company Secretary of Orica Limited since 16 February 2005 and prior to that was assistant Company Secretary from August 2002. Joined Orica in July 1987 and has had a variety of roles in Business Services, IT and Finance.
For
per
sona
l use
onl
y

1�
Group Executive Team
Graeme R liebelt BEc (Hons) Managing Director
Graeme has held a variety of key positions within the Orica Group since joining in 1989 including Chief Executive of ICI Paints Pacific, General Manager Plastics and Advanced Sciences Groups and Chief Executive Officer Orica Mining Services.
Prior to joining Orica Graeme held a number of senior positions including Marketing Director Repco (Australia), Marketing Director Philip Morris (Australia) and Consultant for Pappas Carter (now Boston Consulting Group)
Noel Meehan BSc (Hons), CPA Executive Director Finance
Noel joined Orica in April 1999 as Corporate Reporting Manager. Since then, he as held a number of other senior finance roles within the Group, including CFO for Orica Chemicals and Orica Group Investor Relations Manager. Noel was appointed to the role of Chief Financial Officer in May 2005 and Executive Director Finance in September 2005.
Prior to joining Orica, Noel held a variety of finance roles both within Qantas Airways Limited and Australian Airlines Limited.
John Beevers BEng (Mining) General Manager, Orica Mining Services Australia/Asia
John joined Orica in 1985, starting in the Operations Division of Mining Services (Australia). Since then he has held a variety of positions in Mining Services with leadership roles in Technology, Operations and Business.
Prior to this appointment John was General Manager, Chemical Services.
Note: John was appointed Chief Executive Officer, Orica Mining Services, effective 1� November, 2008.
Craig Elkington Bbus (Acc), CPA President, Orica Mining Services, North America
Craig joined Orica in 1994 initially with corporate accounting responsibilities before moving into several senior finance roles across the Group’s business platforms. In 1998 he moved to Denver, Colorado to join the North American Mining Services business following the acquisition of ICI’s explosives operations.
In recent years he has held the CFO positions of the Company’s former subsidiary Incitec Ltd, Chemicals Division and most recently as CFO of the global Mining Services Group. Craig was appointed to the role of President Orica Mining Services North America in December 2007.
Prior to joining Orica, Craig held a number of positions with Qantas Airways Limited, Australian Airlines Limited and Touche Ross International.
Philippe Etienne BSc, MBA, GradDip (Marketing) Chief Executive Officer, Orica Mining Services
Philippe joined Orica in 1985 from the Bonds Coates Patons Group where he held sales and consumer marketing positions.
Initially in Orica’s Chemicals Group, Philippe has held a number of commercial roles including General Manager of Valchem, Watercare and then the ChlorAlkali Division. In 2000 he moved to Denver, Colorado to join the international management team of Orica Mining Services as Senior VP – Strategic Planning.
Prior to this appointment, Philippe was Managing Director of Orica’s European, Middle Eastern and African business group based in Germany.
Note: Due to illness, Philippe stood down from his position effective 1� November, 2008.
Patrick Houlihan BSc (Hons), MBA General Manager, Orica Consumer Products
Patrick has been with the company for 19 years joining the Dulux business in 1989 as a research chemist. Progressing through a succession of technical, commercial and senior leadership roles including Dulux Director of Marketing and Selleys Sales Director, he has accumulated extensive experience across all facets of the Orica Consumer Products (OCP) division.
Prior to this appointment, Patrick was General Manager of the Yates business.
Andrew larke LLB, BComm, Grad Dip (Corporations & Securities Law) Group General Manager, Mergers and Acquisitions, Strategy and Technology
Andrew has spent over 15 years in mergers, acquisitions, divestments and corporate advisory. He joined Orica in April 2002 as General Manager, Mergers and Acquisitions and has been responsible for leading Orica’s M&A activities since that time, including the merger of Incitec and Pivot in 200�, the subsequent divestment of Orica’s shareholding in the merged Incitec Pivot entity in 2006 and the acquisition of Dyno Nobel in 2005.
Before joining Orica, Andrew was principal in SLM Corporate Advisory and prior to that held the role of General Manager Mergers, Acquisitions and Strategy at resources company North Limited where he also held a number of senior commercial and legal roles.
Michael Reich B Mining Eng Chief Executive Officer, Minova
Michael was appointed to the role of Chief Executive Officer Minova in December 2007.
Prior to his appointment, Michael was CEO of Minova’s German business for five years.
Michael has extensive experience in the mining industry particularly in the area of underground coal mining operations. Throughout his career he has as held a number of positions including sales and operations management.
Greg Witcombe BSc General Manager, Chemicals
Greg joined the company in 1977 as a research chemist with the Agricultural Products business before moving into a series of commercial roles in the Chemicals business, including a secondment to the United Kingdom where he had responsibility for chemical exports to Asia.
His senior management positions have included General Manager of Trading (Chemnet) and Mining Chemicals, General Manager of Polyethylene Group, Manager Director of Incitec Ltd and Managing Director of Incitec Pivot Limited.
Prior to this appointment, Greg was General Manager People and Community with responsibility for Human Resources, Safety Health and Environment, Corporate Affairs, Six Sigma and Group Procurement.
For
per
sona
l use
onl
y
14
Corporate Governance
Orica’s directors and management are committed to conducting the company’s business ethically and in accordance with high standards of corporate governance.
This statement describes Orica’s approach to corporate governance. The Board believes that Orica’s policies and practices comply with the Australian Stock Exchange (ASX) Corporate Governance Council Principles and Recommendations. The company’s corporate governance policies can be viewed on the company’s website at www.orica.com.
INTEGRITY OF REPORTINGThe company has controls in place at the Board and business group level that are designed to safeguard the company’s interests and integrity of its reporting. These include accounting, financial reporting, safety, health and environment and other internal control policies and procedures, which are directed at monitoring whether the company complies with regulatory requirements and community standards.
Both the Managing Director and Executive Director Finance are required to state in writing to the Board that:
• the company’s financial reports represent a true and fair view of the group’s financial condition and operational results and are in accordance with relevant accounting standards; and
• these statements are founded on a sound system of risk management and internal control and that the system is operating effectively in all material respects in relation to financial reporting risks.
These assurances are based on a financial letter of assurance that cascades down through management and includes sign-off by business general managers and business chief financial officers.
Comprehensive practices have been adopted to monitor:
• that capital expenditure and revenue commitments above a certain size obtain prior Board approval;
• financial exposures including the use of derivatives;
• safety, health and environment standards and management systems to achieve high standards of performance and compliance; and
• that business transactions are properly authorised and executed.
Internal audit has a mandate for reviewing and recommending improvements to controls, processes and procedures used by the company across its corporate and business activities. The company’s internal audit is managed by the Chief Risk Officer
and undertaken by an independent firm of accountants.
The company’s financial statements are subject to an annual audit by an independent, professional auditor who also reviews the company’s half-yearly financial statements. The Board Audit and Risk Committee oversees this process on behalf of the Board.
RISk IDENTIFICATION AND MANAGEMENTOrica believes that effective risk management supports the company’s ability to grow. Orica recognises the importance of risk management practices across all businesses and operations. Effective risk management highlights for management’s attention the risks of loss of value and provides a framework to achieve and deliver the company’s strategy.
The Board establishes the policies for the oversight and management of material business risks and internal control. The design and implementation of the risk management and internal control systems to manage the company’s material business risks is the responsibility of management. The Board satisfies itself that management has developed and implemented a sound system of risk management and internal control.
The key elements of the policies for the oversight and management of material business risks are:
• Material financial and non-financial business risks, covering 12 risk categories, are systematically and formally identified and assessed by the Board, group executive and business groups on (at least) an annual basis.
• Risk assessments are also performed for individual material projects, capital expenditure and country risks.
• Management plans are established for each significant identified risk outlining the mitigation strategy and tasks, and the management responsible for the action.
• Formal risk reporting is provided to the Board on an ongoing basis including information relating to risk profiles and progress against plans.
Both the Managing Director and Executive Director Finance have provided a report to the Board that the risk management and internal control systems have been designed and implemented to manage the company’s material business risks, and those risks are managed effectively.
A separate role of Chief Risk Officer exists, reporting to the Executive Director Finance and liaising directly with the Chairman of the
Board Audit and Risk Committee, to manage the company’s risk management and internal audit program.
A third party assists the Board in ensuring compliance with internal controls and risk management programs by regularly reviewing the effectiveness of the risk management and internal control systems, and periodically provides assistance and input when undertaking risk assessments.
THE BOARD ROlEThe Board of Orica Limited sees its primary role as the protection and enhancement of long term shareholder value. The Board is accountable to shareholders for the performance of the company. It directs and monitors the business and affairs of the company on behalf of shareholders and is responsible for the company’s overall corporate governance.
The Board responsibilities include appointing the Managing Director and succession planning, approving major strategic plans, monitoring the integrity and consistency of management’s control of risk, agreeing business plans and budgets, approving major capital expenditure, acquisitions and divestments, approving funding plans and capital raisings, agreeing corporate goals and reviewing performance against approved plans.
Responsibility for managing, directing and promoting the profitable operation and development of the company, consistent with the primary objective of enhancing long term shareholder value, is delegated to the Managing Director, who is accountable to the Board.
The Board recognises the respective roles and responsibilities of the Board and management in the charters prepared for the Board, Managing Director and Chairman and in the company’s reserved authorities approved by the Board.
COMPOSITIONThe Board considers that its structure, size, focus, experience and use of committees enables it to operate effectively and add value to the company.
Orica maintains a majority of non-executive directors on its Board and separates the role of Chairman and Managing Director.
The Board currently comprises eleven directors: nine independent non-executive directors, including the Chairman, and two executive directors, being the Managing Director and the Executive Director Finance.
Details of the directors as at the date of this report, including their qualifications and experience are set out on page 12.
For
per
sona
l use
onl
y
15
The composition of the Board seeks to provide an appropriate range of experience, skills, knowledge and perspective to enable it to carry out its obligations and responsibilities. In reviewing the Board’s composition and in assessing nominations for appointment as non-executive directors, the Board uses external professional advice as well as its own resources to identify candidates for appointment as directors.
The balance of skills and experience of the Board is critically and regularly reviewed by the Corporate Governance and Nominations Committee.
INDEPENDENCEThe Board recognises the special responsibility of non-executive directors for monitoring executive management and the importance of independent views.
The Chairman and all non-executive directors are independent of executive management and free of any business or other relationship that could materially interfere with the exercise of unfettered and independent judgment or compromise their ability to act in the best interests of the company.
The independence of each director is considered on a case by case basis from the perspective of both the company and the director. Materiality is assessed by reference to each director’s individual circumstances, rather than by applying general materiality thresholds. Each director is obliged to immediately inform the company of any fact or circumstance, which may affect the director’s independence.
If a conflict of interest arises, the director concerned does not receive the relevant Board papers and is not present at the meeting whilst the item is considered. Directors must keep the Board advised, on an ongoing basis of any interests that could potentially conflict with those of the company.
SElECTION AND APPOINTMENT OF DIRECTORSThe directors are conscious of the need for Board members to possess the diversity of skill and experience required to fulfil the obligations of the Board. In considering membership of the Board, directors take into account the appropriate characteristics needed by the Board to maximise its effectiveness and the blend of skills, knowledge and experience necessary for the present and future needs of the company.
Nominations for appointment to the Board are considered by the Corporate Governance and Nominations Committee and approved by the Board as a whole.
Non-executive directors are subject to shareholder re-election by rotation at least every three years, and normally do not serve more than 10 years.
All directors must obtain the Chairman’s prior approval before accepting directorships or other significant appointments.
An orientation program is offered to new directors including a program of site visits and briefings on Orica’s businesses and operations and key policies and controls.
BOARD MEETINGSThe Board has eight scheduled meetings per year, of which six are two days duration. Additional meetings are held as the business of the company may require. Directors receive comprehensive Board papers in advance of the Board meetings. As well as holding regular Board meetings, the Board sets aside at least two days annually to comprehensively review business plans and company strategy. Directors also receive regular exposure to Orica’s businesses and the major regulatory controls relevant to the company. Directors also undertake site visits to a range of Orica operations to meet with employees, customers and other stakeholders.
In those months that Board meetings are not scheduled directors receive financial and safety, health and environment reports and an update from the Managing Director on the performance of the company and any issues that have arisen since the last Board meeting.
In conjunction with or in addition to scheduled Board meetings, the non-executive directors meet together without the presence of management and the executive directors to discuss company matters.
To aid the effectiveness of Board meetings each scheduled Board meeting is subject to a critical review evaluating the standard of information and material presented to the Board and the quality of the contribution made by directors to the consideration of issues on the agenda.
BOARD AND ExECUTIvE PERFORMANCEOrica has in place a range of formal processes to evaluate the performance of the Board, Board Committees and executives. These processes can be viewed on the Orica website at www.orica.com.
At the conclusion of the year, the Board carries out a review of its performance. Directors standing for re-election are subject to a performance review conducted by the Board. In addition, each Board Committee reviews its effectiveness. An independent review of Board, Committee and director
performance is undertaken periodically. During the year the annual Board and committee reviews were conducted in respect of the previous financial year in accordance with the process set out above.
The non-executive directors are responsible for regularly evaluating the performance of the Managing Director. The evaluation is based on specific criteria, including the company’s business performance, short and long term strategic objectives and the achievement of personal objectives agreed annually with the Managing Director.
All Orica executives are subject to an annual performance review. The review involves an executive being evaluated by their immediate superior by reference to their specific performance contract for the year, including the completion of key performance indicators and contribution to specific business and company plans. All Orica executives, including the Chief Executive Officer, have had their performance evaluated during the year in accordance with the process set out above.
ACCESS TO INFORMATION AND INDEPENDENT ADvICEEach director has the right of access to all relevant company information and to the company’s executives and, subject to prior consultation with the Chairman, may seek independent professional advice at the company’s expense. Pursuant to a deed executed by the company and each director, a director also has the right to have access to all documents which have been presented to meetings or made available whilst in office, or made available in relation to their position as director for a term of seven years after ceasing to be a director or such longer period as is necessary to determine relevant legal proceedings that commenced during this term.
SHAREHOlDINGS OF DIRECTORS AND EMPlOYEESThe Board has approved guidelines for dealing in securities. Directors and employees must not, directly or indirectly, buy or sell the shares or other securities of Orica, excluding participation in the Dividend Reinvestment Plan, when in possession of unpublished price sensitive information, which could materially affect the value of those securities. Subject to this restriction, directors and employees may buy or sell Orica shares during the following trading windows:
• in the 28 day period commencing 24 hours after the announcement of the Orica half-year results; and
For
per
sona
l use
onl
y
16
• in the period commencing 24 hours after the announcement of the full-year results and ending �1 January.
Directors and employees must receive clearance from the Chairman or Company Secretary for any proposed dealing in Orica shares outside of a trading window.
Directors and employees must not deal in Orica securities on a short-term basis or enter into short-term derivative arrangements in any circumstances. Directors and employees may deal in securities via a margin loan arrangement in relation to their Orica securities where:• the Orica securities are not held “at risk”
or subject to restrictions under an Orica employee, executive or director plan;
• the margin lending arrangement does not, of itself, trigger a transfer in the legal or beneficial ownership of the underlying securities;
• the arrangement is entered into during a trading window; and
• the Company Secretary is notified prior to the margin lending arrangement being entered into.
Directors and employees may create or enter into a derivative arrangement in relation to Orica securities where:• the Orica securities are not held “at risk”
or subject to restrictions under an Orica employee, executive or director plan;
• the derivate arrangement would not be considered a short term derivate arrangement; and
• the Company Secretary is notified prior to the derivate arrangement being entered into.
Any transaction conducted by directors in Orica securities is notified to the Australian Stock Exchange. Each director has entered into an agreement with the company to provide information to allow the company to notify the ASX of any transaction within 5 business days. The current shareholdings are shown in Note �7.
DIRECTORS’ FEES AND ExECUTIvE REMUNERATIONThe remuneration report on page 24 sets out details regarding the company’s remuneration policy, fees paid to directors for the past financial year, and specific details of executive remuneration.
BOARD COMMITTEESThe Board has charters for each of its committees. Charters are reviewed annually and objectives set for each committee. The committees report back to the Board and do not have formal delegation of decision making authority. The Committee Chairmen
report on the committees as a standing item of the Board agenda. Additionally any director is welcome to attend any committee, and minutes of the committees are circulated to the Board. The charters may be viewed on the Orica website at www.orica.com.
BOARD AUDIT AND RISk COMMITTEEThe Board Audit and Risk Committee comprises three independent non-executive directors with relevant financial, commercial and risk management experience. The Chairman of the Board Audit and Risk Committee is separate from the Chairman of the Board. Peter Duncan is the current Chairman of the Board Audit and Risk Committee and the other members are Garry Hounsell, and Nora Scheinkestel. The Chairman, Managing Director and Executive Director Finance attend ex officio.
The committee is charged with assessing the adequacy of the company’s financial and operating controls, oversight of risk management systems and compliance with legal requirements affecting the company. The committee meets at least four times per year.
Details of directors’ attendance at meetings of the Audit and Risk Committee are set out in the Directors’ Report on page 21.
The committee assesses and reviews external and internal audits and risk reviews and any material issues arising from these audits or reviews. It also assesses and reviews the accounting policies and practices of the group as an integral part of reviewing the half yearly and full year accounts for recommendation to the Board. It also makes recommendations to the Board regarding the appointment of external auditors and the level of their fees and provides a facility, if necessary, to convey any concerns raised by the internal and external auditors independent of management influence. The external and internal auditors attend committee meetings and meet privately with the committee at least twice per year.
The Board Audit and Risk Committee monitors the level of any other services provided by the external auditor for compatibility in maintaining auditor independence. Restrictions are placed on other services performed by the external auditor and projects outside the scope of the approved audit program require the approval of the Chairman of the Board Audit and Risk committee. Any other services with a value of greater than $20,000 must be submitted to the Committee for approval in advance of the work being undertaken. The committee is asked to ratify any other services less than $20,000 in value. The fees paid to the
company’s external auditors for audit and other services are set out in Note �1.
REMUNERATION AND APPOINTMENTS COMMITTEEThe Remuneration and Appointments Committee, which comprises all the non-executive directors, is chaired by the Chairman of the company and meets at least four times per year.
Details of directors’ attendance at meetings of the Remunerations and Appointments Committee are set out in the Directors’ Report on page 21.
It reviews the performance and remuneration of senior management including the Managing Director. Remuneration is set by reference to independent data, external professional advice, the company’s circumstances and the requirement to attract and retain high-calibre management. It also has responsibility for overseeing the appointment and succession of executive directors and the members of the group executive.
CORPORATE GOvERNANCE AND NOMINATIONS COMMITTEEThe Corporate Governance and Nominations Committee comprises Don Mercer (Chairman), Graeme Liebelt, Peter Duncan, Peter Kirby and Michael Beckett. The committee monitors new developments in corporate governance practices and evaluates the company’s policies and practices in response to changing external and internal factors and the ethical guidelines affecting the company.
This committee also deals with the nomination of directors and considers the most appropriate processes for review of the Board’s composition and performance. The committee evaluates the composition of the Board and the annual program of matters considered by the Board to determine whether the appropriate mix of members and business exists to enable the Board to discharge its responsibilities to shareholders.
Details of directors’ attendance at meetings of the Corporate Governance and Nominations Committee are set out in the Directors’ Report on page 21.
SAFETY, HEAlTH AND ENvIRONMENT COMMITTEEThe Safety, Health and Environment Committee comprises Peter Kirby (Chairman), Catherine Walter, Michael Beckett and Russell Caplan. The Chairman and Managing Director attend ex officio.
The committee assists the Board in the effective discharge of its responsibilities in relation to safety, health and environmental
Corporate Governance continued
For
per
sona
l use
onl
y
17
matters arising out of activities within the company as they affect employees, contractors, visitors and the communities in which it operates. The committee also reviews the company’s compliance with the environment policy and legislation and reviews safety, health and environmental objectives, targets and due diligence processes adopted by the company.
Details of directors’ attendance at meetings of the Safety, Health and Environment Committee are set out in the Directors’ Report on page 21.
ExECUTIvE AND SPECIAl COMMITTEESIn addition, there is a standing Executive Committee comprising the Chairman, the Managing Director, the Executive Director Finance and any other non-executive director who is available (but at least one), which is convened as required, to deal with matters that need to be dealt with between board meetings. From time to time special committees may be formed on an as-needs basis to deal with specific matters.
CONTINUOUS DISClOSURE AND kEEPING SHAREHOlDERS INFORMEDThe company seeks to provide relevant and timely information to its shareholders and is committed to fulfilling its obligations to the broader market for continuous disclosure and enabling equal access to material information about the company.
The Board has approved a continuous disclosure policy so that the procedures for identifying and disclosing material and price sensitive information in accordance with the Corporations Act and ASX Listing Rules are clearly articulated. This policy sets out the obligations of employees and guidelines relating to the type of information that must be disclosed and may be viewed on the Orica website at www.orica.com.
Information provided to and discussions with analysts are subject to the continuous disclosure policy. Material information must not be selectively disclosed prior to being announced to the Australian Stock Exchange. The Company Secretary is the person responsible for communication with the Australian Stock Exchange.
The www.orica.com website contains copies of the annual and half year reports, ASX announcements, investor relations publications, briefings and presentations given by executives (including webcasts) plus links to information on our products and services. Shareholders may elect to receive electronic notification of releases of information by the company and receive their notice of meeting and proxy form
by email. Electronic submission of proxy appointments and power of attorney are also available to shareholders. Page 128 of this report contains details of how information provided to shareholders may be obtained.
The Board encourages full participation of shareholders at the Annual General Meeting. Important issues are presented to the shareholders as single resolutions. The external auditor attends annual general meetings to answer any questions concerning the audit and the content of the auditor’s report.
CODE OF ETHICSOrica acknowledges the need for directors, executives and employees to observe the highest ethical standards of corporate behaviour. Orica has adopted a Code of Ethics which applies to all countries in which Orica operates and in accordance with international laws and standards, provides employees with guidance on what is acceptable behaviour. Specifically, the company requires that all directors, managers and employees maintain the highest standards of integrity and honesty.
The key elements of the code are:
• fairness, honesty and loyalty supporting all actions;
• being aware of and obeying the law;
• individually and collectively contributing to the well-being of shareholders, customers, the economy and the community;
• avoiding behaviour, which is likely to reflect badly on employees and the company; and
• openness and public disclosure as the test for all actions.
To assist employees in applying the code in practice, the company has developed policies and guidelines dealing with the following:
• safety, health and environment;
• protection of information and the company’s resources;
• trade practices compliance;
• privacy;
• conflict of interest ;
• insider trading and dealing in securities;
• equal employment opportunity and harassment;
• gifts and benefits and facilitation payments; and
• prevention of, and dealing with, fraud.
The Code of Ethics is regularly reviewed and approved by the Corporate Governance and Nominations Committee and processes are in place to promote and communicate these policies. An Integrity Hotline has been established to enable employees to
report breaches of the Code of Ethics. If a report is made, it is escalated to the Orica Business Conduct Committee comprising the Executive Director Finance, General Manager People and Community, the Group General Counsel and the Chief Risk Officer, who collectively determine appropriate organisational actions, take appropriate independent advice and seek to protect the anonymity of the reporter.
The Code of Ethics may be viewed on the Orica website at www.orica.com.
SAFETY, HEAlTH & ENvIRONMENTOrica considers the successful management of safety, health and environment issues as a vital issue for our employees, customers, communities and business success. At each Board meeting the directors receive a report on current safety, health and environment issues and performance in the group. The Board receives more detailed presentations on safety, health and environment every six months. A separate Board Safety, Health and Environment Committee reviews and monitors environmental issues at Board level.
For more in-depth information on our SH&E and Sustainability commitments in 2008, visit the Orica website: www.orica.com/sustainability. The Sustainability section of this Annual Report details the actions being undertaken by the company to improve its environmental performance.
DONATIONSThe equivalent of dividends payable on a shareholding of approximately 0.5% of the company’s ordinary issued capital is allocated for donation at the direction of the Corporate Governance and Nominations Committee.
Orica’s operations contribute to their local communities with donations, sponsorship and practical support and there is an employee giving program known as ‘Dare to Share’ across all Australian sites. From the amount allocated for corporate donations, Orica matches employee ‘Dare to Share’ contributions and may support worthwhile causes overseas. The amount remaining is allocated to the Orica Community Program and is distributed to selected Australian charitable organisations in accordance with published criteria. Orica does not make political donations.
For
per
sona
l use
onl
y
18
Orica has a longstanding commitment to ensuring that we care for the safety of the people we work with, and the communities and environments within which we operate. In very complex work environments, we are proud of our ability to maintain world-class safety performance and introduce innovative ways to reprocess by-products into saleable products. Our Safety, Health and Environment (SH&E) Policy commits us to:• value people and the environment;
and to achieve.• no injuries to anyone, ever.
In recent years we have progressed from not only recognising our responsibility for social and environmental issues but also to an understanding of their importance to our ongoing success and growth. To remain cost competitive in a carbon constrained economy, to engage and retain staff in a competitive environment and to enhance our social ‘licence to operate’ as we expand our global presence, our sustainability aspiration is clear and challenging: we aspire to become a business that does No Harm to People and the Environment.
This means a transition to:• Carbon neutral – no net generation of
greenhouse gases to the atmosphere.• Water neutral – no net consumption of
potable water.• Zero waste – no net generation of waste
to landfill and innovative ways to prevent, reduce, reuse and recycle by-product streams.
• Environmentally friendly operations, products and services – that have no unintended consequences to the environment and the community
… in a commercially responsible way.
Our vision is supported by our ‘Challenge 2010’ SH&E targets. Our people have worked hard to deliver a solid performance against the targets in 2008.
vAlUE PEOPlE AND THE ENvIRONMENTWe understand that the way we conduct our business affects the environment, the people who work for us and live in the local community. We aim to make this impact a positive one.
In 2008 we sought to provide an engaging and enjoyable workplace, free of discrimination and offering a range of training and development opportunities.
Our Emergency Response Service continued to provide a world-class service in 2008, handling ��5 calls from customers and employees, transport carriers, emergency
services, government authorities, hospitals, veterinarians, as well as members of the public.
Today we operate in around 50 countries and publish company news in twelve languages other than English. In 2008 our employees continued to engage with their local communities around the world, providing in kind and financial support to a number of community organizations, particularly in less affluent regions.
NO INJURIES TO ANYONE, EvERWe are committed to eliminating fatalities and serious injuries from our workplaces.
In 2008 our people worked hard to continue implementation and compliance with our safety-related Model Procedures and improve reporting of ‘learning incidents’. While there were no fatalities at our operations this year, we are disappointed to report that our headline “All Worker Recordable Case Rate” has increased from 0.60 in 2007 to 0.72 in 2008.
We are saddened to report that there were seven fatalities to members of the public in separate distribution incidents this year. Although no fault was attributed to either Orica or contracted drivers in any of the events, we will maintain our vigilance and rigorously apply our SH&E systems and tools to manage all distribution related risks under the company’s control.
CARBON NEUTRAl We emit greenhouse gases including carbon dioxide and nitrous oxide from our operations. We have improved our energy efficiency by 14 per cent and reduced our greenhouse gas emissions per tonne of production by 21.6 per cent compared to our 2004 baseline year.
In 2008 we commenced nitrous oxide abatement at our operation in Carseland, Canada. As our third largest emitter of greenhouse gases, the 80 per cent abatement currently achieved at Carseland, with no production losses, is a significant achievement for our business. We are following up on this success with plans for an abatement program at our Bacong operation in the Philippines. The program will be implemented under the Kyoto Protocol’s Clean Development Mechanism. We expect to roll out the abatement program to all Orica Nitric Acid Plants over the next two years, with the potential to reduce our overall greenhouse gas emissions by up to 55 per cent.
We have completed detailed assessments at our two most energy intensive sites in Australia, which have identified many energy efficiency projects. A Sensitivity Analysis for carbon and water is now included in all of our significant expenditure proposals and contracts.
We are working with the Australian Department of Climate Change to ensure Orica is appropriately considered under the proposed Carbon Pollution Reduction Scheme.
WATER NEUTRAl We have reduced our water use per tonne of production by 26.9 per cent compared to our 2004 baseline year, achieving our Challenge 2010 target of a 15 per cent reduction
We are reducing consumption of potable water through the supply of treated water from our Botany Groundwater Treatment Plant (GTP). In 2008 we supplied more than 460 ML to our nearby Chlorine Plant and third party users. This water reuse project resulted in Orica and Qenos (which also consumed GTP treated water) winning the Plastics and Chemicals Industry Association (PACIA) Environment Award. We also completed the preliminary design for a project to supply 100 per cent recycled water from the Hunter River to our Kooragang Island operation. If successful, this project will reduce Orica’s total water use by �0 per cent.
ZERO WASTEWe have reduced our waste generation per unit of product by 55 per cent compared to our 2004 baseline year, achieving our Challenge 2010 target of a 50 per cent reduction. Our most waste-intensive site, Rocklea, reduced its waste to landfill by 15 per cent this year by recycling wash water particulates into the manufacture of compost. Orica Consumer Products (OCP) in New Zealand has developed a commercially viable particleboard using recycled paint, powder coatings and wood waste. OCP has also demonstrated market leadership in waste paint and packaging recycling projects.
ENvIRONMENTAllY FRIENDlY We continue to analyse the full lifecycle impacts of our major products. This year we worked with our customers and suppliers to define, and measure sales of, low-impact or ‘greener’ products. These include our sustainable Blast Based Services for the world explosives market and our expanded range of “Green” paint products, including low-VOC and carbon-neutral paint products.
Read more about how we delivered on our SH&E and Sustainability commitments in 2008 in our Full Report at: www.orica.com/sustainability
Sustainability
Orica and Sustainability
For
per
sona
l use
onl
y

Orica Limited 19
Financial Report
For
per
sona
l use
onl
y
Orica Limited 20
Directors’ Report 21
Directors’ Report – Remuneration Report 24
Lead Auditor’s Independence Declaration 38
Income Statements 39
Statements of Recognised Income and Expense 40
Balance Sheets 41
Statements of Cash Flows 42
Notes to the Financial Statements 43
Directors’ Declaration on the Financial Report set out on pages 39 to 120 121
Auditor’s Report 122
Shareholders’ Statistics 124
Ten Year Financial Statistics 126
For
per
sona
l use
onl
y
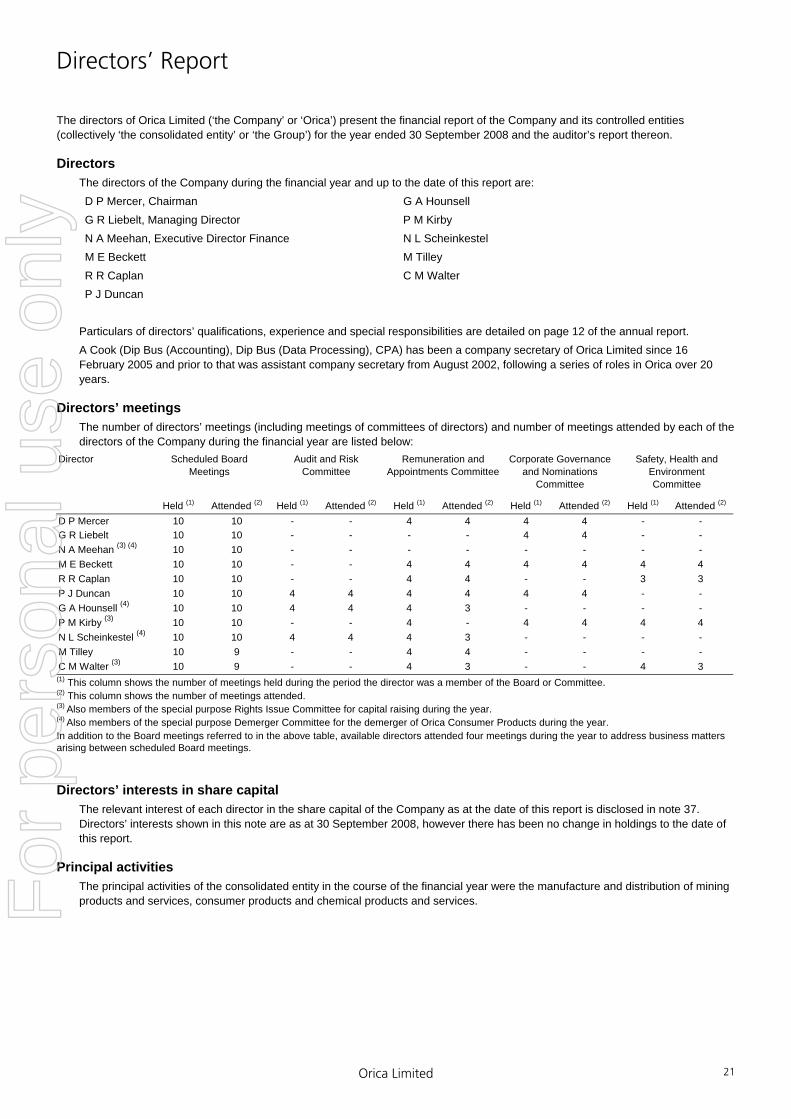
Directors’ Report
Orica Limited 21
The directors of Orica Limited (‘the Company’ or ‘Orica’) present the financial report of the Company and its controlled entities (collectively ‘the consolidated entity’ or ‘the Group’) for the year ended 30 September 2008 and the auditor’s report thereon.
Directors The directors of the Company during the financial year and up to the date of this report are: D P Mercer, Chairman G A Hounsell G R Liebelt, Managing Director P M Kirby N A Meehan, Executive Director Finance N L Scheinkestel M E Beckett M Tilley R R Caplan C M Walter P J Duncan
Particulars of directors’ qualifications, experience and special responsibilities are detailed on page 12 of the annual report. A Cook (Dip Bus (Accounting), Dip Bus (Data Processing), CPA) has been a company secretary of Orica Limited since 16 February 2005 and prior to that was assistant company secretary from August 2002, following a series of roles in Orica over 20 years.
Directors’ meetings The number of directors’ meetings (including meetings of committees of directors) and number of meetings attended by each of the directors of the Company during the financial year are listed below:
Director Scheduled Board Meetings
Audit and Risk Committee
Remuneration and Appointments Committee
Corporate Governance and Nominations
Committee
Safety, Health and Environment Committee
Held (1) Attended (2) Held (1) Attended (2) Held (1) Attended (2) Held (1) Attended (2) Held (1) Attended (2) D P Mercer 10 10 - - 4 4 4 4 - - G R Liebelt 10 10 - - - - 4 4 - - N A Meehan (3) (4) 10 10 - - - - - - - - M E Beckett 10 10 - - 4 4 4 4 4 4 R R Caplan 10 10 - - 4 4 - - 3 3 P J Duncan 10 10 4 4 4 4 4 4 - - G A Hounsell (4) 10 10 4 4 4 3 - - - - P M Kirby (3) 10 10 - - 4 - 4 4 4 4 N L Scheinkestel (4) 10 10 4 4 4 3 - - - - M Tilley 10 9 - - 4 4 - - - - C M Walter (3) 10 9 - - 4 3 - - 4 3 (1) This column shows the number of meetings held during the period the director was a member of the Board or Committee. (2) This column shows the number of meetings attended. (3) Also members of the special purpose Rights Issue Committee for capital raising during the year. (4) Also members of the special purpose Demerger Committee for the demerger of Orica Consumer Products during the year. In addition to the Board meetings referred to in the above table, available directors attended four meetings during the year to address business matters arising between scheduled Board meetings.
Directors’ interests in share capital The relevant interest of each director in the share capital of the Company as at the date of this report is disclosed in note 37. Directors’ interests shown in this note are as at 30 September 2008, however there has been no change in holdings to the date of this report.
Principal activities The principal activities of the consolidated entity in the course of the financial year were the manufacture and distribution of mining products and services, consumer products and chemical products and services. F
or p
erso
nal u
se o
nly

Directors’ Report
Orica Limited 22
Likely developments Likely developments in the operations of the consolidated entity and the expected results of those operations are covered generally in the review of operations and financial performance of the consolidated entity on pages 4 to 11 of the annual report. Further information as to likely developments in the operations of the consolidated entity and the expected results of those operations in subsequent financial years has not been included in this report because, in the opinion of the directors, disclosure would be likely to result in unreasonable prejudice to the consolidated entity. On 21 July 2008, Orica announced the intention to demerge its Consumer Products business. On 7 November 2008, Orica announced that in light of the extreme volatility currently being experienced in equity and financial markets, it would defer the proposed demerger of its Consumer Products business indefinitely.
Review and results of operations A review of the operations of the consolidated entity during the financial year and of the results of those operations is contained on pages 4 to 11 of the annual report.
Dividends Dividends paid or declared since the end of the previous financial year were: $m
Final dividend paid at the rate of 2.5 cents per share on preference shares, franked to 32.08% (0.8 cents) at the 30% corporate tax rate, paid 18 January 2008.
0.05
Final dividend at the rate of 53 cents per share on ordinary shares, franked to 32.08% (17.0 cents) at the 30% corporate tax rate, paid 14 December 2007.
162.4
Interim dividend declared at the rate of 39 cents per share on ordinary shares, franked to 35.9% (14 cents) at the 30% corporate tax rate, paid 4 July 2008.
122.1
Total dividends paid 284.6Since the end of the financial year, the directors have declared a final dividend to be paid at the rate of 55 cents per share on ordinary shares. This dividend will be franked to 36.36% (20 cents) at the 30% corporate tax rate.
Distributions on Step-up preference Shares Distributions paid since the end of the previous financial year were: $m
Dividend at the rate of 7.8133% per annum, per share, unfranked paid 30 November 2007 for the period from 31 May 2007 to 29 November 2007.
19.6
Dividend at the rate of 8.7317% per annum, per share, unfranked paid 2 June 2008 for the period from 30 November 2007 to 31 May 2008.
21.9
Total distributions paid 41.5
Changes in the state of affairs Particulars of significant changes in the state of affairs of the consolidated entity during the year ended 30 September 2008 are as follows: Acquisitions • On 1 October 2007, Orica acquired Southern Blasting Services, Inc. • On 24 September 2007, Orica announced that it had signed an agreement to acquire all of Excel Mining Systems LLC. The
acquisition was completed on 26 October 2007. • On 1 December 2007, Orica completed the purchase of Intermountain West Energy, Inc. • On 9 May 2008, Orica acquired D.C. Guelich Explosive Company. • On 23 May 2008, Orica acquired the business assets of Strata Control Systems. • On 14 August 2008, Orica announced it would acquire and complete early in the 2009 financial year its joint venture partners’
48.6% interest in Dyno Nobel Samex SA. • On 4 September 2008, Orica acquired Arnall Poland Sp z o.o. • On 30 September 2008, Orica announced it has entered into a joint venture agreement with Southwest Energy LLC. Contributed Equity • Orica raised $885.2m net of costs under a rights issue prospectus dated 28 July 2008. • Under the dividend reinvestment plan, dividends paid during the year were underwritten, raising $156.5m. • The cumulative non-redeemable preference shares were cancelled during the year at a cost of $7.5m.
For
per
sona
l use
onl
y
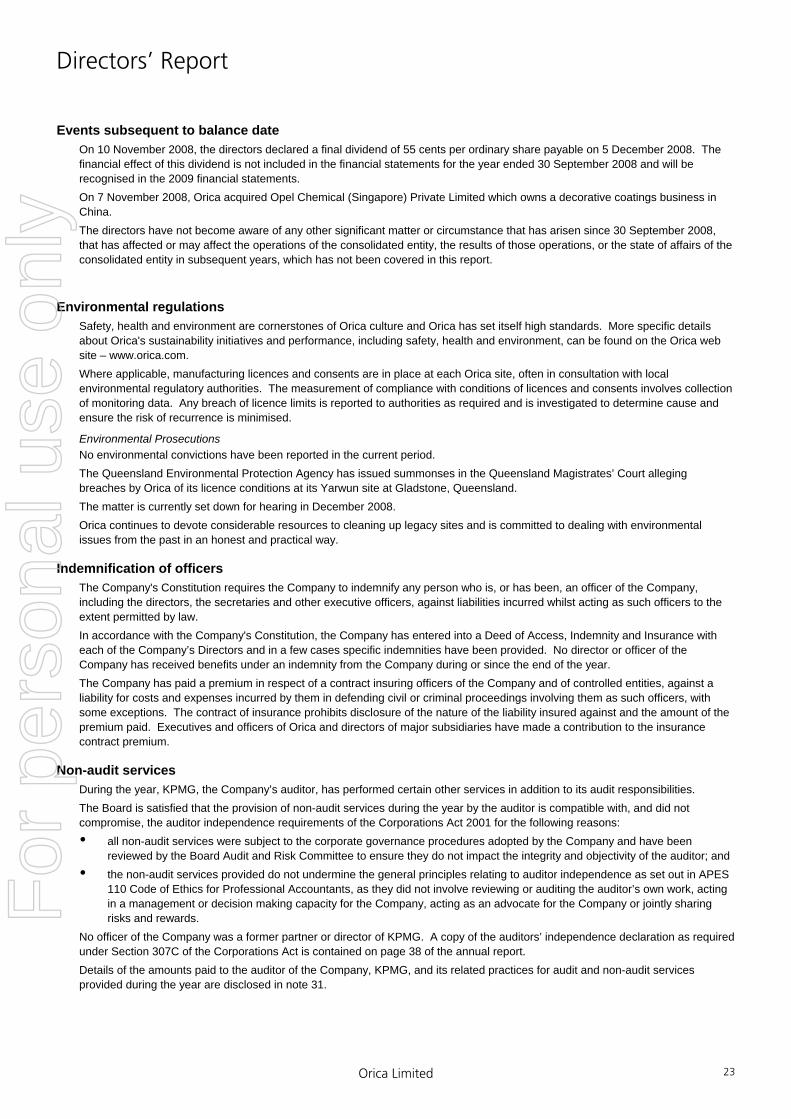
Directors’ Report
Orica Limited 23
Events subsequent to balance date On 10 November 2008, the directors declared a final dividend of 55 cents per ordinary share payable on 5 December 2008. The financial effect of this dividend is not included in the financial statements for the year ended 30 September 2008 and will be recognised in the 2009 financial statements. On 7 November 2008, Orica acquired Opel Chemical (Singapore) Private Limited which owns a decorative coatings business in China. The directors have not become aware of any other significant matter or circumstance that has arisen since 30 September 2008, that has affected or may affect the operations of the consolidated entity, the results of those operations, or the state of affairs of the consolidated entity in subsequent years, which has not been covered in this report.
Environmental regulations Safety, health and environment are cornerstones of Orica culture and Orica has set itself high standards. More specific details about Orica's sustainability initiatives and performance, including safety, health and environment, can be found on the Orica web site – www.orica.com. Where applicable, manufacturing licences and consents are in place at each Orica site, often in consultation with local environmental regulatory authorities. The measurement of compliance with conditions of licences and consents involves collection of monitoring data. Any breach of licence limits is reported to authorities as required and is investigated to determine cause and ensure the risk of recurrence is minimised.
Environmental Prosecutions No environmental convictions have been reported in the current period. The Queensland Environmental Protection Agency has issued summonses in the Queensland Magistrates’ Court alleging breaches by Orica of its licence conditions at its Yarwun site at Gladstone, Queensland. The matter is currently set down for hearing in December 2008. Orica continues to devote considerable resources to cleaning up legacy sites and is committed to dealing with environmental issues from the past in an honest and practical way.
Indemnification of officers The Company's Constitution requires the Company to indemnify any person who is, or has been, an officer of the Company, including the directors, the secretaries and other executive officers, against liabilities incurred whilst acting as such officers to the extent permitted by law. In accordance with the Company's Constitution, the Company has entered into a Deed of Access, Indemnity and Insurance with each of the Company’s Directors and in a few cases specific indemnities have been provided. No director or officer of the Company has received benefits under an indemnity from the Company during or since the end of the year. The Company has paid a premium in respect of a contract insuring officers of the Company and of controlled entities, against a liability for costs and expenses incurred by them in defending civil or criminal proceedings involving them as such officers, with some exceptions. The contract of insurance prohibits disclosure of the nature of the liability insured against and the amount of the premium paid. Executives and officers of Orica and directors of major subsidiaries have made a contribution to the insurance contract premium.
Non-audit services During the year, KPMG, the Company’s auditor, has performed certain other services in addition to its audit responsibilities. The Board is satisfied that the provision of non-audit services during the year by the auditor is compatible with, and did not compromise, the auditor independence requirements of the Corporations Act 2001 for the following reasons: all non-audit services were subject to the corporate governance procedures adopted by the Company and have been
reviewed by the Board Audit and Risk Committee to ensure they do not impact the integrity and objectivity of the auditor; and the non-audit services provided do not undermine the general principles relating to auditor independence as set out in APES
110 Code of Ethics for Professional Accountants, as they did not involve reviewing or auditing the auditor’s own work, acting in a management or decision making capacity for the Company, acting as an advocate for the Company or jointly sharing risks and rewards.
No officer of the Company was a former partner or director of KPMG. A copy of the auditors’ independence declaration as required under Section 307C of the Corporations Act is contained on page 38 of the annual report. Details of the amounts paid to the auditor of the Company, KPMG, and its related practices for audit and non-audit services provided during the year are disclosed in note 31.
For
per
sona
l use
onl
y
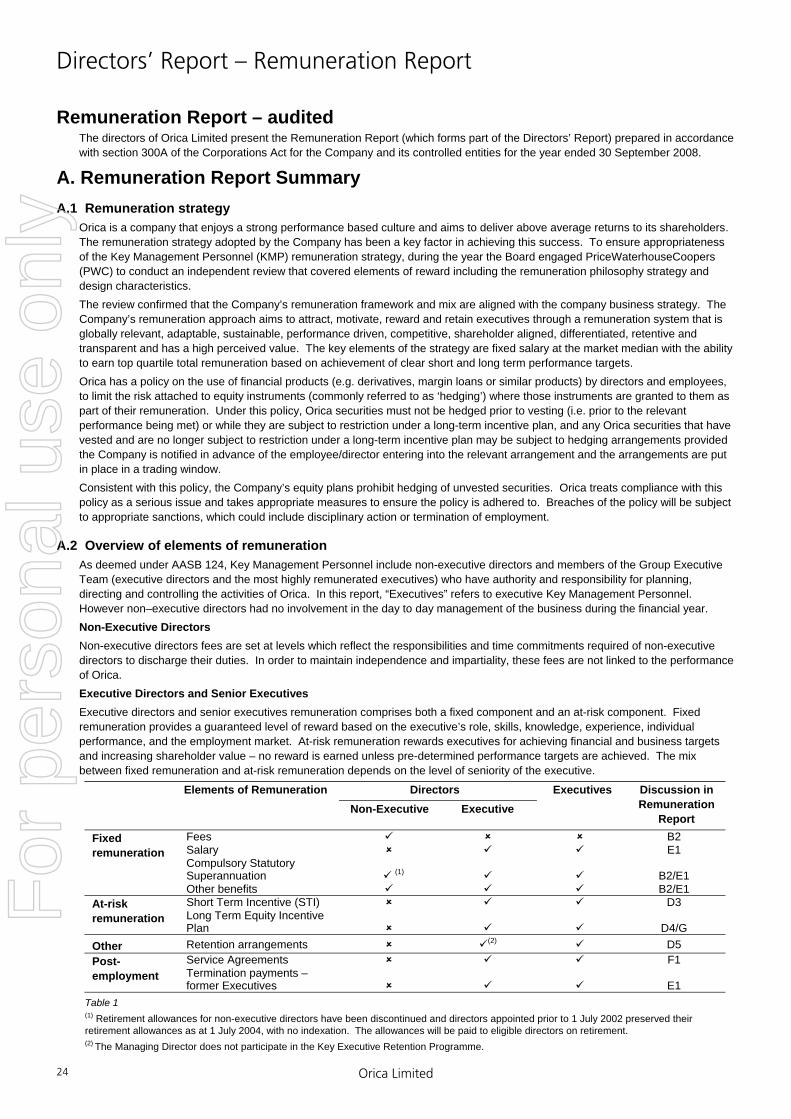
Directors’ Report – Remuneration Report
Orica Limited 24
Remuneration Report – audited The directors of Orica Limited present the Remuneration Report (which forms part of the Directors’ Report) prepared in accordance with section 300A of the Corporations Act for the Company and its controlled entities for the year ended 30 September 2008.
A. Remuneration Report Summary A.1 Remuneration strategy
Orica is a company that enjoys a strong performance based culture and aims to deliver above average returns to its shareholders. The remuneration strategy adopted by the Company has been a key factor in achieving this success. To ensure appropriateness of the Key Management Personnel (KMP) remuneration strategy, during the year the Board engaged PriceWaterhouseCoopers (PWC) to conduct an independent review that covered elements of reward including the remuneration philosophy strategy and design characteristics. The review confirmed that the Company’s remuneration framework and mix are aligned with the company business strategy. The Company’s remuneration approach aims to attract, motivate, reward and retain executives through a remuneration system that is globally relevant, adaptable, sustainable, performance driven, competitive, shareholder aligned, differentiated, retentive and transparent and has a high perceived value. The key elements of the strategy are fixed salary at the market median with the ability to earn top quartile total remuneration based on achievement of clear short and long term performance targets. Orica has a policy on the use of financial products (e.g. derivatives, margin loans or similar products) by directors and employees, to limit the risk attached to equity instruments (commonly referred to as ‘hedging’) where those instruments are granted to them as part of their remuneration. Under this policy, Orica securities must not be hedged prior to vesting (i.e. prior to the relevant performance being met) or while they are subject to restriction under a long-term incentive plan, and any Orica securities that have vested and are no longer subject to restriction under a long-term incentive plan may be subject to hedging arrangements provided the Company is notified in advance of the employee/director entering into the relevant arrangement and the arrangements are put in place in a trading window. Consistent with this policy, the Company’s equity plans prohibit hedging of unvested securities. Orica treats compliance with this policy as a serious issue and takes appropriate measures to ensure the policy is adhered to. Breaches of the policy will be subject to appropriate sanctions, which could include disciplinary action or termination of employment.
A.2 Overview of elements of remuneration As deemed under AASB 124, Key Management Personnel include non-executive directors and members of the Group Executive Team (executive directors and the most highly remunerated executives) who have authority and responsibility for planning, directing and controlling the activities of Orica. In this report, “Executives” refers to executive Key Management Personnel. However non–executive directors had no involvement in the day to day management of the business during the financial year. Non-Executive Directors Non-executive directors fees are set at levels which reflect the responsibilities and time commitments required of non-executive directors to discharge their duties. In order to maintain independence and impartiality, these fees are not linked to the performance of Orica. Executive Directors and Senior Executives Executive directors and senior executives remuneration comprises both a fixed component and an at-risk component. Fixed remuneration provides a guaranteed level of reward based on the executive’s role, skills, knowledge, experience, individual performance, and the employment market. At-risk remuneration rewards executives for achieving financial and business targets and increasing shareholder value – no reward is earned unless pre-determined performance targets are achieved. The mix between fixed remuneration and at-risk remuneration depends on the level of seniority of the executive.
Directors
Elements of Remuneration Non-Executive Executive
Executives Discussion in Remuneration
Report Fees B2 Salary E1 Compulsory Statutory Superannuation
(1)
B2/E1
Fixed remuneration
Other benefits B2/E1 Short Term Incentive (STI) D3 At-risk
remuneration Long Term Equity Incentive Plan
D4/G
Other Retention arrangements (2) D5 Service Agreements F1 Post-
employment Termination payments – former Executives
E1
Table 1 (1) Retirement allowances for non-executive directors have been discontinued and directors appointed prior to 1 July 2002 preserved their retirement allowances as at 1 July 2004, with no indexation. The allowances will be paid to eligible directors on retirement. (2) The Managing Director does not participate in the Key Executive Retention Programme.
For
per
sona
l use
onl
y
Directors’ Report – Remuneration Report
Orica Limited 25
A.3 Key Management Personnel Particulars of Key Management Personnel qualifications, experience and special responsibilities are detailed on pages 12 to 13 of the annual report. All of the current Executives were promoted internally from other roles within the Group reflecting Orica’s commitment to succession planning and development of key talent. The Key Management Personnel to whom this Report applies are:
Name
Role
Commencement Date in current role
Non-Executive Donald Mercer Non-Executive Director 1 October 1997 Michael Beckett Non-Executive Director 15 July 2002 Russell Caplan Non-Executive Director 1 October 2007 Peter Duncan Non-Executive Director 1 June 2001 Garry Hounsell Non-Executive Director 21 September 2004 Peter Kirby Non-Executive Director 22 July 2003 Nora Scheinkestel Non-Executive Director 1 August 2006 Michael Tilley Non-Executive Director 10 November 2003 Catherine Walter Non-Executive Director 1 October 1998 Executives Current Graeme Liebelt Managing Director 1 September 2005 Noel Meehan Executive Director Finance 1 May 2005 Philippe Etienne Chief Executive Officer, Orica Mining Services 1 October 2005 Michael Reich Chief Executive Officer, Minova 1 February 2008 Andrew Larke Group General Manager, Mergers and Acquisitions, Strategy and
Technology 1 June 2006
Greg Witcombe (1) Group General Manager, Chemicals 22 September 2008 John Beevers General Manager, Orica Mining Services Australia/Asia 18 September 2006 Craig Elkington President, Orica Mining Services, North America 1 April 2008 Patrick Houlihan General Manager, Orica Consumer Products 1 February 2007 Former Leaving Date Bronek Karcz General Manager, Chemnet 31 July 2008 Andrew Coleman (2) Group General Manager, Chemicals 19 September 2008
Table 2 The Company Secretary is not considered Key Management Personnel. Accordingly, the Company Secretary has not been included in any Key Management Personnel totals. (1) On 22 September 2008, Greg Witcombe commenced as Group General Manager, Chemicals. Prior to this, Greg Witcombe was General Manager, People and Community. (2) From 18 December 2006, Andrew Coleman was General Manager of Chemical Services. This business was merged with Chemnet on 21 July 2008 to form the Chemicals business. Andrew Coleman held the role of Group General Manager, Chemicals from 21 July 2008 until he ceased employment with the Group on 19 September 2008. This Remuneration Report is signed in accordance with a resolution of the directors of Orica Limited. ------------------------------------------ D P Mercer Chairman of the Remuneration and Appointments Committee 10th November 2008.
For
per
sona
l use
onl
y
Directors’ Report – Remuneration Report
Orica Limited 26
B. Non-Executive Directors’ Remuneration B.1 Policy – independence and impartiality
Non-Executive directors’ fees, including committee fees, are set by the Board within the maximum aggregate amount of $1,800,000 approved by shareholders at the 2005 Annual General Meeting. These fees exclude superannuation benefits and other payments in accordance with rule 48.1 of Orica’s constitution. These fees are set at levels which reflect the time commitments and responsibilities of non-executive directors. In order to maintain independence and impartiality, non-executive directors are not entitled to any form of incentive payments and the level of their fees is not set with reference to measures of Company performance. In setting fees, the Board takes into consideration the Company’s existing remuneration policies, external professional advice, survey data on fees paid by comparable companies and the level of remuneration required to attract and retain directors of the appropriate calibre. From 1 April 2007, non-executive directors receive a fee of $140,000 in relation to their service as a director of the Board, and the Chairman, taking into account the greater commitment required, receives a fee of $420,000. The Chairman’s fees include payment for service on the Remuneration and Appointments Committee and the Corporate Governance and Nominations Committee. From 1 April 2007, directors who sit on the Board’s Audit and Risk Committee and Safety, Health and Environment Committee (SH&E) receive an additional fee of $15,000 per annum, other than Chairs of these Board committees who receive an additional fee of $30,000 per annum. Additional fees of $20,000 per annum are paid for sitting on Special Purpose Committees with Chairs of these Board committees receiving an additional fee of $25,000 per annum. Superannuation contributions are also made. In addition, Non-Executive directors are entitled to be reimbursed for reasonable travel, accommodation and other expenses incurred by the director while engaged on the business of the Company, in accordance with rule 50.2 of Orica’s constitution. Orica has discontinued retirement allowances for all Non-Executive directors. Directors appointed prior to 1 July 2002, have had their retirement allowance preserved (as at 1 July 2004) with no indexation and the allowance will be paid to the eligible directors upon retirement. In accordance with rule 48 of the Company’s constitution, those retirement benefits do not fall within the maximum aggregate fee cap for Non-Executive directors.
B.2 Remuneration Details of Non-Executive Directors remuneration is set out in the following table: For the year to 30 September 2008
Directors Fees (1)
Auditand Risk
Committee (1)
SH&E Committee (1)
Super-annuation Benefits (2)
Due Diligence Committees (1) (3)
Other Benefits (4)
Total
$000 $000 $000 $000 $000 $000 $000D P Mercer, Chairman (5) 420.0 - - 37.8 - - 457.8M E Beckett 140.0 - 15.0 14.0 - - 169.0R R Caplan 140.0 - 11.3 13.6 - - 164.9P J Duncan (5) 140.0 30.0 - 15.3 - - 185.3G A Hounsell (3) 140.0 15.0 - 16.2 25.0 - 196.2P M Kirby (3) 140.0 - 30.0 17.1 20.0 - 207.1N L Scheinkestel (3) 140.0 15.0 - 15.8 20.0 - 190.8M Tilley 140.0 - - 12.6 - - 152.6C M Walter (3) (5) 140.0 - 15.0 16.2 25.0 - 196.2Total Non-Executive Directors 1,540.0 60.0 71.3 158.6 90.0 - 1,919.9 For the year to 30 September 2007 D P Mercer, Chairman (5) 375.0 - - 33.8 - 27.0 435.8M E Beckett 125.0 - 12.5 12.4 - - 149.9P J Duncan (5) 125.0 25.0 - 13.5 - 27.2 190.7G A Hounsell 125.0 12.5 - 12.4 - - 149.9P M Kirby 125.0 - 25.0 13.5 - - 163.5N L Scheinkestel 125.0 12.5 - 12.4 - - 149.9M Tilley 125.0 - - 11.3 - - 136.3C M Walter (5) 125.0 - 12.5 12.4 - - 149.9Total Non-Executive Directors 1,250.0 50.0 50.0 121.7 - 54.2 1,525.9Table 3 (1) Represents actual directors’ remuneration paid during the financial year. (2) Company contributions made on behalf of Non-Executive directors. (3) C Walter chaired and P Kirby was a member of the Rights Issue Committee. G Hounsell chaired and N Scheinkestel was a member of the Demerger Committee. The demerger committee continues to operate in 2009. (4) These benefits relate to spousal travel. (5) If each eligible Non-Executive Director had ceased to be a director on 30 September 2008 and 30 September 2007, the following benefits would have been payable under the grandfathered Directors’ Retirement Scheme: D P Mercer $664,000 (2007 $664,000), P J Duncan $154,800 (2007 $154,800), C M Walter $228,700 (2007 $228,700) (refer Non-Executive Directors’ remuneration above). These benefits have been fully provided for in the financial statements.
For
per
sona
l use
onl
y
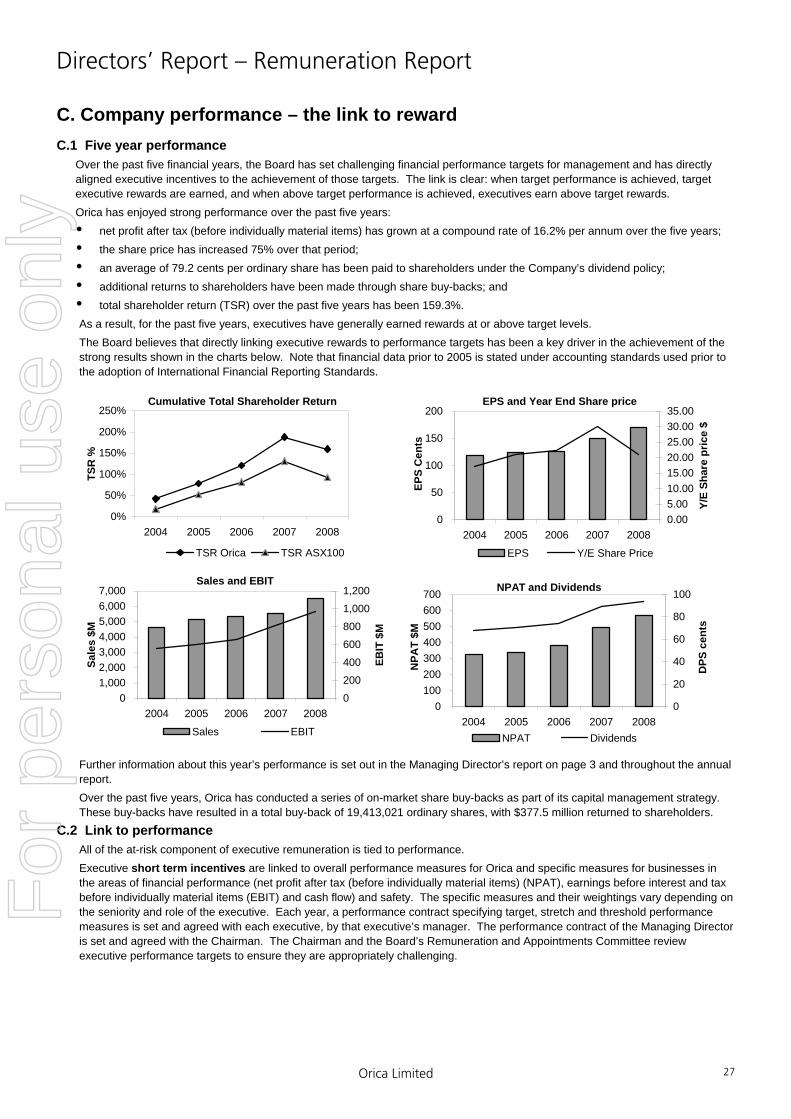
Directors’ Report – Remuneration Report
Orica Limited 27
C. Company performance – the link to reward C.1 Five year performance
Over the past five financial years, the Board has set challenging financial performance targets for management and has directly aligned executive incentives to the achievement of those targets. The link is clear: when target performance is achieved, target executive rewards are earned, and when above target performance is achieved, executives earn above target rewards. Orica has enjoyed strong performance over the past five years: net profit after tax (before individually material items) has grown at a compound rate of 16.2% per annum over the five years; the share price has increased 75% over that period; an average of 79.2 cents per ordinary share has been paid to shareholders under the Company’s dividend policy; additional returns to shareholders have been made through share buy-backs; and total shareholder return (TSR) over the past five years has been 159.3%.
As a result, for the past five years, executives have generally earned rewards at or above target levels. The Board believes that directly linking executive rewards to performance targets has been a key driver in the achievement of the strong results shown in the charts below. Note that financial data prior to 2005 is stated under accounting standards used prior to the adoption of International Financial Reporting Standards.
Further information about this year’s performance is set out in the Managing Director’s report on page 3 and throughout the annual report. Over the past five years, Orica has conducted a series of on-market share buy-backs as part of its capital management strategy. These buy-backs have resulted in a total buy-back of 19,413,021 ordinary shares, with $377.5 million returned to shareholders.
C.2 Link to performance All of the at-risk component of executive remuneration is tied to performance. Executive short term incentives are linked to overall performance measures for Orica and specific measures for businesses in the areas of financial performance (net profit after tax (before individually material items) (NPAT), earnings before interest and tax before individually material items (EBIT) and cash flow) and safety. The specific measures and their weightings vary depending on the seniority and role of the executive. Each year, a performance contract specifying target, stretch and threshold performance measures is set and agreed with each executive, by that executive’s manager. The performance contract of the Managing Director is set and agreed with the Chairman. The Chairman and the Board’s Remuneration and Appointments Committee review executive performance targets to ensure they are appropriately challenging.
EPS and Year End Share price
0
50
100
150
200
2004 2005 2006 2007 2008
EPS
Cen
ts
0.005.0010.0015.0020.0025.0030.0035.00
Y/E
Shar
e pr
ice
$
EPS Y/E Share Price
Sales and EBIT
01,0002,0003,0004,0005,0006,0007,000
2004 2005 2006 2007 2008
Sale
s $M
0
200
400
600
800
1,000
1,200
EBIT
$M
Sales EBIT
Cumulative Total Shareholder Return
0%
50%
100%
150%
200%
250%
2004 2005 2006 2007 2008
TSR
%
TSR Orica TSR ASX100
NPAT and Dividends
0100200300400500600700
2004 2005 2006 2007 2008
NPA
T $M
0
20
40
60
80
100
DPS
cen
ts
NPAT Dividends
For
per
sona
l use
onl
y

Directors’ Report – Remuneration Report
Orica Limited 28
Executive long term incentives (delivered through the Long Term Equity Incentive Plan) are linked to growth in Orica’s share price and growth in Total Shareholder Return (TSR). The table below shows how specific measures of Company performance and shareholder value link to executive at-risk rewards.
2003
2004
2005
2006
2007
2008
External Sales ($m) 3,958.6 4,610.5 5,126.7 5,359.2 5,527.2 6,544.1 Cash flow from operating activities ($m) 500.4 587.9 375.8
413.9 524.3 736.9
EBIT ($m) 442.3 553.3 600.9 657.7 812.7 970.1 NPAT - Net profit after tax (before individually material items) ($m) 270.3 325.6 339.9
380.3
497.8
572.3 All Workers Recordable Case Rate 1.08 0.74 0.85
0.57
0.60
0.72
Dividends per ordinary share (cents) 52.0 68.0 71.0
74.0
89.0
94.0
Return of capital ($m) 49.2 127.5 53.7 81.5 114.8 - Year end share price ($) 12.00 17.30 21.00 22.47 30.10 20.95 Cumulative TSR - Orica (%)
42.57 78.55
120.90 187.70 159.33
Cumulative TSR - ASX 100 (%)
17.64 52.74
81.28 131.46 93.31
Table 4
D. Executive remuneration – driving a performance culture
D.1 Board policy on remuneration The Remuneration and Appointments Committee has recommended, and the Board has adopted, a policy that remuneration for Executives will: reinforce the short, medium and long term objectives of Orica; link the rewards for management to the creation of shareholder value and returns; and be competitive in the markets in which Orica operates in order to attract, motivate and retain high calibre employees.
Details of the composition and responsibilities of the Remuneration and Appointments Committee are set out on page 16. The Committee and senior management receive external advice on matters relating to remuneration. The Board considers it desirable for remuneration packages of Executives to include both a fixed component and an at-risk or performance-related component (comprising both short term and long term incentives). The Board views the at-risk component as an essential driver of Orica’s high performance culture. The mix between fixed remuneration and at-risk remuneration is designed to reflect market conditions at each job and seniority level. For the Managing Director, the split is broadly 35% fixed and 65% at-risk, whilst the split for other Executives is broadly 50% fixed and 50% at-risk, as shown in the table below:
% of Total Annual Remuneration Fixed At-risk Short term incentive (1) Long term incentive Managing Director 35% 20% 45% Other Executives 50% 20% 30%
Table 5 (1) Target STI is set at 50% of the maximum STI. The percentages in table 5 represent the remuneration mix for the Executives where target performance is achieved. The actual remuneration mix for the Executive will vary depending on the level of performance achieved at a Group, business and individual level. Where stretch targets for short term and long term incentives are met, then the proportion of total remuneration derived from these at-risk components will be significantly higher than the percentages shown in table 5. This relatively high weighting of at-risk remuneration reflects the Board’s commitment to performance-based reward. For full details of the remuneration paid to executive directors (including the Managing Director) and Executives for the 2008 financial year, refer to section E below.
D.2 Fixed remuneration All Executives receive a fixed remuneration component. In general, this is expressed as a total amount of salary and other benefits (including statutory superannuation contributions) that may be taken in an agreed form, including cash and superannuation. Fixed remuneration is reviewed annually and is determined by the scope of the individual’s role, their level of knowledge, skills and experience, their individual performance and market benchmarking.
Executive long term incentives are directly linked to share price and TSR growth.
These measures are directly linked to short term incentives. A minimum level of NPAT must be achieved before any incentives are paid.
For
per
sona
l use
onl
y
Directors’ Report – Remuneration Report
Orica Limited 29
D.3 At-risk remuneration – Short Term Incentive Plan (STI) Summary of STI
What is the STI? An annual cash incentive plan linked to specific annual targets (which are predominantly financial). Who participates in the STI?
All Executives.
Why does the Board consider the STI an appropriate incentive?
The STI is designed to put a large proportion of executive remuneration at-risk against meeting targets linked to Orica’s annual business objectives.
Are STIs awarded where performance falls below a minimum threshold performance level?
No STI is awarded if minimum performance across Orica does not meet the required threshold. In recent years, this has been linked to a minimum level of net profit after tax before individually material items that must be achieved before any STI is awarded.
Who assesses the performance of Executives?
The Managing Director, in consultation with the Remuneration and Appointments Committee, assesses the performance of Executives at the end of each financial year.
Who assesses the performance of the Managing Director?
The Remuneration and Appointments Committee sets the targets for the Managing Director and Executive Director Finance at the beginning of each year and assesses performance against those targets at the end of the financial year.
What are the performance conditions?
The performance conditions comprise financial targets relating to: - Net profit after tax (before individually material items); - Business EBIT; and - Cash flow, as well as other targets, including safety, health and environmental performance and talent management. These performance conditions are set at both an Orica level and an individual business level. Achievement of performance conditions may therefore vary between businesses.
Why were these conditions chosen?
The financial targets are set in line with the Group’s annual budget and are intended to improve financial performance which results in greater shareholder wealth. Safety, health and environmental targets build Orica’s culture and commitment to ‘no injuries to anyone, ever’ and ‘valuing people and the environment’. It is this culture that enables Orica to attract and retain high performing people.
Are both target and stretch performance conditions imposed?
Yes. The STI and the performance conditions set under the STI have been designed to motivate and reward high performance. If performance exceeds the already challenging targets, the STI will deliver higher rewards to executives.
Can STI be greater than 100%?
Yes - Executives may achieve greater than 100% of maximum STI where there is uncapped STI for selected significant critical performance items such as EBIT performance.
How well were the performance conditions met in the 2008 financial year?
The performance conditions were generally satisfied above target, with the Group achieving many of its stretch targets.
How would a change of control impact on STI entitlements?
Where there is an actual change of control, the Board would generally be expected to exercise its discretion to pay a proportion of the maximum STI available for that financial year.
Table 6
D.4 At-risk remuneration – Long Term Incentives
D.4.1 Long Term Equity Incentive Plan - (LTEIP) Summary of LTEIP What is the LTEIP? The Orica Long Term Equity Incentive Plan (LTEIP) is the long term incentive component of
remuneration for executives who are able to influence the generation of shareholder wealth by having a direct impact on the Group’s performance. The LTEIP is designed to encourage executives to focus on the key performance drivers which underpin sustainable growth in shareholder value.
Why does the Board consider the structure of the LTEIP appropriate?
The LTEIP facilitates immediate share ownership by the Executives and links a significant proportion of their potential remuneration to Orica’s ongoing share price and returns to shareholders over a three year period. The Board believes the LTEIP promotes behaviour that will achieve superior performance over the long term.
What are the key features of the LTEIP?
Under the LTEIP, eligible executives are provided with an interest free, non-recourse loan from Orica for the sole purpose of acquiring shares in the Company. Executives may not deal with the shares while the loan remains outstanding and any dividends paid on the shares are applied (on an after-tax basis) towards repaying the loan. In order to reward good performance, part of the loan may be forgiven at the end of the three year performance period upon the achievement of specified performance conditions. The loan must be repaid following testing of the performance condition after the three year period or upon the executive ceasing employment with the Group. Under the November 2006 and subsequent
For
per
sona
l use
onl
y
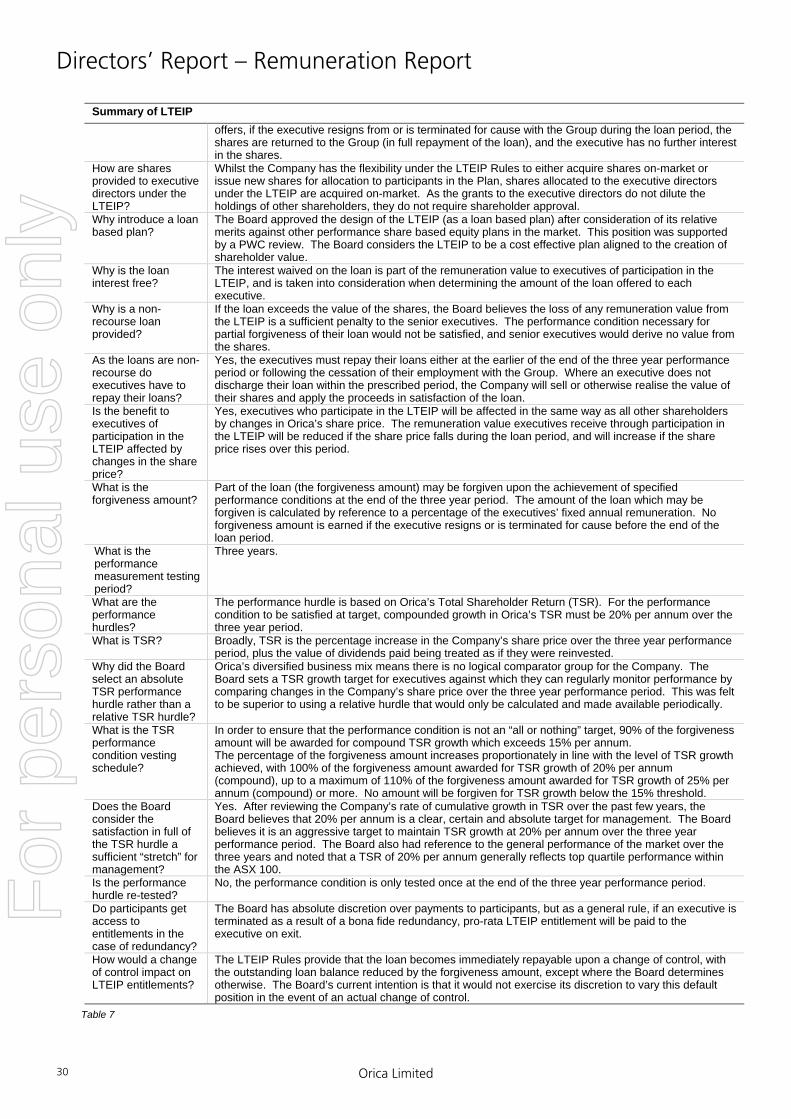
Directors’ Report – Remuneration Report
Orica Limited 30
Summary of LTEIP offers, if the executive resigns from or is terminated for cause with the Group during the loan period, the shares are returned to the Group (in full repayment of the loan), and the executive has no further interest in the shares.
How are shares provided to executive directors under the LTEIP?
Whilst the Company has the flexibility under the LTEIP Rules to either acquire shares on-market or issue new shares for allocation to participants in the Plan, shares allocated to the executive directors under the LTEIP are acquired on-market. As the grants to the executive directors do not dilute the holdings of other shareholders, they do not require shareholder approval.
Why introduce a loan based plan?
The Board approved the design of the LTEIP (as a loan based plan) after consideration of its relative merits against other performance share based equity plans in the market. This position was supported by a PWC review. The Board considers the LTEIP to be a cost effective plan aligned to the creation of shareholder value.
Why is the loan interest free?
The interest waived on the loan is part of the remuneration value to executives of participation in the LTEIP, and is taken into consideration when determining the amount of the loan offered to each executive.
Why is a non-recourse loan provided?
If the loan exceeds the value of the shares, the Board believes the loss of any remuneration value from the LTEIP is a sufficient penalty to the senior executives. The performance condition necessary for partial forgiveness of their loan would not be satisfied, and senior executives would derive no value from the shares.
As the loans are non-recourse do executives have to repay their loans?
Yes, the executives must repay their loans either at the earlier of the end of the three year performance period or following the cessation of their employment with the Group. Where an executive does not discharge their loan within the prescribed period, the Company will sell or otherwise realise the value of their shares and apply the proceeds in satisfaction of the loan.
Is the benefit to executives of participation in the LTEIP affected by changes in the share price?
Yes, executives who participate in the LTEIP will be affected in the same way as all other shareholders by changes in Orica’s share price. The remuneration value executives receive through participation in the LTEIP will be reduced if the share price falls during the loan period, and will increase if the share price rises over this period.
What is the forgiveness amount?
Part of the loan (the forgiveness amount) may be forgiven upon the achievement of specified performance conditions at the end of the three year period. The amount of the loan which may be forgiven is calculated by reference to a percentage of the executives’ fixed annual remuneration. No forgiveness amount is earned if the executive resigns or is terminated for cause before the end of the loan period.
What is the performance measurement testing period?
Three years.
What are the performance hurdles?
The performance hurdle is based on Orica’s Total Shareholder Return (TSR). For the performance condition to be satisfied at target, compounded growth in Orica’s TSR must be 20% per annum over the three year period.
What is TSR? Broadly, TSR is the percentage increase in the Company’s share price over the three year performance period, plus the value of dividends paid being treated as if they were reinvested.
Why did the Board select an absolute TSR performance hurdle rather than a relative TSR hurdle?
Orica’s diversified business mix means there is no logical comparator group for the Company. The Board sets a TSR growth target for executives against which they can regularly monitor performance by comparing changes in the Company’s share price over the three year performance period. This was felt to be superior to using a relative hurdle that would only be calculated and made available periodically.
What is the TSR performance condition vesting schedule?
In order to ensure that the performance condition is not an “all or nothing” target, 90% of the forgiveness amount will be awarded for compound TSR growth which exceeds 15% per annum. The percentage of the forgiveness amount increases proportionately in line with the level of TSR growth achieved, with 100% of the forgiveness amount awarded for TSR growth of 20% per annum (compound), up to a maximum of 110% of the forgiveness amount awarded for TSR growth of 25% per annum (compound) or more. No amount will be forgiven for TSR growth below the 15% threshold.
Does the Board consider the satisfaction in full of the TSR hurdle a sufficient “stretch” for management?
Yes. After reviewing the Company’s rate of cumulative growth in TSR over the past few years, the Board believes that 20% per annum is a clear, certain and absolute target for management. The Board believes it is an aggressive target to maintain TSR growth at 20% per annum over the three year performance period. The Board also had reference to the general performance of the market over the three years and noted that a TSR of 20% per annum generally reflects top quartile performance within the ASX 100.
Is the performance hurdle re-tested?
No, the performance condition is only tested once at the end of the three year performance period.
Do participants get access to entitlements in the case of redundancy?
The Board has absolute discretion over payments to participants, but as a general rule, if an executive is terminated as a result of a bona fide redundancy, pro-rata LTEIP entitlement will be paid to the executive on exit.
How would a change of control impact on LTEIP entitlements?
The LTEIP Rules provide that the loan becomes immediately repayable upon a change of control, with the outstanding loan balance reduced by the forgiveness amount, except where the Board determines otherwise. The Board’s current intention is that it would not exercise its discretion to vary this default position in the event of an actual change of control.
Table 7
For
per
sona
l use
onl
y
Directors’ Report – Remuneration Report
Orica Limited 31
D.4.2 Legacy plans In the period 2001 to 2004, Orica used a Senior Executive Share Loan Plan (SESLP) as the long term incentive for the Group Executive and an Executive Share Option Plan (ESOP) for other senior executives. Prior to this, the Company used a Share Option Plan (SOP) and Share Acquisition Plan (SAP) for senior executives. Further details regarding the legacy share plans that are still active at 30 September 2008 are contained in note 36 to the financial statements.
D.5 Retention Arrangements for the Executives The Board entered into agreements with the Executives during 2007 to participate in the Key Executive Retention Programme (KERP). The Managing Director does not participate in the KERP. In return for participating in the KERP, participants agreed to changes to the terms of their service agreements. The relevant changes comprise an extension of the notice the executive must give to Orica upon termination to six months, as well as an undertaking not to compete with Orica for a period of six months following termination. The KERP has the following key elements:
• participants are eligible to receive a lump sum retention payment equal to 50% of their Fixed Annual Remuneration plus their maximum STI (determined by reference to their remuneration as at 1 January 2007). The amount of the payment is not linked to, or dependent upon, Group performance; and
• participants must be employed with Orica on 31 March 2009 to receive the retention payment, although in exceptional circumstances (e.g. where there is an actual change of control before 31 March 2009 or the employee is made redundant) the Board may elect to make retention payments prior to 31 March 2009.
For
per
sona
l use
onl
y
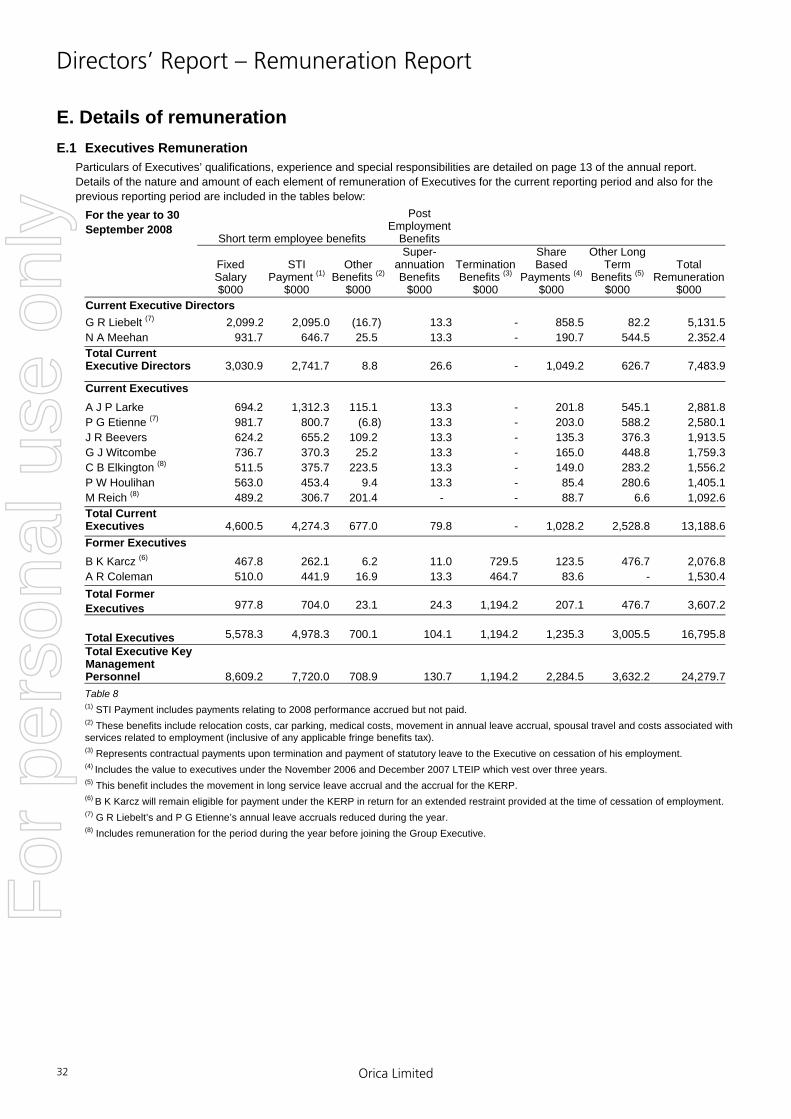
Directors’ Report – Remuneration Report
Orica Limited 32
E. Details of remuneration E.1 Executives Remuneration
Particulars of Executives’ qualifications, experience and special responsibilities are detailed on page 13 of the annual report. Details of the nature and amount of each element of remuneration of Executives for the current reporting period and also for the previous reporting period are included in the tables below:
For the year to 30 September 2008
Short term employee benefits
Post Employment
Benefits
Fixed Salary $000
STI
Payment (1)
$000
Other
Benefits (2)
$000
Super- annuation Benefits
$000
Termination Benefits (3)
$000
Share Based
Payments (4)
$000
Other Long Term
Benefits (5) $000
Total
Remuneration$000
Current Executive Directors G R Liebelt (7) 2,099.2 2,095.0 (16.7) 13.3 - 858.5 82.2 5,131.5N A Meehan 931.7 646.7 25.5 13.3 - 190.7 544.5 2.352.4Total Current Executive Directors
3,030.9 2,741.7
8.8
26.6 -
1,049.2
626.7 7,483.9
Current Executives
A J P Larke 694.2 1,312.3 115.1 13.3 - 201.8 545.1 2,881.8P G Etienne (7) 981.7 800.7 (6.8) 13.3 - 203.0 588.2 2,580.1J R Beevers 624.2 655.2 109.2 13.3 - 135.3 376.3 1,913.5G J Witcombe 736.7 370.3 25.2 13.3 - 165.0 448.8 1,759.3C B Elkington (8) 511.5 375.7 223.5 13.3 - 149.0 283.2 1,556.2P W Houlihan 563.0 453.4 9.4 13.3 - 85.4 280.6 1,405.1M Reich (8) 489.2 306.7 201.4 - - 88.7 6.6 1,092.6Total Current Executives
4,600.5 4,274.3
677.0 79.8 -
1,028.2
2,528.8 13,188.6
Former Executives B K Karcz (6) 467.8 262.1 6.2 11.0 729.5 123.5 476.7 2,076.8A R Coleman 510.0 441.9 16.9 13.3 464.7 83.6 - 1,530.4Total Former Executives
977.8 704.0
23.1 24.3 1,194.2
207.1
476.7 3,607.2
Total Executives
5,578.3 4,978.3
700.1 104.1 1,194.2
1,235.3
3,005.5 16,795.8
Total Executive Key Management Personnel
8,609.2 7,720.0
708.9 130.7 1,194.2
2,284.5
3,632.2 24,279.7Table 8 (1) STI Payment includes payments relating to 2008 performance accrued but not paid. (2) These benefits include relocation costs, car parking, medical costs, movement in annual leave accrual, spousal travel and costs associated with services related to employment (inclusive of any applicable fringe benefits tax). (3) Represents contractual payments upon termination and payment of statutory leave to the Executive on cessation of his employment. (4) Includes the value to executives under the November 2006 and December 2007 LTEIP which vest over three years. (5) This benefit includes the movement in long service leave accrual and the accrual for the KERP. (6) B K Karcz will remain eligible for payment under the KERP in return for an extended restraint provided at the time of cessation of employment. (7) G R Liebelt’s and P G Etienne’s annual leave accruals reduced during the year. (8) Includes remuneration for the period during the year before joining the Group Executive.
For
per
sona
l use
onl
y

Directors’ Report – Remuneration Report
Orica Limited 33
Executives remuneration (continued)
Short term employee benefits
Post Employment
Benefits
For the year to 30 September 2007
Fixed Salary $000
STI
Payment (1)
$000
Other
Benefits (2)
$000
Super- annuation Benefits
$000
Termination Benefits (3)
$000
Share Based
Payments (4)
$000
Other Long Term
Benefits (5) $000
Total
Remuneration$000
Current Executive Directors
G R Liebelt 1,850.0 2,277.6 174.8 12.8 - 289.8 208.7 4,813.7N A Meehan 855.0 683.3 111.5 12.8 - 69.5 427.4 2,159.5Total Current Executive Directors 2,705.0 2,960.9
286.3 25.6 -
359.3 636.1 6,973.2
Current Executives
P G Etienne 906.3 737.2 47.1 12.8 - 74.9 490.2 2,268.5A J P Larke 532.5 865.0 61.2 12.8 - 92.7 402.4 1,966.6G J Witcombe (6) 710.8 516.7 (24.0) 12.8 - 66.0 342.0 1,624.3J R Beevers 590.5 471.8 115.8 12.8 - 53.1 306.0 1,550.0B K Karcz 537.5 228.2 6.3 12.8 - 48.3 251.6 1,084.7P W Houlihan (7) 389.7 256.6 78.8 12.8 - 16.6 298.9 1,053.4A R Coleman 385.2 245.6 28.2 12.8 - 20.0 218.2 910.0Total Current Executives 4,052.5 3,321.1
313.4 89.6 -
371.6 2,309.3 10,457.5
Former Executives P G Bailey 255.0 - 1.2 5.3 651.3 - 19.1 931.9Total Executives 4,307.5 3,321.1 314.6 94.9 651.3 371.6 2,328.4 11,389.4
Total Executive Key Management Personnel 7,012.5 6,282.0
600.9 120.5 651.3
730.9 2,964.5 18,362.6Table 9
(1) STI Payment includes payments relating to 2007 performance accrued but not paid. (2) These benefits include relocation costs, car parking, medical costs, movement in annual leave accrual, spousal travel and costs associated with services related to employment (inclusive of any applicable fringe benefits tax). (3) Represents contractual payments upon termination and payment of statutory leave to the executive on cessation of his employment. (4) Includes the value to executives under the November 2006 LTEIP which vests over three years. The amounts for the 2007 financial year do not include any expense from previous LTEIP offers which vested immediately. (5) This benefit includes the movement in long service leave accrual and the accrual for the KERP. (6) G J Witcombe’s annual leave accrual reduced during the year. (7) Includes remuneration for the period during the year before joining the Group Executive.
E.2 Executives STI Specific information relating to the percentage of the STI which is payable and the percentage that was forfeited for the Executives of the Company and the Group is set out in the table below:
For the year to 30 September 2008
Actual STI payment ($) (1) (2)
Actual STI payment as % of maximum STI (3)
% of maximum STI payment forfeited
Current Executives G R Liebelt 2,095.0 81.2 18.8 N A Meehan 646.7 84.2 15.8 A J P Larke 1,312.3 107.9 - P G Etienne 800.7 99.1 0.9 J R Beevers 655.2 126.0 - G J Witcombe 370.3 60.9 39.1 C B Elkington 375.7 88.1 11.9 P W Houlihan 453.4 96.9 3.1 M Reich 306.7 63.9 36.1 Former Executives B K Karcz 262.1 56.0 44.0 A R Coleman 441.9 101.3 -
Table 10 (1) STI constitutes a cash incentive earned during 2008, and is expected to be paid in December 2008. (2) A minimum level of net profit after tax must be achieved before any STI is paid. Therefore the minimum potential value of the STI for the financial year was nil. (3) Executives may achieve greater than 100% of maximum STI where there is uncapped STI for selected significant critical performance items such as EBIT performance.
For
per
sona
l use
onl
y

Directors’ Report – Remuneration Report
Orica Limited 34
E.3 Equity instruments granted to and exercised by Executives The value of options granted during the year and the value of any options granted in a previous year that were exercised during the year relating to Executives is set out below. The value of the options granted, as valued by PWC, is the fair value calculated at grant date using an adjusted form of the Black Scholes option pricing model.
For the year to 30 September 2008
Options Granted Number
Options Granted (1) (2) (3)
($)
Options Exercised (4)
Number
Options Exercised (4)
($) Current Executive Directors G R Liebelt 193,639 2,042,891 71,194 924,500 N A Meehan 40,664 429,005 6,624 86,027 Total Current Executive Directors 234,303 2,471,896 77,818 1,010,527 Current Executives A J P Larke 34,338 362,266 16,676 216,566 P G Etienne 42,923 452,838 13,874 227,945 J R Beevers 27,109 286,000 12,292 160,148 G J Witcombe 32,531 343,202 45,840 595,298 C B Elkington 24,082 254,065 12,487 208,615 P W Houlihan 24,850 262,168 4,975 80,927 M Reich 27,109 286,000 - - Total Current Executives 212,942 2,246,539 106,144 1,489,499 Former Executives B K Karcz 24,850 262,168 15,075 195,775 A R Coleman 22,591 238,335 5,592 66,977 Total Former Executives 47,441 500,503 20,667 262,752 Total Executives 494,686 5,218,938 204,629 2,762,778
Table 11 (1) Under the LTEIP, eligible Executives are provided with an interest free, non-recourse loan from the Group for the sole purpose of acquiring shares in Orica. Executives must apply net cash dividends to the repayment of the loan balance and may not deal with the shares while the loan remains outstanding. Australian Accounting Standards require that shares issued under employee incentive share plans in conjunction with non-recourse loans are to be accounted for as options. As a result, the amounts receivable from employees in relation to these loans have not been recognised in the financial statements. Further details are set out in sections D.4.1, E.4 and G of this report. (2) The options have been valued by PWC at $10.55 per option. The benefit of the options granted under the November 06 and subsequent LTEIP offers will lapse during future years if the Executive ceases employment with the Group before the end of the three year performance period. (3) The grants made to Executives under the LTEIP during the year constituted 100% of the grants available for the year. The minimum potential value of grants made during the year under LTEIP is nil. (4) Options exercised relate to the December 2004 LTEIP issue. No options were forfeited during the year. The value of each option exercised is the market value of Orica shares on the date of exercise, less the exercise price paid.
E.4 Loans to Executives under Group long term incentive plans For the year to 30 September 2008
Opening balance
$
Advances during the
year (1) $
Forgiveness during the
year (2) $
Repayments during the year
(2) $
Closing balance
$
Interest
free value $
Highest
indebtedness$
Current Executive Directors G R Liebelt 7,526,458 6,149,975 333,590 1,206,071 12,136,772 748,582 13,266,880 N A Meehan 2,134,781 1,291,489 31,048 148,762 3,246,460 200,538 3,369,714 Total Current Executive Directors
9,661,239 7,441,464 364,638 1,354,833
15,383,232 949,120 16,636,594
Current Executives A J P Larke 1,996,293 1,090,575 78,155 284,551 2,724,162 172,433 2,988,454 P G Etienne 2,429,300 1,363,234 65,025 259,808 3,467,701 216,136 3,700,053 J R Beevers 1,631,853 860,982 57,611 214,715 2,220,509 139,220 2,435,224 G J Witcombe 2,785,156 1,033,185 214,832 715,102 2,888,407 194,439 3,579,319 C B Elkington 1,566,284 764,844 58,521 214,359 2,058,248 129,956 2,256,509 P W Houlihan 447,993 789,236 23,315 84,881 1,129,033 65,459 1,209,567 M Reich 132,662 860,982 - 7,417 986,227 53,563 993,644 Total Current Executives
10,989,541 6,763,038 497,459 1,780,833 15,474,287 971,206 17,162,770
Former Executives B K Karcz 1,614,932 789,236 70,652 287,026 2,046,490 114,894 2,318,609 A R Coleman 524,953 717,490 26,211 94,769 1,121,463 65,882 1,129,782 Total Former Executives
2,139,885 1,506,726 96,863 381,795 3,167,953 180,776 3,448,391
Total Executives 22,790,665 15,711,228 958,960 3,517,461 34,025,472 2,101,102 37,247,755 Table 12 (1) Under the LTEIP, eligible Executives are provided with an interest free, non-recourse loan from the Group for the sole purpose of acquiring shares in Orica. Executives must apply net cash dividends to the repayment of the loan balance, and executives may not deal with the shares while the loan remains outstanding. Australian Accounting Standards require that shares issued under employee incentive share plans in conjunction with non-recourse loans are to be accounted for as options. As a result, the amounts receivable from employees in relation to these loans have not been recognised in the financial statements. (2) Constitutes repayments including after tax dividends paid on the shares applied against the loan. Loans were forgiven during the year relating to the December 2004 LTEIP offer.
For
per
sona
l use
onl
y
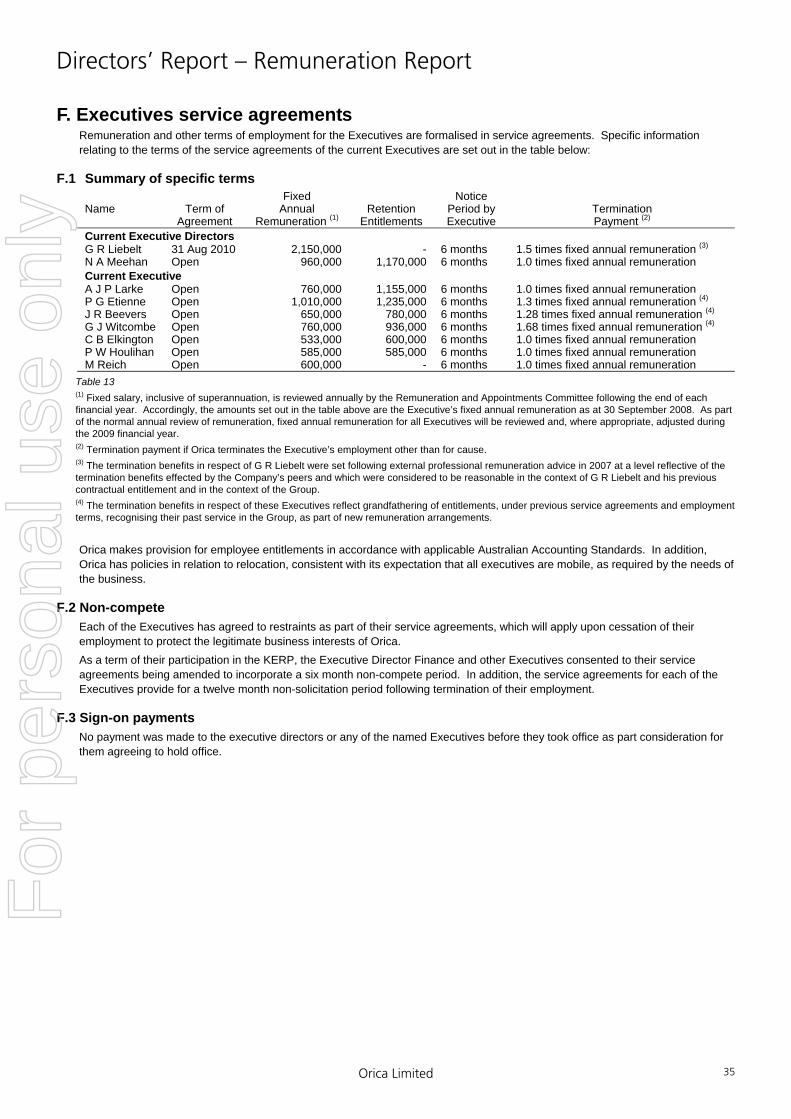
Directors’ Report – Remuneration Report
Orica Limited 35
F. Executives service agreements Remuneration and other terms of employment for the Executives are formalised in service agreements. Specific information relating to the terms of the service agreements of the current Executives are set out in the table below:
F.1 Summary of specific terms Name
Term of
Agreement
Fixed Annual
Remuneration (1)
Retention
Entitlements
Notice Period by Executive
Termination Payment (2)
Current Executive Directors G R Liebelt 31 Aug 2010 2,150,000 - 6 months 1.5 times fixed annual remuneration (3)
N A Meehan Open 960,000 1,170,000 6 months 1.0 times fixed annual remuneration Current Executive A J P Larke Open 760,000 1,155,000 6 months 1.0 times fixed annual remuneration P G Etienne Open 1,010,000 1,235,000 6 months 1.3 times fixed annual remuneration (4) J R Beevers Open 650,000 780,000 6 months 1.28 times fixed annual remuneration (4) G J Witcombe Open 760,000 936,000 6 months 1.68 times fixed annual remuneration (4) C B Elkington Open 533,000 600,000 6 months 1.0 times fixed annual remuneration P W Houlihan Open 585,000 585,000 6 months 1.0 times fixed annual remuneration M Reich Open 600,000 - 6 months 1.0 times fixed annual remuneration
Table 13 (1) Fixed salary, inclusive of superannuation, is reviewed annually by the Remuneration and Appointments Committee following the end of each financial year. Accordingly, the amounts set out in the table above are the Executive’s fixed annual remuneration as at 30 September 2008. As part of the normal annual review of remuneration, fixed annual remuneration for all Executives will be reviewed and, where appropriate, adjusted during the 2009 financial year. (2) Termination payment if Orica terminates the Executive’s employment other than for cause. (3) The termination benefits in respect of G R Liebelt were set following external professional remuneration advice in 2007 at a level reflective of the termination benefits effected by the Company’s peers and which were considered to be reasonable in the context of G R Liebelt and his previous contractual entitlement and in the context of the Group. (4) The termination benefits in respect of these Executives reflect grandfathering of entitlements, under previous service agreements and employment terms, recognising their past service in the Group, as part of new remuneration arrangements. Orica makes provision for employee entitlements in accordance with applicable Australian Accounting Standards. In addition, Orica has policies in relation to relocation, consistent with its expectation that all executives are mobile, as required by the needs of the business.
F.2 Non-compete Each of the Executives has agreed to restraints as part of their service agreements, which will apply upon cessation of their employment to protect the legitimate business interests of Orica. As a term of their participation in the KERP, the Executive Director Finance and other Executives consented to their service agreements being amended to incorporate a six month non-compete period. In addition, the service agreements for each of the Executives provide for a twelve month non-solicitation period following termination of their employment.
F.3 Sign-on payments No payment was made to the executive directors or any of the named Executives before they took office as part consideration for them agreeing to hold office.
For
per
sona
l use
onl
y
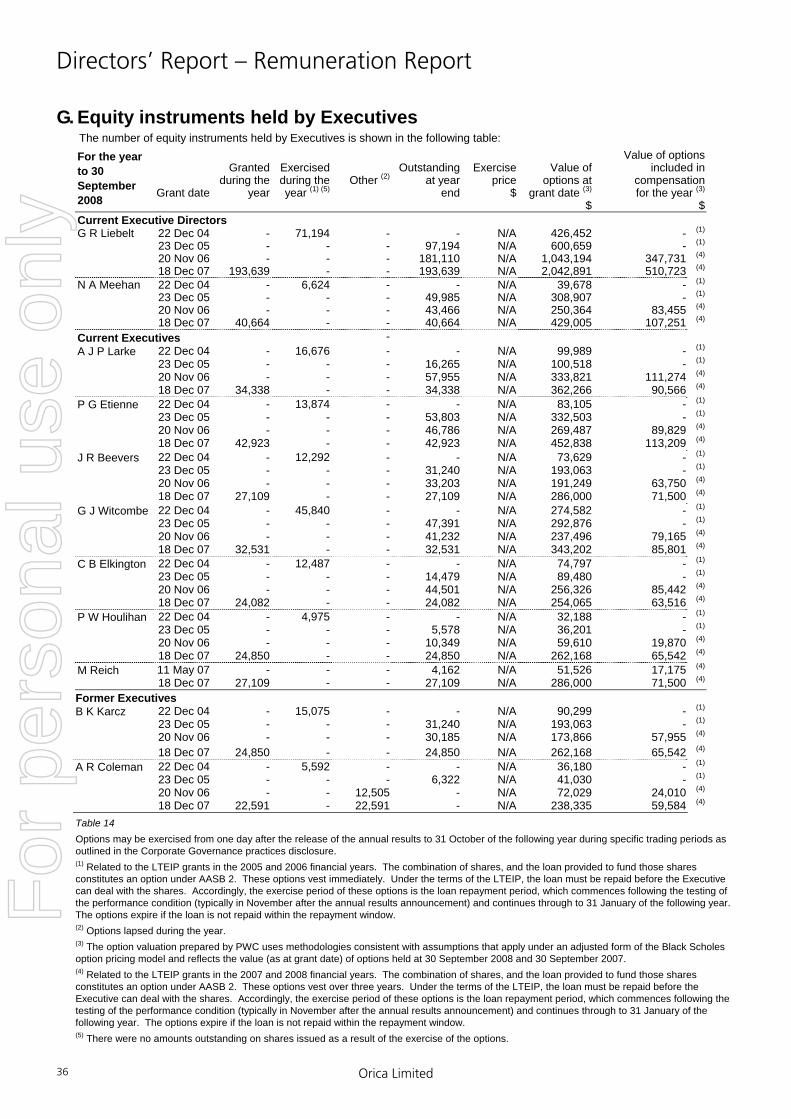
Directors’ Report – Remuneration Report
Orica Limited 36
G. Equity instruments held by Executives The number of equity instruments held by Executives is shown in the following table: For the year to 30 September 2008
Grant date
Granted
during the year
Exercised during the year (1) (5)
Other (2)Outstanding
at yearend
Exercise price
$
Value of
options at grant date (3)
$
Value of options included in
compensation for the year (3)
$Current Executive Directors G R Liebelt 22 Dec 04 - 71,194 - - N/A 426,452 - (1)
23 Dec 05 - - - 97,194 N/A 600,659 - (1)
20 Nov 06 - - - 181,110 N/A 1,043,194 347,731 (4)
18 Dec 07 193,639 - - 193,639 N/A 2,042,891 510,723 (4)
N A Meehan 22 Dec 04 - 6,624 - - N/A 39,678 - (1)
23 Dec 05 - - - 49,985 N/A 308,907 - (1)
20 Nov 06 - - - 43,466 N/A 250,364 83,455 (4)
18 Dec 07 40,664 - - 40,664 N/A 429,005 107,251 (4)
Current Executives - A J P Larke 22 Dec 04 - 16,676 - - N/A 99,989 - (1)
23 Dec 05 - - - 16,265 N/A 100,518 - (1)
20 Nov 06 - - - 57,955 N/A 333,821 111,274 (4)
18 Dec 07 34,338 - - 34,338 N/A 362,266 90,566 (4)
P G Etienne 22 Dec 04 - 13,874 - - N/A 83,105 - (1)
23 Dec 05 - - - 53,803 N/A 332,503 - (1)
20 Nov 06 - - - 46,786 N/A 269,487 89,829 (4)
18 Dec 07 42,923 - - 42,923 N/A 452,838 113,209 (4)
J R Beevers 22 Dec 04 - 12,292 - - N/A 73,629 - (1)
23 Dec 05 - - - 31,240 N/A 193,063 - (1)
20 Nov 06 - - - 33,203 N/A 191,249 63,750 (4)
18 Dec 07 27,109 - - 27,109 N/A 286,000 71,500 (4)
G J Witcombe 22 Dec 04 - 45,840 - - N/A 274,582 - (1)
23 Dec 05 - - - 47,391 N/A 292,876 - (1)
20 Nov 06 - - - 41,232 N/A 237,496 79,165 (4)
18 Dec 07 32,531 - - 32,531 N/A 343,202 85,801 (4)
C B Elkington 22 Dec 04 - 12,487 - - N/A 74,797 - (1)
23 Dec 05 - - - 14,479 N/A 89,480 - (1)
20 Nov 06 - - - 44,501 N/A 256,326 85,442 (4)
18 Dec 07 24,082 - - 24,082 N/A 254,065 63,516 (4)
P W Houlihan 22 Dec 04 - 4,975 - - N/A 32,188 - (1)
23 Dec 05 - - - 5,578 N/A 36,201 - (1)
20 Nov 06 - - - 10,349 N/A 59,610 19,870 (4)
18 Dec 07 24,850 - - 24,850 N/A 262,168 65,542 (4)
M Reich 11 May 07 - - - 4,162 N/A 51,526 17,175 (4)
18 Dec 07 27,109 - - 27,109 N/A 286,000 71,500 (4)
Former Executives B K Karcz 22 Dec 04 - 15,075 - - N/A 90,299 - (1)
23 Dec 05 - - - 31,240 N/A 193,063 - (1)
20 Nov 06 - - - 30,185 N/A 173,866 57,955 (4)
18 Dec 07 24,850 - - 24,850 N/A 262,168 65,542 (4)
A R Coleman 22 Dec 04 - 5,592 - - N/A 36,180 - (1)
23 Dec 05 - - - 6,322 N/A 41,030 - (1)
20 Nov 06 - - 12,505 - N/A 72,029 24,010 (4)
18 Dec 07 22,591 - 22,591 - N/A 238,335 59,584 (4)
Table 14 Options may be exercised from one day after the release of the annual results to 31 October of the following year during specific trading periods as outlined in the Corporate Governance practices disclosure. (1) Related to the LTEIP grants in the 2005 and 2006 financial years. The combination of shares, and the loan provided to fund those shares constitutes an option under AASB 2. These options vest immediately. Under the terms of the LTEIP, the loan must be repaid before the Executive can deal with the shares. Accordingly, the exercise period of these options is the loan repayment period, which commences following the testing of the performance condition (typically in November after the annual results announcement) and continues through to 31 January of the following year. The options expire if the loan is not repaid within the repayment window. (2) Options lapsed during the year. (3) The option valuation prepared by PWC uses methodologies consistent with assumptions that apply under an adjusted form of the Black Scholes option pricing model and reflects the value (as at grant date) of options held at 30 September 2008 and 30 September 2007. (4) Related to the LTEIP grants in the 2007 and 2008 financial years. The combination of shares, and the loan provided to fund those shares constitutes an option under AASB 2. These options vest over three years. Under the terms of the LTEIP, the loan must be repaid before the Executive can deal with the shares. Accordingly, the exercise period of these options is the loan repayment period, which commences following the testing of the performance condition (typically in November after the annual results announcement) and continues through to 31 January of the following year. The options expire if the loan is not repaid within the repayment window. (5) There were no amounts outstanding on shares issued as a result of the exercise of the options.
For
per
sona
l use
onl
y
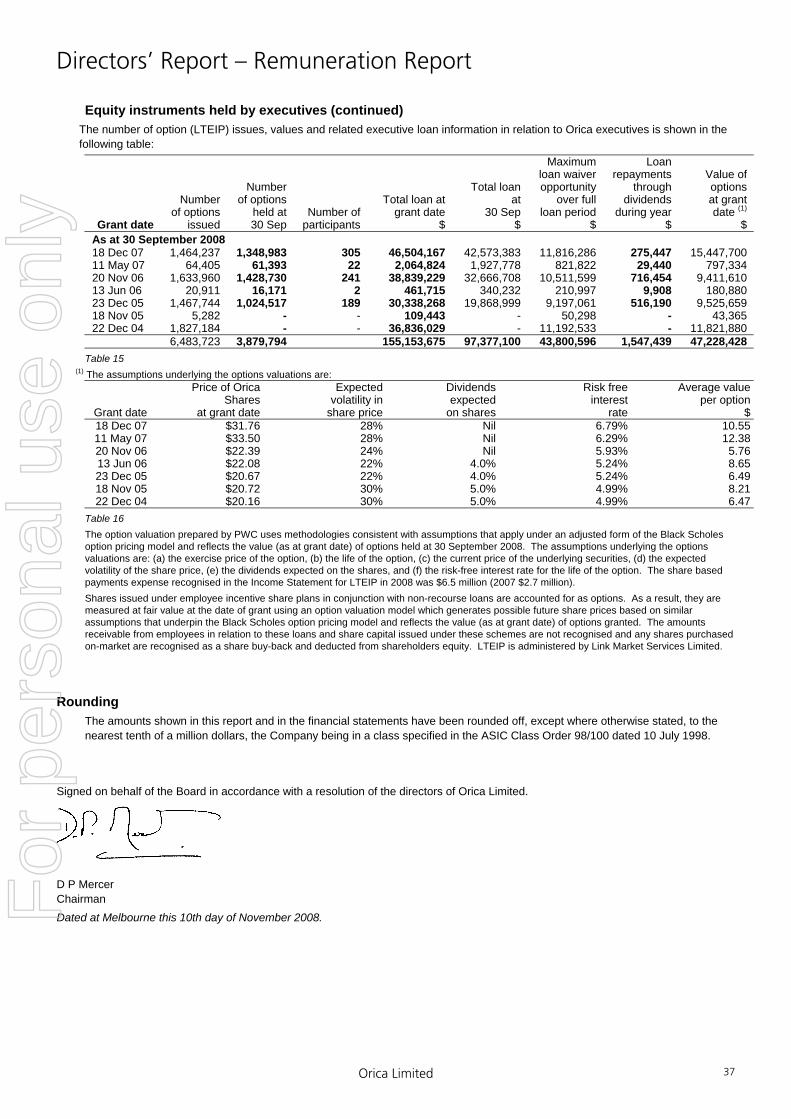
Directors’ Report – Remuneration Report
Orica Limited 37
Equity instruments held by executives (continued) The number of option (LTEIP) issues, values and related executive loan information in relation to Orica executives is shown in the following table:
Grant date
Number of options
issued
Number of options
held at 30 Sep
Number of participants
Total loan at grant date
$
Total loan at
30 Sep$
Maximum loan waiver opportunity
over full loan period
$
Loan repayments
through dividends
during year$
Value of options
at grant date (1)
$ As at 30 September 2008 18 Dec 07 1,464,237 1,348,983 305 46,504,167 42,573,383 11,816,286 275,447 15,447,700 11 May 07 64,405 61,393 22 2,064,824 1,927,778 821,822 29,440 797,334 20 Nov 06 1,633,960 1,428,730 241 38,839,229 32,666,708 10,511,599 716,454 9,411,610 13 Jun 06 20,911 16,171 2 461,715 340,232 210,997 9,908 180,880 23 Dec 05 1,467,744 1,024,517 189 30,338,268 19,868,999 9,197,061 516,190 9,525,659 18 Nov 05 5,282 - - 109,443 - 50,298 - 43,365 22 Dec 04 1,827,184 - - 36,836,029 - 11,192,533 - 11,821,880
6,483,723 3,879,794 155,153,675 97,377,100 43,800,596 1,547,439 47,228,428 Table 15
(1) The assumptions underlying the options valuations are:
Grant date
Price of Orica Shares
at grant date
Expected volatility in
share price
Dividends expected on shares
Risk free interest
rate
Average value per option
$ 18 Dec 07 $31.76 28% Nil 6.79% 10.5511 May 07 $33.50 28% Nil 6.29% 12.3820 Nov 06 $22.39 24% Nil 5.93% 5.7613 Jun 06 $22.08 22% 4.0% 5.24% 8.6523 Dec 05 $20.67 22% 4.0% 5.24% 6.4918 Nov 05 $20.72 30% 5.0% 4.99% 8.2122 Dec 04 $20.16 30% 5.0% 4.99% 6.47
Table 16 The option valuation prepared by PWC uses methodologies consistent with assumptions that apply under an adjusted form of the Black Scholes option pricing model and reflects the value (as at grant date) of options held at 30 September 2008. The assumptions underlying the options valuations are: (a) the exercise price of the option, (b) the life of the option, (c) the current price of the underlying securities, (d) the expected volatility of the share price, (e) the dividends expected on the shares, and (f) the risk-free interest rate for the life of the option. The share based payments expense recognised in the Income Statement for LTEIP in 2008 was $6.5 million (2007 $2.7 million). Shares issued under employee incentive share plans in conjunction with non-recourse loans are accounted for as options. As a result, they are measured at fair value at the date of grant using an option valuation model which generates possible future share prices based on similar assumptions that underpin the Black Scholes option pricing model and reflects the value (as at grant date) of options granted. The amounts receivable from employees in relation to these loans and share capital issued under these schemes are not recognised and any shares purchased on-market are recognised as a share buy-back and deducted from shareholders equity. LTEIP is administered by Link Market Services Limited.
Rounding The amounts shown in this report and in the financial statements have been rounded off, except where otherwise stated, to the nearest tenth of a million dollars, the Company being in a class specified in the ASIC Class Order 98/100 dated 10 July 1998.
Signed on behalf of the Board in accordance with a resolution of the directors of Orica Limited. D P Mercer Chairman Dated at Melbourne this 10th day of November 2008.
For
per
sona
l use
onl
y

Lead Auditor’s Independence Declaration
Orica Limited 38
Lead auditor’s independence declaration under Section 307C of the Corporations Act 2001 To: the directors of Orica Limited I declare that, to the best of my knowledge and belief, in relation to the audit for the financial year ended 30 September 2008 there have been:
(i) no contraventions of the auditor independence requirements as set out in the Corporations Act 2001 in relation to the audit; and
(ii) no contraventions of any applicable code of professional conduct in relation to the audit.
KPMG
Alison Kitchen Partner Melbourne, 10 November 2008
For
per
sona
l use
onl
y
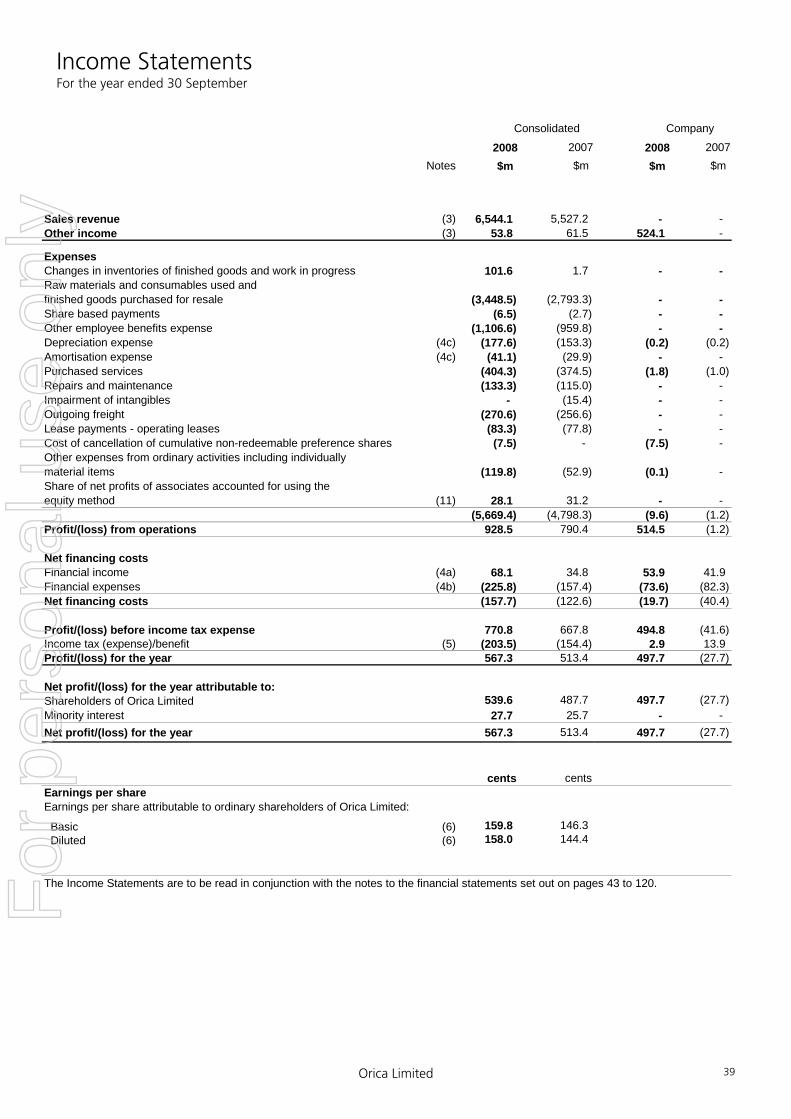
Income Statements For the year ended 30 September
Orica Limited 39
2008 2007 2008 2007Notes $m $m $m $m
Sales revenue (3) 6,544.1 5,527.2 - - Other income (3) 53.8 61.5 524.1 -
ExpensesChanges in inventories of finished goods and work in progress 101.6 1.7 - - Raw materials and consumables used and finished goods purchased for resale (3,448.5) (2,793.3) - - Share based payments (6.5) (2.7) - - Other employee benefits expense (1,106.6) (959.8) - - Depreciation expense (4c) (177.6) (153.3) (0.2) (0.2)Amortisation expense (4c) (41.1) (29.9) - - Purchased services (404.3) (374.5) (1.8) (1.0)Repairs and maintenance (133.3) (115.0) - - Impairment of intangibles - (15.4) - - Outgoing freight (270.6) (256.6) - - Lease payments - operating leases (83.3) (77.8) - - Cost of cancellation of cumulative non-redeemable preference shares (7.5) - (7.5) - Other expenses from ordinary activities including individuallymaterial items (119.8) (52.9) (0.1) - Share of net profits of associates accounted for using the equity method (11) 28.1 31.2 - -
(5,669.4) (4,798.3) (9.6) (1.2)Profit/(loss) from operations 928.5 790.4 514.5 (1.2)
Net financing costsFinancial income (4a) 68.1 34.8 53.9 41.9Financial expenses (4b) (225.8) (157.4) (73.6) (82.3)Net financing costs (157.7) (122.6) (19.7) (40.4)
Profit/(loss) before income tax expense 770.8 667.8 494.8 (41.6)Income tax (expense)/benefit (5) (203.5) (154.4) 2.9 13.9Profit/(loss) for the year 567.3 513.4 497.7 (27.7)
Net profit/(loss) for the year attributable to:Shareholders of Orica Limited 539.6 487.7 497.7 (27.7)Minority interest 27.7 25.7 - - Net profit/(loss) for the year 567.3 513.4 497.7 (27.7)
cents centsEarnings per shareEarnings per share attributable to ordinary shareholders of Orica Limited:
Basic (6) 159.8 146.3 Diluted (6) 158.0 144.4
The Income Statements are to be read in conjunction with the notes to the financial statements set out on pages 43 to 120.
Consolidated Company
For
per
sona
l use
onl
y
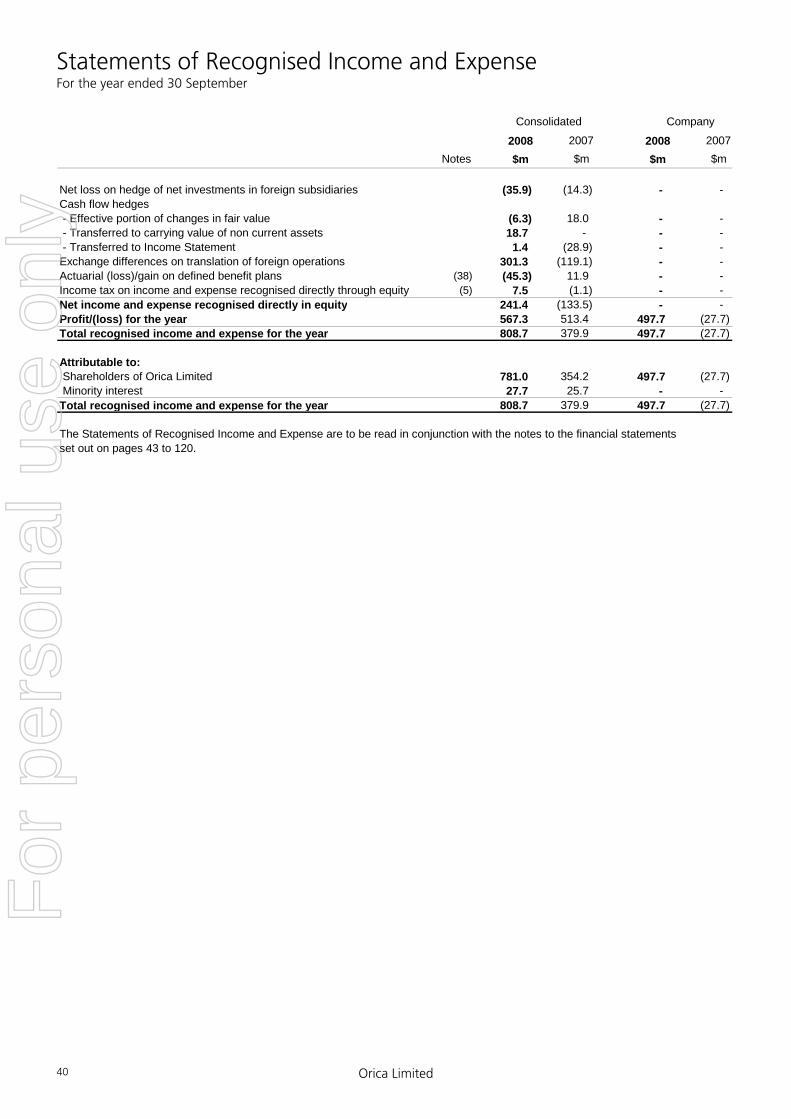
Statements of Recognised Income and Expense For the year ended 30 September
Orica Limited 40
2008 2007 2008 2007Notes $m $m $m $m
Net loss on hedge of net investments in foreign subsidiaries (35.9) (14.3) - - Cash flow hedges - Effective portion of changes in fair value (6.3) 18.0 - - - Transferred to carrying value of non current assets 18.7 - - - - Transferred to Income Statement 1.4 (28.9) - - Exchange differences on translation of foreign operations 301.3 (119.1) - - Actuarial (loss)/gain on defined benefit plans (38) (45.3) 11.9 - - Income tax on income and expense recognised directly through equity (5) 7.5 (1.1) - - Net income and expense recognised directly in equity 241.4 (133.5) - - Profit/(loss) for the year 567.3 513.4 497.7 (27.7)Total recognised income and expense for the year 808.7 379.9 497.7 (27.7)
Attributable to: Shareholders of Orica Limited 781.0 354.2 497.7 (27.7) Minority interest 27.7 25.7 - - Total recognised income and expense for the year 808.7 379.9 497.7 (27.7)
The Statements of Recognised Income and Expense are to be read in conjunction with the notes to the financial statementsset out on pages 43 to 120.
Consolidated Company
For
per
sona
l use
onl
y

Balance Sheets As at 30 September
Orica Limited 41
2008 2007 2008 2007Notes $m $m $m $m
Current assetsCash and cash equivalents (7) 321.3 370.7 - - Trade and other receivables (8) 1,147.4 915.9 971.6 767.1 Other financial assets - derivative assets (12) 96.3 28.1 - - Inventories (9) 824.3 604.3 - - Other assets (10) 68.9 36.2 0.1 - Total current assets 2,458.2 1,955.2 971.7 767.1 Non-current assetsTrade and other receivables (8) 111.0 109.5 100.0 100.0 Investments accounted for using the equity method (11) 208.3 124.5 - - Other financial assets (12) 1.0 1.1 1,915.1 1,915.0 Property, plant and equipment (13) 2,052.3 1,742.9 26.0 26.2 Intangible assets (14) 3,012.6 2,055.5 - - Deferred tax assets (15) 164.1 222.5 5.5 5.2 Other assets (10) 0.3 3.2 - - Total non-current assets 5,549.6 4,259.2 2,046.6 2,046.4 Total assets 8,007.8 6,214.4 3,018.3 2,813.5 Current liabilitiesTrade and other payables (16) 1,372.7 921.6 - 8.4 Other financial liabilities - derivative liabilities (16) 138.7 121.1 - - Interest bearing liabilities (17) 266.4 582.7 72.6 1,218.1 Current tax liabilities (18) 28.3 62.6 37.3 40.6 Provisions (19) 273.5 269.7 - - Total current liabilities 2,079.6 1,957.7 109.9 1,267.1 Non-current liabilitiesTrade and other payables (16) 31.8 4.9 - - Interest bearing liabilities (17) 1,075.4 1,093.7 - 2.0 Deferred tax liabilities (20) 83.8 117.6 - - Provisions (19) 418.8 412.9 1.1 1.1 Total non-current liabilities 1,609.8 1,629.1 1.1 3.1 Total liabilities 3,689.4 3,586.8 111.0 1,270.2 Net assets 4,318.4 2,627.6 2,907.3 1,543.3 Equity Ordinary shares (21) 1,881.3 702.4 1,881.3 702.4 Reserves (22) 91.3 (188.5) - - Retained earnings (22) 1,758.9 1,562.8 536.0 350.9 Total equity attributable to ordinary shareholders of Orica 3,731.5 2,076.7 2,417.3 1,053.3 Equity attributable to Step-Up Preference Securities holders (21) 490.0 490.0 490.0 490.0 Minority interest in controlled entities (23) 96.9 60.9 - - Total equity (24) 4,318.4 2,627.6 2,907.3 1,543.3
The Balance Sheets are to be read in conjunction with the notes to the financial statements set out on pages 43 to 120.
Consolidated Company
For
per
sona
l use
onl
y

Statements of Cash Flows For the year ended 30 September
Orica Limited 42
2008 2007 2008 2007Notes $m $m $m $m
Inflows/ Inflows/ Inflows/ Inflows/(Outflows) (Outflows) (Outflows) (Outflows)
Cash flows from operating activitiesReceipts from customers 6,946.8 6,025.2 - - Payments to suppliers and employees (5,929.8) (5,307.4) (1.8) (4.1)Interest received 69.3 37.0 52.9 42.0 Borrowing costs (217.8) (145.3) (82.0) (79.2) Dividends received 20.4 21.0 524.1 82.6 Other operating revenue received 38.0 35.2 - - Net income taxes (paid)/refund (190.0) (141.4) 5.6 (30.8) Net cash flows from operating activities (26) 736.9 524.3 498.8 10.5Cash flows from investing activitiesPayments for property, plant and equipment (414.4) (304.8) - - Payments for intangibles (11.9) (32.2) - - Payments for purchase of investments - (20.1) (0.1) - Payments for minorities' share of controlled entities (27) (3.0) (20.5) - - Payments for purchase of businesses/controlled entities (27) (866.2) (917.7) - - Proceeds from sale of property, plant and equipment 19.6 23.9 - 2.7Proceeds from sale of investments - 10.8 - - Proceeds from sale of businesses/controlled entities (28) 5.9 88.8 - - Net cash flows (used in)/from investing activities (1,270.0) (1,171.8) (0.1) 2.7Cash flows from financing activitiesCancellation of cumulative non-redeemable preference shares (9.5) - (9.5) - Net movement in short term financing (376.9) 459.0 (1,342.1) 403.4Payments for finance leases (3.1) - - - Proceeds from issue of ordinary shares 900.6 26.3 900.6 26.3Proceeds from issue of ordinary shares - underwritten DRP 156.5 - 156.5 - Payments for buy-back of ordinary shares - (114.8) - (114.8)Payments for buy-back of ordinary shares - LTEIP (7.5) (39.2) (7.5) (39.2)Proceeds from issue of shares to minority interests 12.2 - - - Dividends paid - Orica ordinary shares (155.2) (244.5) (155.2) (244.5)Distributions paid - Step-Up Preference Securities (41.5) (44.4) (41.5) (44.4)Dividends paid - minority interests (10.4) (17.6) - - Net cash flows from/(used in) financing activities 465.2 24.8 (498.7) (13.2)Net decrease in cash held (67.9) (622.7) - - Cash at the beginning of the period 367.7 1,008.2 - - Effects of exchange rate changes on cash 12.5 (17.8) - - Cash at the end of the year (26) 312.3 367.7 - -
The Statements of Cash Flows are to be read in conjunction with the notes to the financial statements set out on pages 43 to 120.
Consolidated Company
For
per
sona
l use
onl
y
Notes to the Financial Statements For the year ended 30 September 2008
Orica Limited 43
1 Accounting policies 44
2 Segment report 51
3 Sales revenue and other income 56
4 Specific profit and loss income and expenses 56
5 Income tax expense 58
6 Earnings per share (EPS) 62
7 Cash and cash equivalents 62
8 Trade and other receivables 63
9 Inventories 66
10 Other assets 66
11 Investments accounted for using the equity method 67
12 Other financial assets 68
13 Property, plant and equipment 69
14 Intangible assets 71
15 Deferred tax assets 72
16 Trade and other payables 72
17 Interest bearing liabilities 73
18 Current tax liabilities 74
19 Provisions 74
20 Deferred tax liabilities 77
21 Contributed equity 77
22 Reserves and retained earnings 81
23 Minority interests in controlled entities 82
24 Total equity reconciliation 83
25 Dividends and distributions 84
26 Notes to the statements of cash flows 85
27 Businesses acquired 86
28 Businesses disposed 88
29 Impairment testing of goodwill and intangibles with indefinite lives 89
30 Commitments 90
31 Auditors’ remuneration 91
32 Critical accounting judgements and estimates 91
33 Contingent liabilities and contingent assets 93
34 Financial and capital management 95
35 Events subsequent to balance date 106
36 Employee share plans 106
37 Related party disclosures 109
38 Superannuation commitments 112
39 Investments in controlled entities 117
40 Deed of cross guarantee 120
For
per
sona
l use
onl
y
Notes to the Financial Statements For the year ended 30 September 2008
Orica Limited 44
1. Accounting policies The significant accounting policies adopted in preparing the financial report of Orica Limited (‘the Company’ or ‘Orica’) and of its controlled entities (collectively ‘the consolidated entity’ or ‘the Group’) are stated below to assist in a general understanding of this financial report.
(i) Basis of preparation The financial report has been prepared on a historical cost basis, except for derivative financial instruments and investments in financial assets (other than controlled entities and associates) which have been measured at fair value. The carrying values of recognised assets and liabilities that are hedged items in fair value hedges, and are otherwise carried at cost, are adjusted to record changes in the fair value attributable to the risks that are being hedged.
(ii) Statement of compliance The financial report is a general purpose financial report which has been prepared in accordance with the requirements of applicable Australian Accounting Standards including Australian Interpretations and the Corporations Act 2001 and complies with International Financial Reporting Standards (IFRS) and interpretations adopted by the International Accounting Standards Board. The financial statements were approved by the Board of Directors on 10 November 2008. The financial report is presented in Australian dollars which is Orica’s functional and presentation currency. This financial report has been prepared on the basis of Australian Accounting Standards and Interpretations on issue that are effective, or early adopted by Orica as at 30 September 2008. Except as described below, the accounting policies applied by the Group in the financial report are the same as those applied by the consolidated entity in its consolidated financial report for the year ended 30 September 2007. The standards relevant to Orica that have been adopted during the year are: • AASB 7 Financial Instruments: Disclosures. • AASB 2005-10 Amendments to Australian Accounting
Standards amending AASB 132 Financial Instruments: Presentation and Disclosure, AASB 101 Presentation of Financial Statements, AASB 114 Segment Reporting, AASB 117 Leases, AASB 133 Earnings per share, AASB 139 Financial Instruments: Recognition and Measurement, AASB 1 First-time adoption of Australian Equivalents to International Reporting Standards, AASB 4 Insurance Contracts, AASB 1023 General Insurance Contracts, AASB 1038 Life Insurance Contracts.
• AASB 2008-4 Amendments to Australian Accounting Standard – Key Management Personnel Disclosures by Disclosing Entities.
• AASB 2008-7 Amendments to Australian Accounting Standards
The standards relevant to Orica that have been early adopted during the year are:
• AASB 2008-1 Amendments to Australian Accounting Account Standard – Share based payments: Vesting Conditions and Cancellations.
• AASB 2008-2 Amendments to Australian Accounting Standards – Puttable Financial Instruments and Obligations arising on Liquidation.
These standards have had no significant impact on the financial statements or impacts only disclosure. The standards and interpretations relevant to Orica that have not been early adopted are: • AASB 8 Operating Segments – applicable from annual
reporting periods beginning on or after 1 January 2009. • AASB 2007-3 Amendments to Australian Accounting
Standards arising from AASB 8 [AASB 5 Non-current Assets Held for Sale and Discontinued Operations, AASB 6 Exploration for and Evaluation of Mineral Resources, AASB 102 Inventories, AASB 107 Cash Flow Statements, AASB 119 Employee Benefits, AASB 127 Consolidated and Separate Financial Statements, AASB 134 Interim Financial Reporting, AASB 136 Impairment of Assets, AASB 1023 General Insurance Contracts, and AASB 1038 Life Insurance Contracts] – applicable from annual reporting periods beginning on or after 1 January 2009. These amendments arise from the issuance of AASB 8 Operating Segments.
• AASB Interpretation 14 AASB 119 – The Limit on a Defined Benefit Asset, Minimum Funding Requirements and their Interaction – applicable from annual reporting periods beginning on or after 1 January 2008.
• AASB 101 Presentation of Financial Statements – applicable from annual reporting periods beginning on or after 1 January 2009.
• AASB 2007-8 Amendments to Australian Accounting Standards arising from AASB 101 – applicable from annual reporting periods beginning on or after 1 January 2009.
• AASB 2007-10 Further Amendments to Australian Accounting Standards arising from AASB 101 – applicable from annual reporting periods beginning on or after 1 January 2009.
• AASB 2008-3 Amendments to Australian Accounting Standards arising from AASB 3 and AASB 127 – applicable from annual reporting periods beginning on or after 1 July 2009.
• AASB 3 Business Combinations and AASB 127 Consolidated and Separate Financial Statements – applicable from annual reporting periods beginning on or after 1 July 2009.
• AASB 2008-8 Amendments to Australian Accounting Standards – Eligible Hedged Items – applicable for annual reporting periods beginning on or after 1 July 2009.
• AASB 2008-5 Amendments to Australian Accounting Standards arising from the Annual Improvements Project - applicable for annual reporting periods beginning on or after 1 January 2009.
• AASB 2008-6 Further Amendments to Australian Accounting Standards arising from the Annual Improvements Project - applicable for annual reporting periods beginning on or after 1 July 2009.
The consolidated entity expects to adopt these standards and interpretations in the 2009 and subsequent financial reports - however they are not expected to have a significant impact on the financial results of the Company or the consolidated entity.
For
per
sona
l use
onl
y

Notes to the Financial Statements For the year ended 30 September 2008
Orica Limited 45
1. Accounting policies (continued)
(iii) Consolidation The consolidated financial statements are prepared by combining the financial statements of all the entities that comprise the consolidated entity, being the Company (the parent entity) and its subsidiaries as defined in Accounting Standard AASB 127 Consolidated and Separate Financial Statements. Consistent accounting policies are employed in the preparation and presentation of the consolidated financial statements. On acquisition, the assets, liabilities and contingent liabilities of a subsidiary are measured at their fair values at the date of acquisition. Any excess of the cost of acquisition over the fair values of the identifiable net assets acquired is recognised as goodwill. If, after reassessment, the fair values of the identifiable net assets acquired exceed the cost of acquisition, the excess is credited to the Income Statement in the period of acquisition. The interest of minority shareholders is stated at the minority’s proportion of the fair values of the assets and liabilities and contingent liabilities recognised. The consolidated financial statements include the information and results of each subsidiary from the date on which the Company obtains control until such time as the Company ceases to control such entity. In preparing the consolidated financial statements, all intercompany balances, transactions and unrealised profits arising within the consolidated entity are eliminated in full.
(iv) Revenue recognition Sales revenue External sales are measured at the fair value of the consideration received or receivable, net of returns, trade discounts and volume rebates. External sales are recognised when the significant risks and rewards of ownership are transferred to the purchaser, recovery of the consideration is probable, the associated costs and possible return of goods can be estimated reliably, there is no continuing management involvement with the goods, and the amount of revenue can be measured reliably.
Other income Profits and losses from sale of businesses, controlled entities and other non-current assets are recognised when there is a signed unconditional contract of sale. Dividends are recognised in the Income Statements when declared. Construction contracts Contract revenue and expenses are recognised on an individual contract basis using the percentage of completion method when the stage of contract completion can be reliably determined, costs to date can be clearly identified, and total contract revenue and costs to complete can be reliably estimated. Stage of completion is measured by reference to an assessment of total costs incurred to date as a percentage of estimated total costs for each contract. Revenue is recognised to the extent of costs incurred. An expected loss is recognised immediately as an expense.
(v) Financial income & borrowing costs Financial income Financial income includes interest income on funds invested and the non designated portion of the net investment hedging derivatives. These are recognised in the Income Statement as accrued. Borrowing costs Borrowing costs include interest, unwinding of the effect of discounting on provisions, amortisation of discounts or premiums relating to borrowings and amortisation of ancillary costs incurred in connection with the arrangement of borrowings, including lease finance charges. Borrowing costs are expensed as incurred unless they relate to qualifying assets. Where funds are borrowed specifically for the production of a qualifying asset, the interest on those funds is capitalised, net of any interest earned on those borrowings. Where funds are borrowed generally, borrowing costs are capitalised using a weighted average interest rate.
(vi) Research and development costs Research costs are expensed as incurred. Development costs are expensed as incurred except when it is probable that future economic benefits associated with the item will flow to the consolidated entity, in which case they are capitalised.
(vii) Share based payments Equity settled share based payments are externally measured at fair value at the date of grant using an option valuation model. This valuation model generates possible future share prices based on similar assumptions that underpin relevant option pricing models and reflects the value (as at grant date) of options granted. The assumptions underlying the options valuations are: (a) the exercise price of the option, (b) the life of the option, (c) the current price of the underlying securities, (d) the expected volatility of the share price, (e) the dividends expected on the shares and (f) the risk-free interest rate for the life of the option. The fair value determined at the grant date of the equity settled share based payments is expensed in the Income Statement on a straight-line basis over the relevant vesting period. The amount recognised is adjusted to reflect the actual number of share options that vest, except for those that fail to vest due to market conditions not being met. Shares issued under employee incentive share plans in conjunction with non-recourse loans are accounted for as options. As a result, the amounts receivable from employees in relation to these loans and share capital issued under these schemes are not recognised and any shares purchased on-market are recognised as a share buy-back and deducted from shareholders equity.
(viii) Taxation Income tax on the profit or loss for the year comprises current and deferred tax and is recognised in the Income Statements. Current tax is the expected tax payable on the taxable income for the year, using tax rates enacted or substantively enacted at reporting date, and any adjustments to tax payable in respect of previous years.
For
per
sona
l use
onl
y
Notes to the Financial Statements For the year ended 30 September 2008
Orica Limited 46
1. Accounting policies (continued) Under AASB 112 Income Taxes, deferred tax balances are determined using the balance sheet method which calculates temporary differences based on the carrying amounts of an entity's assets and liabilities in the balance sheets and their associated tax bases. Current and deferred taxes attributable to amounts recognised directly in equity are also recognised directly in equity. The amount of deferred tax provided will be based on the expected manner of realisation of the asset or settlement of the liability, using tax rates enacted or substantively enacted at reporting date. A deferred tax asset will be recognised only to the extent that it is probable that future taxable profits will be available against which the asset can be utilised. Deferred tax assets will be reduced to the extent it is no longer probable that the related tax benefit will be realised.
Tax consolidation Orica Limited is the parent entity in the tax consolidated group comprising all wholly-owned Australian entities. Due to the existence of a tax sharing agreement between the entities in the tax consolidated group, the parent entity recognises the tax effects of its own transactions and the current tax liabilities and the deferred tax assets arising from unused tax losses and unused tax credits assumed from the subsidiary entities. Current tax income/expense, deferred tax liabilities and deferred tax assets arising from temporary differences of the members of the tax-consolidated group are recognised in the separate financial statements of the members of the tax-consolidated group using the ‘separate taxpayer within group’ approach by reference to the carrying amounts of assets and liabilities in the separate financial statements of each entity and the tax values applying under tax consolidation. In accordance with the tax sharing agreement, the subsidiary entities are compensated for the assets and liabilities assumed by the parent entity as intercompany receivables and payables and for amounts which equal the amounts initially recognised by the subsidiary entities. There is no adjustment for tax consolidation contribution by (or distribution to) equity participants.
(ix) Inventories Inventories are valued at the lower of cost and net realisable value. Net realisable value is the estimated selling price in the ordinary course of business less the estimated cost of completion and selling expenses. Cost is based on the first-in, first-out or weighted average method based on the type of inventory. For manufactured goods, cost includes direct material and fixed overheads based on normal operating capacity. For merchanted goods, cost is net cost into store.
(x) Construction work in progress Where the Group manufactures equipment for sale, the work in progress is carried at cost plus profit recognised to date based on the value of work completed less progress billings and less provision for foreseeable losses allocated between amounts due from customers and amounts due to customers.
(xi) Trade and other receivables Trade and other receivables are recognised at their cost less any impairment losses.
Collectability of trade and other receivables is reviewed on an ongoing basis. Debts that are known to be uncollectible are written off. An impairment loss is recognised when there is objective evidence that the Group will not be able to collect amounts due according to the original terms of the receivables.
Derecognition A number of customers use bank facilities that are guaranteed or partially guaranteed by Orica. Where the entire risks and rewards relating to these facilities have been transferred to the financial institution, the receivable is derecognised. Where this has not occurred, the receivable and the equivalent interest bearing liability have been recognised in the Balance Sheet.
(xii) Investments accounted for using the equity method Investments in associates are accounted for in the consolidated financial statements using the equity method of accounting. Associates are those entities over which the consolidated entity exercises significant influence, but does not control.
(xiii) Other financial assets The consolidated entity’s interests in financial assets other than controlled entities and associates are stated at market value. Investments in subsidiaries and associates are accounted for in the Company’s financial statements at their cost of acquisition.
(xiv) Non-current assets held for sale and disposal groups Immediately before classification as held for sale, the measurement of the assets (and all assets and liabilities in a disposal group) is reassessed in accordance with applicable accounting standards. Then, on initial classification as held for sale, non-current assets and disposal groups are recognised at the lower of carrying amount and fair value less costs to sell. Impairment losses on initial classification as held for sale are included in the Income Statement. The same applies to gains and losses on subsequent remeasurement. Classification as a disposal group occurs when the operation meets the criteria to be classified as held for sale.
(xv) Property, plant and equipment and depreciation Property, plant and equipment are stated at cost less accumulated depreciation and impairment. Cost includes expenditure that is directly attributable to the acquisition of the item. Subsequent costs are included in the asset’s carrying amount or recognised as a separate asset, as appropriate, only when it is probable that future economic benefits associated with the item will flow to the consolidated entity and the cost of the item can be measured reliably. Property, plant and equipment, other than freehold land, is depreciated on a straight-line basis at rates calculated to allocate the cost less the estimated residual value over the estimated useful life of each asset to the consolidated entity. The assets' residual values, useful lives and depreciation methods are reviewed, and adjusted if appropriate, at each financial year end.
For
per
sona
l use
onl
y
Notes to the Financial Statements For the year ended 30 September 2008
Orica Limited 47
1. Accounting policies (continued) Estimated useful lives of each class of asset are as follows: Buildings and improvements 25 to 40 years Machinery, plant and equipment 3 to 30 years Profits and losses on disposal of property, plant and equipment are taken to the Income Statements.
(xvi) Leased assets Leases under which the consolidated entity assumes substantially all the risks and benefits of ownership are classified as finance leases. Other leases are classified as operating leases. Assets under finance lease are capitalised at the present value of the minimum lease payments and amortised on a straight-line basis over the period during which benefits are expected to flow from the use of the leased assets. A corresponding liability is established and each lease payment is allocated between finance charges and reduction of the liability. Operating leases are not capitalised and lease rental payments are taken to the Income Statement on a straight-line basis.
(xvii) Intangible assets Identifiable intangibles Amounts paid for the acquisition of identifiable intangible assets are capitalised at the fair value of consideration paid determined by reference to independent valuations. Identifiable intangible assets with a finite life (customer contracts, patents, software, brand names, trademarks and licences) are amortised on a straight-line basis over their expected useful life to the consolidated entity, being up to thirty years. Identifiable intangible assets with an indefinite life (brand names and trademarks) are not amortised but the recoverable amount of these assets is tested for impairment at least annually as explained under impairment of assets (see note XXV).
Unidentifiable intangibles Where the fair value of the consideration paid for a business acquisition exceeds the fair value of the identifiable assets, liabilities and contingent liabilities acquired, the difference is treated as goodwill. Goodwill is not amortised but the recoverable amount is tested for impairment at least annually as explained under impairment of assets (see note XXV).
Subsequent expenditure Subsequent expenditure on capitalised intangible assets is capitalised only when it increases the future economic benefits embodied in the specific asset to which it relates. All other expenditure is expensed as incurred.
(xviii) Interest-bearing liabilities Interest-bearing liabilities are initially recognised at fair value less attributable transaction costs. Subsequent to initial recognition, interest-bearing liabilities are stated at amortised cost with any difference between cost and redemption value being recognised in the Income Statements over the period of the liabilities on an effective interest basis. Amortised cost is calculated by taking into account any issue costs and any discount or premium on issuance. Gains and
losses are recognised in the Income Statement in the event that the liabilities are derecognised.
(xix) Provisions A provision is recognised when there is a legal or constructive obligation as a result of a past event and it is probable that a future sacrifice of economic benefits will be required to settle the obligation, the timing or amount of which is uncertain. If the effect is material, a provision is determined by discounting the expected future cash flows (adjusted for expected future risks) required to settle the obligation at a rate that reflects current market assessments of the time value of money and the risks specific to the liability. The unwinding of the effect of discounting on provisions is recognised as a borrowing cost.
Environmental Estimated costs for the remediation of soil, groundwater and untreated waste that have arisen as a result of past events are provided for where a legal or constructive obligation exists and a reliable estimate of the liability is able to be assessed. However, where the cost relates to land held for resale then, to the extent that the expected realisation exceeds both the book value of the land and the estimated cost of remediation, the cost is capitalised as part of the holding value of that land. For sites where there are uncertainties with respect to what Orica’s remediation obligations might be or what remediation techniques might be approved and no reliable estimate can presently be made of regulatory and remediation costs, no amounts have been capitalised, expensed or provided for.
Decommissioning The present value of the estimated costs of dismantling and removing an asset and restoring the site on which it is located are recognised as an asset within property, plant and equipment which is depreciated on a straight line basis over its estimated useful life and a corresponding provision is raised where a legal or constructive obligation exists. At each reporting date, the liability is remeasured in line with changes in discount rates, timing and estimated cash flows. Any changes in the liability are added or deducted from the related asset, other than the unwinding of the discount which is recognised as borrowing costs in the Income Statement.
Self insurance The Group self-insures for certain insurance risks. Outstanding claims are recognised when an incident occurs that may give rise to a claim and are measured at the cost that the entity expects to incur in settling the claims.
Employee entitlements Provisions are made for liabilities to employees for annual leave, sick leave and other current employee entitlements that represent the amount for which the consolidated entity has a present obligation. These have been calculated at nominal amounts based on the wage and salary rates that the consolidated entity expects to pay as at each reporting date and include related on-costs. Liabilities for employee entitlements which are not expected to be settled within twelve months of balance date, such as long service leave, are accrued at the present value of future amounts expected to be paid. The present value is determined using interest rates applicable to government guaranteed securities with maturities approximating the terms of the consolidated entity’s obligations.
For
per
sona
l use
onl
y

Notes to the Financial Statements For the year ended 30 September 2008
Orica Limited 48
1. Accounting policies (continued) A liability is recognised for bonus plans on the achievement of predetermined bonus targets and the benefit calculations are formally documented and determined before signing the financial report.
Contingent liabilities on acquisition of controlled entities A provision is recognised on acquisition of a business for contingent liabilities of that business.
Superannuation Contributions to defined contribution superannuation funds are taken to the Income Statement in the year in which the expense is incurred. For each defined benefit scheme, the cost of providing pensions is charged to the Income Statement so as to recognise current and past service costs, interest cost on defined benefit obligations, and the effect of any curtailments or settlements, net of expected returns on plan assets. All actuarial gains and losses are recognised directly in equity. The consolidated entity’s net obligation in respect of defined benefit pension plans is calculated by estimating the amount of future benefit that employees have earned in return for their service in the current and prior periods; that benefit is discounted to determine its present value, and the fair value of any plan assets is deducted. The discount rate is the yield at the balance sheet date on government bonds that have maturity dates approximating the terms of the consolidated entity’s obligations. The calculation is performed annually by a qualified actuary using the projected unit credit method.
Restructuring and employee termination benefits Provisions for restructuring or termination benefits are only recognised when a detailed plan has been approved and the restructuring or termination has either commenced or been publicly announced, or firm contracts related to the restructuring or termination benefits have been entered into. Costs related to ongoing activities are not provided for.
Onerous contracts A provision for onerous contracts is recognised after impairment losses on assets dedicated to the contract have been recognised and when the expected benefits are less than the unavoidable costs of meeting the contractual obligations. A provision is recognised to the extent that the contractual obligations exceed unrecognised assets.
(xx) Trade and other payables Dividends A liability for dividends payable (including distributions on the Step-Up Preference Securities) is recognised in the reporting period in which the dividends are declared, for the entire undistributed amount, regardless of the extent to which they will be paid in cash. A liability for dividends payable on cumulative non-redeemable preference shares was recognised on an accruals basis and included in trade and other payables.
(xxi) Foreign currency Functional currency Items included in the financial statements of each of the Group’s entities are measured using the currency of the primary economic environment in which the entity operates (the functional currency).
Foreign currency transactions Transactions in foreign currencies are translated at the foreign exchange rate ruling at the date of the transaction. Monetary assets and liabilities denominated in foreign currencies at the balance sheet date are translated to the functional currency of the entity at the foreign exchange rate ruling at that date. Foreign exchange differences arising on translation are recognised in the Income Statement. Non-monetary assets and liabilities that are measured at historical cost in a foreign currency are translated using the exchange rate ruling at the date of the transaction. Non-monetary assets and liabilities denominated in foreign currencies that are measured at fair value are translated the functional currency of the entity at foreign exchange rates ruling at the dates the fair value was determined.
Financial statements of foreign operations The assets and liabilities of foreign operations, including goodwill and fair value adjustments arising on consolidation, are translated to Australian dollars at foreign exchange rates ruling at the balance sheet date. The revenues and expenses of foreign operations, excluding foreign operations in hyperinflationary economies, are translated to Australian dollars at rates approximating the foreign exchange rates ruling at the dates of the transactions. The revenues and expenses of foreign operations in hyperinflationary economies are translated to Australian dollars at the foreign exchange rates ruling at the balance sheet date. Foreign exchange differences arising on retranslation are recognised directly in a separate component of equity. Prior to translating the financial statements of foreign operations in hyperinflationary economies, the financial statements, including comparatives, are restated to account for changes in the general purchasing power of the local currency. The restatement is based on relevant price indices at the balance sheet date.
Net investment in foreign operations Exchange differences arising from the translation of the net investment in foreign operations, and of related hedges are taken to the translation reserve. They are released into the Income Statement upon disposal.
(xxii) Financial instruments The consolidated entity uses financial instruments to hedge its exposure to foreign exchange and interest rate risks arising from operational, financing and investment activities. In accordance with its treasury policy, the consolidated entity does not hold or issue financial instruments for trading purposes. However, financial instruments that do not qualify for hedge accounting, but remain economically effective, are accounted for as trading instruments. Financial instruments are recognised initially at cost. Subsequent to initial recognition, financial instruments are stated at fair value. The gain or loss on remeasurement to fair value is recognised immediately in the Income Statement. However, where financial instruments qualify for hedge accounting, recognition of any resultant gain or loss depends on the nature of the item being hedged.
For
per
sona
l use
onl
y

Notes to the Financial Statements For the year ended 30 September 2008
Orica Limited 49
1. Accounting policies (continued) Hedging Cash flow hedges Where a financial instrument is designated as a hedge of the variability in cash flows of a recognised asset or liability, or a highly probable forecasted transaction, the effective part of any gain or loss on the financial instrument is recognised directly in equity. When the forecasted transaction subsequently results in the recognition of a non-financial asset or non-financial liability, the associated cumulative gain or loss is removed from equity and included in the initial cost or other carrying amount of the non-financial asset or liability. If a hedge of a forecasted transaction subsequently results in the recognition of a financial asset or a financial liability, then the associated gains and losses that were recognised directly in equity are reclassified into the Income Statement in the same period or periods during which the asset acquired or liability assumed affects the Income Statement. For cash flow hedges, other than those covered by the preceding two policy statements, the associated cumulative gain or loss is removed from equity and recognised in the Income Statement in the same period or periods during which the hedged forecast transaction affects the Income Statement. The ineffective part of any gain or loss is recognised immediately in the Income Statement. When a hedging instrument expires or is sold, terminated or exercised, or the entity revokes designation of the hedge relationship but the hedged forecast transaction is still expected to occur, the cumulative gain or loss at that point remains in equity and is recognised in accordance with the above policy when the transaction occurs. If the hedged transaction is no longer expected to take place, then the cumulative unrealised gain or loss recognised in equity is recognised immediately in the Income Statement.
Fair value hedges The consolidated entity uses fair value hedges to mitigate the risk of changes in the fair value of its foreign currency borrowings from foreign currency and interest rate fluctuations over the hedging period. Under a fair value hedge gains or losses from remeasuring the fair value of the hedging instrument are recognised in the Income Statement, together with gains or losses in relation to the hedged item.
Hedge of monetary assets and liabilities When a financial instrument is used to hedge economically the foreign exchange exposure of a recognised monetary asset or liability, hedge accounting is not applied and any gain or loss on the hedging instrument is recognised in the Income Statement.
Investments in debt and equity securities Financial instruments held for trading are classified as current assets and are stated at fair value, with any resultant gain or loss recognised in the Income Statement. Other financial instruments held by the consolidated entity classified as being available-for-sale are stated at fair value, with any resultant gain or loss recognised directly in equity, except for impairment losses and, in the case of monetary items such as debt securities, foreign exchange gains and losses. Where these investments are derecognised, the
cumulative gain or loss previously recognised directly in equity is recognised in the Income Statement. Where these investments are interest-bearing, interest calculated using the effective interest method is recognised in the Income Statement. The fair value of financial instruments classified as held for trading and available for sale is their quoted market price at the balance sheet date. Financial instruments classified as held for trading or available for sale investments are recognised/derecognised by the consolidated entity on the date it commits to purchase/sell the investments. Securities held to maturity are recognised/ derecognised on the day they are transferred to/by the consolidated entity.
Hedge of net investment in foreign operations The portion of the gain or loss on an instrument used to hedge a net investment in a foreign operation that is determined to be an effective hedge is recognised directly in the foreign currency translation reserve in equity. The ineffective portion is recognised immediately in the Income Statement. Anticipated transactions Foreign currency transactions are translated at the exchange rate prevailing at the date of the transaction. Foreign currency receivables and payables outstanding at balance date are translated at the exchange rates current at that date. Exchange gains and losses on retranslation of outstanding receivables and payables are taken to the Income Statement. Where a hedge transaction is designated as a hedge of the anticipated purchase or sale of goods or services, purchase of qualifying assets, or an anticipated interest transaction, gains and losses on the hedge, arising up to the date of the anticipated transaction, together with any costs or gains arising at the time of entering into the hedge, are deferred and included in the measurement of the anticipated transaction when the transaction has occurred as designated. Any gains or losses on the hedge transaction after that date are included in the Income Statement. The net amount receivable or payable under open swaps, forward rate agreements and futures contracts and the associated deferred gains or losses are not recorded in the Income Statement until the hedged transaction matures. The net receivables or payables are then revalued using the foreign currency, interest or commodity rates current at balance date. When the anticipated transaction is no longer expected to occur as designated, the deferred gains and losses relating to the hedged transaction are recognised immediately in the Income Statement. Gains and losses that arise prior to and upon the maturity of transactions entered into under hedge strategies are deferred and included in the measurement of the hedged anticipated transaction if the transaction is still expected to occur as designated. If the anticipated transaction is no longer expected to occur as designated, the gains and losses are recognised immediately in the Income Statement.
(xxiii) Cash and cash equivalents Cash includes cash at bank, cash on hand and deposits at call which are readily convertible to cash on hand and which are used in the cash management function and are disclosed for the purposes of the Statement of Cash Flows, net of bank overdrafts.
For
per
sona
l use
onl
y
Notes to the Financial Statements For the year ended 30 September 2008
Orica Limited 50
1. Accounting policies (continued)
(xxiv) Share capital When share capital recognised as equity is repurchased, the amount of the consideration paid, including directly attributable costs, is recognised as a deduction from total equity. Transaction costs of an equity transaction are accounted for as a deduction from equity, net of any related income tax benefit.
Cumulative non-redeemable preference shares Cumulative non-redeemable preference shares were included in liabilities in 2007 as they were, in substance, borrowings. Dividends payable on these shares were recognised in the Income Statements as borrowing costs on an accruals basis.
Step-Up Preference Securities Step-Up Preference Securities are included in equity. A provision for distributions payable is recognised in the reporting period in which the distributions are declared (refer to note 21).
(xxv) Impairment of assets The carrying amount of Orica’s and the Group’s non-current assets excluding defined benefit fund assets, deferred tax assets, goodwill and indefinite life intangible assets is reviewed at each reporting date to determine whether there is any indicators of impairment. If such indicators exists, the asset is tested for impairment by comparing its recoverable amount to its carrying amount. Goodwill and indefinite life intangible assets are tested for impairment annually. The recoverable amount of an asset is determined as the higher of fair value less costs to sell and value in use. The recoverable amount is estimated for each individual asset or where it is not possible to estimate for individual assets, it is estimated for the cash generating unit to which the asset belongs. A cash generating unit is the smallest identifiable group of assets that generate cash inflows largely independent of the cash inflows of other assets or group of assets with each cash generating unit being no larger than a segment. In calculating recoverable amount, the estimated future cash flows are discounted to their present values using a pre-tax discount rate that reflects the current market assessments of the risks specific to the asset or cash generating unit. Cash flows are estimated for the asset in its present condition and therefore do not include cash inflows or outflows that improve or enhance the asset’s performance or that may arise from future restructuring.
An impairment loss is recognised whenever the carrying amount of an asset or its cash generating unit exceeds its recoverable amount. Impairment losses are recognised in the Income Statement. Impairment losses recognised in respect of cash-generating units are allocated first to reduce the carrying amount of any goodwill allocated to cash generating units and then to reduce the carrying amount of the other assets in the unit.
Reversals of impairment An impairment loss is reversed if the subsequent increase in recoverable amount can be related objectively to an event occurring after the impairment loss was recognised. An impairment loss in respect of goodwill is not reversed. An impairment loss is reversed only to the extent that the asset’s carrying amount does not exceed the carrying amount that would have been determined, net of depreciation or amortisation, if no impairment loss had been recognised.
(xxvi) Goods and services tax Revenues, expenses, assets and liabilities other than receivables and payables, are recognised net of the amount of goods and services tax (GST), except where the amount of GST incurred is not recoverable from the relevant taxation authorities. In these circumstances, the GST is recognised as part of the cost of acquisition of the asset or as part of an item of expense. The net amount of GST recoverable from, or payable to, the relevant taxation authorities is included as a current asset or liability in the Balance Sheet. Cash flows are included in the Statement of Cash Flows on a gross basis. The GST components of cash flows arising from investing and financing activities which are recoverable from, or payable to, the relevant taxation authorities are classified as operating cash flows.
(xxvii) Rounding The amounts shown in the financial statements have been rounded off, except where otherwise stated, to the nearest tenth of a million dollars, the Company being in a class specified in the ASIC Class Order 98/100 dated 10 July 1998.
(xxviii) Comparatives Where applicable, comparatives have been adjusted to disclose them on the same basis as current period figures.
For
per
sona
l use
onl
y

Notes to the Financial Statements For the year ended 30 September 2008
Orica Limited 51
2. Segment report Segment information is presented in respect of the consolidated entity’s business and geographical segments. The primary format is business segments. The consolidated entity’s operations have been divided into five business segments comprising Mining Services, Minova, Consumer Products, Chemicals and Other. On 26 October 2007 Orica acquired Excel Mining Systems LLC and it is included in the Minova business segment. The Minova group was acquired on 1 January 2007. Following changes to the operation of the consolidated entity during the year, the former Chemnet and Chemical Services operations have been merged to form one Chemicals operation. Prior year comparatives have been restated accordingly. The consolidated entity's policy is to transfer products internally at negotiated commercial prices. Other income includes royalties, profit on sale of property, plant and equipment and profit from the sale of businesses and controlled entities. The consolidated entity's geographical segments are determined based on the location of the Group’s assets. The major products and services from which the above segments derive revenue are:
Defined business segments Products/services Mining Services Manufacture and supply of explosives and mining services, initiating systems and blasting
technology to the mining, quarrying, construction and exploration industries.
Minova Manufacture and supply of specialty bolts, accessories and chemicals for stabilisation and ventilation systems in underground mining and civil tunnelling works.
Consumer Products Manufacture and supply of paints and other surface coatings to the decorative and technical markets and a range of home handyman, car care and garden care products.
Chemicals Manufactures, distributes and trades a broad range of industrial and speciality chemicals for use in a wide range of industries, which include water treatment, pulp and paper, food and beverage, construction and mining.
Other Minor activities, operation of the Botany Groundwater Recycling Business, non-operating assets, corporate and support costs and financial items such as foreign currency gains/losses.
For
per
sona
l use
onl
y
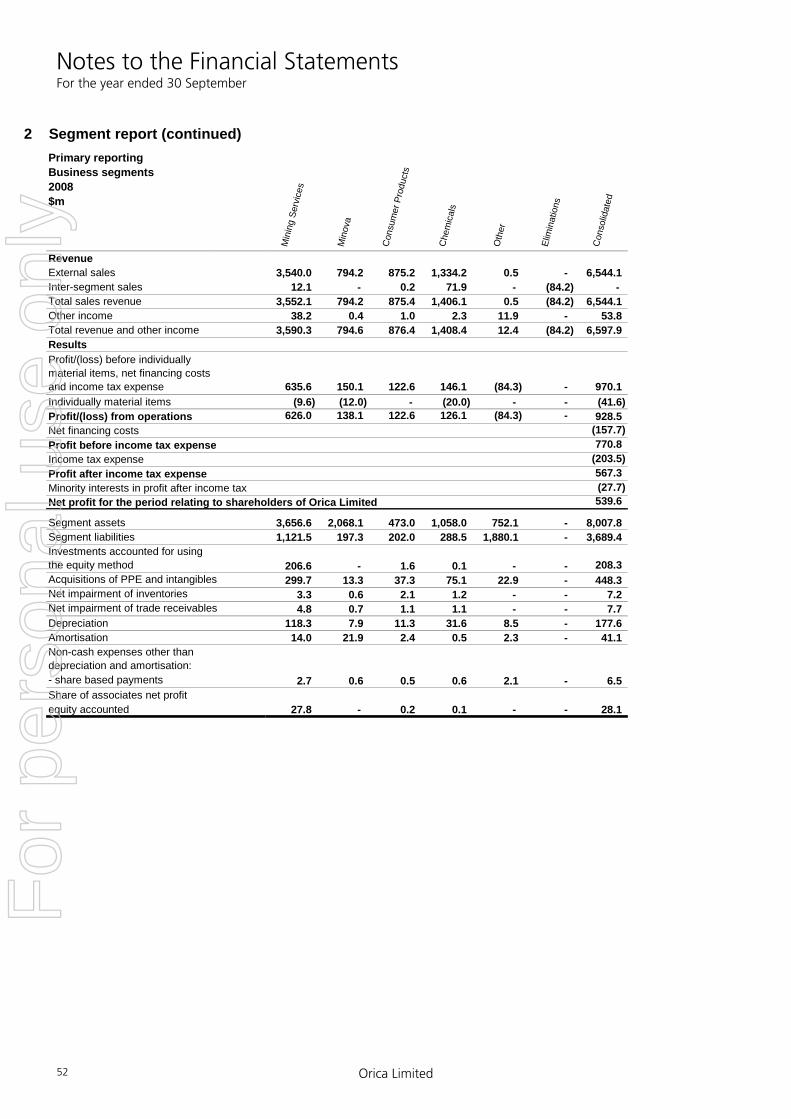
Notes to the Financial Statements For the year ended 30 September
Orica Limited 52
2 Segment report (continued)Primary reportingBusiness segments 2008 $m
Min
ing
Serv
ices
Min
ova
Con
sum
er P
rodu
cts
Che
mic
als
Oth
er
Elim
inat
ions
Con
solid
ated
RevenueExternal sales 3,540.0 794.2 875.2 1,334.2 0.5 - 6,544.1Inter-segment sales 12.1 - 0.2 71.9 - (84.2) - Total sales revenue 3,552.1 794.2 875.4 1,406.1 0.5 (84.2) 6,544.1Other income 38.2 0.4 1.0 2.3 11.9 - 53.8Total revenue and other income 3,590.3 794.6 876.4 1,408.4 12.4 (84.2) 6,597.9ResultsProfit/(loss) before individually material items, net financing costs and income tax expense 635.6 150.1 122.6 146.1 (84.3) - 970.1Individually material items (9.6) (12.0) - (20.0) - - (41.6)Profit/(loss) from operations 626.0 138.1 122.6 126.1 (84.3) - 928.5Net financing costs (157.7)Profit before income tax expense 770.8Income tax expense (203.5)Profit after income tax expense 567.3Minority interests in profit after income tax (27.7)Net profit for the period relating to shareholders of Orica Limited 539.6
Segment assets 3,656.6 2,068.1 473.0 1,058.0 752.1 - 8,007.8Segment liabilities 1,121.5 197.3 202.0 288.5 1,880.1 - 3,689.4Investments accounted for usingthe equity method 206.6 - 1.6 0.1 - - 208.3Acquisitions of PPE and intangibles 299.7 13.3 37.3 75.1 22.9 - 448.3Net impairment of inventories 3.3 0.6 2.1 1.2 - - 7.2Net impairment of trade receivables 4.8 0.7 1.1 1.1 - - 7.7Depreciation 118.3 7.9 11.3 31.6 8.5 - 177.6Amortisation 14.0 21.9 2.4 0.5 2.3 - 41.1Non-cash expenses other thandepreciation and amortisation:- share based payments 2.7 0.6 0.5 0.6 2.1 - 6.5Share of associates net profitequity accounted 27.8 - 0.2 0.1 - - 28.1
For
per
sona
l use
onl
y
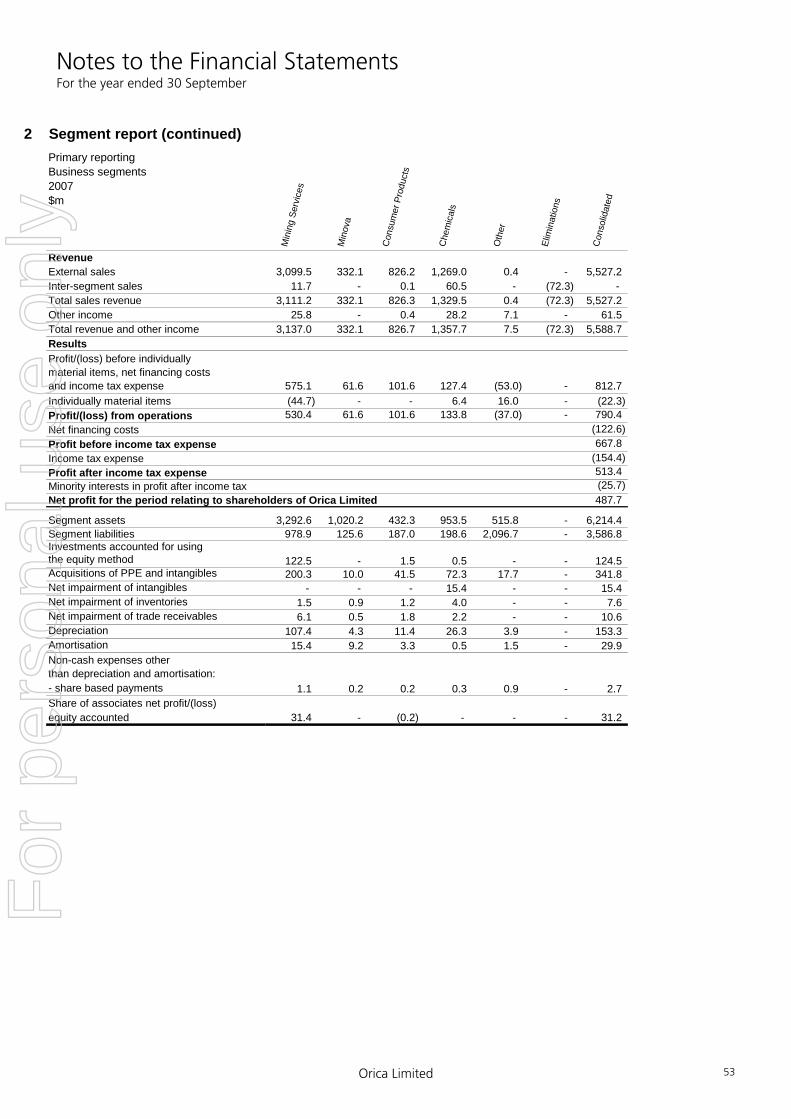
Notes to the Financial Statements For the year ended 30 September
Orica Limited 53
2 Segment report (continued)Primary reportingBusiness segments 2007 $m
Min
ing
Serv
ices
Min
ova
Con
sum
er P
rodu
cts
Che
mic
als
Oth
er
Elim
inat
ions
Con
solid
ated
RevenueExternal sales 3,099.5 332.1 826.2 1,269.0 0.4 - 5,527.2Inter-segment sales 11.7 - 0.1 60.5 - (72.3) - Total sales revenue 3,111.2 332.1 826.3 1,329.5 0.4 (72.3) 5,527.2Other income 25.8 - 0.4 28.2 7.1 - 61.5Total revenue and other income 3,137.0 332.1 826.7 1,357.7 7.5 (72.3) 5,588.7ResultsProfit/(loss) before individually material items, net financing costs and income tax expense 575.1 61.6 101.6 127.4 (53.0) - 812.7Individually material items (44.7) - - 6.4 16.0 - (22.3)Profit/(loss) from operations 530.4 61.6 101.6 133.8 (37.0) - 790.4Net financing costs (122.6)Profit before income tax expense 667.8Income tax expense (154.4)Profit after income tax expense 513.4Minority interests in profit after income tax (25.7)Net profit for the period relating to shareholders of Orica Limited 487.7
Segment assets 3,292.6 1,020.2 432.3 953.5 515.8 - 6,214.4Segment liabilities 978.9 125.6 187.0 198.6 2,096.7 - 3,586.8Investments accounted for usingthe equity method 122.5 - 1.5 0.5 - - 124.5Acquisitions of PPE and intangibles 200.3 10.0 41.5 72.3 17.7 - 341.8Net impairment of intangibles - - - 15.4 - - 15.4Net impairment of inventories 1.5 0.9 1.2 4.0 - - 7.6Net impairment of trade receivables 6.1 0.5 1.8 2.2 - - 10.6Depreciation 107.4 4.3 11.4 26.3 3.9 - 153.3Amortisation 15.4 9.2 3.3 0.5 1.5 - 29.9Non-cash expenses other than depreciation and amortisation:- share based payments 1.1 0.2 0.2 0.3 0.9 - 2.7Share of associates net profit/(loss)equity accounted 31.4 - (0.2) - - - 31.2
For
per
sona
l use
onl
y

Notes to the Financial Statements For the year ended 30 September
Orica Limited 54
2 Segment report (continued)Secondary reportingGeographical segments 2008$m
Aust
ralia
New
Zea
land
Asia
Nor
th A
mer
ica
Latin
Am
eric
a
Euro
pe
Oth
er
Elim
inat
ions
Con
solid
ated
RevenueExternal sales 2,703.4 376.2 527.2 1,219.5 809.0 847.8 61.0 - 6,544.1Inter-segment sales 241.3 12.9 17.7 58.2 22.5 65.5 5.9 (424.0) - Total sales revenue 2,944.7 389.1 544.9 1,277.7 831.5 913.3 66.9 (424.0) 6,544.1Other income 15.0 1.0 1.6 9.5 15.0 11.7 - - 53.8Total revenue and other income 2,959.7 390.1 546.5 1,287.2 846.5 925.0 66.9 (424.0) 6,597.9ResultsProfit before individually material items, net financing costs and income tax expense 434.7 44.0 70.9 172.5 91.8 148.4 7.8 - 970.1Individually material items (24.2) - (1.0) (9.0) (5.6) (1.0) (0.8) - (41.6)Profit from operations 410.5 44.0 69.9 163.5 86.2 147.4 7.0 - 928.5Net financing costs (157.7)Profit before income tax expense 770.8Income tax expense (203.5)Profit after income tax expense 567.3Minority interests in profit after income tax (27.7)Net profit for the period relating to shareholders of Orica Limited 539.6
Segment assets 3,030.3 259.9 570.2 1,800.5 592.7 1,707.0 47.2 - 8,007.8Segment liabilities 2,031.5 538.1 142.5 405.1 192.4 368.5 11.3 - 3,689.4Investments accounted for usingthe equity method 1.7 - 62.2 127.5 2.8 14.1 - - 208.3Acquisitions of PPE and intangibles 189.3 14.7 85.2 72.6 31.8 51.4 3.3 - 448.3Net impairment of inventories 4.4 0.6 1.2 0.3 0.3 0.4 - - 7.2Net impairment of trade receivables 1.6 0.1 0.7 2.3 0.4 2.5 0.1 - 7.7Depreciation 101.7 5.0 8.9 24.6 14.1 22.4 0.9 - 177.6Amortisation 13.2 0.4 0.6 13.1 2.1 11.7 - - 41.1Non-cash expenses other than depreciation and amortisation:- share based payments 4.6 0.1 0.1 0.7 0.4 0.6 - - 6.5Share of associates net profitequity accounted 0.8 - 5.9 19.2 1.0 1.2 - - 28.1
For
per
sona
l use
onl
y
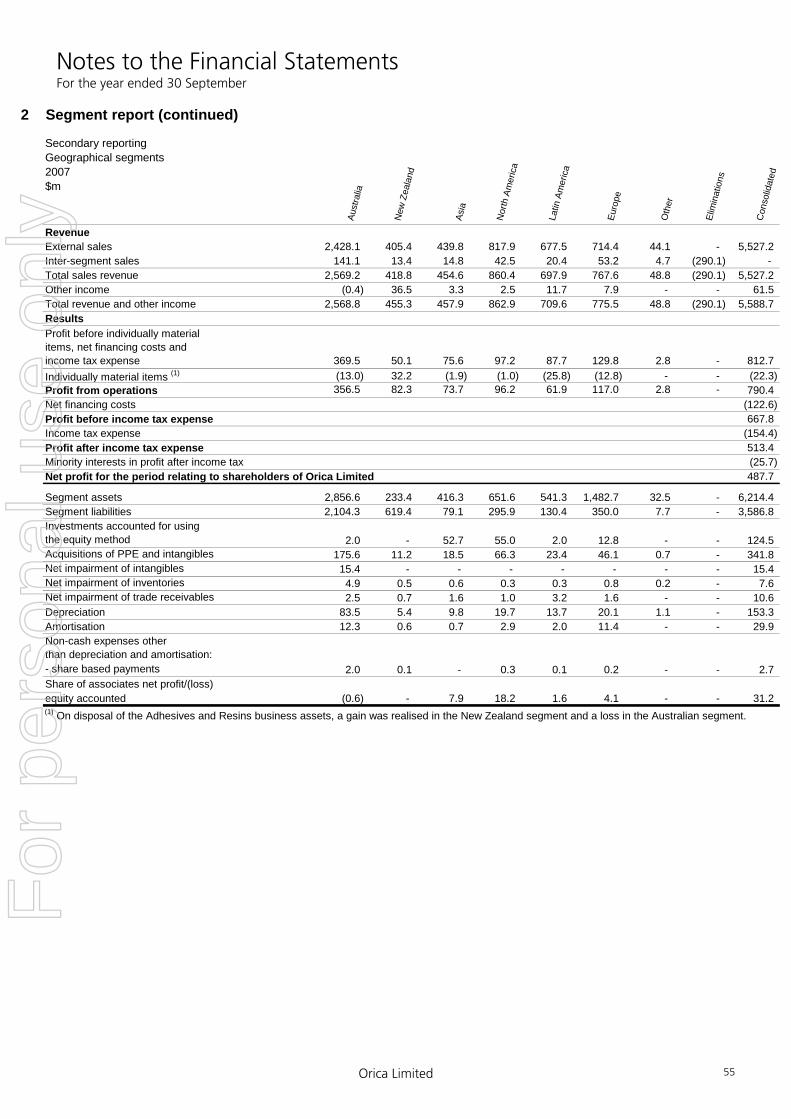
Notes to the Financial Statements For the year ended 30 September
Orica Limited 55
2 Segment report (continued)
Secondary reportingGeographical segments 2007$m
Aust
ralia
New
Zea
land
Asia
Nor
th A
mer
ica
Latin
Am
eric
a
Euro
pe
Oth
er
Elim
inat
ions
Con
solid
ated
RevenueExternal sales 2,428.1 405.4 439.8 817.9 677.5 714.4 44.1 - 5,527.2Inter-segment sales 141.1 13.4 14.8 42.5 20.4 53.2 4.7 (290.1) - Total sales revenue 2,569.2 418.8 454.6 860.4 697.9 767.6 48.8 (290.1) 5,527.2Other income (0.4) 36.5 3.3 2.5 11.7 7.9 - - 61.5Total revenue and other income 2,568.8 455.3 457.9 862.9 709.6 775.5 48.8 (290.1) 5,588.7ResultsProfit before individually material items, net financing costs and income tax expense 369.5 50.1 75.6 97.2 87.7 129.8 2.8 - 812.7Individually material items (1) (13.0) 32.2 (1.9) (1.0) (25.8) (12.8) - - (22.3)Profit from operations 356.5 82.3 73.7 96.2 61.9 117.0 2.8 - 790.4Net financing costs (122.6)Profit before income tax expense 667.8Income tax expense (154.4)Profit after income tax expense 513.4Minority interests in profit after income tax (25.7)Net profit for the period relating to shareholders of Orica Limited 487.7
Segment assets 2,856.6 233.4 416.3 651.6 541.3 1,482.7 32.5 - 6,214.4Segment liabilities 2,104.3 619.4 79.1 295.9 130.4 350.0 7.7 - 3,586.8Investments accounted for usingthe equity method 2.0 - 52.7 55.0 2.0 12.8 - - 124.5Acquisitions of PPE and intangibles 175.6 11.2 18.5 66.3 23.4 46.1 0.7 - 341.8Net impairment of intangibles 15.4 - - - - - - - 15.4Net impairment of inventories 4.9 0.5 0.6 0.3 0.3 0.8 0.2 - 7.6Net impairment of trade receivables 2.5 0.7 1.6 1.0 3.2 1.6 - - 10.6Depreciation 83.5 5.4 9.8 19.7 13.7 20.1 1.1 - 153.3Amortisation 12.3 0.6 0.7 2.9 2.0 11.4 - - 29.9Non-cash expenses other than depreciation and amortisation:- share based payments 2.0 0.1 - 0.3 0.1 0.2 - - 2.7 Share of associates net profit/(loss)equity accounted (0.6) - 7.9 18.2 1.6 4.1 - - 31.2(1) On disposal of the Adhesives and Resins business assets, a gain was realised in the New Zealand segment and a loss in the Australian segment.
For
per
sona
l use
onl
y
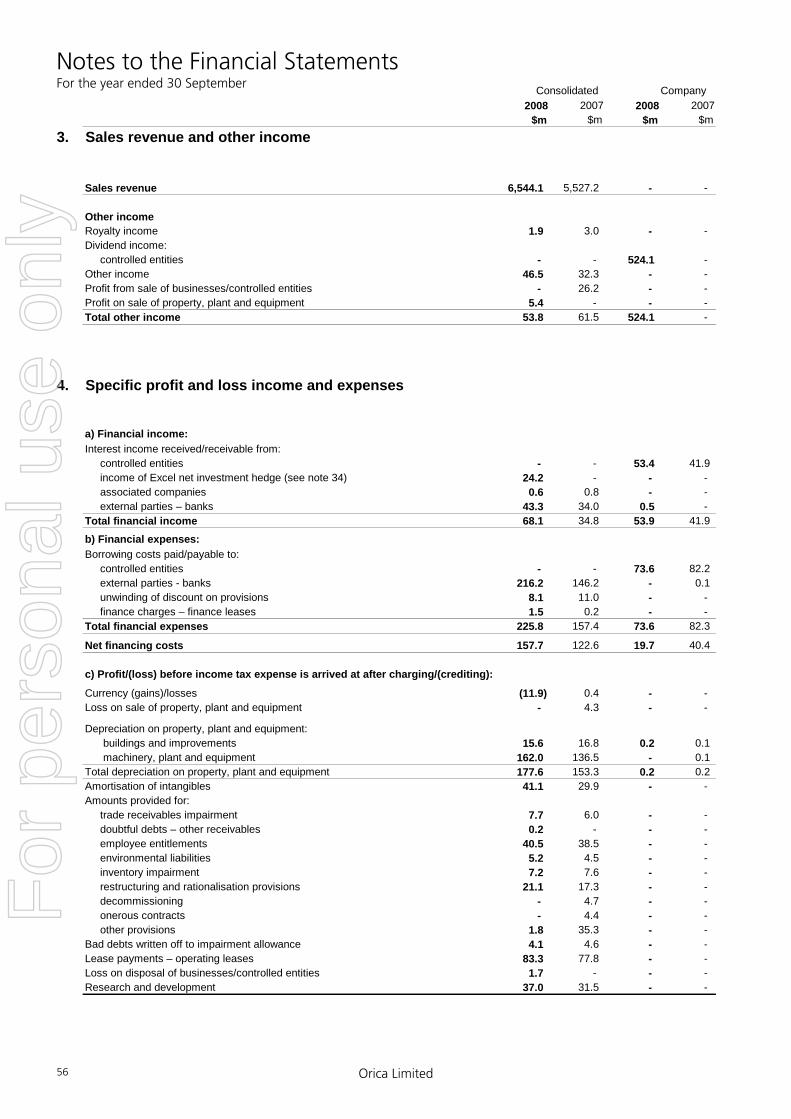
Notes to the Financial Statements For the year ended 30 September
Orica Limited 56
2008 2007 2008 2007$m $m $m $m
3. Sales revenue and other income
Sales revenue 6,544.1 5,527.2 - -
Other incomeRoyalty income 1.9 3.0 - - Dividend income: controlled entities - - 524.1 - Other income 46.5 32.3 - - Profit from sale of businesses/controlled entities - 26.2 - - Profit on sale of property, plant and equipment 5.4 - - - Total other income 53.8 61.5 524.1 -
Consolidated Company
4. Specific profit and loss income and expenses
a) Financial income:Interest income received/receivable from: controlled entities - - 53.4 41.9 income of Excel net investment hedge (see note 34) 24.2 - - - associated companies 0.6 0.8 - - external parties – banks 43.3 34.0 0.5 - Total financial income 68.1 34.8 53.9 41.9
b) Financial expenses:Borrowing costs paid/payable to: controlled entities - - 73.6 82.2 external parties - banks 216.2 146.2 - 0.1 unwinding of discount on provisions 8.1 11.0 - - finance charges – finance leases 1.5 0.2 - - Total financial expenses 225.8 157.4 73.6 82.3
Net financing costs 157.7 122.6 19.7 40.4
c) Profit/(loss) before income tax expense is arrived at after charging/(crediting):
Currency (gains)/losses (11.9) 0.4 - - Loss on sale of property, plant and equipment - 4.3 - -
Depreciation on property, plant and equipment: buildings and improvements 15.6 16.8 0.2 0.1 machinery, plant and equipment 162.0 136.5 - 0.1Total depreciation on property, plant and equipment 177.6 153.3 0.2 0.2Amortisation of intangibles 41.1 29.9 - - Amounts provided for: trade receivables impairment 7.7 6.0 - - doubtful debts – other receivables 0.2 - - - employee entitlements 40.5 38.5 - - environmental liabilities 5.2 4.5 - - inventory impairment 7.2 7.6 - - restructuring and rationalisation provisions 21.1 17.3 - - decommissioning - 4.7 - - onerous contracts - 4.4 - - other provisions 1.8 35.3 - - Bad debts written off to impairment allowance 4.1 4.6 - - Lease payments – operating leases 83.3 77.8 - - Loss on disposal of businesses/controlled entities 1.7 - - - Research and development 37.0 31.5 - -
For
per
sona
l use
onl
y

Notes to the Financial Statements For the year ended 30 September
Orica Limited 57
Gross Tax Net Gross Tax Net$m $m $m $m $m $m
4. Specific profit and loss income and expenses (continued)d) Profit after income tax includes the followingindividually material items of (expense)/income:ConsolidatedRestructuring and rationalisation costs: (1)
Chemicals business (20.0) 5.3 (14.7) - - - Marplex business - - - (16.9) 0.5 (16.4)Integration costs - (expenditure)/income: (2)
Dyno Nobel (9.6) 0.1 (9.5) (44.7) 10.9 (33.8) Minova/Excel (12.0) 3.0 (9.0) - - - Profit on disposal of: Adhesives and Resins (A&R) (3) - - - 23.3 0.4 23.7 Tax indemnity - Cropcare (4) - - - 16.0 - 16.0Individually material items (41.6) 8.4 (33.2) (22.3) 11.8 (10.5) Minority interests in individually material items (0.5) - (0.5) (0.4) - (0.4) Individually material items attributable to shareholders of Orica (41.1) 8.4 (32.7) (21.9) 11.8 (10.1)
2008
(3) Profit on sale of Adhesives and Resins business assets in Australia and New Zealand.
(1) Costs including asset write downs and provisions relating to restructuring and merging of the Chemicals business in 2008 and restructuring of the Marplex (Victoria, Australia) business in 2007.(2) Costs including asset write downs and provisions relating to the integration and restructuring of the Mining Services and Minova segments following the purchase the Dyno Nobel, Excel and Minova businesses.
(4) The Cropcare business was sold to Nufarm Limited in October 2002 and Orica provided a tax indemnity. A tax assessment was received by Nufarm Limited in 2006 and Orica provided for this amount and disputed the claim. In 2007, the Australian Tax Office refunded amounts paid and the expense previously recognised was reversed.
2007
For
per
sona
l use
onl
y
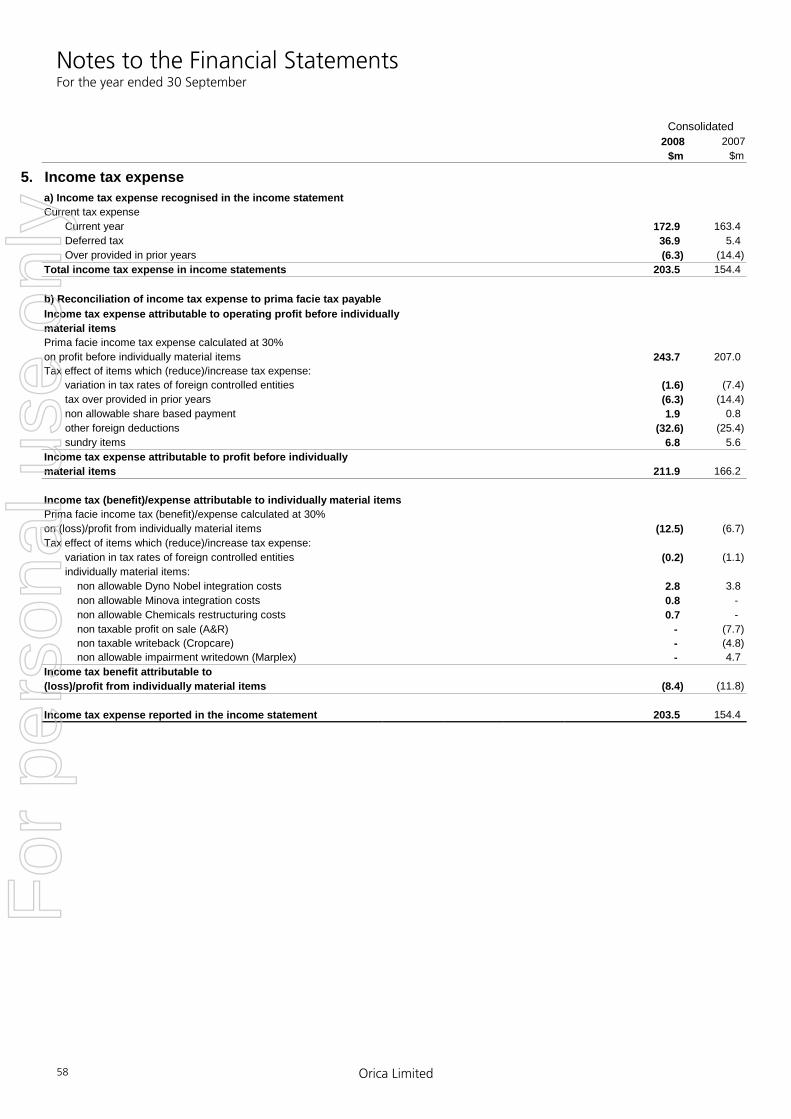
Notes to the Financial Statements For the year ended 30 September
Orica Limited 58
2008 2007$m $m
5. Income tax expensea) Income tax expense recognised in the income statementCurrent tax expense
Current year 172.9 163.4Deferred tax 36.9 5.4Over provided in prior years (6.3) (14.4)
Total income tax expense in income statements 203.5 154.4
b) Reconciliation of income tax expense to prima facie tax payableIncome tax expense attributable to operating profit before individuallymaterial itemsPrima facie income tax expense calculated at 30%on profit before individually material items 243.7 207.0Tax effect of items which (reduce)/increase tax expense:
variation in tax rates of foreign controlled entities (1.6) (7.4)tax over provided in prior years (6.3) (14.4)non allowable share based payment 1.9 0.8other foreign deductions (32.6) (25.4)sundry items 6.8 5.6
Income tax expense attributable to profit before individuallymaterial items 211.9 166.2
Income tax (benefit)/expense attributable to individually material itemsPrima facie income tax (benefit)/expense calculated at 30%on (loss)/profit from individually material items (12.5) (6.7)Tax effect of items which (reduce)/increase tax expense:
variation in tax rates of foreign controlled entities (0.2) (1.1)individually material items: non allowable Dyno Nobel integration costs 2.8 3.8 non allowable Minova integration costs 0.8 - non allowable Chemicals restructuring costs 0.7 - non taxable profit on sale (A&R) - (7.7) non taxable writeback (Cropcare) - (4.8) non allowable impairment writedown (Marplex) - 4.7
Income tax benefit attributable to(loss)/profit from individually material items (8.4) (11.8)
Income tax expense reported in the income statement 203.5 154.4
Consolidated
For
per
sona
l use
onl
y
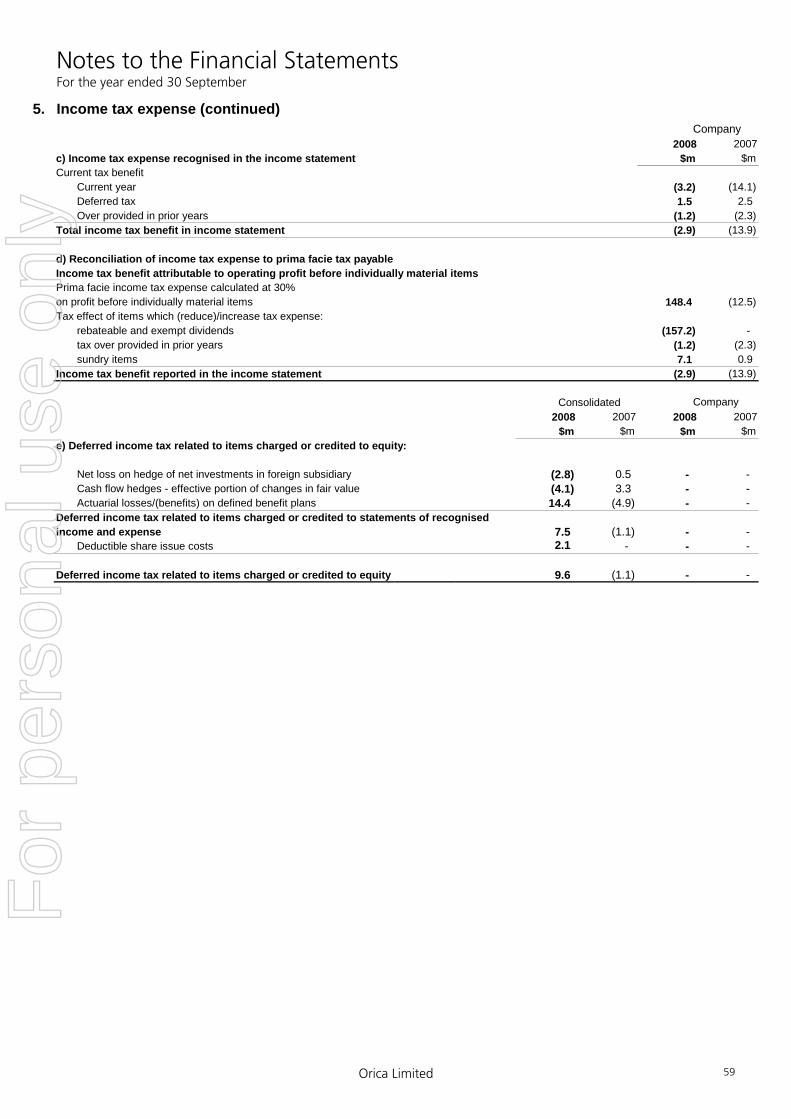
Notes to the Financial Statements For the year ended 30 September
Orica Limited 59
5. Income tax expense (continued)
2008 2007c) Income tax expense recognised in the income statement $m $mCurrent tax benefit
Current year (3.2) (14.1)Deferred tax 1.5 2.5Over provided in prior years (1.2) (2.3)
Total income tax benefit in income statement (2.9) (13.9)
d) Reconciliation of income tax expense to prima facie tax payableIncome tax benefit attributable to operating profit before individually material itemsPrima facie income tax expense calculated at 30%on profit before individually material items 148.4 (12.5)Tax effect of items which (reduce)/increase tax expense: rebateable and exempt dividends (157.2) -
tax over provided in prior years (1.2) (2.3)sundry items 7.1 0.9
Income tax benefit reported in the income statement (2.9) (13.9)
Consolidated2008 2007 2008 2007
$m $m $m $me) Deferred income tax related to items charged or credited to equity:
Net loss on hedge of net investments in foreign subsidiary (2.8) 0.5 - - Cash flow hedges - effective portion of changes in fair value (4.1) 3.3 - - Actuarial losses/(benefits) on defined benefit plans 14.4 (4.9) - -
Deferred income tax related to items charged or credited to statements of recognisedincome and expense 7.5 (1.1) - -
Deductible share issue costs 2.1 - - -
Deferred income tax related to items charged or credited to equity 9.6 (1.1) - -
Company
Company
For
per
sona
l use
onl
y
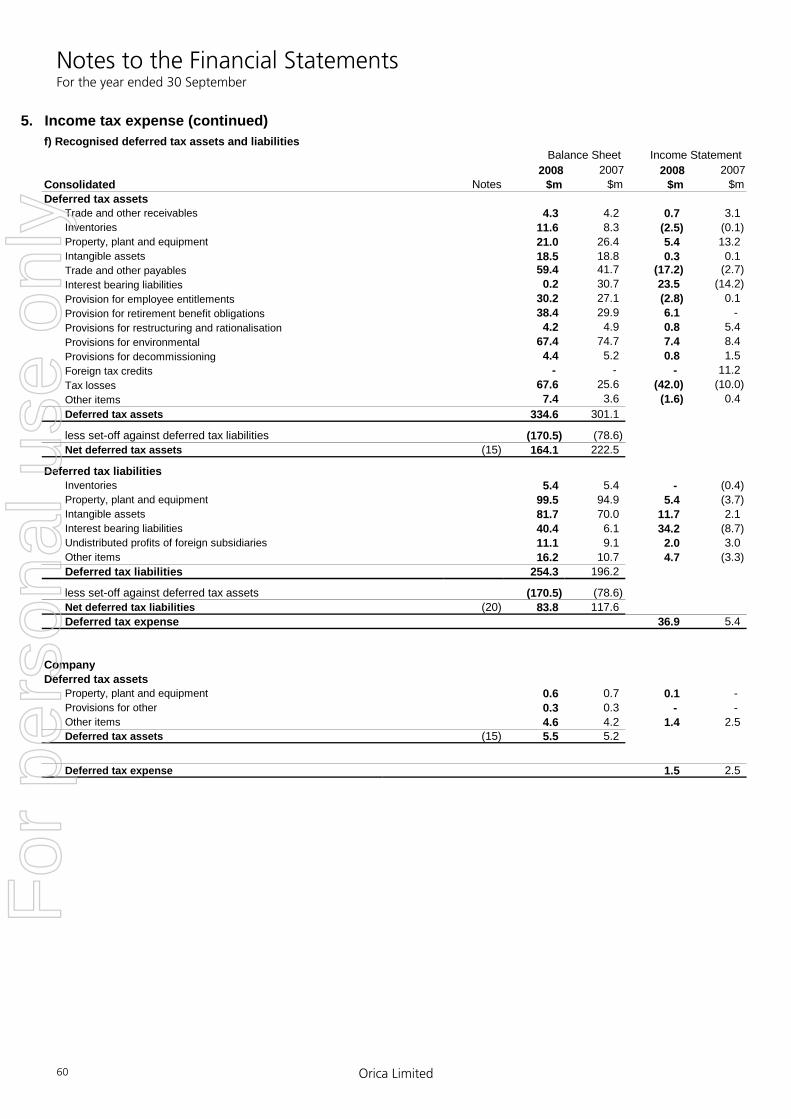
Notes to the Financial Statements For the year ended 30 September
Orica Limited 60
5. Income tax expense (continued)f) Recognised deferred tax assets and liabilities
2008 2007 2008 2007Consolidated Notes $m $m $m $mDeferred tax assets
Trade and other receivables 4.3 4.2 0.7 3.1Inventories 11.6 8.3 (2.5) (0.1)Property, plant and equipment 21.0 26.4 5.4 13.2Intangible assets 18.5 18.8 0.3 0.1Trade and other payables 59.4 41.7 (17.2) (2.7)Interest bearing liabilities 0.2 30.7 23.5 (14.2)Provision for employee entitlements 30.2 27.1 (2.8) 0.1Provision for retirement benefit obligations 38.4 29.9 6.1 - Provisions for restructuring and rationalisation 4.2 4.9 0.8 5.4Provisions for environmental 67.4 74.7 7.4 8.4Provisions for decommissioning 4.4 5.2 0.8 1.5Foreign tax credits - - - 11.2Tax losses 67.6 25.6 (42.0) (10.0)Other items 7.4 3.6 (1.6) 0.4Deferred tax assets 334.6 301.1
less set-off against deferred tax liabilities (170.5) (78.6)Net deferred tax assets (15) 164.1 222.5
Deferred tax liabilitiesInventories 5.4 5.4 - (0.4)Property, plant and equipment 99.5 94.9 5.4 (3.7)Intangible assets 81.7 70.0 11.7 2.1Interest bearing liabilities 40.4 6.1 34.2 (8.7)Undistributed profits of foreign subsidiaries 11.1 9.1 2.0 3.0Other items 16.2 10.7 4.7 (3.3)Deferred tax liabilities 254.3 196.2
less set-off against deferred tax assets (170.5) (78.6)Net deferred tax liabilities (20) 83.8 117.6Deferred tax expense 36.9 5.4
CompanyDeferred tax assets
Property, plant and equipment 0.6 0.7 0.1 - Provisions for other 0.3 0.3 - - Other items 4.6 4.2 1.4 2.5Deferred tax assets (15) 5.5 5.2
Deferred tax expense 1.5 2.5
Balance Sheet Income Statement
For
per
sona
l use
onl
y
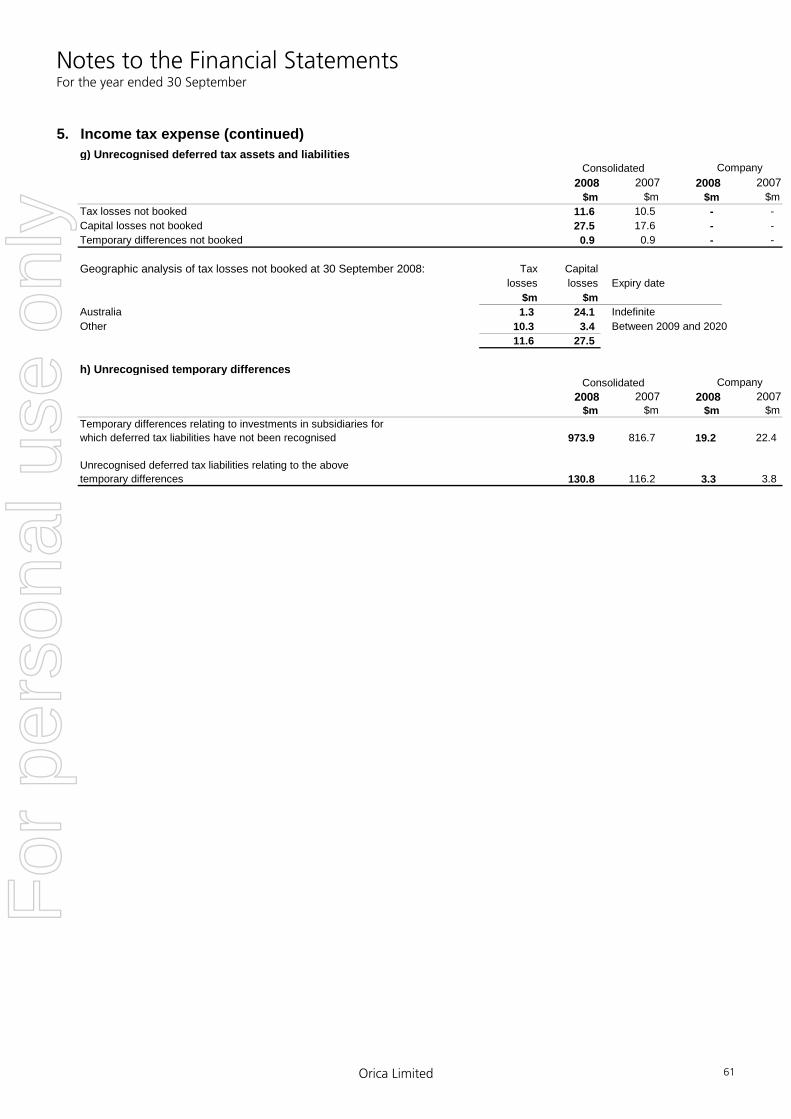
Notes to the Financial Statements For the year ended 30 September
Orica Limited 61
5. Income tax expense (continued)g) Unrecognised deferred tax assets and liabilities
Consolidated2008 2007 2008 2007
$m $m $m $mTax losses not booked 11.6 10.5 - - Capital losses not booked 27.5 17.6 - - Temporary differences not booked 0.9 0.9 - -
Geographic analysis of tax losses not booked at 30 September 2008: Tax Capitallosses losses Expiry date
$m $mAustralia 1.3 24.1 IndefiniteOther 10.3 3.4 Between 2009 and 2020
11.6 27.5
h) Unrecognised temporary differencesConsolidated
2008 2007 2008 2007$m $m $m $m
Temporary differences relating to investments in subsidiaries forwhich deferred tax liabilities have not been recognised 973.9 816.7 19.2 22.4
Unrecognised deferred tax liabilities relating to the above temporary differences 130.8 116.2 3.3 3.8
Company
Company
For
per
sona
l use
onl
y
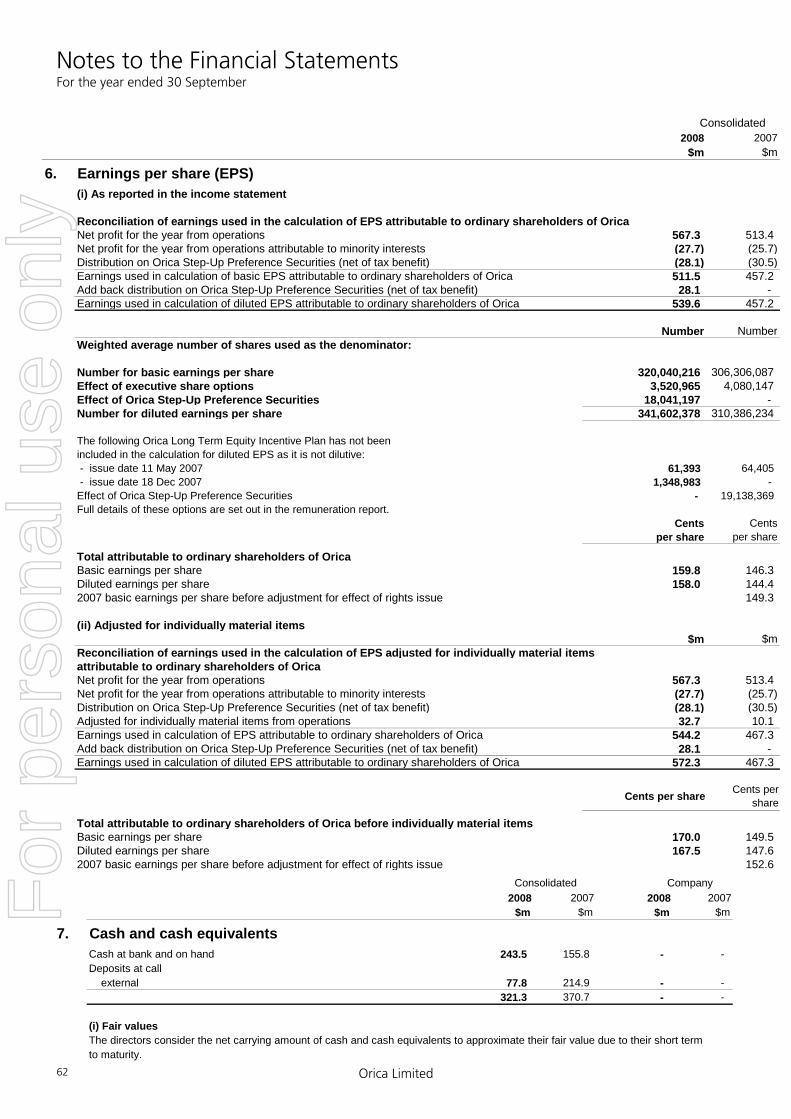
Notes to the Financial Statements For the year ended 30 September
Orica Limited 62
2008 2007$m $m
6. Earnings per share (EPS) (i) As reported in the income statement
Reconciliation of earnings used in the calculation of EPS attributable to ordinary shareholders of OricaNet profit for the year from operations 567.3 513.4Net profit for the year from operations attributable to minority interests (27.7) (25.7)Distribution on Orica Step-Up Preference Securities (net of tax benefit) (28.1) (30.5)Earnings used in calculation of basic EPS attributable to ordinary shareholders of Orica 511.5 457.2Add back distribution on Orica Step-Up Preference Securities (net of tax benefit) 28.1 - Earnings used in calculation of diluted EPS attributable to ordinary shareholders of Orica 539.6 457.2
Number NumberWeighted average number of shares used as the denominator:
Number for basic earnings per share 320,040,216 306,306,087Effect of executive share options 3,520,965 4,080,147Effect of Orica Step-Up Preference Securities 18,041,197 - Number for diluted earnings per share 341,602,378 310,386,234
The following Orica Long Term Equity Incentive Plan has not beenincluded in the calculation for diluted EPS as it is not dilutive: - issue date 11 May 2007 61,393 64,405 - issue date 18 Dec 2007 1,348,983 - Effect of Orica Step-Up Preference Securities - 19,138,369Full details of these options are set out in the remuneration report.
Cents Centsper share per share
Total attributable to ordinary shareholders of OricaBasic earnings per share 159.8 146.3 Diluted earnings per share 158.0 144.4 2007 basic earnings per share before adjustment for effect of rights issue 149.3
(ii) Adjusted for individually material items$m $m
Reconciliation of earnings used in the calculation of EPS adjusted for individually material itemsattributable to ordinary shareholders of OricaNet profit for the year from operations 567.3 513.4Net profit for the year from operations attributable to minority interests (27.7) (25.7)Distribution on Orica Step-Up Preference Securities (net of tax benefit) (28.1) (30.5)Adjusted for individually material items from operations 32.7 10.1Earnings used in calculation of EPS attributable to ordinary shareholders of Orica 544.2 467.3Add back distribution on Orica Step-Up Preference Securities (net of tax benefit) 28.1 - Earnings used in calculation of diluted EPS attributable to ordinary shareholders of Orica 572.3 467.3
Total attributable to ordinary shareholders of Orica before individually material itemsBasic earnings per share 170.0 149.5 Diluted earnings per share 167.5 147.6 2007 basic earnings per share before adjustment for effect of rights issue 152.6
Consolidated
Cents per shareCents per share
2008 2007 2008 2007$m $m $m $m
7. Cash and cash equivalentsCash at bank and on hand 243.5 155.8 - - Deposits at call external 77.8 214.9 - -
321.3 370.7 - -
(i) Fair valuesThe directors consider the net carrying amount of cash and cash equivalents to approximate their fair value due to their short termto maturity.
Consolidated CompanyFor
per
sona
l use
onl
y
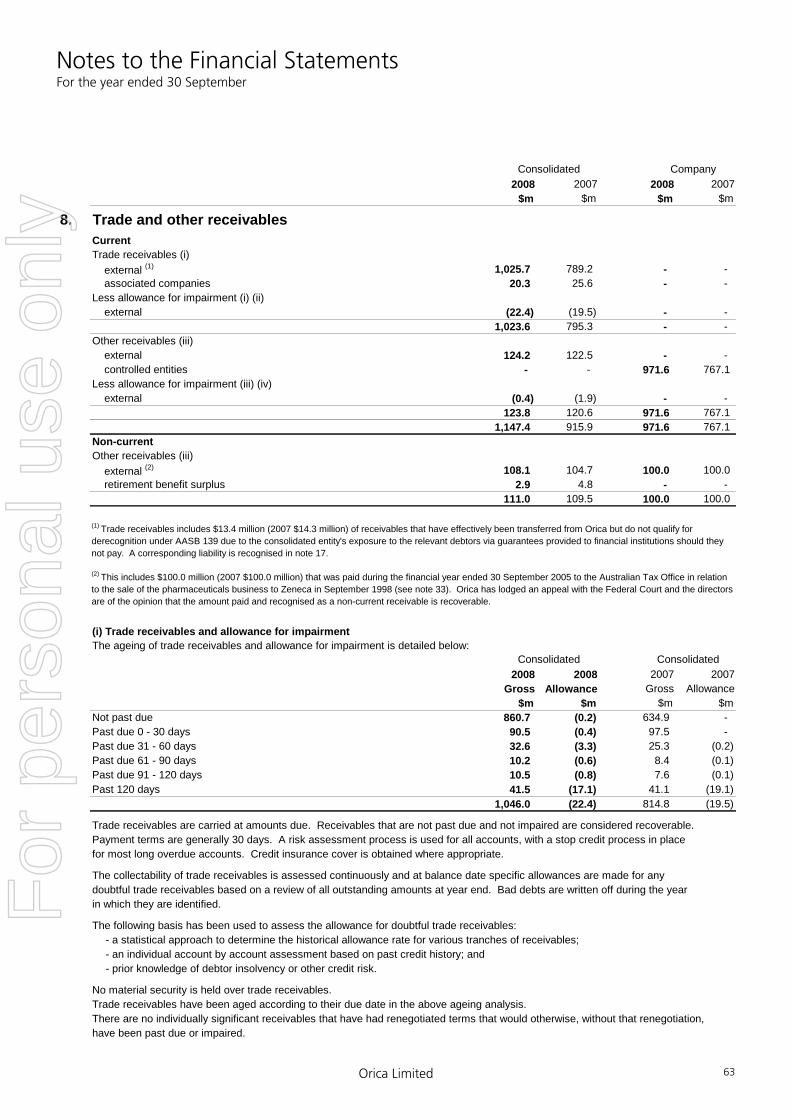
Notes to the Financial Statements For the year ended 30 September
Orica Limited 63
2008 2007 2008 2007$m $m $m $m
8. Trade and other receivablesCurrentTrade receivables (i) external (1) 1,025.7 789.2 - - associated companies 20.3 25.6 - - Less allowance for impairment (i) (ii) external (22.4) (19.5) - -
1,023.6 795.3 - - Other receivables (iii) external 124.2 122.5 - - controlled entities - - 971.6 767.1Less allowance for impairment (iii) (iv) external (0.4) (1.9) - -
123.8 120.6 971.6 767.11,147.4 915.9 971.6 767.1
Non-currentOther receivables (iii) external (2) 108.1 104.7 100.0 100.0 retirement benefit surplus 2.9 4.8 - -
111.0 109.5 100.0 100.0
(i) Trade receivables and allowance for impairmentThe ageing of trade receivables and allowance for impairment is detailed below:
2008 2008 2007 2007Gross Allowance Gross Allowance
$m $m $m $mNot past due 860.7 (0.2) 634.9 - Past due 0 - 30 days 90.5 (0.4) 97.5 - Past due 31 - 60 days 32.6 (3.3) 25.3 (0.2)Past due 61 - 90 days 10.2 (0.6) 8.4 (0.1)Past due 91 - 120 days 10.5 (0.8) 7.6 (0.1)Past 120 days 41.5 (17.1) 41.1 (19.1)
1,046.0 (22.4) 814.8 (19.5)
Trade receivables are carried at amounts due. Receivables that are not past due and not impaired are considered recoverable.Payment terms are generally 30 days. A risk assessment process is used for all accounts, with a stop credit process in placefor most long overdue accounts. Credit insurance cover is obtained where appropriate.
The collectability of trade receivables is assessed continuously and at balance date specific allowances are made for any doubtful trade receivables based on a review of all outstanding amounts at year end. Bad debts are written off during the yearin which they are identified.
The following basis has been used to assess the allowance for doubtful trade receivables:- a statistical approach to determine the historical allowance rate for various tranches of receivables;- an individual account by account assessment based on past credit history; and- prior knowledge of debtor insolvency or other credit risk.
No material security is held over trade receivables.Trade receivables have been aged according to their due date in the above ageing analysis.There are no individually significant receivables that have had renegotiated terms that would otherwise, without that renegotiation,have been past due or impaired.
(2) This includes $100.0 million (2007 $100.0 million) that was paid during the financial year ended 30 September 2005 to the Australian Tax Office in relation to the sale of the pharmaceuticals business to Zeneca in September 1998 (see note 33). Orica has lodged an appeal with the Federal Court and the directors are of the opinion that the amount paid and recognised as a non-current receivable is recoverable.
Consolidated
Consolidated Company
Consolidated
(1) Trade receivables includes $13.4 million (2007 $14.3 million) of receivables that have effectively been transferred from Orica but do not qualify for derecognition under AASB 139 due to the consolidated entity's exposure to the relevant debtors via guarantees provided to financial institutions should they not pay. A corresponding liability is recognised in note 17.
For
per
sona
l use
onl
y

Notes to the Financial Statements For the year ended 30 September
Orica Limited 64
8. Trade and other receivables (continued)(ii) Movement in allowance for impairment of trade receivablesThe movement in the allowance for impairment in respect of trade receivables is detailed below:
2008 2007 2008 2007$m $m $m $m
Opening balance (19.5) (35.3) - - Allowances made during the year (7.7) (6.0) - - Additions through acquisition of entities (2.3) (4.5) - - Reductions through disposal of entities - 2.7 - - Allowances utilised during the year 4.1 4.6 - - Allowances written back during the year 4.5 17.4 - - Foreign currency exchange differences (1.5) 1.6 - - Closing balance (22.4) (19.5) - -
(iii) Current other receivables and allowance for impairment
2008 2008 2007 2007Gross Allowance Gross Allowance
$m $m $m $mNot past due 68.6 - 57.5 - Past due 0 - 30 days 19.4 - 2.6 - Past due 31 - 60 days 1.1 - 0.8 - Past due 61 - 90 days 4.2 - 1.1 - Past due 91 - 120 days 1.5 - 6.0 - Past 120 days 29.4 (0.4) 54.5 (1.9)
124.2 (0.4) 122.5 (1.9)
2008 2008 2007 2007Gross Allowance Gross Allowance
$m $m $m $mNot past due 971.6 - 767.1 -
Other receivables generally arise from transactions outside the usual operating activities of the consolidated entity. Interest may be charged where the terms of repayment exceed agreed terms.Other receivables are carried at amounts due. Payment terms vary. A risk assessment process is used for all accounts, with a stopcredit and follow up process in place for most long overdue accounts.Other receivables have been aged according to their due date in the above ageing analysis.
The collectability of other receivables is assessed at balance date and specific allowances are made for any doubtful receivables based on a review of all outstanding amounts at year end. Bad debts are written off to the Income Statement during the year in whichthey are identified.There are no individually significant receivables that have had renegotiated terms that would otherwise, without that renegotiation,have been past due or impaired.
CompanyConsolidated
Consolidated Consolidated
Company Company
For
per
sona
l use
onl
y

Notes to the Financial Statements For the year ended 30 September
Orica Limited 65
8. Trade and other receivables (continued)
(iv) Movement in allowance for impairment of current other receivablesThe movement in the allowance for impairment in respect of current other receivables is detailed below:
2008 2007 2008 2007$m $m $m $m
Opening balance (1.9) (3.8) - - Allowances made during the year (0.2) - - - Allowances written back during the year 1.8 1.8 - - Foreign currency exchange differences (0.1) 0.1 - - Closing balance (0.4) (1.9) - -
(v) Fair valuesThe net carrying amount of trade and other receivables approximates their fair values. For receivables with a remaining life of less than one year, carrying value reflects fair value. All other significant receivables are discounted to determine carrying value and fair value.The maximum exposure to credit risk is the carrying value of receivables. No material collateral is held as security over any of thereceivables.
(vi) Concentrations of credit riskThe consolidated entity is exposed to the following concentrations of credit risk in regards to its current trade and other receivables:
2008 2007 % %
Mining Services 53.6 53.1Chemicals 18.1 20.1Minova 13.7 8.5Consumer Products 12.2 14.0Corporate 2.4 4.3
100.0 100.0
2008 2007 % %
Australia 34.8 41.4New Zealand 4.7 5.6Asia 13.1 11.3North America 13.7 9.3Latin America 15.5 15.5Europe 16.7 15.8Other 1.5 1.1
100.0 100.0
The Company is exposed to credit risk through the financial assets it holds. This is concentrated with related parties.
(vii) Non current receivables All non current receivables are carried at amounts that approximate their fair value. As at 30 September none are past due. None areconsidered impaired.
Consolidated Company
For
per
sona
l use
onl
y

Notes to the Financial Statements For the year ended 30 September
Orica Limited 66
10. Other assetsCurrentPrepayments and other assets 68.9 36.2 0.1 -
68.9 36.2 0.1 - Non-currentPrepayments and other assets 0.3 3.2 - -
0.3 3.2 - -
2008 2007 2008 2007$m $m $m $m
9. InventoriesRaw materials and stores 332.5 225.9 - - Work in progress 35.7 15.2 - - Finished goods 456.1 363.2 - -
824.3 604.3 - -
Consolidated Company
For
per
sona
l use
onl
y

Notes to the Financial Statements For the year ended 30 September
Orica Limited 67
2008 2007 2008 2007% % $m $m
11. Investments accounted for using the equity methodBalance
Name Principal activity dateAustralian Plantations Pty Ltd Tea tree oil production 30 Jun 50.0 50.0 0.1 0.5Botany Industrial Park Pty Limited Facility management service 30 Sep 33.4 33.4 - - BXL Bulk Explosives Limited (1) Manufacture and sale of explosives 31 Oct 50.0 50.0 0.7 0.3Controladora DNS de RL de CV (2) Manufacture and sale of explosives 30 Sep 49.0 49.0 0.1 0.1Dyno Nobel Petrolera (2) Manufacture and sale of explosives 31 Dec 47.0 47.0 - - Dyno Nobel UMMC LLC (3) Manufacture and sale of explosives 31 Dec 50.0 50.0 - - Emirates Explosives L.L.C. (4) * Manufacture and sale of explosives 31 Dec - - - - Exor Explosives Limited (5) Manufacture and sale of explosives 31 Dec 50.0 50.0 1.4 1.2Geneva Nitrogen LLC (6) Manufacture and sale of explosives 30 Sep 50.0 50.0 7.9 5.9Geodynamics B.V. (7) Manufacture and sale of explosives 31 Dec 27.3 27.3 5.4 4.7Irish Mining Emulsion Systems Ltd (8) Manufacture and sale of explosives 30 Sep 50.0 50.0 - - Makina Kimya Nitro Nobel KimyaSanayii A.S (9) ** Manufacture and sale of explosives 30 Sep - - - -
MicroCoal Inc.(6) Development and commercialisation of coal dewatering process 31 Dec 50.0 50.0 3.7 5.0
MSW-Chemie GmbH (10) Manufacture and sale of explosives 31 Dec 31.5 31.5 0.7 0.6Nelson Brothers, LLC (6) Manufacture and sale of explosives 31 Dec 50.0 50.0 28.4 24.5Nelson Brothers Mining Services LLC (6) Supply of explosives 31 Dec 50.0 50.0 20.8 18.2Norabel Ignition Systems AB (11) Manufacture and sale of explosives 31 Dec 50.0 50.0 0.5 0.4Northwest Energetic Services, LLC (6) * Manufacture and sale of explosives 31 Dec - 33.3 - 1.0Orica Camel Coatings Ltd (12) Manufacture and sale of powder coatings 31 Dec 50.0 50.0 - - OY Forcit (13) Manufacture and sale of explosives 31 Dec 20.0 20.0 5.1 4.8Pigment Manufacturers of AustraliaLimited Non-operating company 31 Dec 50.0 50.0 - - Pinegro Products Pty Ltd Manufacture and sale of garden products 30 Jun 50.0 50.0 1.6 1.5PIIK Limited Partnership (1) Sale of explosives 30 Sep 49.0 49.0 - - Southwest Energy LLC (6) Sale of explosives 30 Sep 50.0 - 66.0 - Sprewa Sprengmittel GmbH (10) Sale of explosives 31 Dec 24.0 24.0 0.8 0.9SVG&FNS Philippines Holdings Inc (14) Investment company 31 Dec 40.0 40.0 - - Thai Nitrate Company Ltd (15) Manufacture and sale of explosives 31 Dec 50.0 50.0 62.2 52.8Troisdorf GmbH (10) Holder of operating permits 30 Sep 50.0 50.0 - - Ulaex SA (16) Manufacture and sale of explosives 31 Dec 50.0 50.0 2.8 2.0Wurgendorf GmbH (10) Holder of operating permits 30 Sep 50.0 50.0 0.1 0.1
208.3 124.5
Entities are incorporated in Australia except: (1) Canada, (2) Mexico, (3) Russia, (4) United Arab Emirates, (5) UK, (6) USA, (7) Holland, (8) Ireland, (9) Turkey, (10) Germany, (11) Sweden, (12) Hong Kong, (13) Finland, (14) Philippines, (15) Thailand, (16) Cuba.
** Disposed of - Makina Kimya Nitro Nobel Kimya Sanayii A.S on 3 May 2007.
Ownership Carrying amount
Consolidated
* Consolidated as a subsidiary: Emirates Explosives L.L.C. from 6 November 2006, Northwest Energetic Services, LLC from 1 December 2007.
For
per
sona
l use
onl
y
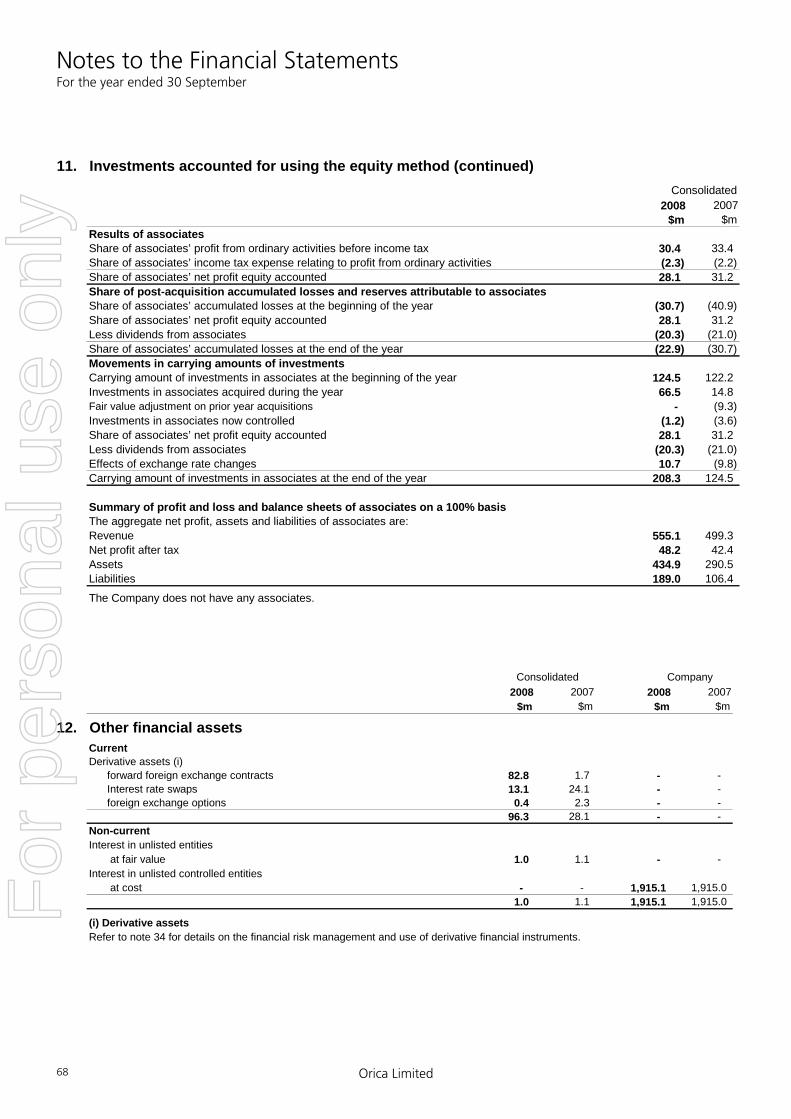
Notes to the Financial Statements For the year ended 30 September
Orica Limited 68
11. Investments accounted for using the equity method (continued)
2008 2007$m $m
Results of associatesShare of associates’ profit from ordinary activities before income tax 30.4 33.4Share of associates’ income tax expense relating to profit from ordinary activities (2.3) (2.2)Share of associates’ net profit equity accounted 28.1 31.2Share of post-acquisition accumulated losses and reserves attributable to associatesShare of associates’ accumulated losses at the beginning of the year (30.7) (40.9)Share of associates’ net profit equity accounted 28.1 31.2Less dividends from associates (20.3) (21.0)Share of associates’ accumulated losses at the end of the year (22.9) (30.7)Movements in carrying amounts of investmentsCarrying amount of investments in associates at the beginning of the year 124.5 122.2Investments in associates acquired during the year 66.5 14.8Fair value adjustment on prior year acquisitions - (9.3)Investments in associates now controlled (1.2) (3.6)Share of associates’ net profit equity accounted 28.1 31.2Less dividends from associates (20.3) (21.0)Effects of exchange rate changes 10.7 (9.8)Carrying amount of investments in associates at the end of the year 208.3 124.5
Summary of profit and loss and balance sheets of associates on a 100% basisThe aggregate net profit, assets and liabilities of associates are:Revenue 555.1 499.3 Net profit after tax 48.2 42.4 Assets 434.9 290.5 Liabilities 189.0 106.4
The Company does not have any associates.
Consolidated
2008 2007 2008 2007$m $m $m $m
12. Other financial assetsCurrentDerivative assets (i) forward foreign exchange contracts 82.8 1.7 - - Interest rate swaps 13.1 24.1 - - foreign exchange options 0.4 2.3 - -
96.3 28.1 - - Non-currentInterest in unlisted entities at fair value 1.0 1.1 - - Interest in unlisted controlled entities at cost - - 1,915.1 1,915.0
1.0 1.1 1,915.1 1,915.0
(i) Derivative assetsRefer to note 34 for details on the financial risk management and use of derivative financial instruments.
Consolidated Company
For
per
sona
l use
onl
y

Notes to the Financial Statements For the year ended 30 September
Orica Limited 69
2008 2007 2008 2007$m $m $m $m
13. Property, plant and equipmentLand, buildings and improvements at cost 586.8 523.0 39.1 41.7 accumulated depreciation (199.4) (154.2) (13.2) (15.6) Total carrying value 387.4 368.8 25.9 26.1
Machinery, plant and equipment Gross book value at cost 2,919.0 2,568.0 3.2 3.6 under finance lease 26.1 0.5 - -
2,945.1 2,568.5 3.2 3.6 Accumulated depreciation at cost (1,279.2) (1,194.1) (3.1) (3.5) under finance lease (1.0) (0.3) - -
(1,280.2) (1,194.4) (3.1) (3.5) Net carrying value at cost 1,639.8 1,373.9 0.1 0.1 under finance lease 25.1 0.2 - - Total carrying value 1,664.9 1,374.1 0.1 0.1
Total net carrying value of property, plant and equipment 2,052.3 1,742.9 26.0 26.2
(i) Capitalised borrowing costsInterest amounting to $2.0 million (2007 $1.4 million) was capitalised to property, plant and equipment, calculated at the rate of7.4% (2007 7.2%).
Consolidated Company
For
per
sona
l use
onl
y
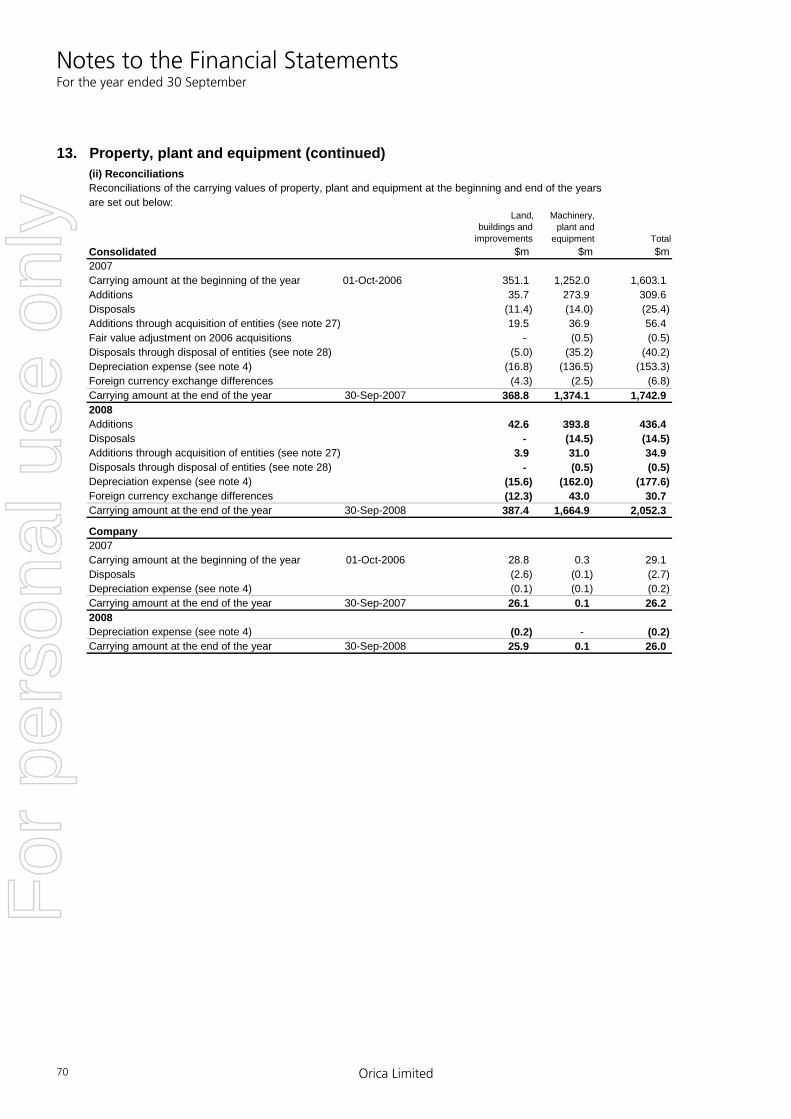
Notes to the Financial Statements For the year ended 30 September
Orica Limited 70
13. Property, plant and equipment (continued)(ii) ReconciliationsReconciliations of the carrying values of property, plant and equipment at the beginning and end of the years are set out below:
Land, Machinery,buildings and plant and
improvements equipment TotalConsolidated $m $m $m2007Carrying amount at the beginning of the year 01-Oct-2006 351.1 1,252.0 1,603.1 Additions 35.7 273.9 309.6 Disposals (11.4) (14.0) (25.4) Additions through acquisition of entities (see note 27) 19.5 36.9 56.4 Fair value adjustment on 2006 acquisitions - (0.5) (0.5) Disposals through disposal of entities (see note 28) (5.0) (35.2) (40.2) Depreciation expense (see note 4) (16.8) (136.5) (153.3) Foreign currency exchange differences (4.3) (2.5) (6.8) Carrying amount at the end of the year 30-Sep-2007 368.8 1,374.1 1,742.9 2008Additions 42.6 393.8 436.4 Disposals - (14.5) (14.5) Additions through acquisition of entities (see note 27) 3.9 31.0 34.9 Disposals through disposal of entities (see note 28) - (0.5) (0.5) Depreciation expense (see note 4) (15.6) (162.0) (177.6) Foreign currency exchange differences (12.3) 43.0 30.7 Carrying amount at the end of the year 30-Sep-2008 387.4 1,664.9 2,052.3
Company2007Carrying amount at the beginning of the year 01-Oct-2006 28.8 0.3 29.1 Disposals (2.6) (0.1) (2.7) Depreciation expense (see note 4) (0.1) (0.1) (0.2) Carrying amount at the end of the year 30-Sep-2007 26.1 0.1 26.2 2008Depreciation expense (see note 4) (0.2) - (0.2) Carrying amount at the end of the year 30-Sep-2008 25.9 0.1 26.0
For
per
sona
l use
onl
y

Notes to the Financial Statements For the year ended 30 September
Orica Limited 71
2008 2007 2008 2007$m $m $m $m
14. Intangible assetsGoodwill 2,599.0 1,789.5 - - Less impairment losses (26.0) (26.0) - - Total net book value of goodwill 2,573.0 1,763.5 - -
Patents, trademarks and rights 137.2 135.8 - - Less accumulated amortisation (53.4) (48.9) - - Total net book value of patents, trademarks and rights 83.8 86.9 - -
Brand names 65.0 62.4 - - Less accumulated amortisation (5.2) (2.8) - - Total net book value of brand names 59.8 59.6 - -
Software 63.0 52.9 - - Less accumulated amortisation (36.4) (26.0) - - Total net book value of software 26.6 26.9 - -
Customer contracts and relationships 308.7 131.5 - - Less accumulated amortisation (39.3) (12.9) - - Total net book value of customer contracts and relationships 269.4 118.6 - -
Total net book value of intangibles 3,012.6 2,055.5 - -
Consolidated Company
Reconciliations of the carrying values of intangible assets at the beginning and end of the years are set out below:
PatentsGoodwill trademarks Brand names Software Customer
and contractsrights Total
Consolidated $m $m $m $m $m $m 2007Carrying amount at the beginning of the year 1,004.9 41.6 26.0 29.3 39.5 1,141.3 Additions - 1.0 23.5 7.7 - 32.2 Disposals - - - (3.0) - (3.0) Additions through acquisition of entities (see note 27) 758.4 55.1 15.0 2.7 92.8 924.0 Fair value adjustment on 2006 acquisitions 77.0 - - - - 77.0 Amortisation expense (see note 4) - (9.3) (1.9) (7.2) (11.5) (29.9) Impairment expense (see note 29) (1) (15.4) - - - - (15.4) Foreign currency exchange differences (61.4) (1.5) (3.0) (2.6) (2.2) (70.7) Carrying amount at the end of the year 1,763.5 86.9 59.6 26.9 118.6 2,055.52008Additions - 2.8 - 9.1 - 11.9 Additions through acquisition of entities (see note 27) 659.4 0.9 - 0.2 155.8 816.3 Disposals through disposal of entities (see note 28) (0.7) - - - - (0.7) Amortisation expense (see note 4) - (6.9) (2.2) (7.6) (24.4) (41.1) Foreign currency exchange differences 150.8 0.1 2.4 (2.0) 19.4 170.7Carrying amount at the end of the year 2,573.0 83.8 59.8 26.6 269.4 3,012.6
There are no intangible assets held by the Company.(1) Impairment of goodwill is related to the writedown of Marplex goodwill in 2007. F
or p
erso
nal u
se o
nly
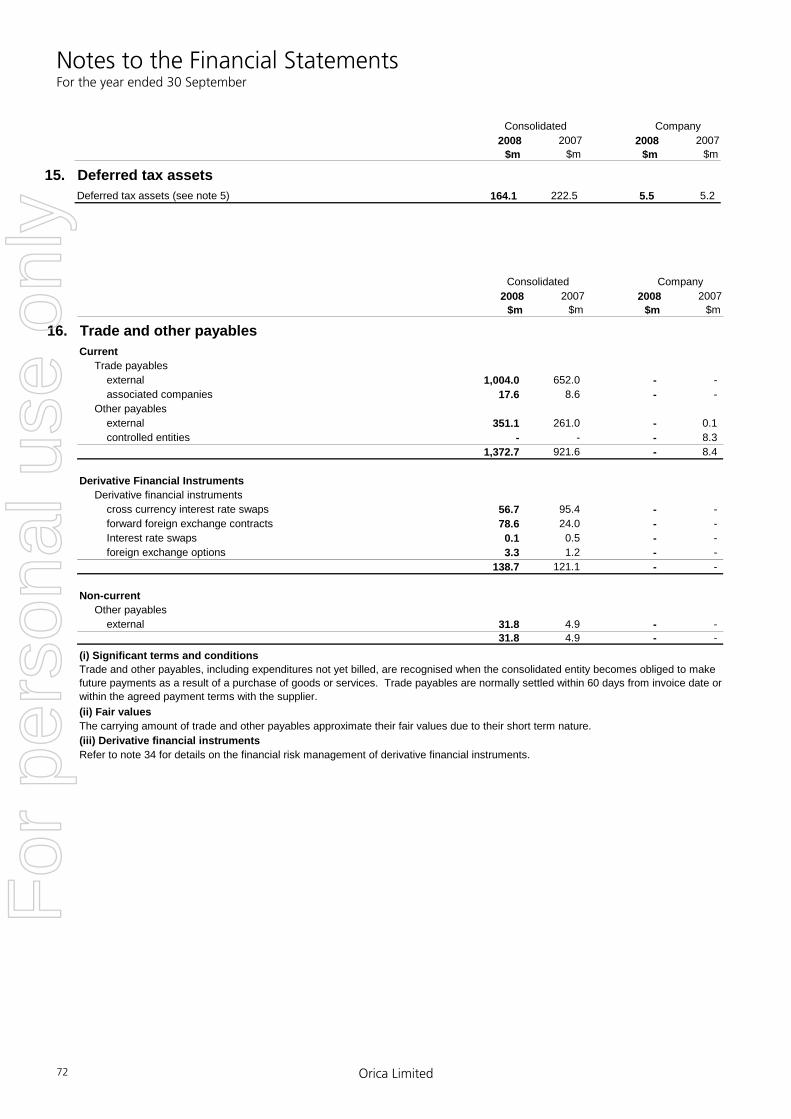
Notes to the Financial Statements For the year ended 30 September
Orica Limited 72
2008 2007 2008 2007$m $m $m $m
16. Trade and other payablesCurrent Trade payables external 1,004.0 652.0 - - associated companies 17.6 8.6 - - Other payables external 351.1 261.0 - 0.1 controlled entities - - - 8.3
1,372.7 921.6 - 8.4
Derivative Financial Instruments Derivative financial instruments cross currency interest rate swaps 56.7 95.4 - - forward foreign exchange contracts 78.6 24.0 - - Interest rate swaps 0.1 0.5 - - foreign exchange options 3.3 1.2 - -
138.7 121.1 - -
Non-current Other payables external 31.8 4.9 - -
31.8 4.9 - - (i) Significant terms and conditions
(ii) Fair valuesThe carrying amount of trade and other payables approximate their fair values due to their short term nature.(iii) Derivative financial instrumentsRefer to note 34 for details on the financial risk management of derivative financial instruments.
Trade and other payables, including expenditures not yet billed, are recognised when the consolidated entity becomes obliged to make future payments as a result of a purchase of goods or services. Trade payables are normally settled within 60 days from invoice date or within the agreed payment terms with the supplier.
CompanyConsolidated
2008 2007 2008 2007$m $m $m $m
15. Deferred tax assetsDeferred tax assets (see note 5) 164.1 222.5 5.5 5.2
Consolidated Company
For
per
sona
l use
onl
y
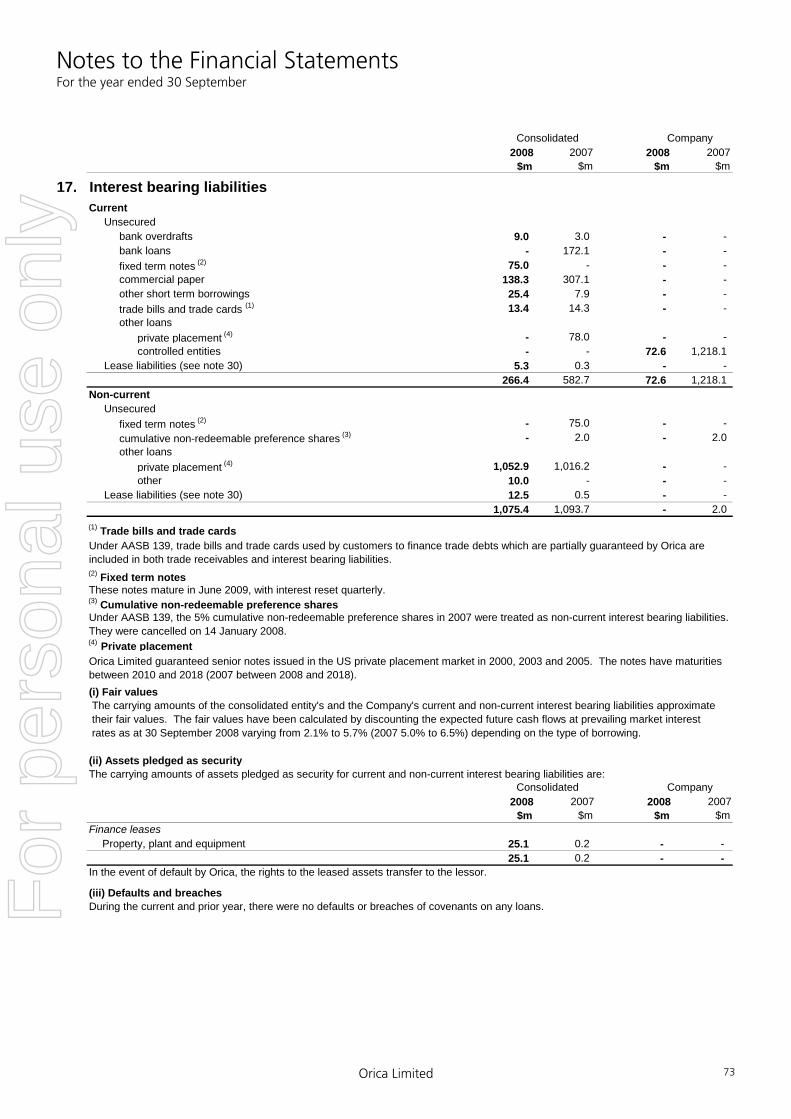
Notes to the Financial Statements For the year ended 30 September
Orica Limited 73
2008 2007 2008 2007$m $m $m $m
17. Interest bearing liabilitiesCurrent Unsecured bank overdrafts 9.0 3.0 - - bank loans - 172.1 - - fixed term notes (2) 75.0 - - - commercial paper 138.3 307.1 - - other short term borrowings 25.4 7.9 - - trade bills and trade cards (1) 13.4 14.3 - - other loans private placement (4) - 78.0 - - controlled entities - - 72.6 1,218.1 Lease liabilities (see note 30) 5.3 0.3 - -
266.4 582.7 72.6 1,218.1 Non-current Unsecured fixed term notes (2) - 75.0 - - cumulative non-redeemable preference shares (3) - 2.0 - 2.0 other loans private placement (4) 1,052.9 1,016.2 - - other 10.0 - - - Lease liabilities (see note 30) 12.5 0.5 - -
1,075.4 1,093.7 - 2.0 (1) Trade bills and trade cards
(2) Fixed term notesThese notes mature in June 2009, with interest reset quarterly.(3) Cumulative non-redeemable preference sharesUnder AASB 139, the 5% cumulative non-redeemable preference shares in 2007 were treated as non-current interest bearing liabilities. They were cancelled on 14 January 2008.(4) Private placement
(i) Fair values The carrying amounts of the consolidated entity's and the Company's current and non-current interest bearing liabilities approximate their fair values. The fair values have been calculated by discounting the expected future cash flows at prevailing market interest rates as at 30 September 2008 varying from 2.1% to 5.7% (2007 5.0% to 6.5%) depending on the type of borrowing.
(ii) Assets pledged as securityThe carrying amounts of assets pledged as security for current and non-current interest bearing liabilities are:
2008 2007 2008 2007$m $m $m $m
Finance leasesProperty, plant and equipment 25.1 0.2 - -
25.1 0.2 - - In the event of default by Orica, the rights to the leased assets transfer to the lessor.
(iii) Defaults and breachesDuring the current and prior year, there were no defaults or breaches of covenants on any loans.
Orica Limited guaranteed senior notes issued in the US private placement market in 2000, 2003 and 2005. The notes have maturities between 2010 and 2018 (2007 between 2008 and 2018).
Consolidated Company
Under AASB 139, trade bills and trade cards used by customers to finance trade debts which are partially guaranteed by Orica are included in both trade receivables and interest bearing liabilities.
Consolidated Company
For
per
sona
l use
onl
y
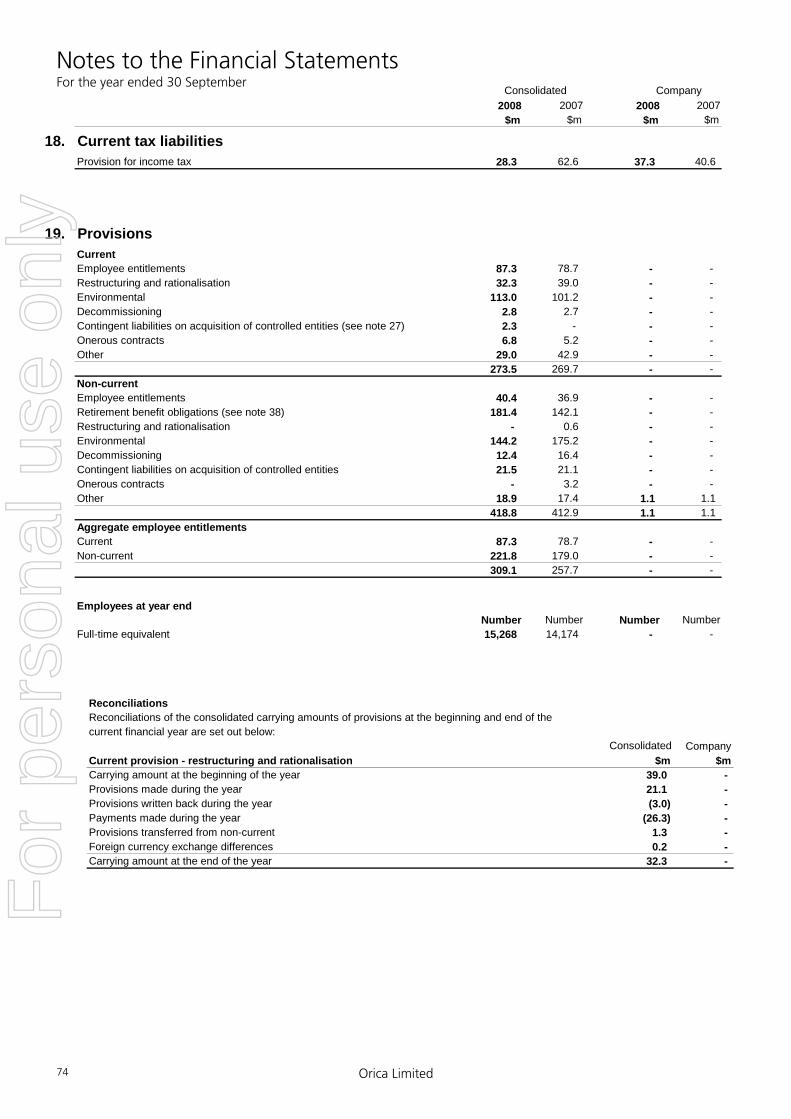
Notes to the Financial Statements For the year ended 30 September
Orica Limited 74
2008 2007 2008 2007 $m $m $m $m
18. Current tax liabilitiesProvision for income tax 28.3 62.6 37.3 40.6
Consolidated Company
19. ProvisionsCurrentEmployee entitlements 87.3 78.7 - - Restructuring and rationalisation 32.3 39.0 - - Environmental 113.0 101.2 - - Decommissioning 2.8 2.7 - - Contingent liabilities on acquisition of controlled entities (see note 27) 2.3 - - - Onerous contracts 6.8 5.2 - - Other 29.0 42.9 - -
273.5 269.7 - - Non-currentEmployee entitlements 40.4 36.9 - - Retirement benefit obligations (see note 38) 181.4 142.1 - - Restructuring and rationalisation - 0.6 - - Environmental 144.2 175.2 - - Decommissioning 12.4 16.4 - - Contingent liabilities on acquisition of controlled entities 21.5 21.1 - - Onerous contracts - 3.2 - - Other 18.9 17.4 1.1 1.1
418.8 412.9 1.1 1.1Aggregate employee entitlementsCurrent 87.3 78.7 - - Non-current 221.8 179.0 - -
309.1 257.7 - -
Employees at year endNumber Number Number Number
Full-time equivalent 15,268 14,174 - -
ReconciliationsReconciliations of the consolidated carrying amounts of provisions at the beginning and end of thecurrent financial year are set out below:
CompanyCurrent provision - restructuring and rationalisation $m $mCarrying amount at the beginning of the year 39.0 - Provisions made during the year 21.1 - Provisions written back during the year (3.0) - Payments made during the year (26.3) - Provisions transferred from non-current 1.3 - Foreign currency exchange differences 0.2 - Carrying amount at the end of the year 32.3 -
Consolidated
For
per
sona
l use
onl
y

Notes to the Financial Statements For the year ended 30 September
Orica Limited 75
19. Provisions (continued)Company
Current provision - environmental $m $mCarrying amount at the beginning of the year 101.2 - Additions through acquisition of entities (see note 27) 2.2 - Provisions made during the year 3.6 - Provisions written back during the year (0.8) - Payments made during the year (39.0) - Provision transferred from non-current 40.8 - Foreign currency exchange differences 5.0 - Carrying amount at the end of the year 113.0 -
Current provision - decommissioningCarrying amount at the beginning of the year 2.7 - Payments made during the year (1.8) - Provision transferred from non-current 1.9 - Carrying amount at the end of the year 2.8 -
Current provision - contingent liabilities on acquisition of controlled entitiesCarrying amount at the beginning of the year - - Additions through acquisition of entities (see note 27) 2.1 - Provisions written back during the year 0.3 - Foreign currency exchange differences (0.1) - Carrying amount at the end of the year 2.3 -
Current provision - onerous contractsCarrying amount at the beginning of the year 5.2 - Payments made during the year (1.6) - Provision transferred from non-current 3.2 - Carrying amount at the end of the year 6.8 -
Current provision - otherCarrying amount at the beginning of the year 42.9 - Provisions made during the year 1.4 - Payments made during the year (15.5) - Provision transferred from non-current 1.8 - Foreign currency exchange differences (1.6) - Carrying amount at the end of the year 29.0 -
Non-current provision - restructuring and rationalisationCarrying amount at the beginning of the year 0.6 - Provision transferred to current (1.3) - Foreign currency exchange differences 0.7 - Carrying amount at the end of the year - -
Non-current provision - environmentalCarrying amount at the beginning of the year 175.2 - Provisions made during the year 1.6 - Provisions written back during the year (0.6) - Payments made during the year (0.2) - Unwinding of discount on provisions (see note 4) 8.1 - Provision transferred to current (40.8) - Foreign currency exchange differences 0.9 - Carrying amount at the end of the year 144.2 -
Consolidated
For
per
sona
l use
onl
y
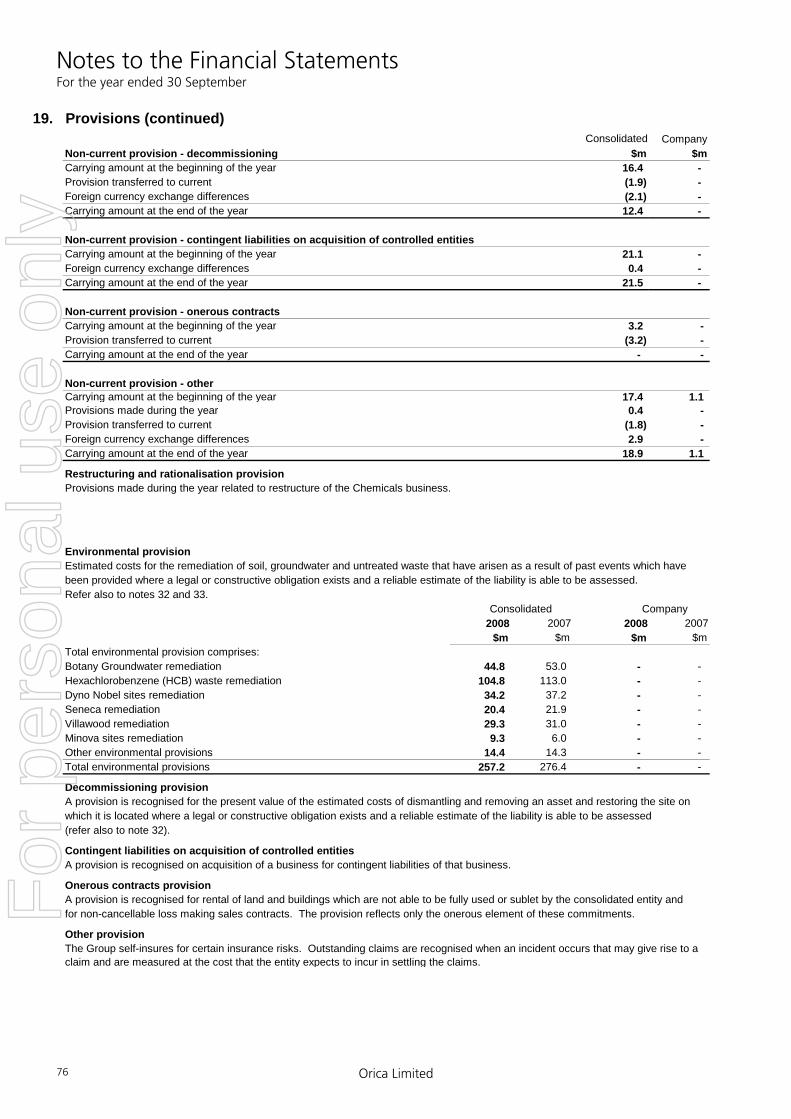
Notes to the Financial Statements For the year ended 30 September
Orica Limited 76
19. Provisions (continued)Company
Non-current provision - decommissioning $m $mCarrying amount at the beginning of the year 16.4 - Provision transferred to current (1.9) - Foreign currency exchange differences (2.1) - Carrying amount at the end of the year 12.4 -
Non-current provision - contingent liabilities on acquisition of controlled entitiesCarrying amount at the beginning of the year 21.1 - Foreign currency exchange differences 0.4 - Carrying amount at the end of the year 21.5 -
Non-current provision - onerous contractsCarrying amount at the beginning of the year 3.2 - Provision transferred to current (3.2) - Carrying amount at the end of the year - -
Non-current provision - otherCarrying amount at the beginning of the year 17.4 1.1 Provisions made during the year 0.4 - Provision transferred to current (1.8) - Foreign currency exchange differences 2.9 - Carrying amount at the end of the year 18.9 1.1
Restructuring and rationalisation provisionProvisions made during the year related to restructure of the Chemicals business.
Environmental provisionEstimated costs for the remediation of soil, groundwater and untreated waste that have arisen as a result of past events which havebeen provided where a legal or constructive obligation exists and a reliable estimate of the liability is able to be assessed.Refer also to notes 32 and 33.
Consolidated Company2008 2007 2008 2007
$m $m $m $mTotal environmental provision comprises:Botany Groundwater remediation 44.8 53.0 - - Hexachlorobenzene (HCB) waste remediation 104.8 113.0 - - Dyno Nobel sites remediation 34.2 37.2 - - Seneca remediation 20.4 21.9 - - Villawood remediation 29.3 31.0 - - Minova sites remediation 9.3 6.0 - - Other environmental provisions 14.4 14.3 - - Total environmental provisions 257.2 276.4 - -
Decommissioning provisionA provision is recognised for the present value of the estimated costs of dismantling and removing an asset and restoring the site onwhich it is located where a legal or constructive obligation exists and a reliable estimate of the liability is able to be assessed(refer also to note 32).
Contingent liabilities on acquisition of controlled entitiesA provision is recognised on acquisition of a business for contingent liabilities of that business.
Onerous contracts provisionA provision is recognised for rental of land and buildings which are not able to be fully used or sublet by the consolidated entity andfor non-cancellable loss making sales contracts. The provision reflects only the onerous element of these commitments.
Other provisionThe Group self-insures for certain insurance risks. Outstanding claims are recognised when an incident occurs that may give rise to aclaim and are measured at the cost that the entity expects to incur in settling the claims.
Consolidated
For
per
sona
l use
onl
y
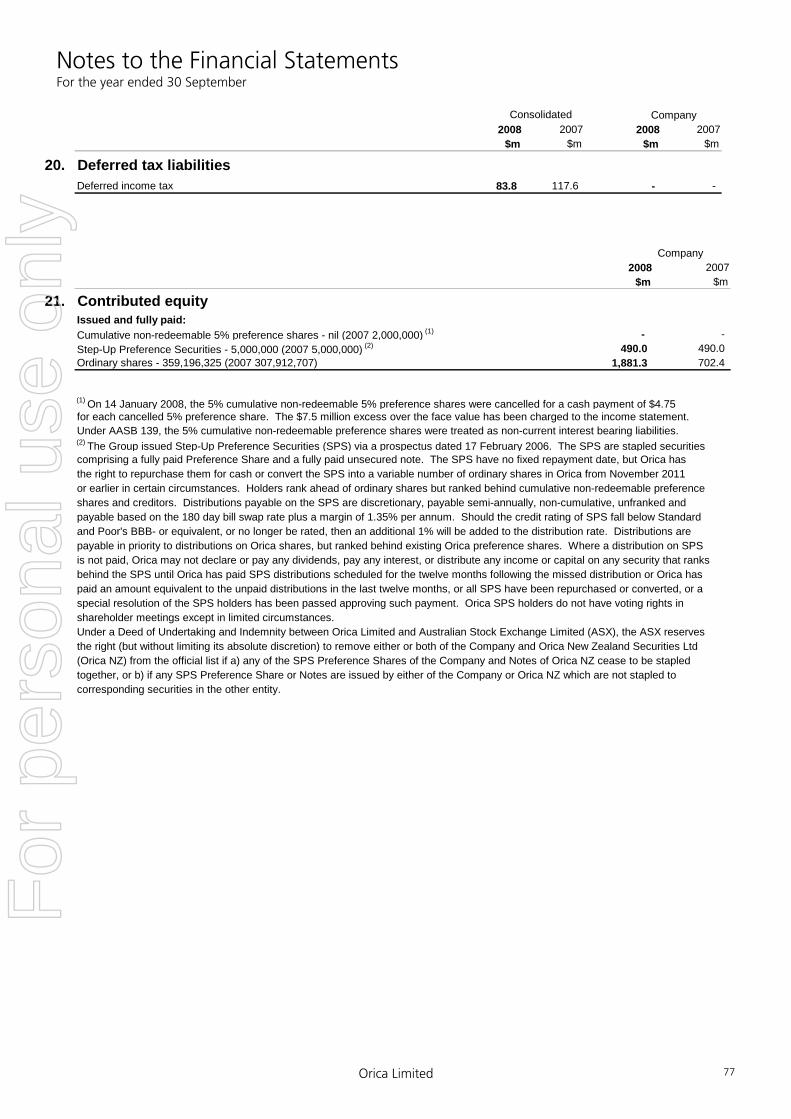
Notes to the Financial Statements For the year ended 30 September
Orica Limited 77
Company
2008 2007$m $m
21. Contributed equityIssued and fully paid:Cumulative non-redeemable 5% preference shares - nil (2007 2,000,000) (1) - - Step-Up Preference Securities - 5,000,000 (2007 5,000,000) (2) 490.0 490.0 Ordinary shares - 359,196,325 (2007 307,912,707) 1,881.3 702.4
(1) On 14 January 2008, the 5% cumulative non-redeemable 5% preference shares were cancelled for a cash payment of $4.75 for each cancelled 5% preference share. The $7.5 million excess over the face value has been charged to the income statement.Under AASB 139, the 5% cumulative non-redeemable preference shares were treated as non-current interest bearing liabilities.(2) The Group issued Step-Up Preference Securities (SPS) via a prospectus dated 17 February 2006. The SPS are stapled securitiescomprising a fully paid Preference Share and a fully paid unsecured note. The SPS have no fixed repayment date, but Orica has the right to repurchase them for cash or convert the SPS into a variable number of ordinary shares in Orica from November 2011or earlier in certain circumstances. Holders rank ahead of ordinary shares but ranked behind cumulative non-redeemable preference shares and creditors. Distributions payable on the SPS are discretionary, payable semi-annually, non-cumulative, unfranked and payable based on the 180 day bill swap rate plus a margin of 1.35% per annum. Should the credit rating of SPS fall below Standardand Poor's BBB- or equivalent, or no longer be rated, then an additional 1% will be added to the distribution rate. Distributions arepayable in priority to distributions on Orica shares, but ranked behind existing Orica preference shares. Where a distribution on SPS is not paid, Orica may not declare or pay any dividends, pay any interest, or distribute any income or capital on any security that ranks behind the SPS until Orica has paid SPS distributions scheduled for the twelve months following the missed distribution or Orica has paid an amount equivalent to the unpaid distributions in the last twelve months, or all SPS have been repurchased or converted, or aspecial resolution of the SPS holders has been passed approving such payment. Orica SPS holders do not have voting rights in shareholder meetings except in limited circumstances.Under a Deed of Undertaking and Indemnity between Orica Limited and Australian Stock Exchange Limited (ASX), the ASX reservesthe right (but without limiting its absolute discretion) to remove either or both of the Company and Orica New Zealand Securities Ltd(Orica NZ) from the official list if a) any of the SPS Preference Shares of the Company and Notes of Orica NZ cease to be stapledtogether, or b) if any SPS Preference Share or Notes are issued by either of the Company or Orica NZ which are not stapled to corresponding securities in the other entity.
Company2008 2007 2008 2007
$m $m $m $m
20. Deferred tax liabilitiesDeferred income tax 83.8 117.6 - -
Consolidated
For
per
sona
l use
onl
y
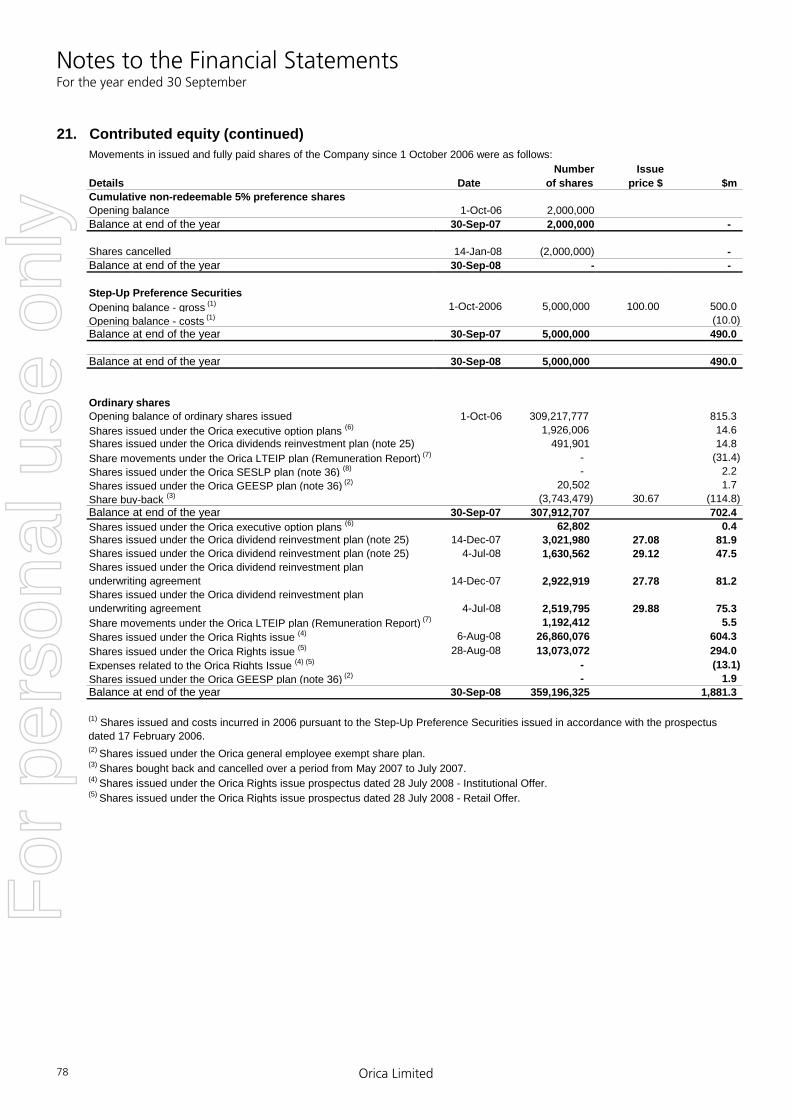
Notes to the Financial Statements For the year ended 30 September
Orica Limited 78
21. Contributed equity (continued)Movements in issued and fully paid shares of the Company since 1 October 2006 were as follows:
Number Issue Details Date of shares price $ $m Cumulative non-redeemable 5% preference sharesOpening balance 1-Oct-06 2,000,000 Balance at end of the year 30-Sep-07 2,000,000 -
Shares cancelled 14-Jan-08 (2,000,000) - Balance at end of the year 30-Sep-08 - -
Step-Up Preference SecuritiesOpening balance - gross (1) 1-Oct-2006 5,000,000 100.00 500.0Opening balance - costs (1) (10.0)Balance at end of the year 30-Sep-07 5,000,000 490.0
Balance at end of the year 30-Sep-08 5,000,000 490.0
Ordinary sharesOpening balance of ordinary shares issued 1-Oct-06 309,217,777 815.3Shares issued under the Orica executive option plans (6) 1,926,006 14.6Shares issued under the Orica dividends reinvestment plan (note 25) 491,901 14.8Share movements under the Orica LTEIP plan (Remuneration Report) (7) - (31.4)Shares issued under the Orica SESLP plan (note 36) (8) - 2.2Shares issued under the Orica GEESP plan (note 36) (2) 20,502 1.7 Share buy-back (3) (3,743,479) 30.67 (114.8) Balance at end of the year 30-Sep-07 307,912,707 702.4 Shares issued under the Orica executive option plans (6) 62,802 0.4 Shares issued under the Orica dividend reinvestment plan (note 25) 14-Dec-07 3,021,980 27.08 81.9 Shares issued under the Orica dividend reinvestment plan (note 25) 4-Jul-08 1,630,562 29.12 47.5 Shares issued under the Orica dividend reinvestment planunderwriting agreement 14-Dec-07 2,922,919 27.78 81.2 Shares issued under the Orica dividend reinvestment planunderwriting agreement 4-Jul-08 2,519,795 29.88 75.3 Share movements under the Orica LTEIP plan (Remuneration Report) (7) 1,192,412 5.5 Shares issued under the Orica Rights issue (4) 6-Aug-08 26,860,076 604.3 Shares issued under the Orica Rights issue (5) 28-Aug-08 13,073,072 294.0 Expenses related to the Orica Rights Issue (4) (5) - (13.1) Shares issued under the Orica GEESP plan (note 36) (2) - 1.9 Balance at end of the year 30-Sep-08 359,196,325 1,881.3
(2) Shares issued under the Orica general employee exempt share plan.(3) Shares bought back and cancelled over a period from May 2007 to July 2007. (4) Shares issued under the Orica Rights issue prospectus dated 28 July 2008 - Institutional Offer. (5) Shares issued under the Orica Rights issue prospectus dated 28 July 2008 - Retail Offer.
(1) Shares issued and costs incurred in 2006 pursuant to the Step-Up Preference Securities issued in accordance with the prospectus dated 17 February 2006.
For
per
sona
l use
onl
y
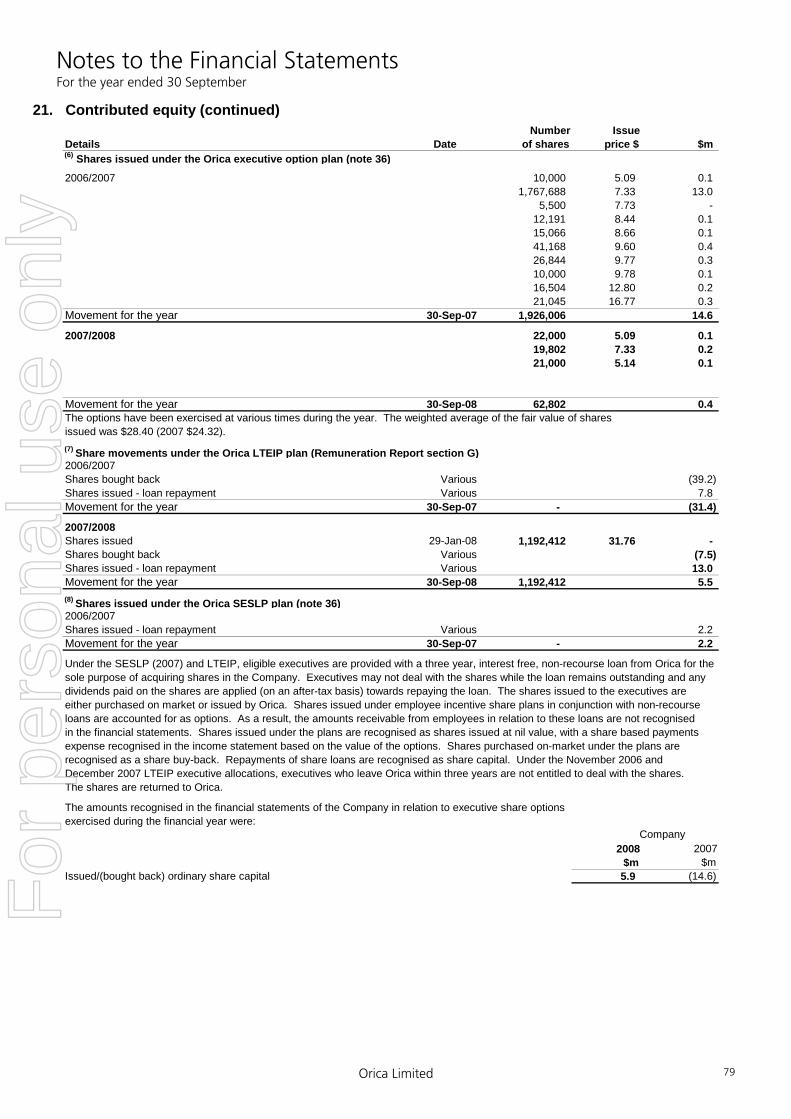
Notes to the Financial Statements For the year ended 30 September
Orica Limited 79
21. Contributed equity (continued)Number Issue
Details Date of shares price $ $m (6) Shares issued under the Orica executive option plan (note 36)
2006/2007 10,000 5.09 0.11,767,688 7.33 13.0
5,500 7.73 - 12,191 8.44 0.115,066 8.66 0.141,168 9.60 0.4 26,844 9.77 0.310,000 9.78 0.116,504 12.80 0.221,045 16.77 0.3
Movement for the year 30-Sep-07 1,926,006 14.6
2007/2008 22,000 5.09 0.1 19,802 7.33 0.2 21,000 5.14 0.1
Movement for the year 30-Sep-08 62,802 0.4The options have been exercised at various times during the year. The weighted average of the fair value of sharesissued was $28.40 (2007 $24.32).(7) Share movements under the Orica LTEIP plan (Remuneration Report section G)2006/2007Shares bought back Various (39.2) Shares issued - loan repayment Various 7.8Movement for the year 30-Sep-07 - (31.4)
2007/2008Shares issued 29-Jan-08 1,192,412 31.76 - Shares bought back Various (7.5) Shares issued - loan repayment Various 13.0Movement for the year 30-Sep-08 1,192,412 5.5(8) Shares issued under the Orica SESLP plan (note 36)2006/2007Shares issued - loan repayment Various 2.2 Movement for the year 30-Sep-07 - 2.2
Under the SESLP (2007) and LTEIP, eligible executives are provided with a three year, interest free, non-recourse loan from Orica for thesole purpose of acquiring shares in the Company. Executives may not deal with the shares while the loan remains outstanding and anydividends paid on the shares are applied (on an after-tax basis) towards repaying the loan. The shares issued to the executives areeither purchased on market or issued by Orica. Shares issued under employee incentive share plans in conjunction with non-recourseloans are accounted for as options. As a result, the amounts receivable from employees in relation to these loans are not recognisedin the financial statements. Shares issued under the plans are recognised as shares issued at nil value, with a share based paymentsexpense recognised in the income statement based on the value of the options. Shares purchased on-market under the plans are recognised as a share buy-back. Repayments of share loans are recognised as share capital. Under the November 2006 and December 2007 LTEIP executive allocations, executives who leave Orica within three years are not entitled to deal with the shares. The shares are returned to Orica.
The amounts recognised in the financial statements of the Company in relation to executive share optionsexercised during the financial year were:
2008 2007 $m $m
Issued/(bought back) ordinary share capital 5.9 (14.6)
Company
For
per
sona
l use
onl
y
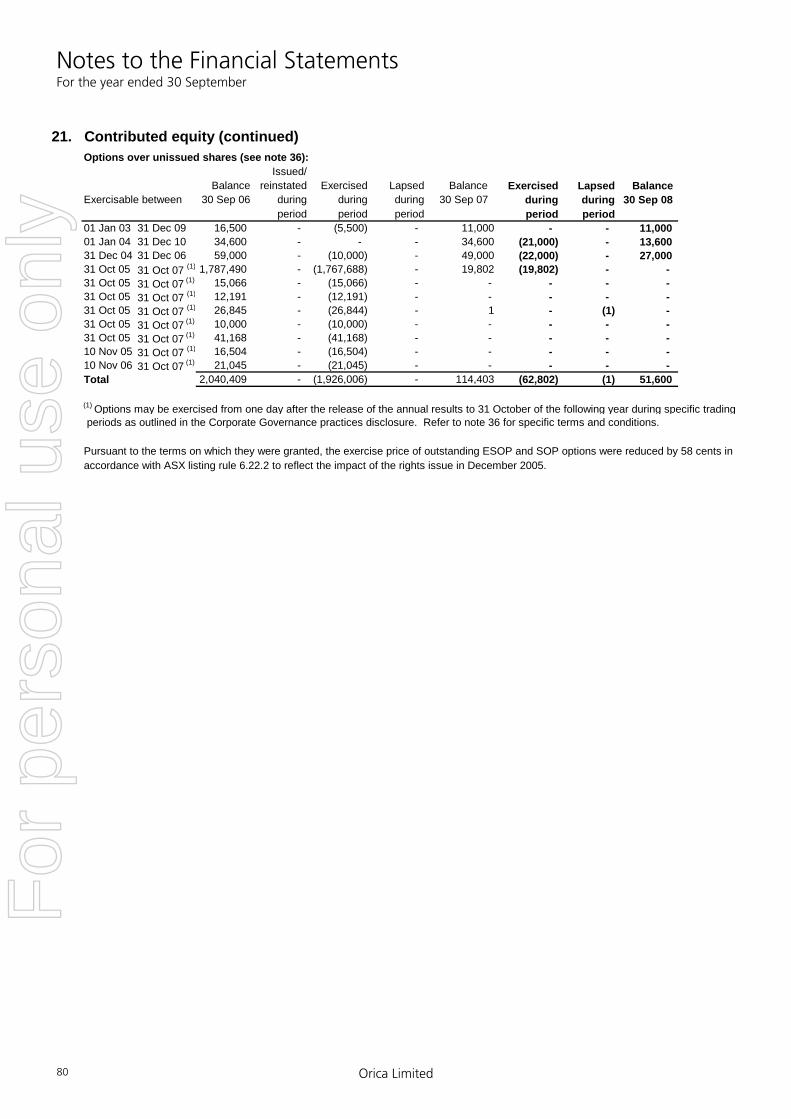
Notes to the Financial Statements For the year ended 30 September
Orica Limited 80
21. Contributed equity (continued)Options over unissued shares (see note 36):
Issued/ Balance reinstated Exercised Lapsed Balance Exercised Lapsed Balance
Exercisable between 30 Sep 06 during during during 30 Sep 07 during during 30 Sep 08period period period period period
01 Jan 03 31 Dec 09 16,500 - (5,500) - 11,000 - - 11,00001 Jan 04 31 Dec 10 34,600 - - - 34,600 (21,000) - 13,60031 Dec 04 31 Dec 06 59,000 - (10,000) - 49,000 (22,000) - 27,00031 Oct 05 31 Oct 07 (1) 1,787,490 - (1,767,688) - 19,802 (19,802) - - 31 Oct 05 31 Oct 07 (1) 15,066 - (15,066) - - - - - 31 Oct 05 31 Oct 07 (1) 12,191 - (12,191) - - - - - 31 Oct 05 31 Oct 07 (1) 26,845 - (26,844) - 1 - (1) - 31 Oct 05 31 Oct 07 (1) 10,000 - (10,000) - - - - - 31 Oct 05 31 Oct 07 (1) 41,168 - (41,168) - - - - - 10 Nov 05 31 Oct 07 (1) 16,504 - (16,504) - - - - - 10 Nov 06 31 Oct 07 (1) 21,045 - (21,045) - - - - - Total 2,040,409 - (1,926,006) - 114,403 (62,802) (1) 51,600
(1) Options may be exercised from one day after the release of the annual results to 31 October of the following year during specific trading periods as outlined in the Corporate Governance practices disclosure. Refer to note 36 for specific terms and conditions.
Pursuant to the terms on which they were granted, the exercise price of outstanding ESOP and SOP options were reduced by 58 cents in accordance with ASX listing rule 6.22.2 to reflect the impact of the rights issue in December 2005.
For
per
sona
l use
onl
y

Notes to the Financial Statements For the year ended 30 September
Orica Limited 81
Notes2008 2007 2008 2007
$m $m $m $m
22. Reserves and retained earnings(a) ReservesShare based payments 28.1 21.6 - - Cash flow hedging 5.2 (4.5) - - Foreign currency translation 64.0 (198.6) - - Equity - arising from purchase of minorities (6.0) (7.0) - - Balance at end of year 91.3 (188.5) - - Movement in reserves during the yearShare based payments Balance at beginning of year 21.6 18.9 - - Share based payments expense 6.5 2.7 - - Balance at end of year 28.1 21.6 - - Cash flow hedging Balance at beginning of year (4.5) 3.1 - - Movement for period 9.7 (7.6) - - Balance at end of the year 5.2 (4.5) - - Foreign currency translation Balance at beginning of year (198.6) (68.6) - - Transfer to income statement on disposal of foreign subsidiaries - 2.9 - - Translation of overseas controlled entities at the end of the financial year 262.6 (132.9) - - Balance at end of the year 64.0 (198.6) - - Equity - arising from purchase of minorities Balance at beginning of year (7.0) - - - Purchase of minority interests 1.0 (7.0) - - Balance at end of the year (6.0) (7.0) - -
(b) Retained earningsRetained earnings at the beginning of the year 1,562.8 1,357.9 350.9 668.4Operating profit/(loss) after income tax attributableto shareholders of Orica 539.6 487.7 497.7 (27.7)Defined benefit fund superannuation movement (net of tax) (30.9) 7.0 - - Dividends/distributions paid: (25) Step-Up Preference Securities distributions (41.5) (44.4) (41.5) (44.4) Less tax credit on Step-Up Preference Securities distributions 13.4 13.9 13.4 13.9 Ordinary dividends – interim (122.1) (111.3) (122.1) (111.3) Ordinary dividends – final (162.4) (148.0) (162.4) (148.0)Retained earnings at end of the year 1,758.9 1,562.8 536.0 350.9
Share based payments reserveThe amount charged to the share based payments reserve each year represents the share based payments expense.
Cash flow hedging reserveThe amount in the cash flow hedging reserve represents the cumulative net change in the fair value of cash flow hedginginstruments related to hedged transactions that have not yet occurred.
Foreign currency translation reserveThe foreign currency translation reserve records the foreign currency differences arising from the translation of foreignoperations, the translation of transactions that hedge the Company’s net investment in a foreign operation or the translation of foreign currency monetary items forming part of the net investment in a foreign operation.
Equity reserve arising from purchase of minoritiesThe equity reserve represents the excess of cost of investment in purchasing minority interests in subsidiaries over the net assetsacquired and minority share of goodwill at the date of original acquisition of the subsidiary.
Consolidated Company
For
per
sona
l use
onl
y

Notes to the Financial Statements For the year ended 30 September
Orica Limited 82
2008 2007 2008 2007% % $m $m
23. Minority interests in controlled entitiesOrdinary share capital of controlled entities held byminority interests in: ACN 099 090 267 Pty Ltd (formerly Welvic Australia Pty Ltd) (1) - - - - Active Chemicals Chile S.A. (2) - - - - Altona Properties Pty Ltd 37.4 37.4 - - Ammonium Nitrate Development and Production Limited 0.1 0.1 - - Andean Mining & Chemicals Limited (2) - - - - ASA Organizacion Industrial S.A. De C.V. (2) - - - - Bamble Mekaniske Industri AS 40.0 40.0 0.3 0.3 Beijing Ruichy Minova Synthetic Material Company Limited (3) 45.0 45.0 1.5 1.2 Bronson & Jacobs International Co. Ltd 51.0 51.0 - - Deco-Pro China Limited (4) (6) - - - - CJSC (ZAO) Carbo-Zakk (3) (4) 6.3 12.5 0.1 0.1 Dyno NitroMed AD 40.0 40.0 2.6 2.6 Dyno Nobel Samex S.A. 49.5 49.5 4.1 4.1 Dyno Nobel VH Company LLC 49.0 49.0 0.8 0.2 Dyno Nobel (Zimbabwe) (Pty) Limited (6) - - - - Emirates Explosives L.L.C. (2) 35.0 35.0 2.1 2.1 Explosivos de Mexico SA de CV 1.3 1.3 - - GeoNitro Limited 40.0 40.0 0.3 0.3 Minova Ksante Sp. z o.o. (3) 30.0 30.0 0.6 0.6 Minova MineTek Private Limited (3) 24.0 24.0 0.2 0.2 Minova Ukraine (5) 10.0 - 0.3 - Nitro Asia Company Inc. 41.6 41.6 0.1 0.1 Northwest Energetic Services LLC (5) 48.7 - 1.8 - OOO Minova TPS (3) (4) 6.3 12.5 - - Orica Blast & Quarry Surveys Ltd (3) 25.0 25.0 0.6 0.6 Orica-CCM Energy Systems Sdn Bhd 45.0 45.0 0.6 0.6 Orica-GM Holdings Ltd 49.0 49.0 12.6 - Orica Chemicals Chile S.A. (2) - - - - Orica Chemicals Peru S.A.C. (2) - - - - Orica Colombia S.A. 8.0 8.0 - - Orica Eesti OU 35.0 35.0 2.6 2.6 Orica Kazakhstan Closed Joint Stock Company 23.0 23.0 2.2 2.2 Orica Nitrates Philippines 4.0 4.0 0.2 0.2 Orica Nitro Patlayici Maddeler Ticaret ve Sanayi Anonim Sirketi, A.S. 49.0 49.0 1.7 1.7 Orica Philippines Inc (2) 9.9 9.9 0.2 0.2 Orica (Weihai) Explosives Co Ltd 20.0 20.0 6.1 6.1 PT Kaltim Nitrate Indonesia 10.0 10.0 1.1 1.1 Sprengmittelvertrieb in Bayern GmbH 49.0 49.0 0.1 0.1 TOO "Minova Kasachstan" (3) 40.0 40.0 0.5 0.5 Teradoran Pty Ltd 33.0 33.0 - -
43.3 27.7 Minority interests in shareholders' equity at balance date is as follows: Contributed equity 43.3 27.7 Reserves 15.5 5.9 Retained earnings 38.1 27.3
96.9 60.9
(1) Liquidated during the year 2007.(2) Minority interests purchased during the year 2007.(3) Minority interests acquired through new acquisitions during the year 2007.(4) Minority interests purchased during the year 2008.(5) Minority interests acquired through new acquisitions during the year 2008.(6) Disposed of: Deco-Pro China Limited - 30 September 2008 and Dyno Nobel (Zimbabwe) (Pty) Limited - 30 September 2007.
Consolidated Consolidated
For
per
sona
l use
onl
y
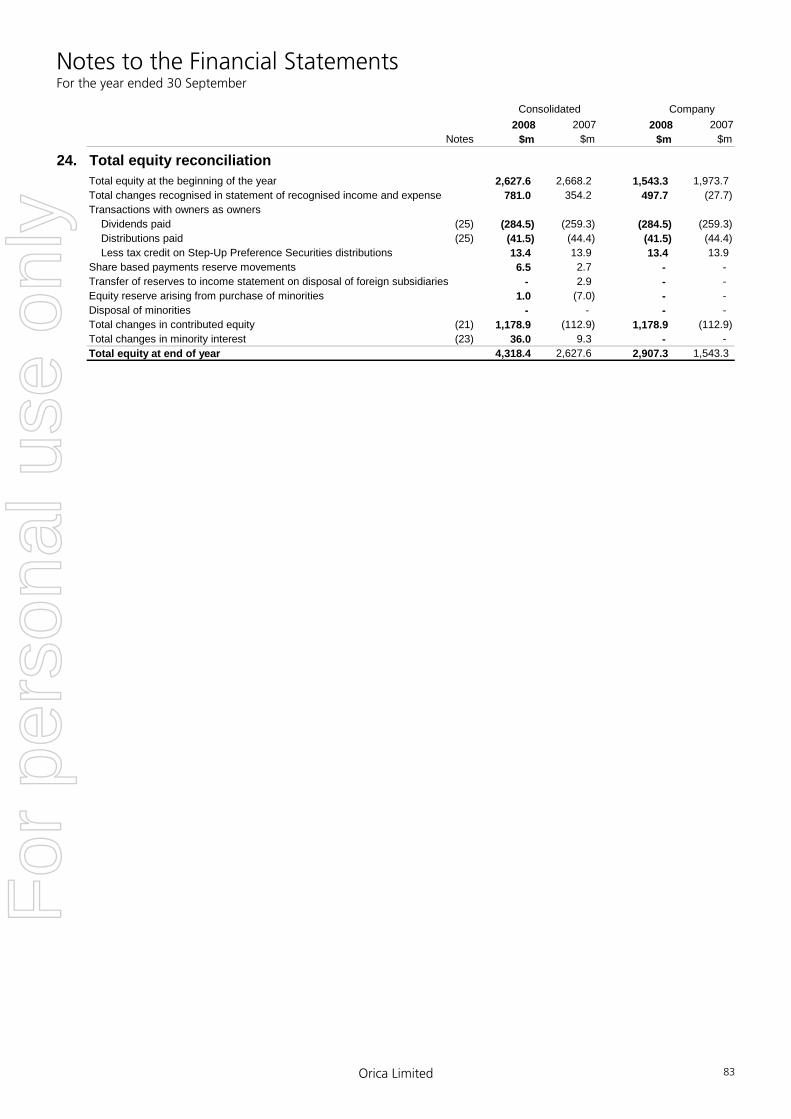
Notes to the Financial Statements For the year ended 30 September
Orica Limited 83
2008 2007 2008 2007Notes $m $m $m $m
24. Total equity reconciliationTotal equity at the beginning of the year 2,627.6 2,668.2 1,543.3 1,973.7Total changes recognised in statement of recognised income and expense 781.0 354.2 497.7 (27.7)Transactions with owners as owners Dividends paid (25) (284.5) (259.3) (284.5) (259.3) Distributions paid (25) (41.5) (44.4) (41.5) (44.4) Less tax credit on Step-Up Preference Securities distributions 13.4 13.9 13.4 13.9Share based payments reserve movements 6.5 2.7 - - Transfer of reserves to income statement on disposal of foreign subsidiaries - 2.9 - - Equity reserve arising from purchase of minorities 1.0 (7.0) - - Disposal of minorities - - - - Total changes in contributed equity (21) 1,178.9 (112.9) 1,178.9 (112.9)Total changes in minority interest (23) 36.0 9.3 - - Total equity at end of year 4,318.4 2,627.6 2,907.3 1,543.3
Consolidated Company
For
per
sona
l use
onl
y
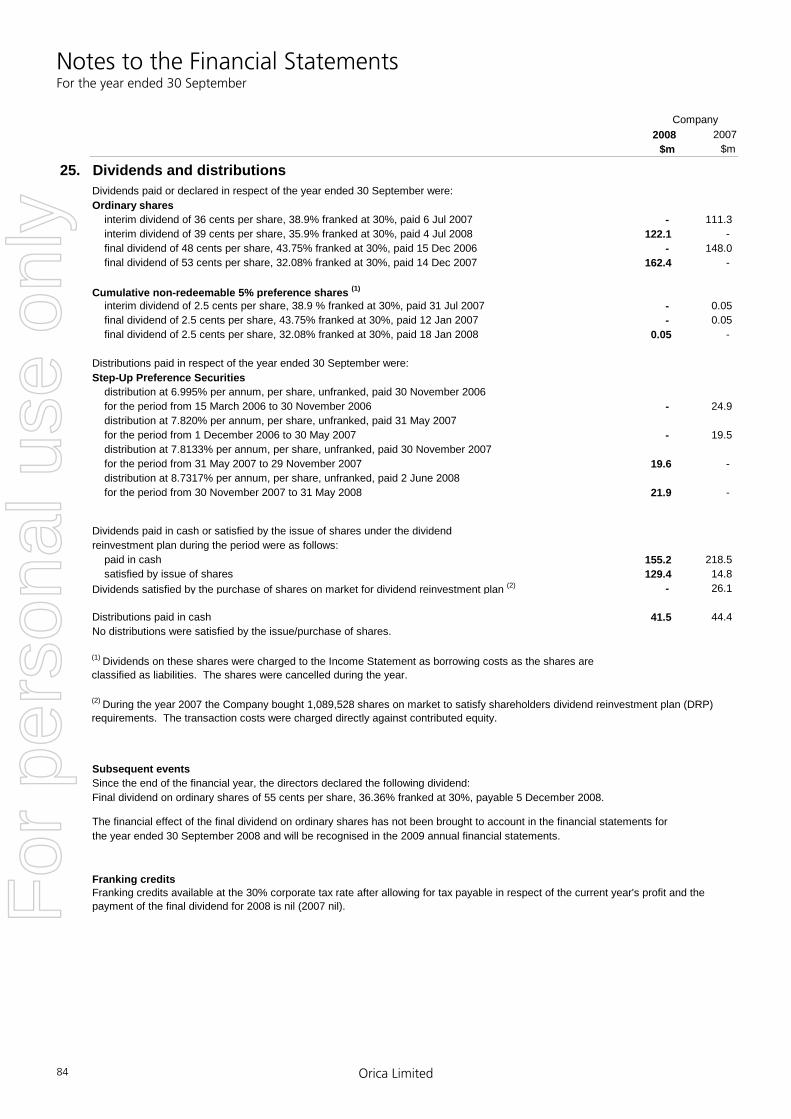
Notes to the Financial Statements For the year ended 30 September
Orica Limited 84
2008 2007 $m $m
25. Dividends and distributionsDividends paid or declared in respect of the year ended 30 September were:Ordinary shares interim dividend of 36 cents per share, 38.9% franked at 30%, paid 6 Jul 2007 - 111.3 interim dividend of 39 cents per share, 35.9% franked at 30%, paid 4 Jul 2008 122.1 - final dividend of 48 cents per share, 43.75% franked at 30%, paid 15 Dec 2006 - 148.0 final dividend of 53 cents per share, 32.08% franked at 30%, paid 14 Dec 2007 162.4 -
Cumulative non-redeemable 5% preference shares (1)
interim dividend of 2.5 cents per share, 38.9 % franked at 30%, paid 31 Jul 2007 - 0.05 final dividend of 2.5 cents per share, 43.75% franked at 30%, paid 12 Jan 2007 - 0.05 final dividend of 2.5 cents per share, 32.08% franked at 30%, paid 18 Jan 2008 0.05 -
Distributions paid in respect of the year ended 30 September were: Step-Up Preference Securities distribution at 6.995% per annum, per share, unfranked, paid 30 November 2006 for the period from 15 March 2006 to 30 November 2006 - 24.9 distribution at 7.820% per annum, per share, unfranked, paid 31 May 2007 for the period from 1 December 2006 to 30 May 2007 - 19.5 distribution at 7.8133% per annum, per share, unfranked, paid 30 November 2007 for the period from 31 May 2007 to 29 November 2007 19.6 - distribution at 8.7317% per annum, per share, unfranked, paid 2 June 2008 for the period from 30 November 2007 to 31 May 2008 21.9 -
Dividends paid in cash or satisfied by the issue of shares under the dividendreinvestment plan during the period were as follows: paid in cash 155.2 218.5 satisfied by issue of shares 129.4 14.8Dividends satisfied by the purchase of shares on market for dividend reinvestment plan (2) - 26.1
Distributions paid in cash 41.5 44.4No distributions were satisfied by the issue/purchase of shares.
Subsequent eventsSince the end of the financial year, the directors declared the following dividend:Final dividend on ordinary shares of 55 cents per share, 36.36% franked at 30%, payable 5 December 2008.
The financial effect of the final dividend on ordinary shares has not been brought to account in the financial statements forthe year ended 30 September 2008 and will be recognised in the 2009 annual financial statements.
Franking credits
(1) Dividends on these shares were charged to the Income Statement as borrowing costs as the shares are classified as liabilities. The shares were cancelled during the year.
Franking credits available at the 30% corporate tax rate after allowing for tax payable in respect of the current year's profit and the payment of the final dividend for 2008 is nil (2007 nil).
(2) During the year 2007 the Company bought 1,089,528 shares on market to satisfy shareholders dividend reinvestment plan (DRP) requirements. The transaction costs were charged directly against contributed equity.
Company
For
per
sona
l use
onl
y
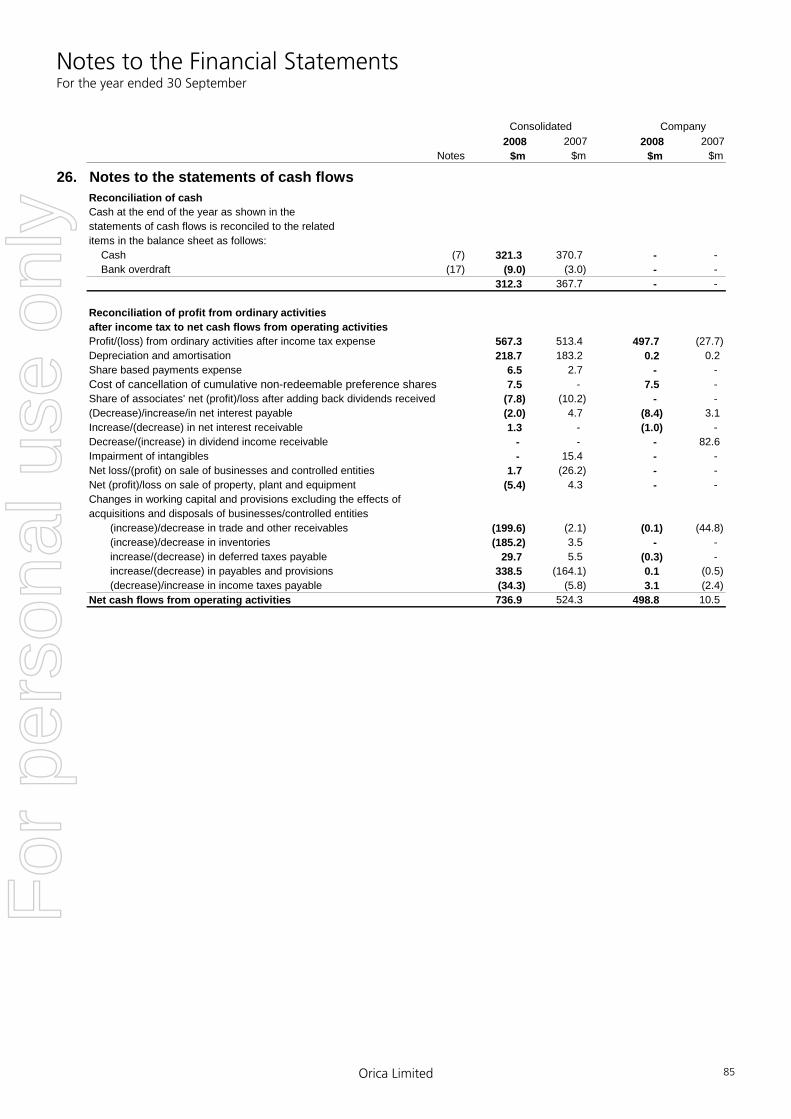
Notes to the Financial Statements For the year ended 30 September
Orica Limited 85
2008 2007 2008 2007Notes $m $m $m $m
26. Notes to the statements of cash flowsReconciliation of cashCash at the end of the year as shown in the statements of cash flows is reconciled to the relateditems in the balance sheet as follows: Cash (7) 321.3 370.7 - - Bank overdraft (17) (9.0) (3.0) - -
312.3 367.7 - -
Reconciliation of profit from ordinary activities after income tax to net cash flows from operating activitiesProfit/(loss) from ordinary activities after income tax expense 567.3 513.4 497.7 (27.7)Depreciation and amortisation 218.7 183.2 0.2 0.2Share based payments expense 6.5 2.7 - - Cost of cancellation of cumulative non-redeemable preference shares 7.5 - 7.5 - Share of associates' net (profit)/loss after adding back dividends received (7.8) (10.2) - - (Decrease)/increase/in net interest payable (2.0) 4.7 (8.4) 3.1Increase/(decrease) in net interest receivable 1.3 - (1.0) - Decrease/(increase) in dividend income receivable - - - 82.6Impairment of intangibles - 15.4 - - Net loss/(profit) on sale of businesses and controlled entities 1.7 (26.2) - - Net (profit)/loss on sale of property, plant and equipment (5.4) 4.3 - - Changes in working capital and provisions excluding the effects ofacquisitions and disposals of businesses/controlled entities (increase)/decrease in trade and other receivables (199.6) (2.1) (0.1) (44.8) (increase)/decrease in inventories (185.2) 3.5 - - increase/(decrease) in deferred taxes payable 29.7 5.5 (0.3) - increase/(decrease) in payables and provisions 338.5 (164.1) 0.1 (0.5) (decrease)/increase in income taxes payable (34.3) (5.8) 3.1 (2.4)Net cash flows from operating activities 736.9 524.3 498.8 10.5
Consolidated Company
For
per
sona
l use
onl
y
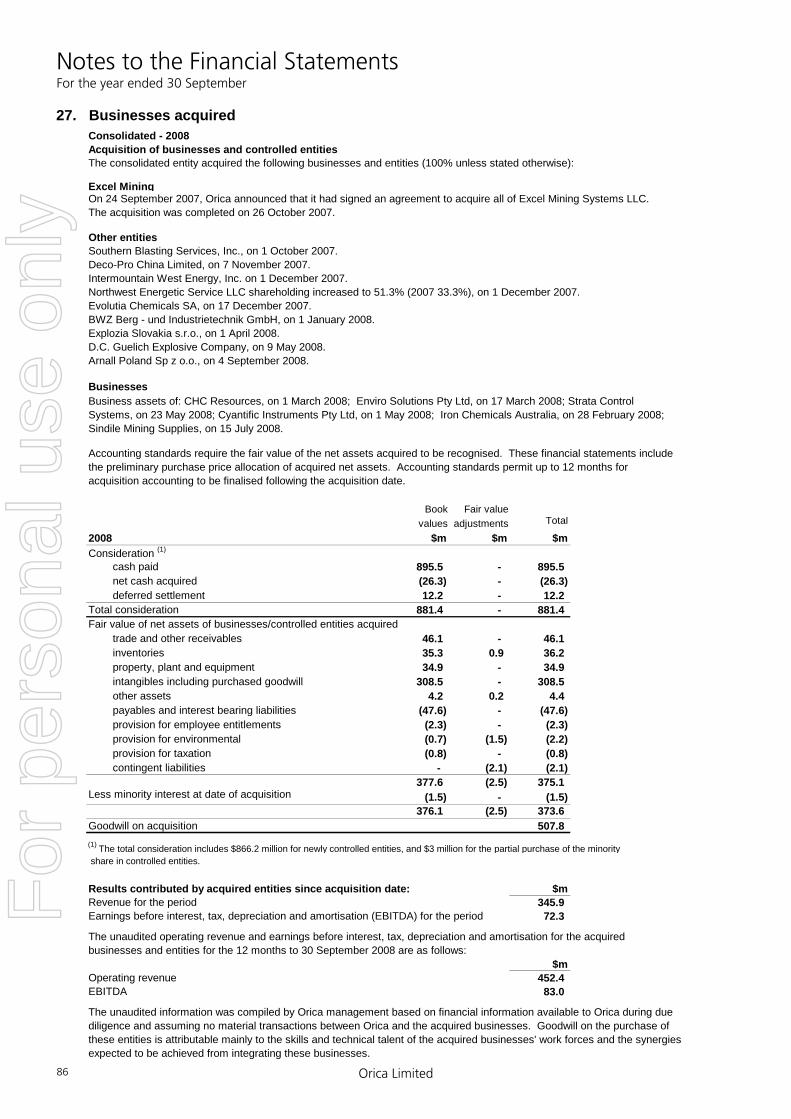
Notes to the Financial Statements For the year ended 30 September
Orica Limited 86
27. Businesses acquiredConsolidated - 2008Acquisition of businesses and controlled entitiesThe consolidated entity acquired the following businesses and entities (100% unless stated otherwise):
Excel MiningOn 24 September 2007, Orica announced that it had signed an agreement to acquire all of Excel Mining Systems LLC. The acquisition was completed on 26 October 2007.
Other entitiesSouthern Blasting Services, Inc., on 1 October 2007.Deco-Pro China Limited, on 7 November 2007.Intermountain West Energy, Inc. on 1 December 2007.Northwest Energetic Service LLC shareholding increased to 51.3% (2007 33.3%), on 1 December 2007.Evolutia Chemicals SA, on 17 December 2007.BWZ Berg - und Industrietechnik GmbH, on 1 January 2008. Explozia Slovakia s.r.o., on 1 April 2008. D.C. Guelich Explosive Company, on 9 May 2008.Arnall Poland Sp z o.o., on 4 September 2008.
BusinessesBusiness assets of: CHC Resources, on 1 March 2008; Enviro Solutions Pty Ltd, on 17 March 2008; Strata ControlSystems, on 23 May 2008; Cyantific Instruments Pty Ltd, on 1 May 2008; Iron Chemicals Australia, on 28 February 2008;Sindile Mining Supplies, on 15 July 2008.
Accounting standards require the fair value of the net assets acquired to be recognised. These financial statements includethe preliminary purchase price allocation of acquired net assets. Accounting standards permit up to 12 months foracquisition accounting to be finalised following the acquisition date.
Book Fair valuevalues adjustments Total
2008 $m $m $mConsideration (1)
cash paid 895.5 - 895.5 net cash acquired (26.3) - (26.3) deferred settlement 12.2 - 12.2Total consideration 881.4 - 881.4Fair value of net assets of businesses/controlled entities acquired trade and other receivables 46.1 - 46.1 inventories 35.3 0.9 36.2 property, plant and equipment 34.9 - 34.9 intangibles including purchased goodwill 308.5 - 308.5 other assets 4.2 0.2 4.4 payables and interest bearing liabilities (47.6) - (47.6) provision for employee entitlements (2.3) - (2.3) provision for environmental (0.7) (1.5) (2.2) provision for taxation (0.8) - (0.8) contingent liabilities - (2.1) (2.1)
377.6 (2.5) 375.1Less minority interest at date of acquisition (1.5) - (1.5)
376.1 (2.5) 373.6Goodwill on acquisition 507.8(1) The total consideration includes $866.2 million for newly controlled entities, and $3 million for the partial purchase of the minority share in controlled entities.
Results contributed by acquired entities since acquisition date: $mRevenue for the period 345.9Earnings before interest, tax, depreciation and amortisation (EBITDA) for the period 72.3
The unaudited operating revenue and earnings before interest, tax, depreciation and amortisation for the acquiredbusinesses and entities for the 12 months to 30 September 2008 are as follows:
$mOperating revenue 452.4EBITDA 83.0
The unaudited information was compiled by Orica management based on financial information available to Orica during due diligence and assuming no material transactions between Orica and the acquired businesses. Goodwill on the purchase ofthese entities is attributable mainly to the skills and technical talent of the acquired businesses' work forces and the synergies expected to be achieved from integrating these businesses.
For
per
sona
l use
onl
y
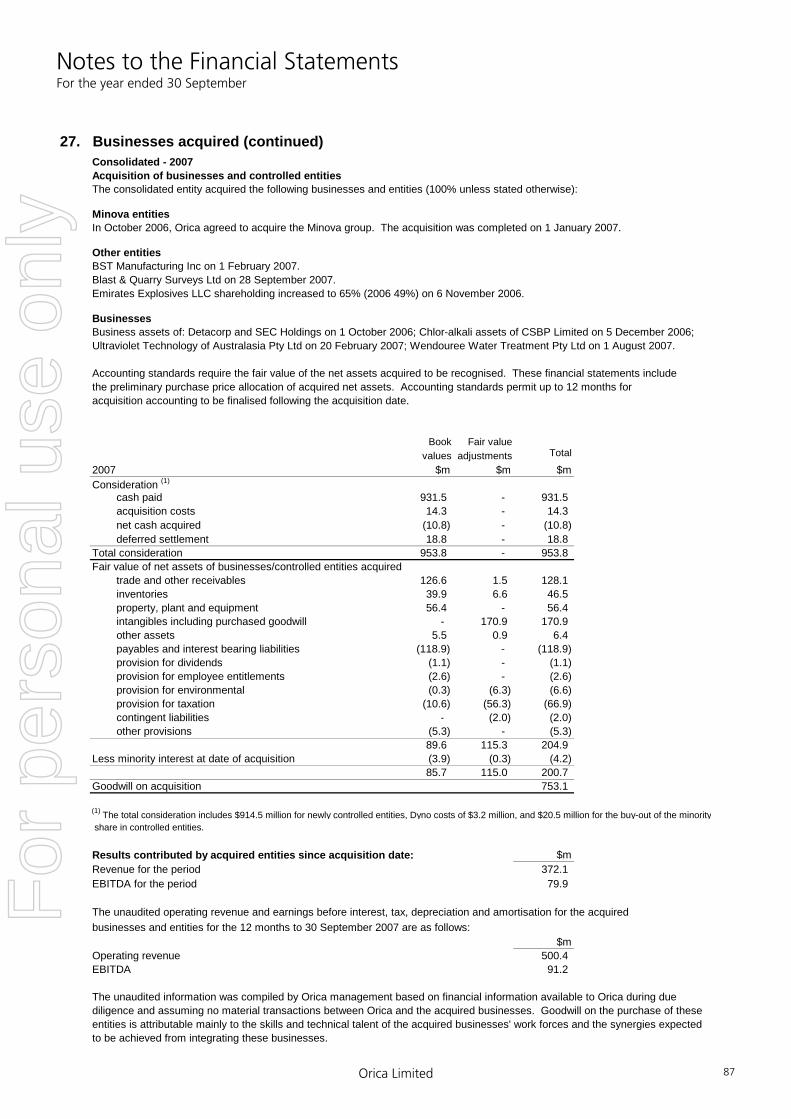
Notes to the Financial Statements For the year ended 30 September
Orica Limited 87
27. Businesses acquired (continued)Consolidated - 2007Acquisition of businesses and controlled entitiesThe consolidated entity acquired the following businesses and entities (100% unless stated otherwise):
Minova entitiesIn October 2006, Orica agreed to acquire the Minova group. The acquisition was completed on 1 January 2007.
Other entitiesBST Manufacturing Inc on 1 February 2007.Blast & Quarry Surveys Ltd on 28 September 2007.Emirates Explosives LLC shareholding increased to 65% (2006 49%) on 6 November 2006.
BusinessesBusiness assets of: Detacorp and SEC Holdings on 1 October 2006; Chlor-alkali assets of CSBP Limited on 5 December 2006;Ultraviolet Technology of Australasia Pty Ltd on 20 February 2007; Wendouree Water Treatment Pty Ltd on 1 August 2007.
Accounting standards require the fair value of the net assets acquired to be recognised. These financial statements includethe preliminary purchase price allocation of acquired net assets. Accounting standards permit up to 12 months foracquisition accounting to be finalised following the acquisition date.
Book Fair valuevalues adjustments Total
2007 $m $m $mConsideration (1)
cash paid 931.5 - 931.5 acquisition costs 14.3 - 14.3 net cash acquired (10.8) - (10.8) deferred settlement 18.8 - 18.8Total consideration 953.8 - 953.8Fair value of net assets of businesses/controlled entities acquired trade and other receivables 126.6 1.5 128.1 inventories 39.9 6.6 46.5 property, plant and equipment 56.4 - 56.4 intangibles including purchased goodwill - 170.9 170.9 other assets 5.5 0.9 6.4 payables and interest bearing liabilities (118.9) - (118.9) provision for dividends (1.1) - (1.1) provision for employee entitlements (2.6) - (2.6) provision for environmental (0.3) (6.3) (6.6) provision for taxation (10.6) (56.3) (66.9) contingent liabilities - (2.0) (2.0) other provisions (5.3) - (5.3)
89.6 115.3 204.9Less minority interest at date of acquisition (3.9) (0.3) (4.2)
85.7 115.0 200.7Goodwill on acquisition 753.1
(1) The total consideration includes $914.5 million for newly controlled entities, Dyno costs of $3.2 million, and $20.5 million for the buy-out of the minority share in controlled entities.
Results contributed by acquired entities since acquisition date: $mRevenue for the period 372.1EBITDA for the period 79.9
The unaudited operating revenue and earnings before interest, tax, depreciation and amortisation for the acquiredbusinesses and entities for the 12 months to 30 September 2007 are as follows:
$mOperating revenue 500.4EBITDA 91.2
The unaudited information was compiled by Orica management based on financial information available to Orica during due diligence and assuming no material transactions between Orica and the acquired businesses. Goodwill on the purchase of these entities is attributable mainly to the skills and technical talent of the acquired businesses' work forces and the synergies expected to be achieved from integrating these businesses.
For
per
sona
l use
onl
y

Notes to the Financial Statements For the year ended 30 September
Orica Limited 88
28. Businesses disposed Disposal of businesses/controlled entitiesThe following businesses and controlled entities were disposed of:2008:On 23 October 2007, Essential Oils of Tasmania business in Australia.On 30 September 2008, Orica decided to dissolve Deco-Pro China Limited.
2007:On 31 October 2006, Welvic PVC business in Australia.On 1 December 2006, B&J Perlite and Vermiculite business in Australia.On 8 December 2006, Adhesives and Resins business in Indonesia.On 31 January 2007, Adhesives and Resins business assets in Australia and New Zealand.On 9 February 2007, Bridestowe lavender farm in Australia.On 30 June 2007, High Energy Materials business in Norway.
2008 2007$m $m
Consideration cash received 5.9 97.8 disposal costs - (9.0)Inflow of cash 5.9 88.8 deferred settlement - 2.7Net consideration 5.9 91.5Carrying value of net assets of businesses/controlled entities disposed trade and other receivables 11.5 21.4 inventories 1.4 17.3 property, plant and equipment 0.5 40.2 intangibles 0.7 - other assets - 2.5 investment - 4.3 payables and interest bearing liabilities (0.3) (14.8) provision for employee entitlements - (5.7) provision for income tax (0.1) 0.1
13.7 65.3Less minority interests at date of disposal (6.1) -
7.6 65.3(Loss)/profit on sale of business/controlled entities (1.7) 26.2
Consolidated
For
per
sona
l use
onl
y
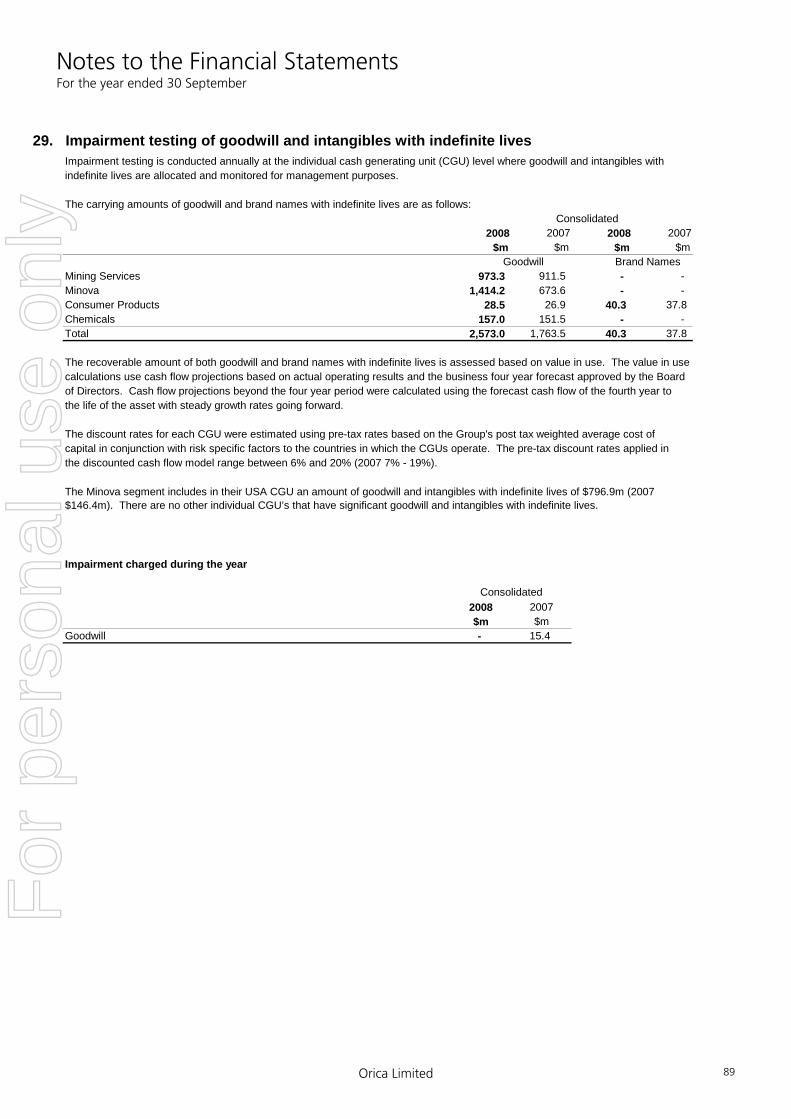
Notes to the Financial Statements For the year ended 30 September
Orica Limited 89
29. Impairment testing of goodwill and intangibles with indefinite livesImpairment testing is conducted annually at the individual cash generating unit (CGU) level where goodwill and intangibles withindefinite lives are allocated and monitored for management purposes.
The carrying amounts of goodwill and brand names with indefinite lives are as follows: Consolidated
2008 2007 2008 2007$m $m $m $m
Goodwill Brand NamesMining Services 973.3 911.5 - - Minova 1,414.2 673.6 - - Consumer Products 28.5 26.9 40.3 37.8Chemicals 157.0 151.5 - - Total 2,573.0 1,763.5 40.3 37.8
The recoverable amount of both goodwill and brand names with indefinite lives is assessed based on value in use. The value in use calculations use cash flow projections based on actual operating results and the business four year forecast approved by the Board of Directors. Cash flow projections beyond the four year period were calculated using the forecast cash flow of the fourth year tothe life of the asset with steady growth rates going forward.
The discount rates for each CGU were estimated using pre-tax rates based on the Group's post tax weighted average cost of capital in conjunction with risk specific factors to the countries in which the CGUs operate. The pre-tax discount rates applied in the discounted cash flow model range between 6% and 20% (2007 7% - 19%).
Impairment charged during the year
2008 2007$m $m
Goodwill - 15.4
Consolidated
The Minova segment includes in their USA CGU an amount of goodwill and intangibles with indefinite lives of $796.9m (2007 $146.4m). There are no other individual CGU’s that have significant goodwill and intangibles with indefinite lives.
For
per
sona
l use
onl
y

Notes to the Financial Statements For the year ended 30 September
Orica Limited 90
2008 2007 2008 2007$m $m $m $m
30. CommitmentsCapital expenditure commitmentsCapital expenditure on property, plant and equipment andbusiness acquisitions contracted but not provided for and payable: no later than one year 140.9 82.5 - -
140.9 82.5 - -
Lease commitmentsLease expenditure contracted for at balance date but notrecognised in the financial statements and payable: no later than one year 76.4 73.7 - - later than one, no later than five years 125.0 112.9 - - later than five years 38.9 28.3 - -
240.3 214.9 - -
Representing: cancellable operating leases 101.4 86.6 - - non-cancellable operating leases 138.9 128.3 - -
240.3 214.9 - -
Non-cancellable operating lease commitmentspayable: no later than one year 37.3 43.9 - - later than one, no later than five years 68.7 63.3 - - later than five years 32.9 21.1 - -
138.9 128.3 - -
Finance lease commitments payable: no later than one year 5.3 0.3 - - later than one, no later than five years 17.0 0.5 - -
22.3 0.8 - - Less future finance charges (4.5) - - - Present value of minimum lease payments provided for as a liability 17.8 0.8 - -
Representing lease liabilities: (see note 17) current 5.3 0.3 - - non-current 12.5 0.5 - -
17.8 0.8 - -
CompanyConsolidated
For
per
sona
l use
onl
y
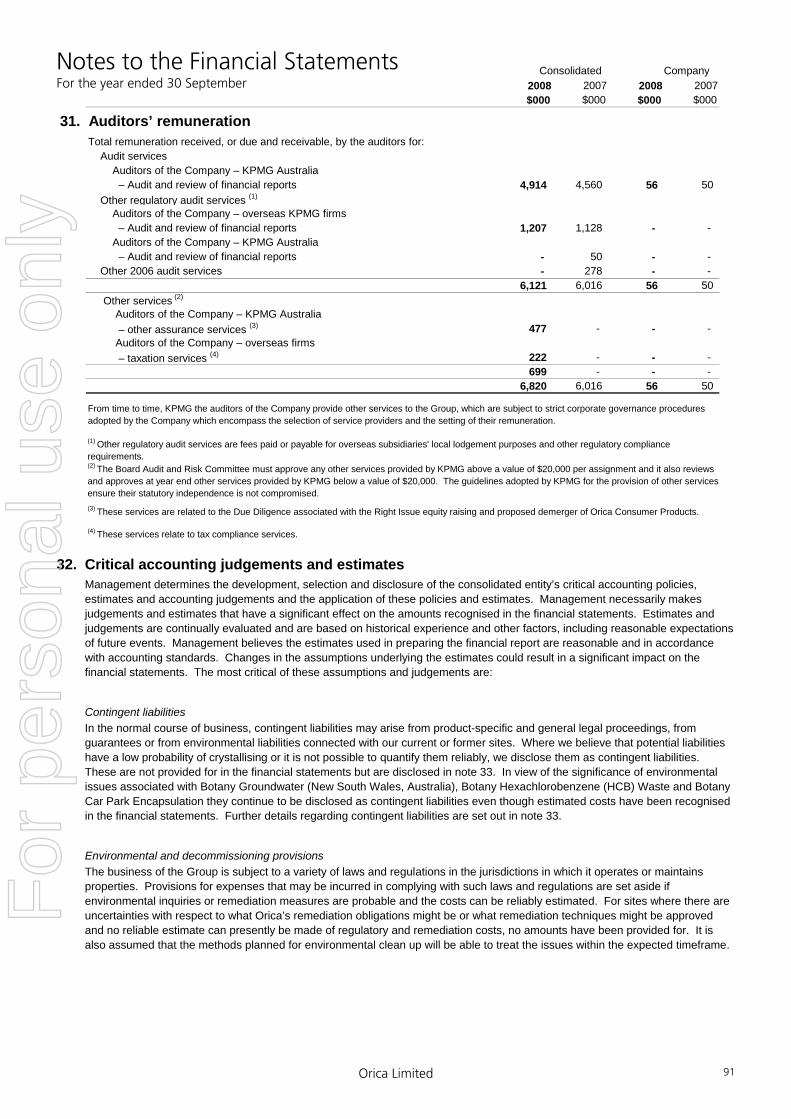
Notes to the Financial Statements For the year ended 30 September
Orica Limited 91
32. Critical accounting judgements and estimates Management determines the development, selection and disclosure of the consolidated entity’s critical accounting policies, estimates and accounting judgements and the application of these policies and estimates. Management necessarily makes judgements and estimates that have a significant effect on the amounts recognised in the financial statements. Estimates and judgements are continually evaluated and are based on historical experience and other factors, including reasonable expectations of future events. Management believes the estimates used in preparing the financial report are reasonable and in accordance with accounting standards. Changes in the assumptions underlying the estimates could result in a significant impact on the financial statements. The most critical of these assumptions and judgements are:
Contingent liabilities In the normal course of business, contingent liabilities may arise from product-specific and general legal proceedings, from guarantees or from environmental liabilities connected with our current or former sites. Where we believe that potential liabilities have a low probability of crystallising or it is not possible to quantify them reliably, we disclose them as contingent liabilities. These are not provided for in the financial statements but are disclosed in note 33. In view of the significance of environmental issues associated with Botany Groundwater (New South Wales, Australia), Botany Hexachlorobenzene (HCB) Waste and Botany Car Park Encapsulation they continue to be disclosed as contingent liabilities even though estimated costs have been recognised in the financial statements. Further details regarding contingent liabilities are set out in note 33.
Environmental and decommissioning provisions The business of the Group is subject to a variety of laws and regulations in the jurisdictions in which it operates or maintains properties. Provisions for expenses that may be incurred in complying with such laws and regulations are set aside if environmental inquiries or remediation measures are probable and the costs can be reliably estimated. For sites where there are uncertainties with respect to what Orica’s remediation obligations might be or what remediation techniques might be approved and no reliable estimate can presently be made of regulatory and remediation costs, no amounts have been provided for. It is also assumed that the methods planned for environmental clean up will be able to treat the issues within the expected timeframe.
2008 2007 2008 2007$000 $000 $000 $000
31. Auditors’ remunerationTotal remuneration received, or due and receivable, by the auditors for: Audit services Auditors of the Company – KPMG Australia – Audit and review of financial reports 4,914 4,560 56 50 Other regulatory audit services (1)
Auditors of the Company – overseas KPMG firms – Audit and review of financial reports 1,207 1,128 - - Auditors of the Company – KPMG Australia – Audit and review of financial reports - 50 - - Other 2006 audit services - 278 - -
6,121 6,016 56 50 Other services (2)
Auditors of the Company – KPMG Australia – other assurance services (3) 477 - - - Auditors of the Company – overseas firms – taxation services (4) 222 - - -
699 - - - 6,820 6,016 56 50
(1) Other regulatory audit services are fees paid or payable for overseas subsidiaries' local lodgement purposes and other regulatory compliance requirements.
(4) These services relate to tax compliance services.
(2) The Board Audit and Risk Committee must approve any other services provided by KPMG above a value of $20,000 per assignment and it also reviews and approves at year end other services provided by KPMG below a value of $20,000. The guidelines adopted by KPMG for the provision of other services ensure their statutory independence is not compromised. (3) These services are related to the Due Diligence associated with the Right Issue equity raising and proposed demerger of Orica Consumer Products.
Consolidated Company
From time to time, KPMG the auditors of the Company provide other services to the Group, which are subject to strict corporate governance procedures adopted by the Company which encompass the selection of service providers and the setting of their remuneration.
For
per
sona
l use
onl
y

Notes to the Financial Statements For the year ended 30 September
Orica Limited 92
32. Critical accounting judgements and estimates (continued) With regard to the HCB Waste clean up, it is assumed that a licence to export waste for destruction overseas will be obtained. German authorities have rejected Orica’s application to import the waste into Germany for treatment. Orica has lodged objections against these rejections. It is difficult to estimate the future costs of environmental remediation because of many uncertainties, particularly with regard to the status of laws, regulations and the information available about conditions in the various countries and at the individual sites. Significant factors in estimating the costs include previous experiences in similar cases, expert opinions regarding environmental programs, current costs and new developments affecting costs, management’s interpretation of current environmental laws and regulations, the number and financial position of third parties that may become obligated to participate in any remediation costs on the basis of joint liability, and the remediation methods which are likely to be deployed. Environmental costs are estimated using either the work of external consultants and/or internal experts. Changes in the assumptions underlying these estimated costs could impact future reported results. Subject to these factors, but taking into consideration experience gained to date regarding environmental matters of a similar nature, Orica believes the provisions to be appropriate based upon currently available information. However, given the inherent difficulties in estimating liabilities in this area, it cannot be guaranteed that additional costs will not be incurred beyond the amounts provided. It is possible that final resolution of these matters may require expenditures to be made in excess of established provisions over an extended period of time that may result in changes in timing of anticipated cash flows from those assumed and in a range of amounts that cannot be reasonably estimated. In respect to the Botany Groundwater contamination, a provision was established in 2004 to cover the estimated costs associated with remediation until 2014. Costs are expected to be incurred after this date, but it is not possible to predict the timeframe over which remediation will be required or the form the remediation will take and therefore it is not possible to reliably estimate any associated costs. The discount rate used for environmental provisioning is Orica’s weighted average cost of capital and this may vary from year to year.
Legal proceedings The outcome of currently pending and future proceedings cannot be predicted with certainty. Thus, an adverse decision in a lawsuit could result in additional costs that are not covered, either wholly or partially, under insurance policies and that could significantly impact the business and results of operations of the Group. Litigation and other judicial proceedings as a rule raise difficult and complex legal issues and are subject to many uncertainties and complexities including, but not limited to, the facts and circumstances of each particular case, issues regarding the jurisdiction in which each suit is brought and differences in applicable law. Upon resolution of any pending legal matter, the Group may be forced to incur charges in excess of the presently established provisions and related insurance coverage. It is possible that the financial position, results of operations or cash flows of the Group could be materially affected by the unfavourable outcome of litigation. Litigation and administrative proceedings are evaluated on a case-by-case basis considering the available information, including that from legal counsel, to assess potential outcomes. Where it is considered probable that a future obligation will result in an outflow of resources, a provision is recorded in the amount of the present value of the expected cash outflows if these are deemed to be reliably measurable. In the course of acquisitions and disposals of businesses and assets, Orica routinely negotiates warranties and indemnities across a range of commercial issues and risks, including environmental risks associated with real property. Management uses the information available and exercises judgement in the overall context of these transactions, in determining the scope and extent of these warranties and indemnities. In assessing Orica’s financial position, management relies on warranties and indemnities received, and considers potential exposures on warranties and indemnities provided. It is possible that the financial position, results of operations and cash flows of the Group could be materially affected if circumstances arise where warranties and indemnities received are not honoured, or for those provided, circumstances change adversely.
Defined benefit superannuation fund obligations The expected costs of providing post-retirement benefits under defined benefit arrangements relating to employee service during the period are charged to the income statement. Any actuarial gains and losses, which can arise from differences between expected and actual outcomes or changes in actuarial assumptions, are recognised immediately in the consolidated statement of recognised income and expense. In all cases, the pension costs are assessed in accordance with the advice of independent qualified actuaries but require the exercise of significant judgement in relation to assumptions for future salary and pension increases, long term price inflation and investment returns. While management believes the assumptions used are appropriate, a change in the assumptions used would impact the earnings of the Group (refer note 38).
Property, plant and equipment and definite life intangible assets The Group’s property, plant and equipment and intangible assets, other than indefinite life intangible assets, are depreciated/amortised on a straight line basis over their useful economic lives. Management reviews the appropriateness of useful economic lives of assets at least annually but any changes to useful economic lives could affect prospective depreciation rates and asset carrying values.
For
per
sona
l use
onl
y

Notes to the Financial Statements For the year ended 30 September
Orica Limited 93
32. Critical accounting judgements and estimates (continued) Financial instruments at fair value The Group measures a number of financial instruments at fair value. These fair values are based on observable market data which is used to estimate future cash flows and discount them to present value. Management's aim is to use and source this data consistently from period to period. While management believes these assumptions used are appropriate, a change in assumptions would impact the fair value calculations.
Impairment of assets The Group reviews the carrying amounts of its tangible and intangible assets to determine whether there is any indication that those assets are impaired. In making the assessment for impairment, assets that do not generate independent cash flows are allocated to an appropriate cash generating unit (CGU). The recoverable amount of those assets, or CGUs, is measured as the higher of their fair value less costs to sell and value in use. Management necessarily applies its judgement in allocating assets that do not generate independent cash flows to appropriate CGUs. The determination of value in use requires the estimation and discounting of future cashflows. The estimation of the cashflows considers all the information available at balance date which may deviate from actual developments. This includes, among other things, expected revenue from sales of products, the return on assets, future costs and discount rates. Subsequent changes to the CGU allocation or to the timing and quantum of cash flows could impact the carrying value of the respective assets. The carrying value of the Botany Groundwater Treatment Plant is based on the assumption that sufficient groundwater can be sourced and treated. It also assumes that treated water from the plant will be of sufficient quality for sale to industrial customers for prices based on those currently charged by Sydney Water. While some sales are already being made, ongoing testing of water quality is required to meet the needs of some customers and there is no guarantee that the outcome of this testing will be successful. Should the testing ultimately not prove successful, or sufficient groundwater not be available, an impairment expense may arise which would have an adverse impact on earnings. The carrying value of the Groundwater Treatment Plant included in property, plant and equipment at 30 September 2008 is $62.9 million.
Current asset provisions In the course of normal trading activities, management uses its judgement in establishing the net realisable value of various elements of working capital – principally inventory and accounts receivable. Provisions are established for obsolete or slow moving inventories, bad or doubtful receivables and product warranties. Actual expenses in future periods may be different from the provisions established and any such differences would affect future earnings of the Group.
Taxation The Group is subject to income taxes in Australia and jurisdictions where it has foreign operations. Significant judgement is required in determining the worldwide provision for income taxes. There are many transactions and calculations undertaken during the ordinary course of business for which the ultimate tax determination is uncertain. The Group recognises liabilities for anticipated tax audit issues based on estimates of whether additional taxes will be due. Where the final tax outcome of these matters is different from the amounts that were initially recorded, such differences will impact the current and deferred tax provision in the period in which such determination is made. In addition, deferred tax assets are recognised for deductible temporary differences and unused tax losses only if it is probable that future taxable profits are available to utilise those temporary differences and losses, and the tax losses continue to be available having regard to the nature and timing of their origination and compliance with the relevant tax legislation associated with their recoupment. Assumptions are also made about the application of income tax legislation. These assumptions are subject to risk and uncertainty and there is a possibility that changes in circumstances will alter expectations which may impact the amount of deferred tax assets and deferred tax liabilities recorded on the Balance Sheet and the amount of tax losses and timing differences not yet recognised. In these circumstances, the carrying amount of deferred tax assets and liabilities may change, resulting in an impact on the earnings of the Group.
33. Contingent liabilities and contingent assets Environmental
(i) General A number of sites within the Group have been identified as requiring environmental remediation or review. Appropriate implementation of remediation actions to meet Orica’s obligations for these sites is continuing. In accordance with the current accounting policy, provisions have been created for all known environmental liabilities that can be reliably estimated. For sites where the requirements have been assessed and are capable of reliable measurement, estimated regulatory and remediation costs have been capitalised, expensed as incurred or provided for. For environmental matters where there are significant uncertainties with respect to Orica’s remediation obligations or the remediation techniques that might be approved, no reliable estimate can presently be made of regulatory and remediation costs. Any costs are expensed as incurred.
For
per
sona
l use
onl
y

Notes to the Financial Statements For the year ended 30 September
Orica Limited 94
33. Contingent liabilities and contingent assets (continued) There can be no assurance that new information or regulatory requirements with respect to known sites or the identification of new remedial obligations at other sites will not require additional future provisions for environmental remediation and such provisions could be material. Orica has entered into arrangements with the relevant regulatory authorities for a number of sites to investigate possible land and groundwater contamination and, where appropriate, undertake voluntary remediation activities on these sites. Where reliable estimates are possible and remediation techniques have been identified for these sites, provisions have been established in accordance with the current accounting policy.
(ii) Significant environmental matters which are in progress at the date of this report are as follows: Botany Groundwater (New South Wales, Australia) Orica is continuing to conduct extensive remediation activities, including the operation of a Groundwater Treatment Plant, to treat the groundwater at Botany, which is contaminated with pollutants from historical operations. The Groundwater Treatment Plant has been commissioned and a portion of the treated water is sold by Orica to other corporations to replace town drinking water in industrial uses. Testing of the quality of the recycled water is ongoing. Orica is also investigating suitable remediation options for Dense Non-Aqueous Phase Liquid (DNAPL) source areas. No provision has been established for remediation activities in respect of DNAPL as a reliable estimate is not possible at this stage. Orica has received preliminary results indicating elevated concentrations of mercury in soil and groundwater at the southern end of the Botany site and at adjacent offsite locations. An environmental consultant has been commissioned to assess and report on these concentrations of mercury. No provision has been established for remediation activities in respect of this matter as the extent of contamination is unknown. Botany Hexachlorobenzene (HCB) Waste Clean Up (New South Wales, Australia) In August 2006, Orica submitted its application for export approval of HCB waste to the Federal Government. In its application, Orica sought permission to export the HCB waste for final destruction at high temperature incinerators in Germany. In May 2007, the Federal Government issued a duly motivated statement of fact that Australia does not have the technical capability to treat Orica’s HCB waste. In June 2007, German authorities rejected Orica’s application to import the HCB waste into Germany. Orica has lodged objections against these rejections. In the event that Orica does not obtain the necessary regulatory approvals to export the waste overseas for destruction, it will continue to ensure the safe storage of the HCB waste at Botany. Orica provided for the estimated costs associated with export and treatment of the waste in 2006 (refer note 19). Botany Car Park Waste Encapsulation (New South Wales, Australia) Soil and ash contaminated with low level chlorinated materials (including hexachlorobutadiene and HCB) are stored in an approved and licensed encapsulation on the Botany site, known as the Car Park Waste Encapsulation. Orica has investigated technologies that may be suitable to treat this material and has evaluated conventional destruction methods and has determined that direct thermal treatment of this waste is the preferred treatment technology. As required under the Botany site environmental licence conditions, Orica has submitted an application for planning approval of the proposed remediation. Orica has provided for estimated costs of treatment of the soil using thermal desorption technology (refer note 19). Taxation
(i) Tax investigations and audits Consistent with other companies of the size and diversity of Orica, the Group is the subject of periodic information requests, investigations and audit activities by the Australian Taxation Office (“ATO”) and tax authorities in other jurisdictions in which Orica operates.
(ii) Brazilian Tax Action The Brazilian Taxation authority is claiming unpaid taxes relating to the 1997 financial year of approximately $25 million. ICI Plc, the vendor of the business to Orica, has been notified to preserve Orica's rights under the tax indemnity obtained upon acquisition of the business. The Brazilian Taxation authority has been granted security over the Lorena site in relation to these matters.
(iii) Tax Audit – 1998 Sale of Pharmaceuticals Business On 13 October 2004, Orica Limited received a notice of amended assessment from the ATO for $210.3 million (primary tax of $95.3 million, penalties of $23.8 million and interest of $91.2 million). The amended assessment relates to the sale of the pharmaceuticals business to Zeneca in September 1998. On 9 November 2004, Orica lodged an objection against the amended assessment. On 10 March 2005, the ATO disallowed the objection and, in March 2005, Orica applied to have the matter dealt with by the Federal Court. After due consideration, the directors are of the opinion the ATO’s case has no merit and accordingly no liability is recognised. In accordance with the ATO administrative practice, Orica has paid 50% of the amended assessment, which has been recognised as a non-current receivable. On 28 March 2006, the ATO advised Orica of an error with the interest calculation in relation to the amended assessment, reducing the interest component by $10.2 million. On the basis of the 50% arrangement, Orica Limited received a refund of $5.1 million from the ATO.
For
per
sona
l use
onl
y
Notes to the Financial Statements For the year ended 30 September
Orica Limited 95
33. Contingent liabilities and contingent assets (continued) The ATO has indicated that if it is unsuccessful in defending the amended assessment against Orica, it may consider issuing an amended assessment for a similar amount to Orica Australia Pty Ltd in respect of the same transaction. The ATO considers that it is not in a position to decide if the second assessment should be issued until the outcome of the dispute with Orica Limited is known. Orica would also contest this matter. Guarantees, indemnities and warranties • The consolidated entity has entered into various long term supply contracts. For some contracts, minimum charges are
payable regardless of the level of operations, but in all cases the levels of operations are expected to remain above those that would trigger minimum payments.
• There are a number of legal claims and exposures which arise from the ordinary course of business. There is significant uncertainty as to whether a future liability will arise in respect of these items. The amount of liability, if any, which may arise cannot be reliably measured at this time.
• The consolidated entity has entered into various sales contracts where minimum savings are guaranteed to customers and such savings are expected to be achieved in the ordinary course of business.
• There are guarantees relating to certain leases of property, plant and equipment and other agreements arising in the ordinary course of business.
• Contracts of sale covering companies and assets which were divested during the current and prior years include commercial warranties and indemnities to the purchasers.
The Company Under the terms of a Deed of Cross Guarantee entered into in accordance with the ASIC Class Order 98/1418 dated 13 August 1998 (as amended), each company which is a party to the Deed has covenanted with the Trustee of the Deed to guarantee the payment of any debts of the other companies which are party to the Deed which might arise on the winding up of those companies. The closed group of entities which are party to the Deed are disclosed in note 39. A consolidated balance sheet and income statement for this closed group is shown in note 40.
34. Financial and capital management Capital management Orica’s objectives when managing capital (net debt and shareholders equity) are to safeguard the consolidated entity’s ability to continue as a going concern and to ensure that the capital structure enhances, protects and balances financial flexibility against minimising the cost of capital. In order to maintain the appropriate capital structure, the consolidated entity may adjust the amount of dividends paid to shareholders, utilise a dividend reinvestment plan, return capital to shareholders or issue new equity, in addition to incurring an appropriate mix of long and short term borrowings. Currently, Orica’s dividend policy is to pay a progressive dividend and accordingly to increase its declared dividend per share each year. Orica monitors capital on the basis of the accounting gearing ratio (which is calculated as net debt divided by net debt plus shareholders equity) and an adjusted gearing ratio (which is calculated by notionally reclassifying $250m of the $500m Orica Step-Up Preference Securities (SPS) from equity to debt). In addition, Orica monitors various other credit metrics, principally an interest cover ratio (EBIT divided by net financing costs) and funds from operations (FFO) divided by total debt measure. The target level for adjusted gearing is 35% to 45% and for interest cover is 5 times or greater. These, together with an appropriate FFO/total debt measure, are targeted to maintain a strong investment grade credit profile, which should facilitate access to borrowings from a diverse range of sources. Ratios may move outside of these target ranges for relatively short periods of time after major acquisitions or other significant transactions, such as the Rights Issue during 2008. The gearing level and interest cover are also monitored to ensure an adequate buffer against covenant levels under various facilities.
For
per
sona
l use
onl
y
Notes to the Financial Statements For the year ended 30 September
Orica Limited 96
34. Financial and capital management (continued)
The consolidated entity self-insures for certain insurance risks and under the Australian General Insurance Reform Act 2001 and related Prudential Standards, all authorised general insurers, including Curasalus Insurance Pty Ltd (the Orica self-insurance company) are required to maintain a minimum capital ratio ("MCR") of 120% as calculated by the Australian Prudential Regulation Authority (APRA). The MCR of Curasalus Insurance was in excess of 120% in both 2008 and 2007. Consistent with the consolidated entity’s policy a Rights Issue was undertaken during the year.
Financial risk factors The consolidated entity and the Company’s principal financial risks are associated with foreign exchange, interest rate, liquidity and credit risk. The consolidated entity and the Company’s overall risk management program seeks to mitigate these risks and reduce volatility of Orica’s financial performance. Financial risk management is carried out centrally by the Treasury department under policies approved by the Board of Directors. The Board provides written principles for overall risk management and policies covering specific areas, such as foreign exchange, interest rate and credit risk as well as the use of derivative and non-derivative financial instruments and the investment of excess liquidity. Orica enters into derivative instruments for risk management purposes only. Derivative transactions are entered into to hedge the risks relating to underlying physical positions arising from business activities. Derivative transactions to hedge risks such as interest rate and foreign currency movements principally include interest rate swaps, cross currency interest rate swaps, forward exchange contracts and vanilla European option contracts.
Classification of financial assets and financial liabilities The consolidated entity and the Company’s principal financial instruments comprise cash and cash equivalents, receivables, payables, interest bearing liabilities and derivatives. For measurement purposes the Company and the consolidated entity classify financial assets and financial liabilities into the following categories: (a) financial assets and liabilities at fair value through profit and loss, (b) loans and other receivables and (c) financial liabilities at amortised cost. Neither the Company nor the consolidated entity has financial assets categorised as held-to-maturity or as available-for-sale.
Consolidated CompanyThe net debt to gearing ratios are calculated as follows:
2008 2007 2008 2007$m $m $m $m
Interest bearing borrowings 1,341.8 1,676.4 72.6 1,220.1Less: cash and cash equivalents (321.3) (370.7) - - Net debt 1,020.5 1,305.7 72.6 1,220.1Notional adjustment for SPS 250.0 250.0 250.0 250.0Adjusted net debt 1,270.5 1,555.7 322.6 1,470.1Total equity 4,318.4 2,627.6 2,907.3 1,543.3Notional adjustment for SPS (250.0) (250.0) (250.0) (250.0)Adjusted equity 4,068.4 2,377.6 2,657.3 1,293.3Adjusted net debt & adjusted equity 5,338.9 3,933.3 2,979.8 2,763.5Gearing ratio (%) 19.1% 33.2% 2.4% 44.2%Adjusted Gearing ratio (%) 23.8% 39.6% 10.8% 53.2%
The interest cover ratio is calculated as follows:2008 2007
$m $m
EBIT (1) 970.1 812.7Net financing costs 157.7 122.6Capitalised borrowing costs 2.0 1.4
159.7 124.0Interest cover ratio (times) 6.1 6.6
(1) Before individually material items
For
per
sona
l use
onl
y

Notes to the Financial Statements For the year ended 30 September
Orica Limited 97
34. Financial and capital management (continued) Financial assets and liabilities at fair value through profit and loss This category combines financial assets and liabilities “held for trading” and those designated at “fair value” through profit and loss at inception. A financial asset or liability is classified in this category if it is acquired principally for the purpose of selling in the short term or if it is so designated by management. The consolidated entity holds a number of derivative instruments for economic hedging purposes under Board approved risk management policies, which do not meet the criteria for hedge accounting under Australian Accounting Standards. These derivatives are required to be categorised as “held for trading”. Assets and liabilities in this category are classified as current if they are either “held for trading” or are expected to be realised within 12 months of the balance sheet date (refer notes 12 and 16).
Loans and other receivables Loans and other receivables are non-derivative financial assets with fixed or determinable payments that are not quoted in an active market. They are included in current assets, except where maturities are greater than 12 months after the balance sheet date when they are classified as non-current. Loans and receivables are classified as ‘receivables’ in the balance sheet (refer note 8).
Amortised cost Financial liabilities measured in this category are initially recognised at their fair value and are then subsequently re-measured at amortised cost using the effective interest rate method. This includes the Company and the consolidated entity’s short-term non-derivative financial instruments (refer note 16) and its interest bearing liabilities (refer note 17).
Risks and mitigation The risks associated with the financial instruments and the policies for minimising these risks are detailed below:
Interest rate risk Interest rate risk refers to the risk that the value of a financial instrument or cash flows associated with the instrument will fluctuate due to changes in market interest rates. The consolidated entity is primarily exposed to interest rate risk on outstanding interest bearing liabilities. Non-derivative interest bearing assets are predominately short-term liquid assets. Interest bearing liabilities issued at fixed rates expose the consolidated entity to fair value interest risk while borrowings issued at a variable rate give rise to cash flow interest rate risk. Interest rate risk on long-term interest bearing liabilities is managed by adjusting the ratio of fixed interest debt to variable interest debt. This is managed within policies determined by the Orica Board of Directors via the use of interest rate swaps and cross currency interest rate swaps. Under the policy, a maximum of between 50% and 90% of debt with a maturity of less than five years can be fixed and a maximum 50% of debt with a maturity of between five and ten years can be fixed. Debt issuance with fixed interest payments can exceed ten years but requires Board approval. The consolidated entity operated within this range during both the current year and the prior year. The effective interest rate on average gross debt for the year ended 30 September 2008 was 7.3% (2007 7.2%).
For
per
sona
l use
onl
y
Notes to the Financial Statements For the year ended 30 September
Orica Limited 98
34. Financial and capital management (continued)
The Company's exposure to interest rate risk and the weighted average effective interest rate on financialasset and liabilities at balance date are:
Company 2008 2008 2007 2007Note $m % p.a. $m % p.a.
30 September 2008Trade and other receivables (8) 1,071.6 6.8 867.1 5.5Total financial assets 1,071.6 867.1Trade and other payables (16) - - 8.4 - Long term borrowings (17) 72.6 8.2 1,220.1 7.7Total financial liabilities 72.6 1,228.5Net financial assets/(liabilities) 999.0 (361.4)
Interest Rate SensitivityThe table below shows the effect on profit and equity after tax if interest rates at that date had been 10% higher or lower based on the relevant interest rate yield curve applicable to the underlying currency the borrowings are denominated in (including Australian dollars, Euros, Canadian dollars, New Zealand dollars and United States dollars) with all other variables held constant,taking into account all underlying exposures and related hedges. A sensitivity of 10% has been selected as this is considered
2008 2007 2008 2007$m $m $m $m
Effect on profit increase/(decrease)If interest rates were 10% higher, with all other variables held constant (2.0) (0.9) (2.0) (4.0)If interest rates were 10% lower, with all other variables held constant 1.4 1.1 2.0 4.0
Effect on profit after tax increase/(decrease)If interest rates were 10% higher, with all other variables held constant (1.4) (0.7) (1.4) (2.8)If interest rates were 10% lower, with all other variables held constant 1.0 0.8 1.4 2.8
Effect on shareholders' equity increase/(decrease)If interest rates were 10% higher, with all other variables held constant 9.4 7.5 (1.4) (2.8)If interest rates were 10% lower, with all other variables held constant (10.3) (8.0) 1.4 2.8
Consolidated Company
reasonable given the current level of both short-term and long-term interest rates. Directors cannot nor do not seek to predict movements in interest rates. These sensitivities are shown for illustrative purposes only.
The consolidated entity's exposure to interest rate risk and the weighted average effective interest rates on financial assets and liabilities at balance date are:
Consolidated Entity 2008 2008 2007 2007Note $m % p.a. $m % p.a.
30 September 2008Cash (7) 321.3 3.5 370.7 5.4Trade and other receivables (8) 1,255.5 - 1,020.6 - Other financial assets (12) 97.3 - 29.2 - Total financial assets 1,674.1 1,420.5Trade and other payables (16) 1,404.5 - 926.5 - Bank overdrafts (17) 9.0 9.9 3.0 6.9Short term borrowings (17) 252.1 8.2 579.4 7.3Lease liabilities (17) 17.8 8.6 0.8 8.1Long term borrowings (17) 1,000.9 7.9 1,014.7 7.2Interest rate swaps - (2.6) - (0.5)Cross currency interest rate swaps (17) 62.0 3.0 78.5 3.0Total financial liabilities 2,746.3 2,602.9Net financial assets/(liabilities) (1,072.2) (1,182.4)
For
per
sona
l use
onl
y

Notes to the Financial Statements For the year ended 30 September
Orica Limited 99
34. Financial and capital management (continued) Foreign currency risk - transactional Foreign currency risk refers to the risk that the value of a financial commitment, recognised asset or liability or cash flow will fluctuate due to changes in foreign currency rates. The consolidated entity is exposed to foreign exchange risk primarily due to significant sales and/or purchases denominated, either directly or indirectly, in currencies other than the functional currencies of the consolidated entity’s subsidiaries. In regard to foreign currency risk relating to sales and purchases, the consolidated entity hedges up to 100 per cent of committed exposures. Anticipated exposures are hedged by applying a declining percentage of cover the further the time to the transaction date. Only exposures that can be forecast with highly probable forecast accuracy are hedged. Transactions can be hedged for up to five years on a rolling monthly basis. The derivative instruments used for hedging purchase and sales exposures are bought vanilla option contracts and forward exchange contracts. Forward exchange contracts may be used only under Board policy for committed exposures and anticipated exposures expected to occur within 12 months. Bought vanilla option contracts may be used for all exposures. These contracts are designated as cash flow hedges and are recognised at their fair value. The currencies giving rise to this risk are primarily U.S. Dollar (USD), New Zealand Dollar (NZD), Euro (EUR), Canadian Dollar (CAD), Norwegian Kroner (NOK), Great Britain Pound (GBP) and Swedish Kronor (SEK).
Exchange rate sensitivity The table below shows the effect on profit and equity of the consolidated entity if exchange rates as at 30 September had been 10% higher or lower with all other variables held constant, taking into account all underlying exposures and related hedges. A sensitivity of 10% has been selected, as this is considered reasonably possible given the current level of exchange rates and the volatility of exchange rates based on an historical analysis. Directors cannot nor do not seek to predict movements in exchange rates. These sensitivities are shown for illustrative purposes only. However, it should be noted that it is extremely unlikely that all currencies would move in the same direction and by the same percentage. Major exposures are against the USD, CAD, NZD, NOK, SEK, EUR, and GBP.
USD CAD NZD NOK SEK EUR GBP$m $m $m $m $m $m $m
Cash 1,946.4 42.2 - 701.6 134.8 477.4 241.5Trade and other receivables 310.5 - 1.2 49.8 - 32.2 2.2Trade and other payables (382.8) (3.1) (10.4) (2.5) (15.8) (34.8) (0.7)Interest bearing liabilities (2,054.5) (0.6) (475.0) (3.9) (51.4) (108.3) (411.8)Net derivatives 266.9 (0.1) (44.2) 0.2 (0.1) (77.8) (2.5)Net exposure 86.5 38.4 (528.4) 745.2 67.5 288.7 (171.3)
USD CAD NZD NOK SEK EUR GBP$m $m $m $m $m $m $m
Cash 1,976.3 7.2 299.2 729.5 81.1 392.3 226.3Trade and other receivables 309.5 - 5.3 49.2 0.4 22.6 1.6Trade and other payables (253.6) (14.1) (3.3) (1.8) (5.3) (21.2) (1.8)Interest bearing liabilities (2,373.1) (0.7) (561.9) (0.3) (44.8) (76.7) (246.3)Net derivatives 39.0 (28.5) (17.3) (0.3) 0.1 (77.8) - Net exposure (301.9) (36.1) (278.0) 776.3 31.5 239.2 (20.2)
2008
2007
The consolidated entity's exposure to foreign currency risk including both external balances and internal balances (eliminated on consolidation) at the reporting date was as follows (Australian dollar equivalents):
For
per
sona
l use
onl
y
Notes to the Financial Statements For the year ended 30 September
Orica Limited 100
34. Financial and capital management (continued)
A 10% sensitivity would move year-end rates as follows (against the Australian Dollar):
10% As 10% 10% As 10%lower reported higher lower reported higher
U.S. Dollar 0.721 0.801 0.881 0.796 0.884 0.972Canadian Dollar 0.758 0.842 0.926 0.796 0.885 0.973New Zealand Dollar 1.078 1.198 1.317 1.053 1.170 1.287Norwegian Kroner 4.181 4.645 5.110 4.311 4.790 5.269Swedish Kronor 4.899 5.444 5.988 5.166 5.740 6.314Euro 0.502 0.558 0.613 0.562 0.624 0.686Great Britain Pound 0.394 0.438 0.482 0.393 0.437 0.480
2008 2007
The effect on profit/(loss) from operations, net profit after tax and shareholders' equity of a movement in individualexchange rates with all other variables held constant is as follows (there is no impact on the Company):
-10% 10% -10% 10%$m $m $m $m
Effect on profit/(loss) from operations from a movement in:U.S. Dollar (27.4) 16.4 1.6 (1.5)Canadian Dollar (4.8) 3.3 (1.6) 1.3New Zealand Dollar (2.9) 2.7 0.7 (0.7)Norwegian Kroner 5.3 (4.3) 6.4 (5.7)Swedish Kronor (1.7) 1.4 (0.3) 0.2Euro 0.5 (0.4) 0.7 (0.6)Great Britain Pound (8.9) 8.9 (0.9) 1.1
Effect on net profit after tax from a movement in:U.S. Dollar (19.2) 11.5 1.1 (1.0)Canadian Dollar (3.3) 2.3 (1.1) 0.9New Zealand Dollar (2.0) 1.9 0.5 (0.5)Norwegian Kroner 3.7 (3.0) 4.5 (4.0)Swedish Kronor (1.2) 1.0 (0.2) 0.2Euro 0.3 (0.3) 0.5 (0.4)Great Britain Pound (6.2) 6.3 (0.6) 0.8
Increase/(decrease) on shareholders' equity from a movement in:U.S. Dollar 36.5 (43.7) 73.8 (68.0)Canadian Dollar (3.6) 3.2 (1.1) 1.1New Zealand Dollar (52.9) 48.0 (23.5) 19.1Norwegian Kroner 58.0 (47.4) 62.5 (51.4)Swedish Kronor 5.3 (4.3) 2.0 (1.6)Euro 26.7 (21.8) 19.8 (16.2)Great Britain Pound (15.4) 12.6 (2.3) 2.1
2008 2007
For
per
sona
l use
onl
y
Notes to the Financial Statements For the year ended 30 September
Orica Limited 101
34. Financial and capital management (continued) Foreign currency risk - translational Foreign currency earnings translation risk arises primarily as a result of earnings in USD, NZD, SEK, EUR, GBP and CAD being translated into AUD and from the location of a number of other individually minor foreign currency earnings. Derivatives contracts to hedge earnings exposures do not qualify for hedge accounting under Australian Accounting Standards. However, Board approved policy allows hedging of this exposure in order to reduce the volatility of full year earnings resulting from changes in exchange rates. At 30 September 2008 the fair value of these derivatives was a $0.2 million loss (2007 $Nil). Foreign currency net investment translation risk is managed within policies determined by the Board of Directors. Hedging of exposures is undertaken centrally by the consolidated entity’s Treasury department primarily through originating debt in the currency of the asset or by raising debt in a different currency and effectively swapping the debt to the currency of the asset (see below “cross currency interest rate swaps” under “interest rate risk management”). The remaining translation exposure is managed, where considered appropriate, through forward foreign exchange derivative instruments. Gains and losses resulting from these hedging activities are recorded in the foreign currency translation reserve within the equity section of the balance sheet and offset against the foreign exchange impact resulting from the translation of the net assets of foreign operations. Ten percent of the consolidated entity’s investment in foreign operations was hedged in this manner as at 30 September 2008. A foreign exchange loss of $2.7 million (2007 $3.4 million gain) was recognised in the foreign currency translation reserve during the period.
Credit risk management Credit risk represents the loss that would be recognised if counterparties failed to meet their obligations under a contract or arrangement. The Company and the consolidated entity have exposure to credit risk on all financial assets included within the balance sheets. For discussion on how this risk in relation to receivables is managed refer to note 8. In regards to credit risk arising from derivatives and cash, this is the credit exposure to financial institutions that are counterparties to derivative contracts and cash deposits, with a positive fair value from Orica’s perspective (refer note 7). As at 30 September 2008, the sum of all contracts with a positive fair value was $27.2 million (2007 $31.4 million). To manage this risk the consolidated entity restricts dealings to highly rated counterparties approved within its credit limit policy. The higher the credit rating of the counterparty, the higher the consolidated entity’s allowable exposure is to that counterparty under the policy. The consolidated entity does not hold any credit derivatives to offset its credit exposures.
As at reporting date, the following derivative instruments hedging net investment exposures had a fair value of:
2008 2007$m $m
Forward foreign exchange contracts (4.0) - Cross currency interest rate swaps (113.6) (107.1)
For
per
sona
l use
onl
y

Notes to the Financial Statements For the year ended 30 September
Orica Limited 102
34. Financial and capital management (continued)
Liquidity risk managementLiquidity risk arises from the possibility that there will be insufficient funds available to make payment as and when required.The consolidated entity manages this risk via: - maintaining an adequate level of undrawn committed facilities in various currencies that can be drawn upon at short notice; - generally uses instruments that are readily tradable in the financial markets; - monitors duration of long term debt; - spreads, to the extent practicable, the maturity dates of long-term debt facilities; and - a comprehensive analysis of all inflows and outflows that relate to financial assets and liabilities.Facilities available and the amounts drawn and undrawn are as follows:
2008 2007 2008 2007$m $m $m $m
Unsecured bank overdraft facilitiesUnsecured bank overdraft facilities available 104.7 100.6 - -Amount of facilities unused 95.7 97.6 - -Committed standby and loan facilitiesCommitted standby and loan facilities available 3,377.9 2,294.2 - -Amount of facilities unused 2,325.0 1,120.0 - -The unsecured bank overdraft facilities are provided by banks. The bank overdrafts are payable on demand and are subject to anannual review. The repayment dates of the committed standby and loan facilities range from 1 October 2009 to 24 October2018 (2007 19 December 2008 to 24 October 2018).The contractual maturity of the consolidated entities' fixed and floating rate financial instruments and derivatives are shown in thetable below. The amounts shown represent the future undiscounted principal and interest cash flows:
Consolidated
Less than 1 year
1 to 2 years
2 to 5 years
Over 5 years
Less than 1 year
1 to 2 years
2 to 5 years
Over 5 years
$m $m $m $m $m $m $m $mNon-derivative financial assetsCash 321.3 - - - 370.7 - - -Trade and other receivables (1) 1,147.4 108.1 - - 915.9 104.7 - -Derivative financial assets 850.9 1,709.2 137.2 386.5 1,254.7 25.5 113.1 402.2Financial assets 2,319.6 1,817.3 137.2 386.5 2,541.3 130.2 113.1 402.2
Non-derivative financial liabilitiesTrade and other payables (1) 1,372.7 31.8 - - 921.6 4.9 - -Bank overdrafts 9.0 - - - 3.0 - - -Bank loans - - - - 172.1 - - -Commercial paper 140.0 - - - 308.7 - - -Other short term borrowings 25.4 - - - 7.9 - - -Trade bills and trade cards 13.4 - - - 14.3 - - -Private placement 81.8 78.8 445.7 980.6 223.0 72.7 379.5 1,040.5Other long term borrowings 0.8 5.2 5.8 - - - - -Fixed term notes 79.6 - - - 6.2 79.6 - -Cumulative non-redeemable preference shares (2) - - - - 0.1 0.1 0.3 2.1Lease liabilities 6.4 5.4 9.7 - 0.3 0.5 - -Derivative financial liabilities 841.7 1,707.3 162.7 443.4 1,284.2 28.7 138.5 474.9Financial liabilities 2,570.8 1,828.5 623.9 1,424.0 2,941.4 186.5 518.3 1,517.5
Net (outflow)/inflow (251.2) (11.2) (486.7) (1,037.5) (400.1) (56.3) (405.2) (1,115.3)(1) Excludes derivative financial instruments but includes the $100 million ATO receivable (refer note 8).(2) No settlement date, interest only included for year five. Repurchased during 2008.
CompanyConsolidated
As at 30 September 2008 As at 30 September 2007
For
per
sona
l use
onl
y
Notes to the Financial Statements For the year ended 30 September
Orica Limited 103
34. Financial and capital management (continued)
Cash flow hedges Cash flow hedges are used to hedge exposures relating to borrowings and ongoing business activities, where there is a highly probable sale, purchase or settlement commitment in foreign currencies.
Foreign exchange transactions The hedging of foreign exchange transactions is described under foreign currency risk above. The fair value of forward exchange contracts used as hedges of foreign exchange transactions at 30 September 2008 was a net $7.9 million gain (2007 $2.9 million loss), comprising assets of $13.8 million (2007 $1.7 million) and liabilities of $5.9 million (2007 $4.6 million). The fair value of currency options used as hedges of foreign exchange transactions at 30 September 2008 was $2.9 million loss (2007 $5.5 million gain), comprising assets of $1.6 million (2007 $5.6 million) and liabilities of $4.5 million (2007 $0.1 million). The following table shows the maturities of the receipts/payments of derivative instruments designated as cash flow hedges:
Foreign Exchange Contracts Weighted average rate million million 2008 2007 2008 2007
Buy US dollars/sell Australian dollars Not later than one year 0.8361 0.8547 USD 133.8 USD 35.6
Buy US dollars/sell New Zealand dollars Not later than one year 0.6696 0.7132 USD 27.5 USD 21.3
Buy Australian dollars/sell New Zealand dollars Not later than one year 1.2240 1.1454 NZD 3.7 NZD 9.6
Buy Australian dollars/sell Canadian dollars Not later than one year 0.8567 0.8569 CAD 37.7 CAD 6.0
Buy Australian dollars/sell Swedish Kronor Not later than one year - 5.6403 - SEK 42.7
Buy Swedish Kronor/sell Norwegian Kroner Not later than one year 1.1731 1.1768 NOK 88.5 NOK 133.4
Buy Euro/sell Australian dollars Not later than one year 0.5621 0.5975 EUR 18.1 EUR 4.3 Later than one year but not later than two years 0.5698 - EUR 11.7 - Buy Colombian Peso/sell US dollars Not later than one year 1,948.8 - USD 7.0 - Buy British Pounds/sell Australian dollars Not later than one year 0.4784 - GBP 7.6 -
Company
Less than 1 year
1 to 2 years
2 to 5 years
Over 5 years
Less than 1 year
1 to 2 years
2 to 5 years
Over 5 years
$m $m $m $m $m $m $m $mNon-derivative financial assetsTrade and other receivables (1) 971.6 100.0 - - 767.1 100.0 - -Other financial assets - - - 1,915.1 - - - 1,915.0Financial assets 971.6 100.0 - 1,915.1 767.1 100.0 - 1,915.0
Non-derivative financial liabilitiesTrade and other payables - - - - 8.4 - - -Other loans - controlled entities 72.6 - - - 1,218.1 - - -Cumulative non-redeemable preference shares (2) - - - - 0.1 0.1 0.3 2.1Financial liabilities 72.6 - - - 1,226.6 0.1 0.3 2.1
Net inflow/(outflow) 899.0 100.0 - 1,915.1 (459.5) 99.9 (0.3) 1,912.9(1) Includes $100 million receivable from the ATO (refer note 8).(2) No settlement date, interest only included for year five. Repurchased during 2008.
As at 30 September 2008 As at 30 September 2007
For
per
sona
l use
onl
y
Notes to the Financial Statements For the year ended 30 September
Orica Limited 104
34. Financial instruments (continued) Vanilla European Option Contracts Weighted average rate million million
2008 2007 2008 2007 Buy US dollars/sell Australian dollars Not later than one year 0.7962 0.7818 USD 4.1 USD 52.1 Later than one year but not later than two years 0.7877 0.7877 USD 0.3 USD 4.1
Buy US dollars/sell Canadian dollars Not later than one year 0.9850 - CAD 6.0 - Later than one year but not later than two years 0.9850 - CAD 5.0 - Later than two years but not later than three years 0.9850 - CAD 3.0 - Later than three years but not later than five years 0.9850 - CAD 1.6 -
Buy Mexican Peso/sell US dollars Not later than one year 10.5545 - USD 34.2 - Later than one year but not later than two years 10.5545 - USD 2.9 -
Buy Chilean Peso/sell US dollars Not later than one year 509.367 - USD 64.6 - Later than one year but not later than two years 512.000 - USD 4.8 -
Buy Australian dollars/sell Canadian dollars Not later than one year 0.8643 - CAD 8.6 - Later than one year but not later than two years 0.8463 - CAD 1.0 -
Buy US dollars/sell New Zealand dollars Not later than one year 0.7374 0.6227 USD 6.2 USD 12.5 Later than one year but not later than two years 0.7333 0.7248 USD 0.5 USD 4.5 Gains and losses recognised in the cash flow hedge reserve on all foreign currency hedges of anticipated purchases, sales and interest and the timing of their anticipated recognition as part of sales or purchases are:
Net deferred (loss)/gains 2008 2007
Term $m $m
Not later than one year (0.6) 2.2 Later than one year but not later than two years (0.5) 0.4 Later than two year but no later than five years 0.3 - Total (0.8) 2.6 The terms of the forward exchange contracts have been negotiated to match the terms of the commitments. The portion of the gain or loss on the hedging instrument that is determined to be an effective hedge is recognised directly in equity. When the asset or liability affects the Income Statement, the consolidated entity transfers the related amount deferred in equity into the Income Statement. In September 2007, Orica announced that it had signed an agreement to acquire all of Excel Mining Systems LLC. The purchase price was denominated in US dollars, and the entity entered into forward foreign exchange contracts to hedge the resultant currency exposure as detailed below:
Foreign Exchange Contracts Weighted average rate million million 2008 2007 2008 2007
Buy US dollars/sell Australian dollars Not later than one year - 0.8618 - USD 680 As at 30 September 2007, the fair value of this hedge was a loss of $18.8 million. On payment of the purchase price this was capitalised as part of the cost of investment. Due to the acquisition of Excel in October 2007 the consolidated entity entered into a forward foreign exchange contract to hedge the translational exposure arising from movements in the USD. In accordance with the revised policy, during August 2008 this contract was closed out resulting in a gain of $24.2 million within the Income Statement (in financial income) reflecting the non designated portion (forward points) of the net investment hedge.
For
per
sona
l use
onl
y

Notes to the Financial Statements For the year ended 30 September
Orica Limited 105
34. Financial instruments (continued) Interest rate swap contracts Interest rate or cross currency interest rate swaps are classified as cash flow hedges if they are used to transfer floating rate debt into fixed rate debt and are stated at fair value. All gains and losses attributable to the hedged risk are taken directly to equity and reclassified into the Income Statement when the interest expense is recognised. All swaps are matched directly against the appropriate loans and interest expense and as such are considered highly effective. There was a derivative asset of $6.2 million as at 30 September 2008 (2007 $19.1 million asset). The notional amounts of interest rate swaps as summarised below represent the contract or face values of these derivatives. The notional amounts do not represent amounts exchanged by the parties. The amounts to be exchanged are net settled and will be calculated with reference to the notional amounts and the pay and receive interest rates determined under the terms of the derivative contracts. Each contract involves quarterly or semi-annual payment or receipt of the net amount of interest: 2008
$m 2007
$mFloating to fixed swaps One to five years 391.8 389.5More than five years 100.0 100.0Fixed interest rate range p.a. 5.2% to 8.3% 5.2% to 8.3% Fair value hedges Cross currency interest rate swap contracts During the period the consolidated entity held cross currency interest rate swaps to mitigate the consolidated entity’s exposure to changes in the fair value of foreign denominated debt from fluctuations in foreign currency and interest rates. The hedged items designated were a portion of the consolidated entity’s foreign currency denominated borrowings. The changes in the fair values of the hedged items resulting from movements in exchange rates and interest rates are offset against the changes in the value of the cross currency interest rate swaps. The objective of this hedging is to convert foreign currency borrowings to floating rate Australian dollar borrowings. For the consolidated entity, re-measurement of the hedged items resulted in a loss before tax of $42.8 million (2007 $20.6 million gain) and the changes in the fair value of the hedging instruments resulted in a gain before tax of $45.3 million (2007 $20.9 million loss) resulting in a net gain before tax of $2.5 million (2007 $0.3 million loss) recorded in finance costs. The fair value of these swaps at 30 September 2008 was $75.5 million (2007 $31.9 million), comprising assets of $106.6 million (2007 $88.1 million) and liabilities of $31.1 million (2007 $56.2 million). From the cross currency interest rate swaps as at 30 September 2008 there was a derivative asset of $68.6 million (2007 $107.1 million liability). During 2007, the entity sold assets that were based in New Zealand and as a result, the entity closed out some cross currency interest rate swaps that were designated as a hedge of NZD assets. The accumulated deferred losses associated with hedging the sold assets of $2.5 million, after tax were transferred from the foreign currency translation reserve and included in the calculation of the profit on sale in that year. Derivatives not designated in a hedging relationship Certain derivative instruments do not qualify for hedge accounting, despite being commercially valid economic hedges of the relevant risks. Changes in the fair value of any derivative instruments that do not qualify for hedge accounting are recognised immediately in the Income Statement (for example, changes in the fair value of any economic hedge not qualifying for hedge accounting or in the value of vanilla bought European options used to hedge translation of foreign earnings).
Interest rate swaps The change in fair value of swaps executed as economic hedges for which hedge accounting was not applied was a $0.1 million gain for the financial year ending 30 September 2008 (2007 $1.3 million gain). This relates to two interest rate swaps with a notional principal amount of $31.8 million (2007 $29.5 million).
Fair values of derivatives The carrying value of derivatives disclosed in notes 12 and 16 equal their fair values. Valuation techniques include where applicable, reference to prices quoted in active markets, discounted cash flow analysis, fair value of recent arm’s length transactions involving the same instruments or other instruments that are substantially the same, and option pricing models. The fair value of forward exchange contracts are calculated by reference to forward exchange market rates for contracts within similar maturity profiles at the time of valuation. The fair values of cross currency interest rate swaps and interest rate swaps and other financial liabilities measured at fair value are determined using valuation techniques which utilise data from observable markets. Assumptions are based on market conditions existing at each balance date. The fair value is calculated as the present value of the estimated future cash flows using an appropriate market based yield curve, which is independently derived and representative of Orica’s cost of borrowings.
For
per
sona
l use
onl
y
Notes to the Financial Statements For the year ended 30 September
Orica Limited 106
35. Events subsequent to balance date On 10 November 2008, the directors declared a final dividend of 55 cents per ordinary share payable on 2 December 2008. The financial effect of this dividend is not included in the financial statements for the year ended 30 September 2008 and will be recognised in the 2009 financial statements. On 7 November 2008, Orica acquired Opel Chemical (Singapore) Private Limited which owns a decorative coatings business in China. The directors have not become aware of any other significant matter or circumstance that has arisen since 30 September 2008, that has affected or may affect the operations of the consolidated entity, the results of those operations, or the state of affairs of the consolidated entity in subsequent years, which has not been covered in this report.
36. Employee share plans Employees’ options entitlement The names of persons who currently hold options in the share option plans are entered in the registers of options kept by the Company pursuant to Section 170 of the Corporations Act 2001. The registers may be inspected free of charge. Options granted to and exercised by executives under SOP and ESOP to the date of this report are shown below. The exercise price of options issued under SOP and ESOP was set at the market value of an Orica share at the time of issue of the option. Market value is defined as the average of the closing price at which Orica shares were traded on the ASX during the three calendar months preceding the date of issue. The ability to exercise these options is conditional on the Company achieving prescribed performance hurdles. All options refer to ordinary shares of Orica Limited and the options are provided at no cost to the recipient until their exercisable date. No person entitled to exercise an option in the Company has, by virtue of the option, a right to participate in a share issue of any other consolidated entity of the Group. 62,802 ordinary shares were issued during the financial year as a consequence of the exercise of options issued in prior years. As at balance date, there are 51,600 unissued ordinary shares under option. (a) Executive Share Option Plan The Executive Share Option Plan (ESOP) was introduced as part of the new executive compensation arrangements introduced during 2002 and operated between 2002 and 2004. It was the Board’s intention that the plan would be used only once to reflect the particular circumstances of the Company at the time to support the introduction of its new compensation policy. ESOP is administered by the Plan Manager, Link Market Services Limited. Eligible executives, as determined by the Board, who agreed to participate in the new compensation arrangements were invited to apply for options in three tranches to acquire shares in Orica at a specified exercise price subject to the achievement of a performance hurdle based on Orica’s share price. Options that vest upon achievement of the performance hurdles may be exercised from one day after the release of the annual results to 31 October of the following year subject to the company’s guidelines for dealing in securities. The plan performance periods and hurdles reflect those put in place for the Executive Key Management Personnel under SESLP. The second price hurdle was reached during 2005 and the third price hurdle was reached during 2006. Pursuant to the terms on which they were granted, the exercise price of outstanding ESOP options were adjusted in accordance with ASX listing rule 6.22.2 to reflect the impact of the rights issue in December 2005. There are no options over ordinary shares of the Company under the ESOP as at 30 September 2008. The table below discloses options over ordinary shares of the Company under the ESOP at 30 September 2007:
For
per
sona
l use
onl
y

Notes to the Financial Statements For the year ended 30 September
Orica Limited 107
36. Employee share plans (continued)
Grant date
Options issued
Options held at 30 Sep
Number of participants
at 30 Sep
Exercise price
$
First Tranche Exercise
date (1)
Price Hurdle
$
Second Tranche Exercise
date (1)
Price
Hurdle $
Third Tranche Exercise
date (1)
Price Hurdle
$
Value of options at
grant date (2)
$As at 30 September 2007 24 Apr 02 9,061,385 19,802 3 7.33 2004 8.00 2005 10.00 2006 12.00 16,854,17611 Nov 02 115,421 1 1 9.77 2004 10.35 2005 10.00 2006 12.00 216,991
9,176,806 19,803 17,071,167(1) Options may be exercised from one day after the release of the annual results to 31 October of the following year during specific trading periods as outlined in the Corporate Governance practices disclosure. (2) The assumptions underlying the options valuations are:
Grant date
Price of Orica Shares
at grant date
Expected volatility
in share price
Dividends expected on shares
Risk free interest
rate
Value per option
$ 24 Apr 02 8.72 30% 5.4% 5.89% 1.8611 Nov 02 10.24 30% 4.5% 4.74% 1.88The option valuation prepared by PWC uses methodologies consistent with assumptions that apply under an adjusted form of the binomial option pricing model and reflects the value (as at grant date) of options held at 30 September 2007. The assumptions underlying the options valuations are: (a) the exercise price of the option, (b) the life of the option, (c) the current price of the underlying securities, (d) the expected volatility of the share price, (e) the dividends expected on the shares, and (f) the risk-free interest rate for the life of the option. The share based payments expense recognised in the Income Statement for ESOP’s in 2008 was $nil (2007 $nil).
(b) Share Option Plan The Share Option Plan (SOP) operated between 1999 and 2002. SOP is administered by the Plan Manager, Link Market Services Limited. Eligible executives, as determined by the Board, who achieved an agreed performance rating were invited to apply for options to acquire shares in Orica at a specified exercise price subject to the achievement of a performance hurdle based on Orica’s Total Shareholder Return (TSR) relative to the TSR of the other companies in the ASX 100 index after three, four and five years. The proportion of options that vest and become exercisable is determined by comparing Orica’s TSR with the other companies. No options vest where Orica’s TSR score is below 50% of the other companies. Where the score is equal to or greater than 75% of other companies, all options granted will vest. Options that vest may be exercised for a period up to 10 years from the grant date. Pursuant to the terms on which they were granted, the exercise price of outstanding SOP options were adjusted in accordance with ASX listing rule 6.22.2 to reflect the impact of the rights issue in December 2005.
For
per
sona
l use
onl
y
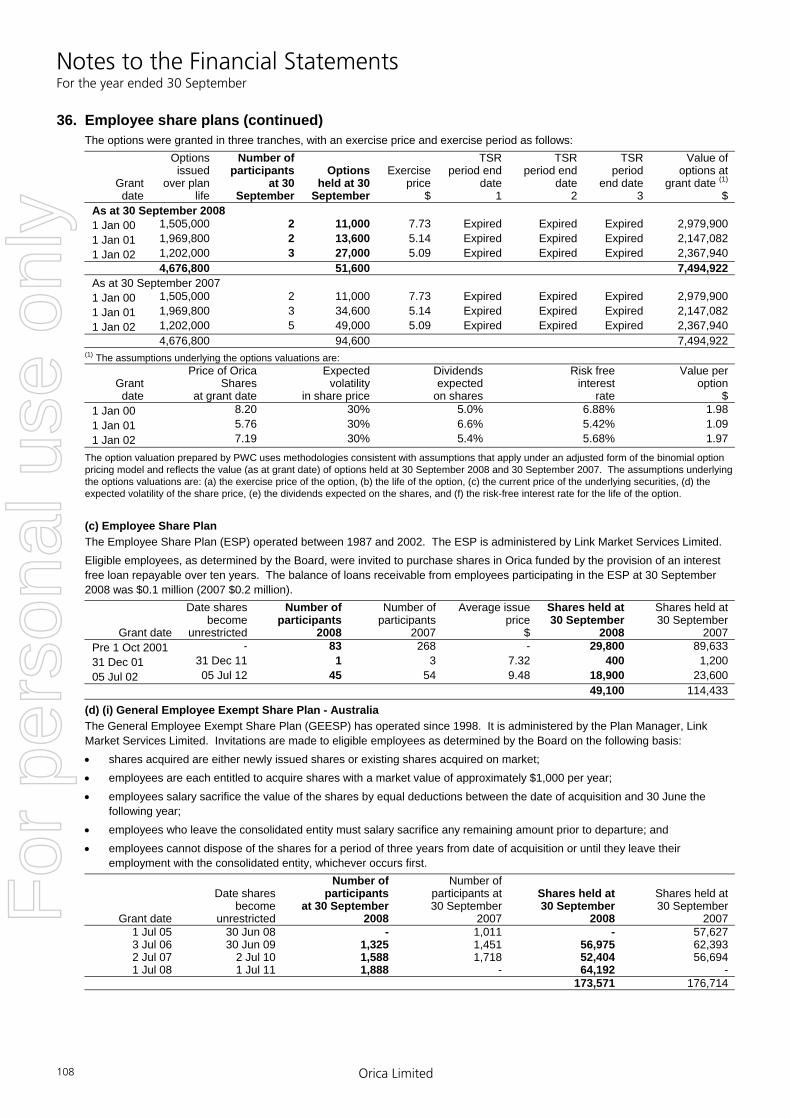
Notes to the Financial Statements For the year ended 30 September
Orica Limited 108
36. Employee share plans (continued) The options were granted in three tranches, with an exercise price and exercise period as follows:
Grant date
Options issued
over plan life
Number of participants
at 30 September
Options held at 30
September
Exercise price
$
TSR period end
date 1
TSR period end
date 2
TSR period
end date 3
Value of options at
grant date (1) $
As at 30 September 2008 1 Jan 00 1,505,000 2 11,000 7.73 Expired Expired Expired 2,979,900 1 Jan 01 1,969,800 2 13,600 5.14 Expired Expired Expired 2,147,082 1 Jan 02 1,202,000 3 27,000 5.09 Expired Expired Expired 2,367,940
4,676,800 51,600 7,494,922 As at 30 September 2007 1 Jan 00 1,505,000 2 11,000 7.73 Expired Expired Expired 2,979,900 1 Jan 01 1,969,800 3 34,600 5.14 Expired Expired Expired 2,147,082 1 Jan 02 1,202,000 5 49,000 5.09 Expired Expired Expired 2,367,940
4,676,800 94,600 7,494,922 (1) The assumptions underlying the options valuations are:
Grant date
Price of Orica Shares
at grant date
Expected volatility
in share price
Dividends expected
on shares
Risk free interest
rate
Value per option
$ 1 Jan 00 8.20 30% 5.0% 6.88% 1.98 1 Jan 01 5.76 30% 6.6% 5.42% 1.09 1 Jan 02 7.19 30% 5.4% 5.68% 1.97
The option valuation prepared by PWC uses methodologies consistent with assumptions that apply under an adjusted form of the binomial option pricing model and reflects the value (as at grant date) of options held at 30 September 2008 and 30 September 2007. The assumptions underlying the options valuations are: (a) the exercise price of the option, (b) the life of the option, (c) the current price of the underlying securities, (d) the expected volatility of the share price, (e) the dividends expected on the shares, and (f) the risk-free interest rate for the life of the option.
(c) Employee Share Plan The Employee Share Plan (ESP) operated between 1987 and 2002. The ESP is administered by Link Market Services Limited. Eligible employees, as determined by the Board, were invited to purchase shares in Orica funded by the provision of an interest free loan repayable over ten years. The balance of loans receivable from employees participating in the ESP at 30 September 2008 was $0.1 million (2007 $0.2 million).
Grant date
Date shares become
unrestricted
Number of participants
2008
Number of participants
2007
Average issue price
$
Shares held at 30 September
2008
Shares held at 30 September
2007 Pre 1 Oct 2001 - 83 268 - 29,800 89,633 31 Dec 01 31 Dec 11 1 3 7.32 400 1,200 05 Jul 02 05 Jul 12 45 54 9.48 18,900 23,600
49,100 114,433
(d) (i) General Employee Exempt Share Plan - Australia The General Employee Exempt Share Plan (GEESP) has operated since 1998. It is administered by the Plan Manager, Link Market Services Limited. Invitations are made to eligible employees as determined by the Board on the following basis: • shares acquired are either newly issued shares or existing shares acquired on market; • employees are each entitled to acquire shares with a market value of approximately $1,000 per year; • employees salary sacrifice the value of the shares by equal deductions between the date of acquisition and 30 June the
following year; • employees who leave the consolidated entity must salary sacrifice any remaining amount prior to departure; and • employees cannot dispose of the shares for a period of three years from date of acquisition or until they leave their
employment with the consolidated entity, whichever occurs first.
Grant date
Date shares
become unrestricted
Number of participants
at 30 September 2008
Number of participants at 30 September
2007
Shares held at 30 September
2008
Shares held at 30 September
2007 1 Jul 05 30 Jun 08 - 1,011 - 57,627 3 Jul 06 30 Jun 09 1,325 1,451 56,975 62,393 2 Jul 07 2 Jul 10 1,588 1,718 52,404 56,694 1 Jul 08 1 Jul 11 1,888 - 64,192 -
173,571 176,714
For
per
sona
l use
onl
y

Notes to the Financial Statements For the year ended 30 September
Orica Limited 109
36. Employee share plans (continued) (e) (ii) General Employee Exempt Share Plan - New Zealand A separate GEESP has operated for New Zealand employees since 1999. It is administered internally. Invitations are made to eligible employees as determined by the Board on the following basis: • shares acquired are either newly issued shares or existing shares acquired on market; • employees are each entitled to acquire shares with a market value of approximately NZ$780 per year; • employees salary sacrifice the value of the shares by equal deductions between the date of acquisition and 30 September
the following year; • employees who leave the consolidated entity because of redundancy, retirement or sickness, have the option to salary
sacrifice any remaining amounts prior to departure, if they wish to retain their shares; • employees who leave the consolidated entity because of resignation, will be paid the market value of the shares in proportion
to their contributions to date; and • employees cannot dispose of the shares for a period of three years from date of acquisition or until they leave their
employment with the consolidated entity and they are entitled to retain their shares, whichever occurs first.
Grant date
Date shares
become unrestricted
Number of participants at 30 September
2008
Number of participants at 30 September
2007
Shares held at 30 September
2008
Shares held at 30 September
2007 1 Oct 03 30 Sept 06 20 33 1,120 1,854 1 Oct 04 30 Sept 07 40 84 1,640 3,444 1 Oct 05 30 Sept 08 87 113 3,045 3,955 1 Oct 06 30 Sept 09 99 128 3,069 3,968 1 Oct 07 30 Sept 10 119 - 2,737 -
11,611 13,221
37. Related party disclosures (a) Key Management Personnel compensation summary As deemed under AASB 124, Key Management Personnel include non-executive directors and members of the Group Executive Team (executive directors and the most highly remunerated executives) who have authority and responsibility for planning, directing and controlling the activities of Orica. In this report, “Executives” refers to executive Key Management Personnel. However non–executive directors have had no day to day involvement in the management of the business during the financial year. A summary of the Key Management Personnel compensation is set out in the following table:
Consolidated Company 2008
$000 2007 $000
2008 $000
2007 $000
Short term employee benefits 18,799.4 15,299.6 - - Other long term benefits 3,632.2 2,964.5 - - Post employment benefits 289.3 242.2 - - Share-based payments 2,284.5 730.9 - - Termination benefits 1,194.2 651.3 - - 26,199.6 19,888.5 - - Information regarding individual directors and executives compensation and some equity instruments disclosure as permitted by Corporation Regulation 2M.3.03 is provided in the remuneration report section of the directors’ report.
For
per
sona
l use
onl
y
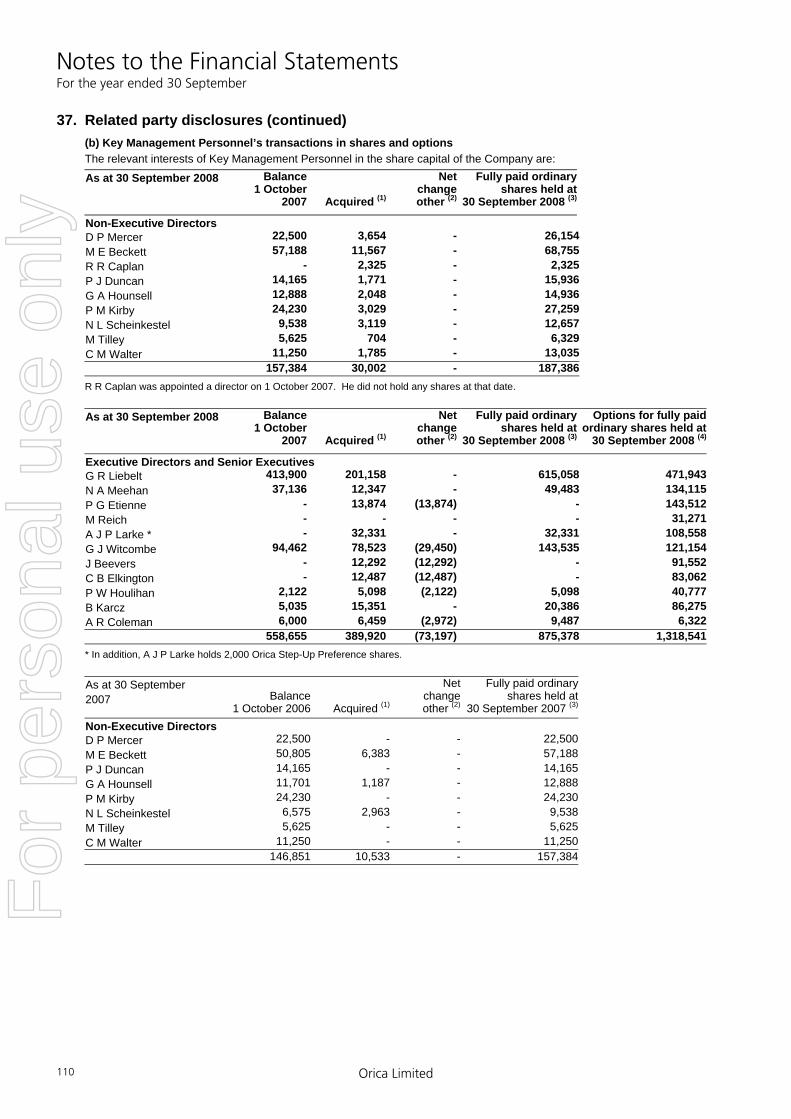
Notes to the Financial Statements For the year ended 30 September
Orica Limited 110
37. Related party disclosures (continued) (b) Key Management Personnel’s transactions in shares and options The relevant interests of Key Management Personnel in the share capital of the Company are:
As at 30 September 2008
Balance 1 October
2007 Acquired (1)
Netchangeother (2)
Fully paid ordinary shares held at
30 September 2008 (3)
Non-Executive Directors D P Mercer 22,500 3,654 - 26,154 M E Beckett 57,188 11,567 - 68,755 R R Caplan - 2,325 - 2,325 P J Duncan 14,165 1,771 - 15,936 G A Hounsell 12,888 2,048 - 14,936 P M Kirby 24,230 3,029 - 27,259 N L Scheinkestel 9,538 3,119 - 12,657 M Tilley 5,625 704 - 6,329 C M Walter 11,250 1,785 - 13,035 157,384 30,002 - 187,386 R R Caplan was appointed a director on 1 October 2007. He did not hold any shares at that date. As at 30 September 2008
Balance 1 October
2007 Acquired (1)
Netchangeother (2)
Fully paid ordinary shares held at
30 September 2008 (3)
Options for fully paidordinary shares held at
30 September 2008 (4)
Executive Directors and Senior Executives G R Liebelt 413,900 201,158 - 615,058 471,943N A Meehan 37,136 12,347 - 49,483 134,115P G Etienne - 13,874 (13,874) - 143,512M Reich - - - - 31,271A J P Larke * - 32,331 - 32,331 108,558G J Witcombe 94,462 78,523 (29,450) 143,535 121,154J Beevers - 12,292 (12,292) - 91,552C B Elkington - 12,487 (12,487) - 83,062P W Houlihan 2,122 5,098 (2,122) 5,098 40,777B Karcz 5,035 15,351 - 20,386 86,275A R Coleman 6,000 6,459 (2,972) 9,487 6,322 558,655 389,920 (73,197) 875,378 1,318,541* In addition, A J P Larke holds 2,000 Orica Step-Up Preference shares. As at 30 September 2007 Balance
1 October 2006 Acquired (1)
Net changeother (2)
Fully paid ordinary shares held at
30 September 2007 (3) Non-Executive Directors D P Mercer 22,500 - - 22,500 M E Beckett 50,805 6,383 - 57,188 P J Duncan 14,165 - - 14,165 G A Hounsell 11,701 1,187 - 12,888 P M Kirby 24,230 - - 24,230 N L Scheinkestel 6,575 2,963 - 9,538 M Tilley 5,625 - - 5,625 C M Walter 11,250 - - 11,250 146,851 10,533 - 157,384
For
per
sona
l use
onl
y
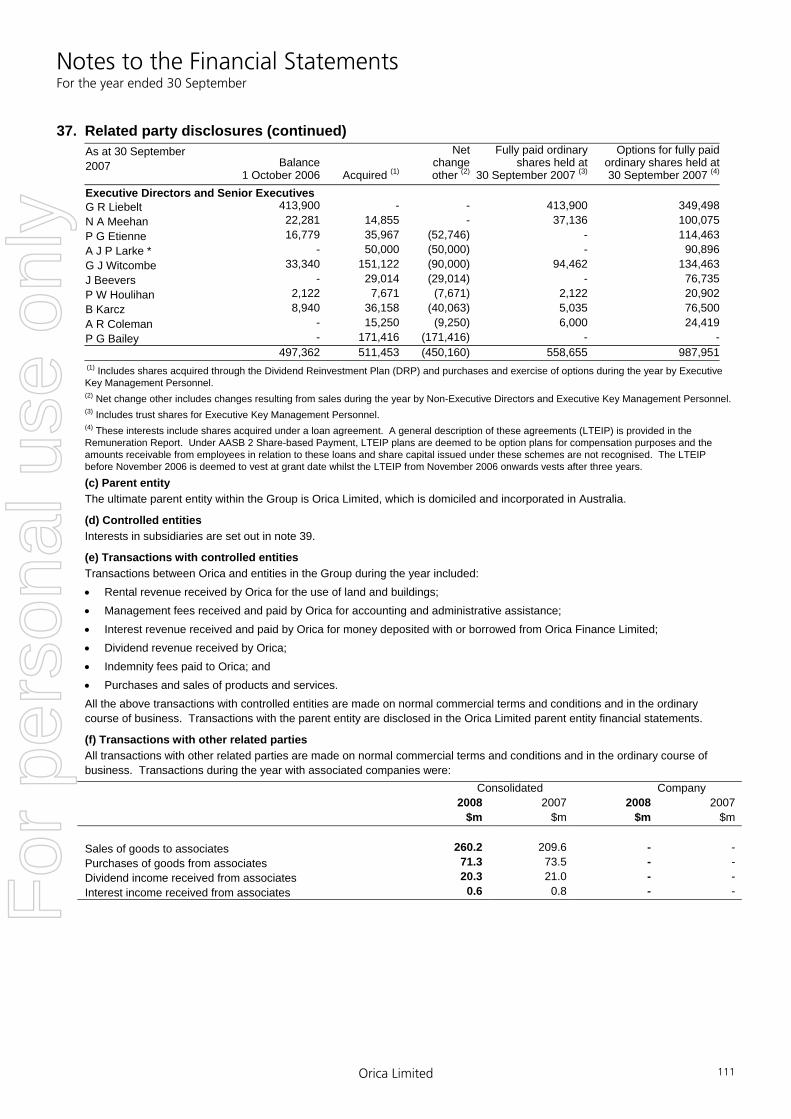
Notes to the Financial Statements For the year ended 30 September
Orica Limited 111
37. Related party disclosures (continued) As at 30 September 2007
Balance
1 October 2006 Acquired (1)
Net changeother (2)
Fully paid ordinary shares held at
30 September 2007 (3)
Options for fully paidordinary shares held at 30 September 2007 (4)
Executive Directors and Senior Executives G R Liebelt 413,900 - - 413,900 349,498N A Meehan 22,281 14,855 - 37,136 100,075P G Etienne 16,779 35,967 (52,746) - 114,463A J P Larke * - 50,000 (50,000) - 90,896G J Witcombe 33,340 151,122 (90,000) 94,462 134,463J Beevers - 29,014 (29,014) - 76,735P W Houlihan 2,122 7,671 (7,671) 2,122 20,902B Karcz 8,940 36,158 (40,063) 5,035 76,500A R Coleman - 15,250 (9,250) 6,000 24,419P G Bailey - 171,416 (171,416) - - 497,362 511,453 (450,160) 558,655 987,951 (1) Includes shares acquired through the Dividend Reinvestment Plan (DRP) and purchases and exercise of options during the year by Executive Key Management Personnel. (2) Net change other includes changes resulting from sales during the year by Non-Executive Directors and Executive Key Management Personnel. (3) Includes trust shares for Executive Key Management Personnel. (4) These interests include shares acquired under a loan agreement. A general description of these agreements (LTEIP) is provided in the Remuneration Report. Under AASB 2 Share-based Payment, LTEIP plans are deemed to be option plans for compensation purposes and the amounts receivable from employees in relation to these loans and share capital issued under these schemes are not recognised. The LTEIP before November 2006 is deemed to vest at grant date whilst the LTEIP from November 2006 onwards vests after three years.
(c) Parent entity The ultimate parent entity within the Group is Orica Limited, which is domiciled and incorporated in Australia.
(d) Controlled entities Interests in subsidiaries are set out in note 39.
(e) Transactions with controlled entities Transactions between Orica and entities in the Group during the year included: • Rental revenue received by Orica for the use of land and buildings; • Management fees received and paid by Orica for accounting and administrative assistance; • Interest revenue received and paid by Orica for money deposited with or borrowed from Orica Finance Limited; • Dividend revenue received by Orica; • Indemnity fees paid to Orica; and • Purchases and sales of products and services. All the above transactions with controlled entities are made on normal commercial terms and conditions and in the ordinary course of business. Transactions with the parent entity are disclosed in the Orica Limited parent entity financial statements.
(f) Transactions with other related parties All transactions with other related parties are made on normal commercial terms and conditions and in the ordinary course of business. Transactions during the year with associated companies were:
Consolidated Company 2008 2007 2008 2007 $m $m $m $m Sales of goods to associates 260.2 209.6 - - Purchases of goods from associates 71.3 73.5 - - Dividend income received from associates 20.3 21.0 - - Interest income received from associates 0.6 0.8 - -
F
or p
erso
nal u
se o
nly
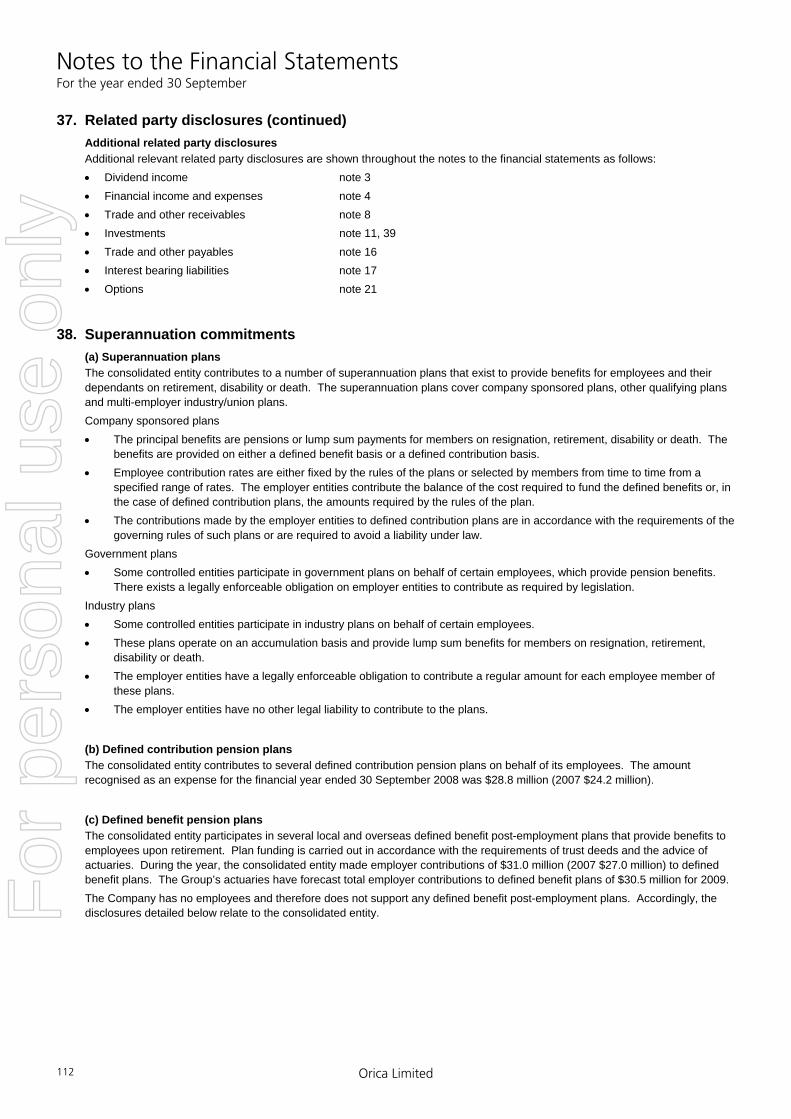
Notes to the Financial Statements For the year ended 30 September
Orica Limited 112
37. Related party disclosures (continued) Additional related party disclosures Additional relevant related party disclosures are shown throughout the notes to the financial statements as follows: • Dividend income note 3 • Financial income and expenses note 4 • Trade and other receivables note 8 • Investments note 11, 39 • Trade and other payables note 16 • Interest bearing liabilities note 17 • Options note 21
38. Superannuation commitments (a) Superannuation plans The consolidated entity contributes to a number of superannuation plans that exist to provide benefits for employees and their dependants on retirement, disability or death. The superannuation plans cover company sponsored plans, other qualifying plans and multi-employer industry/union plans. Company sponsored plans • The principal benefits are pensions or lump sum payments for members on resignation, retirement, disability or death. The
benefits are provided on either a defined benefit basis or a defined contribution basis. • Employee contribution rates are either fixed by the rules of the plans or selected by members from time to time from a
specified range of rates. The employer entities contribute the balance of the cost required to fund the defined benefits or, in the case of defined contribution plans, the amounts required by the rules of the plan.
• The contributions made by the employer entities to defined contribution plans are in accordance with the requirements of the governing rules of such plans or are required to avoid a liability under law.
Government plans • Some controlled entities participate in government plans on behalf of certain employees, which provide pension benefits.
There exists a legally enforceable obligation on employer entities to contribute as required by legislation. Industry plans • Some controlled entities participate in industry plans on behalf of certain employees. • These plans operate on an accumulation basis and provide lump sum benefits for members on resignation, retirement,
disability or death. • The employer entities have a legally enforceable obligation to contribute a regular amount for each employee member of
these plans. • The employer entities have no other legal liability to contribute to the plans.
(b) Defined contribution pension plans The consolidated entity contributes to several defined contribution pension plans on behalf of its employees. The amount recognised as an expense for the financial year ended 30 September 2008 was $28.8 million (2007 $24.2 million).
(c) Defined benefit pension plans The consolidated entity participates in several local and overseas defined benefit post-employment plans that provide benefits to employees upon retirement. Plan funding is carried out in accordance with the requirements of trust deeds and the advice of actuaries. During the year, the consolidated entity made employer contributions of $31.0 million (2007 $27.0 million) to defined benefit plans. The Group’s actuaries have forecast total employer contributions to defined benefit plans of $30.5 million for 2009. The Company has no employees and therefore does not support any defined benefit post-employment plans. Accordingly, the disclosures detailed below relate to the consolidated entity.
For
per
sona
l use
onl
y

Notes to the Financial Statements For the year ended 30 September
Orica Limited 113
38. Superannuation commitments (continued) (c) (i) Balance sheet amounts The amounts recognised in the balance sheet are determined as follows: 2008 2007 $m $m Present value of the defined benefit obligations 701.3 691.4 Fair value of defined benefit plan assets (613.4) (635.3) Deficit in plan 87.9 56.1 Present value of unfunded defined benefit obligation at end of year 86.9 81.2 Deficit 174.8 137.3 Restriction on assets recognised 3.7 - Net liability in the balance sheet 178.5 137.3 Amounts in balance sheet: Liabilities 181.4 142.1 Assets (2.9) (4.8) Net liability recognised in balance sheet at end of year 178.5 137.3
(c) (ii) Categories of plan assets The major categories of plan assets are as follows: 2008 2007 $m $m Cash and net current assets 56.1 57.0 Equity instruments 299.5 310.1 Fixed interest securities 158.8 166.9 Property 60.4 58.5 Other assets 38.6 42.8 613.4 635.3
(c) (iii) Reconciliations 2008 2007 $m $m Reconciliation of present value of the defined benefit obligation: Balance at the beginning of the year 772.6 746.1 Current service cost 20.9 21.7 Interest cost 44.1 40.5 Actuarial (gains)/losses (25.8) 20.6 Contributions by plan participants 7.3 7.0 Benefits paid (41.3) (60.8) Distributions (4.0) (3.6) Settlements (1.1) (7.9) Liabilities assumed in business combinations - 26.9 Exchange differences on foreign funds 15.5 (17.9) Balance at the end of the year 788.2 772.6 Reconciliation of the fair value of the plan assets: Balance at the beginning of the year 635.3 589.7 Expected return on plan assets 45.0 40.6 Actuarial (losses)/gains (67.4) 32.5 Contributions by plan participants 7.3 7.0 Contributions by employer 31.0 27.0 Benefits paid (41.3) (60.8) Distributions (4.0) (3.6) Settlements (1.1) (3.2) Assets acquired in business combinations - 17.5 Exchange differences on foreign funds 8.6 (11.4) Balance at the end of the year 613.4 635.3 The fair value of plan assets does not include any amounts relating to the consolidated entity’s own financial instruments, property occupied by, or other assets used by, the consolidated entity.
For
per
sona
l use
onl
y
Notes to the Financial Statements For the year ended 30 September
Orica Limited 114
38. Superannuation commitments (continued) (c) (iv) Amounts recognised in the income statement The amounts recognised in the income statement are as follows: 2008 2007 $m $m Current service cost 20.9 21.7 Interest cost 44.1 40.5 Expected return on plan assets (45.0) (40.6) Curtailment or settlement gains - (4.7) Total included in employee benefits expense 20.0 16.9
(c) (v) Principal actuarial assumptions The principal actuarial assumptions used were as follows: 2008 2007 Discount rate 4.10% - 11.29% 4.25% - 8.75% Expected return on plan assets 0.00% - 11.60% 0.00% - 8.75% Future salary increases 2.75% - 8.68% 2.50% - 7.00% Future inflation 2.00% - 4.50% 2.00% - 4.00% Future pension increases 2.00% - 5.00% 0.00% - 3.15% Healthcare cost trend rates (ultimate) 4.80% - 5.00% 4.80% - 5.00% Pension increases in deferment 2.00% - 5.00% 2.00% - 3.15% A one percentage point change in assumed healthcare cost trend rates would have the following effects: One
percentage point
increase $m
One percentage
point decrease
$m Effect on the aggregate of the service cost and interest cost 0.3 (0.2) Effect on the defined benefit obligation 3.1 (2.5)
(c) (vi) Historic summary Amounts for the current and previous periods are as follows: 2008 2007 2006 2005 $m $m $m $m Defined benefit plan obligation 788.2 772.6 746.1 692.3 Plan assets (613.4) (635.3) (589.7) (584.0) Restriction on assets recognised 3.7 - - -
Deficit 178.5 137.3 156.4 108.3
Experience adjustments arising on plan liabilities (16.6) 26.7 (0.3) (8.1) Experience adjustments arising on plan assets (67.4) 32.5 14.2 42.2 Actual return on plan assets (22.4) 73.1 53.2 78.3 The consolidated entity has used the AASB 1 exemption and disclosed amounts under AASB 1 above for each annual reporting period prospectively from the transition date (1 October 2004).
(c) (vii) Amounts included in the statement of recognised income and expense 2008 2007 $m $m Net actuarial (losses)/gains (41.6) 11.9 Change in the effect of asset ceiling (3.7) - Total (losses)/gains recognised via the Statement of Recognised Income and Expenses (45.3) 11.9
The consolidated entity has elected under AASB 119, to recognise all actuarial gains/losses in the statement of recognised income and expense. The cumulative amount of net actuarial losses/gains included in the statement of recognised income and expense as at 30 September 2008 is $5.6 million - loss (2007 $36.0 million - gain).
For
per
sona
l use
onl
y
Notes to the Financial Statements For the year ended 30 September
Orica Limited 115
38. Superannuation commitments (continued) (c) (viii) Expected rate of return on assets assumption The overall expected rate of return on assets assumption is determined by weighting the expected long-term rate of return for each asset class by the target allocation of plan assets to each class. The rates of return used for each class are net of investment tax and investment fees.
(c) (ix) Surplus/(deficit) for major defined benefit plans
30 September 2008 Plan
Accrued Benefits
Fund Assets
Accrued (deficit)/surplus
Current contribution
recommendation
Discount rate
Expected return on
plan assets
Future salary
increases
$m $m $m % % %The Flexible Benefits Super Fund 4(a) 414.1 382.6 (31.5) 13.0% of salaries 4.85 7.50 4.50Pension Plan for Employees of Orica Canada Inc 4(b) 88.9 72.8 (16.1)
7.4% of pensionable earnings 6.00 7.00 3.75
Post Retirement Benefits (Canada) 4(c) 15.1 - (15.1)
Based on benefit payments 6.00 n/a n/a
Orica Pension Scheme (UK) 4(b) 37.6 31.2 (6.4) 20.8% of pensionable earnings 6.40 7.39 4.00Dyno Nobel Sweden AB 4(d) 40.8 - (40.8) Based on benefit payments 4.25 n/a 3.50Dyno DNE (Norway) 4(e) 40.9 26.5 (14.4) Insurance premiums 5.00 5.75 4.50Dyno Defence (Norway) 4(e) 7.6 5.8 (1.8) Insurance premiums 5.00 5.75 4.50Dynea HK (Norway) 4(e) 12.0 7.0 (5.0) Insurance premiums 5.00 5.75 4.50Orica New Zealand Ltd Retirement Plan 4(b) 33.4 24.7 (8.7)
14.4% of salaries 4.10 6.40 3.50
Orica USA Inc. Retirement Income Plan 4(b) 23.2 21.0 (2.2)
Set in accordance with local annual funding requirements 6.50 8.25 n/a
Minova USA Retirement Plans 4(b) 19.5 14.8 (4.7)
Set in accordance with local annual funding requirements 6.50 8.25 3.50
Other (3) 55.1 27.0 (28.1) Various Various Various Various788.2 613.4 (174.8)
Restriction on assets recognised (3.7)(178.5)
30 September 2007 Plan
Accrued Benefits
Fund Assets
Accrued (deficit)/surplus
Current contribution
recommendation
Discount rate
Expected return on
plan assets
Future salary
increases
$m $m $m % % %The Flexible Benefits Super Fund 4(a) 413.5 403.7 (9.8) 12.5% of salaries 5.00 7.00 4.00Pension Plan for Employees of Orica Canada Inc 4(b) 83.1 66.0 (17.1)
6.2% of pensionable earnings 5.60 7.25 3.75
Post Retirement Benefits (Canada) 4(c) 14.3 - (14.3)
Based on benefit payments 5.60 n/a n/a
Orica Pension Scheme (UK) 4(b) 38.7 32.7 (6.0) 24.8% of pensionable earnings 6.00 7.07 5.05Dyno Nobel Sweden AB 4(d) 38.9 - (38.9) Based on benefit payments 4.25 n/a 3.50Dyno DNE (Norway) 4(e) 40.4 26.0 (14.4) Insurance premiums 5.25 6.25 4.50Dyno Defence (Norway) (2) 4(e) 7.8 6.2 (1.6) Insurance premiums 5.25 6.25 4.50Dynea HK (Norway) 4(e) 12.3 7.1 (5.2) Insurance premiums 5.25 6.25 4.50Orica New Zealand Ltd Retirement Plan 4(b) 33.5 31.3 (2.2)
15.7% of salaries 4.30 6.20 3.50
Orica USA Inc. Retirement Income Plan 4(b) 21.2 21.3 0.1
Set in accordance with local annual funding requirements 6.25 8.25 n/a
Minova USA Retirement Plans (1) 4(b) 17.5 15.5 (2.0)
Set in accordance with local annual funding requirements 6.25 8.00 3.50
Other (3) 51.4 25.5 (25.9) Various Various Various Various772.6 635.3 (137.3)
(1) The Minova USA Retirement Plans were acquired on 1 January 2007 as part of the Minova acquisition. (2) The Dyno Defence (Norway) accrued deficit balance was reduced by $4.7 million due to the transfer of employees in relation to the sale of the High Energy Materials business on 30 June 2007.
For
per
sona
l use
onl
y
Notes to the Financial Statements For the year ended 30 September
Orica Limited 116
38. Superannuation commitments (continued) (3) Other international plans comprise the following:
Dyno Nobel HK (Norway) Indian Explosives Limited Non-Management Staff Leave Encashment Scheme
Dyno Nobel Retirement Plan (Philippines) International Pension Plan (Canada)
Dyno Nobel Retirement Plans (Mexico) Jubilee (Europe)
Eurodyn (Europe) Minova Carbotech Pension Plans (Germany)
Excess Plan (Canada) Minova Holding Pension Plans (Germany)
Orica Germany Nitro Consult (Sweden)
High Income Earners Arrangement (Canada) Old Age Part-time Program (Incentives for Early Retirement) (Europe)
Indian Explosives Limited Employees Management Staff Superannuation
Orica Brasil Ltda.
Indian Explosives Limited Employees Superannuation Fund Orica USA Inc. Retiree Medical Plan
Indian Explosives Limited Gratuity Fund Philippine Explosives Corporation Factory Workers Retirement Plan
Indian Explosives Limited Management Staff Leave Encashment Scheme
Philippine Explosives Corporation Monthly-Paid Employees Retirement Plan
Indian Explosives Limited Management Staff Pension (DB) Fund Self-insured Long-Term Disability (LTD) plan (Canada) (4) The major defined benefit plans of the consolidated entity are categorised as follows:
(a) Funded lump sum retirement benefits based on final average pensionable earnings; (b) Funded pension retirement benefits based on final average pensionable earnings; (c) Post retirement life, dental and medical coverage; (d) Unfunded pension retirement benefits based on final average pensionable earnings; and (e) Arrangements for each Norway entity are a combination of funded and unfunded pension benefits based on final average pensionable earnings.
For
per
sona
l use
onl
y

Notes to the Financial Statements For the year ended 30 September
Orica Limited 117
39. Investments in controlled entitiesThe consolidated financial statements incorporate the assets, liabilities and results of the following controlled entities held during 2007 and 2008:
Name of Entity Place ofincorporationif other thanAustralia
Name of Entity Place ofincorporationif other thanAustralia
CompanyOrica Limited Dyno Nobel Samex SA PeruControlled Entities Dyno Nobel Schweiz AG (d) SwitzerlandAccesorios para Explosivos Problast Ltda Chile Dyno Nobel Slovakia a.s. SlovakiaACF and Shirleys Pty Ltd (g) Dyno Nobel Sweden AB SwedenActive Chemicals Chile S.A. Chile Dyno Nobel (Thailand) Limited ThailandAltona Properties Pty Ltd (g) Dyno Nobel VH Company LLC USAAmmonium Nitrate Development and Thailand Dyno Nobel Venezuela CA (i) Venezuela Production Limited (merged with Orica Venezuela C.A.)Anbao Insurance Pte Ltd (c) Singapore Dyno Nobel Zambia Limited ZambiaAndean Mining & Chemicals Limited Jersey D.C. Guelich Explosive Company (b) USAArboleda S.A Panama Eastern Nitrogen Pty Ltd (g)ASA Organizacion Industrial S.A. De C.V. Mexico Emirates Explosives LLC United Arab Australian Fertilizers Pty Ltd (g) EmiratesA.C.N. 009 556 218 Pty Ltd (d) (g) Engineering Polymers Pty Ltd (formerly Essential Oils of Tasmania Pty Ltd) Eurodyn Sprengmittel GmbH GermanyBamble Mekaniske Industri AS Norway Excel Mining Systems LLC (b) USABarbara Limited UK Explosivos de Mexico SA de CV MexicoBeijing Ruichy Minova Synthetic China Explosivos Mexicanos S.A. de C.V. Mexico Material Company Limited FA Sig Pty Limited (g)BHZ Ekochem Sp. z o.o. Poland Fortune Properties (Alrode) (Pty) Limited South AfricaBrasex Participacoes Ltda Brazil FS Resin (Pty) Limited South AfricaBronson and Jacobs (H.K.) Limited Hong Kong Geobolt s.r.o. Czech RepublicBronson and Jacobs (Shanghai) International China GeoNitro Limited Georgia Trading Co. Ltd Ground Consolidation Pty Limited (g)Bronson & Jacobs (GZFTZ) Ltd China Hallowell Manufacturing LLC USABronson & Jacobs International Co. Ltd Thailand Hebben & Fischbach Chemietechnik GmbH GermanyBronson & Jacobs (Malaysia) Sdn Bhd Malaysia Indian Explosives Limited IndiaBronson & Jacobs (NZ) Limited NZ Initiating Explosives Systems Pty Ltd (a) Bronson & Jacobs Pty Ltd Inversiones Dyno Nobel Chile Ltda (d) Chile Bronson & Jacobs (S.E. Asia) Pte Limited Singapore Intermountain West Energy, Inc. (b) USABST Manufacturing, Inc. USA Joplin Manufacturing Inc. USABWZ Berg - und Industrietechnik GmbH (b) Germany Karochem International Limited (e) UKCarbo Tech-Australia Pty Limited (g) LLC Orica Logistics RussiaCarbo Tech Australia Cement Marplex Australia (Holdings) Pty Ltd (g) Investments Pty Limited (g) Marplex Australia Pty Ltd Carbo Tech Polonia Sp. z o.o. (g) Poland Mining Concepts Pty Limited (g)Chemnet Pty Limited (g) Mining Systems Holding LLC (b) USACJSC Dyno Nobel Russia Russia Minova AG Switzerland(formerly Zao Dyno Nobel Russia) Minova Arnall Sp. z.o.o. (b) PolandCJSC (ZAO) Carbo-Zakk Russia (formerly Arnall Poland Sp. z.o.o.)CJSC (ZAO) Carbo & Krep Ukraine Minova Australia Pty LimitedCompania Aragonesa de Explosivos, S.A. (i) Spain Minova Bohemia s.r.o. (b) Czech Republic (merged with Orica Explosivos Industriales, S.A.) Minova Botswana (Pty) Ltd BotswanaCurasalus Insurance Limited (e) Minova CarboTech GmbH GermanyCurasalus Insurance Pty Limited Minova Codiv S.L. SpainCyantific Instruments Pty Ltd (b) Minova Ekochem S.A. PolandDeco-Pro China Limited (b) (f) Hong Kong Minova Holding GmbH GermanyDENASA Argentina (d) Argentina Minova Holding Inc USADulux Holdings Pty Ltd (g) Minova International Limited UKDyno Consult AS Norway Minova Ksante Sp. z o.o. PolandDyno NitroMed AD Bulgaria Minova MineTek Private Limited IndiaDyno Nobel AS Norway Minova Nordic AB Sweden(formerly Dyno Nobel ASA) Minova Slovakia s.r.o. (e) Slovak RepublicDyno Nobel Bolivia SA Bolivia Minova Operations (QLD) Pty LimitedDyno Nobel Brasil Ltda Brazil (formerly Ventmine (QLD) Pty Limited)Dyno Nobel Chile SA Chile Minova UK Limited UKDyno Nobel Latin America S.A. Peru Minova Ukraine OOO (b) UkraineDyno Nobel Nitrogen AB (d) Sweden Minova US Inc USA
For
per
sona
l use
onl
y

Notes to the Financial Statements For the year ended 30 September
Orica Limited 118
39. Investments in controlled entities (continued)Name of Entity Place of
incorporationif other thanAustralia
Place ofincorporationif other thanAustralia
Mintun Australia Pty Ltd Orica Explosives Technology Pty Ltd Mintun 1 Limited (b) UK Orica Explosivos Industriales, S.A. SpainMintun 2 Limited (b) UK Orica Export Inc. USAMintun 3 Limited (b) UK Orica Fiji Ltd FijiMintun 4 Limited (b) UK Orica Finance Limited Nitedals Krudtvaerk AS Norway Orica GEESP Pty Ltd (g)Nitro Asia Company Inc Philippines Orica Germany GmbH GermanyNitro Consult AB Sweden Orica Ghana Limited GhanaNitroamonia de Mexico S.A de C.V. Mexico Orica Grace US Holdings Inc. USANobel Industrier AS Norway Orica Guyana Inc. GuyanaNobeltax S.A. (e) Spain Orica Holdings Pty Ltd (g)Nordenfjeldske Spraengstof AS Norway Orica Hong Kong Limited Hong KongNorthwest Energetic Services L.L.C. (h) USA Orica IC Assets Holdings Limited PartnershipNutnim 1 Limited (b) UK Orica IC Assets Pty Ltd (a)Nutnim 2 Limited (b) UK Orica IC Investments Pty Ltd (g)OOO Minova (b) Russia Orica International IP Holdings Inc. USAOOO Minova TPS (b) Russia Orica International Pte Ltd (c) SingaporeOrica-CCM Energy Systems Sdn Bhd Malaysia Orica Investments (Indonesia) Pty Limited (g)Orica-GM Holdings Ltd UK Orica Investments (NZ) Limited NZOrica Advanced Water Technologies Pty Ltd (g) Orica Investments (Thailand) Pty Limited (g)Orica Argentina S.A.I.C. Argentina Orica Investments Pty Ltd (a) Orica Australia Pty Ltd (a) Orica Japan Co. Ltd JapanOrica Australia Securities Pty Limited Orica Kazakhstan Closed Joint Stock Company Kazakhstan Orica Blast & Quarry Surveys Ltd (b) UK Orica Malaysia Sdn Bhd MalaysiaOrica Brasil Ltda Brazil Orica Mining Services (Hong Kong) Ltd Hong KongOrica Brasil Produtos Quimicos Ltda Brazil (formerly Dyno Nobel Hong Kong Ltd)Orica Caledonie SAS New Caledonia Orica Mongolia LLC MongoliaOrica Canada Inc Canada Orica Nelson Quarry Services Inc. USAOrica Centroamerica SA Costa Rica Orica Netherlands Finance B.V. Holland(formerly Dyno Nobel Centroamerica SA) Orica New Zealand Finance Limited NZOrica Chemicals Argentina S.A. (c) Argentina Orica New Zealand Ltd NZOrica Chemicals Chile S.A. Chile Orica New Zealand Securities Limited NZOrica Chemicals Colombia SA (b) Columbia Orica New Zealand Superfunds Securities Ltd NZ(formerly Evolutia Chemicals SA) Orica Nitrates Philippines inc PhilippinesOrica Chemicals Peru S.A.C. Peru (formerly Dyno Nobel Philippines Inc)Orica Chile S.A. Chile Orica Nitro Patlayici Maddeler Ticaret ve TurkeyOrica Clarendon NZ Limited (c) New Zealand Sanayi Anonim Sirketi A.S.Orica Clarendon Pty Ltd (c) (formerly Orica Nitro Patlayici Maddeler Ticaret veOrica Coatings (Shenzhen) Limited China Sanayi A.S.)Orica Colombia S.A. Colombia Orica Nitrogen LLC USA(formerly Dyno Nobel Colombia SA) Orica Nominees Pty Ltd (g)Orica Czech Republic s.r.o. Czech Republic Orica Norway Holdings AS Norway(formerly Dyno Nobel Czech Republic) Orica Panama, S.A.(c) PanamaOrica Denmark A/S Denmark Orica Papua New Guinea Limited PNG(formerly Dyno Nobel Danmark A/S) Orica Peru S.A. PeruOrica CP Limited (c) Orica Philippines Inc PhilippinesOrica CP Australia Pty Ltd (c) Orica Poland Sp. z.o.o. PolandOrica CP Investments Pty Ltd (c) (formerly Dyno Nobel Poland Sp. z.o.o.)Orica CP Finance Pty Ltd (c) Orica Puerto Rico Inc. (d) Puerto RicoOrica CP Holdings Pty Ltd (c) Orica Securities (UK) Limited UKOrica Dominicana S.A. Dominican Orica Share Plan Pty Limited (g)
Republic Orica Singapore Pte Ltd SingaporeOrica Eesti OU Estonia Orica Slovakia s.r.o. (b) SlovakiaOrica Engineering Pty Ltd (d) (g) (formerly Explozia Slovakia s.r.o.)Orica Europe FT Pty Ltd (g) Orica South Africa (Proprietary) Limited South Africa(formerly Orica Investments (China Paints) Pty Ltd) Orica St. Petersburg LLC RussiaOrica Europe Investments Pty Ltd (g) Orica Sweden Holdings AB SwedenOrica Explosives Holdings Pty Ltd Orica Tanzania Limited (c) TanzaniaOrica Explosives Holdings No 2 Pty Ltd Orica UK Limited UK(formerly Orica International GP Pty Ltd) Orica USA Holdings General Partnership USAOrica Explosives Holdings No 3 Pty Ltd (g) Orica USA Inc. USAOrica Europe Management GmbH Germany Orica U.S. Services Inc. USAOrica Europe Pty Ltd & Co KG Germany Orica Venezuela C.A. VenezuelaOrica Explosives Research Pty Ltd (g) Orica Watercare Inc. USAOrica Explosives (Thailand) Co Ltd Thailand Oricorp Comercial S.A. de C.V. Mexico
For
per
sona
l use
onl
y
Notes to the Financial Statements For the year ended 30 September
Orica Limited 119
39. Investments in controlled entities (continued)Name of Entity Place of
incorporationif other thanAustralia
Place ofincorporationif other thanAustralia
Oricorp Mexico S.A. de C.V. Mexico Southern Blasting Services, Inc. (b) USAOrica (Weihai) Explosives Co Ltd China Sprengmittelvertrieb in Bayern GmbH GermanyPenlon Pty Limited (g) Sprengstoff-Verwertungs GmbH GermanyProject Grace Holdings Limited UK Stratabolt Products (Pty) Limited South AfricaProject Grace Incorporated USA Stratabolt (Proprietary) Ltd South AfricaProject Grace Limited UK Tec Harseim Do Brazil Ltda BrazilPT Baktijala Kencana Citra Indonesia Tecrete Industries Pty Limited (g)PT Kalimantan Mining Services Indonesia Teradoran Pty Ltd (formerly PT Dyno Nobel Indonesia) TOO "Minova Kasachstan" KazakhstanPT Kaltim Nitrate Indonesia Indonesia UPEX S.A. (d) PeruPT Orica Mining Services Indonesia Ventmine Pty Limited Retec Pty Ltd (g) White Lightning Holding Co Inc PhilippinesSarkem Pty Ltd (g) Willich Fosroc Technika Gornicza PolandSelleys Pty Limited (a) i Budowlana Sp z o.o.
Woods & Woods Pty Limited (e)
Notes:All entities are owned 100% except as set out in note 23.
(b) Acquired in 2008.(c) Incorporated in 2008.(d) In liquidation.(e) Liquidated in 2008.(f) Dissolved in 2008.(g) Small proprietary company - no separate statutory accounts are prepared.(h) Associate acquired as a subsidiary in 2008.(i) Merged with another entity in 2008.
(a) These controlled entities have each entered into a Deed of Cross Guarantee with Orica in respect of relief granted from specific accounting and financial reporting requirements in accordance with the ASIC Class Order 98/1418.
For
per
sona
l use
onl
y

Notes to the Financial Statements For the year ended 30 September
Orica Limited 120
2008 2007 $m $m
40 Deed of cross guaranteeEntities which are party to a Deed of Cross Guarantee, entered into in accordance with ASIC Class Order 98/1418 dated 13 August 1998 (as amended), are disclosed in note 39. A consolidated income statement and consolidatedbalance sheet for this closed group is shown below.
Summarised balance sheetCurrent assetsCash and cash equivalents 1,321.0 1,593.2 Trade and other receivables 457.5 373.5 Inventories 313.0 234.2 Other assets 12.7 7.5 Total current assets 2,104.2 2,208.4 Non-current assetsTrade and other receivables 103.1 103.0 Investments accounted for using the equity method 1.6 1.3 Other financial assets 3,068.3 2,057.0 Property, plant and equipment 1,261.9 1,121.8 Intangible assets 435.5 426.7 Deferred tax assets 141.8 134.6 Other assets - 1.3 Total non-current assets 5,012.2 3,845.7 Total assets 7,116.4 6,054.1 Current liabilitiesTrade and other payables 647.6 462.5 Interest bearing liabilities 2,489.6 2,479.2 Current tax liabilities 45.4 44.0 Provisions 130.1 120.8 Total current liabilities 3,312.7 3,106.5 Non-current liabilitiesTrade and other payables 58.7 11.5 Interest bearing liabilities 11.7 313.4 Deferred tax liabilities 86.4 78.7 Provisions 97.3 88.8 Total non-current liabilities 254.1 492.4 Total liabilities 3,566.8 3,598.9 Net assets 3,549.6 2,455.2 EquityOrdinary shares 1,881.3 702.4 Reserves 443.4 435.7 Retained profits 734.9 827.1 Total equity attributable to ordinary shareholders of Orica 3,059.6 1,965.2 Equity attributable to Step-Up Preference Securities holders 490.0 490.0 Total equity 3,549.6 2,455.2
Summarised income statement and retained profitsProfit before income tax expense 306.7 178.5 Income tax expense (69.2) (56.3) Profit from continuing operations 237.5 122.2 Retained profits at the beginning of the year 827.1 992.7 Actuarial gains/losses recognised directly in equity (17.1) 2.0 Dividends/distributions paid: Step-Up Preference Securities distributions (41.5) (44.4) Less tax credit on Step-Up Preference Securities distributions 13.4 13.9 Ordinary dividends – interim (122.1) (111.3) Ordinary dividends – final (162.4) (148.0) Retained profits at the end of the year 734.9 827.1
Closed Group
For
per
sona
l use
onl
y
Directors’ Declaration on the Financial Report set out on pages 39 to 120
Orica Limited 121
I, Donald Penn Mercer, being a director of Orica Limited, do hereby state in accordance with a resolution of the directors that in the opinion of the directors,
(a) the financial statements and notes, set out on pages 39 to 120, are in accordance with the Corporations Act 2001, including:
(i) giving a true and fair view of the financial position of the Company and the consolidated entity as at 30 September 2008 and of their performance for the financial year ended on that date; and (ii) complying with Australian Accounting Standards and the Corporations Regulations 2001; and
(b) there are reasonable grounds to believe the Company will be able to pay its debts as and when they become due and payable.
There are reasonable grounds to believe that the Company and the controlled entities identified in note 39 will be able to meet any obligations or liabilities to which they are or may become subject to by virtue of the Deed of Cross Guarantee between the Company and those controlled entities pursuant to ASIC Class Order 98/1418. The directors have been given the declarations required by Section 295A of the Corporations Act 2001 from the Managing Director and Executive Director Finance for the financial year ended 30 September 2008. D P Mercer Chairman Dated at Melbourne this 10th day of November 2008.
For
per
sona
l use
onl
y
Auditor’s Report For the year ended 30 September 2008
Orica Limited 122
Independent auditor’s report to the members of Orica Limited
Report on the financial report We have audited the accompanying financial report of Orica Limited (the Company), which comprises the balance sheets as at 30 September 2008, and the income statements, statements of recognised income and expense and cash flow statements for the year ended on that date, a description of significant accounting policies and other explanatory notes 1 to 40 and the directors’ declaration set out on pages 39 to 121 of the Group comprising the Company and the entities it controlled at the year’s end or from time to time during the financial year.
Directors’ responsibility for the financial report
The directors of the Company are responsible for the preparation and fair presentation of the financial report in accordance with Australian Accounting Standards (including the Australian Accounting Interpretations) and the Corporations Act 2001. This responsibility includes establishing and maintaining internal control relevant to the preparation and fair presentation of the financial report that is free from material misstatement, whether due to fraud or error; selecting and applying appropriate accounting policies; and making accounting estimates that are reasonable in the circumstances. In note 1, the directors also state, in accordance with Australian Accounting Standard AASB 101 Presentation of Financial Statements, that the financial report, comprising the financial statements and notes, complies with International Financial Reporting Standards.
Auditor’s responsibility
Our responsibility is to express an opinion on the financial report based on our audit. We conducted our audit in accordance with Australian Auditing Standards. These Auditing Standards require that we comply with relevant ethical requirements relating to audit engagements and plan and perform the audit to obtain reasonable assurance whether the financial report is free from material misstatement.
An audit involves performing procedures to obtain audit evidence about the amounts and disclosures in the financial report. The procedures selected depend on the auditor’s judgement, including the assessment of the risks of material misstatement of the financial report, whether due to fraud or error. In making those risk assessments, the auditor considers internal control relevant to the entity’s preparation and fair presentation of the financial report in order to design audit procedures that are appropriate in the circumstances, but not for the purpose of expressing an opinion on the effectiveness of the entity’s internal control. An audit also includes evaluating the appropriateness of accounting policies used and the reasonableness of accounting estimates made by the directors, as well as evaluating the overall presentation of the financial report.
We performed the procedures to assess whether in all material respects the financial report presents fairly, in accordance with the Corporations Act 2001 and Australian Accounting Standards (including the Australian Accounting Interpretations), a view which is consistent with our understanding of the Company’s and the Group’s financial position and of their performance.
We believe that the audit evidence we have obtained is sufficient and appropriate to provide a basis for our audit opinion.
Independence
In conducting our audit, we have complied with the independence requirements of the Corporations Act 2001.
For
per
sona
l use
onl
y
Auditor’s Report For the year ended 30 September 2008
Orica Limited 123
Auditor’s opinion In our opinion:
(a) the financial report of Orica Limited is in accordance with the Corporations Act 2001, including:
(i) giving a true and fair view of the Company’s and the Group’s financial position as at 30 September 2008 and of their performance for the year ended on that date; and
(ii) complying with Australian Accounting Standards (including the Australian Accounting Interpretations) and the Corporations Regulations 2001.
(b) the financial report also complies with International Financial Reporting Standards as disclosed in note 1.
Report on the remuneration report We have audited the Remuneration Report included in pages 24 to 37 of the directors’ report for the year ended 30 September 2008. The directors of the company are responsible for the preparation and presentation of the remuneration report in accordance with Section 300A of the Corporations Act 2001. Our responsibility is to express an opinion on the remuneration report, based on our audit conducted in accordance with auditing standards.
Auditor’s opinion
In our opinion, the remuneration report of Orica Limited for the year ended 30 September 2008, complies with Section 300A of the Corporations Act 2001.
KPMG
Alison M Kitchen Partner Dated at Melbourne this 10th day of November 2008.
For
per
sona
l use
onl
y
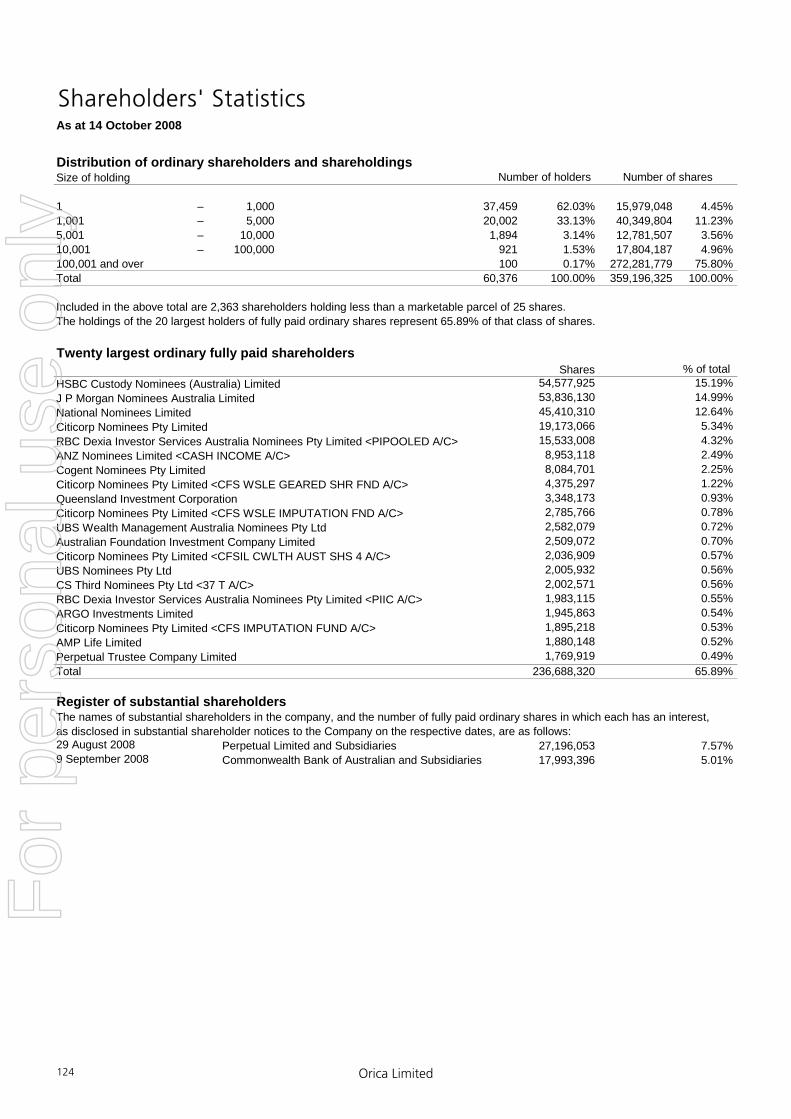
Orica Limited 124
Shareholders' StatisticsAs at 14 October 2008
Distribution of ordinary shareholders and shareholdingsSize of holding
1 – 1,000 37,459 62.03% 15,979,048 4.45%1,001 – 5,000 20,002 33.13% 40,349,804 11.23%5,001 – 10,000 1,894 3.14% 12,781,507 3.56%10,001 – 100,000 921 1.53% 17,804,187 4.96%100,001 and over 100 0.17% 272,281,779 75.80%Total 60,376 100.00% 359,196,325 100.00%
Included in the above total are 2,363 shareholders holding less than a marketable parcel of 25 shares.The holdings of the 20 largest holders of fully paid ordinary shares represent 65.89% of that class of shares.
Twenty largest ordinary fully paid shareholdersShares
HSBC Custody Nominees (Australia) Limited 54,577,925 15.19%J P Morgan Nominees Australia Limited 53,836,130 14.99%National Nominees Limited 45,410,310 12.64%Citicorp Nominees Pty Limited 19,173,066 5.34%RBC Dexia Investor Services Australia Nominees Pty Limited <PIPOOLED A/C> 15,533,008 4.32%ANZ Nominees Limited <CASH INCOME A/C> 8,953,118 2.49%Cogent Nominees Pty Limited 8,084,701 2.25%Citicorp Nominees Pty Limited <CFS WSLE GEARED SHR FND A/C> 4,375,297 1.22%Queensland Investment Corporation 3,348,173 0.93%Citicorp Nominees Pty Limited <CFS WSLE IMPUTATION FND A/C> 2,785,766 0.78%UBS Wealth Management Australia Nominees Pty Ltd 2,582,079 0.72%Australian Foundation Investment Company Limited 2,509,072 0.70%Citicorp Nominees Pty Limited <CFSIL CWLTH AUST SHS 4 A/C> 2,036,909 0.57%UBS Nominees Pty Ltd 2,005,932 0.56%CS Third Nominees Pty Ltd <37 T A/C> 2,002,571 0.56%RBC Dexia Investor Services Australia Nominees Pty Limited <PIIC A/C> 1,983,115 0.55%ARGO Investments Limited 1,945,863 0.54%Citicorp Nominees Pty Limited <CFS IMPUTATION FUND A/C> 1,895,218 0.53%AMP Life Limited 1,880,148 0.52%Perpetual Trustee Company Limited 1,769,919 0.49%Total 236,688,320 65.89%
Register of substantial shareholdersThe names of substantial shareholders in the company, and the number of fully paid ordinary shares in which each has an interest,as disclosed in substantial shareholder notices to the Company on the respective dates, are as follows:29 August 2008 Perpetual Limited and Subsidiaries 27,196,053 7.57%9 September 2008 Commonwealth Bank of Australian and Subsidiaries 17,993,396 5.01%
Number of sharesNumber of holders
% of total
For
per
sona
l use
onl
y
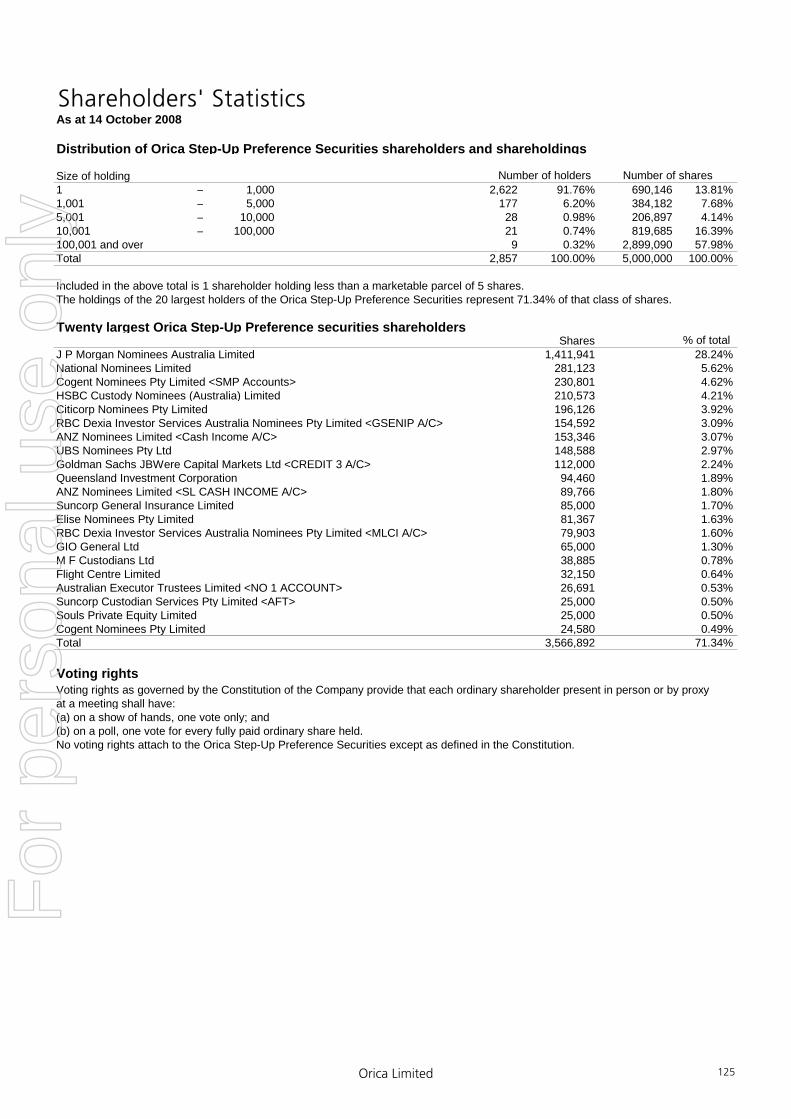
Orica Limited 125
Shareholders' StatisticsAs at 14 October 2008
Distribution of Orica Step-Up Preference Securities shareholders and shareholdings
Size of holding1 – 1,000 2,622 91.76% 690,146 13.81%1,001 – 5,000 177 6.20% 384,182 7.68%5,001 – 10,000 28 0.98% 206,897 4.14%10,001 – 100,000 21 0.74% 819,685 16.39%100,001 and over 9 0.32% 2,899,090 57.98%Total 2,857 100.00% 5,000,000 100.00%
Included in the above total is 1 shareholder holding less than a marketable parcel of 5 shares.The holdings of the 20 largest holders of the Orica Step-Up Preference Securities represent 71.34% of that class of shares.
Twenty largest Orica Step-Up Preference securities shareholdersShares
J P Morgan Nominees Australia Limited 1,411,941 28.24%National Nominees Limited 281,123 5.62%Cogent Nominees Pty Limited <SMP Accounts> 230,801 4.62%HSBC Custody Nominees (Australia) Limited 210,573 4.21%Citicorp Nominees Pty Limited 196,126 3.92%RBC Dexia Investor Services Australia Nominees Pty Limited <GSENIP A/C> 154,592 3.09%ANZ Nominees Limited <Cash Income A/C> 153,346 3.07%UBS Nominees Pty Ltd 148,588 2.97%Goldman Sachs JBWere Capital Markets Ltd <CREDIT 3 A/C> 112,000 2.24%Queensland Investment Corporation 94,460 1.89%ANZ Nominees Limited <SL CASH INCOME A/C> 89,766 1.80%Suncorp General Insurance Limited 85,000 1.70%Elise Nominees Pty Limited 81,367 1.63%RBC Dexia Investor Services Australia Nominees Pty Limited <MLCI A/C> 79,903 1.60%GIO General Ltd 65,000 1.30%M F Custodians Ltd 38,885 0.78%Flight Centre Limited 32,150 0.64%Australian Executor Trustees Limited <NO 1 ACCOUNT> 26,691 0.53%Suncorp Custodian Services Pty Limited <AFT> 25,000 0.50%Souls Private Equity Limited 25,000 0.50%Cogent Nominees Pty Limited 24,580 0.49%Total 3,566,892 71.34%
Voting rightsVoting rights as governed by the Constitution of the Company provide that each ordinary shareholder present in person or by proxy at a meeting shall have:(a) on a show of hands, one vote only; and(b) on a poll, one vote for every fully paid ordinary share held.No voting rights attach to the Orica Step-Up Preference Securities except as defined in the Constitution.
Number of holders Number of shares
% of total
For
per
sona
l use
onl
y
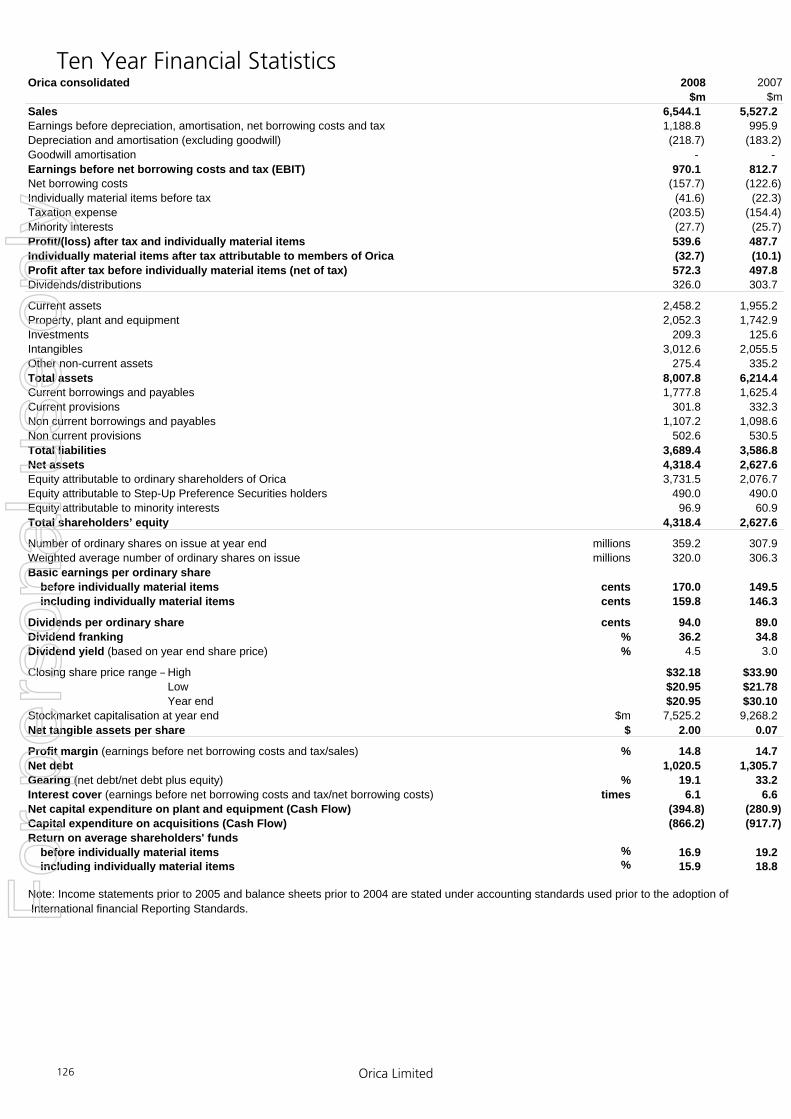
Ten Year Financial Statistics
Orica Limited 126
Orica consolidated 2008 2007$m $m
Sales 6,544.1 5,527.2Earnings before depreciation, amortisation, net borrowing costs and tax 1,188.8 995.9Depreciation and amortisation (excluding goodwill) (218.7) (183.2)Goodwill amortisation - - Earnings before net borrowing costs and tax (EBIT) 970.1 812.7Net borrowing costs (157.7) (122.6)Individually material items before tax (41.6) (22.3)Taxation expense (203.5) (154.4)Minority interests (27.7) (25.7)Profit/(loss) after tax and individually material items 539.6 487.7Individually material items after tax attributable to members of Orica (32.7) (10.1)Profit after tax before individually material items (net of tax) 572.3 497.8Dividends/distributions 326.0 303.7
Current assets 2,458.2 1,955.2Property, plant and equipment 2,052.3 1,742.9Investments 209.3 125.6Intangibles 3,012.6 2,055.5Other non-current assets 275.4 335.2Total assets 8,007.8 6,214.4Current borrowings and payables 1,777.8 1,625.4Current provisions 301.8 332.3Non current borrowings and payables 1,107.2 1,098.6Non current provisions 502.6 530.5Total liabilities 3,689.4 3,586.8Net assets 4,318.4 2,627.6Equity attributable to ordinary shareholders of Orica 3,731.5 2,076.7Equity attributable to Step-Up Preference Securities holders 490.0 490.0Equity attributable to minority interests 96.9 60.9Total shareholders’ equity 4,318.4 2,627.6
Number of ordinary shares on issue at year end millions 359.2 307.9Weighted average number of ordinary shares on issue millions 320.0 306.3Basic earnings per ordinary share before individually material items cents 170.0 149.5 including individually material items cents 159.8 146.3
Dividends per ordinary share cents 94.0 89.0Dividend franking % 36.2 34.8Dividend yield (based on year end share price) % 4.5 3.0
Closing share price range –High $32.18 $33.90Low $20.95 $21.78Year end $20.95 $30.10
Stockmarket capitalisation at year end $m 7,525.2 9,268.2Net tangible assets per share $ 2.00 0.07
Profit margin (earnings before net borrowing costs and tax/sales) % 14.8 14.7Net debt 1,020.5 1,305.7Gearing (net debt/net debt plus equity) % 19.1 33.2Interest cover (earnings before net borrowing costs and tax/net borrowing costs) times 6.1 6.6Net capital expenditure on plant and equipment (Cash Flow) (394.8) (280.9)Capital expenditure on acquisitions (Cash Flow) (866.2) (917.7)Return on average shareholders' funds before individually material items % 16.9 19.2 including individually material items % 15.9 18.8
Note: Income statements prior to 2005 and balance sheets prior to 2004 are stated under accounting standards used prior to the adoption of International financial Reporting Standards.F
or p
erso
nal u
se o
nly
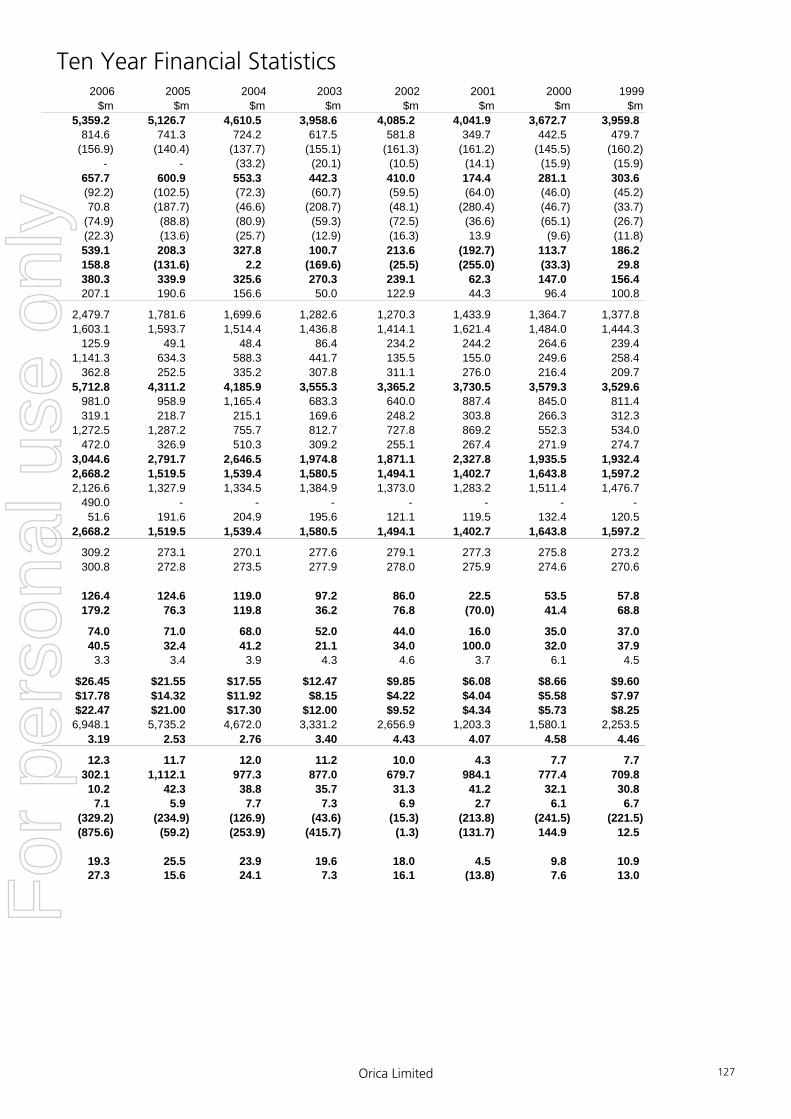
Ten Year Financial Statistics
Orica Limited 127
2006 2005 2004 2003 2002 2001 2000 1999$m $m $m $m $m $m $m $m
5,359.2 5,126.7 4,610.5 3,958.6 4,085.2 4,041.9 3,672.7 3,959.8814.6 741.3 724.2 617.5 581.8 349.7 442.5 479.7
(156.9) (140.4) (137.7) (155.1) (161.3) (161.2) (145.5) (160.2) - - (33.2) (20.1) (10.5) (14.1) (15.9) (15.9)
657.7 600.9 553.3 442.3 410.0 174.4 281.1 303.6(92.2) (102.5) (72.3) (60.7) (59.5) (64.0) (46.0) (45.2)70.8 (187.7) (46.6) (208.7) (48.1) (280.4) (46.7) (33.7)
(74.9) (88.8) (80.9) (59.3) (72.5) (36.6) (65.1) (26.7)(22.3) (13.6) (25.7) (12.9) (16.3) 13.9 (9.6) (11.8)539.1 208.3 327.8 100.7 213.6 (192.7) 113.7 186.2158.8 (131.6) 2.2 (169.6) (25.5) (255.0) (33.3) 29.8380.3 339.9 325.6 270.3 239.1 62.3 147.0 156.4207.1 190.6 156.6 50.0 122.9 44.3 96.4 100.8
2,479.7 1,781.6 1,699.6 1,282.6 1,270.3 1,433.9 1,364.7 1,377.81,603.1 1,593.7 1,514.4 1,436.8 1,414.1 1,621.4 1,484.0 1,444.3
125.9 49.1 48.4 86.4 234.2 244.2 264.6 239.41,141.3 634.3 588.3 441.7 135.5 155.0 249.6 258.4
362.8 252.5 335.2 307.8 311.1 276.0 216.4 209.75,712.8 4,311.2 4,185.9 3,555.3 3,365.2 3,730.5 3,579.3 3,529.6
981.0 958.9 1,165.4 683.3 640.0 887.4 845.0 811.4319.1 218.7 215.1 169.6 248.2 303.8 266.3 312.3
1,272.5 1,287.2 755.7 812.7 727.8 869.2 552.3 534.0472.0 326.9 510.3 309.2 255.1 267.4 271.9 274.7
3,044.6 2,791.7 2,646.5 1,974.8 1,871.1 2,327.8 1,935.5 1,932.42,668.2 1,519.5 1,539.4 1,580.5 1,494.1 1,402.7 1,643.8 1,597.22,126.6 1,327.9 1,334.5 1,384.9 1,373.0 1,283.2 1,511.4 1,476.7
490.0 - - - - - - - 51.6 191.6 204.9 195.6 121.1 119.5 132.4 120.5
2,668.2 1,519.5 1,539.4 1,580.5 1,494.1 1,402.7 1,643.8 1,597.2
309.2 273.1 270.1 277.6 279.1 277.3 275.8 273.2300.8 272.8 273.5 277.9 278.0 275.9 274.6 270.6
126.4 124.6 119.0 97.2 86.0 22.5 53.5 57.8179.2 76.3 119.8 36.2 76.8 (70.0) 41.4 68.8
74.0 71.0 68.0 52.0 44.0 16.0 35.0 37.040.5 32.4 41.2 21.1 34.0 100.0 32.0 37.9
3.3 3.4 3.9 4.3 4.6 3.7 6.1 4.5
$26.45 $21.55 $17.55 $12.47 $9.85 $6.08 $8.66 $9.60$17.78 $14.32 $11.92 $8.15 $4.22 $4.04 $5.58 $7.97$22.47 $21.00 $17.30 $12.00 $9.52 $4.34 $5.73 $8.256,948.1 5,735.2 4,672.0 3,331.2 2,656.9 1,203.3 1,580.1 2,253.5
3.19 2.53 2.76 3.40 4.43 4.07 4.58 4.46
12.3 11.7 12.0 11.2 10.0 4.3 7.7 7.7302.1 1,112.1 977.3 877.0 679.7 984.1 777.4 709.810.2 42.3 38.8 35.7 31.3 41.2 32.1 30.87.1 5.9 7.7 7.3 6.9 2.7 6.1 6.7
(329.2) (234.9) (126.9) (43.6) (15.3) (213.8) (241.5) (221.5)(875.6) (59.2) (253.9) (415.7) (1.3) (131.7) 144.9 12.5
19.3 25.5 23.9 19.6 18.0 4.5 9.8 10.927.3 15.6 24.1 7.3 16.1 (13.8) 7.6 13.0
For
per
sona
l use
onl
y
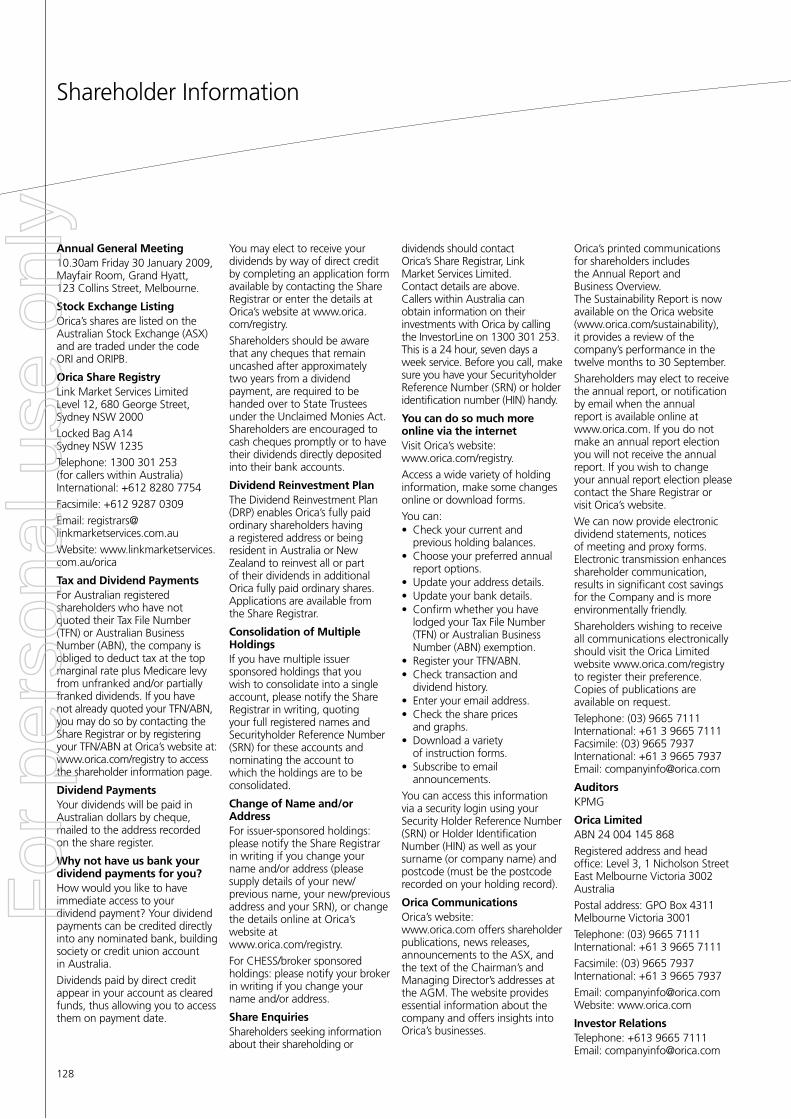
128
Shareholder InformationShareholder Information
Annual General Meeting10.30am Friday 30 January 2009, Mayfair Room, Grand Hyatt, 123 Collins Street, Melbourne.
Stock Exchange listingOrica’s shares are listed on the Australian Stock Exchange (ASX) and are traded under the code ORI and ORIPB.
Orica Share RegistryLink Market Services Limited Level 12, 680 George Street, Sydney NSW 2000
Locked Bag A14 Sydney NSW 1235
Telephone: 1300 301 253 (for callers within Australia) International: +612 8280 7754
Facsimile: +612 9287 0309
Email: [email protected]
Website: www.linkmarketservices.com.au/orica
Tax and Dividend PaymentsFor Australian registered shareholders who have not quoted their Tax File Number (TFN) or Australian Business Number (ABN), the company is obliged to deduct tax at the top marginal rate plus Medicare levy from unfranked and/or partially franked dividends. If you have not already quoted your TFN/ABN, you may do so by contacting the Share Registrar or by registering your TFN/ABN at Orica’s website at: www.orica.com/registry to access the shareholder information page.
Dividend PaymentsYour dividends will be paid in Australian dollars by cheque, mailed to the address recorded on the share register.
Why not have us bank your dividend payments for you?How would you like to have immediate access to your dividend payment? Your dividend payments can be credited directly into any nominated bank, building society or credit union account in Australia.
Dividends paid by direct credit appear in your account as cleared funds, thus allowing you to access them on payment date.
You may elect to receive your dividends by way of direct credit by completing an application form available by contacting the Share Registrar or enter the details at Orica’s website at www.orica.com/registry.
Shareholders should be aware that any cheques that remain uncashed after approximately two years from a dividend payment, are required to be handed over to State Trustees under the Unclaimed Monies Act. Shareholders are encouraged to cash cheques promptly or to have their dividends directly deposited into their bank accounts.
Dividend Reinvestment PlanThe Dividend Reinvestment Plan (DRP) enables Orica’s fully paid ordinary shareholders having a registered address or being resident in Australia or New Zealand to reinvest all or part of their dividends in additional Orica fully paid ordinary shares. Applications are available from the Share Registrar.
Consolidation of Multiple HoldingsIf you have multiple issuer sponsored holdings that you wish to consolidate into a single account, please notify the Share Registrar in writing, quoting your full registered names and Securityholder Reference Number (SRN) for these accounts and nominating the account to which the holdings are to be consolidated.
Change of Name and/or AddressFor issuer-sponsored holdings: please notify the Share Registrar in writing if you change your name and/or address (please supply details of your new/previous name, your new/previous address and your SRN), or change the details online at Orica’s website at www.orica.com/registry.
For CHESS/broker sponsored holdings: please notify your broker in writing if you change your name and/or address.
Share EnquiriesShareholders seeking information about their shareholding or
dividends should contact Orica’s Share Registrar, Link Market Services Limited. Contact details are above. Callers within Australia can obtain information on their investments with Orica by calling the InvestorLine on 1300 301 253. This is a 24 hour, seven days a week service. Before you call, make sure you have your Securityholder Reference Number (SRN) or holder identification number (HIN) handy.
You can do so much more online via the internetVisit Orica’s website: www.orica.com/registry.
Access a wide variety of holding information, make some changes online or download forms.
You can:• Check your current and
previous holding balances.• Choose your preferred annual
report options.• Update your address details.• Update your bank details.• Confirm whether you have
lodged your Tax File Number (TFN) or Australian Business Number (ABN) exemption.
• Register your TFN/ABN.• Check transaction and
dividend history.• Enter your email address.• Check the share prices
and graphs.• Download a variety
of instruction forms.• Subscribe to email
announcements.
You can access this information via a security login using your Security Holder Reference Number (SRN) or Holder Identification Number (HIN) as well as your surname (or company name) and postcode (must be the postcode recorded on your holding record).
Orica CommunicationsOrica’s website: www.orica.com offers shareholder publications, news releases, announcements to the ASX, and the text of the Chairman’s and Managing Director’s addresses at the AGM. The website provides essential information about the company and offers insights into Orica’s businesses.
Orica’s printed communications for shareholders includes the Annual Report and Business Overview. The Sustainability Report is now available on the Orica website (www.orica.com/sustainability), it provides a review of the company’s performance in the twelve months to 30 September.
Shareholders may elect to receive the annual report, or notification by email when the annual report is available online at www.orica.com. If you do not make an annual report election you will not receive the annual report. If you wish to change your annual report election please contact the Share Registrar or visit Orica’s website.
We can now provide electronic dividend statements, notices of meeting and proxy forms. Electronic transmission enhances shareholder communication, results in significant cost savings for the Company and is more environmentally friendly.
Shareholders wishing to receive all communications electronically should visit the Orica Limited website www.orica.com/registry to register their preference. Copies of publications are available on request.
Telephone: (03) 9665 7111 International: +61 3 9665 7111 Facsimile: (03) 9665 7937 International: +61 3 9665 7937 Email: [email protected]
AuditorsKPMG
Orica limitedABN 24 004 145 868
Registered address and head office: Level 3, 1 Nicholson Street East Melbourne Victoria 3002 Australia
Postal address: GPO Box 4311 Melbourne Victoria 3001
Telephone: (03) 9665 7111 International: +61 3 9665 7111
Facsimile: (03) 9665 7937 International: +61 3 9665 7937
Email: [email protected] Website: www.orica.com
Investor RelationsTelephone: +613 9665 7111 Email: [email protected]
For
per
sona
l use
onl
y
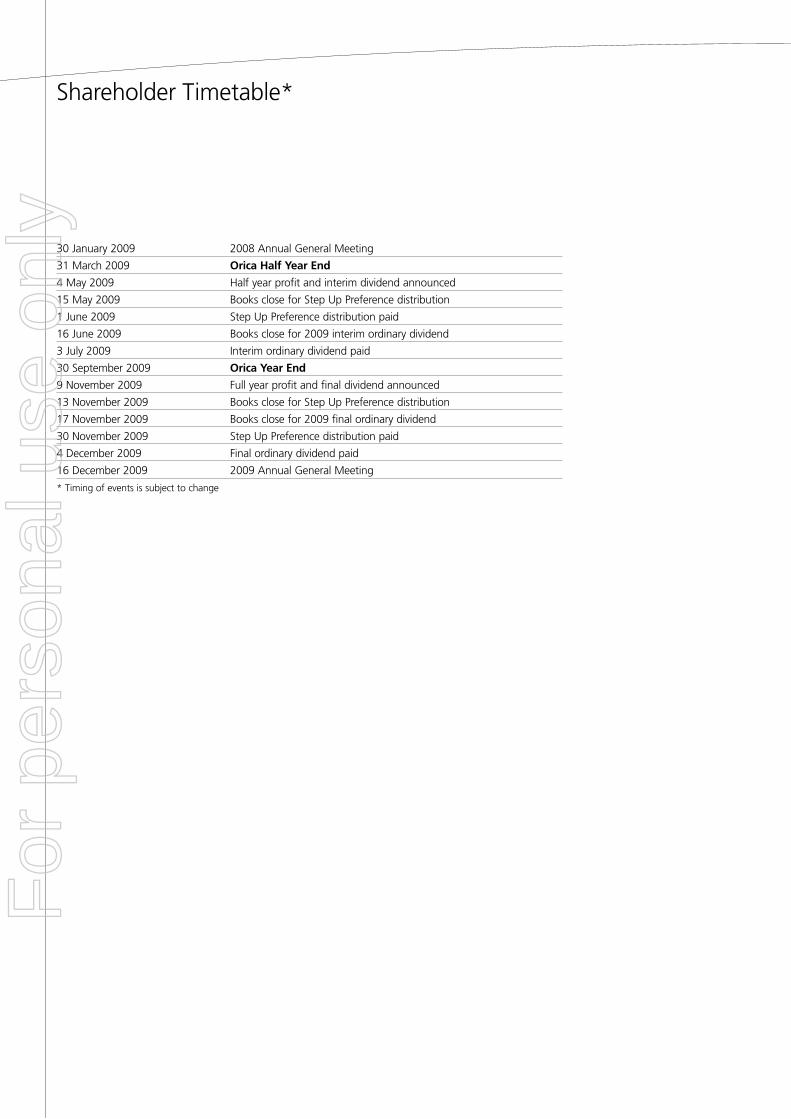
129
Shareholder Timetable*
30 January 2009 2008 Annual General Meeting
31 March 2009 Orica Half Year End
4 May 2009 Half year profit and interim dividend announced
15 May 2009 Books close for Step Up Preference distribution
1 June 2009 Step Up Preference distribution paid
16 June 2009 Books close for 2009 interim ordinary dividend
3 July 2009 Interim ordinary dividend paid
30 September 2009 Orica Year End
9 November 2009 Full year profit and final dividend announced
13 November 2009 Books close for Step Up Preference distribution
17 November 2009 Books close for 2009 final ordinary dividend
30 November 2009 Step Up Preference distribution paid
4 December 2009 Final ordinary dividend paid
16 December 2009 2009 Annual General Meeting
* Timing of events is subject to change
For
per
sona
l use
onl
y
Orica Limited
ABN 24 004 145 868
Registered address and head-office:
Level 3, 1 Nicholson Street
East Melbourne Victoria 3002
Australia
Postal address:
GPO Box 4311
Melbourne Victoria 3001
Telephone: +613 9665 7111
Facsimile: +613 9665 7937
Email: [email protected]
Website: www.orica.com
We are committed to keeping all our
shareholders well-informed and regularly
update our website at orica.com with:
• Orica Share Price – updated every 15 minutes
• ASX Releases• Investor presentations• Financial performance• Half-yearly and annual
results webcasts• Annual Reports
• Sustainability strategy
For
per
sona
l use
onl
y