Embed Size (px)
Citation preview

Peter Bradford, Managing Director and CEO
INDEPENDENCE GROUP NLAustralian Nickel Conference 2018
23 October 2018ASX:IGO / ADR:IIDY
1
For
per
sona
l use
onl
y

Cautionary Statements & Disclaimer
2
• This presentation has been prepared by Independence Group NL (“IGO”) (ABN 46 092 786 304). It should not be considered as an offer or invitation to subscribe for or purchase any securities in IGO or as aninducement to make an offer or invitation with respect to those securities in any jurisdiction.
• This presentation contains general summary information about IGO. The information, opinions or conclusions expressed in the course of this presentation should be read in conjunction with IGO’s other periodicand continuous disclosure announcements lodged with the ASX, which are available on the IGO website. No representation or warranty, express or implied, is made in relation to the fairness, accuracy orcompleteness of the information, opinions and conclusions expressed in this presentation.
• This presentation includes forward looking information regarding future events, conditions, circumstances and the future financial performance of IGO. Often, but not always, forward looking statements can beidentified by the use of forward looking words such as "may", "will", "expect", "intend", "plan", "estimate", "anticipate", "continue" and "guidance", or other similar words and may include statements regardingplans, strategies and objectives of management, anticipated production or construction commencement dates and expected costs or production outputs. Such forecasts, projections and information are not aguarantee of future performance and involve unknown risks and uncertainties, many of which are beyond IGO’s control, which may cause actual results and developments to differ materially from thoseexpressed or implied. Further details of these risks are set out below. All references to future production and production guidance made in relation to IGO are subject to the completion of all necessary feasibilitystudies, permit applications and approvals, construction, financing arrangements and access to the necessary infrastructure. Where such a reference is made, it should be read subject to this paragraph and inconjunction with further information about the Mineral Resources and Ore Reserves, as well as any Competent Persons' Statements included in periodic and continuous disclosure announcements lodged withthe ASX. Forward looking statements in this presentation only apply at the date of issue. Subject to any continuing obligations under applicable law or any relevant stock exchange listing rules, in providing thisinformation IGO does not undertake any obligation to publicly update or revise any of the forward looking statements or to advise of any change in events, conditions or circumstances on which any suchstatement is based.
• There are a number of risks specific to IGO and of a general nature which may affect the future operating and financial performance of IGO and the value of an investment in IGO including and not limited toeconomic conditions, stock market fluctuations, commodity demand and price movements, access to infrastructure, timing of environmental approvals, regulatory risks, operational risks, reliance on keypersonnel, reserve and resource estimations, native title and title risks, foreign currency fluctuations and mining development, construction and commissioning risk. The production guidance in this presentationis subject to risks specific to IGO and of a general nature which may affect the future operating and financial performance of IGO.
• Any references to IGO Mineral Resource and Ore Reserve estimates should be read in conjunction with IGO’s 2018 Mineral Resource and Ore Reserve announcement dated 26 July 2018 and lodged with theASX for which Competent Person’s consents were obtained, which is available on the IGO website. The Competent Person’s consents remain in place for subsequent releases by the Company of the sameinformation in the same form and context, until the consent is withdrawn or replaced by a subsequent report and accompanying consent.
• The information in this presentation that relates to Exploration Results is extracted from the ASX announcement released 26 July 2018 entitled “Lake Mackay JV – Exploration Update” for which CompetentPerson’s consents were obtained. The Competent Person’s consents remain in place for subsequent releases by the Company of the same information in the same form and context, until the consent iswithdrawn or replaced by a subsequent report and accompanying consent.
• The Company confirms that it is not aware of any new information or data that materially affects the information included in the original ASX announcements released on 26 July 2018 and, in the case ofestimates or Mineral Resources or Ore Reserves, that all material assumptions and technical parameters underpinning the estimates in the original ASX announcement continue to apply and have notmaterially changed. The Company confirms that the form and context in which the Competent Person’s findings are presented have not been materially modified from the original ASX announcement.
• All currency amounts in Australian Dollars unless otherwise noted.• Net Debt is outstanding debt less cash balances.• Cash Costs are reported inclusive of Royalties and after by-product credits on per unit of payable metal basis, unless otherwise stated.• IGO reports All-in Sustaining Costs (AISC) per ounce of gold for its 30% interest in the Tropicana Gold Mine using the World Gold Council guidelines for AISC. The World Gold Council guidelines publication
was released via press release on 27 June 2013 and is available from the World Gold Council’s website.• Underlying EBITDA is a non-IFRS measure and comprises net profit or loss after tax, adjusted to exclude tax expense, finance costs, interest income, asset impairments, gain on sale of subsidiary,
redundancy and restructuring costs, depreciation and amortisation, and once-off transaction costs.• Free Cash Flow comprises Net Cash Flow from Operating Activities and Net Cash Flow from Investing Activities. Underlying adjustments exclude acquisition costs, proceeds from investment sales and
payments for investments.
For
per
sona
l use
onl
y

3
Talking Points:• Making a Difference – the IGO Way• People and approach to ESG• Reshaped portfolio: high quality Nova
& Tropicana • Our vision for the future and our
strategic focus on minerals critical to energy storage─ Renewable energy
─ Nova downstream processing to produce nickel & cobalt sulphates
─ Exploration to unlock discovery potential from portfolio of belt scale projects with Fraser Range focus
For
per
sona
l use
onl
y

For
per
sona
l use
onl
y

5
PeopleF
or p
erso
nal u
se o
nly
6
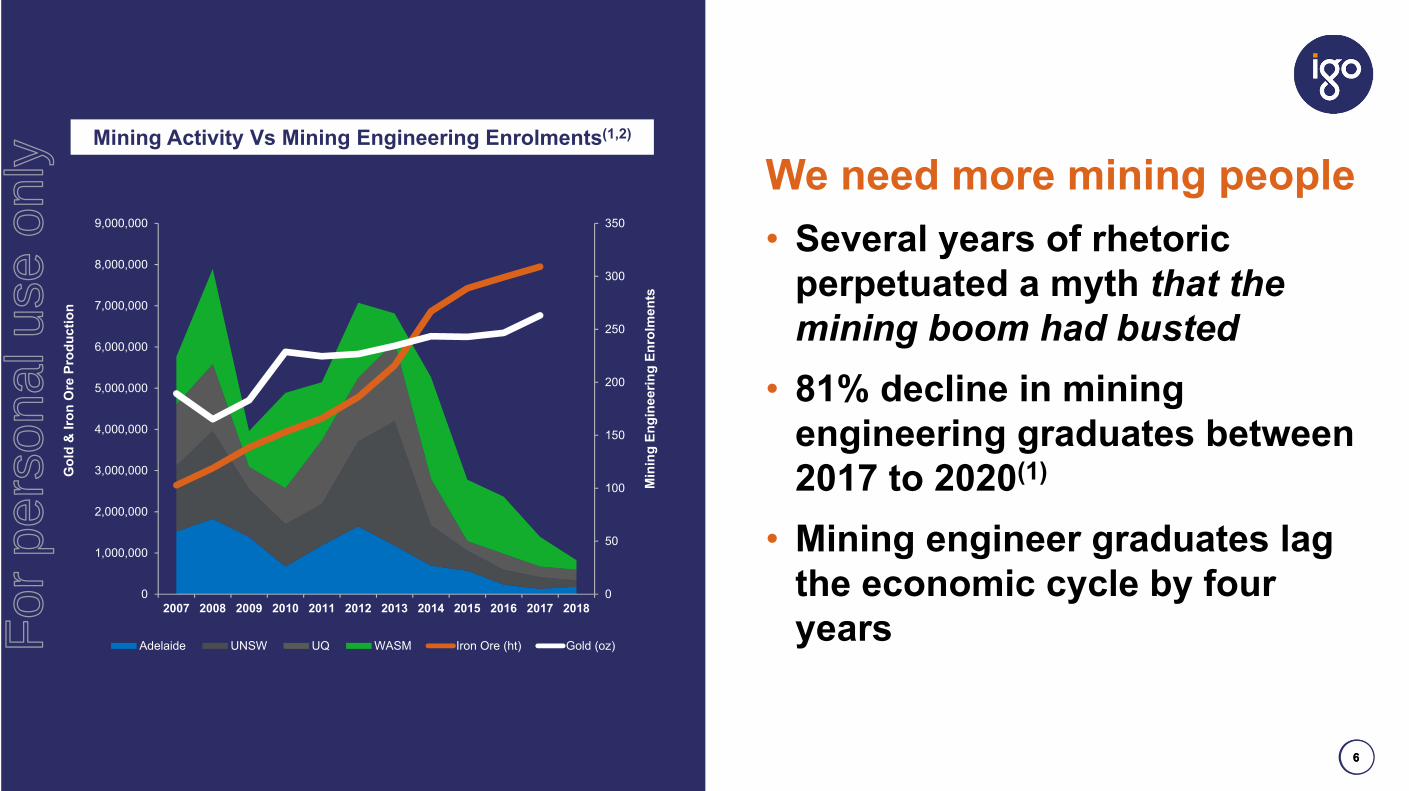
We need more mining people• Several years of rhetoric
perpetuated a myth that the mining boom had busted
• 81% decline in mining engineering graduates between 2017 to 2020(1)
• Mining engineer graduates lag the economic cycle by four years
6
0
1,000,000
2,000,000
3,000,000
4,000,000
5,000,000
6,000,000
7,000,000
8,000,000
9,000,000
2007 2008 2009 2010 2011 2012 2013 2014 2015 2016 2017 20180
50
100
150
200
250
300
350
Gol
d &
Iron
Ore
Pro
duct
ion
Min
ing
Engi
neer
ing
Enro
lmen
tsAdelaide UNSW UQ WASM Iron Ore (ht) Gold (oz)
Mining Activity Vs Mining Engineering Enrolments(1,2)
1) Minerals Council of Australia2) WA Department of Mines, Industry Regulation and Safety
For
per
sona
l use
onl
y

7
There is a need for greater conversation about how we attract new entrants to the industry• Role for individual
companies, industry associations, government
• Increase awareness and interest in mining at the high school level
• Change perceptions of miningFor
per
sona
l use
onl
y

8
Part of the IGO Difference is our focus on people• Strong sense of purpose• Empowered people who act
like owners of the business, and are owners of the business, and want to make a difference
• Focus on diversity because it is the right thing to do
88
For
per
sona
l use
onl
y

Safety & Sustainability
9
1) 12 month moving average MTIFR – Medically Treated Injury Frequency Rate: calculated as the number of medically treated injuries x 1,000,000 divided by the total number of hours worked
2) 12 month moving average LTIFR – Lost Time Injury Frequency Rate: calculated as the number of Lost Time injuries x 1,000,000 divided by the total number of hours worked
3) VSLI: Visual Safety Leadership Interaction4) Jun-18 LTIFR rate has increased from 1.96 to 2.39 as a result of the reclassification of a single injury from the June
2018 Quarter5) Australian Council of Superannuation Investors (ACSI)
Key Lag Safety Metrics(1,2,4)
Key Lead Safety Metrics(3)
2018 ACSI Rating of ASX200 Sustainability Reporting(5)
Leading
Detailed
Moderate
Basic
No Reporting
SectorAverage
SectorLeader
ASX 200Average
“Leading” rating each of the last three years
‐
0.5
1.0
1.5
2.0
2.5
VSLI Index Hazard Index Near Miss Index Workplace Inspection Index
0.0
1.0
2.0
3.0
4.0
5.0
6.0
7.0
8.0
Sep‐15 Dec‐15 Mar‐16 Jun‐16 Sep‐16 Dec‐16 Mar‐17 Jun‐17 Sep‐17 Dec‐17 Mar‐18 Jun‐18 Sep‐18
LTIFR 12 MMA MTIFR 12 MMA
For
per
sona
l use
onl
y

10Reshaped Portfolio
For
per
sona
l use
onl
y
‐
2.00
4.00
6.00
8.00
10.00
12.00
14.00
‐
1.00
2.00
3.00
4.00
5.00
6.00
Oct‐17
Nov‐17
Dec‐17
Jan‐18
Feb‐18
Mar‐18
Apr‐18
May‐18
Jun‐18
Jul‐1
8
Aug‐18
Sep‐18
Oct‐18
Volume (M)A$/share
11
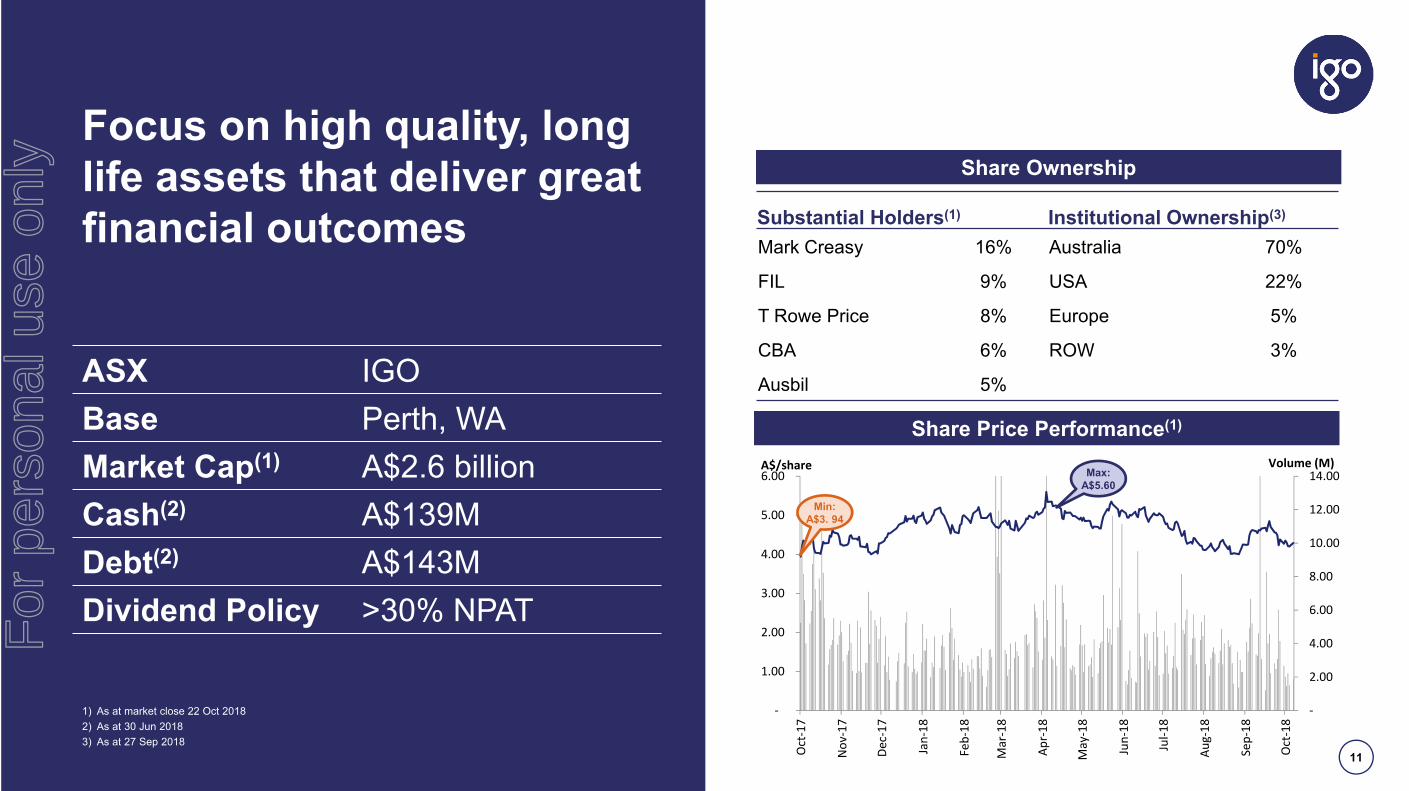
ASX IGOBase Perth, WAMarket Cap(1) A$2.6 billionCash(2) A$139MDebt(2) A$143MDividend Policy >30% NPAT
Focus on high quality, long life assets that deliver great financial outcomes
1) As at market close 22 Oct 20182) As at 30 Jun 20183) As at 27 Sep 2018
Share Price Performance(1)Share Price Performance(1)
Share OwnershipShare Ownership
Substantial Holders(1) Institutional Ownership(3)
Mark Creasy 16% Australia 70%
FIL 9% USA 22%
T Rowe Price 8% Europe 5%
CBA 6% ROW 3%
Ausbil 5%
Min: A$3. 94
Max: A$5.60
For
per
sona
l use
onl
y

121) Macquarie Research – 29 Aug 2018
IGO EBITDA Profile (A$M)(1)
Future portfolio to focus on minerals critical to energy storage
-
100
200
300
400
500
600
FY12 FY13 FY14 FY15 FY16 FY17 FY18 FY19E FY20E FY21E
Long (A$M) Jaguar (A$M) Tropicana (A$M) Nova (A$M)
For
per
sona
l use
onl
y

13Tropicana
13
For
per
sona
l use
onl
y

0
200
400
600
800
1,000
1,200
0
100,000
200,000
300,000
400,000
500,000
600,000
FY14 FY15 FY16 FY17 FY18 FY19E
Gold Production (oz) AISC (A$/oz)
14
Tropicana• 30% IGO & 70% AngloGold
Ashanti (managers)• 330km NE of Kalgoorlie• Higher gold production and
lower costs expected in FY19• ~8.0 Mtpa of ore mined and
processed• ~10 year mine life remaining• Upside potential
Tropicana Production (100%) & AISC
1) Refer to IGO annual reports for FY14 to FY182) FY19E is the midpoint of guidance for FY19. Refer ASX Release dated 29 July 2018 – Guidance Range of
500,000 to 550,000oz gold production at AISC of A$890/oz to A$980/oz gold sold
Gold production (oz) AISC (A$/oz)
For
per
sona
l use
onl
y

15
Tropicana value drivers• Grade streaming drives FY19-
FY20 gold production and costs• Long Island underpins mine life• Additional ball mill delivers
higher throughput rate and improved gold recovery─ Commissioning by end CY18
• Boston Shaker Underground Pre-feasibility study nearing completion
6MW Ball Mill
For
per
sona
l use
onl
y

16Nova
For
per
sona
l use
onl
y
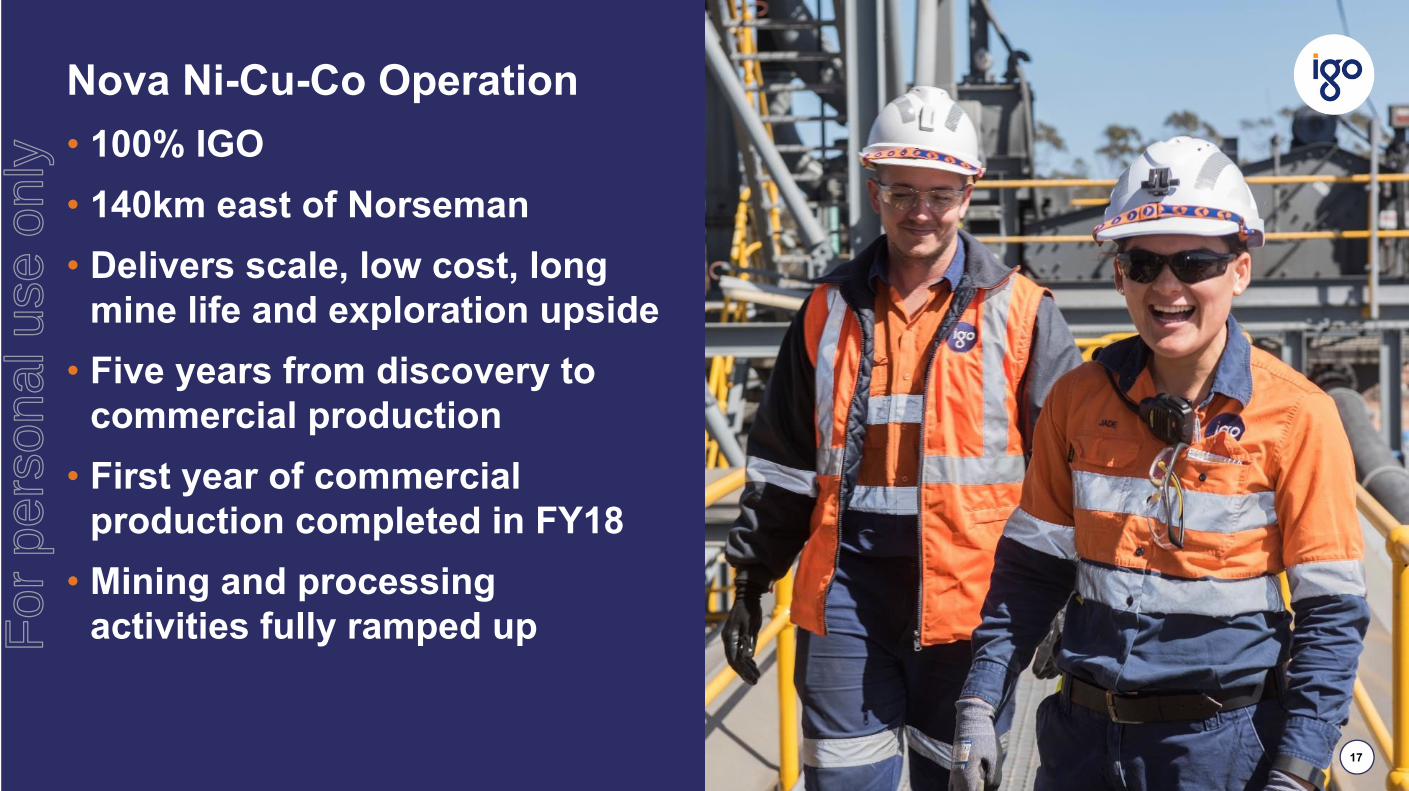
17
Nova Ni-Cu-Co Operation• 100% IGO• 140km east of Norseman• Delivers scale, low cost, long
mine life and exploration upside• Five years from discovery to
commercial production• First year of commercial
production completed in FY18• Mining and processing
activities fully ramped upFor
per
sona
l use
onl
y
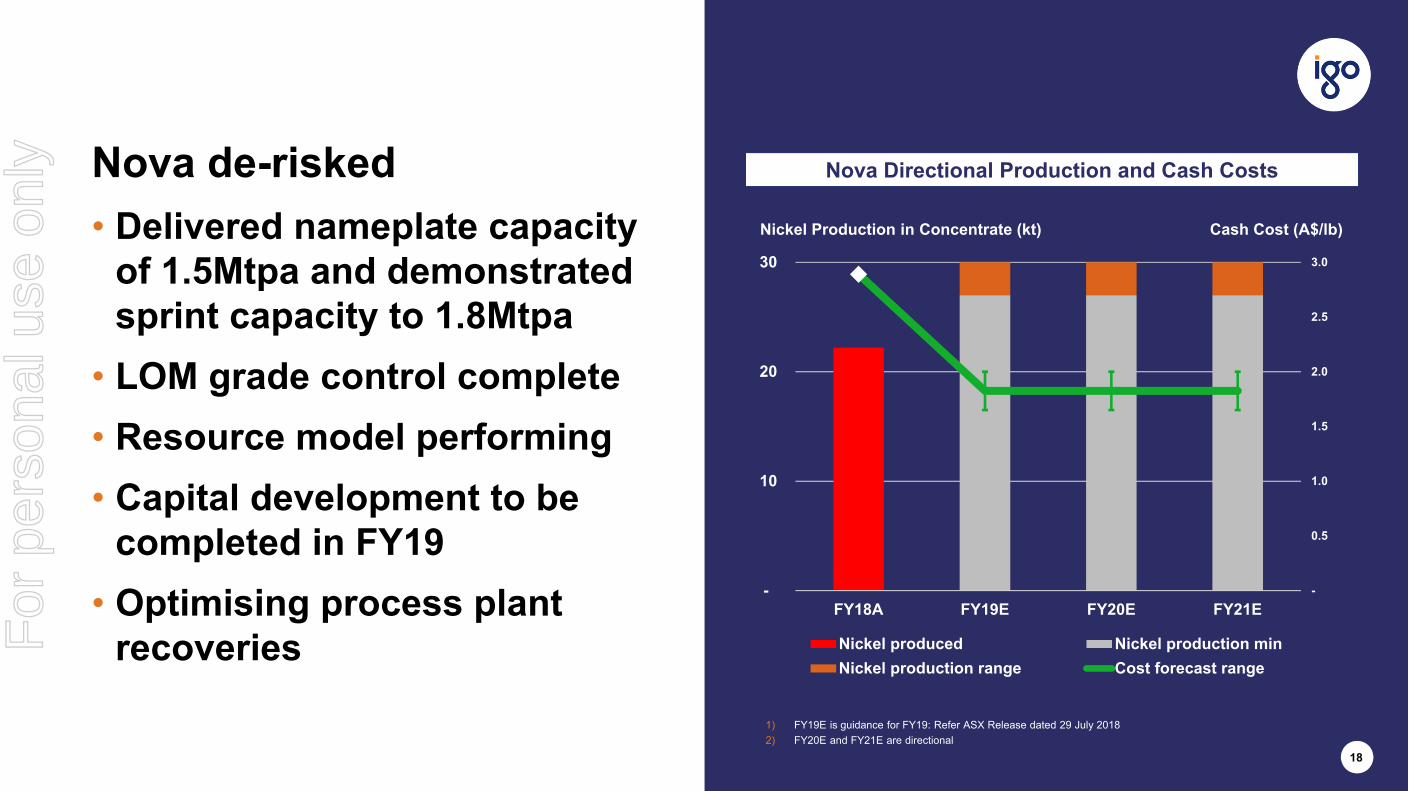
18
1) FY19E is guidance for FY19: Refer ASX Release dated 29 July 20182) FY20E and FY21E are directional
-
0.5
1.0
1.5
2.0
2.5
3.0
-
10
20
30
FY18A FY19E FY20E FY21E
Nickel produced Nickel production minNickel production range Cost forecast range
Nickel Production in Concentrate (kt) Cash Cost (A$/lb)
Nova Directional Production and Cash CostsNova de-risked• Delivered nameplate capacity
of 1.5Mtpa and demonstrated sprint capacity to 1.8Mtpa
• LOM grade control complete• Resource model performing• Capital development to be
completed in FY19• Optimising process plant
recoveriesFor
per
sona
l use
onl
y

19
Nova Underground Mine Design & DrillingF
or p
erso
nal u
se o
nly

20Our Vision For The Future
For
per
sona
l use
onl
y

Future success for IGO
21
Globally relevant supplier of metals that are critical to the energy storage industry
Globally Relevant
Vertical integration to produce battery grade nickel and cobalt sulphate and cathode precursors
Vertically Integrated
Quality products manufactured safely and ethically with minimum environmental impact in a tier 1 jurisdiction
Quality Focused
Proactive adoption of renewables, energy storage and EV mining equipment to reduce carbon footprint
Proactively GreenFor
per
sona
l use
onl
y

22
Nova Solar Farm• Agreement with Zenith Energy to
build 12.5GWh solar farm• First fully integrated commercial
hybrid diesel/Solar PV facility in Australia
• Includes state-of-the-art PV modules, single axis tracking, inverters, communications and control system technology
• Commissioning expected first quarter of FY20
1) Photo showing Arctech Solar Arctracker Pro application in Namibia
For
per
sona
l use
onl
y

23
Nickel sulphate hexahydrate crystals produced from Nova nickel concentrate• Demonstrated technical
feasibility of process route• Pre-feasibility underway • Delivers multiple benefits:
─ Increase in payable metal─ Increased concentrator recovery─ Higher price for nickel as nickel
sulphate─ Directly links IGO to EV market
For
per
sona
l use
onl
y

24
DiscoveryF
or p
erso
nal u
se o
nly
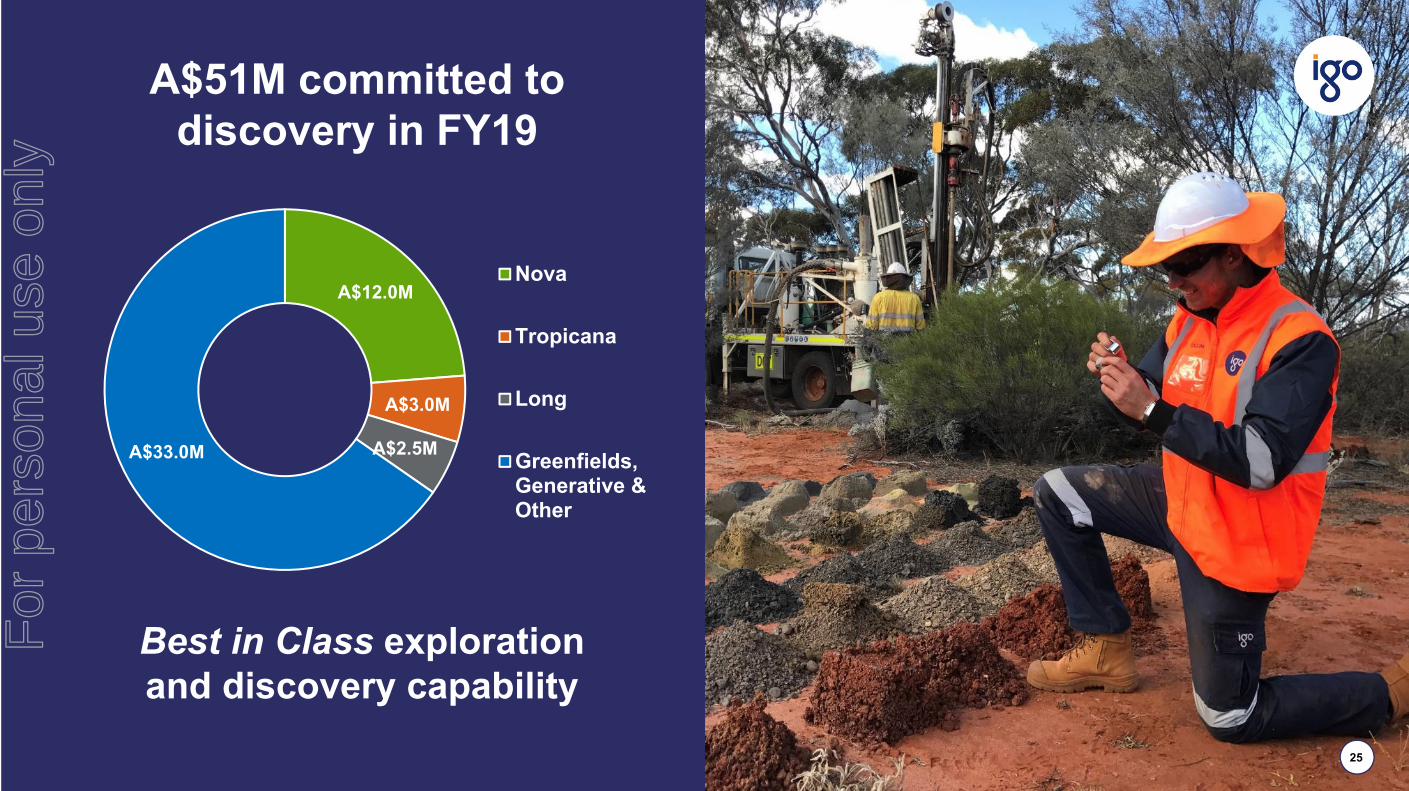
25
A$51M committed to discovery in FY19
A$12.0M
A$3.0M
A$2.5MA$33.0M
Nova
Tropicana
Long
Greenfields,Generative &Other
Best in Class exploration and discovery capability
For
per
sona
l use
onl
y
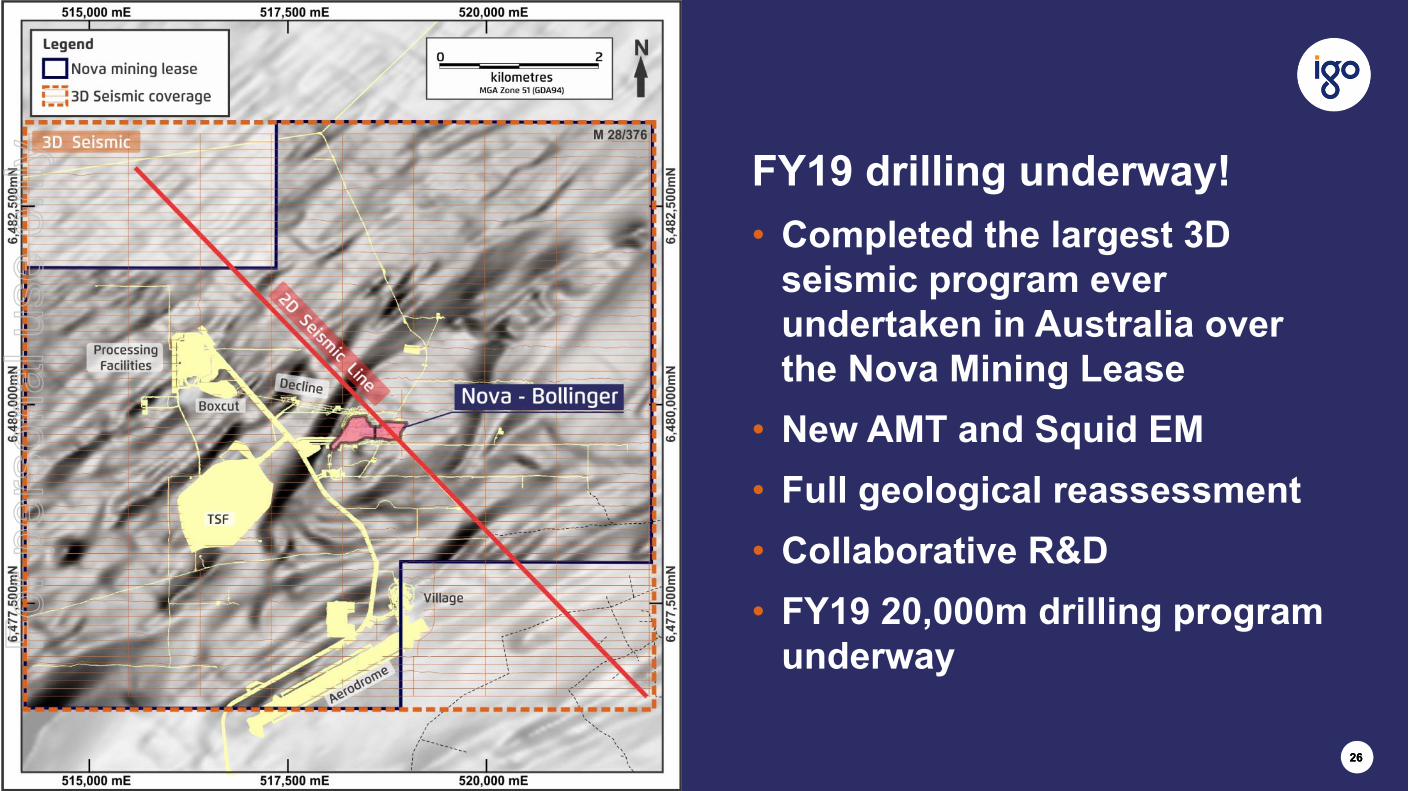
26
FY19 drilling underway!• Completed the largest 3D
seismic program ever undertaken in Australia over the Nova Mining Lease
• New AMT and Squid EM• Full geological reassessment• Collaborative R&D• FY19 20,000m drilling program
underway
26
For
per
sona
l use
onl
y

27
1) Classic Minerals ASX Releases: 29 Aug 2013, 12 Dec 2013 and 17 Dec 20162) Sirius Resources ASX Release: June 2015 Quarterly3) Enterprise Metals EIS Final Drilling Report to DMP: 25 Jul 20144) Orion Gold ASX Release 17 Mar 20145) Legend Mining ASX Release 6 Jun 20176) Buxton Resources ASX Release: 15 Dec 20147) Newmont report to DMP, 19688) Arrow Minerals ASX Release: 5 Feb 2018
September 2015
Empirical evidence demonstrates belt is fertile
Why explore the Fraser Range?• Multiple magmatic intrusions• Ni/Cu anomalism reported by
multiple explorers along belt• Disseminated and blebby sulphides
For
per
sona
l use
onl
y

February 2018
1) www.dmirs.wa.gov.au Online Catalogue
Systematic exploration over ~15,000km2 of consolidated tenure• Multiple EM platforms• Bedrock geochem using Aircore• Gravity survey & mapping• Progressively drilling targets while
continuing regional exploration
28
October 2018
Creasy Silver Knight(1) discovery demonstrates potential of belt
For
per
sona
l use
onl
y
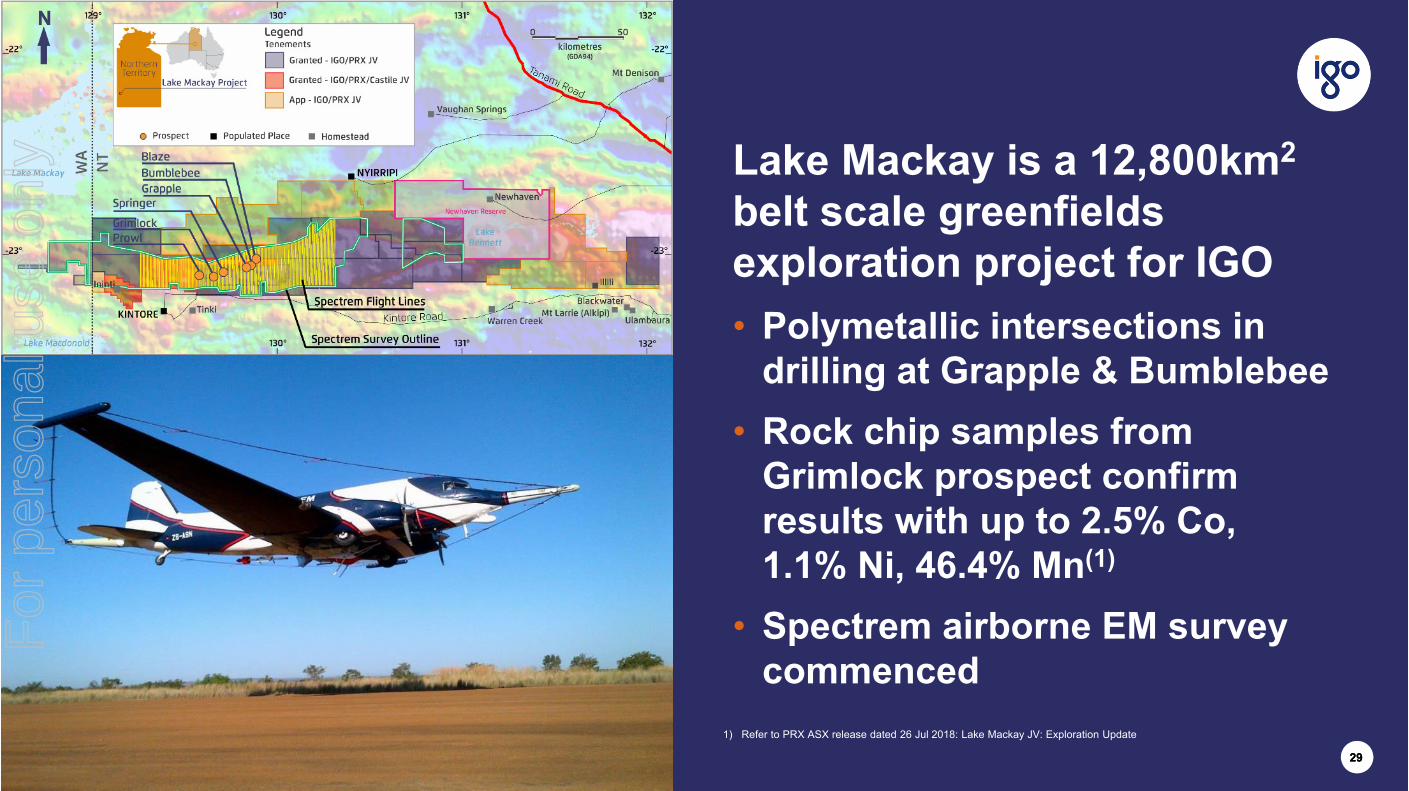
2929
Lake Mackay is a 12,800km2
belt scale greenfieldsexploration project for IGO• Polymetallic intersections in
drilling at Grapple & Bumblebee• Rock chip samples from
Grimlock prospect confirm results with up to 2.5% Co, 1.1% Ni, 46.4% Mn(1)
• Spectrem airborne EM survey commenced
1) Refer to PRX ASX release dated 26 Jul 2018: Lake Mackay JV: Exploration Update
For
per
sona
l use
onl
y

30
To conclude:• IGO is founded on people with
passion and a strong sense of purpose
• Demonstrated track record in exploration, development and operating capability
• World-class assets at Nova and Tropicana delivering a strong balance sheet and free cashflow
• Poised for transformational growth through discovery and downstream processing
For
per
sona
l use
onl
y
For
per
sona
l use
onl
y