Embed Size (px)
Citation preview

Aristocrat Leisure Limited abn 44 002 818 368
Building A, Pinnacle Office Park, 85 Epping Road, North Ryde NSW 2113 PO Box 361, North Ryde BC NSW 1670, Australia
Telephone +61 2 9013 6000 fax +61 2 9013 6200 web www.aristocrat.com
30 November 2017 Company Announcements Office Australian Securities Exchange Limited Exchange Centre 20 Bridge Street Sydney NSW 2000
Aristocrat Leisure Limited Formatting Error – Revised FY2017 Results Announcement Aristocrat Leisure Limited (the “Company”) refers to its earlier announcement (“FY2017 Results Announcement”) which contained a minor formatting error on page 7 of the notes to the Financial Statements which resulted in certain figures in Note 1-1(b) Segment results not being visible. The attached Revised FY2017 Results Announcement corrects this minor formatting error.
Yours sincerely A Korsanos Chief Financial Officer & Company Secretary
For
per
sona
l use
onl
y

ARISTOCRAT LEISURE LIMITED ABN 44 002 818 368
2017 PROFIT ANNOUNCEMENT
RESULTS TO BE RELEASED TO THE MARKET
ANNUAL INFORMATION GIVEN TO THE ASX
UNDER LISTING RULE 4.3A
ARISTOCRAT LEISURE LIMITED
BUILDING A PINNACLE OFFICE PARK
85 EPPING ROAD
NORTH RYDE NSW 2113
For
per
sona
l use
onl
y

2017 PROFIT ANNOUNCEMENT CONTENTS
Appendix 4E - Results for announcement to the market
2017 Financial Statements
- Statement of profit or loss and other comprehensive income- Balance sheet- Statement of changes in equity- Cash flow statement- Notes to the financial statements
Directors’ Declaration
Auditor's Independence Declaration
Directors' Report
- Operating and Financial Review- Remuneration Report
Independent Auditor's Report
For
per
sona
l use
onl
y
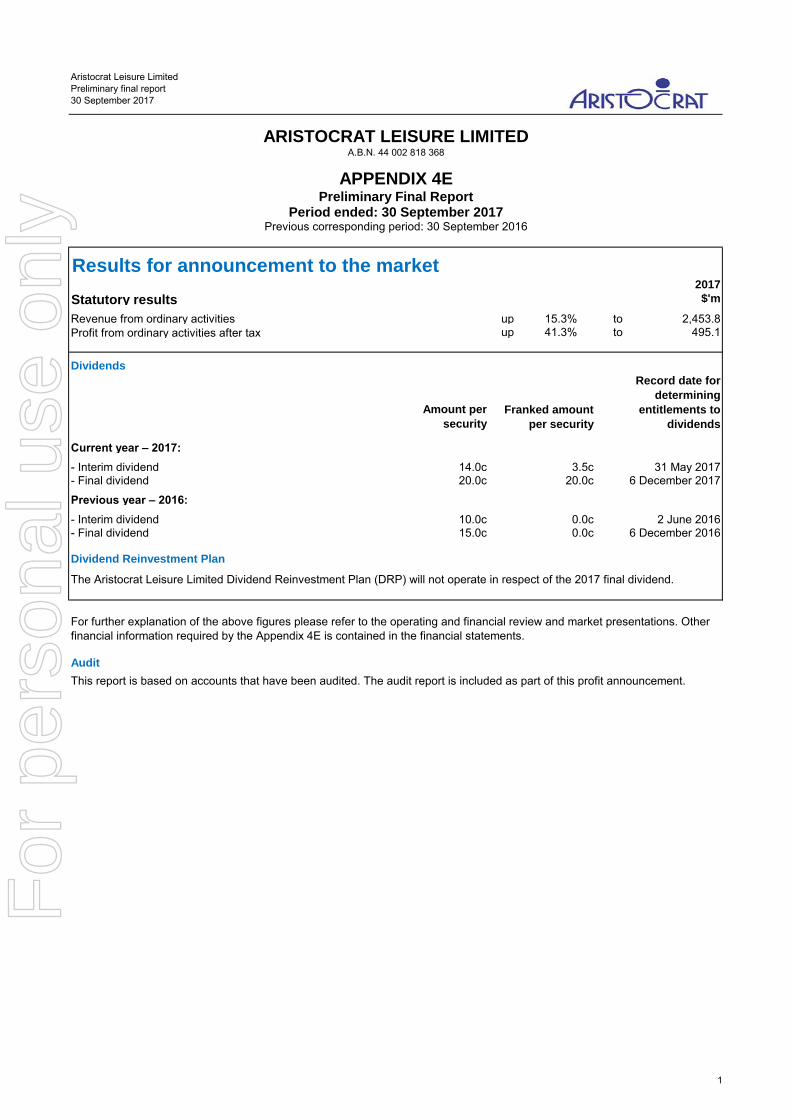
Aristocrat Leisure Limited
Preliminary final report
30 September 2017
2017
Statutory results $'m
Revenue from ordinary activities up 15.3% to 2,453.8up 41.3% to 495.1
Amount per
security
Current year – 2017:
- Interim dividend 14.0c- Final dividend 20.0c 20.0c
Previous year – 2016:
- Interim dividend 10.0c- Final dividend 15.0c 0.0c
Dividends
ARISTOCRAT LEISURE LIMITEDA.B.N. 44 002 818 368
APPENDIX 4EPreliminary Final Report
Period ended: 30 September 2017Previous corresponding period: 30 September 2016
Results for announcement to the market
Profit from ordinary activities after tax
The Aristocrat Leisure Limited Dividend Reinvestment Plan (DRP) will not operate in respect of the 2017 final dividend.
Franked amount
per security
Record date for
determining
entitlements to
dividends
3.5c 31 May 20176 December 2017
0.0c 2 June 20166 December 2016
Dividend Reinvestment Plan
For further explanation of the above figures please refer to the operating and financial review and market presentations. Other
financial information required by the Appendix 4E is contained in the financial statements.
Audit
This report is based on accounts that have been audited. The audit report is included as part of this profit announcement.
1
For
per
sona
l use
onl
y

Directors' Report
For the 12 months ended 30 September 2017
The Directors present their report together with the financial statements of the Company and its subsidiaries (the
Group) for the 12 months ended 30 September 2017 (the financial year). The information in this report is current as at
30 November 2017 unless otherwise specified.
This Directors’ Report has been prepared in accordance with the requirements of Division 1 of part 2M.3 of the
Corporations Act 2001 (Cth) (the Act).
Review and results of operations
A review of the operations of the Group for the financial year is set out in the Operating and Financial Review which
forms part of this Directors’ Report.
Financial results
The reported result of the Group attributable to shareholders for the 12 months ended 30 September 2017 was a profit
of $495.1 million after tax (2016: profit of $350.5 million after tax).
Further details regarding the financial results of the Group are set out in the Operating and Financial Review and
financial statements.
Dividends
Since the end of the financial year, the Directors have recommended the payment of a final dividend of 20.0 cents
(2016: 15.0 cents) per fully paid ordinary share. Details of the dividends paid and declared during the financial year
are set out in Note 1-6 to the financial statements.
Remuneration Report
Details of the remuneration policies in respect of the Group’s Key Management Personnel are detailed in the
Remuneration Report which forms part of this Directors’ Report.
Sustainability
Further detail on sustainability can be found on the Company’s website and forms part of this Directors’ Report and
integrates a wider range of non-financial management issues as the Group moves to improve its sustainable reporting
standards.
1
For
per
sona
l use
onl
y
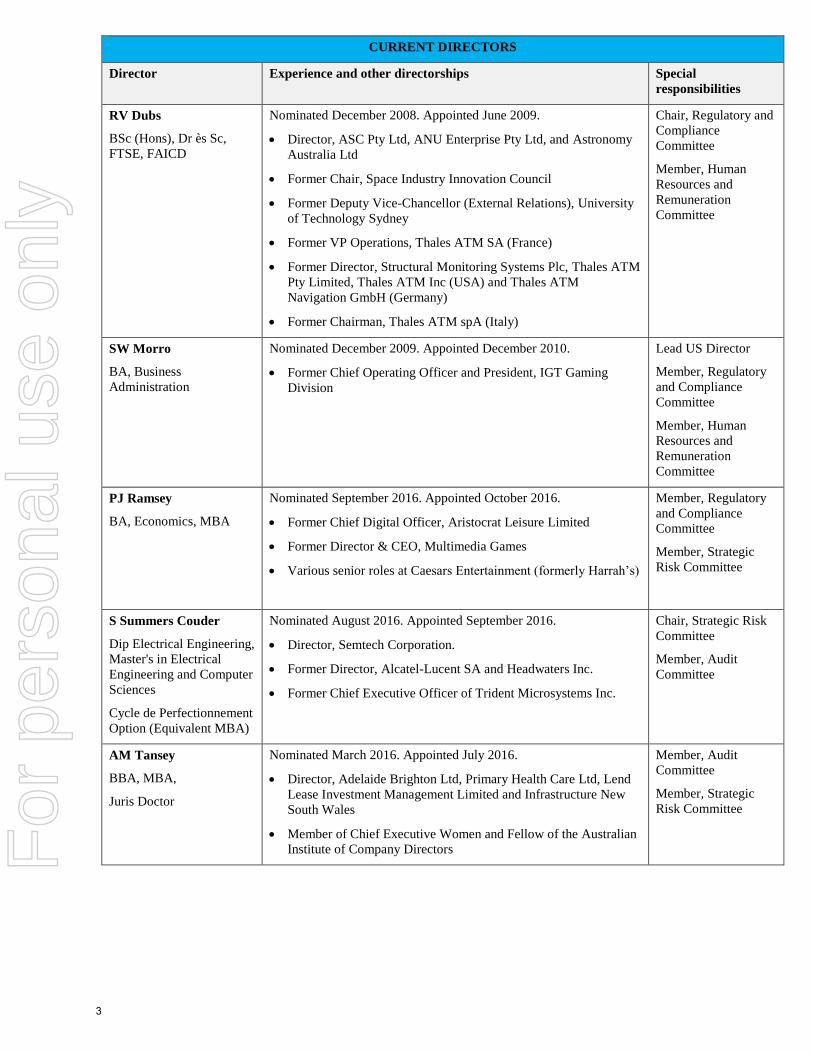
Directors’ particulars, experience and special responsibilities
Current Directors
The Directors of the Company throughout the financial year and up to the date of this report are:
CURRENT DIRECTORS
Director Experience and other directorships Special
responsibilities
ID Blackburne
BSc (Hons), MBA, PhD
Nominated December 2009. Appointed September 2010.
• Former Chairman, Recall Holdings Limited, CSR Limited and
Australian Nuclear Science and Technology Organisation
• Former Director, Teekay Corporation (listed on the NYSE),
Suncorp-Metway Limited and Symbion Health Limited
• Former Managing Director, Caltex Australia Limited
Non-Executive
Chairman
Member of each
Board Committee
TJ Croker
Advanced Management
Program (Wharton School,
University of
Pennsylvania)
Appointed 1 March 2017
• Former Executive Vice President, Global Product & Insights –
Aristocrat Leisure Limited
• Former Managing Director, ANZ – Aristocrat Leisure Limited
• Sales Director – Fosters Australia Ltd
Managing Director
and Chief Executive
Officer
(from 1 March 2017)
Member, Strategic
Risk Committee
DCP Banks
BBus (Mgt)
Nominated October 2010. Appointed July 2011.
• Former Group Chief Operating Officer of Galaxy Entertainment
Group (Macau)
• Former Chief Executive (Casinos Division) of Tabcorp Holdings
Limited
• Former Chief Executive Officer, Star City Holdings Limited
• Former President, Australasian Casinos Association
• Former Director, Australian Gaming Council
Chair, Audit
Committee
Member, Regulatory
and Compliance
Committee
K Conlon
BEc, MBA
Nominated January 2014. Appointed February 2014.
• Director of REA Group Limited and Lynas Corporation Limited
• Member of Chief Executive Women, Director of the Benevolent
Society and Chair of the Audit Committee for the Commonwealth
Department of Health
• Former President of the NSW Council, former Director of CSR
Limited and former National Board Member of the Australian
Institute of Company Directors
• Former Partner and Director, Boston Consulting Group (BCG)
Chair, Human
Resources and
Remuneration
Committee
Member, Strategic
Risk Committee
2
For
per
sona
l use
onl
y
CURRENT DIRECTORS
Director Experience and other directorships Special
responsibilities
RV Dubs
BSc (Hons), Dr ès Sc,
FTSE, FAICD
Nominated December 2008. Appointed June 2009.
• Director, ASC Pty Ltd, ANU Enterprise Pty Ltd, and Astronomy
Australia Ltd
• Former Chair, Space Industry Innovation Council
• Former Deputy Vice-Chancellor (External Relations), University
of Technology Sydney
• Former VP Operations, Thales ATM SA (France)
• Former Director, Structural Monitoring Systems Plc, Thales ATM
Pty Limited, Thales ATM Inc (USA) and Thales ATM
Navigation GmbH (Germany)
• Former Chairman, Thales ATM spA (Italy)
Chair, Regulatory and
Compliance
Committee
Member, Human
Resources and
Remuneration
Committee
SW Morro
BA, Business
Administration
Nominated December 2009. Appointed December 2010.
• Former Chief Operating Officer and President, IGT Gaming
Division
Lead US Director
Member, Regulatory
and Compliance
Committee
Member, Human
Resources and
Remuneration
Committee
PJ Ramsey
BA, Economics, MBA
Nominated September 2016. Appointed October 2016.
• Former Chief Digital Officer, Aristocrat Leisure Limited
• Former Director & CEO, Multimedia Games
• Various senior roles at Caesars Entertainment (formerly Harrah’s)
Member, Regulatory
and Compliance
Committee
Member, Strategic
Risk Committee
S Summers Couder
Dip Electrical Engineering,
Master's in Electrical
Engineering and Computer
Sciences
Cycle de Perfectionnement
Option (Equivalent MBA)
Nominated August 2016. Appointed September 2016.
• Director, Semtech Corporation.
• Former Director, Alcatel-Lucent SA and Headwaters Inc.
• Former Chief Executive Officer of Trident Microsystems Inc.
Chair, Strategic Risk
Committee
Member, Audit
Committee
AM Tansey
BBA, MBA,
Juris Doctor
Nominated March 2016. Appointed July 2016.
• Director, Adelaide Brighton Ltd, Primary Health Care Ltd, Lend
Lease Investment Management Limited and Infrastructure New
South Wales
• Member of Chief Executive Women and Fellow of the Australian
Institute of Company Directors
Member, Audit
Committee
Member, Strategic
Risk Committee
3
For
per
sona
l use
onl
y

FORMER DIRECTORS
Director Experience and other directorships Special
responsibilities
JR Odell
MBA
Appointed May 2009; Ceased employment on 28 February 2017
• Former Board Member, American Gaming Association
• Former Managing Director, Australia, Asia and Pacific, Foster’s
Group Limited
• Former Executive, Allied Domecq in the UK and Asia Pacific
• Former Managing Director, Lyons Tetley Australia
Former Managing
Director and Chief
Executive Officer
RA Davis
BEc (Hons), M Philosophy
Appointed June 2005; Retired 27 February 2017.
• Consulting Director Investment Banking, Rothschild Australia
Limited
• Chairman, Bank of Queensland Limited
• Director, Argo Investments Limited, AIG Australia Limited,
Ardent Leisure Management Limited and Ardent Leisure Limited
• Former Chairman, Centric Wealth Advisors Limited and Charter
Hall Office REIT
• Former Director, Territory Insurance Office and Trust Company
Limited.
• Former Senior Executive, Citicorp and CitiGroup Inc in the
United States and Japan
• Former Group Managing Director, ANZ Banking Group Limited
Member, Audit
Committee
Member, Human
Resources and
Remuneration
Committee
4
For
per
sona
l use
onl
y
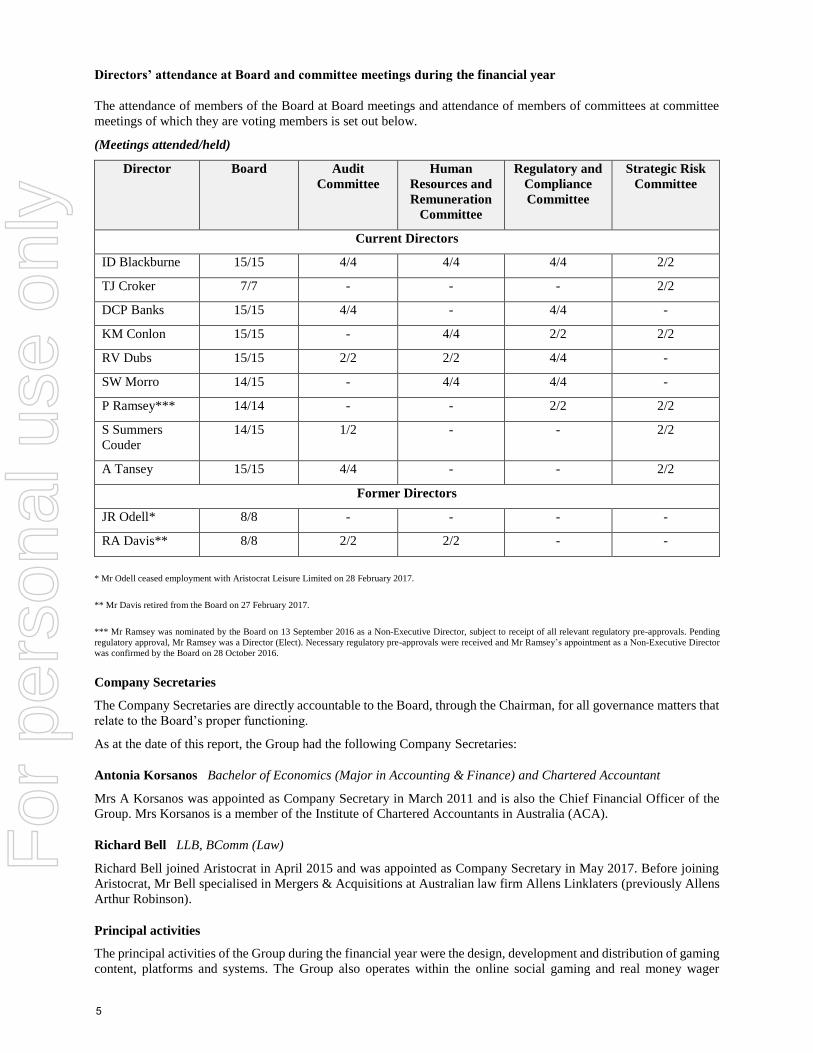
Directors’ attendance at Board and committee meetings during the financial year
The attendance of members of the Board at Board meetings and attendance of members of committees at committee
meetings of which they are voting members is set out below.
(Meetings attended/held)
Director Board Audit
Committee
Human
Resources and
Remuneration
Committee
Regulatory and
Compliance
Committee
Strategic Risk
Committee
Current Directors
ID Blackburne 15/15 4/4 4/4 4/4 2/2
TJ Croker 7/7 - - - 2/2
DCP Banks 15/15 4/4 - 4/4 -
KM Conlon 15/15 - 4/4 2/2 2/2
RV Dubs 15/15 2/2 2/2 4/4 -
SW Morro 14/15 - 4/4 4/4 -
P Ramsey*** 14/14 - - 2/2 2/2
S Summers
Couder
14/15 1/2 - - 2/2
A Tansey 15/15 4/4 - - 2/2
Former Directors
JR Odell* 8/8 - - - -
RA Davis** 8/8 2/2 2/2 - -
* Mr Odell ceased employment with Aristocrat Leisure Limited on 28 February 2017.
** Mr Davis retired from the Board on 27 February 2017.
*** Mr Ramsey was nominated by the Board on 13 September 2016 as a Non-Executive Director, subject to receipt of all relevant regulatory pre-approvals. Pending
regulatory approval, Mr Ramsey was a Director (Elect). Necessary regulatory pre-approvals were received and Mr Ramsey’s appointment as a Non-Executive Director
was confirmed by the Board on 28 October 2016.
Company Secretaries
The Company Secretaries are directly accountable to the Board, through the Chairman, for all governance matters that
relate to the Board’s proper functioning.
As at the date of this report, the Group had the following Company Secretaries:
Antonia Korsanos Bachelor of Economics (Major in Accounting & Finance) and Chartered Accountant
Mrs A Korsanos was appointed as Company Secretary in March 2011 and is also the Chief Financial Officer of the
Group. Mrs Korsanos is a member of the Institute of Chartered Accountants in Australia (ACA).
Richard Bell LLB, BComm (Law)
Richard Bell joined Aristocrat in April 2015 and was appointed as Company Secretary in May 2017. Before joining
Aristocrat, Mr Bell specialised in Mergers & Acquisitions at Australian law firm Allens Linklaters (previously Allens
Arthur Robinson).
Principal activities
The principal activities of the Group during the financial year were the design, development and distribution of gaming
content, platforms and systems. The Group also operates within the online social gaming and real money wager
5
For
per
sona
l use
onl
y
markets. The Company’s objective is to be the leading global provider of gaming solutions. There were no significant
changes in the nature of those activities during the financial year.
Significant changes in the state of affairs
Except as outlined below and elsewhere in this Directors’ Report, there were no significant changes in the state of
affairs of the Group during the financial year.
Events after balance date
On 20 October 2017, the Group completed the acquisition of 100% of Plarium Global Limited, for a total consideration
of an upfront amount of US$500m cash, subject to adjustments and an earn-out arrangement payable to Plarium
shareholders following the end of calendar years 2017 and 2018 respectively. A debt draw down of US$425m was
made to finance the transaction.
On 30 November 2017, the Group signed an agreement to acquire 100% of Big Fish Games, Inc. from Churchill
Downs Inc. for a purchase price of US$990m, subject to customary completion adjustments. The acquisition is subject
to receiving regulatory approval, and will be funded by an incremental Term Loan B debt facility as well as cash
holdings. The entity to be acquired operates as a publisher of social casino, casual free-to-play and premium paid
games.
Other than the matter above, there has not arisen in the interval between the end of the financial year and the date of
this report any item, transaction or event of a material and unusual nature likely, in the opinion of the Directors, to
affect significantly the operations of the Group, the results of those operations, or the state of affairs of the Group, in
future financial reporting periods.
Likely developments and expected results
Likely developments in the operations of the Group in future financial years and the expected results of operations are
referred to in the Operating and Financial Review which forms part of this Directors’ Report.
Options over share capital
No options over Company shares were granted to executives or Directors during the financial year. There were no
unissued shares or interests in the Company subject to options at the date of this Directors’ Report and no Company
shares or interests issued pursuant to exercised options during or since the end of the financial year.
Indemnities and insurance premiums
The Company’s Constitution provides that the Company will indemnify each officer of the Company against any
liability incurred by that officer in or arising out of the conduct of the business of the Company or in or arising out of
the discharge of that officer’s duties to the extent permitted by law.
An officer for the purpose of this provision includes any Director or Secretary of the Company or the Company’s
subsidiaries, executive officers or employees of the Company or its subsidiaries and any person appointed as a trustee
by, or acting as a trustee at the request of, the Company, and includes former Directors.
In accordance with the Company’s Constitution, the Company has entered into deeds of access, indemnity and
insurance and deeds of indemnity for identity theft with each Director and nominated officers of the Company. No
amount has been paid pursuant to those indemnities during the financial year to the date of this Directors’ Report.
The Company has paid a premium in respect of a contract insuring officers of the Company and its related bodies
corporate against any liability incurred by them arising out of the conduct of the business of the Company or in or
arising out of the discharge of their duties. In accordance with normal commercial practices, under the terms of the
insurance contracts, the details of the nature and extent of the liabilities insured against and the amount of premiums
paid are confidential.
Environmental regulation
The Group’s operations have a limited impact on the environment. The Group is subject to a number of environmental
regulations in respect of its integration activities. The Company does not manufacture gaming machines, it only
integrates (assembles) machines and systems in Australia, the USA, Macau, the UK, South Africa and New Zealand.
The Company uses limited amounts of chemicals in its assembly process. The Directors are not aware of any breaches
of any environmental legislation or of any significant environmental incidents during the financial year.
6
For
per
sona
l use
onl
y
Based on current emission levels, the Company is not required to register and report under the National Greenhouse
and Energy Reporting Act 2007 (Cth) (NGER Act). However, the Company continues to receive reports and monitors
its position to ensure compliance with the NGER Act.
The Company is committed to not only complying with the various environmental laws to which its operations are
subject, but also to achieving a high standard of environmental performance across all its operations. The Company is
aware of, and continues to plan for, any new Australian regulatory requirements on climate change. It is the Company’s
view that climate change does not pose any significant risks to its operations in the short to medium term. Throughout
the Group, new programs and initiatives have been introduced to ensure the Company is well prepared for new
regulatory regimes and to reduce its carbon footprint.
Proceedings on behalf of the Company
No proceedings have been brought on behalf of the Company under section 236 of the Act nor has any application
been made in respect of the Company under section 237 of the Act.
Auditor
PricewaterhouseCoopers continues in office in accordance with section 327 of the Act.
Non-audit services provided by the auditor
The Company, with the prior approval of the Chair of the Audit Committee, may decide to employ
PricewaterhouseCoopers, the Company’s auditor, on assignments additional to its statutory audit duties where the
auditor’s expertise and experience with the Company and/or the Group are important. The Company has a Charter of
audit independence which specifies those non-audit services which cannot be performed by the Company auditor. The
Charter also sets out the procedures which are required to be followed prior to the engagement of the Company’s
auditor for any non-audit related service.
Details of the amounts paid or payable to the Company’s auditor, for audit and non-audit services provided during the
financial year, are set out in Note 6-3 to the financial statements.
The Board of Directors has considered the position and, in accordance with the advice received from the Audit
Committee, is satisfied that the provision of the non-audit services as set out in Note 6-3 to the financial statements is
compatible with the general standard of independence for auditors imposed by the Act for the following reasons:
• All non-audit services have been reviewed by the Audit Committee to ensure they do not impact the
impartiality and objectivity of the auditor.
• None of the services undermine the general principles relating to auditor independence as set out in APES
110 Code of Ethics for Professional Accountants, including reviewing or auditing the auditor’s own work,
acting in a management or a decision-making capacity for the Company, acting as advocate for the Company
or jointly sharing economic risk and rewards.
A copy of the auditor’s independence declaration is attached to this Directors’ Report.
Loans to Directors and executives
No Director or executive held any loans with the Company during the financial year.
Rounding of amounts to nearest thousand dollars
The Company is of a kind referred to in ASIC Corporations (Rounding in Financial/Directors’ Reports) Instrument
2016/191 as issued by the Australian Securities and Investments Commission. Amounts in the Director's report and
the financial statements have been rounded off to the nearest whole number of million dollars and one decimal place
representing hundreds of thousands of dollars, or in certain cases, the nearest dollar in accordance with that class order.
This report is made in accordance with a resolution of the Directors and is signed for and on behalf of the Directors.
Dr ID Blackburne
Chairman
30 November 2017
7
For
per
sona
l use
onl
y
Aristocrat Leisure Limited
Operating and Financial Review
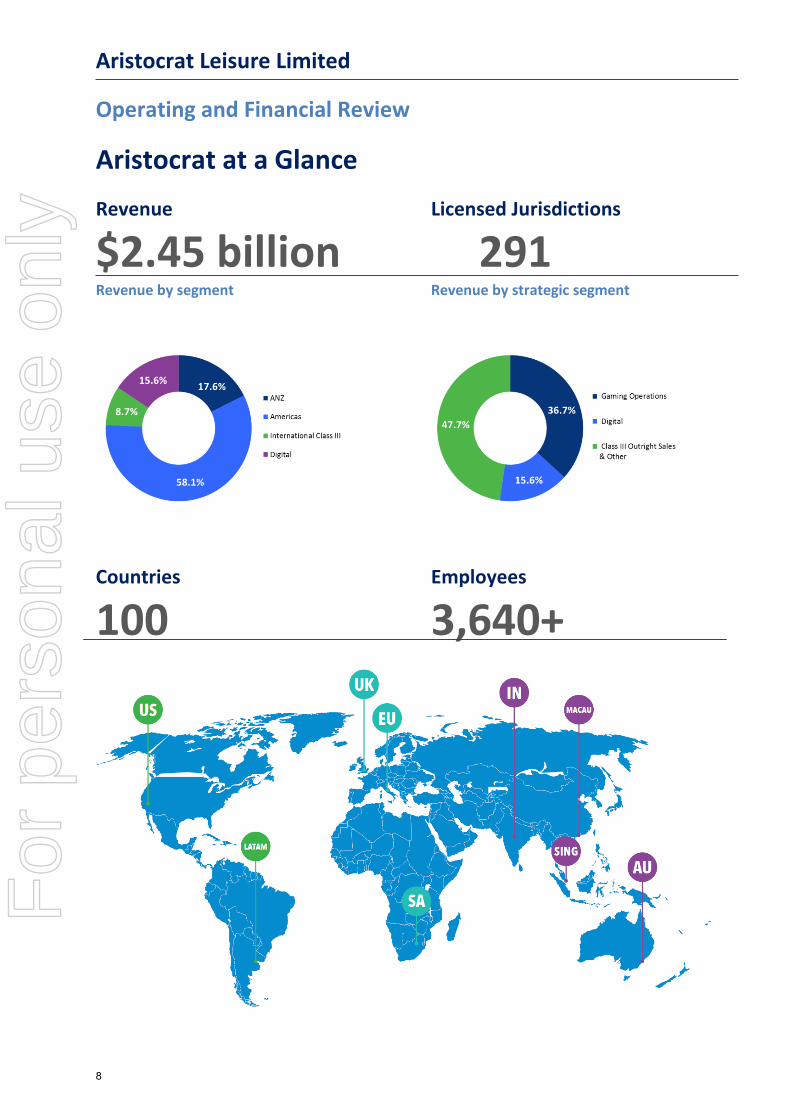
Aristocrat at a Glance
Revenue Licensed Jurisdictions
$2.45 billion 291 Revenue by segment Revenue by strategic segment
Countries Employees
100 3,640+
8
For
per
sona
l use
onl
y

Aristocrat Leisure Limited
Operating and Financial Review
Business Strategy
Business strategies and prospects for
future financial years
Aristocrat’s consistent focus has been on delivering high quality, sustainable growth, by protecting and expanding our core business, capturing opportunities in adjacent and new markets and segments, and investing in outstanding talent and a high performance culture.
The acquisition of Plarium Global Ltd (‘Plarium’), announced during the period, is an example of Aristocrat’s willingness to invest in new markets, consistent with our strategy and rigorous approach to M&A. Plarium significantly increases Aristocrat’s presence in the high-growth social games market. It has also immediately expanded our addressable digital opportunity by around eight times – to approximately US$22 billion of value – encompassing the Strategy, Role Playing Game (‘RPG’) and Casual games segments in which Plarium competes.
This acquisition will substantially lift the Digital segment’s pro forma earnings contribution to the Group. It will also further expand Aristocrat’s recurring revenue base, thereby enhancing the Group’s ability to drive sustainable returns over time.
Over the course of FY17, Aristocrat also made further progress in unlocking organic growth opportunities in adjacent markets and segments.
In the Digital business, a new application - Cashman Casino
TM – was successfully launched
and scaled, while a new Asian-themed app FaFaFa Gold
TM will be launched in the coming period.
In addition, the RELMTM
Class III stepper product was introduced, with significant progress made during the reporting period in building out a broad and deep game portfolio to support the product in market.
The Class II OvationTM
video product was another successful launch into an adjacent segment executed during the year. Early performance is exceeding expectations and driving strong customer interest and momentum.
Progress was also made in developing a competitive VLT (video lottery terminal) offer during the year, leveraging new and existing Aristocrat content and offering a mix of games to appeal to multiple player segments.
Aristocrat’s strong balance sheet and growing recurring revenues give us broad optionality to continue to consider both organic and inorganic opportunities to sustain our growth momentum and create value for shareholders.
“Aristocrat made progress in unlocking
organic growth opportunities in
adjacent markets and segments in
addition to investing in the high growth
social games market through the
acquisition of Plarium”
9
For
per
sona
l use
onl
y
Aristocrat Leisure Limited
Operating and Financial Review
Review of Operations Group Performance
Earnings Summary
Key performance indicators for the current period and prior period are set out below.
(1) Results for 12 months to 30 September 2017 adjusted for translational exchange rates using rates applying in 2016 as referenced in the table on page 11.
(2) Consolidated EBITDA as defined by the Credit Agreement
The information presented in this Operating and Financial Review has not been audited in accordance with the Australian Auditing Standards.
Constant Constant
currency1 currency1 Reported
A$ million 2017 2017 2016 % %
Reported Results
Operating revenue 2,513.7 2,453.8 2,128.7 18.1 15.3
EBITDA 1,030.1 1,001.2 806.0 27.8 24.2
EBITA 883.0 858.1 673.4 31.1 27.4
NPAT 509.3 495.1 350.5 45.3 41.3
NPATA 559.1 543.4 398.2 40.4 36.5
Earnings per share (fully diluted) 79.7c 77.5c 54.9c 45.2 41.2
EPS before amortisation of acquired intangibles (fully diluted) 87.5c 85.0c 62.4c 40.2 36.2
Total dividend per share 34.0c 34.0c 25.0c 36.0 36.0
Balance sheet and cash flow
Net working capital/revenue 6.9% 7.1% 5.7% (1.2)pts (1.4)pts
Operating cash flow 822.2 799.1 680.5 20.8 17.4
Operating cash flow conversion 147.1% 147.1% 170.9% (23.8)pts (23.8)pts
Closing (net debt)/cash (671.5) (652.3) (1,004.6) 33.2 35.1
Gearing (net debt/consolidated EBITDA2) n/a 0.6 1.2 n/a 50.0
Variance vs. 2016
10
For
per
sona
l use
onl
y
Aristocrat Leisure Limited
Performance Summary
Profit after tax and before amortisation of acquired intangibles (‘NPATA’) of $543 million for the period
represented a 36% increase (40% in constant currency) compared to $398 million in the prior corresponding
period. There are no significant items or discontinued operations reported this period. Revenue increased by
more than 15% (18% in constant currency) driven by growth across all key segments in broadly flat markets.
Normalised fully diluted earnings per share before amortisation of acquired intangibles of 85.0c represents a
36.2% increase on the prior corresponding period.
Operating cash flow increased by more than 17% and net gearing reduced to 0.6x from 1.2x compared to the
prior corresponding period reflecting the strong performance across the business as well as the continued
focus on cash management.
NPATA movement FY16 to FY17 (A$ million)
Strong growth in the Americas business
drove a $109 million improvement in post-
tax profit compared to the prior period. This
growth was driven by an 18% expansion in
the Class III premium gaming operations
footprint, together with further growth in
the Class II gaming operations footprint and
average fee per day (‘FPD’). A 9% lift in Class
III Outright Sales and an improved average
selling price (ASP) further supported this
result.
The ANZ business delivered almost $15
million in incremental profit, driven by the
top performing HelixTM
cabinet, penetration
of the Lightning LinkTM
and Player’s ChoiceTM
family of games, the recent introduction of
Dragon LinkTM
and continued performance
of the broader Aristocrat game portfolio.
Digital delivered strong earnings growth of
$31.7m due to the continued success of
Heart of VegasTM
and the success of
Cashman CasinoTM
which was launched in
the year.
International Class III drove a $23.9 million
improvement in post-tax profit compared to
the prior period mainly driven by large scale
openings in the region. The completion of
the 1.1 regulatory churn cycle in Macau in
FY16 was more than offset by the growth
across the region.
The Group’s strategic investments in talent
and technology, represented in higher D&D
spend, are delivering strong competitive
product across all key markets and segments
in line with its strategic objectives.
Foreign exchange impacted the business
performance by $18.3 million which was
partially offset by a decrease in interest.
+36%NPATA Growth
11
For
per
sona
l use
onl
y

Aristocrat Leisure Limited
Group Profit and Loss
Results in the current period and prior corresponding period are at reported currency and there were no
significant items or discontinued operations. Segment profit is stated before amortisation of acquired
intangibles.
Variance
A$ million 2017 2016 %
Segment revenue
Australia and New Zealand 431.6 412.7 4.6
Americas 1,424.5 1,255.2 13.5
International Class III 214.7 181.1 18.6
Digital 383.0 279.7 36.9
Total segment revenue 2,453.8 2,128.7 15.3
Segment profit
Australia and New Zealand 190.5 169.1 12.7
Americas 736.4 600.3 22.7
International Class III 112.5 80.5 39.8
Digital 158.9 118.1 34.5
Total segment profit 1,198.3 968.0 23.8
Unallocated expenses
Group D&D expense (268.4) (239.2) (12.2)
Foreign exchange (4.9) (1.0) (390.0)
Corporate (66.9) (54.4) (23.0)
Total unallocated expenses (340.2) (294.6) (15.5)
EBIT before amortisation of acquired intangibles (EBITA) 858.1 673.4 27.4
Amortisation of acquired intangibles (76.9) (76.3) (0.8)
EBIT 781.2 597.1 30.8
Interest (53.1) (89.9) 40.9
Profit before tax 728.1 507.2 43.6
Income tax (233.0) (156.7) (48.7)
Profit after tax 495.1 350.5 41.3
Amortisation of acquired intangibles after tax 48.3 47.7 1.3
Profit after tax and before amortisation of acquired intangibles (NPATA) 543.4 398.2 36.5
12
For
per
sona
l use
onl
y

Aristocrat Leisure Limited
Revenue
Segment revenue increased $325 million or 15% in
reported currency (18% in constant currency) with
growth across all three of our strategic segments:
Gaming Operations; Digital and Class III Outright
Sales & Other.
In Gaming Operations, the Premium Class III install
base grew 18%, the Class II footprint grew almost
5% and overall average fee per day grew 5%. The
OvationTM
(Class II Video) product was launched in
the period.
Digital revenue grew 41% to A$395 million in
constant currency terms due to an increase in
average revenue per daily active user (‘ARPDAU’)
driven by strong content releases and growth in
daily active users (‘DAU’) as a result of the launch
and scaling of Cashman CasinoTM
in the period.
In Class III Outright Sales, the overall North
American ship share was maintained in line with
the growth in market size. Unit sales revenue was
up 14%, driven by the sales volume increase and
an improvement in ASP due to favourable product
mix supported by the performance from ArcTM
Single.
In Australia & New Zealand Class III, revenue
increased by 4.6% to $432 million in constant
currency terms compared to the prior
corresponding period, while overall profit
increased by 12.7% reflecting the continued
strength in market share.
In International Class III, revenue was up by 21.5%
to $220 million in constant currency terms, driven
by large scale openings in the region.
Revenue by Strategic Segment
Earnings
Segment profit increased $230 million in reported
currency, up 24% compared with the prior
corresponding period (27% in constant currency)
ahead of revenue delivery primarily due to the
growth in install base and improved margins
across all businesses from a combination of higher
average selling prices and operating leverage.
13
For
per
sona
l use
onl
y

Aristocrat Leisure Limited
Segment Profit Margin % of Revenue
The Group continues to invest significantly in
better games through new talent and new
technology, with ongoing efficiencies reinvested in
core product development and capability targeting
strategic growth opportunities. The Group’s
investment in D&D spend, as a percentage of
revenue, was 10.9% compared to 11.2% of
revenues in the prior corresponding period. Total
reported spend increased $29.2 million or 12%
(14% in constant currency).
Corporate costs increased by $12.5 million
compared to the prior corresponding period
mainly driven by higher variable employee
compensation, higher legal costs and one-off
consulting costs. Corporate costs as a percentage
of revenue remained broadly in line with the prior
corresponding period.
Net interest expense decreased $36.8 million to
$53.1 million, reflecting the repricing of the Term
Loan B facility and the reduced debt levels.
The effective tax rate (‘ETR’) for the reporting
period was 32% compared to 30.9% in the prior
corresponding period due to the geographical mix
of earnings.
Other Key Margins % of Revenue and ETR
14
For
per
sona
l use
onl
y

Aristocrat Leisure Limited
Balance Sheet
The balance sheet can be summarised as follows:
Significant balance sheet movements from 30
September 2016 are:
Net working capital: Normalised for deferred
consideration on the VGT acquisition, net working
capital as a percentage of annual revenue
remained in line with the prior period at 7.5%
reflecting the continued focus on cash
management.
Intangible assets: The decrease relates primarily
to the impact of foreign exchange on the US dollar
denominated assets combined with amortisation
of the acquired intangibles of the VGT business –
predominantly customer relationships and
technology.
Non-current borrowings: The reduction in non-
current borrowings primarily relates to the
repayment of US$50 million of the Term Loan B
facility during the reporting period and the impact
of foreign exchange on the US dollar denominated
loan facility.
Total equity: The change in total equity reflects
the result for the period, changes in reserves due
to currency movements, net of dividends paid
during the period.
Variance
A$ million 30 Sep 2017 31 Mar 2017 30 Sep 2016 %
Cash and cash equivalents 547.1 394.5 283.2 93.2
Property, plant and equipment 241.3 239.2 217.5 10.9
Intangible assets 1,687.7 1,738.7 1,736.5 (2.8)
Other assets 816.8 760.1 750.5 8.8
Total assets 3,292.9 3,132.5 2,987.7 10.2
Current borrowings 0.1 0.1 - n/a
Non current borrowings 1,199.3 1,227.5 1,287.8 (6.9)
Payables, provisions and other liabilities 747.9 661.1 624.4 19.8
Total equity 1,345.6 1,243.8 1,075.5 25.1
Total liabilities and equity 3,292.9 3,132.5 2,987.7 10.2
Net working capital 174.2 148.7 122.3 42.4
Net working capital % revenue 7.1 6.3 5.7 24.6
Normalised net working capital % revenue 7.5 7.9 7.3 2.7
Net debt / (cash) 652.3 833.1 1,004.6 (35.1)
15
For
per
sona
l use
onl
y

Aristocrat Leisure Limited
Statement of cash flows
The movement in net debt (debt less cash), after eliminating foreign exchange movements is set out below:
Operating cash flow
Consolidated cash flow
Operating cash flow increased 17% compared to
the prior corresponding period.
The increase in operating cash flows is due to the
strong performance across the business with
higher mix of recurring revenues as well as
continued focus on cash management.
Net interest paid at $44.0 million was $23.7 million
lower than the prior corresponding period due to
favourable repricing of the Term Loan B facility
and the reduced debt levels with US$50 million
repaid during the year.
Taxes paid in the year increased from $84.6 million
to $127 million driven by the growth in the
Americas and Digital businesses and the prior year
benefit from tax losses which were fully utilised
during FY16.
Capital expenditure relates primarily to investment
in hardware to support the Americas gaming
operations installed base.
Cash flow in the statutory format is set out in the
financial statements.
Change
A$ million 2017 2016 %
EBITDA 1,001.2 806.0 24.2
Change in net working capital (51.9) 20.4 n/a
Interest and tax (171.0) (152.3) (12.3)
Other cash and non-cash movements 20.8 6.4 225.0
Operating cash flow 799.1 680.5 17.4
Operating cash flow less capex 585.6 487.9 20.0
Operating cash flow % NPATA 147.1 170.9 (13.9)
Operating cash flow % EBITDA 79.8 84.4 (5.5)
Change
A$ million 2017 2016 %
Operating cash flow 799.1 680.5 17.4
Capex (213.5) (192.6) (10.9)
Acquisitions and divestments (23.0) (16.7) (37.7)
Investing cash flow (236.5) (209.3) (13.0)
Repayment of borrowings (65.5) (359.1) 81.8
Payments for loans advanced - (13.5) 100.0
Dividends and share payments (231.1) (133.8) (72.7)
Financing cash flow (296.6) (506.4) 41.4
Net increase in cash 266.0 (35.2) n/a
16
For
per
sona
l use
onl
y

Aristocrat Leisure Limited
Funding and Liquidity
The Group had committed loan facilities of A$1.3
billion as at 30 September 2017, comprising a
US$950 million Term Loan B facility maturing in
October 2021 and a $100 million revolving facility
maturing in October 2019. The Group repaid
US$50 million of the Term Loan B facility during
the period, reflecting the Group’s strong cash
balance and liquidity position providing it with
flexibility to repay debt.
The Group’s facilities are summarised as follows:
The Group’s interest and debt coverage ratios are
as follows (x):
* EBITDA refers to Consolidated EBITDA for the Group as defined in
Aristocrat’s Syndicated Facility Agreement (also referred to as Bank
EBITDA)
** Interest expense shown above includes ongoing finance fees relating
to bank debt facility arrangements, such as line fees.
The Group’s leverage ratio (net debt / EBITDA)
continued to decline in the reporting period, falling
from 1.2x as at 30 September 2016 to 0.6x as at 30
September 2017. The reduction in gearing over
the reporting period reflects debt paydown,
earnings growth and strong free cash flow
generation across the Group.
The company completed the acquisition of Plarium
Global Limited on 19 October 2017. Aristocrat
funded the acquisition via existing cash and an
incremental US$425 million 7 year Term Loan B
debt facility which matures in October 2024.
Pro forma debt coverage ratios are set out below:
Credit Ratings
The Group obtained credit ratings from both
Moody’s Investor Services and Standard & Poor's
in order to support the launch of the US$1.3 billion
Term Loan B facility in 2014.
As at 30 September 2017, Aristocrat holds credit
ratings of BB+ from Standard & Poor’s and Ba1
from Moody’s. Moody’s upgraded Aristocrat’s
credit rating by one notch from Ba2 in December
2016 and S&P upgraded from BB in May 2017.
Aristocrat continues to target financial metrics in
line with an investment grade level.
Dividends
The Directors have authorised a final dividend in
respect of the full year to 30 September 2017 of
20.0 cents per share ($127.7 million). Total
dividends in respect of the 2017 year amount to
34.0 cents per share ($217.3 million) and
represent an increase of 36% (or 9.0 cents),
reflective of growth in performance, strength of
cash flows and continued improvement in gearing.
The dividend is expected to be declared and paid
on 20 December 2017 to shareholders on the
register at 5.00pm on 6 December 2017. The
dividend will be fully franked.
Drawn as at
Facility 30 Sep 2017 Limit Maturity date
Term Loan B facility US$950.0m US$950.0m Oct 2021
Revolving facility A$0.0m A$100.0m Oct 2019
Overdraft facilities A$0.0m A$7.6m Annual Review
Proforma Ratio FY17
Debt / EBITDA* (x) 1.6x
Net debt (cash) / EBITDA* (x) 1.2x
0.6x Net Debt ratio
17
For
per
sona
l use
onl
y

Aristocrat Leisure Limited
Foreign exchange
Given the extent of the Group’s global operations
and the percentage of its earnings derived from
overseas, its reported results are impacted by
movements in foreign exchange rates.
In the 12 months to 30 September 2017, the
Australian dollar was, on average, stronger against
the US dollar when compared to the prior
corresponding period. The impact of translating
foreign currency (translational impact) decreased
revenue by $59.9 million while decreasing
normalised profit after tax and before
amortisation of acquired intangibles by $15.7
million on a weighted average basis when
compared with rates prevailing in the respective
months in the prior period. In addition, as at 30
September 2017, the cumulative effect of the
retranslation of the net assets of foreign controlled
entities (recognised through the foreign currency
translation reserve) was a debit balance of $38.0
million (compared to a debit balance of $11.1
million as at 30 September 2016).
Based on the Group’s mix of profitability, the
major exposure to translational foreign exchange
results from the Group’s US dollar profits. A US
dollar 1 cent change in the US$:A$ exchange rate
results in an estimated $6 million translational
impact on the Group’s annual profit after tax and
before amortisation of acquired intangibles. This
impact will vary as the magnitude and mix of
overseas profits change.
Foreign exchange rates compared with prior
corresponding periods for key currencies are as
follows:
¹Average of monthly exchange rates only. No weighting applied.
2017 2016
A$: 30 Sep 2017 31 Mar 2017 30 Sept 2016 Average¹ Average¹
USD 0.7842 0.7647 0.7663 0.7624 0.7383
NZD 1.0860 1.0902 1.0517 1.0649 1.0706
EUR 0.6639 0.7160 0.6817 0.6870 0.6675
GBP 0.5850 0.6102 0.5903 0.5983 0.5251
ZAR 10.6324 10.2421 10.5100 10.2028 10.8931
ARS 13.5804 11.7668 11.7692 12.3371 10.1781
18
For
per
sona
l use
onl
y

Aristocrat Leisure Limited
Operating and Financial Review
Review of Operations Regional segment review
Segment profit represents earnings before interest
and tax, and before significant items, charges for
D&D expenditure, amortisation of acquired
intangibles and corporate costs. The total amount
of these items is disclosed in the Group’s
statement of comprehensive income. There are no
significant items or discontinued operations in the
current period. Constant currency amounts refer
to 2017 results restated using exchange rates
applying in 2016.
Americas
Summary Profit or Loss
In local currency, North American profits increased
by 26%, or US$116 million to US$560 million
representing 3.9 ppts of margin expansion. This
was driven by strong performance in both the
premium and Class II gaming operations segments
and growth in outright sales with improved unit
mix.
North America Gaming Operations Units
Aristocrat’s Class III premium gaming operations
install base grew 18%, fuelled by continued
penetration of the high-performing products
Lightning LinkTM
, Buffalo GrandTM
, Walking Dead
3TM
, and Game of ThronesTM
as well as the
successful launch of innovative products such as
Fast CashTM
and 5 Dragons GrandTM
.
The Class III premium gaming operations install
based will continue to be supported by a strong
product portfolio across a diverse range of product
segments with Dragon LinkTM
on the Arc SingleTM
cabinet and the introduction of two new hardware
innovations as shown at G2E: the RELM XLTM
Aristocrat’s stepper cabinet, launching with
Buffalo InfernoTM
and Buffalo Thundering 7sTM
;
and the Flame55TM
portrait cabinet launching with
Mariah CareyTM
, and the second Aristocrat title
made in partnership with HBO’s #1 TV show, Game
of ThronesTM
.
Variance
US$ million 2017 2016 %
Revenue
North America 1,033.7 890.1 16.1
Latin America 51.0 38.0 34.2
Total Revenue 1,084.7 928.1 16.9
Profit
North America 546.6 434.0 25.9
Latin America 13.7 9.9 38.4
Total Profit 560.3 443.9 26.2
Margin 51.7% 47.8% 3.9 pts
+10%Unit Growth
19
For
per
sona
l use
onl
y
Aristocrat Leisure Limited
In Class II Gaming Operations placements
increased by 4.7% driven by the opening of new
sites, additions at existing locations and the
successful launch of the Class II video product
OvationTM
.
Average fee per day across Class II and Class III
markets increased 5%, driven by game
performance across the portfolio supported by
new form factors.
North America Outright Sales units and Average
US$ Price / unit
Class III Outright Sales revenue increased by 14%
compared to the prior period primarily driven by
the depth of strong portfolio performance, the
introduction of the HelixTM
+ cabinet and the
continued performance of HelixTM
and ArcTM
single.
HelixTM
+ is an enhanced version of the HelixTM
footprint, featuring High Definition Dual 27”
screens including a fully integrated virtual button
deck.
The Class III Outright Sales portfolio performed
well during the period across all categories with
new content and continued success from
Aristocrat’s existing library. The C-SeriesTM
portfolio included new releases in Extra Bonus
WildsTM
, a brand extension of Whales of CashTM
and a strong addition to the Wonder 4TM
suite with
Wonder 4 Tall FortunesTM
. The E-SeriesTM
performance and depth of library continued to
grow with strong titles such as Sacred GuardiansTM
and 8 PetalsTM
, supported by the new top
performing Mighty CashTM
– Long Teng Ju XiaoTM
.
J-SeriesTM
was also a key category across both
HelixTM
and ArcTM
footprint with the new Gold
BonanzaTM
, Pure GoldTM
and the extension of Gold
StacksTM
.
The RELMTM
Stepper was introduced in the period
with 18 titles, a reflection of the commitment to
this market segment. Key performing games
include Golden TreeTM
, Stars and SevensTM
, Triple 7
Wildfire DoubleTM
and 3x7 2xLotusTM
.
Latin America Outright Sales units, Average US$
Price / unit and Recurring Revenue install base
Latin America revenue increased 34% compared to
the prior period, as a result of strong product
performance in both outright sales and recurring
revenue, with continued momentum of Arc
SingleTM
and Lightning LinkTM
in addition to the
introduction of the HelixTM
+.
There was growth in the Latin America recurring
revenue footprint in the year with an increase of
52% in ending install base.
+9% Platform Growth
20
For
per
sona
l use
onl
y
Aristocrat Leisure Limited
Australia and New Zealand
Summary Profit or Loss
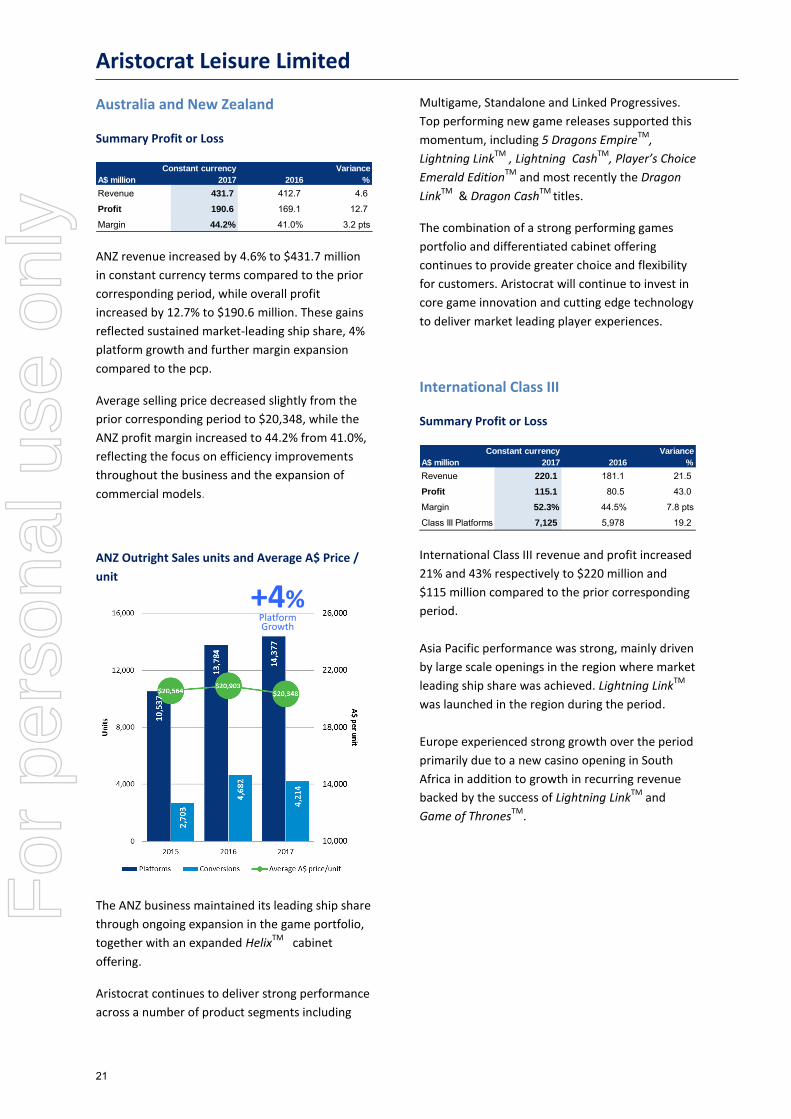
ANZ revenue increased by 4.6% to $431.7 million
in constant currency terms compared to the prior
corresponding period, while overall profit
increased by 12.7% to $190.6 million. These gains
reflected sustained market-leading ship share, 4%
platform growth and further margin expansion
compared to the pcp.
Average selling price decreased slightly from the
prior corresponding period to $20,348, while the
ANZ profit margin increased to 44.2% from 41.0%,
reflecting the focus on efficiency improvements
throughout the business and the expansion of
commercial models.
ANZ Outright Sales units and Average A$ Price /
unit
The ANZ business maintained its leading ship share
through ongoing expansion in the game portfolio,
together with an expanded HelixTM
cabinet
offering.
Aristocrat continues to deliver strong performance
across a number of product segments including
Multigame, Standalone and Linked Progressives.
Top performing new game releases supported this
momentum, including 5 Dragons EmpireTM
,
Lightning LinkTM
, Lightning CashTM
, Player’s Choice
Emerald EditionTM
and most recently the Dragon
LinkTM
& Dragon CashTM
titles.
The combination of a strong performing games
portfolio and differentiated cabinet offering
continues to provide greater choice and flexibility
for customers. Aristocrat will continue to invest in
core game innovation and cutting edge technology
to deliver market leading player experiences.
International Class III
Summary Profit or Loss
International Class III revenue and profit increased
21% and 43% respectively to $220 million and
$115 million compared to the prior corresponding
period.
Asia Pacific performance was strong, mainly driven
by large scale openings in the region where market
leading ship share was achieved. Lightning LinkTM
was launched in the region during the period.
Europe experienced strong growth over the period
primarily due to a new casino opening in South
Africa in addition to growth in recurring revenue
backed by the success of Lightning LinkTM
and
Game of ThronesTM
.
Constant currency Variance
A$ million 2017 2016 %
Revenue 431.7 412.7 4.6
Profit 190.6 169.1 12.7
Margin 44.2% 41.0% 3.2 pts
Constant currency Variance
A$ million 2017 2016 %
Revenue 220.1 181.1 21.5
Profit 115.1 80.5 43.0
Margin 52.3% 44.5% 7.8 pts
Class III Platforms 7,125 5,978 19.2
+4%Platform Growth
21
For
per
sona
l use
onl
y

Aristocrat Leisure Limited
Digital
Summary Profit or Loss
Digital revenues increased by 41% to A$395 million
in constant currency (A$383 million in reported
currency) driven by the ongoing success of Heart
of VegasTM
and the launch and scaling of Cashman
CasinoTM
in the period.
Segment profit margin of 41.5% is slightly lower
that the pcp due to costs associated with the
launch of Cashman CasinoTM
.
Daily active user (‘DAU’) numbers increased 36%
primarily due to the launch and scaling of
Cashman CasinoTM
, both on the Android platform
from December 2016 and the iOS platform from
June 2017.
Overall average revenue per daily active user
(ARPDAU) increased 26% to US 53c compared to
the pcp driven by increasingly sophisticated
product and marketing features, and strong
content releases, in particular Lightning LinkTM
.
Daily Active Users (DAU) and Average US$ net
revenue per DAU (ARPDAU)
The shift toward mobile continued throughout
2017, with users on mobile channels representing
85% of average DAU, up from 65% in the pcp.
Constant currency Variance
A$ million 2017 2016 %
Revenue 395.0 279.7 41.2
Profit 163.9 118.1 38.8
Margin 41.5% 42.2% (0.7) pts
+36%DAU Growth
22
For
per
sona
l use
onl
y
Aristocrat Leisure Limited
Operating and Financial Review
Principal Risks
Material risks to business strategies and
prospects for future financial years
Identifying and managing risks which may affect
the success of our strategy and financial prospects
for future years is an essential part of our
governance framework. While the Group has a
strong track record of managing a multitude of
risks, some inherent risks remain, many of which
are not directly within the control of the Group.
Our risk management approach involves the
ongoing assessment, monitoring and reporting of
risks which could impede our progress in delivering
our strategic priorities. Key management and staff
are responsible for the day-to-day management of
risks and implementation of risk management
plans. The Group also has an Internal Audit and
Risk Management function which, supported by
external advisors, provides independent and
objective assurance on the effectiveness of our
internal control processes.
A separate Strategic Risk Committee of the Board
has been established given the increased scale,
complexity and breadth of the Group’s business.
The Strategic Risk Committee will assist the Board
by monitoring key identified strategic (enterprise-
wide) risks and overseeing the Group’s risk
management strategy in connection with these
identified risks. This facilitates and integrated,
entreprise-wide approach to identifying and
managing key risks and a strong focus on specific
critical strategic risks.
The Group has established a formal risk
management framework, which is based on
ISO3100 Risk Management and the ASX Principles
and Recommendations. This framework is
supported by the Group’s Code of Conduct and
risk management policy. The policy defines
‘Extreme’ and ‘Very High’ business risks which,
once identified, are also captured on the global
risk register. Extreme and Very High business risks
are regularly reported to the Board via the Board
Audit Committee along with treatment plans and
controls. Any Extreme or Very High Strategic risk,
which would prevent a material part of the
strategy from being executed is regularly reported
to the Strategic Risk Committee.
The main risks affecting the Group are set out
below. The Group may also face a range of other
risks from time to time in conducting its business
activities. While it aims to manage risks in order to
avoid adverse impacts on its financial standing,
some risks are outside the control of the Group.
Changing economic conditions and other factors
affecting the gaming industry
Demand for our products and services can be
dependent upon favourable conditions in the
gaming industry, which is highly sensitive to
players’ disposable incomes and gaming
preferences. Discretionary spending on
entertainment activities could decline for reasons
beyond the Group’s control; for example, due to
negative economic conditions or natural disasters.
A decline in the relative health of the gaming
industry and the difficulty or inability of our
customers to obtain adequate levels of capital to
finance their ongoing operations might reduce the
resources available to purchase products and
services, which could affect Group revenues.
To address this we are working to develop and
deliver new and innovative technologies and
products to meet customer needs and working to
partner with our customers to provide value
adding solutions.
23
For
per
sona
l use
onl
y

Aristocrat Leisure Limited
Litigation and contingent liabilities
From time to time, the Group may be subject to
material litigation, regulatory actions, legal or
arbitration proceedings and other contingent
liabilities which, if they crystallise, may adversely
affect the Group’s results.
Increasing competition
Competition in the gaming industry (both land-
based and online) has intensified from the
consolidation of existing competitors as well as the
entry of new competitors. Increasingly, price,
reliability and product innovation are among the
factors affecting a provider’s success in selling its
products.
As traditional land-based markets continue to
mature, the Group’s success and profitability is
dependent in part on our ability to successfully
enter new segments in existing markets and new
markets as well as new distribution channels, such
as mobile and online gaming.
To address this we continue to invest in key skills
and talent and have also strengthened our insights
function to enhance our ability to produce
innovative new product portfolios to drive entry
into new markets and support share growth.
Government gaming regulation
The global gaming industry is subject to extensive
governmental regulation. While the regulatory
requirements vary by jurisdiction, most require:
(a) licences and/or permits;
(b) findings of suitability;
(c) documentation of qualifications, including
evidence of financial stability; and
(d) individual suitability of officers, directors, major
shareholders and key employees.
Changes in laws or regulations or the manner of
their interpretation or enforcement could impact
the Group’s financial performance and restrict our
ability to operate our business or execute our
strategies. Difficulties or delays in obtaining or
maintaining required licences or approvals could
also have a negative impact on the business.
A material breach of internal processes may result
in violation of existing regulations which could also
impact our ability to maintain required licenses or
approvals.
Gaming laws and regulations serve to protect the
public and ensure that gaming related activity is
conducted honestly, competitively, and free of
corruption. A change in government (or
governmental policy towards gaming) may also
impact our operations. This political risk increases
in jurisdictions where there is significant anti-
gaming opposition or vocal minority interests.
The Group has established a comprehensive
regulatory assurance function and governance
framework to ensure that we continue to monitor
the political environment and regulations in the
jurisdictions in which we operate and to monitor
our adherence to internal processes to ensure we
comply with existing regulations.
Cyber risk and privacy regulation
The cyber security and privacy regulatory
environment is continuing to evolve. Aristocrat is
focused on further strengthening its governance,
processes and technology controls to continue to
protect the integrity and privacy of data, and
maintain compliance with regulatory
requirements. The Group’s ongoing investment in
cyber transformation initiatives, together with its
Control and Risk Framework operate to reduce the
likelihood of cyber security incidents, ensuring
early detection and the mitigation of impact.
Tax
The risk that changes in tax law (including goods
and services taxes and stamp duties), or changes in
the way tax laws are interpreted in the various
jurisdictions in which the Group operates, may
impact the tax liabilities of the Group and the
assets in which it holds an interest. The Group
seeks to manage this risk by monitoring changes in
legislation, utilising external tax and legal advisors
and employing highly experienced qualified
24
For
per
sona
l use
onl
y

Aristocrat Leisure Limited
accounting and tax experts who regularly monitor
the taxation relevant to the Group’s operations.
Aristocrat has implemented a Tax Governance
Framework which sets out the Company’s
approach to tax risk management and governance,
tax strategy and dealing with revenue authorities.
In addition Aristocrat has chosen to adopt the
Board of Taxation’s Voluntary Tax Transparency
Code of 2016 and prepares a Voluntary Tax
Transparency Code Report. In accordance with
that code, Aristocrat discloses details such as
corporate income taxes paid by and effective tax
rates of, Aristocrat. This report is posted on the
Aristocrat website. The report can also be viewed
at the Voluntary Tax Transparency Code central
website, administered by the ATO.
Fluctuations in foreign exchange rates and
interest rates
The Group operates internationally and is exposed
to foreign exchange risk arising from various
currency exposures, primarily with respect to the
US dollar and Euro.
Foreign exchange risk arises from future
commercial transactions and recognised assets
and liabilities denominated in a currency that is
not the entity’s functional currency. The risk is
measured using sensitivity analysis and cash flow
forecasting. The Group’s foreign exchange hedging
policy is to reduce the foreign exchange risk
associated with transactional exposures, primarily
over a 12 month horizon. External foreign
exchange contracts are designated at the Group
level as hedges of foreign exchange risk on specific
foreign currency denominated transactions. The
debt issue used to partly fund the acquisition of
Video Gaming Technologies Inc. resulted in an
increase in the Group’s total debt and also
resulted in a level of debt which is exposed to a
floating rate of interest. The Group is therefore
exposed to movements in interest rates. The
Group seeks to mitigate this risk with a capital
management strategy which examines periodic
debt pay down and with the implementation, and
continued assessment, of an interest rate hedging
strategy.
Ability to manage and frequently introduce
innovative products on a timely basis
The Group’s success is dependent on its ability to
develop and sell new products that are attractive
to casino operators and other gaming enterprises
and their customers, for both land-based and
online gaming operations. If the Group’s land-
based or online gaming content does not meet or
sustain revenue and profitability expectations, it
may be replaced or we may experience a
reduction in revenue generated and an increased
exposure to obsolete inventory. Therefore, success
depends upon the Group’s ability to continue to
produce technologically sophisticated land-based
and online products that meet its customers’
needs and achieve high levels of player appeal and
sustainability. Further, newer products are
generally more sophisticated than those produced
in the past and the Group must continually refine
design, production and approval capabilities to
meet the needs of its product innovation.
The Group has invested, and intends to continue
to invest, significant resources into its insights
function, research and development efforts and
the acquisition of key talent to mitigate this risk.
25
For
per
sona
l use
onl
y

ARISTOCRAT LEISURE LIMITED Remuneration Report 2017
REMUNERATION REPORT
'
REPORT
This Remuneration Report for the 12 months ended 30 September 2017 (Reporting Period or FY2017) forms part of the Directors’ Report and has been audited as required by section 308(3C) of the Corporations Act 2001 (Cth) (the Act).
SECTION 1 MAINTAINING SUSTAINABLE
PERFORMANCE Aristocrat’s remuneration strategy and framework is based on a ‘pay for performance’ philosophy. The Board is confident the current remuneration framework has supported and driven its business strategy and Group out-performance.
Aristocrat is one of a small group of ASX listed companies that derives the majority of its revenues from overseas markets and is genuinely global in its structure and operations. Aristocrat’s senior leadership is predominantly US based, and the business must increasingly attract and retain leaders in the US market with technology and global management skillsets that will require an evolution in its approach to remuneration. US market practice (in particular) places a greater emphasis on at-risk opportunity, and significant equity grants are more commonly used for talent attraction and retention, than is typically the case in Australia.
The Board will continue to review the structure of Aristocrat’s incentive schemes to ensure they are competitive and effective in helping the business to retain and attract the leadership and talent it needs to drive business strategy and financial performance in the interests of shareholders.
Any changes will continue to reflect Aristocrat’s ‘pay for performance’ philosophy and drive shareholder value.
STI outcome
Senior Executives received on average 176% of their STI target award, supported by NPATA increasing by 36.5% to $543.4 million (in reported currency) from the prior corresponding period.
This strong NPATA growth was driven by continued growth across all key segments and through continued share gains across broadly flat markets.
Strong FCF of 129% of target.
LTI outcome
Based on sustained long term performance over the three year period to 30 September 2017, 100% of PSRs awarded under the 2015 LTI Grant vested following testing against the Relative TSR and Relevant EPS performance measures in November 2017, and converted into shares.
The Relative TSR component (30% of total grant) vested as Aristocrat’s annual compounded TSR of 296.07%, with Aristocrat 2nd in its Peer Comparator Group and ranked at the 98.95th percentile.
The Relevant EPS component (30% of total grant) vested at 100% based on the delivery of a three-year EPS CAGR of 54.4%.
26
For
per
sona
l use
onl
y

ARISTOCRAT LEISURE LIMITED Remuneration Report 2017
REMUNERATION REPORT
'
REPORT
SECTION 2 REMUNERATION REPORT OVERVIEW This Remuneration Report has been prepared in accordance with section 300A of the Corporations Act 2001 (Cth) (the Act) for Aristocrat Leisure Limited and its controlled entities (Group) for the year ended 30 September 2017.
Table 1 below outlines the KMP and their movements during FY2017
KMP Position Term as KMP
Non-Executive Directors
ID Blackburne Chair; Director Full financial year
DCP Banks Director Full financial year
KM Conlon Director Full financial year
RA Davis Director Retired on 27 February 2017
RV Dubs Director Full financial year
SW Morro Lead US Director1 Full financial year
P Ramsey Director2 Full financial year
Nominated on 13 September 2016
AM Tansey Director Full financial year
S Summers Couder Director Full financial year
Executive KMP
T Croker CEO and Managing Director (from 1 March 2017) 3 Full financial year
A Korsanos CFO, Global Services and Company Secretary Full financial year
J Sevigny President, Video Gaming Technologies Full financial year
JR Odell CEO and Managing Director Ceased to be employed on 28 February 2017
M Sweeny Chief Commercial Officer Ceased to be employed on 31 December 2016
1. One Non-Executive Director acts as the Lead US Director. The Lead US Director assists the Board with review and oversight of Aristocrat’s North American
business, which accounts for approximately 70% of Group revenue.2. Mr Ramsey was nominated by the Board on 13 September 2016 as a Non-Executive Director, subject to receipt of all relevant regulatory pre-approvals.
Pending regulatory approval, Mr Ramsey was a Director (Elect). Necessary regulatory pre-approvals were received and Mr Ramsey’s appointment as a Non-Executive Director was confirmed by the Board on 28 October 2016.
3. Mr Croker was appointed as CEO and Managing Director (Elect) on 9 November 2016, and formally assumed the role of CEO and Managing Directoron 1 March 2017. Prior to his appointment as CEO and Managing Director (Elect), Mr Croker held the role of Executive VP - Global Products and Insights.
27
For
per
sona
l use
onl
y
ARISTOCRAT LEISURE LIMITED Remuneration Report 2017
REMUNERATION REPORT
REPORT
SECTION 3 SENIOR EXECUTIVE1 REMUNERATION PHILOSOPHY AND FRAMEWORK 3.1 Core principles
The following three core principles guide Aristocrat’s Senior Executive remuneration strategy and a ‘pay for performance’ framework:
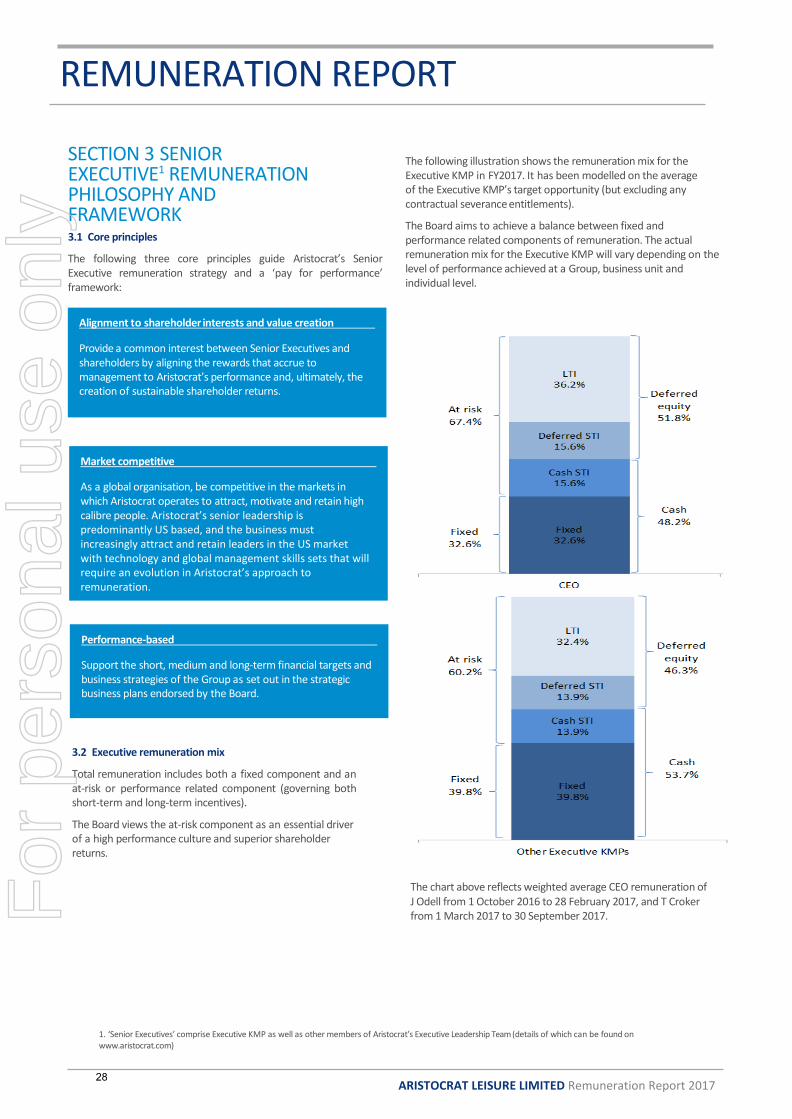
The following illustration shows the remuneration mix for the Executive KMP in FY2017. It has been modelled on the average of the Executive KMP’s target opportunity (but excluding any contractual severance entitlements).
The Board aims to achieve a balance between fixed and performance related components of remuneration. The actual remuneration mix for the Executive KMP will vary depending on the level of performance achieved at a Group, business unit and individual level.
Alignment to shareholder interests and value creation
Provide a common interest between Senior Executives and shareholders by aligning the rewards that accrue to management to Aristocrat’s performance and, ultimately, the creation of sustainable shareholder returns.
Market competitive
As a global organisation, be competitive in the markets in which Aristocrat operates to attract, motivate and retain high calibre people. Aristocrat’s senior leadership is predominantly US based, and the business must increasingly attract and retain leaders in the US market with technology and global management skills sets that will require an evolution in Aristocrat’s approach to remuneration.
Performance-based
Support the short, medium and long-term financial targets and business strategies of the Group as set out in the strategic business plans endorsed by the Board.
3.2 Executive remuneration mix
Total remuneration includes both a fixed component and an at-risk or performance related component (governing both short-term and long-term incentives).
The Board views the at-risk component as an essential driver of a high performance culture and superior shareholder returns.
The chart above reflects weighted average CEO remuneration of J Odell from 1 October 2016 to 28 February 2017, and T Croker from 1 March 2017 to 30 September 2017.
1. ‘Senior Executives’ comprise Executive KMP as well as other members of Aristocrat’s Executive Leadership Team (details of which can be found onwww.aristocrat.com)
28
For
per
sona
l use
onl
y
ARISTOCRAT LEISURE LIMITED Remuneration Report 2017
REMUNERATION REPORT
REPORT
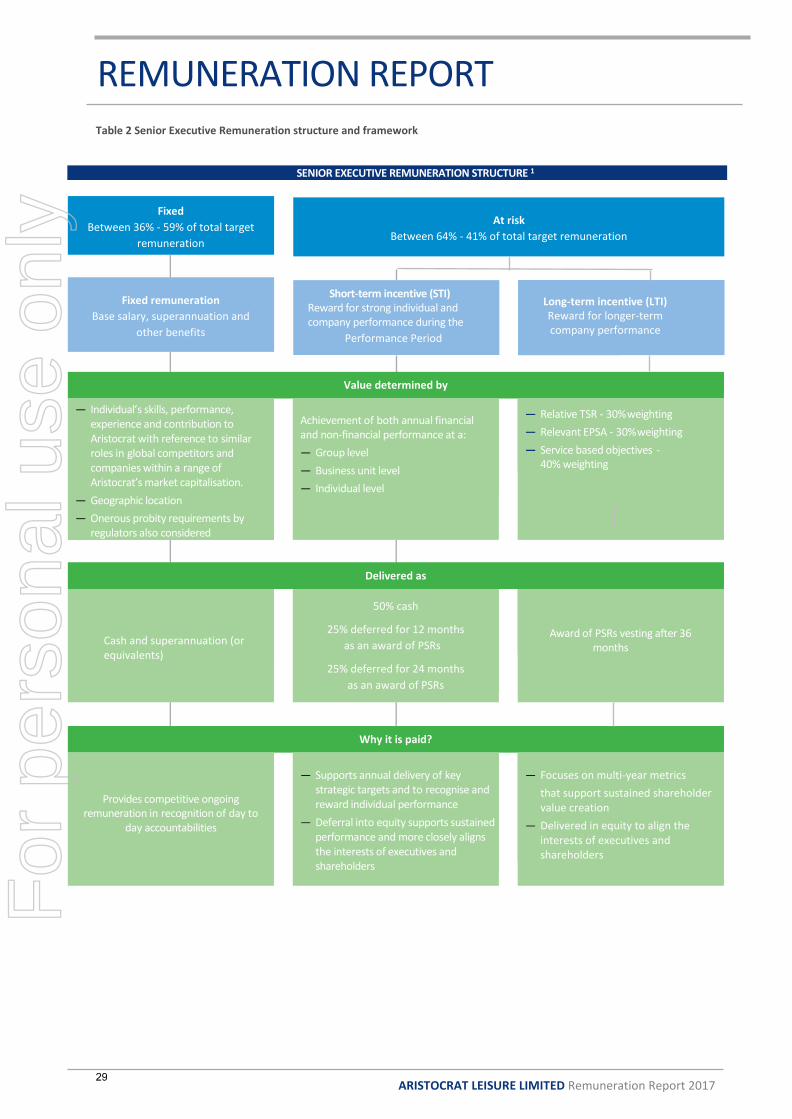
At risk
Between 64% - 41% of total target remuneration
Short-term incentive (STI) Reward for strong individual and company performance during the
Performance Period
Long-term in Reward for l company p
Long-term incentive (LTI) Reward for longer-term company performance
Table 2 Senior Executive Remuneration structure and framework
SENIOR EXECUTIVE REMUNERATION STRUCTURE 1
Value determined by
— Individual’s skills, performance, experience and contribution to Aristocrat with reference to similar roles in global competitors and companies within a range of Aristocrat’s market capitalisation.
— Geographic location
— Onerous probity requirements by regulators also considered
Achievement of both annual financial and non-financial performance at a:
— Group level
— Business unit level
— Individual level
— Relative TSR - 30% weighting
— Relevant EPSA - 30% weighting
— Service based objectives - 40% weighting
Delivered as
Cash and superannuation (or equivalents)
50% cash
25% deferred for 12 months
as an award of PSRs
25% deferred for 24 months
as an award of PSRs
Award of PSRs vesting after 36 months
Why it is paid?
Provides competitive ongoing remuneration in recognition of day to
day accountabilities
— Supports annual delivery of key strategic targets and to recognise and reward individual performance
— Deferral into equity supports sustained performance and more closely aligns the interests of executives and shareholders
— Focuses on multi-year metrics
that support sustained shareholder value creation
— Delivered in equity to align the interests of executives and shareholders
Fixed
Between 36% - 59% of total target
remuneration
Fixed remuneration
Base salary, superannuation and
other benefits
29
For
per
sona
l use
onl
y
ARISTOCRAT LEISURE LIMITED Remuneration Report 2017
REMUNERATION REPORT
REPORT
3.3 Elements of executive remuneration
3.3.1 Fixed remuneration
Senior Executives receive a competitive fixed remuneration comprising cash salary, superannuation and other benefits which make up the ‘fixed remuneration’ component of their total remuneration package.
Senior Executives have the choice to have a combination of benefits including additional superannuation contributions and the provision of a vehicle provided from their fixed remuneration. Senior Executives also (in certain instances) receive other benefits, including salary continuance, trauma, death and disability insurance. Senior Executives are able to maintain memberships to appropriate professional associations. As appropriate, expatriate executives receive additional support including accommodation allowances, travel and ad hoc taxation advice.
Senior Executives do not receive retirement benefits other than
those disclosed in Table 7.
3.3.2 STI Plan
What is the STI Plan?
Senior Executives have the opportunity to earn an annual incentive award which is delivered in cash and deferred equity awards (in the form of PSRs). The STI Plan recognises and rewards short-term performance.
How much can Senior Executives earn?
A target opportunity is set for each Senior Executive, which is earned if Group and individual performance is on target. For certain Senior Executives, in a region or business unit, a target opportunity is set which is earned if regional performance and individual performance is on target.
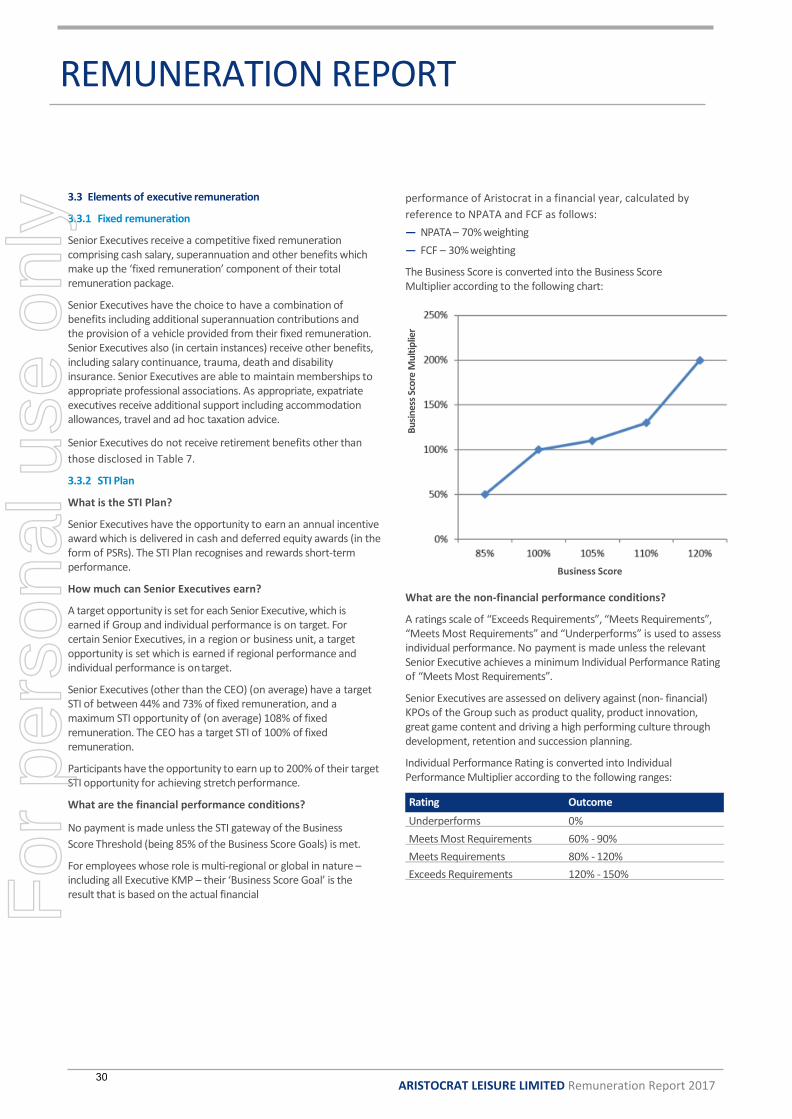
Senior Executives (other than the CEO) (on average) have a target STI of between 44% and 73% of fixed remuneration, and a maximum STI opportunity of (on average) 108% of fixed remuneration. The CEO has a target STI of 100% of fixed remuneration.
Participants have the opportunity to earn up to 200% of their target STI opportunity for achieving stretch performance.
What are the financial performance conditions?
No payment is made unless the STI gateway of the Business
Score Threshold (being 85% of the Business Score Goals) is met.
For employees whose role is multi-regional or global in nature – including all Executive KMP – their ‘Business Score Goal’ is the result that is based on the actual financial
performance of Aristocrat in a financial year, calculated by
reference to NPATA and FCF as follows:
— NPATA – 70% weighting
— FCF – 30% weighting
The Business Score is converted into the Business Score Multiplier according to the following chart:
Business Score
What are the non-financial performance conditions?
A ratings scale of “Exceeds Requirements”, “Meets Requirements”, “Meets Most Requirements” and “Underperforms” is used to assess individual performance. No payment is made unless the relevant Senior Executive achieves a minimum Individual Performance Rating of “Meets Most Requirements”.
Senior Executives are assessed on delivery against (non- financial) KPOs of the Group such as product quality, product innovation, great game content and driving a high performing culture through development, retention and succession planning.
Individual Performance Rating is converted into Individual Performance Multiplier according to the following ranges:
Underperforms 0%
Meets Most Requirements 60% - 90%
Meets Requirements 80% - 120%
Exceeds Requirements 120% - 150%
Rating Outcome
Bu
sin
ess
Sco
re M
ult
iplie
r
30
For
per
sona
l use
onl
y
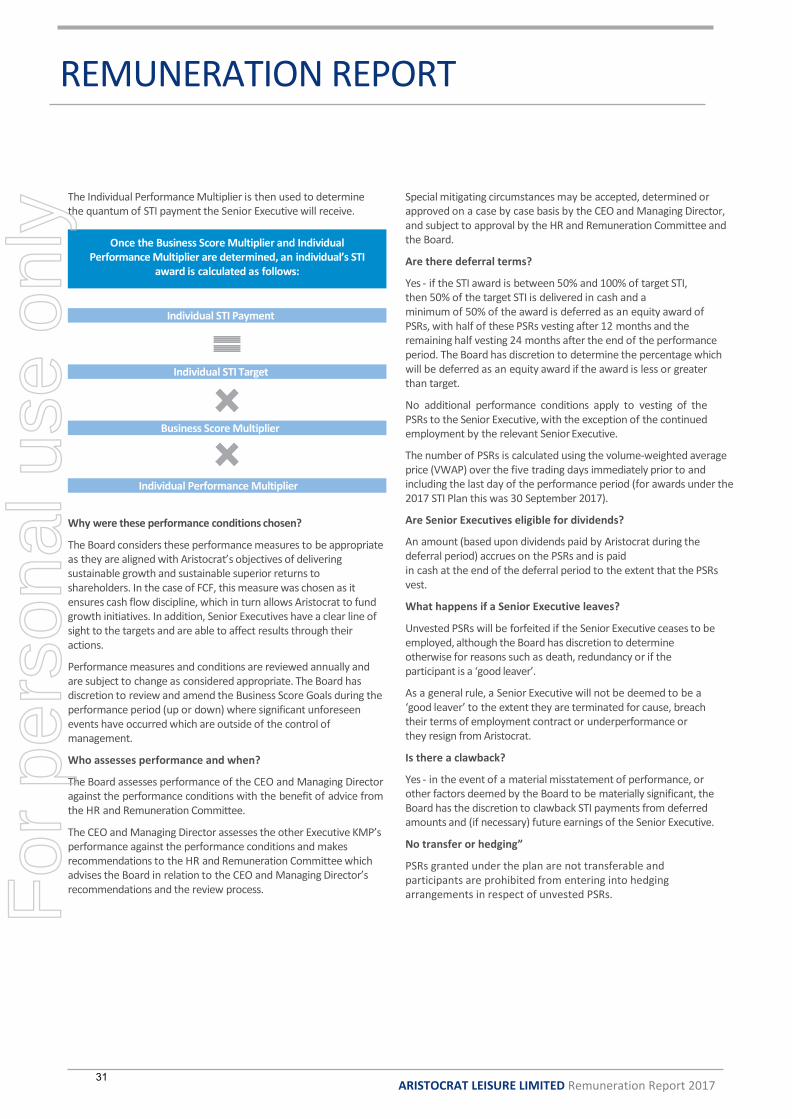
ARISTOCRAT LEISURE LIMITED Remuneration Report 2017
REMUNERATION REPORT
REPORT
The Individual Performance Multiplier is then used to determine the quantum of STI payment the Senior Executive will receive.
Individual STI Payment
Individual STI Target
Business Score Multiplier
Individual Performance Multiplier
Why were these performance conditions chosen?
The Board considers these performance measures to be appropriate as they are aligned with Aristocrat’s objectives of delivering sustainable growth and sustainable superior returns to shareholders. In the case of FCF, this measure was chosen as it ensures cash flow discipline, which in turn allows Aristocrat to fund growth initiatives. In addition, Senior Executives have a clear line of sight to the targets and are able to affect results through their actions.
Performance measures and conditions are reviewed annually and are subject to change as considered appropriate. The Board has discretion to review and amend the Business Score Goals during the performance period (up or down) where significant unforeseen events have occurred which are outside of the control of management.
Who assesses performance and when?
The Board assesses performance of the CEO and Managing Director against the performance conditions with the benefit of advice from the HR and Remuneration Committee.
The CEO and Managing Director assesses the other Executive KMP’s performance against the performance conditions and makes recommendations to the HR and Remuneration Committee which advises the Board in relation to the CEO and Managing Director’s recommendations and the review process.
Special mitigating circumstances may be accepted, determined or approved on a case by case basis by the CEO and Managing Director, and subject to approval by the HR and Remuneration Committee and the Board.
Are there deferral terms?
Yes - if the STI award is between 50% and 100% of target STI, then 50% of the target STI is delivered in cash and a minimum of 50% of the award is deferred as an equity award of PSRs, with half of these PSRs vesting after 12 months and the remaining half vesting 24 months after the end of the performance period. The Board has discretion to determine the percentage which will be deferred as an equity award if the award is less or greater than target.
No additional performance conditions apply to vesting of the PSRs to the Senior Executive, with the exception of the continued employment by the relevant Senior Executive.
The number of PSRs is calculated using the volume-weighted average price (VWAP) over the five trading days immediately prior to and including the last day of the performance period (for awards under the 2017 STI Plan this was 30 September 2017).
Are Senior Executives eligible for dividends?
An amount (based upon dividends paid by Aristocrat during the deferral period) accrues on the PSRs and is paid in cash at the end of the deferral period to the extent that the PSRs vest.
What happens if a Senior Executive leaves?
Unvested PSRs will be forfeited if the Senior Executive ceases to be employed, although the Board has discretion to determine otherwise for reasons such as death, redundancy or if the participant is a ‘good leaver’.
As a general rule, a Senior Executive will not be deemed to be a ‘good leaver’ to the extent they are terminated for cause, breach their terms of employment contract or underperformance or they resign from Aristocrat.
Is there a clawback?
Yes - in the event of a material misstatement of performance, or other factors deemed by the Board to be materially significant, the Board has the discretion to clawback STI payments from deferred amounts and (if necessary) future earnings of the Senior Executive.
No transfer or hedging”
PSRs granted under the plan are not transferable and participants are prohibited from entering into hedging arrangements in respect of unvested PSRs.
Once the Business Score Multiplier and Individual Performance Multiplier are determined, an individual’s STI
award is calculated as follows:
31
For
per
sona
l use
onl
y
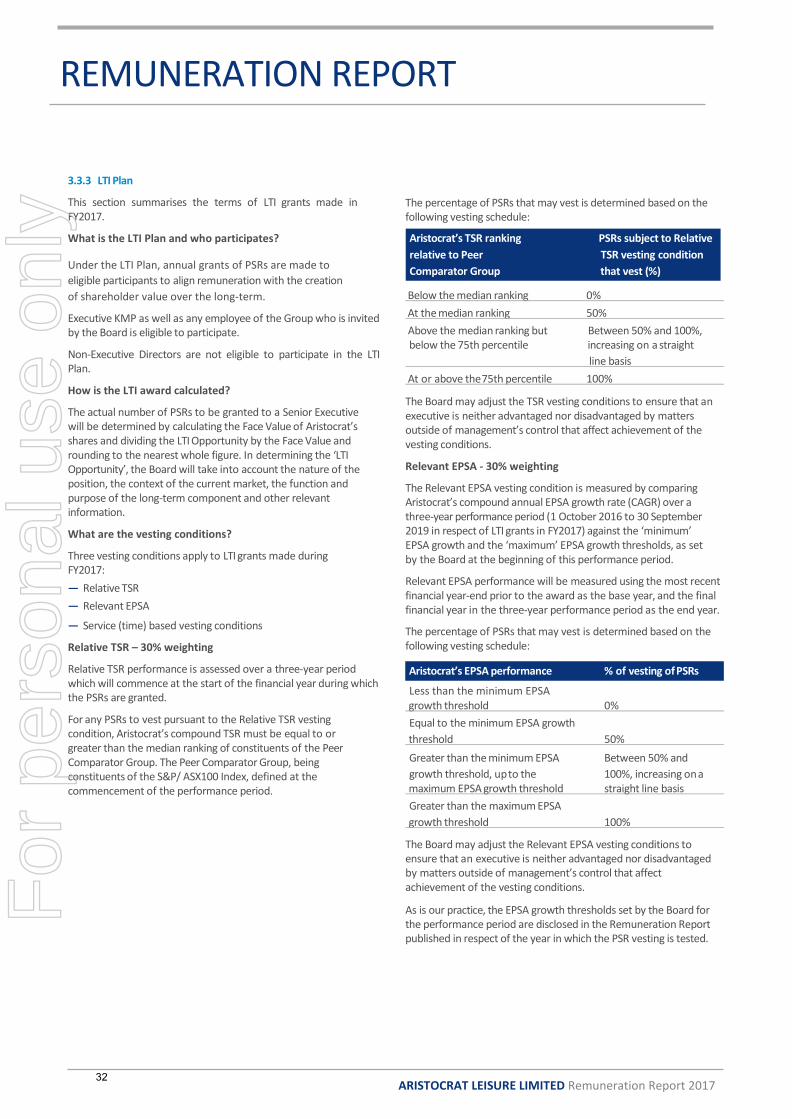
ARISTOCRAT LEISURE LIMITED Remuneration Report 2017
REMUNERATION REPORT
REPORT
Aristocrat’s TSR ranking PSRs subject to Relative
relative to Peer TSR vesting condition
Comparator Group that vest (%)
3.3.3 LTI Plan
This section summarises the terms of LTI grants made in FY2017.
What is the LTI Plan and who participates?
The percentage of PSRs that may vest is determined based on the following vesting schedule:
Under the LTI Plan, annual grants of PSRs are made to
eligible participants to align remuneration with the creation
of shareholder value over the long-term.
Executive KMP as well as any employee of the Group who is invited by the Board is eligible to participate.
Non-Executive Directors are not eligible to participate in the LTI Plan.
How is the LTI award calculated?
The actual number of PSRs to be granted to a Senior Executive will be determined by calculating the Face Value of Aristocrat’s shares and dividing the LTI Opportunity by the Face Value and rounding to the nearest whole figure. In determining the ‘LTI Opportunity’, the Board will take into account the nature of the position, the context of the current market, the function and purpose of the long-term component and other relevant information.
What are the vesting conditions?
Three vesting conditions apply to LTI grants made during FY2017:
— Relative TSR
— Relevant EPSA
— Service (time) based vesting conditions
Relative TSR – 30% weighting
Relative TSR performance is assessed over a three-year period which will commence at the start of the financial year during which the PSRs are granted.
For any PSRs to vest pursuant to the Relative TSR vesting condition, Aristocrat’s compound TSR must be equal to or greater than the median ranking of constituents of the Peer Comparator Group. The Peer Comparator Group, being constituents of the S&P/ ASX100 Index, defined at the commencement of the performance period.
Below the median ranking 0%
At the median ranking 50%
Above the median ranking but Between 50% and 100%, below the 75th percentile increasing on a straight
line basis
At or above the 75th percentile 100%
The Board may adjust the TSR vesting conditions to ensure that an executive is neither advantaged nor disadvantaged by matters outside of management’s control that affect achievement of the vesting conditions.
Relevant EPSA - 30% weighting
The Relevant EPSA vesting condition is measured by comparing Aristocrat’s compound annual EPSA growth rate (CAGR) over a three-year performance period (1 October 2016 to 30 September 2019 in respect of LTI grants in FY2017) against the ‘minimum’ EPSA growth and the ‘maximum’ EPSA growth thresholds, as set by the Board at the beginning of this performance period.
Relevant EPSA performance will be measured using the most recent financial year-end prior to the award as the base year, and the final financial year in the three-year performance period as the end year.
The percentage of PSRs that may vest is determined based on the following vesting schedule:
Less than the minimum EPSA growth threshold 0%
Equal to the minimum EPSA growth
threshold 50%
Greater than the minimum EPSA Between 50% and
growth threshold, up to the 100%, increasing on a maximum EPSA growth threshold straight line basis
Greater than the maximum EPSA
growth threshold 100%
The Board may adjust the Relevant EPSA vesting conditions to ensure that an executive is neither advantaged nor disadvantaged by matters outside of management’s control that affect achievement of the vesting conditions.
As is our practice, the EPSA growth thresholds set by the Board for the performance period are disclosed in the Remuneration Report published in respect of the year in which the PSR vesting is tested.
Aristocrat’s EPSA performance % of vesting of PSRs
32
For
per
sona
l use
onl
y
ARISTOCRAT LEISURE LIMITED Remuneration Report 2017
REMUNERATION REPORT
REPORT
Service (time) based vesting conditions - 40% weighting
The service (time) based element of the LTI Plan will vest subject to the participant being employed by a member of the Group for the entire three-year performance period, and having maintained at least a “Meets Most” individual performance rating (Service/Time Based Conditions).
Why were these vesting conditions chosen?
Relative TSR
— Ensures alignment between comparative shareholder return and reward for the executive
— Provides relative, objective, external, market-based performance measure against those companies with which Aristocrat competes for capital, customers and talent
— Is widely understood and accepted by key stakeholders
Relevant EPSA
— Is a relevant indicator of increases in shareholder value
— Neutralises the tax effected amortisation expense of acquired intangibles (most notably VGT), which is a non-cash charge and not representative of underlying performance of the business and cash flow generation
— Is a target that provides a suitable line of sight to encourage executive performance
Service (Time) Based
— Aristocrat is one of a small group of ASX listed companies that derives the majority of its revenues from overseas markets and is genuinely global in its structure and operations. Aristocrat’s senior leadership is predominantly US based, and the business must increasingly attract and retain leaders in the US market with technology and global management skillsets.
— A service based condition supports our LTI Plan being competitive to global and US peers who have elements of service based vesting (restricted stock).
Who assesses performance and when?
Relative TSR and Relevant EPSA results are calculated by Aristocrat and the external remuneration advisor tests these TSR results as soon as practicable after the end of the relevant performance period. The calculations are considered by the Board to determine vesting outcomes.
The vesting conditions are therefore tested only at the end of the performance period. There is no re-testing of vesting conditions.
Vesting
If PSRs vest, the Board has discretion to either issue new
shares or to acquire shares on-market to satisfy the vestings.
Shares allocated on vesting of the PSRs are subject to the terms of Aristocrat’s Share Trading Policy, and carry full dividend and voting rights upon allocation.
Are PSRs eligible for dividends?
Holders of LTI PSRs are not entitled to dividends until the PSRs have vested and converted into shares.
What happens if a Senior Executive leaves?
If a participant ceases employment during the first 12 months of the performance period then, regardless of the reason, any unvested PSRs lapse.
If a participant ceases employment after the first 12 months of the performance period, the Board has the express discretion to determine that some or all PSRs vest or lapse.
Where a participant acts fraudulently, dishonestly, joins a competitor or, in the Board’s opinion, is in breach of obligations owed to Aristocrat, then any unvested PSRs will lapse and unallocated shares are forfeited.
What happens in the event of a change of control?
There is no automatic vesting of PSRs on a change of control. The Board will (in its discretion) determine the appropriate treatment regarding PSRs in the event of a change of control. Where the Board does not exercise this discretion, there will be a pro rata vesting of PSRs based on the proportion of the performance period that has passed at the time of the change of control event.
No transfer or hedging
PSRs granted under the plan are not transferable and participants are prohibited from entering into hedging arrangements in respect of unvested PSRs.
33
For
per
sona
l use
onl
y

ARISTOCRAT LEISURE LIMITED Remuneration Report 2017
REMUNERATION REPORT
REPORT
SECTION 4 REMUNERATION OUTCOMES IN FY2017 AND LINK TO BUSINESS STRATEGY AND GROUP PERFORMANCE 4.1 Senior Executive remuneration
Remuneration strategy and link to business strategy and Group performance in connection with FY2017 remuneration outcomes
This Remuneration Report discloses the outcome of awards made under the 2015 LTI Grant, under which the following three vesting conditions apply:
— a Relative TSR vesting condition (30% weighting);
— a Relevant EPSA vesting condition (30% weighting); and
— Strategic Objectives (for Mr Odell, who was CEO at the time of the grant) and Service (Time) Based (for others) vesting condition (40% weighting).
Senior Executive remuneration outcomes disclosed in this Remuneration Report are linked and aligned to delivery of shareholder value over the short and longer term, rewarding the strong results delivered across the relevant STI and LTI performance periods (including in FY2017).
34
For
per
sona
l use
onl
y

ARISTOCRAT LEISURE LIMITED Remuneration Report 2017
REMUNERATION REPORT
REPORTSo, Aristocrat’s
actual performance…
EXCEEDED
NPATA increasing by 36.5% to $543.4 million (in reported currency) significantly exceeded STI target
Achieved strong FCF of 129% of target
Aristocrat achieved a TSR of 296.07% over the 2015 LTI grant performance period, 2nd its Peer Comparator Group and ranked at the 98.95th percentile
Compounded EPS growth rate of 54.4% exceeded set targets
Revenue increased by more than 15% in broadly flat markets to a new record level of above $2.45b
EXCEEDED
In excess of 50% of Group revenues now derive from recurring sources
Digital revenues increased by 36.9% to $383 million (in reported currency)
Launch of multi app strategy, with successful new apps such as Cashman Casino
Acquisition of Israeli-based social gaming company (Plarium Global Ltd), which significantly expands Aristocrat’s addressable digital opportunity by around eight times – to around US$25bn of value - and the proportion of Aristocrat’s revenues that derive from recurring sources
EXCEEDED
Market leading share maintained in ANZ and Asia Pacific with continued growth
Strong growth in North American segment driven by significant
expansion in premium gaming operations footprint and outright
sales
Continued share gains were achieved across broadly flat key
markets and segments
MET
Continued to increase ROI in both D&D and corporate expenses, and consolidation of suppliers driving efficiencies in supply chain
EXCEEDED
For the 2nd year running, Product Madness was awarded the prestigious ‘Social Operator’ of the year award 2016 at the eGaming Review Awards in London. EILERS Slot Survey Q2 2017 (July 2017):
- top performing premium leased game – Lightning Link – 5th quarter in a row, Buffalo 3rd (2 of top 3)
- top performing casino owned games –Buffalo and Wonder Wheels (2 of top 3)
- most anticipated games – Dragon Link
Aristocrat voted industry’s top G2E supplier for the 4th year in a row.
MET
Year over year improvement in our global engagement survey results with both participation levels and overall results well above industry and global benchmarks
Ongoing focus on developing leaders resulting in high levels of internal promotions including onto the Senior Leadership Team.
Successful CEO transition
Increased level of talent and capability across the Group, with focus on critical talent retention
Table 3 below discloses remuneration outcomes in FY2017 and alignment to business strategy and Group performance
Directly affects remuneration outcomes
Total LTI vesting outcome in FY2017 =
100% of target
based on TSR
and EPSA
performance
measures
CEO STI outcome in FY2017 =
170% of target
Average STI outcome in FY2017 for other Executive KMP =
145% of target
Business strategy and objectives…
Are reflected in LTI
and STI performance measures…
Financial performance
STI performance measure of NPATA
Measures profitability across the Group
STI performance measure of FCF
Measures free cash flow generated by the Group
LTI performance measure of Relative TSR Measures the benefit delivered to shareholders over three years, including dividend payments and movement in the share price over and above a market benchmark
LTI performance measure of Relevant EPS Measures profitability across the Group on a per share basis
Grow recurring revenue
base
STI Individual performance rating Measures include sustainable growth in US Gaming Operations
Market share – continue
momentum
STI Individual performance rating Measures include sustainability of strong market position in Australia and growth in North American market share
Cost
efficiencies
STI Individual performance rating
Measures include managing and improving cost
efficiency as a proportion of revenue
Product quality, product
innovation and great
game content
STI Individual performance rating Measures include product quality and delivery and product innovation and great game content. Measures also include attracting, developing and retaining gaming design talent
High performing People and
Culture
STI Individual performance rating Measures include development, retention and succession planning across all management levels and for creative talent
35
For
per
sona
l use
onl
y
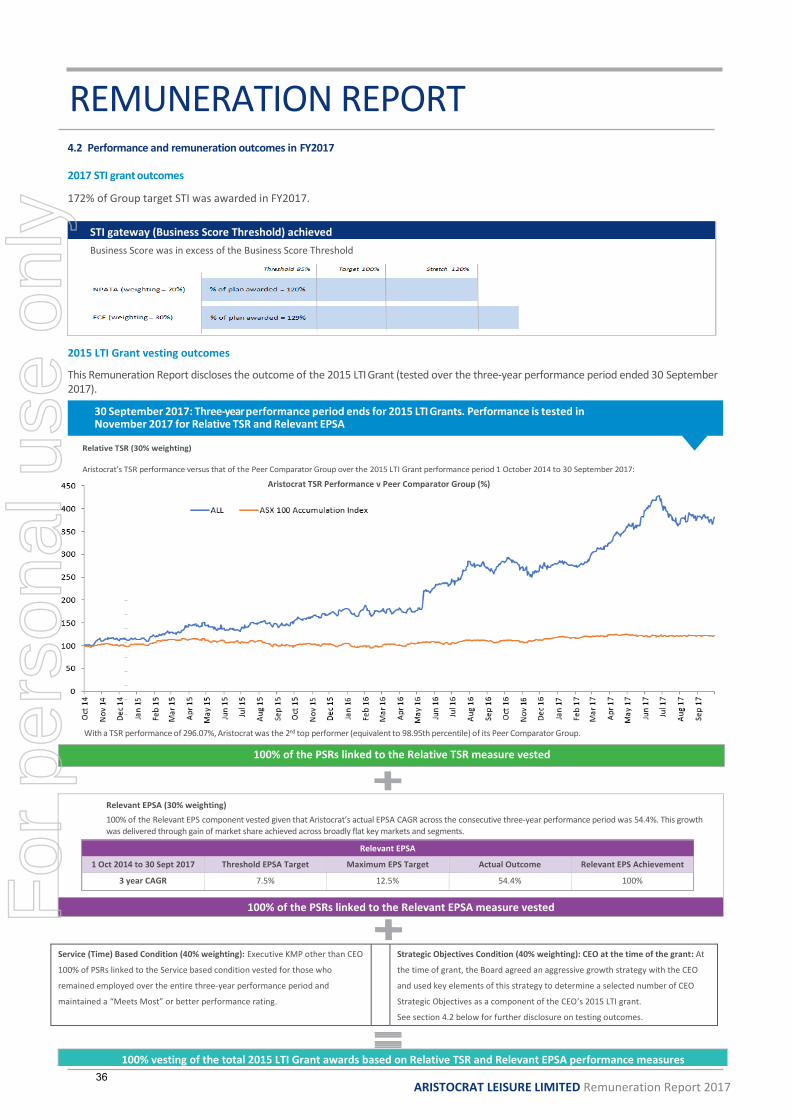
ARISTOCRAT LEISURE LIMITED Remuneration Report 2017
REMUNERATION REPORT
REPORT4.2 Performance and remuneration outcomes in FY2017
2017 STI grant outcomes
172% of Group target STI was awarded in FY2017.
STI gateway (Business Score Threshold) achieved
Business Score was in excess of the Business Score Threshold
2015 LTI Grant vesting outcomes
This Remuneration Report discloses the outcome of the 2015 LTI Grant (tested over the three-year performance period ended 30 September 2017).
Service (Time) Based Condition (40% weighting): Executive KMP other than CEO
100% of PSRs linked to the Service based condition vested for those who
remained employed over the entire three-year performance period and
maintained a “Meets Most” or better performance rating.
Strategic Objectives Condition (40% weighting): CEO at the time of the grant: At
the time of grant, the Board agreed an aggressive growth strategy with the CEO
and used key elements of this strategy to determine a selected number of CEO
Strategic Objectives as a component of the CEO’s 2015 LTI grant.
See section 4.2 below for further disclosure on testing outcomes.
Relevant EPSA (30% weighting)
100% of the Relevant EPS component vested given that Aristocrat’s actual EPSA CAGR across the consecutive three-year performance period was 54.4%. This growth was delivered through gain of market share achieved across broadly flat key markets and segments.
100% of the PSRs linked to the Relevant EPSA measure vested
100% vesting of the total 2015 LTI Grant awards based on Relative TSR and Relevant EPSA performance measures
30 September 2017: Three-year performance period ends for 2015 LTI Grants. Performance is tested in November 2017 for Relative TSR and Relevant EPSA
With a TSR performance of 296.07%, Aristocrat was the 2nd top performer (equivalent to 98.95th percentile) of its Peer Comparator Group.
Relative TSR (30% weighting)
Aristocrat’s TSR performance versus that of the Peer Comparator Group over the 2015 LTI Grant performance period 1 October 2014 to 30 September 2017:
Aristocrat TSR Performance v Peer Comparator Group (%)
100% of the PSRs linked to the Relative TSR measure vested
Relevant EPSA
1 Oct 2014 to 30 Sept 2017 Threshold EPSA Target Maximum EPS Target Actual Outcome Relevant EPS Achievement
3 year CAGR 7.5% 12.5%
12.5%
54.4% 100%
36
For
per
sona
l use
onl
y

ARISTOCRAT LEISURE LIMITED Remuneration Report 2017
REMUNERATION REPORT
REPORT
Outcome of CEO Strategic Objectives Testing
At the time of grant, the Board set three defined categories of Strategic Objectives for the then CEO: (i) digital strategy and growth, (ii) Foundations for recurring revenue growth (including in the Class II market), and (iii) people and succession planning.
At the end of the 2015 LTI grant performance period the Board measured achievement of the Strategic Objectives condition based on a qualitative assessment of performance against these objectives during the three year LTI grant performance period.
80.47% of the Strategic Objectives component was eligible for testing given that Mr Odell ceased to be employed in February 2017 (before expiry of the performance period, which ended on 30 September 2017). 85% of the amount of the Strategic Objectives component that was eligible for testing vested given strong performance across all three of the abovementioned defined categories of Strategic Objectives.
4.3 Alignment between remuneration and Group performance
Numerous elements of Aristocrat’s remuneration strategy and framework are directly linked to Group performance.
The table below sets out information about movements in shareholder wealth for the financial years ended 30 September 2013 to 30 September 2017, highlighting alignment between Aristocrat’s remuneration strategy and framework and Group performance over the past 5 years.
Further details about the Group’s performance over this period can be found in the Five-Year Summary contained in this Annual Report.
Table 4 Summary of movement in shareholder wealth
12 months to
30 Sep 2017
12 months to
30 Sep 2016
12 months to
30 Sep 2015
12 months to
30 Sep 2014
12 months to
30 Sep 2013
Share price as at financial year-end (A$) 21.00 15.81 8.61 5.84 4.62
Total dividends paid (cps) 34.0 25.0 17.0 16.0 14.5
EPS (fully diluted)/EPSA (fully diluted)
(cps)1
77.5/85.0 54.9/62.4 30.1/37.1 22.8/23.1 19.4
TSR (%) 35% 87% 50% 30% 77%
Short-term cash incentives (% of Group
target)
172% 176% 170% 110% 66%
LTI (% vesting) based on Relative TSR and
Relevant EPSA performance measures
100% 100% 94% 30% 0%
1. Excluding the effect of significant items which are not representative of the underlying operational performance of the Group.
37
For
per
sona
l use
onl
y
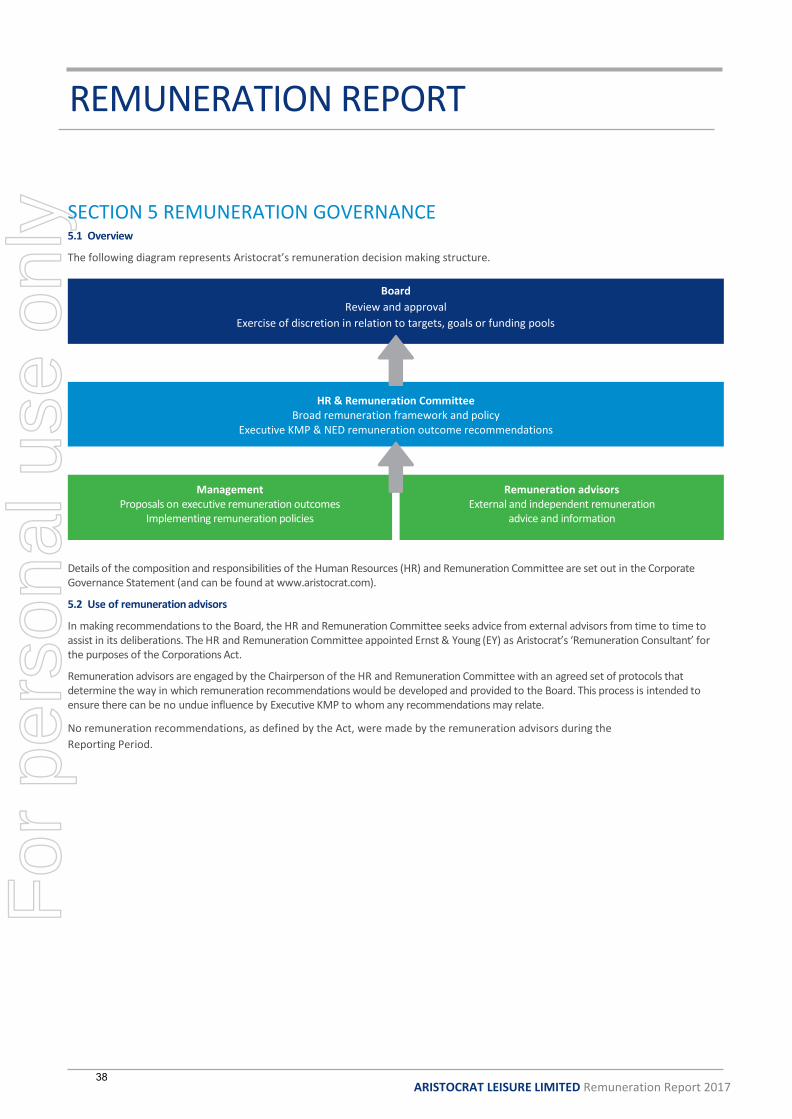
ARISTOCRAT LEISURE LIMITED Remuneration Report 2017
REMUNERATION REPORT
REPORT
Management Proposals on executive remuneration outcomes
Implementing remuneration policies
Remuneration advisors External and independent remuneration
advice and information
SECTION 5 REMUNERATION GOVERNANCE 5.1 Overview
The following diagram represents Aristocrat’s remuneration decision making structure.
Board
Review and approval
Exercise of discretion in relation to targets, goals or funding pools
HR & Remuneration Committee Broad remuneration framework and policy
Executive KMP & NED remuneration outcome recommendations
Details of the composition and responsibilities of the Human Resources (HR) and Remuneration Committee are set out in the Corporate Governance Statement (and can be found at www.aristocrat.com).
5.2 Use of remuneration advisors
In making recommendations to the Board, the HR and Remuneration Committee seeks advice from external advisors from time to time to assist in its deliberations. The HR and Remuneration Committee appointed Ernst & Young (EY) as Aristocrat’s ‘Remuneration Consultant’ for the purposes of the Corporations Act.
Remuneration advisors are engaged by the Chairperson of the HR and Remuneration Committee with an agreed set of protocols that determine the way in which remuneration recommendations would be developed and provided to the Board. This process is intended to ensure there can be no undue influence by Executive KMP to whom any recommendations may relate.
No remuneration recommendations, as defined by the Act, were made by the remuneration advisors during the
Reporting Period.
38
For
per
sona
l use
onl
y
ARISTOCRAT LEISURE LIMITED Remuneration Report 2017
REMUNERATION REPORT
REPORT
5.3 Service agreements
The remuneration and other terms of employment for the Executive KMP are formalised in service agreements, which have no specified term. Each of these agreements provide for performance related bonuses under the STI program, and participation, where eligible, in the Group’s LTI program. Other major provisions of the service agreements of the Executive KMP are as follows:
Table 5 Service agreements
Notice to be given Notice to be given Termination payment Post-employment by Executive by Group1 restraint
CEO and Managing Director
T Croker 6 months 12 months 12 months (fixed remuneration) 12 months
Other Executive KMP
A Korsanos 6 months 6 months 12 months (fixed remuneration) 12 months
J Sevigny 2 months - 12 months (fixed remuneration) 12 months
1. Payments may be made in lieu of notice period.
The key terms of Mr Odell and Mrs Sweeny’s service agreements have been outlined in previous years’ Remuneration Reports and are not restated here given their departures from the positions of CEO & Managing Director and Chief Operating Officer, respectively.
5.4 Key terms of JR Odell’s arrangements relating to cessation of employment
Jamie Odell departed the business on 28 February 2017 after a remarkably successful eight-year tenure.
Mr Odell’s termination entitlements were in accordance with those previously announced to the market. In particular:
— Payment: Mr Odell received $1,655,412 as payment in connection with termination of his employment (inclusive of any payment in lieu of notice).
— 2017 STI: Mr Odell remained eligible for a pro rata FY2017 STI award, meaning his total STI award in FY2017 was $1,168,750. Mr Odell’s STI outcome in FY2017 STI was 170% of target and he will consequently receive a cash payment of $584,375, and $584,375 will be deferred for up to 24 months in the form of PSRs.
— 2015 LTI grant: 94% of Mr Odell’s total 2015 LTI grant awards vested (on a pro rata basis, relative to the portion of the performance period he remained employed) as follows:
• 100% of PSRs linked to the Relative TSR measure vested
• 100% of PSRs linked to the Relevant EPSA measure vested
• 85% of the Strategic Objectives component that was eligible for testing vested.
— 2016 LTI grant: Mr Odell remains eligible for a pro rata portion of his unvested 2016 LTI grant (subject to testing in the normal course of Aristocrat’s incentive process and in the same way as other participants).
Mr Odell was not granted an LTI award in FY2017.
As announced to the market on 27 February 2017, Mr Odell agreed a twelve-month consultancy arrangement with Aristocrat to support a smooth transition with an appropriate level of continuity.
5.5 Disclosures under Listing Rule 4.10.22
A total of 2,001,145 securities were acquired on-market by the Aristocrat Employee Equity Trust during the Reporting Period (at an average price per security of $22.9185) to satisfy Aristocrat’s obligations under various equity and related plans.
5.6 Share trading policy
Aristocrat’s share trading policy prohibits the use of Derivatives (as defined in the policy) in relation to unvested equity instruments, including PSRs and vested securities which are subject to disposal restrictions. Derivatives may be used in relation to vested positions which are not subject to disposal restrictions, subject to compliance with the other provisions of the share trading policy.
Senior Executives are strictly prohibited from entering into a margin loan or similar funding arrangement to acquire Aristocrat’s securities and from using Aristocrat securities as security for a margin loan or similar funding arrangements.
Breaches of Aristocrat’s share trading policy are regarded very seriously and may lead to disciplinary action being taken (including termination of employment).
39
For
per
sona
l use
onl
y
ARISTOCRAT LEISURE LIMITED Remuneration Report 2017
REMUNERATION REPORT
REPORT
SECTION 6 NON-EXECUTIVE DIRECTOR REMUNERATION Details of the Non-Executive Directors of Aristocrat during
the Reporting Period are provided in the Directors’ Report.
6.1 Overview of policy
The remuneration of the Non-Executive Directors is not linked to the performance of the Group in order to maintain their independence and impartiality. In setting fee levels, the HR and Remuneration Committee, which makes recommendations to the Board, obtains advice from an independent remuneration advisor and takes into account the demands and responsibilities associated with the
Directors’ roles and the global scope and highly regulated environment in which the Group operates. The Board will continue to review its approach to Non-Executive Director remuneration to ensure it remains in line with high standards of corporate governance.
6.2 Components and details of Non-Executive Director remuneration
Non-Executive Directors receive a fixed fee (inclusive of superannuation and committee memberships) for services to the Board. The Chair of each committee receives an additional fee for that service.
Table 6 Non-Executive Director fees payable during the Reporting Period
Board fees per annum1 Amount (inclusive of all statutory superannuation
obligations and committee service)
Chairman $460,000
Non-Executive Director $215,000
Lead US Director Additional $40,000
Committee Chair Additional $25,000
1. Fees paid to Australian-based Non-Executive Directors are paid in AUD. Fees paid to US-based Non-Executive Directors are paid in USD converted at a rate of A$1 to US$1. Inclusive of statutory superannuation obligations made on behalf of Australian-based Non-Executive Directors.
There were no increases in Board or Committee fees for the Reporting Period.
The regulatory requirements of the environment in which Aristocrat operates impose a considerable burden on the Non-Executive Directors and their families who are required to disclose detailed personal and financial information and submit to interviews, including in foreign jurisdictions. These requirements are taken into account in determining the fees payable to Non-Executive Directors.
Regard is also had to time commitments required of Non-Executive Directors in connection with the number of Board and Committee meetings that Non-Executive Directors attend each year.
Non-Executive Directors are entitled to be reimbursed for all reasonable business related expenses, including travel, as may be incurred in the discharge of their duties.
Aristocrat does not make sign-on payments to new Non- Executive Directors and the Board does not provide for retirement allowances for Non-Executive Directors.
Given the large amount of work undertaken by the Board during the Reporting Period, particularly in relation to the diligence, negotiation and execution of the Plarium acquisition and associated debt financing, it was determined that each Non-Executive Director will receive a fixed sum of A$15,000 in addition to the fees noted above.
6.3 Aggregate fee pool approved by shareholders
Non-Executive Directors’ fees (including committee fees) are set by the Board within the maximum aggregate amount of A$2,750,000 approved by shareholders at the AGM in February 2016.
40
For
per
sona
l use
onl
y

ARISTOCRAT LEISURE LIMITED Remuneration Report 2017
REMUNERATION REPORT
REPORT
SECTION 7 STATUTORY REMUNERATION TABLES AND DATA 7.1 Details of Executive KMP remuneration
The following table reflects the accounting value of remuneration attributable to Executive KMP, derived from the various components of their remuneration. This does not necessarily reflect actual amounts paid to Executive KMP due to the conditional nature (for example, performance criteria) of some of these accrued amounts.
As required by the Accounting Standards, the table includes credits for PSRs which were forfeited during the year and the amortised value of PSRs that may vest in future reporting periods.
Table 7 Statutory Executive KMP remuneration table
Long Term
BenefitsTotal
% of Share
Based
Executive Year Cash Salary1 Cash Bonuses2 Non-Monetary
Benefits3 Superannuation Termination4 Long Service
Leave5 STI PSRs7 LTI PSRs8 TOTAL %
CEO & Managing Director
2017 857,917 414,375 23,686 28,333 - 78,090 365,156 577,821 2,345,378 24.6%
2016 557,000 330,000 103,303 30,000 - 9,303 315,000 382,218 1,726,824 22.1%
2017 673,836 584,375 36,107 13,665 1,655,412 11,146 1,821,875 706,070 5,502,486 12.8%
2016 1,617,205 1,650,000 17,497 32,795 - 27,010 1,430,000 2,136,896 6,911,403 30.9%
Executive KMP
2017 797,740 572,000 7,797 19,760 800,000 33,769 700,583 381,511 3,313,160 11.5%
2016 695,616 495,000 150 19,385 - 14,399 422,250 613,347 2,260,147 27.1%
2017 282,880 - - - 812,018 - (398,241) (218,298) 478,359 (45.6%)
2016 804,760 521,989 - - - - 613,472 479,706 2,419,927 19.6%
2017 742,185 288,956 - - - - 372,178 413,454 1,816,773 22.8%
2016 767,522 443,690 - - - - 327,842 256,129 1,795,183 14.3%
2017 3,354,558 1,859,706 67,590 61,758 3,267,430 123,005 2,861,551 1,860,558 13,456,156 13.8%
2016 4,442,103 3,440,679 120,950 82,180 - 50,712 3,108,564 3,868,296 15,113,484 25.6%
1. Amounts shown as cash salary and fees include amounts sacrificed in l ieu of other benefits at the discretion of the individual. To the extent that benefits are paid and subject to Fringe Benefits Tax (FBT), the above amount includes FBT.
2. Amounts reflect the non-deferred cash component of the 2017 STI incentives.
3. Non-monetary benefits include insurance and travel costs, relocation costs, expatriate related costs and associated FBT.
4. Termination payments reflect payments in connection with the termination of employment (inclusive of any payments in l ieu of notice).
5. The amounts provided for by the Group during the financial year in relation to accruals for long service leave.
9. M Sweeny left the Company on 31 December 2016.
6. In accordance with the requirements of the Australian Accounting Standards, remuneration includes a proportion of the fair value of equity compensation granted or outstanding during the year. The fair value of equity instruments which do not vest during the reporting
period is determined as at the grant date and is progressively allocated over the vesting period. The amount included as remuneration is not related to or indicative of the benefit (if any) that individual Executive KMP may ultimately realise should the equity instruments vest.
An independent accounting valuation for each tranche of PSRs at their respective grant dates has been performed by EY. In undertaking the valuation of the PSRs, EY has used a TSR model and an EPSA model. These models are described below:
TSR model – EY uses the Monte-Carlo simulation-based model which incorporates the impact of performance hurdles and the vesting scale on the value of the PSRs. This pricing model takes into account factors such as the Company’s share price at the date of grant, volatil ity
of the underlying shares, the risk-free rate of return, expected dividend yield and the likelihood that vesting conditions will be met. The accounting valuation of rights issued is allocated equally over the vesting period.
EPSA model – The Binomial Tree model was used to determine the fair value of PSRs. This pricing model takes into account factors such as the Company’s share price at the date of grant, the risk-free rate of return, expected dividend yield and time to maturity. The accounting
valuation of rights issued is allocated over the vesting period so as to take into account the expected level of vesting over the performance period. For the purposes of remuneration packaging, the ’face value’ (volume-weighted average price for the 5 trading days up to and
including the day before the start of the performance period) is adopted for determining the total number of PSRs to be allocated as this valuation best reflects the fair value of PSRs to each executive at that time. The requirements of AASB 2 in relation to the treatment of non-
market vesting conditions, such as earnings per share growth and share-based remuneration requiring shareholder approval, results in accounting expense and disclosures differing from the value allocated for the purposes of remuneration packaging.
7. A component of STI awards payable to Executive KMP will be satisfied by the grant of deferred share rights. Half will vest after one year, with the remainder vesting after two years, both subject to relevant forfeiture conditions. The accounting expense for STI share rights
represents the expense attributable to the service period that has been completed for each deferred award. Therefore, the amounts reflected for the 12 months to 30 September 2017 include the accounting accruals attributable to deferred share rights pursuant to the 2015,
2016 and 2017 STI awards.
8. The share-based payments expense includes the impact of PSRs that were granted in previous years that are being expensed for accounting purposes over the vesting period, as well as the PSRs that were granted in the reporting period. Remuneration in the form of PSRs
includes credits for the earnings per share (EPS) component of 2015 LTI grant forfeited during the period.
Short Term Benefits Post-Employment Benefits Share-Based Payments 6
Total
T Croker
JR Odell
A Korsanos
M Sweeny9
J Sevigny
41
For
per
sona
l use
onl
y

ARISTOCRAT LEISURE LIMITED Remuneration Report 2017
REMUNERATION REPORT
REPORT
Table 8 Details of 2017 short term awards paid and deferred
Table 9 Details of LTI PSRs granted to Executive KMP, including their related parties, during the Reporting Period
Performance rights with a three-year performance period were granted during the Reporting Period as follows:
Rights granted Value of grant ($)
T Croker 62,838 964,377
A Korsanos 42,416 650,962
J Sevigny 30,753 471,971
The fair value of the rights that were granted on 28 March 2017 are $11.91 for rights with a total shareholder return condition and $16.82 for rights with a service condition. The values shown in the above table represent the maximum value of the grants made. The minimum value is zero. The performance conditions for the grants are set out in Section 3.3.3.
For the 12 months ended
30 September 2017Total Award1 Cash Payment2 Deferred
component3
No. Share Rights
vesting
No Share Rights
vesting
Total award as %
of target STI
% of total award
deferred
$ $ $ 1 Oct 20183 1 Oct 20193
T Croker 828,750 414,375 414,375 10,072 10,072 170% 50%
A Korsanos 1,144,000 572,000 572,000 13,904 13,904 160% 50%
J Sevigny 569,879 288,956 280,923 6,828 6,828 130% 50%
JR Odell 1,168,750 584,375 584,375 14,205 14,205 170% 50%
M Sweeny - - - - - - -
1. Amounts reflect the value of the total 2017 awards. See footnotes 2 and 3 for an explanation of the cash and deferred components of the total award.
2. Amounts reflect the cash component of the 2017 awards paid to participants. Amounts in USD are translated at the average rate for the year.
CEO & Managing Director
Other Executive KMP
Former Executive KMP
3. Amounts reflect the value of 2017 awards deferred into PSRs. Part of the deferred component of awards will vest on 1 October 2018 and the remainder on 1 October 2019. The number of PSRs is determined
using the five day VWAP up to and including 30 September 2017, being $20.57. Amounts in USD are translated at the FX rate on the grant date.
42
For
per
sona
l use
onl
y

ARISTOCRAT LEISURE LIMITED Remuneration Report 2017
REMUNERATION REPORT
REPORT
Table 10 Details of the movement in numbers of LTI PSRs during the Reporting Period
T Croker 220,781 62,838 (116,304) - 167,315
A Korsanos 326,142 42,416 (141,304) - 227,254
J Sevigny 98,361 30,753 - - 129,114
JR Odell 1,127,148 - (435,000) - 692,148
M Sweeny 186,672 - - (122,704) 63,968
1. The value of the PSRs granted to Executive KMP during the year (including the aggregate value of PSRs granted) is set out in Table 9. No options were granted during the year toany Executive KMP.
2. The value of each PSR on the date of vesting is the closing price of the Company’s shares on the ASX on the preceding trading day. 3. As shares are immediately allocated upon the vesting of PSRs, there will be no instances where PSRs are vested and exercisable, or vested but not yet exercisable.
7.2 Details of Non-Executive Director remuneration
Table 11 Details of Non-Executive Director remuneration for the Reporting Period
Post-Employment
Benefits
Post-Employment
Benefits
Share-Based
PaymentsTOTAL
Directors Year Cash Salary & Fees1 Fees for extra
services2 Superannuation3 Retirement
Benefits4 Options and PSRs $
2017 428,334 15,000 31,666 - - 475,000
2016 436,769 - 23,231 - - 460,000
2017 79,797 - 7,772 - - 87,569
2016 196,347 - 18,653 - - 215,000
2017 219,178 15,000 20,822 - - 255,000
2016 219,178 - 20,822 - - 240,000
2017 334,742 15,000 - - - 349,742
2016 345,684 - - - - 345,684
2017 219,178 15,000 20,822 - - 255,000
2016 219,178 - 20,822 - - 240,000
2017 219,178 15,000 20,822 - - 255,000
2016 219,178 - 20,822 - - 240,000
2017 196,347 15,000 18,653 - - 230,000
2016 98,929 - 9,398 - - 108,327
2017 298,422 15,000 - - - 313,422
2016 28,088 - - - - 28,088
2017 282,237 15,000 - - - 297,237
2016 - - - - - -
2017 2,277,413 120,000 120,557 - - 2,517,970
2016 1,763,351 - 113,748 - - 1,877,099
3. Superannuation contributions include amounts required to satisfy the Group’s obligations under applicable Superannuation Guarantee legislation.
4. Non-Executive Directors are not entitled to any retirement benefit.
Short Term Benefits
2. Given the large amount of work undertaken by the Board during the reporting period, particularly in relation to the dil igence, negotiation and execution of the Plarium acquisition and associated debt
financing, it was determined that each Non-Executive Director will receive a fixed sum of A$15,000.
Total
PJ Ramsey
S Summers Couder
A Tansey
1. Amounts shown as cash salary and fees include amounts sacrificed in l ieu of other benefits at the discretion of the individual. To the extent that any non- monetary benefits are subject to Fringe Benefits
Tax (FBT), amounts shown include FBT.
ID Blackburne
KM Conlon
DCP Banks
SW Morro
RV Dubs
RA Davis
Balance at Granted during Balance at 30
1 October 2016 the year1 Vested2,3 Lapsed/ forfeited September 2017
43
For
per
sona
l use
onl
y

ARISTOCRAT LEISURE LIMITED Remuneration Report 2017
REMUNERATION REPORT
REPORT
SECTION 8 SHAREHOLDINGS 8.1 Movement in shares
The number of shares (excluding those unvested under the STI Plan and the LTI Plan) in Aristocrat held during the year ended 30 September
2017 by each Non-Executive Director and Executive KMP, including their personally related entities, are set out below.
No amounts are unpaid on any of the shares issued. Where shares are held by the Director or Executive KMP and any entity under the joint or several controls of the Director or Executive KMP, they are shown as ‘beneficially held’. Shares held by those who are defined by AASB 124 Related Party Disclosures as close members of the family of the Director or Executive KMP or are held through a nominee or custodian are shown as ‘non-beneficially held’.
The following sets out details of the movement in shares in Aristocrat held by Non-Executive Directors or their related parties during the year:
Table 12 Details of Non-Executive Director shareholdings
Non-Executive Directors
Type
Balance as at 1
October 2016
Performance
shares vested
Other net changes during
the year
Balance as at 30
September 2017
ID Blackburne Beneficially held - - - -
Non-beneficially held 137,851 - - 137,851
DCP Banks Beneficially held - - - -
Non-beneficially held 30,851 - - 30,851
KM Conlon Beneficially held - - - -
Non-beneficially held 10,514 - - 10,514
RA Davis (retired on
27 February 2017)
Beneficially held 19,335 - - 19,335
Non-beneficially held 14,005 - - 14,005
RV Dubs Beneficially held 32,851 - - 32,851
Non-beneficially held - - - -
SW Morro Beneficially held - - - -
Non-beneficially held 35,000 - 5,000 40,000
P Ramsey Beneficially held 19,360 - - 19,360
Non-beneficially held - - - -
AM Tansey Beneficially held - - - -
Non-beneficially held - - 1,570 1,570
S Summers Couder Beneficially held - - - -
Non-beneficially held - - - -
All equity instrument transactions between the Non-Executive Directors, including their related parties, and Aristocrat during
the year have been on arm’s length basis.
44
For
per
sona
l use
onl
y

ARISTOCRAT LEISURE LIMITED Remuneration Report 2017
REMUNERATION REPORT
REPORT
The following sets out details of the movement in shares in Aristocrat held by Executive KMP or their related parties during the year:
Table 13 Details of Executive KMP shareholdings not held under an employee share plan
Executive Director and other Executive KMP
Type
Balance as at 1
October 2016
Performance
shares vested
Other net changes during
the year
Balance as at 30
September 2017
Other than share-based payment compensation effected through an employee share plan, all equity instrument transactions between
Executive KMP, including their related parties, and Aristocrat during the year have been on arm’s length basis.
8.2 Loans with KMP
No KMP or their related parties held any loans from the Group during or at the end of the year ended 30 September 2017 or prior year.
T Croker Beneficially held 332,897 156,210 (225,000) 264,107
Non-beneficially held - - - -
A Korsanos Beneficially held 360,353 177,754 (35,000) 503,107
Non-beneficially held - - - -
J Sevigny Beneficially held - - - -
Non-beneficially held - - - -
JR Odell Beneficially held 1,404,505 560,298 (435,000) 1,529,803
Non-beneficially held - - - -
M Sweeny Beneficially held 32,263 16,729 - 48,992
Non-beneficially held - - - -
45
For
per
sona
l use
onl
y
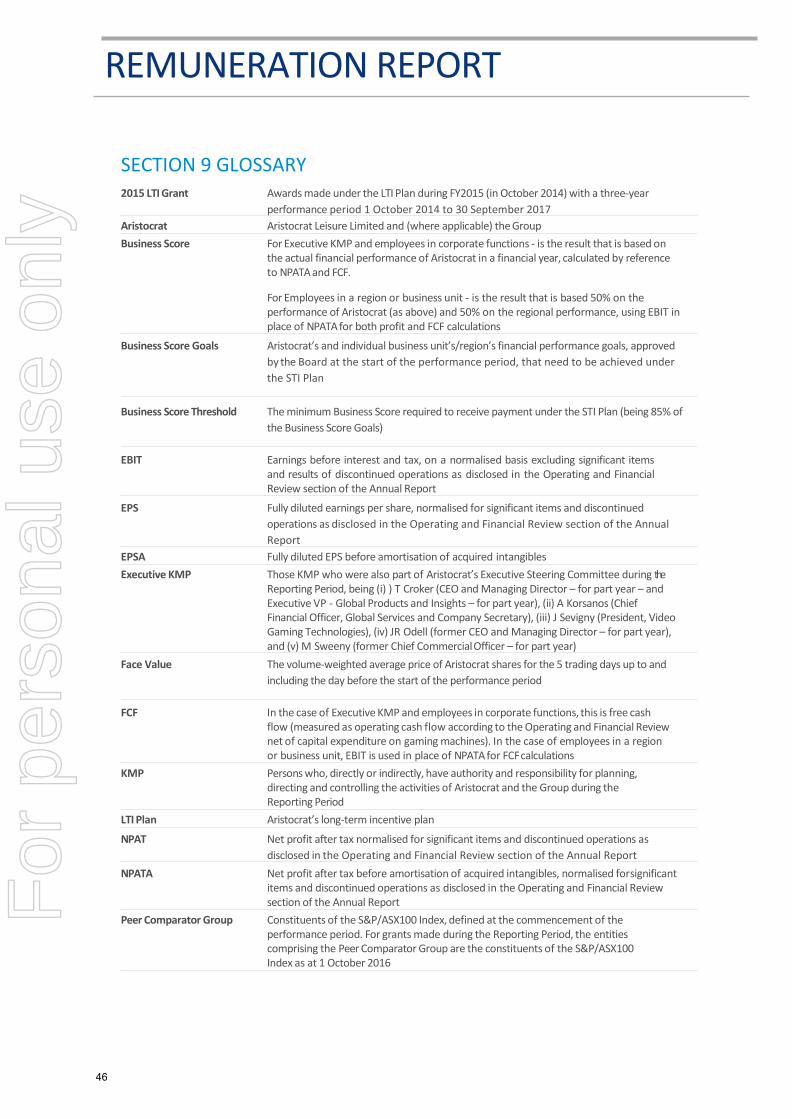
REMUNERATION REPORT
REPORTSECTION 9 GLOSSARY 2015 LTI Grant Awards made under the LTI Plan during FY2015 (in October 2014) with a three-year
performance period 1 October 2014 to 30 September 2017
Aristocrat Aristocrat Leisure Limited and (where applicable) the Group
Business Score For Executive KMP and employees in corporate functions - is the result that is based on the actual financial performance of Aristocrat in a financial year, calculated by reference to NPATA and FCF.
For Employees in a region or business unit - is the result that is based 50% on the performance of Aristocrat (as above) and 50% on the regional performance, using EBIT in place of NPATA for both profit and FCF calculations
Business Score Goals Aristocrat’s and individual business unit’s/region’s financial performance goals, approved
by the Board at the start of the performance period, that need to be achieved under
the STI Plan
Business Score Threshold The minimum Business Score required to receive payment under the STI Plan (being 85% of
the Business Score Goals)
EBIT Earnings before interest and tax, on a normalised basis excluding significant items and results of discontinued operations as disclosed in the Operating and Financial Review section of the Annual Report
EPS Fully diluted earnings per share, normalised for significant items and discontinued
operations as disclosed in the Operating and Financial Review section of the Annual
Report
EPSA Fully diluted EPS before amortisation of acquired intangibles
Executive KMP Those KMP who were also part of Aristocrat’s Executive Steering Committee during the Reporting Period, being (i) ) T Croker (CEO and Managing Director – for part year – and Executive VP - Global Products and Insights – for part year), (ii) A Korsanos (Chief Financial Officer, Global Services and Company Secretary), (iii) J Sevigny (President, Video Gaming Technologies), (iv) JR Odell (former CEO and Managing Director – for part year), and (v) M Sweeny (former Chief Commercial Officer – for part year)
Face Value The volume-weighted average price of Aristocrat shares for the 5 trading days up to and
including the day before the start of the performance period
FCF In the case of Executive KMP and employees in corporate functions, this is free cash flow (measured as operating cash flow according to the Operating and Financial Review net of capital expenditure on gaming machines). In the case of employees in a region or business unit, EBIT is used in place of NPATA for FCF calculations
KMP Persons who, directly or indirectly, have authority and responsibility for planning, directing and controlling the activities of Aristocrat and the Group during the Reporting Period
LTI Plan Aristocrat’s long-term incentive plan
NPAT Net profit after tax normalised for significant items and discontinued operations as
disclosed in the Operating and Financial Review section of the Annual Report
NPATA Net profit after tax before amortisation of acquired intangibles, normalised for significant items and discontinued operations as disclosed in the Operating and Financial Review section of the Annual Report
Peer Comparator Group Constituents of the S&P/ASX100 Index, defined at the commencement of the performance period. For grants made during the Reporting Period, the entities comprising the Peer Comparator Group are the constituents of the S&P/ASX100 Index as at 1 October 2016
46
For
per
sona
l use
onl
y
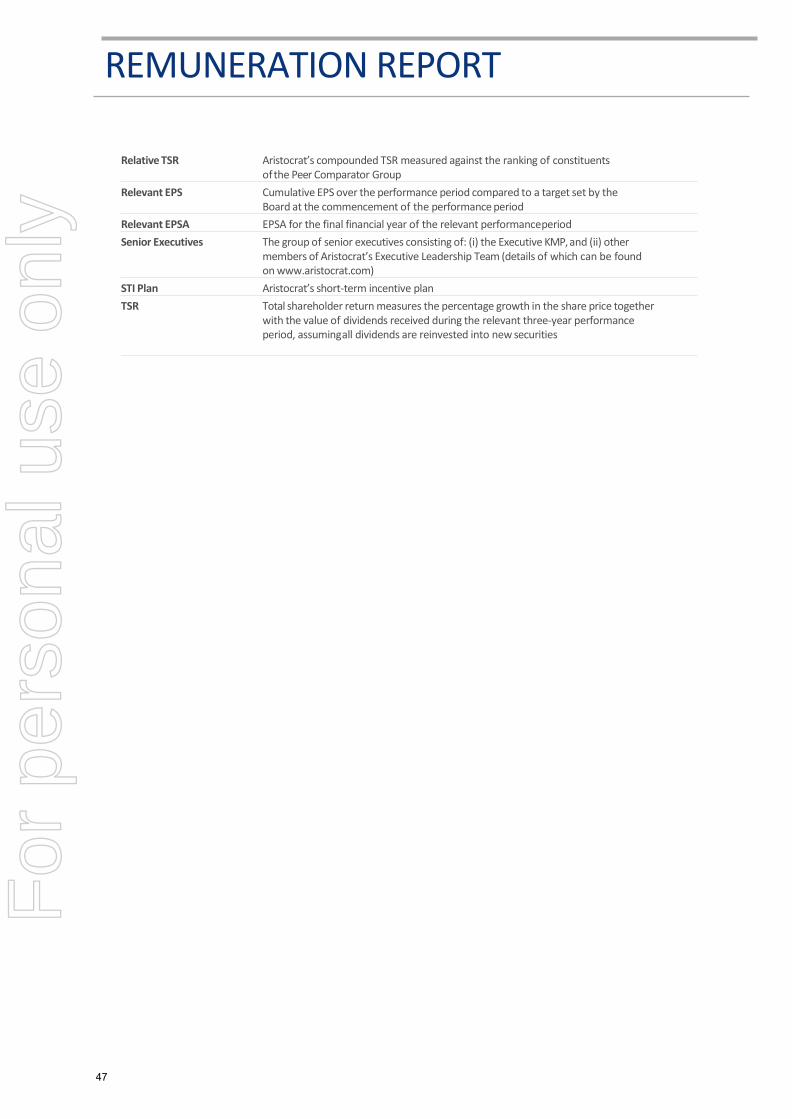
REMUNERATION REPORT
REPORT
Relative TSR Aristocrat’s compounded TSR measured against the ranking of constituents of the Peer Comparator Group
Relevant EPS Cumulative EPS over the performance period compared to a target set by the Board at the commencement of the performance period
Relevant EPSA EPSA for the final financial year of the relevant performance period
Senior Executives The group of senior executives consisting of: (i) the Executive KMP, and (ii) other members of Aristocrat’s Executive Leadership Team (details of which can be found on www.aristocrat.com)
STI Plan Aristocrat’s short-term incentive plan
TSR Total shareholder return measures the percentage growth in the share price together with the value of dividends received during the relevant three-year performance period, assuming all dividends are reinvested into new securities
47
For
per
sona
l use
onl
y
PricewaterhouseCoopers, ABN 52 780 433 757One International Towers Sydney, Watermans Quay, Barangaroo, GPO BOX 2650, SYDNEY NSW 2001T: +61 2 8266 0000, F: +61 2 8266 9999, www.pwc.com.auLiability limited by a scheme approved under Professional Standards Legislation.
Auditor’s Independence Declaration
As lead auditor for the audit of Aristocrat Leisure Limited for the year ended 30 September 2017, Ideclare that to the best of my knowledge and belief, there have been:
(a) no contraventions of the auditor independence requirements of the Corporations Act 2001 inrelation to the audit; and
(b) no contraventions of any applicable code of professional conduct in relation to the audit.
This declaration is in respect of Aristocrat Leisure Limited and the entities it controlled during theperiod.
MK Graham SydneyPartner 30 November 2017PricewaterhouseCoopers
For
per
sona
l use
onl
y

Aristocrat Leisure Limited ABN 44 002 818 368
Consolidated financial statements for the year ended 30 September 2017
Aristocrat
Aristocrat Leisure Limited
Financial statements for the year ended 30 September 2017 1
For
per
sona
l use
onl
y
Contents
Statement of profit or loss and other comprehensive income 3
Balance sheet 4
Statement of changes in equity 5
Cash flow statement 6
Notes to the financial statements
1 Business performance
1-1 Segment performance 7
1-2 Revenues 8
1-3 Expenses 9
1-4 Taxes 10
1-5 Earnings per share 12
1-6 Dividends 12
2 Operating assets and liabilities
2-1 Trade and other receivables 13
2-2 Inventories 14
2-3 Intangible assets 15
2-4 Property, plant and equipment 17
2-5 Trade and other payables 17
2-6 Provisions 18
3 Capital and financial structure
3-1 Borrowings 19
3-2 Financial assets and financial liabilities 20
3-3 Reserves and retained earnings 21
3-4 Contributed equity 22
3-5 Net tangible assets per share 22
3-6 Capital and financial risk management 22
4 Group structure
4-1 Business combinations 26
4-2 Subsidiaries 26
5 Employee benefits
5-1 Key management personnel 27
5-2 Share-based payments 27
6 Other disclosures
6-1 Commitments and contingencies 31
6-2 Events occurring after reporting date 32
6-3 Remuneration of auditors 32
6-4 Related parties 32
6-5 Parent entity financial information 32
6-6 Deed of cross guarantee 33
6-7 Basis of preparation 35
Directors' declaration 37
Financial statements
Aristocrat Leisure Limited
Financial statements for the year ended 30 September 2017 2
For
per
sona
l use
onl
y
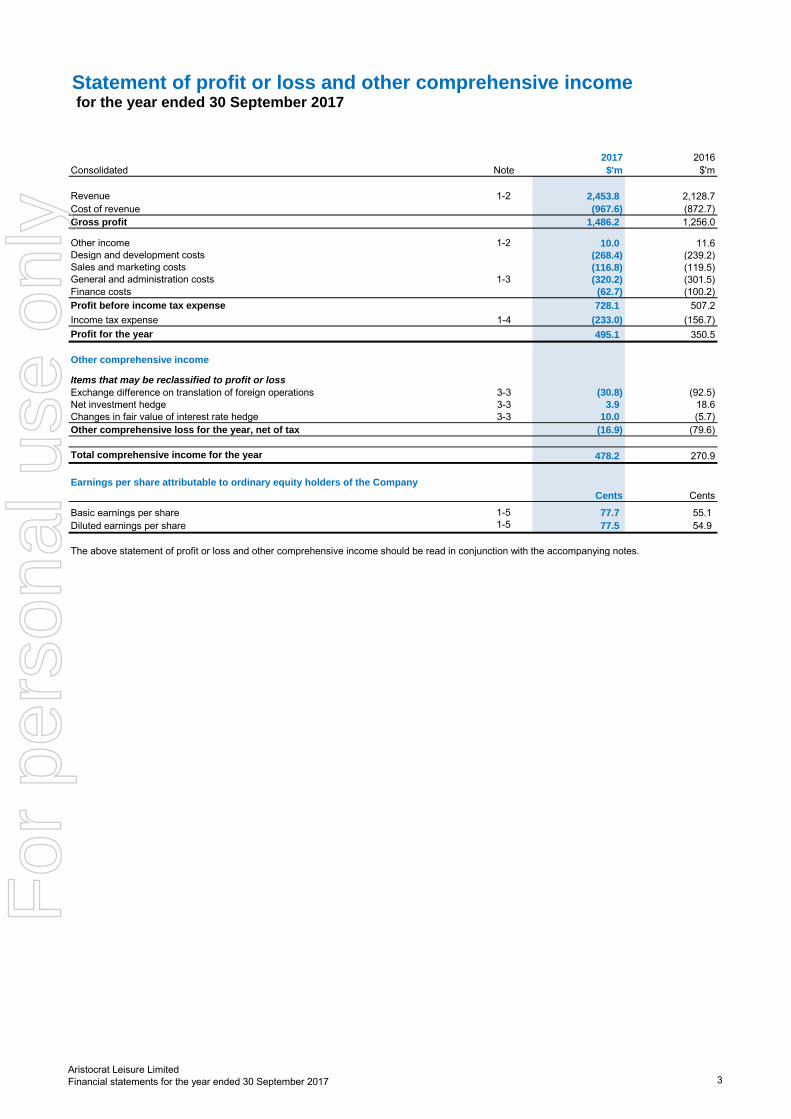
for the year ended 30 September 2017
2017 2016
Consolidated Note $'m $'m
Revenue 1-2 2,453.8 2,128.7
Cost of revenue (967.6) (872.7)
Gross profit 1,486.2 1,256.0
Other income 1-2 10.0 11.6
Design and development costs (268.4) (239.2)
Sales and marketing costs (116.8) (119.5)
General and administration costs 1-3 (320.2) (301.5)
Finance costs (62.7) (100.2)
Profit before income tax expense 728.1 507.2
Income tax expense 1-4 (233.0) (156.7)
Profit for the year 495.1 350.5
Other comprehensive income
Items that may be reclassified to profit or loss
Exchange difference on translation of foreign operations 3-3 (30.8) (92.5)
Net investment hedge 3-3 3.9 18.6
Changes in fair value of interest rate hedge 3-3 10.0 (5.7)
Other comprehensive loss for the year, net of tax (16.9) (79.6)
Total comprehensive income for the year 478.2 270.9
Earnings per share attributable to ordinary equity holders of the Company
Cents Cents
Basic earnings per share 1-5 77.7 55.1
Diluted earnings per share 1-5 77.5 54.9
The above statement of profit or loss and other comprehensive income should be read in conjunction with the accompanying notes.
Statement of profit or loss and other comprehensive income
Aristocrat Leisure Limited
Financial statements for the year ended 30 September 2017 3
For
per
sona
l use
onl
y

Balance Sheetas at 30 September 2017
2017 2016
Consolidated Note $'m $'m
ASSETS
Current assets
Cash and cash equivalents 547.1 283.2
Trade and other receivables 2-1 512.3 432.9
Inventories 2-2 116.4 124.3
Financial assets 3-2 6.4 7.0
Current tax assets 12.8 27.7
Total current assets 1,195.0 875.1
Non-current assets
Trade and other receivables 2-1 107.0 96.9
Financial assets 3-2 7.8 6.6
Property, plant and equipment 2-4 241.3 217.5
Intangible assets 2-3 1,687.7 1,736.5
Deferred tax assets 1-4 54.1 55.1
Total non-current assets 2,097.9 2,112.6
Total assets 3,292.9 2,987.7
LIABILITIES
Current liabilities
Trade and other payables 2-5 404.7 371.1
Borrowings 3-1 0.1 -
Current tax liabilities 148.7 81.8
Provisions 2-6 44.3 32.5
Financial liabilities 3-2 0.5 -
Deferred revenue 54.8 63.8
Total current liabilities 653.1 549.2
Non-current liabilities
Trade and other payables 2-5 44.2 37.5
Borrowings 3-1 1,199.3 1,287.8
Provisions 2-6 13.8 13.4
Financial liabilities 3-2 0.9 10.8
Deferred tax liabilities 1-4 12.7 -
Deferred revenue 19.6 10.3
Other liabilities 3.7 3.2
Total non-current liabilities 1,294.2 1,363.0
Total liabilities 1,947.3 1,912.2
Net assets 1,345.6 1,075.5
EQUITY
Contributed equity 3-4 715.1 693.8
Reserves 3-3 (116.8) (55.7)
Retained earnings 3-3 747.3 437.4
Total equity 1,345.6 1,075.5
The above balance sheet should be read in conjunction with the accompanying notes.
Aristocrat Leisure Limited
Financial statements for the year ended 30 September 2017 4
For
per
sona
l use
onl
y

Statement of changes in equityfor the year ended 30 September 2017
Contributed equity Reserves Retained earnings Total equity
Consolidated Note $'m $'m $'m $'m
Balance at 1 October 2015 693.8 15.7 207.9 917.4
Profit for the year ended 30 September 2016 - - 350.5 350.5
Other comprehensive income - (79.6) - (79.6)
Total comprehensive income for the year - (79.6) 350.5 270.9
Transactions with owners in their capacity as owners:
Net movement in share-based payments reserve 3-3 - 8.2 - 8.2
Dividends provided for and paid - - (121.0) (121.0)
- 8.2 (121.0) (112.8)
Balance at 30 September 2016 693.8 (55.7) 437.4 1,075.5
Profit for the year ended 30 September 2017 - - 495.1 495.1
Other comprehensive income - (16.9) - (16.9)
Total comprehensive income for the year - (16.9) 495.1 478.2
Transactions with owners in their capacity as owners:
Contributions of equity, net of transaction costs and tax 3-4 21.3 - - 21.3
Net movement in share-based payments reserve 3-3 - (44.2) - (44.2)
Dividends provided for and paid* 1-6 - - (185.2) (185.2)
21.3 (44.2) (185.2) (208.1)
Balance at 30 September 2017 715.1 (116.8) 747.3 1,345.6
*Payment of dividends relates to the 2016 final dividend and 2017 interim dividend.
The above statement of changes in equity should be read in conjunction with the accompanying notes.
Aristocrat Leisure Limited
Financial statements for the year ended 30 September 2017 5
For
per
sona
l use
onl
y
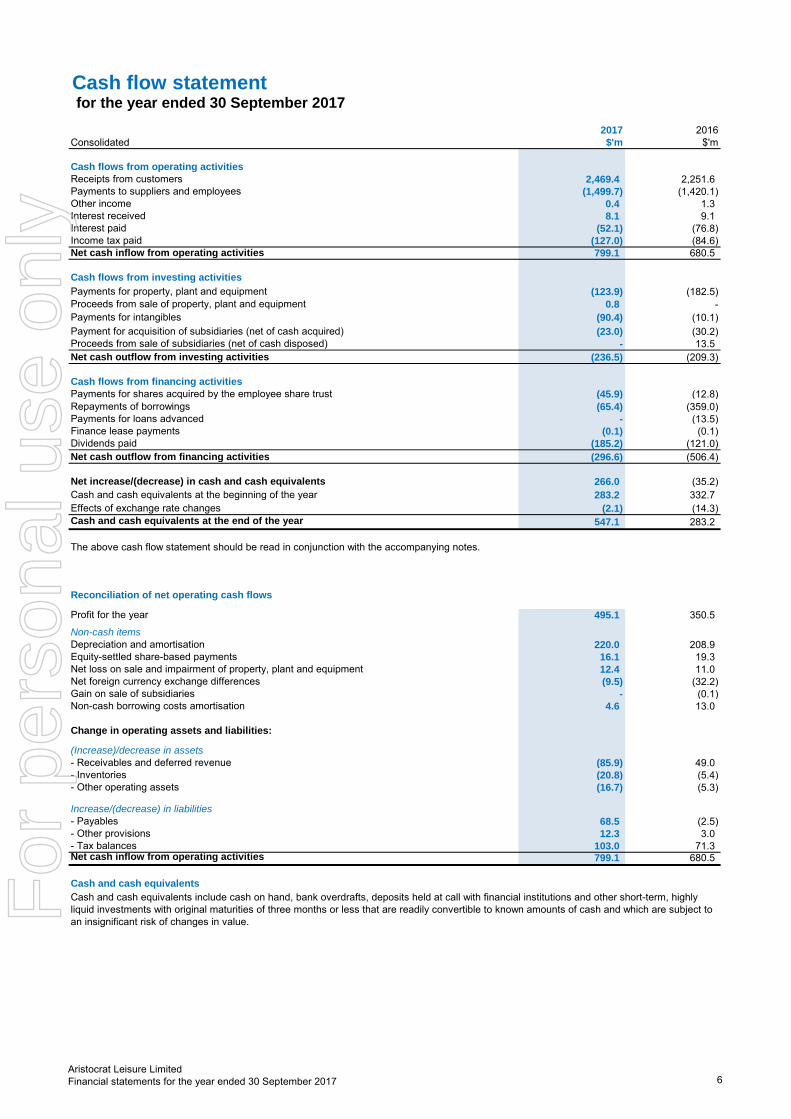
for the year ended 30 September 2017
2017 2016
Consolidated $'m $'m
Cash flows from operating activities
Receipts from customers 2,469.4 2,251.6
Payments to suppliers and employees (1,499.7) (1,420.1)
Other income 0.4 1.3
Interest received 8.1 9.1
Interest paid (52.1) (76.8)
Income tax paid (127.0) (84.6)
Net cash inflow from operating activities 799.1 680.5
Cash flows from investing activities
Payments for property, plant and equipment (123.9) (182.5)
Proceeds from sale of property, plant and equipment 0.8 -
Payments for intangibles (90.4) (10.1)
Payment for acquisition of subsidiaries (net of cash acquired) (23.0) (30.2)
Proceeds from sale of subsidiaries (net of cash disposed) - 13.5
Net cash outflow from investing activities (236.5) (209.3)
Cash flows from financing activities
Payments for shares acquired by the employee share trust (45.9) (12.8)
Repayments of borrowings (65.4) (359.0)
Payments for loans advanced - (13.5)
Finance lease payments (0.1) (0.1)
Dividends paid (185.2) (121.0)
Net cash outflow from financing activities (296.6) (506.4)
Net increase/(decrease) in cash and cash equivalents 266.0 (35.2)
Cash and cash equivalents at the beginning of the year 283.2 332.7
Effects of exchange rate changes (2.1) (14.3)
Cash and cash equivalents at the end of the year 547.1 283.2
Reconciliation of net operating cash flows
Profit for the year 495.1 350.5
Non-cash items
Depreciation and amortisation 220.0 208.9
Equity-settled share-based payments 16.1 19.3
Net loss on sale and impairment of property, plant and equipment 12.4 11.0
Net foreign currency exchange differences (9.5) (32.2)
Gain on sale of subsidiaries - (0.1)
Non-cash borrowing costs amortisation 4.6 13.0
Change in operating assets and liabilities:
(Increase)/decrease in assets
- Receivables and deferred revenue (85.9) 49.0
- Inventories (20.8) (5.4)
- Other operating assets (16.7) (5.3)
Increase/(decrease) in liabilities
- Payables 68.5 (2.5)
- Other provisions 12.3 3.0
- Tax balances 103.0 71.3Net cash inflow from operating activities 799.1 680.5
Cash and cash equivalents
Cash and cash equivalents include cash on hand, bank overdrafts, deposits held at call with financial institutions and other short-term, highly
liquid investments with original maturities of three months or less that are readily convertible to known amounts of cash and which are subject to
an insignificant risk of changes in value.
Cash flow statement
The above cash flow statement should be read in conjunction with the accompanying notes.
Aristocrat Leisure Limited
Financial statements for the year ended 30 September 2017 6
For
per
sona
l use
onl
y
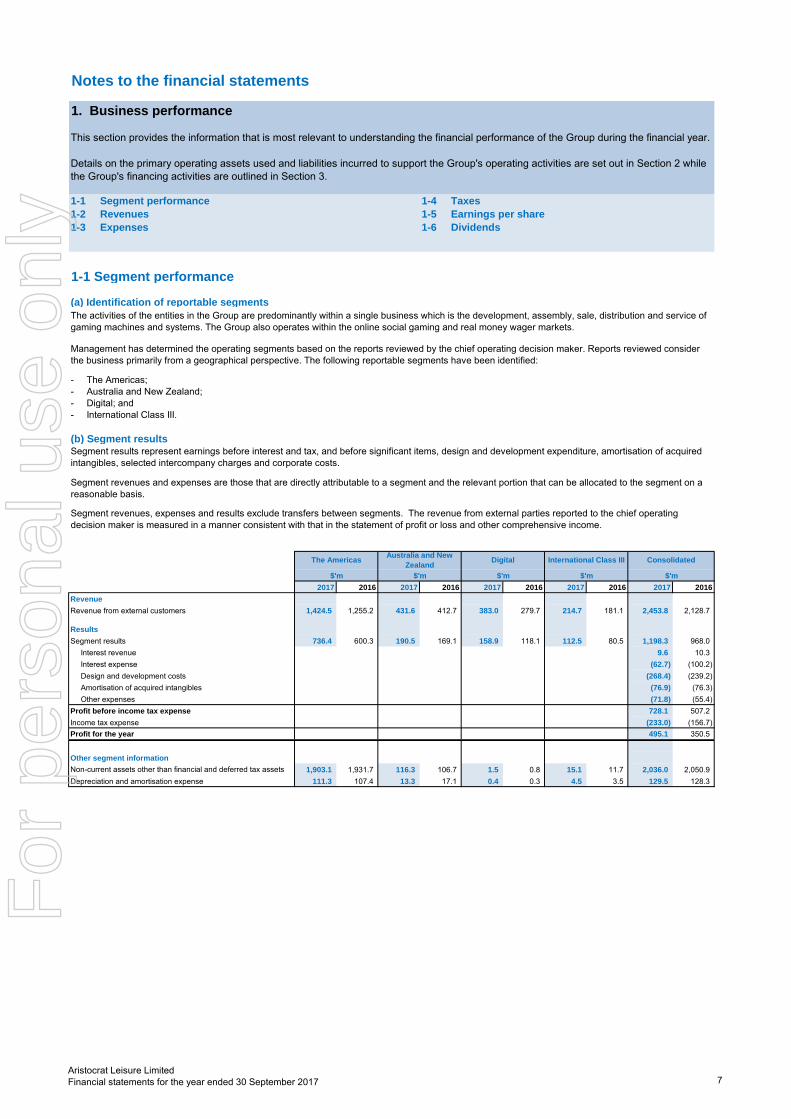
Notes to the financial statements
1-1 Segment performance 1-4 Taxes
1-2 Revenues 1-5 Earnings per share
1-3 Expenses 1-6 Dividends
1-1 Segment performance
(a) Identification of reportable segments
- The Americas;
- Australia and New Zealand;
- Digital; and
- International Class III.
(b) Segment results
2017 2016 2017 2016 2017 2016 2017 2016 2017 2016
Revenue
Revenue from external customers 1,424.5 1,255.2 431.6 412.7 383.0 279.7 214.7 181.1 2,453.8 2,128.7
Results
Segment results 736.4 600.3 190.5 169.1 158.9 118.1 112.5 80.5 1,198.3 968.0
Interest revenue 9.6 10.3
Interest expense (62.7) (100.2)
Design and development costs (268.4) (239.2)
Amortisation of acquired intangibles (76.9) (76.3)
Other expenses (71.8) (55.4)
Profit before income tax expense 728.1 507.2
Income tax expense (233.0) (156.7)
Profit for the year 495.1 350.5
Other segment information
Non-current assets other than financial and deferred tax assets 1,903.1 1,931.7 116.3 106.7 1.5 0.8 15.1 11.7 2,036.0 2,050.9
Depreciation and amortisation expense 111.3 107.4 13.3 17.1 0.4 0.3 4.5 3.5 129.5 128.3
Segment revenues, expenses and results exclude transfers between segments. The revenue from external parties reported to the chief operating
decision maker is measured in a manner consistent with that in the statement of profit or loss and other comprehensive income.
The activities of the entities in the Group are predominantly within a single business which is the development, assembly, sale, distribution and service of
gaming machines and systems. The Group also operates within the online social gaming and real money wager markets.
This section provides the information that is most relevant to understanding the financial performance of the Group during the financial year.
Details on the primary operating assets used and liabilities incurred to support the Group's operating activities are set out in Section 2 while
the Group's financing activities are outlined in Section 3.
1. Business performance
Management has determined the operating segments based on the reports reviewed by the chief operating decision maker. Reports reviewed consider
the business primarily from a geographical perspective. The following reportable segments have been identified:
Segment results represent earnings before interest and tax, and before significant items, design and development expenditure, amortisation of acquired
intangibles, selected intercompany charges and corporate costs.
Segment revenues and expenses are those that are directly attributable to a segment and the relevant portion that can be allocated to the segment on a
reasonable basis.
Consolidated
$'m $'m $'m $'m $'m
The AmericasAustralia and New
ZealandDigital International Class III
Aristocrat Leisure Limited
Financial statements for the year ended 30 September 2017 7
For
per
sona
l use
onl
y
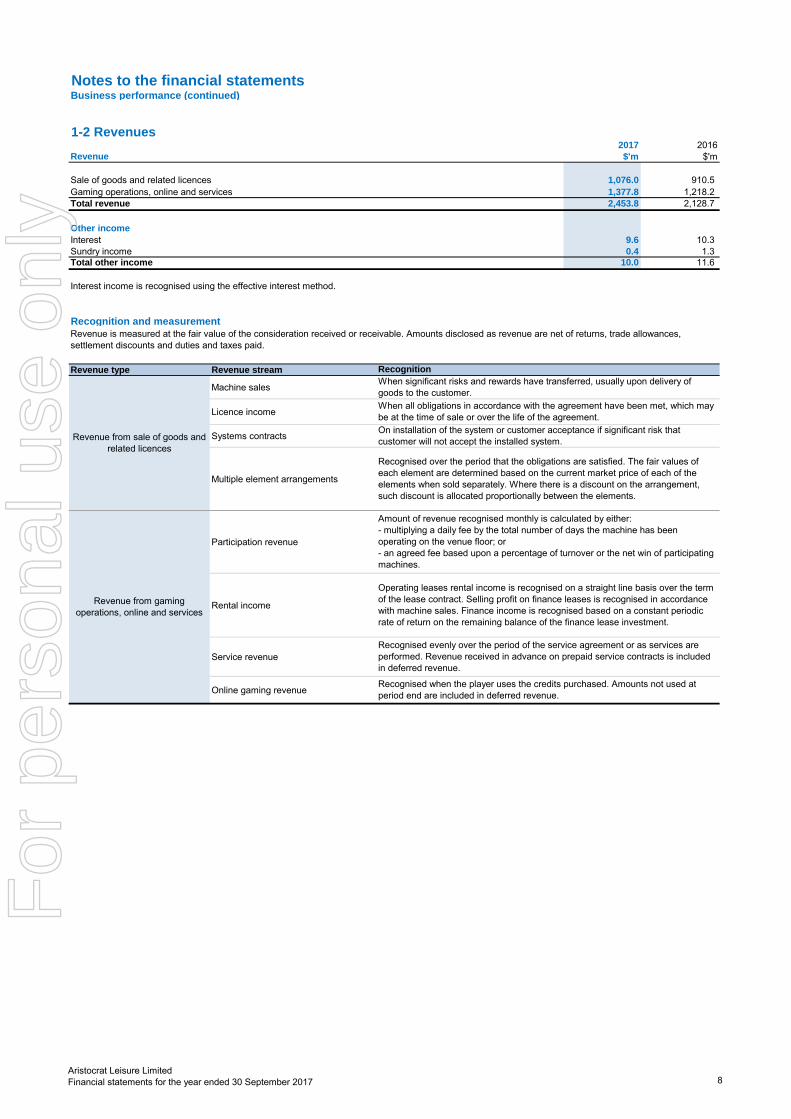
Notes to the financial statementsBusiness performance (continued)
1-2 Revenues2017 2016
Revenue $'m $'m
Sale of goods and related licences 1,076.0 910.5
Gaming operations, online and services 1,377.8 1,218.2
Total revenue 2,453.8 2,128.7
Other income
Interest 9.6 10.3
Sundry income 0.4 1.3
Total other income 10.0 11.6
Recognition and measurement
Revenue type Revenue stream
Machine sales
Licence income
Systems contracts
Multiple element arrangements
Participation revenue
Rental income
Service revenue
Online gaming revenue
Interest income is recognised using the effective interest method.
Revenue is measured at the fair value of the consideration received or receivable. Amounts disclosed as revenue are net of returns, trade allowances,
settlement discounts and duties and taxes paid.
Revenue from sale of goods and
related licences
Revenue from gaming
operations, online and services
Recognition
When significant risks and rewards have transferred, usually upon delivery of
goods to the customer.
When all obligations in accordance with the agreement have been met, which may
be at the time of sale or over the life of the agreement.
On installation of the system or customer acceptance if significant risk that
customer will not accept the installed system.
Recognised over the period that the obligations are satisfied. The fair values of
each element are determined based on the current market price of each of the
elements when sold separately. Where there is a discount on the arrangement,
such discount is allocated proportionally between the elements.
Recognised evenly over the period of the service agreement or as services are
performed. Revenue received in advance on prepaid service contracts is included
in deferred revenue.
Operating leases rental income is recognised on a straight line basis over the term
of the lease contract. Selling profit on finance leases is recognised in accordance
with machine sales. Finance income is recognised based on a constant periodic
rate of return on the remaining balance of the finance lease investment.
Amount of revenue recognised monthly is calculated by either:
- multiplying a daily fee by the total number of days the machine has been
operating on the venue floor; or
- an agreed fee based upon a percentage of turnover or the net win of participating
machines.
Recognised when the player uses the credits purchased. Amounts not used at
period end are included in deferred revenue.
Aristocrat Leisure Limited
Financial statements for the year ended 30 September 2017 8
For
per
sona
l use
onl
y
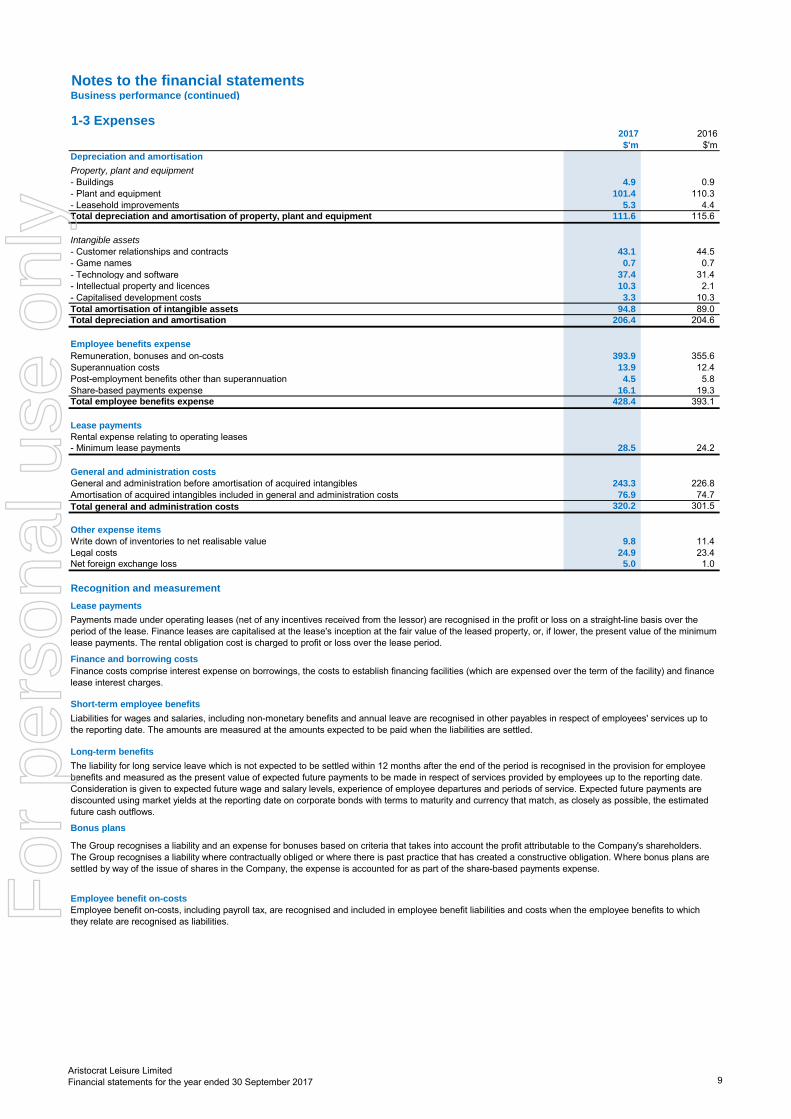
Notes to the financial statementsBusiness performance (continued)
1-3 Expenses2017 2016
$'m $'m
Depreciation and amortisation
Property, plant and equipment
- Buildings 4.9 0.9
- Plant and equipment 101.4 110.3
- Leasehold improvements 5.3 4.4
Total depreciation and amortisation of property, plant and equipment 111.6 115.6
Intangible assets
- Customer relationships and contracts 43.1 44.5
- Game names 0.7 0.7
- Technology and software 37.4 31.4
- Intellectual property and licences 10.3 2.1
- Capitalised development costs 3.3 10.3
Total amortisation of intangible assets 94.8 89.0
Total depreciation and amortisation 206.4 204.6
Employee benefits expense
Remuneration, bonuses and on-costs 393.9 355.6
Superannuation costs 13.9 12.4
Post-employment benefits other than superannuation 4.5 5.8
Share-based payments expense 16.1 19.3
Total employee benefits expense 428.4 393.1
Lease payments
Rental expense relating to operating leases
- Minimum lease payments 28.5 24.2
General and administration costs
General and administration before amortisation of acquired intangibles 243.3 226.8
Amortisation of acquired intangibles included in general and administration costs 76.9 74.7
Total general and administration costs 320.2 301.5
Other expense items
Write down of inventories to net realisable value 9.8 11.4
Legal costs 24.9 23.4
Net foreign exchange loss 5.0 1.0
Recognition and measurement
Lease payments
Finance and borrowing costs
Long-term benefits
Bonus plans
Employee benefit on-costs
Payments made under operating leases (net of any incentives received from the lessor) are recognised in the profit or loss on a straight-line basis over the
period of the lease. Finance leases are capitalised at the lease's inception at the fair value of the leased property, or, if lower, the present value of the minimum
lease payments. The rental obligation cost is charged to profit or loss over the lease period.
Finance costs comprise interest expense on borrowings, the costs to establish financing facilities (which are expensed over the term of the facility) and finance
lease interest charges.
Short-term employee benefits
Liabilities for wages and salaries, including non-monetary benefits and annual leave are recognised in other payables in respect of employees' services up to
the reporting date. The amounts are measured at the amounts expected to be paid when the liabilities are settled.
The liability for long service leave which is not expected to be settled within 12 months after the end of the period is recognised in the provision for employee
benefits and measured as the present value of expected future payments to be made in respect of services provided by employees up to the reporting date.
Consideration is given to expected future wage and salary levels, experience of employee departures and periods of service. Expected future payments are
discounted using market yields at the reporting date on corporate bonds with terms to maturity and currency that match, as closely as possible, the estimated
future cash outflows.
The Group recognises a liability and an expense for bonuses based on criteria that takes into account the profit attributable to the Company's shareholders.
The Group recognises a liability where contractually obliged or where there is past practice that has created a constructive obligation. Where bonus plans are
settled by way of the issue of shares in the Company, the expense is accounted for as part of the share-based payments expense.
Employee benefit on-costs, including payroll tax, are recognised and included in employee benefit liabilities and costs when the employee benefits to which
they relate are recognised as liabilities.
Aristocrat Leisure Limited
Financial statements for the year ended 30 September 2017 9
For
per
sona
l use
onl
y

Notes to the financial statementsBusiness performance (continued)
1-4 Taxes2017 2016
$'m $'m
(a) Income tax expense
Current year 214.6 146.2
Adjustment for prior years (9.4) (9.4)
Temporary differences 20.4 13.6
7.4 6.3
233.0 156.7
27.8 19.9
27.8 19.9
(b) Tax reconciliation
728.1 507.2
218.4 152.2
Impact of changes in tax rates and law 22.3 7.7
Exempt income (26.6) (7.2)
13.3 3.7
(6.5) (6.4)
14.1 9.8
Adjustment in respect of previous years income tax (2.0) (3.1)
233.0 156.7
Average effective tax rate 32.0% 30.9%
(c) Amounts recognised directly in equity
3.6 7.1
(d) Revenue and capital tax losses
1.0 1.0
204.8 204.8
205.8 205.8
61.7 61.7
Current taxes
Tax at the Australian tax rate of 30% (2016: 30%)
Non-deductible expenses
Research and development tax credit
Difference in overseas tax rates
Unused revenue losses were incurred by Aristocrat Leisure Limited's overseas subsidiaries. All unused capital tax losses were incurred by
Australian entities.
The income tax expense for the year is the tax payable on the current period's taxable income based on the applicable income tax rate for each
jurisdiction adjusted by changes in deferred tax assets and liabilities, current income tax of prior years and unused tax losses/credits.
The current income tax charge is calculated on the basis of the tax laws enacted or substantively enacted at the end of the reporting period in
the countries where the Company's subsidiaries operate and generate taxable income.
Income tax expense
Major components of income tax expense are:
Current
Profit before tax
Adjustment for prior years
Income tax expense
Deferred income tax expense included in income tax expense comprises:
Decrease in net deferred tax assets
Deferred income tax expense included in income tax expense
Deferred
Net deferred tax - credited directly to equity
Unused gross tax losses for which no deferred tax asset has been recognised
Unused gross capital tax losses for which no deferred tax asset has been recognised
Revenue and capital tax losses
Potential tax benefit
Aristocrat Leisure Limited
Financial statements for the year ended 30 September 2017 10
For
per
sona
l use
onl
y
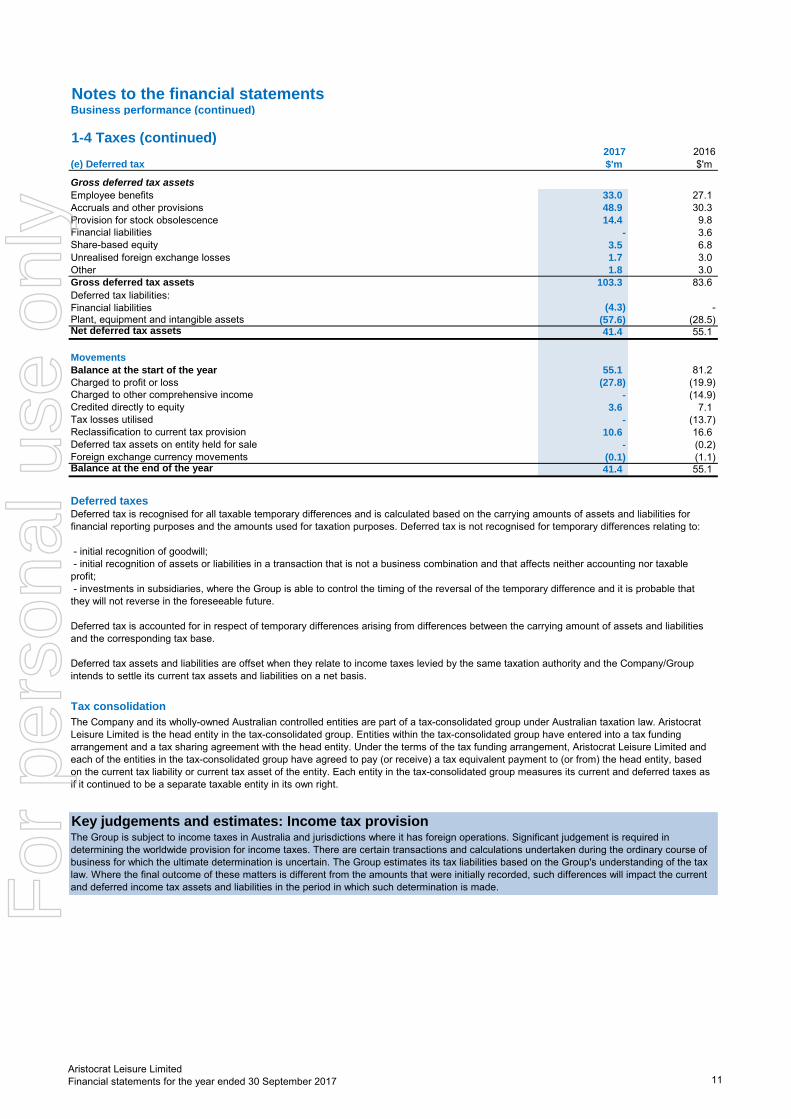
Notes to the financial statementsBusiness performance (continued)
1-4 Taxes (continued)2017 2016
(e) Deferred tax $'m $'m
Gross deferred tax assets
33.0 27.1
48.9 30.3
14.4 9.8
Financial liabilities - 3.6
Share-based equity 3.5 6.8
1.7 3.0
1.8 3.0
Gross deferred tax assets 103.3 83.6
Deferred tax liabilities:
Financial liabilities (4.3) -
Plant, equipment and intangible assets (57.6) (28.5)Net deferred tax assets 41.4 55.1
Movements
55.1 81.2
(27.8) (19.9)
Charged to other comprehensive income - (14.9)
Credited directly to equity 3.6 7.1
Tax losses utilised - (13.7)
Reclassification to current tax provision 10.6 16.6
Deferred tax assets on entity held for sale - (0.2)
Foreign exchange currency movements (0.1) (1.1)Balance at the end of the year 41.4 55.1
Tax consolidation
The Company and its wholly-owned Australian controlled entities are part of a tax-consolidated group under Australian taxation law. Aristocrat
Leisure Limited is the head entity in the tax-consolidated group. Entities within the tax-consolidated group have entered into a tax funding
arrangement and a tax sharing agreement with the head entity. Under the terms of the tax funding arrangement, Aristocrat Leisure Limited and
each of the entities in the tax-consolidated group have agreed to pay (or receive) a tax equivalent payment to (or from) the head entity, based
on the current tax liability or current tax asset of the entity. Each entity in the tax-consolidated group measures its current and deferred taxes as
if it continued to be a separate taxable entity in its own right.
Deferred taxesDeferred tax is recognised for all taxable temporary differences and is calculated based on the carrying amounts of assets and liabilities for
financial reporting purposes and the amounts used for taxation purposes. Deferred tax is not recognised for temporary differences relating to:
- initial recognition of goodwill;
- initial recognition of assets or liabilities in a transaction that is not a business combination and that affects neither accounting nor taxable
profit;
- investments in subsidiaries, where the Group is able to control the timing of the reversal of the temporary difference and it is probable that
they will not reverse in the foreseeable future.
Deferred tax is accounted for in respect of temporary differences arising from differences between the carrying amount of assets and liabilities
and the corresponding tax base.
Deferred tax assets and liabilities are offset when they relate to income taxes levied by the same taxation authority and the Company/Group
intends to settle its current tax assets and liabilities on a net basis.
Charged to profit or loss
Employee benefits
Accruals and other provisions
Provision for stock obsolescence
Unrealised foreign exchange losses
Other
Balance at the start of the year
The Group is subject to income taxes in Australia and jurisdictions where it has foreign operations. Significant judgement is required in
determining the worldwide provision for income taxes. There are certain transactions and calculations undertaken during the ordinary course of
business for which the ultimate determination is uncertain. The Group estimates its tax liabilities based on the Group's understanding of the tax
law. Where the final outcome of these matters is different from the amounts that were initially recorded, such differences will impact the current
and deferred income tax assets and liabilities in the period in which such determination is made.
Key judgements and estimates: Income tax provision
Aristocrat Leisure Limited
Financial statements for the year ended 30 September 2017 11
For
per
sona
l use
onl
y

Notes to the financial statementsBusiness performance (continued)
1-5 Earnings per share2017 2016
Basic and diluted earnings per share (EPS) calculations
Net profit attributable to members of Aristocrat Leisure Limited ($'m) 495.1 350.5
637,565,360 636,383,164
Effect of Performance Share Rights (number) 1,580,860 1,486,325
639,146,220 637,869,489
Basic EPS (cents per share) 77.7 55.1 Diluted EPS (cents per share) 77.5 54.9
Basic earnings per share
Diluted earnings per share
Information concerning the classification of securities
Share-based payments
Share-based payments trust
1-6 Dividends2017 2017 2016 2016
Ordinary shares Final Interim Final Interim
Dividend per share (cents) 20.0c 14.0c 15.0c 10.0c
Franking percentage (%) 100% 25% 0% 0%
Cost ($'m) 127.7 89.6 95.6 63.7
Payment date 20 December 2017 3 July 2017 20 December 2016 1 July 2016
Franking credits
Recognition and measurement
Dividends not recognised at year end
Since the end of the year, the Directors have recommended the payment of a final dividend of 20.0 cents (2016: 15.0 cents) per fully paid ordinary
share, franked at 100%. The aggregate amount of the proposed final dividend expected to be paid on 20 December 2017 out of retained earnings at
30 September 2017, but not recognised as a liability at the end of the year is $127.7m.
Provision is made for the amount of any dividend declared, being appropriately authorised and no longer at the discretion of the entity, on or before
the end of the financial year but not distributed at reporting date. The final 2017 dividend had not been declared at the reporting date and therefore is
not reflected in the financial statements.
The franking account balance at 30 September 2017 is $51.6m (2016: $nil).
The calculation of diluted earnings per share is based on the profit attributable to ordinary shareholders and the weighted average number of
ordinary shares outstanding after adjustments for the effects of all dilutive potential ordinary shares.
The calculation of basic earnings per share is based on the profit attributable to ordinary shareholders and the weighted average number of ordinary
shares outstanding.
Rights granted to employees under share-based payments arrangements are considered to be potential ordinary shares and have been included in
the determination of diluted earnings per share. Details relating to the rights are set out in Note 5-2.
Included within the weighted average number of potential ordinary shares related to Performance Share Rights are 287,461 (2016: 380,902)
Performance Share Rights that had lapsed during the year.
Shares purchased on-market and issued shares through the Aristocrat Employee Equity Plan Trust have been treated as shares bought back and
cancelled for the purpose of the calculation of the weighted average number of ordinary shares in calculating basic earnings per share. At the end of
the reporting period, there were 2,083,839 (2016: 1,097,867) shares held in the share trust.
Weighted average number of ordinary shares (WANOS) used in calculating basic EPS (number)
WANOS used in calculating diluted EPS (number)
Aristocrat Leisure Limited
Financial statements for the year ended 30 September 2017 12
For
per
sona
l use
onl
y

Notes to the financial statements
2-1 Trade and other receivables 2-4 Property, plant and equipment
2-2 Inventories 2-5 Trade and other payables
2-3 Intangible assets 2-6 Provisions
2-1 Trade and other receivables2017 2016
$'m $'m
Current
459.8 387.1
(17.8) (14.7)
Loan receivables 2.6 3.3
67.7 57.2Total current receivables 512.3 432.9
Non-current
Trade receivables 60.9 55.2
Loan receivables 10.2 11.4
Other receivables 35.9 30.3
Total non-current receivables 107.0 96.9
Movements in the provision:
At the start of the year (14.7) (13.3)
Provision recognised during the year (3.9) (4.5)
Foreign currency exchange differences 0.4 1.1
Provisions no longer required 0.4 2.0
At the end of the year (17.8) (14.7)
Trade receivables past due but not impaired
Under 3 months 61.9 41.3
3 months and over 0.6 1.7
Total receivables past due but not impaired 62.5 43.0
Trade receivables
Impairment of trade receivables
Other receivables
Fair value
Leasing arrangements
2017 2016 2017 2016 2017 2016
Current - Under one year 2.4 6.3 0.4 0.7 2.0 5.6
Non-current - Between one and five years 0.6 1.7 - - 0.6 1.7
3.0 8.0 0.4 0.7 2.6 7.3
$'m
Included in trade receivables are receivables from gaming machines that have been sold under finance lease arrangements. The lease payments receivable under
these contracts are as follows:
Unearned finance income Present value of minimum lease
payments
$'m
Minimum lease payments
$'m
The above provision includes $9.0m (2016: $6.6m) of trade receivables past due and considered impaired. Included in the provision is $10.9m (2016: $7.7m)
relating to Latin America trade receivables.
Trade receivables are recognised initially at fair value and subsequently at amortised cost using the effective interest method, less an allowance for impairment.
Current trade receivables are non-interest bearing and generally have terms of up to 120 days.
Collectability of trade receivables is reviewed on an ongoing basis. A provision for impairment of trade receivables is established when there is objective evidence
that the Group will not be able to collect all amounts due. Debts which are known to be uncollectible are written off by reducing the carrying amount directly.
These include prepayments, other receivables and long-term deposits incurred under normal terms and conditions and which do not earn interest. They do not
contain impaired assets and are not past due.
Due to their short-term nature, the carrying amount of current receivables are estimated to represent their fair value. Non-current receivables are carried at
discounted carrying values which are estimated to represent their fair value.
Other receivables
2. Operating assets and liabilities
This section provides information relating to the operating assets and liabilities of the Group which contribute to the business platform for generating
revenues and profits.
Trade receivables
Provision for impairment
Aristocrat Leisure Limited
Financial statements for the year ended 30 September 2017 13
For
per
sona
l use
onl
y

Notes to the financial statementsOperating assets and liabilities (continued)
2-2 Inventories2017 2016
$'m $'m
Current
Raw materials and stores 96.6 109.5
Work in progress 10.6 9.8
Finished goods 32.2 21.0
Inventory in transit 1.7 9.3
Provision for obsolescence and impairment (24.7) (25.3)Total inventories 116.4 124.3
Inventory expense
Recognition and measurement
Inventories recognised as an expense during the year ended 30 September 2017 amounted to $410.8m (2016: $376.6m).
Key judgements and estimates: Carrying value of inventory
The Group assesses at each reporting date whether inventory is recorded at the lower of cost and net realisable value, including assessing the
expected sales of slow moving inventories. These assessments involve estimates and assumptions that are based on current expectations of
demand and market conditions, including opportunities to sell into new markets.
Inventories are valued at the lower of cost and net realisable value. Cost comprises direct materials, direct labour and an appropriate proportion of variable and
fixed overhead expenditure, the latter being allocated on the basis of normal operating capacity. Net realisable value is the estimated selling price in the
ordinary course of business less the estimated costs to sell.
Aristocrat Leisure Limited
Financial statements for the year ended 30 September 2017 14
For
per
sona
l use
onl
y
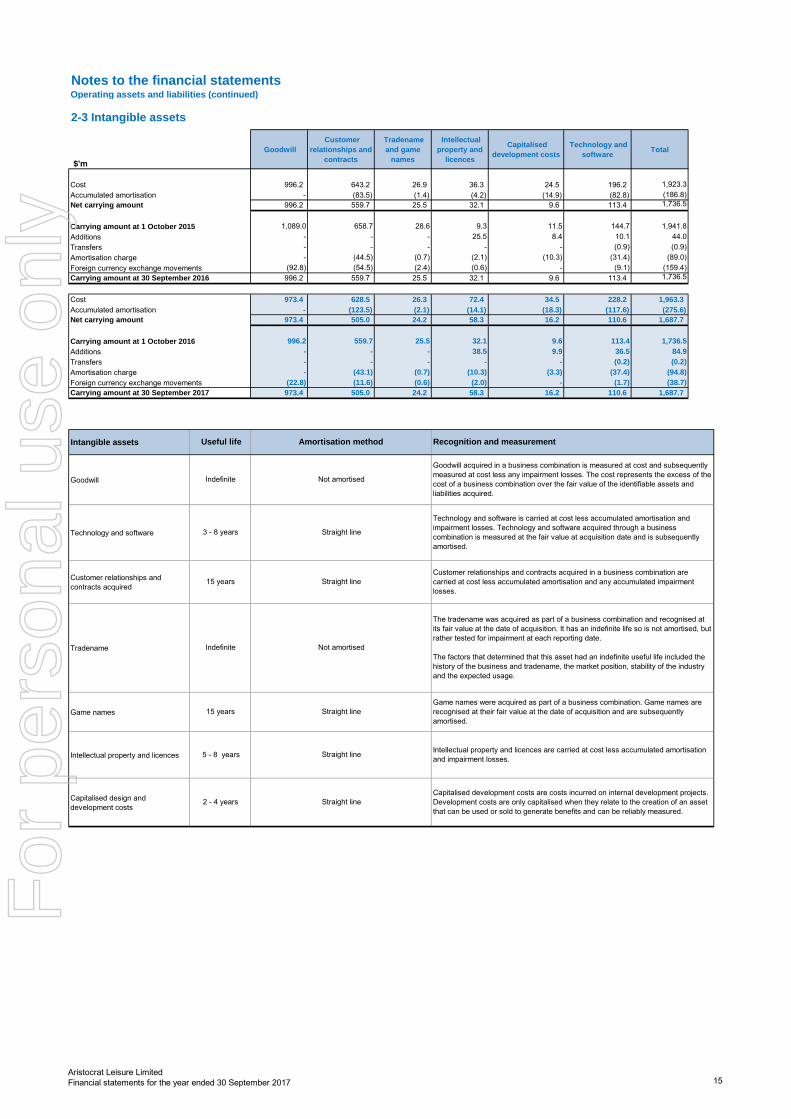
Notes to the financial statementsOperating assets and liabilities (continued)
2-3 Intangible assets
$'m
Goodwill
Customer
relationships and
contracts
Tradename
and game
names
Intellectual
property and
licences
Capitalised
development costs
Technology and
software Total
Cost 996.2 643.2 26.9 36.3 24.5 196.2 1,923.3
Accumulated amortisation - (83.5) (1.4) (4.2) (14.9) (82.8) (186.8)
Net carrying amount 996.2 559.7 25.5 32.1 9.6 113.4 1,736.5
Carrying amount at 1 October 2015 1,089.0 658.7 28.6 9.3 11.5 144.7 1,941.8
Additions - - - 25.5 8.4 10.1 44.0
Transfers - - - - - (0.9) (0.9)
Amortisation charge - (44.5) (0.7) (2.1) (10.3) (31.4) (89.0)
Foreign currency exchange movements (92.8) (54.5) (2.4) (0.6) - (9.1) (159.4)
Carrying amount at 30 September 2016 996.2 559.7 25.5 32.1 9.6 113.4 1,736.5
Cost 973.4 628.5 26.3 72.4 34.5 228.2 1,963.3
Accumulated amortisation - (123.5) (2.1) (14.1) (18.3) (117.6) (275.6)
Net carrying amount 973.4 505.0 24.2 58.3 16.2 110.6 1,687.7
Carrying amount at 1 October 2016 996.2 559.7 25.5 32.1 9.6 113.4 1,736.5
Additions - - - 38.5 9.9 36.5 84.9
Transfers - - - - - (0.2) (0.2)
Amortisation charge - (43.1) (0.7) (10.3) (3.3) (37.4) (94.8)
Foreign currency exchange movements (22.8) (11.6) (0.6) (2.0) - (1.7) (38.7)
Carrying amount at 30 September 2017 973.4 505.0 24.2 58.3 16.2 110.6 1,687.7
Intangible assets
Goodwill
Technology and software
Customer relationships and
contracts acquired
Tradename
Game names
Intellectual property and licences
Capitalised design and
development costs
5 - 8 years
Capitalised development costs are costs incurred on internal development projects.
Development costs are only capitalised when they relate to the creation of an asset
that can be used or sold to generate benefits and can be reliably measured.
Recognition and measurement
Goodwill acquired in a business combination is measured at cost and subsequently
measured at cost less any impairment losses. The cost represents the excess of the
cost of a business combination over the fair value of the identifiable assets and
liabilities acquired.
Technology and software is carried at cost less accumulated amortisation and
impairment losses. Technology and software acquired through a business
combination is measured at the fair value at acquisition date and is subsequently
amortised.
Customer relationships and contracts acquired in a business combination are
carried at cost less accumulated amortisation and any accumulated impairment
losses.
The tradename was acquired as part of a business combination and recognised at
its fair value at the date of acquisition. It has an indefinite life so is not amortised, but
rather tested for impairment at each reporting date.
The factors that determined that this asset had an indefinite useful life included the
history of the business and tradename, the market position, stability of the industry
and the expected usage.
Game names were acquired as part of a business combination. Game names are
recognised at their fair value at the date of acquisition and are subsequently
amortised.
Intellectual property and licences are carried at cost less accumulated amortisation
and impairment losses.
Amortisation method
Straight line
Straight line
Straight line
Not amortised
Straight line
Straight line
Not amortised
2 - 4 years
Useful life
Indefinite
3 - 8 years
15 years
Indefinite
15 years
Aristocrat Leisure Limited
Financial statements for the year ended 30 September 2017 15
For
per
sona
l use
onl
y

Notes to the financial statementsOperating assets and liabilities (continued)
2-3 Intangible assets (continued)
2017 2016
$'m $'m
Americas (excluding VGT) 72.6 74.4
Product Madness (part of Digital segment) 22.8 23.3VGT 878.0 898.5
Total goodwill at the end of the year 973.4 996.2
Inputs
Cash flow projections
2017 2016
Americas (excluding VGT) 11.0% 12.0%
Product Madness 13.3% 15.2%
VGT 10.3% 11.0%
2017 2016
Americas (excluding VGT) 2.0% 3.0%
Product Madness 3.0% 3.0%
VGT 2.0% 2.0%
Allocation of head office assets
Key judgements and estimates: Recoverable amount of intangible assets
The Group tests annually whether goodwill and other intangible assets that are not amortised have suffered any impairment. The recoverable
amounts of cash-generating units have been determined based on value-in-use calculations. These calculations require the use of assumptions.
The above note details these assumptions and the potential impact of changes to the assumptions.
Assumptions
With regard to the assessment of the value-in-use of the CGUs, management do not believe that a reasonably possible change in any one of the key
assumptions would lead to a material impairment charge.
(c) Impact of possible changes in key assumptions
Financial budgets and strategic plans approved by the Board to 2018 and management projections from 2019 to 2022.
These projections, which include projected revenues, gross margins and expenses, have been determined based on past
performance and management expectations for the future. Expected market conditions in which each CGU operates have
been taken into account in the projections.
Pre-tax annual discount rate
Terminal growth rate
The Group's head office assets do not generate separate cash inflows and are utilised by more than one CGU. Head office
assets are allocated to CGUs on a reasonable and consistent basis and tested for impairment as part of the testing of the
CGU to which the head office assets are allocated.
(b) Key assumptions used for value-in-use calculations
A discounted cash flow model has been used based on operating and investing cash flows (before borrowing costs and tax impacts) in valuing the Group's
CGUs that contain intangible assets. The following inputs and assumptions have been adopted:
(a) Impairment tests
Goodwill and other intangibles are allocated to the Group's cash-generating units (CGUs) for the purpose of impairment testing. A CGU is the smallest
identifiable group of assets that generate cash inflows that are largely independent of the cash inflows from other assets or groups of assets.
The VGT CGU also includes $15.8m relating to a tradename that is not amortised, and is tested for impairment annually.
A summary of the goodwill allocation by CGU is presented below:
Aristocrat Leisure Limited
Financial statements for the year ended 30 September 2017 16
For
per
sona
l use
onl
y

Notes to the financial statements
Operating assets and liabilities (continued)
2-4 Property, plant and equipment
2017 2016 2017 2016 2017 2016 2017 2016
Cost 20.2 20.7 57.1 51.5 554.4 468.4 631.7 540.6
Accumulated depreciation/amortisation (11.4) (6.6) (31.4) (26.6) (347.6) (289.9) (390.4) (323.1)
Net carrying amount 8.8 14.1 25.7 24.9 206.8 178.5 241.3 217.5
Carrying amount at the start of the year 14.1 16.6 24.9 28.2 178.5 158.7 217.5 203.5
Additions - 0.1 6.5 2.7 118.7 180.0 125.2 182.8
Disposals - - - (0.1) (3.1) (3.7) (3.1) (3.8)
Impairment losses - (0.5) - - - (6.6) - (7.1)
Transfers* - - - - 18.7 (23.4) 18.7 (23.4)
(4.9) (0.9) (5.3) (4.4) (101.4) (110.3) (111.6) (115.6)
Foreign currency exchange differences (0.4) (1.2) (0.4) (1.5) (4.6) (16.2) (5.4) (18.9)
Carrying amount at the end of the year 8.8 14.1 25.7 24.9 206.8 178.5 241.3 217.5
Recognition and measurement
The expected useful lives and depreciation and amortisation methods are listed below:
Asset Useful life Depreciation method
Buildings 25-40 years Straight line
Leasehold improvements 2-10 years Straight line
Plant and equipment 1-10 years Straight line
Land Indefinite No depreciation
Derecognition
2-5 Trade and other payables 2017 2016
$'m $'m
Current
Trade payables 130.5 104.9
Deferred consideration - 22.8
Other payables 274.2 243.4Total current payables 404.7 371.1
Non-current
Deferred consideration 18.6 18.3
Other payables 25.6 19.2Total non-current payables 44.2 37.5
Recognition and measurement
Trade payables and other payables are recognised when the Group becomes obliged to make future payments resulting from the purchase of goods and
services. The amounts are unsecured and are usually paid within 30-120 days of recognition. Other payables include short-term employee benefits.
The carrying amounts of trade and other payable are estimated to represent their fair value.
Land and buildings
$'m
Total Plant and equipment Leasehold
improvements
$'m$'m
An item of property, plant and equipment is derecognised when it is sold or disposed, or when its use is expected to bring no future economic benefits. Gains
and losses on disposals are determined by comparing disposal proceeds with the carrying amount of the asset and are recognised within 'other income' in the
profit or loss in the period the disposal occurs.
All property, plant and equipment are stated at historical cost less accumulated depreciation/amortisation and impairment.
*Transfers predominantly relate to gaming operations assets that have been transferred to and from inventory.
$'m
Depreciation and amortisation
Aristocrat Leisure Limited
Financial statements for the year ended 30 September 2017 17
For
per
sona
l use
onl
y
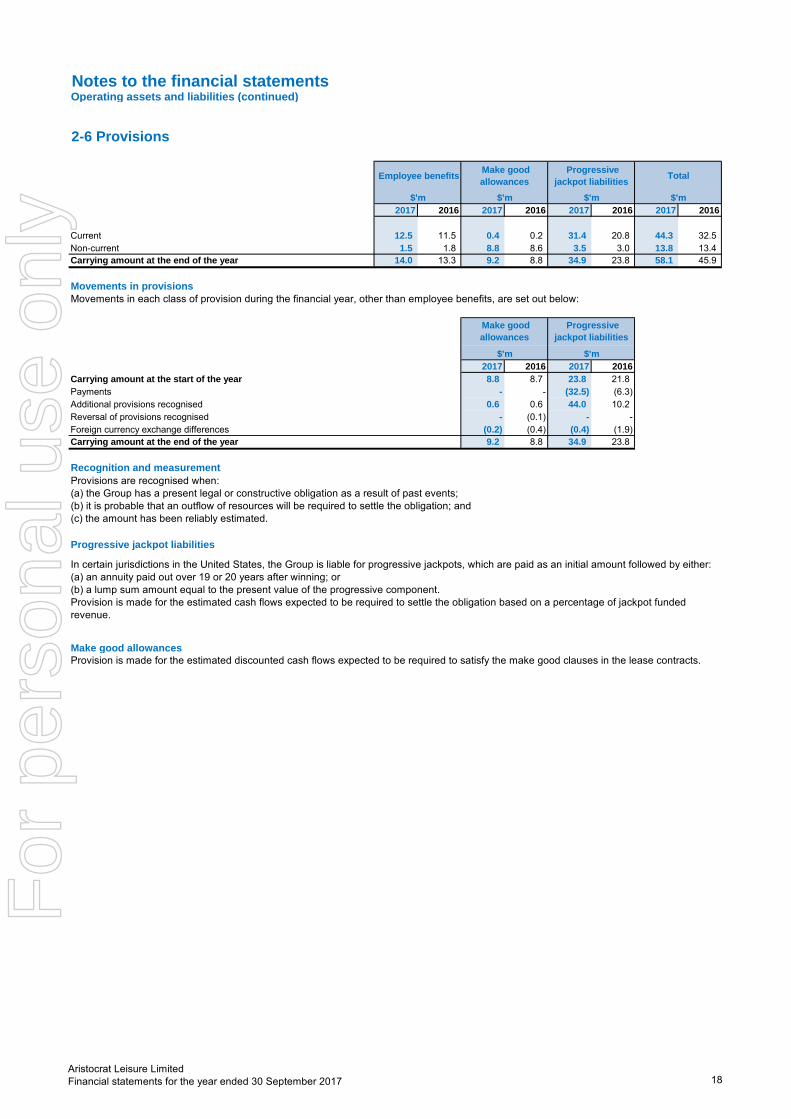
Notes to the financial statementsOperating assets and liabilities (continued)
2-6 Provisions
2017 2016 2017 2016 2017 2016 2017 2016
Current 12.5 11.5 0.4 0.2 31.4 20.8 44.3 32.5
Non-current 1.5 1.8 8.8 8.6 3.5 3.0 13.8 13.4
Carrying amount at the end of the year 14.0 13.3 9.2 8.8 34.9 23.8 58.1 45.9
2017 2016 2017 2016
8.8 8.7 23.8 21.8
Payments - - (32.5) (6.3)
Additional provisions recognised 0.6 0.6 44.0 10.2
Reversal of provisions recognised - (0.1) - -
Foreign currency exchange differences (0.2) (0.4) (0.4) (1.9)
9.2 8.8 34.9 23.8
Recognition and measurement
Progressive jackpot liabilities
Make good allowances
Progressive
jackpot liabilities
$'m $'m
Provision is made for the estimated discounted cash flows expected to be required to satisfy the make good clauses in the lease contracts.
Movements in provisions
Movements in each class of provision during the financial year, other than employee benefits, are set out below:
Provisions are recognised when:
(a) the Group has a present legal or constructive obligation as a result of past events;
(b) it is probable that an outflow of resources will be required to settle the obligation; and
(c) the amount has been reliably estimated.
$'m $'m $'m
Employee benefits Make good
allowances
Progressive
jackpot liabilities Total
In certain jurisdictions in the United States, the Group is liable for progressive jackpots, which are paid as an initial amount followed by either:
(a) an annuity paid out over 19 or 20 years after winning; or
(b) a lump sum amount equal to the present value of the progressive component.
Provision is made for the estimated cash flows expected to be required to settle the obligation based on a percentage of jackpot funded
revenue.
Carrying amount at the end of the year
$'m
Carrying amount at the start of the year
Make good
allowances
Aristocrat Leisure Limited
Financial statements for the year ended 30 September 2017 18
For
per
sona
l use
onl
y
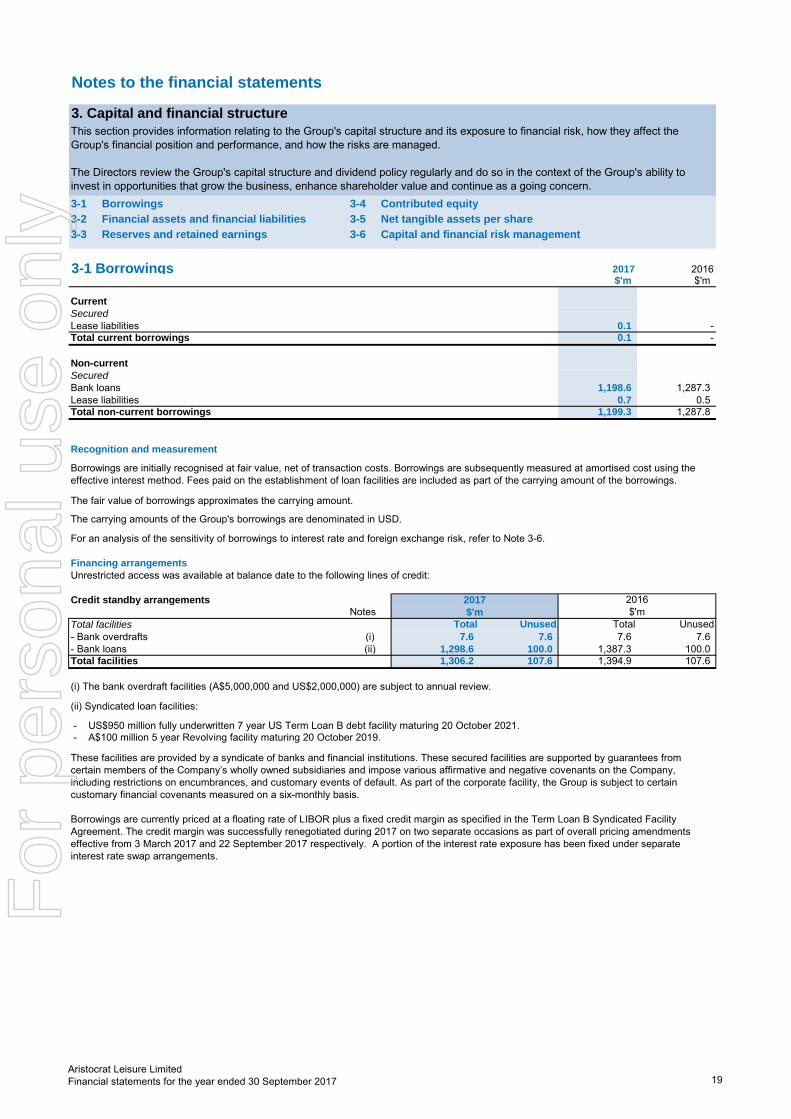
Notes to the financial statements
3-1 Borrowings 3-4 Contributed equity
3-2 Financial assets and financial liabilities 3-5 Net tangible assets per share
3-3 Reserves and retained earnings 3-6 Capital and financial risk management
3-1 Borrowings 2017 2016$'m $'m
Current
Secured
Lease liabilities 0.1 -
Total current borrowings 0.1 -
Non-current
Secured
Bank loans 1,198.6 1,287.3
Lease liabilities 0.7 0.5
Total non-current borrowings 1,199.3 1,287.8
Recognition and measurement
Credit standby arrangements
Notes
Total facilities Total Unused Total Unused
- Bank overdrafts (i) 7.6 7.6 7.6 7.6
- Bank loans (ii) 1,298.6 100.0 1,387.3 100.0
Total facilities 1,306.2 107.6 1,394.9 107.6
These facilities are provided by a syndicate of banks and financial institutions. These secured facilities are supported by guarantees from
certain members of the Company’s wholly owned subsidiaries and impose various affirmative and negative covenants on the Company,
including restrictions on encumbrances, and customary events of default. As part of the corporate facility, the Group is subject to certain
customary financial covenants measured on a six-monthly basis.
Borrowings are currently priced at a floating rate of LIBOR plus a fixed credit margin as specified in the Term Loan B Syndicated Facility
Agreement. The credit margin was successfully renegotiated during 2017 on two separate occasions as part of overall pricing amendments
effective from 3 March 2017 and 22 September 2017 respectively. A portion of the interest rate exposure has been fixed under separate
interest rate swap arrangements.
(i) The bank overdraft facilities (A$5,000,000 and US$2,000,000) are subject to annual review.
(ii) Syndicated loan facilities:
2017
- US$950 million fully underwritten 7 year US Term Loan B debt facility maturing 20 October 2021.
- A$100 million 5 year Revolving facility maturing 20 October 2019.
Financing arrangements
Unrestricted access was available at balance date to the following lines of credit:
2016
$'m $'m
The carrying amounts of the Group's borrowings are denominated in USD.
The fair value of borrowings approximates the carrying amount.
For an analysis of the sensitivity of borrowings to interest rate and foreign exchange risk, refer to Note 3-6.
3. Capital and financial structure
This section provides information relating to the Group's capital structure and its exposure to financial risk, how they affect the
Group's financial position and performance, and how the risks are managed.
The Directors review the Group's capital structure and dividend policy regularly and do so in the context of the Group's ability to
invest in opportunities that grow the business, enhance shareholder value and continue as a going concern.
Borrowings are initially recognised at fair value, net of transaction costs. Borrowings are subsequently measured at amortised cost using the
effective interest method. Fees paid on the establishment of loan facilities are included as part of the carrying amount of the borrowings.
Aristocrat Leisure Limited
Financial statements for the year ended 30 September 2017 19
For
per
sona
l use
onl
y
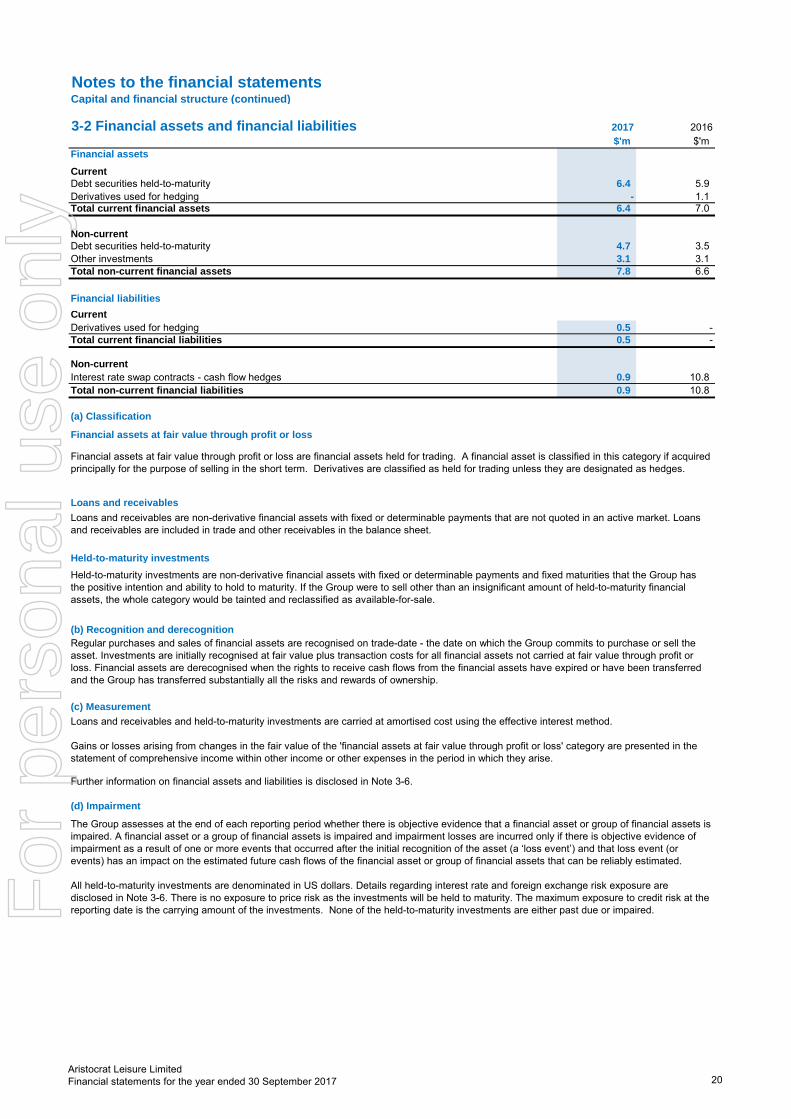
Notes to the financial statementsCapital and financial structure (continued)
3-2 Financial assets and financial liabilities 2017 2016
$'m $'m
Financial assets
Current
Debt securities held-to-maturity 6.4 5.9
Derivatives used for hedging - 1.1
Total current financial assets 6.4 7.0
Non-current
Debt securities held-to-maturity 4.7 3.5
Other investments 3.1 3.1
Total non-current financial assets 7.8 6.6
Financial liabilities
Current
Derivatives used for hedging 0.5 -
Total current financial liabilities 0.5 -
Non-current
Interest rate swap contracts - cash flow hedges 0.9 10.8
Total non-current financial liabilities 0.9 10.8
(a) Classification
Financial assets at fair value through profit or loss
Loans and receivables
Held-to-maturity investments
(b) Recognition and derecognition
(c) Measurement
(d) Impairment
Financial assets at fair value through profit or loss are financial assets held for trading. A financial asset is classified in this category if acquired
principally for the purpose of selling in the short term. Derivatives are classified as held for trading unless they are designated as hedges.
Loans and receivables are non-derivative financial assets with fixed or determinable payments that are not quoted in an active market. Loans
and receivables are included in trade and other receivables in the balance sheet.
Held-to-maturity investments are non-derivative financial assets with fixed or determinable payments and fixed maturities that the Group has
the positive intention and ability to hold to maturity. If the Group were to sell other than an insignificant amount of held-to-maturity financial
assets, the whole category would be tainted and reclassified as available-for-sale.
The Group assesses at the end of each reporting period whether there is objective evidence that a financial asset or group of financial assets is
impaired. A financial asset or a group of financial assets is impaired and impairment losses are incurred only if there is objective evidence of
impairment as a result of one or more events that occurred after the initial recognition of the asset (a ‘loss event’) and that loss event (or
events) has an impact on the estimated future cash flows of the financial asset or group of financial assets that can be reliably estimated.
All held-to-maturity investments are denominated in US dollars. Details regarding interest rate and foreign exchange risk exposure are
disclosed in Note 3-6. There is no exposure to price risk as the investments will be held to maturity. The maximum exposure to credit risk at the
reporting date is the carrying amount of the investments. None of the held-to-maturity investments are either past due or impaired.
Regular purchases and sales of financial assets are recognised on trade-date - the date on which the Group commits to purchase or sell the
asset. Investments are initially recognised at fair value plus transaction costs for all financial assets not carried at fair value through profit or
loss. Financial assets are derecognised when the rights to receive cash flows from the financial assets have expired or have been transferred
and the Group has transferred substantially all the risks and rewards of ownership.
Further information on financial assets and liabilities is disclosed in Note 3-6.
Loans and receivables and held-to-maturity investments are carried at amortised cost using the effective interest method.
Gains or losses arising from changes in the fair value of the 'financial assets at fair value through profit or loss' category are presented in the
statement of comprehensive income within other income or other expenses in the period in which they arise.
Aristocrat Leisure Limited
Financial statements for the year ended 30 September 2017 20
For
per
sona
l use
onl
y

Notes to the financial statementsCapital and financial structure (continued)
$'m
Retained
earnings
Foreign
currency
translation
reserve
Share-based
payments
reserve
Interest rate
hedge reserve
Non-
controlling
interest
reserve
Total
reserves
Balance at 1 October 2015 207.9 62.8 (34.8) (5.2) (7.1) 15.7
350.5 - - - - -
- (92.5) - - - (92.5)
Net investment hedge - 31.1 - - - 31.1
- (12.5) - (2.4) - (14.9)
- - - (3.3) - (3.3)
350.5 (73.9) - (5.7) - (79.6)
(121.0) - - - - -
- - 19.3 - - 19.3
- - (12.8) - - (12.8)
- - 1.7 - - 1.7
437.4 (11.1) (26.6) (10.9) (7.1) (55.7)
Balance at 1 October 2016 437.4 (11.1) (26.6) (10.9) (7.1) (55.7)
495.1 - - - - -
- (30.8) - - - (30.8)
Net investment hedge - 3.9 - - - 3.9
- - - 10.0 - 10.0
495.1 (26.9) - 10.0 - (16.9)
(185.2) - - - - -
- - 16.1 - - 16.1
- - (67.2) - - (67.2)
- - 6.9 - - 6.9
747.3 (38.0) (70.8) (0.9) (7.1) (116.8)
Foreign currency translation reserve
Share-based payments reserve
Interest rate hedge reserve
The interest rate hedge reserve is used to record gains or losses on interest rate hedges that are recognised in other comprehensive income.
Non-controlling interest reserve
The non-controlling interest reserve is used to record transactions with non-controlling interests that do not result in the loss of control.
3-3 Reserves and retained earnings
Profit for the year
Currency translation differences
Deferred tax
Movement in fair value of interest rate hedges
Total comprehensive income/(loss) for the year
Transactions with owners in their capacity as owners
Dividends paid or provided for
Share-based payments expense
Issues of shares to and purchases of shares by the Aristocrat Employee
Share Trust
Share-based tax and other adjustments
Balance at 30 September 2016
The foreign currency translation reserve records the foreign currency exchange differences arising from the translation of foreign operations, the translation of
transactions that hedge the Company's net investment in a foreign operation or the translation of foreign currency monetary items forming part of the net
investment in foreign operations.
The share-based payments reserve is used to recognise the fair value of all shares, options and rights both issued and issued but not exercised under the
various employee share plans, as well as purchases of shares by the Aristocrat Employee Share Trust.
Total comprehensive income/(loss) for the year
Profit for the year
Dividends paid or provided for
Currency translation differences
Share-based payments expense
Issues of shares to and purchases of shares by the Aristocrat Employee
Share Trust
Share-based tax and other adjustments
Transactions with owners in their capacity as owners
Movement in fair value of interest rate hedges
Nature and purpose of reserves:
Balance at 30 September 2017
Aristocrat Leisure Limited
Financial statements for the year ended 30 September 2017 21
For
per
sona
l use
onl
y

Notes to the financial statementsCapital and financial structure (continued)
3-4 Contributed equity2017 2016 2017 2016
Ordinary shares, fully paid 638,544,150 637,119,632 715.1 693.8
Movements in ordinary share capital
Ordinary shares at the beginning of the year 637,119,632 637,119,632 693.8 693.8
Shares issued during the year 1,424,518 - 21.3 -Ordinary shares at the end of the financial year 638,544,150 637,119,632 715.1 693.8
Ordinary shares
Recognition and measurement
3-5 Net tangible assets/(liabilities) per share 2017 2016
$ $
(0.54) (1.04)
3-6 Capital and financial risk management
(a) Capital management
The Group has managed its capital through interest and debt coverage ratios as follows:
2017 2016
Gross debt/bank EBITDA* 1.2x 1.6x
Net debt/(cash)/bank EBITDA* 0.6x 1.2x
Interest coverage ratio (bank EBITDA*/interest expense**) 19.1x 10.7x
(b) Financial risk management
Shares $'m
Incremental costs directly attributable to the issue of new shares are shown in contributed equity as a deduction, net of tax, from the
proceeds.
If the entity reacquires its own equity instruments, for example as the result of a share buy-back, those instruments are deducted from
equity and the associated shares are cancelled. No gain or loss is recognised in the profit or loss and the consideration paid including any
directly attributable incremental cost (net of income taxes) is recognised directly in equity. There is no current on-market buy back.
The Group's overall strategic capital management objective is to maintain a funding structure, which provides sufficient flexibility to fund
the operational demands of the business and to underwrite any strategic opportunities.
This section explains the Group's exposure to financial risks and how these risks could affect the Group's future financial performance.
* Bank EBITDA refers to Consolidated EBITDA for the Group as defined in Aristocrat's Syndicated Facility Agreement.
** Interest expense includes ongoing finance fees relating to bank debt facility arrangements, such as line fees.
Financial risk management is carried out by a central treasury department (Group Treasury) under policies approved by the Board of
Directors. Group Treasury identifies, evaluates and hedges financial risks in close co-operation with the Group’s operating units. The
Board provides written principles for overall risk management, as well as policies covering specific areas, such as foreign exchange risk,
interest rate risk, credit risk, use of derivative financial instruments and investment of excess liquidity.
The Group's overall risk management program focuses on the unpredictability of financial markets and seeks to minimise potential
adverse effects on the financial performance of the Group. The Group uses derivative financial instruments such as foreign exchange
contracts and interest rate swaps to hedge certain risk exposures. Derivatives are exclusively used for hedging purposes, i.e. not as
trading or other speculative instruments.
Net tangible assets/(liabilities) per share
Ordinary shares have no par value and entitle the holder to participate in dividends and the winding up of the Company in proportion to the
number of, and amounts paid on, the shares held. Holders of ordinary shares are entitled to one vote per share at meetings of the
Company.
Net assets per share at 30 September 2017 were $2.11 (2016: $1.69).
A large proportion of the Group's assets are intangible in nature, including goodwill and identifiable intangible assets relating to
businesses acquired. These assets are excluded from the calculation of net tangible assets per share, which results in a negative amount.
Aristocrat Leisure Limited
Financial statements for the year ended 30 September 2017 22
For
per
sona
l use
onl
y

Notes to the financial statementsCapital and financial structure (continued)
3-6 Capital and financial risk management (continued)
Risk Management
Market risk: Interest
rate
Market risk: Foreign
exchange
Market risk: Price
risk
Credit risk
Liquidity risk
Hedge of net investment in foreign entity
Summarised sensitivity analysis
2017 2016 2017 2016 2017 2016 2017 2016 2017 2016
547.1 283.2 (5.5) (2.8) 5.5 2.8 0.4 0.6 (0.3) (0.5)
Receivables 619.3 529.8 - - - - 2.3 4.4 (1.9) (3.6)
11.1 9.4 (0.1) (0.1) 0.1 0.1 - - - -
3.1 4.2 - - - - - - - -
448.9 408.6 - - - - (2.7) (2.6) 2.2 2.1
1,199.4 1,287.8 12.1 1.3 (12.1) (13.1) - - - -
34.9 23.8 0.3 0.2 (0.3) (0.2) - - - -
1.4 10.8 - - - - - - - -
6.8 (1.4) (6.8) (10.4) - 2.4 - (2.0)
+1%
Profit
$'m
-10%
Profit
$'m
+10%
Borrowings
Progressive jackpot liabilities
Other financial liabilities
Total increase/(decrease)
Cash and cash equivalents
Exposure arising
from
- Use of floating to fixed swaps; and
- The mix between fixed and floating rate debt is reviewed on a regular basis under the Group
Treasury policy.
Sensitivity
analysis
Floating rate
borrowings drawn under
a Term Loan B facility
- The Group's foreign exchange hedging policy reduces the risk associated with transactional
exposures; and
- Unrealised gains/losses on outstanding foreign exchange contracts are taken to the profit or
loss on a monthly basis.
Sensitivity
analysis & cash
flow forecasts
Future commercial
transactions and
recognised assets and
liabilities denominated
in a currency that is not
the entity's functional
currency
Measurement
Interest rate risk
The Group's exposure
to commodity price risk
is indirect and is not
considered likely to be
material
- Customers and suppliers are appropriately credit assessed per Group policies;
- Derivative counterparties and cash transactions are limited to high credit quality financial
institutions; and
- All cash and cash equivalents are held with counterparties which are rated 'A' or higher.
- Maintaining sufficient cash and marketable securities;
- Maintaining adequate amounts of committed credit facilities and the ability to close out market
positions; and
- Maintaining flexibility in funding by keeping committed credit lines available.
Cash flow
forecasts and
debt covenants
Ageing analysis
& credit ratings
Cash and cash
equivalents, trade and
other receivables,
derivative financial
instruments and held-to-
maturity investments
Borrowings and other
liabilities
The following table summarises the sensitivity of the Group’s financial assets and financial liabilities to interest rate risk and foreign exchange risk. These
sensitivities are prior to the offsetting impact of hedging instruments, and are shown on a pre-tax basis:
Nil Nil
In 2015, the Group entered into a Term Loan B amounting to US$1,300.0m which was taken out to acquire an American subsidiary and is denominated in United
States Dollars (US$). At 30 September 2017, US$130.0m of this loan, held within the Australian company has been designated as a hedge of the net investment
in this American subsidiary. The fair value and carrying amount of the borrowing at 30 September 2017 was $1,198.6m (2016: $1,287.3m). The foreign exchange
gain on translation of the borrowing to Australian dollars at the end of the reporting period is recognised in other comprehensive income and accumulated in the
foreign currency translation reserve within shareholders equity (Note 3-3). There was no ineffectiveness to be recorded in the profit or loss from net investments in
foreign entity hedges.
-1%
Profit
$'m
Foreign exchange risk
Profit
$'m
Financial assets
Carrying amount
$'m
Payables
Debt securities held-to-maturity
Other investments
Financial liabilities
Aristocrat Leisure Limited
Financial statements for the year ended 30 September 2017 23
For
per
sona
l use
onl
y

Notes to the financial statementsCapital and financial structure (continued)
3-6 Capital and financial risk management (continued)
Maturities of financial liabilities
2017 2016 2017 2016 2017 2016 2017 2016 2017 2016
130.5 104.9 - - - - 130.5 104.9 130.5 104.9
Other payables 274.2 243.4 25.6 19.2 - - 299.8 262.6 299.8 262.6
- 22.8 19.1 19.6 - - 19.1 42.4 18.6 41.1
0.1 - 1,199.3 - - 1,305.0 1,199.4 1,305.0 1,199.4 1,287.8
39.6 46.2 120.4 185.4 - 2.5 160.0 234.1 - -
Progressive jackpot liabilities 31.4 20.8 1.6 1.8 1.9 1.2 34.9 23.8 34.9 23.8
475.8 438.1 1,366.0 226.0 1.9 1,308.7 1,843.7 1,972.8 1,683.2 1,720.2
0.1 - 0.8 10.8 - - 0.9 10.8 0.9 10.8 -
Gross settled (forward foreign exchange contracts)
(65.5) (43.6) - - - - (65.5) (43.6) - (1.1)
66.0 42.5 - - - - 66.0 42.5 0.5 -
0.5 (1.1) - - - - 0.5 (1.1) 0.5 (1.1)
0.6 (1.1) 0.8 10.8 - - 1.4 9.7 1.4 9.7
(c) Foreign currency risk
2016
$'m
US dollars 396.2 320.0
Australian dollars 191.2 156.0
Other(1)
31.9 53.8
Total carrying amount 619.3 529.8
The carrying amounts of the Group's current and non-current payables are denominated in the following currencies:
US dollars 310.2 307.1
Australian dollars 124.5 90.8
Other(1)
14.2 10.7
Total carrying amount 448.9 408.6
(1) Other refers to a basket of currencies (including Euro and New Zealand Dollar).
(d) Credit risk
2017 2016
$'m $'m
Trade receivables with guarantees 12.7 13.0
Trade receivables without guarantees 490.2 414.6
Total trade receivables 502.9 427.6
$'m
2017
The amounts disclosed in the table are the contractual undiscounted cash flows. Balances due within 12 months equal their carrying balances, as the impact of
discounting is not significant.
- derivative financial liabilities for which the contractual maturities are not essential for an understanding of the timing of cash flows.
The table below analyses the Group's financial liabilities into relevant maturity groupings as follows:
(i) based on their contractual maturities:
- all non-derivative financial liabilities, and
- net and gross settled derivative financial instruments for which the contractual maturities are essential for an understanding of the timing of cash flows.
Non-derivatives
Trade payables
$'m
Carrying amount
(assets)/liabilitiesLess than 1 year
Net settled (interest rate swaps)
Derivatives
The maximum exposure to credit risk at the reporting date is the carrying amount of each class of receivables
mentioned above. Refer above for more information on the risk management policy of the Group. The Group
holds guarantees over the debts of certain customers. The value of debtor balances over which guarantees are
held is detailed below:
Borrowings
Borrowings - interest payments
Total non-derivatives
Deferred consideration
Between 1 to 5
years
$'m $'m $'m
Total contractual
cash flows
The carrying amounts of the Group's current and non-current receivables are denominated in the following
currencies:
Contractual maturities of financial liabilities
- (inflow)
- outflow
(ii) based on the remaining period to the expected settlement date:
$'m
Over 5 years
Total derivatives
Total (inflow)/outflow
Aristocrat Leisure Limited
Financial statements for the year ended 30 September 2017 24
For
per
sona
l use
onl
y
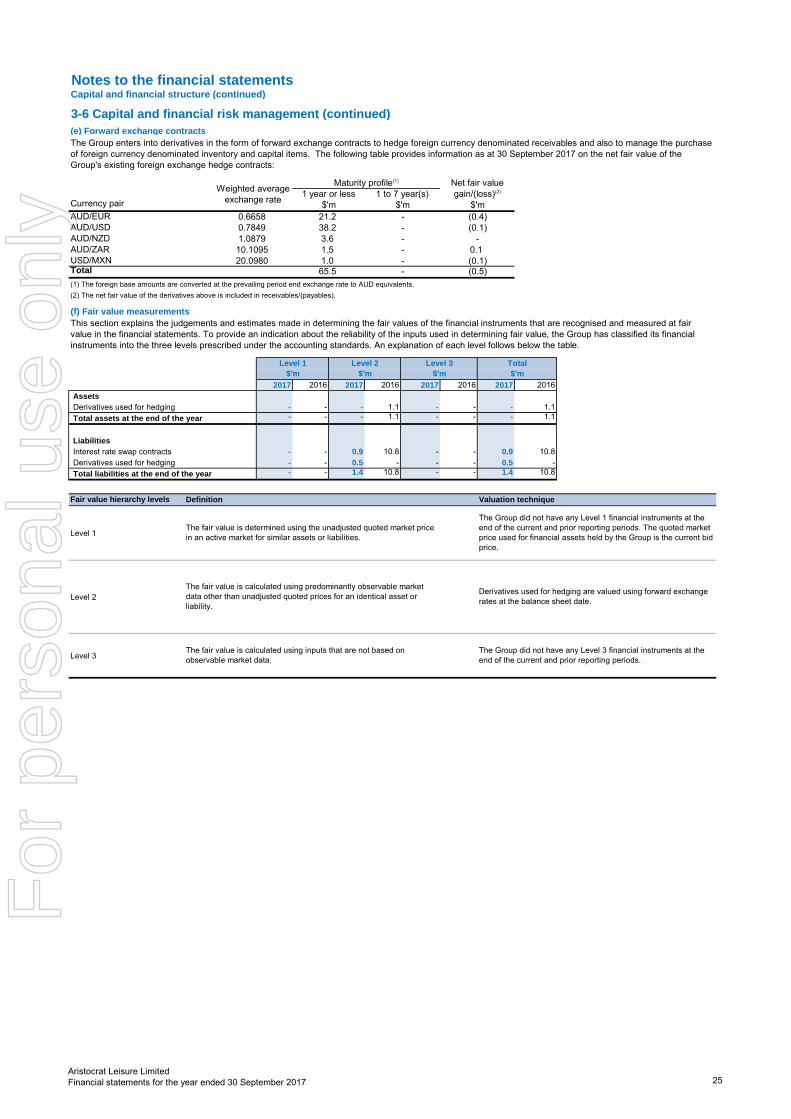
Notes to the financial statementsCapital and financial structure (continued)
3-6 Capital and financial risk management (continued)
(e) Forward exchange contracts
Currency pair
AUD/EUR
AUD/USD
AUD/NZD
AUD/ZAR
USD/MXNTotal
2017 2016 2017 2016 2017 2016 2017 2016
Assets
Derivatives used for hedging - - - 1.1 - - - 1.1
Total assets at the end of the year - - - 1.1 - - - 1.1
Liabilities
Interest rate swap contracts - - 0.9 10.8 - - 0.9 10.8
Derivatives used for hedging - - 0.5 - - - 0.5 -
Total liabilities at the end of the year - - 1.4 10.8 - - 1.4 10.8
Level 1
Level 2
Level 3The fair value is calculated using inputs that are not based on
observable market data.
The fair value is calculated using predominantly observable market
data other than unadjusted quoted prices for an identical asset or
liability.
The Group did not have any Level 3 financial instruments at the
end of the current and prior reporting periods.
Derivatives used for hedging are valued using forward exchange
rates at the balance sheet date.
The fair value is determined using the unadjusted quoted market price
in an active market for similar assets or liabilities.
The Group did not have any Level 1 financial instruments at the
end of the current and prior reporting periods. The quoted market
price used for financial assets held by the Group is the current bid
price.
(2) The net fair value of the derivatives above is included in receivables/(payables).
Valuation techniqueDefinition
$'m
Fair value hierarchy levels
(f) Fair value measurements
(0.5)
Level 2
$'m $'m
Level 3
65.5 -
$'m
$'m$'m
1.0
38.2
21.2
1 to 7 year(s)
$'m
-
-
Net fair value
gain/(loss)(2)1 year or less
1.0879 3.6 - -
Total
(1) The foreign base amounts are converted at the prevailing period end exchange rate to AUD equivalents.
This section explains the judgements and estimates made in determining the fair values of the financial instruments that are recognised and measured at fair
value in the financial statements. To provide an indication about the reliability of the inputs used in determining fair value, the Group has classified its financial
instruments into the three levels prescribed under the accounting standards. An explanation of each level follows below the table.
Level 1
10.1095 1.5 - 0.1
-
(0.4)
Maturity profile(1)
Weighted average
exchange rate
0.7849
20.0980 (0.1)
The Group enters into derivatives in the form of forward exchange contracts to hedge foreign currency denominated receivables and also to manage the purchase
of foreign currency denominated inventory and capital items. The following table provides information as at 30 September 2017 on the net fair value of the
Group's existing foreign exchange hedge contracts:
(0.1)
0.6658
Aristocrat Leisure Limited
Financial statements for the year ended 30 September 2017 25
For
per
sona
l use
onl
y

Notes to the financial statements
4-1 Business combinations 4-2 Subsidiaries
4-1 Business combinations
Business combination subsequent to reporting date
Recognition and measurement
4-2 Subsidiaries
The controlled entities of the Group listed below were wholly owned during the current and prior year, unless otherwise stated:
Region Controlled entities Country of incorporation
Aristocrat Technical Services Pty Ltd Australia
Aristocrat Properties Pty Ltd Australia
Aristocrat (Holdings) Pty Ltd Australia
Aristocrat Technologies Australia Pty Ltd Australia
ASSPA Pty Ltd Australia
Aristocrat Technology Gaming Systems Pty Limited Australia
System 7000 Pty Ltd Australia
Aristocrat Employee Equity Plan Trust Australia
Aristocrat International Pty Ltd Australia
Aristocrat Technologies NZ Limited New Zealand
Aristocrat Technologies Mexico, S.A. DE C.V. Mexico
Aristocrat Service Mexico, S.A. DE C.V. Mexico
Aristocrat Technologies, Inc. USA
Aristocrat Funding Corporation Pty Ltd Australia
Aristocrat Technologies Canada, Inc. Canada
Product Madness Inc. USA
Video Gaming Technologies, Inc. USA
Aristocrat C.A. Venezuela
AI (Puerto Rico) Pty Limited Australia
Aristocrat (Latin America) Pty Ltd Australia
Aristocrat (Argentina) Pty Limited Australia
Aristocrat (Asia) Pty Limited Australia
Aristocrat (Macau) Pty Limited Australia
Aristocrat (Philippines) Pty Limited Australia
Aristocrat (Singapore) Pty Limited Australia
Aristocrat (Cambodia) Pty Limited Australia
Aristocrat (Malaysia) Pty Limited Australia
Aristocrat Leisure Technology Development (Beijing) Co. Ltd China
Aristocrat Technologies India Private Ltd India
Aristocrat Technologies Hong Kong Limited* Hong Kong
Aristocrat Hanbai KK Japan
Aristocrat Leisure Cyprus Limited Cyprus
Aristocrat Gaming LLC* Russia
Aristocrat Technologies Europe (Holdings) Limited UK
ASSPA (UK) Limited UK
Aristocrat Technologies LLC* Russia
Product Madness (UK) Limited UK
Aristocrat Technologies Europe Limited UK
Aristocrat Technologies Spain S.L. Spain
Aristocrat Research & Development (Africa) Pty Ltd South Africa
Aristocrat Plarium Global Holdings Limited** UK
*Ownership interest at 30 September 2017: 0% (2016: 100%)
**Ownership interest at 30 September 2017: 100% (2016: 0%)
4. Group structure
This section explains significant aspects of the Group structure, including its controlled entities and how changes affect the Group structure. It provides
information on business acquisitions and disposals made during the financial year and the impact they had on the Group's financial performance and
position.
On 20 October 2017, the Group completed the acquisition of 100% of Plarium Global Limited. Plarium was a privately owned free-to-play mobile, social and web-
based game developer headquartered in Herzliya, Israel.
The purchase consideration includes an upfront amount of US$500m cash, subject to adjustments and an earn-out arrangement payable to Plarium shareholders
following the end of calendar years 2017 and 2018 respectively. US$425m debt was drawn under a new incremental Term Loan B facility to finance the transaction.
The accounting for the acquisition is in progress. Acquisition related costs of $2.8m were incurred during the year ended 30 September 2017.
Australia and New Zealand
Americas
Asia Pacific
Europe, Middle East and Africa
The Group accounts for business combinations using the acquisition method when control is transferred to the Group. The consideration transferred in the acquisition
is measured at fair value. Acquisition-related costs are expensed as incurred in the profit or loss.
Aristocrat Leisure Limited
Financial statements for the year ended 30 September 2017 26
For
per
sona
l use
onl
y

Notes to the financial statements
5-1 Key management personnel 5-2 Share-based payments
5-1 Key management personnel
2017 2016
$ $
Short-term employee benefits 7,679,267 9,767,083
Post-employment benefits 182,315 195,928
Long-term benefits 123,005 50,712
Termination benefits 3,267,430 -
Share-based payments 4,722,109 6,976,860
Key management personnel compensation 15,974,126 16,990,583
Plan
Performance share plan ("PSP")
Deferred equity employee plan
Deferred short-term incentive plan
General employee share plan
("GESP")
GESP is designed to provide employees with shares
in the parent entity under the provisions of Division
83A of the Australian Income Tax Assessment Act.
The number of shares issued to participants in the
Plan is the offer amount divided by the weighted
average price at which the Company's shares are
traded on the Australian Securities Exchange during
the five days immediately before the date of the offer.
A long-term employee share scheme that provides
for eligible employees to be offered conditional
entitlements to fully paid ordinary shares in the parent
entity ('Performance Share Rights'). Performance
Share Rights issued under the PSP are identical in all
respects other than performance conditions and
periods.
Certain eligible employees are offered incentives of
share rights that are based on individual and
company performance, subject to continued
employment. Should the performance criteria be met,
an amount of share rights are granted. The shares
outstanding at 30 September 2017 result from the
meeting of performance criteria in the 2015 and 2016
financial years. These rights are subject to the
respective employees remaining with the Group until
October 2017 and October 2018.
Upon the vesting of short-term incentives, Executives
receive the incentives as 50% cash, with 50%
deferred as Performance Share Rights. These share
rights are expensed over the vesting periods, being
two and three years.
This section provides a breakdown of the various programs the Group uses to reward and recognise employees and key executives,
including Key Management Personnel.
The Remuneration Report, presented in the Directors' Report, also provides detailed disclosure on share-based payments.
5-2 Share-based payments
Description
Nil (2016: Nil)
529,603 (2016: 631,834)
1,140,739 (2016: 593,681)
14 employees (2016: 19) were entitled to 1,663,201
rights (2016: 3,135,423).
Shares outstanding at the end of the year
5. Employee benefits
Detailed remuneration disclosures are provided in the remuneration report.
Key management personnel compensation
Key management personnel includes all Non-Executive Directors, Executive Directors and Senior Executives who were responsible for the
overall planning, directing and controlling of activities of the Group. During the year ended 30 September 2017, 5 Executive Directors and Senior
Executives (2016: 5 Executive Directors and Senior Executives) were designated as key management personnel.
Aristocrat Leisure Limited
Financial statements for the year ended 30 September 2017 27
For
per
sona
l use
onl
y
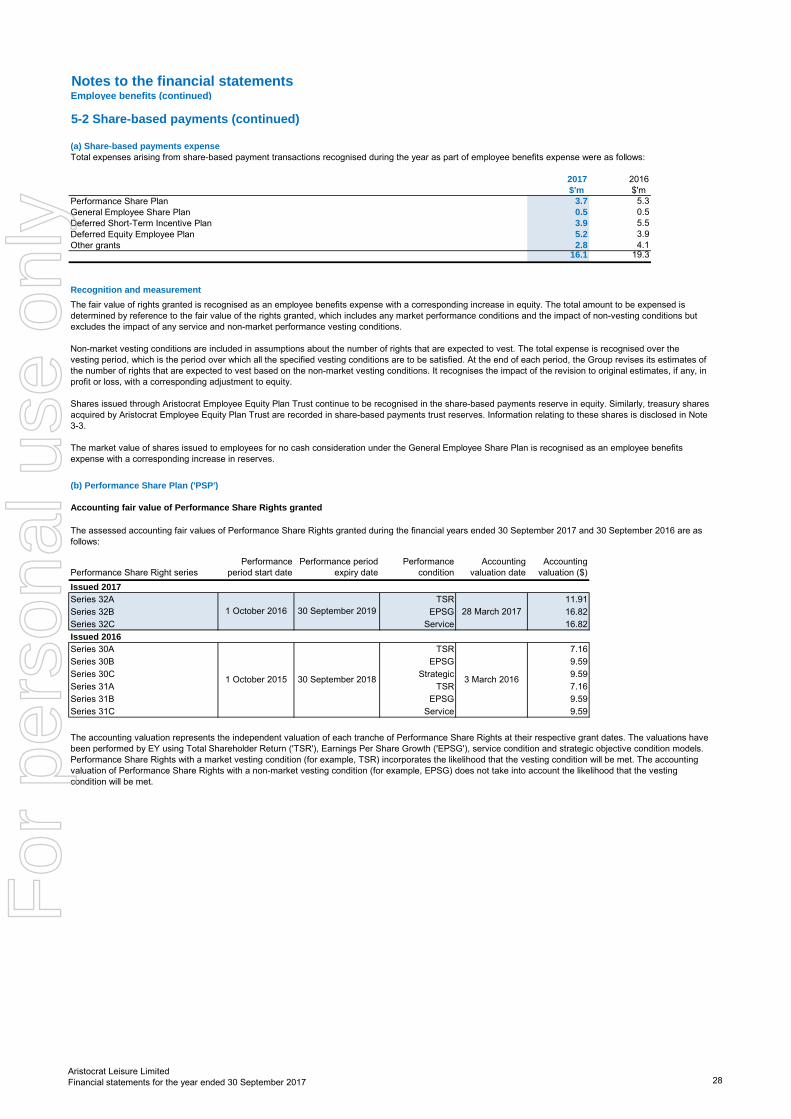
Notes to the financial statementsEmployee benefits (continued)
(a) Share-based payments expense
2017 2016
$'m $'m
Performance Share Plan 3.7 5.3
General Employee Share Plan 0.5 0.5
Deferred Short-Term Incentive Plan 3.9 5.5
Deferred Equity Employee Plan 5.2 3.9
Other grants 2.8 4.1 16.1 19.3
(b) Performance Share Plan ('PSP')
Performance Share Right series
Performance
period start date
Performance period
expiry date
Performance
condition
Accounting
valuation date
Accounting
valuation ($)
Issued 2017
Series 32A TSR 11.91
Series 32B EPSG 28 March 2017 16.82
Series 32C Service 16.82
Issued 2016
Series 30A TSR 7.16
Series 30B EPSG 9.59
Series 30C Strategic 9.59
Series 31A TSR 7.16
Series 31B EPSG 9.59
Series 31C Service 9.59
1 October 2015 30 September 2018 3 March 2016
5-2 Share-based payments (continued)
Accounting fair value of Performance Share Rights granted
The assessed accounting fair values of Performance Share Rights granted during the financial years ended 30 September 2017 and 30 September 2016 are as
follows:
Total expenses arising from share-based payment transactions recognised during the year as part of employee benefits expense were as follows:
The accounting valuation represents the independent valuation of each tranche of Performance Share Rights at their respective grant dates. The valuations have
been performed by EY using Total Shareholder Return ('TSR'), Earnings Per Share Growth ('EPSG'), service condition and strategic objective condition models.
Performance Share Rights with a market vesting condition (for example, TSR) incorporates the likelihood that the vesting condition will be met. The accounting
valuation of Performance Share Rights with a non-market vesting condition (for example, EPSG) does not take into account the likelihood that the vesting
condition will be met.
Recognition and measurement
The fair value of rights granted is recognised as an employee benefits expense with a corresponding increase in equity. The total amount to be expensed is
determined by reference to the fair value of the rights granted, which includes any market performance conditions and the impact of non-vesting conditions but
excludes the impact of any service and non-market performance vesting conditions.
Non-market vesting conditions are included in assumptions about the number of rights that are expected to vest. The total expense is recognised over the
vesting period, which is the period over which all the specified vesting conditions are to be satisfied. At the end of each period, the Group revises its estimates of
the number of rights that are expected to vest based on the non-market vesting conditions. It recognises the impact of the revision to original estimates, if any, in
profit or loss, with a corresponding adjustment to equity.
Shares issued through Aristocrat Employee Equity Plan Trust continue to be recognised in the share-based payments reserve in equity. Similarly, treasury shares
acquired by Aristocrat Employee Equity Plan Trust are recorded in share-based payments trust reserves. Information relating to these shares is disclosed in Note
3-3.
The market value of shares issued to employees for no cash consideration under the General Employee Share Plan is recognised as an employee benefits
expense with a corresponding increase in reserves.
1 October 2016 30 September 2019
Aristocrat Leisure Limited
Financial statements for the year ended 30 September 2017 28
For
per
sona
l use
onl
y

Notes to the financial statementsEmployee benefits (continued)
(ii) Earnings Per Share Growth ('EPSG') model, service condition and strategic objective condition
Input
Share rights granted
Share price at grant date
Price volatility of Company's shares
Dividend yield
Risk-free interest rate
EY has utilised a Binomial Tree model to determine the fair value of share rights. This pricing model takes into account such factors as the Company’s share
price at the date of grant, volatility of the underlying share price, expected dividend yield, risk-free rate of return and time to maturity.
The model inputs for share rights granted during the year ended 30 September 2017 and year ended 30 September 2016 included:
Consideration
2017
The accounting valuation of the rights has been allocated equally over the vesting period.
2016
Zero consideration and have a three year life.
$17.75
1.9%
2.3%
25.0%
$10.21
1.8%
2.0%
25.0%
The expected price volatility is based on the two year historical volatility of the share price of the Company due to the long-term nature of the underlying share
rights.
EY has developed a Monte-Carlo Simulation-based model which incorporates the impact of performance hurdles and the vesting scale on the value of the share
rights. This pricing model takes into account such factors as the Company’s share price at the date of grant, volatility of the underlying share price, expected
dividend yield, risk free rate of return and time to maturity.
(i) Total Shareholder Return ('TSR') model
5-2 Share-based payments (continued)
Aristocrat Leisure Limited
Financial statements for the year ended 30 September 2017 29
For
per
sona
l use
onl
y

Notes to the financial statementsEmployee benefits (continued)
New rights Rights Rights
issues vested lapsed
Right series Number Number Number Number Number
PSP
Series 25A 130,500 - (130,500) - -
Series 25B 304,500 - (304,500) - -
Series 26A 248,353 - (248,353) - -
Series 26B 579,492 - (579,492) - -
Series 28A 188,563 - - (16,851) 171,712
Series 28B 188,564 - - (16,851) 171,713
Series 28C 234,341 - - (48,234) 186,107
Series 29A 122,867 - - (23,990) 98,877
Series 29B 122,867 - - (23,990) 98,877
Series 29C 163,822 - - (31,987) 131,835
Series 30A 84,778 - - (44,787) 39,991
Series 30B 84,778 - - (44,787) 39,991
Series 30C 113,036 - - (59,715) 53,321
Series 31A 170,691 - - (33,931) 136,760
Series 31B 170,691 - - (33,931) 136,760
Series 31C 227,580 - - (92,099) 135,481
Series 32A - 87,438 - (6,368) 81,070
Series 32B - 87,438 - (6,368) 81,070
Series 32C - 116,604 - (16,968) 99,636
3,135,423 291,480 (1,262,845) (500,857) 1,663,201
Consolidated - 2016 New rights Rights Rights
issues vested lapsed
Right series Number Number Number Number Number
PSP
Series 22A 229,850 - (229,850) - -
Series 22B 536,150 - (493,254) (42,896) -
Series 23A 315,416 - (315,416) - -
Series 23B 735,105 - (676,305) (58,800) -
Series 25A 130,500 - - - 130,500
Series 25B 304,500 - - - 304,500
Series 26A 248,353 - - - 248,353
Series 26B 579,492 - - - 579,492
Series 28A 205,475 - - (16,912) 188,563
Series 28B 205,476 - - (16,912) 188,564
Series 28C 256,890 - - (22,549) 234,341
Series 29A 122,867 - - - 122,867
Series 29B 122,867 - - - 122,867
Series 29C 163,822 - - - 163,822
Series 30A - 84,778 - - 84,778
Series 30B - 84,778 - - 84,778
Series 30C - 113,036 - - 113,036
Series 31A - 210,558 - (39,867) 170,691
Series 31B - 210,558 - (39,867) 170,691
Series 31C - 280,738 - (53,158) 227,580
4,156,763 984,446 (1,714,825) (290,961) 3,135,423
27 February 2015
28 March 2017 30 September 2019
3 March 2016
30 September 2018
3 March 2016
30 September 2015
30 September 2016
20 February 2013
1 October 2012
1 October 2013
20 February 2014
30 September 2018
1 October 2014
27 February 2015
3 March 2016
3 March 2016
30 September 2017
Consolidated - 2017 Rights at end
of year
Performance period
expiry date
Rights at start
of year
Grant
date
Rights at end
of year
Rights at start of
yearGrant date
Performance period
expiry date
Performance Share Rights are detailed in the tables below:
5-2 Share-based payments (continued)
20 February 2014
30 September 2016
1 October 2013
1 October 2014
30 September 2017
Aristocrat Leisure Limited
Financial statements for the year ended 30 September 2017 30
For
per
sona
l use
onl
y

Notes to the financial statements
6-1 Commitments and contingencies 6-5 Parent entity financial information
6-2 Events occurring after reporting date 6-6 Deed of cross guarantee
6-3 Remuneration of auditors 6-7 Basis of preparation
6-4 Related parties
6-1 Commitments and contingencies2017 2016
$'m $'m
(a) Commitments
Capital commitments
Intangible assets - Technology and software - 0.4
0.1 0.5
Lease commitments
Non-cancellable operating leases
The Group leases various offices and plant and equipment under non-cancellable operating leases.
Under one year 26.7 21.2Between one and five years 84.3 54.1Over five years 81.4 13.5Commitments not recognised in the financial statements 192.4 88.8
Sub-lease payments
3.7 5.4
(v) a notice of action has been filed against a company in the Group by an individual in relation to the operation of its Dolphin Treasure electronic
gaming machines in Australia. No damages are sought. Aristocrat has defended the action vigorously. The action went to trial in September 2017 and
judgement is presently reserved.
(iii) controlled entities within the Group may become parties to various legal actions concerning intellectual property claims. Intellectual property claims
can include challenges to the Group's patents on various products or processes and/or assertions of infringement of third party patents.
Most intellectual property claims involve highly complex issues. Often, these issues are subject to substantial uncertainties and therefore the
probability of damages, if any, being sustained and an estimate of the amount of damages is difficult to ascertain. Based on the information currently
available, the Directors consider that there are no current claims likely to have a material adverse effect on the Group;
6. Other disclosuresThis section provides details on other required disclosures relating to the Group to comply with the accounting standards and other
pronouncements.
The Group and parent entity have contingent liabilities at 30 September 2017 in respect of the following matters:
(i) a contingent liability may exist in relation to certain guarantees and indemnities given in the ordinary course of business by the Group;
(ii) controlled entities within the Group are and become parties to various legal actions in the ordinary course of business and from time to time. The
Directors consider that any liabilities arising from this type of legal action are unlikely to have a material adverse effect on the Group;
(b) Contingent liabilities
Property, plant and equipment
Commitments for minimum lease payments are as follows:
Capital expenditure contracted for at the reporting date but not recognised as liabilities:
Future minimum lease payments expected to be received in relation to non-cancellable sub-leases of operating
leases
(iv) Aristocrat Leisure Limited, Aristocrat International Pty Ltd, Aristocrat Technologies Australia Pty Ltd, Aristocrat (Holdings) Pty Limited, Aristocrat
(Asia) Pty Limited and Aristocrat (Macau) Pty Limited are parties to a deed of cross guarantee which has been lodged with and approved by the
Australian Securities & Investments Commission as discussed in Note 6-6; and
Aristocrat Leisure Limited
Financial statements for the year ended 30 September 2017 31
For
per
sona
l use
onl
y

Notes to the financial statementsOther disclosures (continued)
During the year, the following fees were paid or payable to the auditor of the parent entity, PricewaterhouseCoopers and its related practices:2017 2016
$ $
Australia 837,000 585,019
1,489,500 1,307,230
2,326,500 1,892,249
789 -
789 -2,327,289 1,892,249
1,784,441 5,000
792,277 101,9502,576,718 106,950
(a) Other transactions with key management personnel
(b) Subsidiaries
6-5 Parent entity financial information
(a) Summary financial information
The individual financial statements for the parent entity show the following aggregate amounts: 2017 2016
$'m $'m
Balance sheet
Current assets 105.0 67.2
Total assets 984.4 742.8
Current liabilities 148.4 82.8
Total liabilities 148.4 82.8Net assets 836.0 660.0
Shareholders' equity
Contributed equity 715.1 693.8
Reserves 134.0 117.9
Accumulated losses (13.1) (151.7)Total equity 836.0 660.0
Profit for the year after tax 323.8 102.8
Total comprehensive income after tax 323.8 102.8
(b) Guarantees entered into by the parent entity
(c) Contingent liabilities of the parent entity
Recognition and measurement
Total remuneration for advisory services
Other assurance services
Overseas
Total remuneration for other assurance servicesTotal remuneration for assurance services
6-2 Events occurring after reporting date
Audit or review of financial reports
Other than the matters above, there has not arisen in the interval between the end of the year and the date of this report any item, transaction or event of a
material and unusual nature likely, in the opinion of the Directors of the Company, to affect significantly the operations of the Group, the results of those
operations, or the state of affairs of the Group, in future financial reporting periods.
6-3 Remuneration of auditors
Refer to Note 1-6 for information regarding dividends declared after reporting date.
On 20 October 2017, the Group completed the acquisition of 100% of Plarium Global Limited, for a total consideration of an upfront amount of US$500m cash,
subject to adjustments and an earn-out arrangement payable to Plarium shareholders following the end of calendar years 2017 and 2018 respectively.
US$425m debt was drawn under a new incremental Term Loan B facility to finance the transaction. Further information can be found in Note 4-1.
On 30 November 2017, the Group signed an agreement to acquire 100% of Big Fish Games Inc. from Churchill Downs Inc. for a purchase price of US$990m
subject to customary completion adjustments. The acquisition is subject to receiving regulatory approval, and will be funded by an incremental Term Loan B
debt facility as well as cash holdings. The entity to be acquired operates as a publisher of social casino, casual free-to-play and premium paid games.
Cross guarantees given by the parent entity are set out in Note 6-6.
Contingent liabilities of the parent entity are set out in Note 6-1.
The financial information for the parent entity, Aristocrat Leisure Limited, disclosed above has been prepared on the same basis as the consolidated financial
statements, except for investments in subsidiaries where they are accounted for at cost less impairment charges in the financial statements of Aristocrat Leisure
Limited.
Overseas
Advisory services
Australia
Total remuneration for audit/review services
Interests in subsidiaries are set out in Note 4-2.
6-4 Related parties
There were no other related party transactions aside from disclosures under key management personnel. Refer to Note 5-1.
It is the Group's policy to employ PricewaterhouseCoopers on assignments additional to their statutory audit duties where PricewaterhouseCoopers' expertise
and experience with the Group are important. These assignments are principally tax advice, due diligence on acquisitions, consulting, cyber reviews or where
PricewaterhouseCoopers is awarded assignments on a competitive basis. It is the Group's policy to seek competitive tenders for all major consulting projects.
Overseas
Aristocrat Leisure Limited
Financial statements for the year ended 30 September 2017 32
For
per
sona
l use
onl
y

Notes to the financial statementsOther disclosures (continued)
2017 2016
$'m $'m
Revenue 573.5 601.3Other income from non-related parties 5.1 5.8Other income from related parties 264.5 119.8Cost of revenue and other expenses (181.6) (166.9)Employee benefits expense (163.7) (148.6)Finance costs (10.6) (23.0)Depreciation and amortisation expense (13.4) (17.1)
Profit before income tax 473.8 371.3
Income tax expense (139.3) (102.4)
Profit for the year 334.5 268.9
Other comprehensive incomeChanges in fair value of interest rate hedge 1.9 (0.5)Other comprehensive income/(loss) net of tax 1.9 (0.5)
336.4 268.4
Retained earnings at the beginning of the financial year 157.6 9.8
Profit for the year 334.5 268.9
Dividends paid (185.2) (121.1)
Retained earnings at the end of the financial year 306.9 157.6
Total comprehensive income for the year
6-6 Deed of cross guarantee
Pursuant to ASIC Corporations Instrument 2017/785, the wholly owned subsidiaries listed below are relieved from the Corporations Act 2001 requirements for
preparation, audit and lodgement of a financial report and Directors’ Report.
It is a condition of the Instrument that the Company and each of the participating subsidiaries enter into a Deed of Cross Guarantee (Deed). The effect of the
Deed, dated 22 December 2006, is that the Company guarantees to each creditor payment in full of any debt in the event of winding up of any of the participating
subsidiaries under certain provisions of the Corporations Act. If a winding up occurs under other provisions of the Corporations Act, the Company will only be liable
in the event that after six months, any creditor has not been paid in full. The subsidiaries have also given similar guarantees in the event the Company is wound
up.
The subsidiaries subject to the Deed are:
• Aristocrat Technologies Australia Pty Limited
• Aristocrat International Pty Limited
• Aristocrat (Asia) Pty Limited
• Aristocrat (Macau) Pty Limited
• Aristocrat (Holdings) Pty Limited
The above named companies represent a Closed Group for the purposes of the Instrument, and as there are no other parties to the Deed that are controlled by
the Company, they also represent the Extended Closed Group.
Set out below is the statement of profit or loss and other comprehensive income of the Closed Group:
Set out below is a summary of movements in consolidated retained earnings of the Closed Group:
Aristocrat Leisure Limited
Financial statements for the year ended 30 September 2017 33
For
per
sona
l use
onl
y

Notes to the financial statementsOther disclosures (continued)
2017 2016
$'m $'m
Current assets
Cash and cash equivalents 325.4 170.5
Trade and other receivables 153.6 130.0
Inventories 32.9 55.9
Total current assets 511.9 356.4
Non-current assets
Trade and other receivables 95.6 53.7
Investments 705.0 705.3
Property, plant and equipment 13.2 14.1
Deferred tax assets 39.1 45.6
Intangible assets 47.6 38.5
Total non-current assets 900.5 857.2
Total assets 1,412.4 1,213.6
Current liabilities
Trade and other payables 153.7 144.0
Current tax liabilities 147.4 81.8
Provisions 12.7 11.7
Deferred revenue and other liabilities 19.6 16.9
Total current liabilities 333.4 254.4
Non-current liabilities
Trade and other payables 2.3 5.1
Borrowings 163.0 166.0
Provisions 6.5 6.4
Deferred revenue and other liabilities 17.7 8.6
Total non-current liabilities 189.5 186.1
Total liabilities 522.9 440.5
Net assets 889.5 773.1
Equity
Contributed equity 715.1 693.8
Reserves (132.5) (78.3)
Retained earnings 306.9 157.6
Total equity 889.5 773.1
6-6 Deed of cross guarantee (continued)
Set out below is the balance sheet of the Closed Group:
Aristocrat Leisure Limited
Financial statements for the year ended 30 September 2017 34
For
per
sona
l use
onl
y

Notes to the financial statementsOther disclosures (continued)
Corporate information
The Group's registered office and principal place of business is:
Basis of preparation
Policies have been applied consistently for all years presented, unless otherwise stated.
Principles of consolidation
Foreign currency
Reserves Historical date
Foreign exchange gains and losses resulting from translation are recognised in the statement of profit or loss, except for qualifying cash flow hedges which are
deferred to equity.
Foreign exchange differences resulting from translation of foreign operations are initially recognised in the foreign currency translation reserve and subsequently
transferred to the profit or loss on disposal of the foreign operation.
Income and expenses Average exchange rate
Assets and liabilities Reporting date
Equity Historical date
6-7 Basis of preparation
The results and financial position of foreign operations are translated into Australian dollars at the reporting date using the following applicable exchange rates:
Aristocrat Leisure Limited is a for-profit company incorporated and domiciled in Australia and limited by shares publicly traded on the Australian Securities Exchange.
This financial report covers the financial statements for the consolidated entity consisting of Aristocrat Leisure Limited and its subsidiaries (together referred to as the
Group). A description of the nature of the Group's operations and its principal activities is included in the Directors' Report and the Operating and Financial Review.
The financial report was authorised for issue in accordance with a resolution of Directors on 30 November 2017.
Aristocrat Leisure Limited
Building A, Pinnacle Office Park
85 Epping Road
North Ryde NSW 2113
Australia
The Group ensures that its corporate reporting is timely, complete and available globally. All press releases, financial statements, and other information are available in
the investor information section of the Company's website: www.aristocrat.com
These general purpose financial statements have been prepared in accordance with Australian Accounting Standards, other authoritative pronouncements of the
Australian Accounting Standards Board, International Financial Reporting Standards (IFRS) as issued by the International Accounting Standards Board (IASB) and the
Corporations Act 2001. The report presents information on a historical cost basis, except for financial assets and liabilities (including derivative instruments), which
have been measured at fair value and for classes of property, plant and equipment which have been measured at deemed cost. Amounts have been rounded off to
the nearest whole number of million dollars and one decimal place representing hundreds of thousands of dollars, or in certain cases, the nearest dollar in accordance
with the relief provided under the ASIC Corporations (Rounding in Financial/Directors' Reports) Instrument 2016/191 as issued by the Australian Securities and
Investments Commission.
Comparative information is reclassified where appropriate to enhance comparability.
The consolidated financial statements incorporate the financial statements of Aristocrat Leisure Limited (the Company) and its subsidiaries as at 30 September 2017.
Subsidiaries are fully consolidated from the date on which control is transferred to the Group. They are deconsolidated from the date that control ceases. The Group
controls an entity when the Group is exposed to, or has rights to, variable returns from its involvement with the entity and has the ability to affect those returns through
its power to direct the activities of the entity.
In preparing the consolidated financial statements, all intercompany balances, transactions and unrealised gains have been eliminated. Accounting policies of
subsidiaries have been changed where necessary to ensure consistency with the policies adopted by the Group.
The Group has a trust to administer the Group’s employee share scheme. This trust is consolidated as it is controlled by the Group.
The consolidated financial statements are presented in Australian dollars. Items included in the financial statements of each of the Group's entities are measured using
the currency of the primary economic environment in which the entity operates (the functional currency).
Foreign currency amount Applicable exchange rate
Aristocrat Leisure Limited
Financial statements for the year ended 30 September 2017 35
For
per
sona
l use
onl
y

Notes to the financial statementsOther disclosures (continued)
New accounting standards and interpretations
Reference
Financial Year of
Application by
Aristocrat
AASB 9 Financial
Instruments2019
AASB 15 Revenue from
Contracts with Customers2019
AASB 16 Leases 2020
AASB 16 removes the
classification of leases as either
operating leases or finance
leases for the lessee. The lease
becomes an on-balance sheet
liability that attracts interest,
together with a new asset on the
balance sheet.
Changes to the leases standard will impact the Group on leases of property,
plant and equipment. By bringing operating leases on the balance sheet,
there will be an increase in assets and a corresponding increase in liabilities.
Furthermore, the Group will no longer recognise 'rent expense' in relation to
operating leases, but rather depreciation expense on the right of use asset
and interest expense on the lease liability. Note 6-1 provides information on
operating lease commitments that are currently recorded off-balance sheet.
On transition to the new standard these will be recognised on-balance sheet
after discounting to present value.
Description Impact on the Group
AASB 9 addresses the
classification, measurement and
derecognition of financial assets
and financial liabilities. It also
includes an expected loss
impairment model and a reformed
approach to hedge accounting.
The Group has reviewed AASB 9 to determine the impact of the new
standard and to develop accounting policies that will be followed from
FY2019.
The Group has assessed the impact of the new 'expected loss model'
whereby doubtful debts provisions will need to incorporate the risk that
receivables will not be collected regardless of whether customers are making
payments. Given that historical bad debts of the Group are relatively low, it is
not expected that the doubtful debts provision will be materially different on
transition to the new Standard.
The Group does not expect the overall impact of the changes to be material.
6-7 Basis of preparation (continued)
The new standard is based on the
principle that revenue is
recognised when control of goods
or services transfers to the
customer. The notion of control
replaces the existing notion of
risks and rewards. AASB 15
replaces existing revenue
recognition standards including
AASB 118 Revenue and AASB
111 Construction Contracts.
The assessment of impact to date has focused on the Group's main revenue
streams by reviewing arrangements with customers to identify the impacts of
the new standard and to develop an accounting policy to be followed from
FY2019.
Overall, the Group expects a low magnitude of impact on adoption of the new
standard.
A number of new accounting standards and interpretations have been published that are not mandatory for 30 September 2017 reporting periods and have not been
early adopted by the Group. The status of the Group’s assessment of the impact of these new standard and interpretations is set out below:
Aristocrat Leisure Limited
Financial statements for the year ended 30 September 2017 36
For
per
sona
l use
onl
y

Directors' declaration
In the Directors' opinion:
(a)
(b)
(c)
Sydney
30 November 2017
at the date of this declaration, there are reasonable grounds to believe that the members of the Extended Closed
Group identified in Note 6-6 will be able to meet any obligations or liabilities to which they are, or may become,
subject by virtue of the deed of cross guarantee described in Note 6-6.
Note 6-7 confirms that the financial statements also comply with International Financial Reporting Standards as issued by the
International Accounting Standards Board.
The Directors have been given declarations by the Chief Executive Officer and Managing Director and Chief Financial Officer
required by section 295A of the Corporations Act 2001.
This declaration is made in accordance with a resolution of the Directors.
I Blackburne
Chairman
for the year ended 30 September 2017
the financial statements and notes set out on pages 3 to 36 are in accordance with the Corporations Act 2001
including:
(i) complying with Accounting Standards, the Corporations Regulations 2001 and other mandatory
professional reporting requirements;
(ii) giving a true and fair view of the consolidated entity's financial position as at 30 September 2017 and of its
performance, for the financial year ended on that date; and
there are reasonable grounds to believe that the Company will be able to pay its debts as and when they become
due and payable; and
Aristocrat Leisure Limited
Financial statements for the year ended 30 September 2017 37
For
per
sona
l use
onl
y
PricewaterhouseCoopers, ABN 52 780 433 757One International Towers Sydney, Watermans Quay, Barangaroo, GPO BOX 2650, SYDNEY NSW 2001T: +61 2 8266 0000, F: +61 2 8266 9999, www.pwc.com.au
Liability limited by a scheme approved under Professional Standards Legislation.
Independent auditor’s reportTo the members of Aristocrat Leisure Limited
Report on the audit of the Financial Report
Our opinion
In our opinion:
The accompanying financial report of Aristocrat Leisure Limited (the Company) and its controlledentities (together, the Group) is in accordance with the Corporations Act 2001, including:
a) giving a true and fair view of the Group’s financial position as at 30 September 2017 and of itsfinancial performance for the year then ended
b) complying with Australian Accounting Standards and the Corporations Regulations 2001.
What we have audited
The Group’s financial report comprises:
● the balance sheet as at 30 September 2017
● the statement of profit and loss and comprehensive income for the year then ended
● the statement of changes in equity for the year then ended
● the cash flow statement for the year then ended
● the notes to the financial statements, which include a summary of significant accountingpolicies
● the directors’ declaration.
Basis for opinion
We conducted our audit in accordance with Australian Auditing Standards. Our responsibilities underthose standards are further described in the Auditor’s responsibilities for the audit of the financialreport section of our report.
We believe that the audit evidence we have obtained is sufficient and appropriate to provide a basis forour opinion.
Independence
We are independent of the Group in accordance with the auditor independence requirements of theCorporations Act 2001 and the ethical requirements of the Accounting Professional and EthicalStandards Board’s APES 110 Code of Ethics for Professional Accountants (the Code) that are relevantto our audit of the financial report in Australia. We have also fulfilled our other ethical responsibilitiesin accordance with the Code.F
or p
erso
nal u
se o
nly
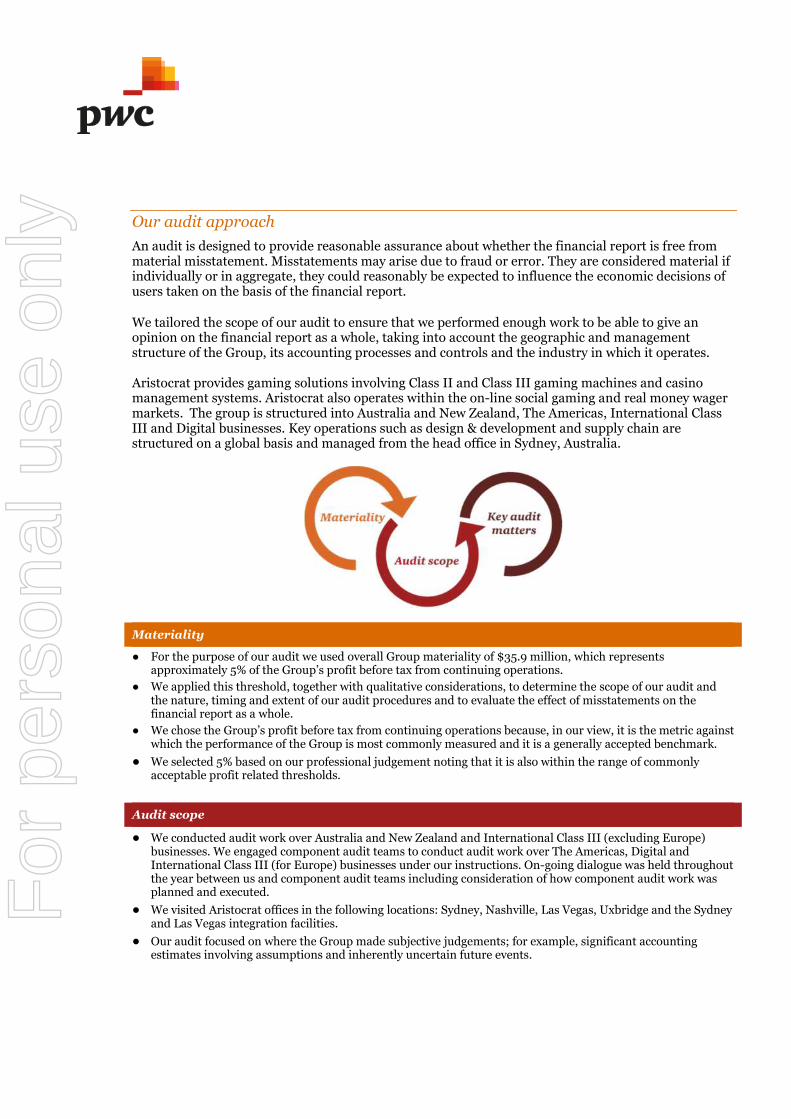
Our audit approach
An audit is designed to provide reasonable assurance about whether the financial report is free frommaterial misstatement. Misstatements may arise due to fraud or error. They are considered material ifindividually or in aggregate, they could reasonably be expected to influence the economic decisions ofusers taken on the basis of the financial report.
We tailored the scope of our audit to ensure that we performed enough work to be able to give anopinion on the financial report as a whole, taking into account the geographic and managementstructure of the Group, its accounting processes and controls and the industry in which it operates.
Aristocrat provides gaming solutions involving Class II and Class III gaming machines and casinomanagement systems. Aristocrat also operates within the on-line social gaming and real money wagermarkets. The group is structured into Australia and New Zealand, The Americas, International ClassIII and Digital businesses. Key operations such as design & development and supply chain arestructured on a global basis and managed from the head office in Sydney, Australia.
Materiality
● For the purpose of our audit we used overall Group materiality of $35.9 million, which representsapproximately 5% of the Group’s profit before tax from continuing operations.
● We applied this threshold, together with qualitative considerations, to determine the scope of our audit andthe nature, timing and extent of our audit procedures and to evaluate the effect of misstatements on thefinancial report as a whole.
● We chose the Group’s profit before tax from continuing operations because, in our view, it is the metric againstwhich the performance of the Group is most commonly measured and it is a generally accepted benchmark.
● We selected 5% based on our professional judgement noting that it is also within the range of commonlyacceptable profit related thresholds.
Audit scope
● We conducted audit work over Australia and New Zealand and International Class III (excluding Europe)businesses. We engaged component audit teams to conduct audit work over The Americas, Digital andInternational Class III (for Europe) businesses under our instructions. On-going dialogue was held throughoutthe year between us and component audit teams including consideration of how component audit work wasplanned and executed.
● We visited Aristocrat offices in the following locations: Sydney, Nashville, Las Vegas, Uxbridge and the Sydneyand Las Vegas integration facilities.
● Our audit focused on where the Group made subjective judgements; for example, significant accountingestimates involving assumptions and inherently uncertain future events.
For
per
sona
l use
onl
y
Key audit matters
Key audit matters are those matters that, in our professional judgement, were of most significance inour audit of the financial report for the current period. The key audit matters were addressed in thecontext of our audit of the financial report as a whole, and in forming our opinion thereon, and we donot provide a separate opinion on these matters. Further, any commentary on the outcomes of aparticular audit procedure is made in that context. We communicated the key audit matters to theAudit and Risk Committee.
Key audit matter How our audit addressed the key audit matter
Revenue recognition
Refer to Note 1-2 Revenue $2,454m
A material proportion of the Group’s totalrevenue is represented by sales of Class IIIgaming machines and casino managementsystems resulting from multi-elementarrangements as described in the accountingpolicy note 1-2.
Accounting for revenue from sales of ClassIII gaming machines and casinomanagement systems is complex due tobespoke contractual arrangements withcustomers such as delayed settlement,delayed delivery and bundling of products.
Where sales are made to distributors there isa risk that the contractual arrangements maynot result in the transfer of inventory riskand that sales may not be recognised in thecorrect financial reporting period. This maypotentially result in a material misstatementof the reported revenue for the financialyear.
For this reason, we have focused on revenuerecognition of the bespoke contractualarrangements with the customers of Class IIIgaming machines and casino managementsystems.
We obtained an understanding of the systems, controls andprocesses associated with the recording of sales transactions.We identified, selected and tested contracts that had a higherrisk of sales not being recognised in the correct period.
Where delayed settlement terms were identified during ourtesting we re-calculated the Group’s calculation of presentvalue of the consideration and found it to be accurate for thesample of contracts we tested.
Where delayed delivery was identified we considered whetherthe Group has transferred the inventory risk to the customerbefore the balance date of 30 September 2017 and found thatthey had in the sample of contracts we tested.
Where bundling of different products was identified wecompared the revenue allocation of the products sold in thesample of contracts to recent examples of sales of that producton a standalone basis. We found that the implied discounts hadbeen appropriately allocated pro-rata across the products soldand had been recognised in the correct period for the samplewe tested.
For a sample of sales made to distributors we considered thecommercial substance of the contractual arrangement and wetested to satisfy ourselves that inventory risks such asobsolescence had passed to the distributor such that thedistributor was not acting as an agent of Aristocrat and that itwas appropriate to recognise the revenue on delivery to thedistributor rather than the end customer.
For
per
sona
l use
onl
y
Income taxes
Refer to Note 1-4 Taxes $233m
The Group operates globally and is subject totax regimes and tax legislation administeredby separate tax authorities in a number ofcountries. Transfer pricing arrangementsbetween different countries are a complextax and accounting area. Judgement isinvolved in accounting for uncertain taxpositions that had not been assessed by therelevant tax authorities at the date of thisreport.
The Group has recognised provisions foruncertain tax positions in relation to some ofits international related party dealings.
Under the relevant legislation in certainterritories some tax assessments remainopen to challenge for an extended period.There is a risk that the position adopted bythe Group could be challenged by taxauthorities. This may potentially result in amaterial change in the accounting estimate.
We worked with our internal taxation experts to assess theGroup’s accounting for uncertain tax positions that existed at30 September 2017 including considering possible alternatepositions. We considered a number of matters, including:
● relevant correspondence with tax authorities● relevant correspondence with the Group’s tax advisors● consistency of assumptions, in years where tax
assessments were still open, to historically agreedpositions with tax authorities
● relevant tax legislation.
We considered whether the accounting positions adopted foryears open to amendment of assessment were calculated on abasis that was consistent with historically agreed positionswith revenue authorities.
For
per
sona
l use
onl
y
Estimated recoverable amount of goodwill– Video Gaming Technology Inc. (VGT)
Refer to Note 2-3 Intangible assets $878m
The total goodwill balance of $973m issignificantly greater than materiality. Thelargest proportion of the goodwill relates tothe VGT business ($878m). We focussed onthe impairment testing relating to the VGTbusiness goodwill recoverable amountbecause of the judgement involved in theassessment of potential impairment as at 30September 2017.
The Group’s impairment assessmentincludes assumptions about the forecastedfuture results of the VGT business, terminalgrowth rate, revenue forecasts and thediscount rates applied to future cash flowforecasts in order to assess the impact on thevaluation of goodwill.
Our audit procedures over VGT’s goodwill (amongst others) aredetailed below.
We evaluated and challenged the Group’s cash flow forecastsand the process by which they were developed.
We compared these forecasts to the Board approved one yearplan and the strategic 5 year forecast and found them to beconsistent.
We compared previous forecasts to actual results, to assess theperformance of the business and the accuracy of the Group’sforecasting of future results.
We challenged:
- the terminal growth rate - comparing it to economic andindustry forecasts
- the discount rate – assessing the costs of capital applied tothe Group and comparable organisations, as well asconsidering territory specific factors.
- the installed base and win per unit assumptions includingconsidering historical growth rates of the Group.
We tested the sensitivity of the calculations by varying theabove mentioned key assumptions. We determined theimpairment testing result was most sensitive to assumptionsfor revenue growth rates and discount rates.
We checked the valuation calculations used in the impairmenttesting for mathematical accuracy.
We also noted that the market capitalisation of the Group wassignificantly higher than the Group’s net assets of $1,346million as at 30 September 2017 (which includes VGT’sgoodwill).
For
per
sona
l use
onl
y
Other information
The directors of the Company are responsible for the other information. The other informationcomprises the Director’s Report and Operating and Financial Review for the year ended 30 September2017 (but does not include the financial report and our auditor’s report thereon), which we obtainedprior to the date of this auditor’s report. We expect other information to be made available to us afterthe date of this auditor’s report, including the 2017 Online Business Review and 2017 CorporateGovernance Statement on the Group’s website referenced from the 2017 Group’s Annual Report andCompany Profile and Key Dates, Nevada Information Statement, Five Year Summary, ShareholderInformation and Corporate Directory included in the Group’s annual report for the year ended 30September 2017.
Our opinion on the financial report does not cover the other information and we do not and will notexpress an opinion or any form of assurance conclusion thereon.
In connection with our audit of the financial report, our responsibility is to read the other informationidentified above and, in doing so, consider whether the other information is materially inconsistentwith the financial report or our knowledge obtained in the audit, or otherwise appears to be materiallymisstated.
If, based on the work we have performed on the other information that we obtained prior to the date ofthis auditor’s report, we conclude that there is a material misstatement of this other information, weare required to report that fact. We have nothing to report in this regard.
When we read the other information not yet received as identified above, if we conclude that there is amaterial misstatement therein, we are required to communicate the matter to the directors and useour professional judgement to determine the appropriate action to take.
Responsibilities of the directors for the financial report
The directors of the Company are responsible for the preparation of the financial report that gives atrue and fair view in accordance with Australian Accounting Standards and the Corporations Act 2001and for such internal control as the directors determine is necessary to enable the preparation of thefinancial report that gives a true and fair view and is free from material misstatement, whether due tofraud or error.
In preparing the financial report, the directors are responsible for assessing the ability of the Group tocontinue as a going concern, disclosing, as applicable, matters related to going concern and using thegoing concern basis of accounting unless the directors either intend to liquidate the Group or to ceaseoperations, or have no realistic alternative but to do so.
Auditor’s responsibilities for the audit of the financial report
Our objectives are to obtain reasonable assurance about whether the financial report as a whole is freefrom material misstatement, whether due to fraud or error, and to issue an auditor’s report thatincludes our opinion. Reasonable assurance is a high level of assurance, but is not a guarantee that anaudit conducted in accordance with the Australian Auditing Standards will always detect a materialmisstatement when it exists. Misstatements can arise from fraud or error and are considered materialif, individually or in the aggregate, they could reasonably be expected to influence the economicdecisions of users taken on the basis of the financial report.
A further description of our responsibilities for the audit of the financial report is located at theAuditing and Assurance Standards Board website at:http://www.auasb.gov.au/auditors_responsibilities/ar1.pdf
For
per
sona
l use
onl
y

This description forms part of our auditor’s report.
Report on the remuneration report
Our opinion on the remuneration report
We have audited the remuneration report included in pages 26 to 47 of the directors’ report for theyear ended 30 September 2017.
In our opinion, the remuneration report of Aristocrat Leisure Limited for the year ended 30 September2017 complies with section 300A of the Corporations Act 2001.
Responsibilities
The directors of the Company are responsible for the preparation and presentation of theremuneration report in accordance with section 300A of the Corporations Act 2001. Our responsibilityis to express an opinion on the remuneration report, based on our audit conducted in accordance withAustralian Auditing Standards.
PricewaterhouseCoopers
MK Graham SydneyPartner 30 November 2017
Scott Walsh SydneyPartner 30 November 2017
For
per
sona
l use
onl
y