Embed Size (px)
Citation preview

Chadstone, VIC
15 February 2017
FY17 interim results December 2016
For
per
sona
l use
onl
y

Overview Angus McNaughton
Emporium Melbourne, VIC
For
per
sona
l use
onl
y

Angus McNaughton CEO and Managing Director
Richard Jamieson Chief Financial Officer
Overview Angus McNaughton
Financial results Richard Jamieson
Portfolio update Michael O’Brien
Development update Carolyn Viney
Summary and FY17 guidance and focus Angus McNaughton
Agenda
Michael O’Brien Chief Investment Officer
Carolyn Viney EGM Development
For
per
sona
l use
onl
y

Vicinity Centres | FY17 interim results | 15 February 2017
Tip (Header)
The header has been set up to give you the ability to change the colour and keep it consistent.
Click the Increase/Decrease List level button to change between the different available heading colours.
Tip (Header)
The header has been set up to give you the ability to change the colour and keep it consistent.
Click the Increase/Decrease List level button to change between the different available heading colours.
Tip (Header)
The header has been set up to give you the ability to change the colour and keep it consistent.
Click the Increase/Decrease List level button to change between the different available heading colours.
Tip (Header)
The header has been set up to give you the ability to change the colour and keep it consistent.
Click the Increase/Decrease List level button to change between the different available heading colours.
Solid financial result $908.8m statutory net profit
Underlying earnings down 0.4%, but up 4.8% on a comparable basis4
Strong net valuation gain5 of $508m, increasing net tangible assets per security (NTA) to $2.73
Conservative gearing position of 24.0%
Standard & Poor’s raised credit rating to ‘A’ with a stable outlook on strengthening portfolio quality
Well advanced on portfolio enhancement strategy ~$1.5b divestment program now largely complete
Development pipeline at $3.0b (Vicinity share: $1.4b)
• Key retail stage of $666m (Vicinity share: $333m) Chadstone project completed
• Mandurah Forum development progressing well
Increased ownership6 of DFO South Wharf from 75% to 100%
Strong portfolio fundamentals Occupancy unchanged at 99.4%
Leasing spreads7 of 1.7% (FY16: 0.5%)
Comparable NPI growth of 3.0%
4
FY17 interim results summary Solid result reflecting focus on strategy and strong underlying performance
$908.8m Net profit
Dec-15: $424.6m
14.3% 12 month total return1
9.5 cps Underlying earnings
Dec-15: 9.5 cps
3.0% Net property income (NPI) growth2
Jun-16: 3.5%3
2.2% Specialty MAT growth2
Jun-16: 3.0%
99.4% Portfolio occupancy
Jun-16: 99.4%
1. Calculated as: (Change in NTA during the prior 12 months + distributions declared)/Opening NTA. 2. Comparable. 3. FY16 compared to FY15. 4. Refer to slide 40 for details. 5. Excludes acquisitions, divestments and statutory adjustments, and includes the impact of equity accounted investments. 6. Contracts exchanged in February 2017 and expected to settle in April 2017. 7. Leasing spreads include all shop types other than majors and ATMs.
For
per
sona
l use
onl
y

Vicinity Centres | FY17 interim results | 15 February 2017
Tip (Header)
The header has been set up to give you the ability to change the colour and keep it consistent.
Click the Increase/Decrease List level button to change between the different available heading colours.
Tip (Header)
The header has been set up to give you the ability to change the colour and keep it consistent.
Click the Increase/Decrease List level button to change between the different available heading colours.
Tip (Header)
The header has been set up to give you the ability to change the colour and keep it consistent.
Click the Increase/Decrease List level button to change between the different available heading colours.
Tip (Header)
The header has been set up to give you the ability to change the colour and keep it consistent.
Click the Increase/Decrease List level button to change between the different available heading colours.
Dec-16 Dec-15 Change
Number of assets 75 85 (10)
Specialty sales per sqm2 $9,200 $8,459 8.8%
Specialty occupancy cost2 14.6% 15.2% (60 bps)
Occupancy rate 99.4% 99.2% 20 bps
Leasing spread - total 1.7% (1.8%) 350 bps
Capitalisation rate 5.75% 6.10% (35 bps)
Portfolio enhancement strategy and ~$1.5b asset divestment program announced in December 2015
Divestment program largely complete with $1.4b of assets sold at a 1.3% premium to book value Assets sold averaged specialty sales of ~$6,900 per sqm
Capital reinvested into enhancement opportunities
Acquired $538m of assets1 with strong future growth fundamentals
Entered joint venture to develop DFO at Perth Airport
Progressed development pipeline
Clear improvement in portfolio metrics
Recognised by Standard & Poor’s raising credit rating
5
Delivering on portfolio enhancement strategy Significant improvement in portfolio quality reflected in key property metrics
1. Includes contracts exchanged in February 2017 for the acquisition of the remaining 25% interest in DFO South Wharf, which is expected to settle in April 2017. 2. Comparable. Refer to slide 47 for details.
Improvement in metrics over past year
For
per
sona
l use
onl
y

Vicinity Centres | FY17 interim results | 15 February 2017
Tip (Header)
The header has been set up to give you the ability to change the colour and keep it consistent.
Click the Increase/Decrease List level button to change between the different available heading colours.
6
Retail environment Drivers generally supportive of retail spending growth
0%
1%
2%
3%
4%
5%
6%
7%
8%
9%
10%
-5%
0%
5%
10%
15%
20%
2004 2005 2006 2007 2008 2009 2010 2011 2012 2013 2014 2015 2016
Gro
wth
Rat
e (Y
oY)
Ch
ange
in H
ou
sin
g P
rice
Ind
ex (
YoY)
House price growth is moderating House Prices Growth Retail Turnover (MAT) Growth
Source: ABS and Vicinity Centres Research.
1%
2%
3%
4%
5%
6%
7%
8%
9%
75
80
85
90
95
100
105
110
115
120
125
2000 2001 2002 2003 2004 2005 2006 2007 2008 2009 2010 2011 2012 2013 2014 2015 2016 2017
Gro
wth
Rat
e (Y
oY)
Co
nsu
mer
Sen
tim
ent
Ind
ex
Consumer sentiment reflecting increased uncertainty Consumer Sentiment Retail Turnover (MAT) Growth
Source: ABS, Melbourne Institute and Vicinity Centres Research.
0.6
0.7
0.8
0.9
1.0
1.1
1.2
1.3
1.4
1.5
0.40
0.50
0.60
0.70
0.80
0.90
1.00
1.10
1.20
2000 2001 2002 2003 2004 2005 2006 2007 2008 2009 2010 2011 2012 2013 2014 2015 2016 2017
Ove
rsea
s Tr
avel
(O
utb
ou
nd
:In
bo
un
d R
atio
)
Exch
ange
Rat
e (A
UD
:USD
)
AUD supporting rising inbound travel growth Exchange Rate (AUD:USD) Overseas Travel OUT:IN Ratio
Source: ABS, RBA and Vicinity Centres Research.
More Outbound Travel
More Inbound Travel
0%
5%
10%
15%
20%
25%
30%
35%
40%
0.60
0.70
0.80
0.90
1.00
1.10
1.20
2011 2012 2013 2014 2015 2016
Gro
wth
Rat
e (Y
oY)
Exch
ange
Rat
e (A
UD
:USD
)
Online spending growth relatively stable Exchange Rate (AUD:USD) Online Retail Spending Growth
Source: NAB, RBA and Vicinity Centres Research.
For
per
sona
l use
onl
y

Vicinity Centres | FY17 interim results | 15 February 2017
Tip (Header)
The header has been set up to give you the ability to change the colour and keep it consistent.
Click the Increase/Decrease List level button to change between the different available heading colours.
Tip (Header)
The header has been set up to give you the ability to change the colour and keep it consistent.
Click the Increase/Decrease List level button to change between the different available heading colours.
Tip (Header)
The header has been set up to give you the ability to change the colour and keep it consistent.
Click the Increase/Decrease List level button to change between the different available heading colours.
Tip (Header)
The header has been set up to give you the ability to change the colour and keep it consistent.
Click the Increase/Decrease List level button to change between the different available heading colours.
7
Retail trends Structural changes providing opportunities for Vicinity
Chadstone, VIC
Consumer demand for better experiences Consumer demand for lifestyle, services and food driving sales growth in these categories
Opportunities exist to enhance consumers’ shopping centre experience
Portfolio-wide connectivity will enable closer relationships with consumers
Continued strong demand from international retailers New international flagships driving strong foot traffic and sales
Some impact on retailers who have not adapted to increased competition
Divergence in retailer performance Retailers with well-considered omni-channel strategies to benefit most
Recent retailer administrations providing remixing opportunities
Technology is changing the shopping centre landscape Merging physical and digital consumer experiences
Increasing application of operational technology in-centre
Operating, leasing and development decisions to be enhanced by data insights
For
per
sona
l use
onl
y

Financial results Richard Jamieson
QueensPlaza, QLD
For
per
sona
l use
onl
y

Vicinity Centres | FY17 interim results | 15 February 2017
Tip (Header)
The header has been set up to give you the ability to change the colour and keep it consistent.
Click the Increase/Decrease List level button to change between the different available heading colours.
Tip (Header)
The header has been set up to give you the ability to change the colour and keep it consistent.
Click the Increase/Decrease List level button to change between the different available heading colours.
Tip (Header)
The header has been set up to give you the ability to change the colour and keep it consistent.
Click the Increase/Decrease List level button to change between the different available heading colours.
Tip (Header)
The header has been set up to give you the ability to change the colour and keep it consistent.
Click the Increase/Decrease List level button to change between the different available heading colours.
9
Financial results Underlying earnings up 4.8%1 on a comparable basis
1. Refer to slide 40 for details. 2. Refer to slide 39 for full reconciliation of underlying earnings to statutory net profit. 3. Calculated as: Distributions declared/Underlying earnings. 4. Excludes acquisitions, divestments and development-impacted centres and is calculated on a like-for-like basis versus the prior corresponding period.
For the six months to Dec-16
($m) Dec-15
($m)
Change (%)
Net property income (NPI) 461.7 472.9 (2.4)
Partnerships and other income 34.1 32.6 4.6
Total income 495.8 505.5 (1.9)
Net corporate overheads (37.1) (42.3) (12.3)
Net interest expense (82.7) (85.6) (3.4)
Total expenses (119.8) (127.9) (6.3)
Underlying earnings 376.0 377.6 (0.4)
Net profit after tax2 908.8 424.6 114.0
Underlying EPS (cents) 9.5 9.5 (0.4)
DPS (cents) 8.7 8.8 (1.1)
Payout ratio3 (%) 91.6 92.3 (70 bps)
$908.8m Net profit
Driven largely by net valuation gain of over $500m
3.0% Comparable NPI growth4
Solid income growth and prudent property expense management
12.3% Reduction in overheads
Realisation of cost savings and timing benefits
4.8% Comparable underlying earnings growth1
Down 0.4% on an unadjusted basis
For
per
sona
l use
onl
y
Vicinity Centres | FY17 interim results | 15 February 2017
Tip (Header)
The header has been set up to give you the ability to change the colour and keep it consistent.
Click the Increase/Decrease List level button to change between the different available heading colours.
Tip (Header)
The header has been set up to give you the ability to change the colour and keep it consistent.
Click the Increase/Decrease List level button to change between the different available heading colours.
Tip (Header)
The header has been set up to give you the ability to change the colour and keep it consistent.
Click the Increase/Decrease List level button to change between the different available heading colours.
Tip (Header)
The header has been set up to give you the ability to change the colour and keep it consistent.
Click the Increase/Decrease List level button to change between the different available heading colours.
10
Balance sheet Strong balance sheet provides sufficient capacity to fund future growth
As at Dec-16
($m) Jun-16
($m) Change
($m)
Cash 79.6 52.8 26.8
Direct properties 15,037.0 14,658.7 378.3
Intangible assets 600.8 602.4 (1.6)
Other assets 401.0 535.6 (134.6)
Total assets 16,118.4 15,849.5 268.9
Borrowings 3,743.8 3,942.2 (198.4)
Other liabilities 962.8 1,058.3 (95.5)
Total liabilities 4,706.6 5,000.5 (293.9)
Net assets 11,411.8 10,849.0 562.8
Net tangible assets per security ($) 2.73 2.59 5.4%
Net asset value per security ($) 2.88 2.74 5.1%
5.4% Growth in NTA to $2.73
$378.3m Increase in direct property
Reflecting strong valuation gains
($198.4m) Decrease in borrowings
Net repayments from asset disposal proceeds
For
per
sona
l use
onl
y

Vicinity Centres | FY17 interim results | 15 February 2017
Tip (Header)
The header has been set up to give you the ability to change the colour and keep it consistent.
Click the Increase/Decrease List level button to change between the different available heading colours.
Tip (Header)
The header has been set up to give you the ability to change the colour and keep it consistent.
Click the Increase/Decrease List level button to change between the different available heading colours.
Tip (Header)
The header has been set up to give you the ability to change the colour and keep it consistent.
Click the Increase/Decrease List level button to change between the different available heading colours.
Tip (Header)
The header has been set up to give you the ability to change the colour and keep it consistent.
Click the Increase/Decrease List level button to change between the different available heading colours. Strongest growth in Chadstone, Outlet Centre and Neighbourhood
centres
WACR2 tightened 20 bps over the six months to 5.75%
Chadstone’s valuation now at $5.25b (Vicinity share: $2.63b), driven by continued income growth and capitalisation rate compression of 50 bps to 4.25%
11
Valuations Strong portfolio valuation gains1 of $508m or 3.5%
1. Excludes acquisitions, divestments and statutory adjustments, and includes the impact of equity accounted investments. 2. Weighted average capitalisation rate. 3. Vicinity’s ownership interest. Refer to slides 52 to 55 for details.
Key valuation movements
Valuation3 at 31-Dec-16
($m)
Net movement
($m) (%)
Chadstone 2,625.0 286.3 12.2
DFO South Wharf 416.6 25.3 6.5
DFO Homebush 408.8 17.9 4.6
Box Hill Central (South Precinct) 177.0 14.9 9.2
Lake Haven Centre 284.2 10.4 3.8
Chadstone, VIC
For
per
sona
l use
onl
y

Vicinity Centres | FY17 interim results | 15 February 2017
Tip (Header)
The header has been set up to give you the ability to change the colour and keep it consistent.
Click the Increase/Decrease List level button to change between the different available heading colours.
Tip (Header)
The header has been set up to give you the ability to change the colour and keep it consistent.
Click the Increase/Decrease List level button to change between the different available heading colours.
Tip (Header)
The header has been set up to give you the ability to change the colour and keep it consistent.
Click the Increase/Decrease List level button to change between the different available heading colours.
Tip (Header)
The header has been set up to give you the ability to change the colour and keep it consistent.
Click the Increase/Decrease List level button to change between the different available heading colours.
Debt maturity profile ($m)
12
Total facilities of $5.1b
Drawn debt of $3.7b comprised of 41% bank debt and 59% debt capital markets
Available liquidity of $1.4b
Capital management Limited debt expiries over the next 18 months
Debt sources (%)
30
19 11
13
27
178 38 40
735
400 150
655
260
1,204
43
128
700
557
0
250
500
750
1,000
1,250
1,500
FY17 FY18 FY19 FY20 FY21 FY22 FY23 Beyond
USPP AMTN EMTN Bank debt drawn Bank debt undrawn
Repaid Feb-17
For
per
sona
l use
onl
y

Vicinity Centres | FY17 interim results | 15 February 2017
Tip (Header)
The header has been set up to give you the ability to change the colour and keep it consistent.
Click the Increase/Decrease List level button to change between the different available heading colours.
Tip (Header)
The header has been set up to give you the ability to change the colour and keep it consistent.
Click the Increase/Decrease List level button to change between the different available heading colours.
Tip (Header)
The header has been set up to give you the ability to change the colour and keep it consistent.
Click the Increase/Decrease List level button to change between the different available heading colours.
Tip (Header)
The header has been set up to give you the ability to change the colour and keep it consistent.
Click the Increase/Decrease List level button to change between the different available heading colours. Standard & Poor’s raised4 Vicinity’s credit rating
to ‘A/stable’ from ‘A-/positive’
Strong financial position Conservatively geared at 24.0%
High interest cover ratio
Weighted average interest rate of 4.2%, which is expected to be maintained to the end of FY17
Solid tenor of almost five years maintained
Well positioned to fund development and strategic acquisition opportunities
As at Dec-16 Jun-16
Weighted average interest rate1 (%) 4.2 4.0
Gearing2 (%) 24.0 25.9
Proportion of debt hedged (%) 92 91
Debt duration3 (years) 4.8 5.3
Interest cover ratio (ICR) (times) 5.2 5.2
Credit ratings/outlook - Moody’s - Standard & Poor’s
A2/stable A/stable4
A2/stable
A-/positive
13
Capital management Credit rating raised on portfolio quality improvement
1. The average over the reporting period and inclusive of margin, drawn line fees and establishment fees. 2. Calculated as: Drawn debt net of cash/Total tangible assets excluding cash, derivative financial assets and finance lease assets. 3. Based on facility limits. 4. Rating change announced on 24 January 2017.
For
per
sona
l use
onl
y

Portfolio update Michael O’Brien
DFO Homebush, NSW
For
per
sona
l use
onl
y

Vicinity Centres | FY17 interim results | 15 February 2017
Tip (Header)
The header has been set up to give you the ability to change the colour and keep it consistent.
Click the Increase/Decrease List level button to change between the different available heading colours.
Tip (Header)
The header has been set up to give you the ability to change the colour and keep it consistent.
Click the Increase/Decrease List level button to change between the different available heading colours.
Tip (Header)
The header has been set up to give you the ability to change the colour and keep it consistent.
Click the Increase/Decrease List level button to change between the different available heading colours.
Tip (Header)
The header has been set up to give you the ability to change the colour and keep it consistent.
Click the Increase/Decrease List level button to change between the different available heading colours. Portfolio quality enhanced
Sold interests in eight retail assets and acquired interests in two assets3
Property metrics remain solid Comparable NPI growth1 of 3.0%
High portfolio occupancy maintained
Sales growth reflects moderating retail sales environment
Lower WACR due to strong investment market fundamentals and improvement in portfolio quality
As at 31-Dec-16 30-Jun-16
Number of retail assets 75 81
Gross lettable area (m)(sqm) 2.6 2.7
Comparable NPI growth1 (%) 3.0 3.5
Occupancy rate (%) 99.4 99.4
Weighted average lease expiry by GLA (years) 5.4 5.5
Total MAT growth2 (%) 1.3 2.1
Specialty MAT growth2 (%) 2.2 3.0
Specialty sales per sqm2 ($) 9,200 8,865
Specialty occupancy cost2 (%) 14.6 14.6
Weighted average capitalisation rate (WACR)(%) 5.75 5.95
15
Portfolio summary Property metrics remain solid
1. Excludes acquisitions, divestments and development-impacted centres and is calculated on a like-for-like basis versus the prior corresponding period. 2. On a comparable basis, which excludes divestments and development-impacted centres in accordance with Shopping Centre Council of Australia (SCCA) guidelines. Refer to slide 47 for details. 3. Includes contracts exchanged in February 2017 for the acquisition of the remaining 25% interest in DFO South Wharf, which is expected to settle in April 2017.
For
per
sona
l use
onl
y

Vicinity Centres | FY17 interim results | 15 February 2017
Tip (Header)
The header has been set up to give you the ability to change the colour and keep it consistent.
Click the Increase/Decrease List level button to change between the different available heading colours.
Tip (Header)
The header has been set up to give you the ability to change the colour and keep it consistent.
Click the Increase/Decrease List level button to change between the different available heading colours.
Tip (Header)
The header has been set up to give you the ability to change the colour and keep it consistent.
Click the Increase/Decrease List level button to change between the different available heading colours.
Tip (Header)
The header has been set up to give you the ability to change the colour and keep it consistent.
Click the Increase/Decrease List level button to change between the different available heading colours. Specialty stores
Growth solid but has moderated to 2.2%, excluding Dick Smith growth was 2.7%
Supermarkets Growth has improved despite aggressive pricing strategies
Mini majors Robust performance
Growth was 9.3% excluding Dick Smith
Department stores and discount department stores Significant divergence in performance between chains
Actual MAT Dec-16 Comparable1 MAT growth
MAT ($m)
Proportion of portfolio (%)
Dec-16 (%)
Jun-16 (%) By sales By rent
Specialty stores 6,207 38 56 2.2 3.0
Supermarkets 4,660 29 9 0.5 0.1
Mini majors2 1,825 11 12 3.3 3.5
Discount department stores 1,579 10 7 (0.5) 2.8
Other retail3, 4 1,026 6 11 1.5 3.8
Department stores 842 5 4 (0.3) 2.7
Total portfolio 16,140 100 100 1.3 2.1
16
Portfolio sales by store type Mini majors sales growth robust in a moderating sales environment
1. Excludes divestments and development-impacted centres in accordance with SCCA guidelines. Refer to slide 47 for details. 2. Mini majors includes retailers with a lettable area of 400 sqm or greater (excludes retailers classified as majors). Examples of retailers include JB Hi Fi, The Reject Shop, Priceline, Rebel, Best & Less and Uniqlo. 3. Other retail includes cinemas, travel agents, auto accessories, lotteries and other entertainment. 4. Includes rent for non-retail stores.
Note: Totals may not sum due to rounding.
For
per
sona
l use
onl
y

Vicinity Centres | FY17 interim results | 15 February 2017
Tip (Header)
The header has been set up to give you the ability to change the colour and keep it consistent.
Click the Increase/Decrease List level button to change between the different available heading colours.
Tip (Header)
The header has been set up to give you the ability to change the colour and keep it consistent.
Click the Increase/Decrease List level button to change between the different available heading colours.
Tip (Header)
The header has been set up to give you the ability to change the colour and keep it consistent.
Click the Increase/Decrease List level button to change between the different available heading colours.
Tip (Header)
The header has been set up to give you the ability to change the colour and keep it consistent.
Click the Increase/Decrease List level button to change between the different available heading colours. Apparel
Men’s Apparel (+8.0%), Fashion Accessories (+6.6%) and Footwear (+4.3%) particularly strong
Women’s Apparel recorded a slight decline
Strong performance across Outlet Centres
General retail and Retail services Consumer demand remains strong for beauty and wellness services and products
Cosmetics very strong (+11.8%)
Food retail Solid growth boosted by Fruit and Vegetables (+5.8%) and Liquor (+6.4%)
Homewares Growth was 2.1% excluding Dick Smith
17
Portfolio specialty store performance General retail and services continue to grow strongly
1. Excludes divestments and development-impacted centres in accordance with SCCA guidelines. Refer to slide 47 for details. 2. General retail includes giftware, pharmacy and cosmetics, pets, discount variety, tobacconists, florists and toys.
Actual MAT Dec-16 Comparable1 MAT growth
MAT ($m)
% of specialty
sales Dec-16
(%) Jun-16
(%)
Apparel 2,194 35 2.8 3.0
Food catering 903 15 2.2 2.6
General retail2 576 9 4.9 5.7
Food retail 546 9 3.3 1.4
Retail services 522 8 6.5 7.0
Homewares 412 7 (5.7) 0.0
Leisure 408 7 0.8 1.0
Jewellery 404 7 (0.9) 2.7
Mobile phones 242 4 (2.7) 1.3
Total specialty stores 6,207 100 2.2 3.0
Note: Totals may not sum due to rounding.
For
per
sona
l use
onl
y

Vicinity Centres | FY17 interim results | 15 February 2017
Tip (Header)
The header has been set up to give you the ability to change the colour and keep it consistent.
Click the Increase/Decrease List level button to change between the different available heading colours.
Tip (Header)
The header has been set up to give you the ability to change the colour and keep it consistent.
Click the Increase/Decrease List level button to change between the different available heading colours.
Tip (Header)
The header has been set up to give you the ability to change the colour and keep it consistent.
Click the Increase/Decrease List level button to change between the different available heading colours.
Tip (Header)
The header has been set up to give you the ability to change the colour and keep it consistent.
Click the Increase/Decrease List level button to change between the different available heading colours. Victoria
Strong employment and housing market growth driving household consumption
DFO portfolio continues to perform strongly
NSW Strong housing sector activity, higher house prices and lower unemployment rate
Modest sales growth driven by Regional assets
Queensland Economy benefiting from tourism, housing activity and population growth
Western Australia Sales performance continues to reflect the end of the mining construction boom
Recent recovery in commodity prices
Economy forecast to recover into 2018
18
Portfolio sales by state Growth predominantly driven by eastern seaboard states
Comparable1 specialty store MAT growth by state (%)
1. Excludes divestments and development-impacted centres in accordance with SCCA guidelines. Refer to slide 47 for details.
Note: Percentages under state labels show proportion of portfolio specialty MAT by state.
4.6
0.6
3.2
(2.6)
4.6
0.8
2.2
-3-2-1012345
VIC(37%)
NSW(23%)
QLD(20%)
WA(15%)
SA(3%)
TAS(3%)
Total portfolio
Weighted comparable1 specialty store MAT growth by state (%)
1.7 0.1
0.6
(0.4)
0.1 0.0 2.2
0
1
2
3
VIC NSW QLD WA SA TAS Total portfolio
For
per
sona
l use
onl
y
Vicinity Centres | FY17 interim results | 15 February 2017
Tip (Header)
The header has been set up to give you the ability to change the colour and keep it consistent.
Click the Increase/Decrease List level button to change between the different available heading colours.
Tip (Header)
The header has been set up to give you the ability to change the colour and keep it consistent.
Click the Increase/Decrease List level button to change between the different available heading colours.
Tip (Header)
The header has been set up to give you the ability to change the colour and keep it consistent.
Click the Increase/Decrease List level button to change between the different available heading colours.
Tip (Header)
The header has been set up to give you the ability to change the colour and keep it consistent.
Click the Increase/Decrease List level button to change between the different available heading colours.
19
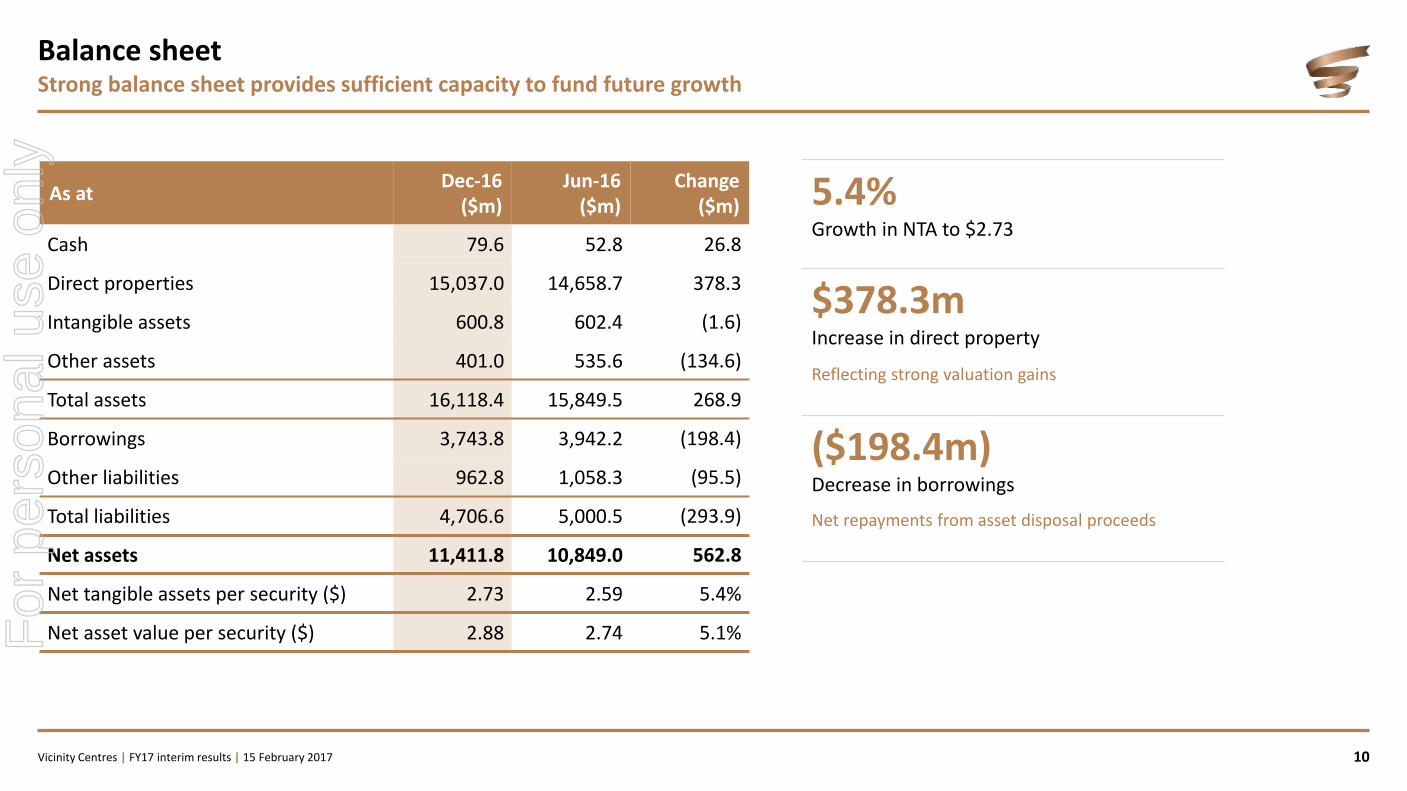
Leasing Leasing spreads have improved and lease expiry profile is well weighted
1. Leasing spreads include all shop types other than majors and ATMs. 2. Excluding project leasing and divestments. 3. Calculations based on a same centre analysis and excludes Outlet Centres.
Lease expiry profile by income (%)
Leasing spread1,2 (%)
Six months to 31-Dec-16
12 months to 30-Jun-16
Leasing spread – renewals 2.8 0.9
Leasing spread – replacements 0.4 0.0
Leasing spread – total 1.7 0.5
Leasing spreads have improved 667 lease transactions completed2
Solid increase in leasing spreads on renewals particularly in Outlet Centres
Cautious outlook given moderating retail trading environment
Proactive remixing changing retailer category weightings Specialty store area re-weighted over the past five years3:
• Cafes, food courts and restaurants increased by 20%
• Retail services increased by 32%
• Women’s Apparel reduced by 12%
Opportunities arising from retailer administrations Strengthening tenancy mix
138 stores (~1% of GLA) in administration since January 2016. Of the 88 stores handed back to date, over 80% have been re-leased
Well weighted lease expiry profile 72% of leases by income in place until FY19 and beyond
1 0 1 1 2
17
6 7 12 12 11
30
0
10
20
30
40
50
Holdover FY17 FY18 FY19 FY20 FY21+
Majors All other leases
For
per
sona
l use
onl
y

Vicinity Centres | FY17 interim results | 15 February 2017
Tip (Header)
The header has been set up to give you the ability to change the colour and keep it consistent.
Click the Increase/Decrease List level button to change between the different available heading colours.
Tip (Header)
The header has been set up to give you the ability to change the colour and keep it consistent.
Click the Increase/Decrease List level button to change between the different available heading colours.
Tip (Header)
The header has been set up to give you the ability to change the colour and keep it consistent.
Click the Increase/Decrease List level button to change between the different available heading colours.
Tip (Header)
The header has been set up to give you the ability to change the colour and keep it consistent.
Click the Increase/Decrease List level button to change between the different available heading colours. DFO portfolio now valued at $1.2b, with a 6.35% WACR1
Comparable specialty store MAT growth of 9.5%
Comparable specialty store MAT of $9,428/sqm
Specialty store occupancy cost of 10.4%
DFO is the pre-eminent outlet centre brand and is recognised nationally
Market leading capability and breadth of tenant relationships has delivered significant value 15.2% annualised total return since acquisition
Portfolio expanded Acquisition of DFO Brisbane (June 2016)
Acquired remaining 25% interest in DFO South Wharf2
DFO Perth Airport site works have commenced
Significant growth potential remains
20
DFO portfolio continues to perform strongly Vicinity is the leading owner and manager of Outlet Centres in Australia
1. As at 31 December 2016. 2. Contracts exchanged in February 2017 and expected to settle in April 2017.
DFO South Wharf, VIC
For
per
sona
l use
onl
y

Vicinity Centres | FY17 interim results | 15 February 2017
Tip (Header)
The header has been set up to give you the ability to change the colour and keep it consistent.
Click the Increase/Decrease List level button to change between the different available heading colours.
Tip (Header)
The header has been set up to give you the ability to change the colour and keep it consistent.
Click the Increase/Decrease List level button to change between the different available heading colours.
Tip (Header)
The header has been set up to give you the ability to change the colour and keep it consistent.
Click the Increase/Decrease List level button to change between the different available heading colours.
Tip (Header)
The header has been set up to give you the ability to change the colour and keep it consistent.
Click the Increase/Decrease List level button to change between the different available heading colours. Our commitments
Reach 3 Star Green Star Performance portfolio average within next 12 months
Build climate resilience into planning across our portfolio
Identify significant long-term carbon reduction target for the portfolio
Roll out centre-level community programs to address youth employment
Strong sustainability survey results
Dow Jones Sustainability Index (DJSI) Included in DJSI World, Asia Pacific and Australia leaders lists with score of 73/100
Global Real Estate Sustainability Benchmark (GRESB) Direct portfolio scored 83/100 against retail sector peer average of 77/100
CDP Rated ‘A-’ for climate change performance and recipient of award for ‘Best Climate Disclosure by a New Responding Company 2016’
Improved resource usage Energy intensity1 down 6%
Greenhouse gas emissions intensity1 down 9%
35% of waste diverted from landfill2
Enhanced community outcomes Established 3-year partnership with Beacon Foundation to focus on youth employment
21
A focus on creating shared value for Vicinity and our stakeholders Our sustainability program has generated significant benefits
1. FY16 compared to FY15 on a per sqm basis. 2. Over FY16.
For
per
sona
l use
onl
y

Development update
Carolyn Viney
The Glen, VIC
For
per
sona
l use
onl
y

Vicinity Centres | FY17 interim results | 15 February 2017
Tip (Header)
The header has been set up to give you the ability to change the colour and keep it consistent.
Click the Increase/Decrease List level button to change between the different available heading colours.
Tip (Header)
The header has been set up to give you the ability to change the colour and keep it consistent.
Click the Increase/Decrease List level button to change between the different available heading colours.
Tip (Header)
The header has been set up to give you the ability to change the colour and keep it consistent.
Click the Increase/Decrease List level button to change between the different available heading colours.
Tip (Header)
The header has been set up to give you the ability to change the colour and keep it consistent.
Click the Increase/Decrease List level button to change between the different available heading colours.
Development pipeline of $3.0b (Vicinity share: $1.4b)
Chadstone key retail stage successfully opened, with overall project completion by June 2017
Mandurah Forum multi-deck car park opened with 850 new spaces
DFO Perth Airport approved with site works commenced1 and retail construction expected to start in mid-2017
The Glen on track for commencement in 2Q 2017
Roselands major redevelopment not proceeding, refurbishment program being scoped
Galleria planning advancing
23
Development summary Development pipeline provides ongoing portfolio enhancement opportunities
1. Site works are being undertaken by Perth Airport Pty Ltd.
DFO Perth Airport, WA – Artist’s impression
Galleria, WA – Artist’s impression
For
per
sona
l use
onl
y

Vicinity Centres | FY17 interim results | 15 February 2017
Tip (Header)
The header has been set up to give you the ability to change the colour and keep it consistent.
Click the Increase/Decrease List level button to change between the different available heading colours.
Current
Estimated FY17 commencements
Estimated FY18 commencements
Estimated FY19+ commencements
24
Total Vicinity share Partner share $m
Investing to create long-term value
Extensive $3.0b development pipeline (Vicinity share: $1.4b) provides significant opportunities
75
60
350
75
245
46
175
333
300
100
120
700
150
490
85
61
350
666
The Myer Centre Brisbane
Midland Gate
Chadstone Hotel
Galleria
DFO Perth Airport
The Glen
Gateway Plaza
DFO South Wharf car park
Mandurah Forum
Chadstone Retail and Office
Note: Timing and costs of identified projects are indicative only and may change as projects advance.
For
per
sona
l use
onl
y

Vicinity Centres | FY17 interim results | 15 February 2017
Tip (Header)
The header has been set up to give you the ability to change the colour and keep it consistent.
Click the Increase/Decrease List level button to change between the different available heading colours.
25
Chadstone (VIC) development key retail stage completed The evolution of Australia’s best shopping centre continues
Key retail stage opened in October 2016 • Overwhelmingly well received by customers and retailers
• December monthly sales up 21% and foot traffic up 18% on prior corresponding period
• 2016 Boxing Day attracted over 170,000 visitors
Centre valued at $5.25b (Vicinity share: $2.63b) • Vicinity recorded $286m net valuation gain in December 2016
Four new flagship stores – Zara, H&M, Sephora and Uniqlo
Over 170 new and refurbished stores have opened
Backfill tenancies to open progressively until completion in June 2017
LEGOLAND® Discovery Centre to open in 2Q 2017
New office tower complete and fully leased
Future masterplan being progressed including proposed hotel
Key metrics
Cost (Retail and Office)1 $666m
Initial yield >6%
Expected IRR >10%
1. 100% interest. Vicinity’s share is 50%.
June 2017 project
completion
+19,800 sqm
GLA
Key retail stage complete
For
per
sona
l use
onl
y

Vicinity Centres | FY17 interim results | 15 February 2017
Tip (Header)
The header has been set up to give you the ability to change the colour and keep it consistent.
Click the Increase/Decrease List level button to change between the different available heading colours.
26
Chadstone development Key retail stage and office tower complete
Food Central Office tower
For
per
sona
l use
onl
y

Vicinity Centres | FY17 interim results | 15 February 2017
Tip (Header)
The header has been set up to give you the ability to change the colour and keep it consistent.
Click the Increase/Decrease List level button to change between the different available heading colours.
Tip (Header)
The header has been set up to give you the ability to change the colour and keep it consistent.
Click the Increase/Decrease List level button to change between the different available heading colours.
Tip (Header)
The header has been set up to give you the ability to change the colour and keep it consistent.
Click the Increase/Decrease List level button to change between the different available heading colours.
Tip (Header)
The header has been set up to give you the ability to change the colour and keep it consistent.
Click the Increase/Decrease List level button to change between the different available heading colours.
New 850 space multi-deck car park opened ahead of program
Leasing progressing to program with first retail stage to open 3Q 2017
Completion remains on schedule for mid-2018
Project will address high levels of escape expenditure from the catchment
Complete centre transformation • Brand new David Jones and Target
• Upgraded Coles and Kmart
• Total stores to increase by 80 to over 220 on completion
• New food court with adjoining play area, fresh food market hall and alfresco dining precinct
27
Mandurah Forum (WA) redevelopment on track Major redevelopment significantly improving product offer to capture growth opportunity
Key metrics
Cost1 $350m
Initial yield >6%
Expected IRR >10%
1. 100% interest. Vicinity’s share is 50%.
Mid-2018 project
completion
+26,000 sqm
GLA
Artist’s impression
New car park
For
per
sona
l use
onl
y

Vicinity Centres | FY17 interim results | 15 February 2017
Tip (Header)
The header has been set up to give you the ability to change the colour and keep it consistent.
Click the Increase/Decrease List level button to change between the different available heading colours.
Tip (Header)
The header has been set up to give you the ability to change the colour and keep it consistent.
Click the Increase/Decrease List level button to change between the different available heading colours.
Tip (Header)
The header has been set up to give you the ability to change the colour and keep it consistent.
Click the Increase/Decrease List level button to change between the different available heading colours.
Tip (Header)
The header has been set up to give you the ability to change the colour and keep it consistent.
Click the Increase/Decrease List level button to change between the different available heading colours.
Joint venture to develop the first DFO in Perth • 120 specialty stores
• Over 1,600 car spaces
Reinforces Vicinity’s market leadership position in Outlet Centres
Greenfield development enables optimisation of design and construction
Centrally located adjacent to Perth Airport and near major arterial roads
Site works have commenced, with retail construction expected to start in mid-2017
Leasing demand strong, leveraging extensive retailer relationships
Completion expected in 2018
28
DFO Perth Airport (WA) site works commenced Retail construction to start in mid-2017
1. Total cost including a lump sum rental payment. Vicinity’s share is approximately $75m.
Key metrics
Cost1 $150m
Initial yield >10%
Expected IRR >15%
Mid-2017 target retail
commencement
24,000 sqm
GLA
Artist’s impression
For
per
sona
l use
onl
y

Vicinity Centres | FY17 interim results | 15 February 2017
Tip (Header)
The header has been set up to give you the ability to change the colour and keep it consistent.
Click the Increase/Decrease List level button to change between the different available heading colours.
Tip (Header)
The header has been set up to give you the ability to change the colour and keep it consistent.
Click the Increase/Decrease List level button to change between the different available heading colours.
Tip (Header)
The header has been set up to give you the ability to change the colour and keep it consistent.
Click the Increase/Decrease List level button to change between the different available heading colours.
Tip (Header)
The header has been set up to give you the ability to change the colour and keep it consistent.
Click the Increase/Decrease List level button to change between the different available heading colours.
$490m1 major redevelopment • Latest format David Jones
• Introduction of Aldi and relocated Woolworths to anchor fresh food market with Coles
• New contemporary food gallery with elevated views and new casual dining hub over two levels
• Complete refurbishment of existing centre
Located in strong trade area • Above average incomes, low levels of household debt and above average
apparel expenditure
Planning approval received for residential development above the centre
Board and joint-owner approved
29
The Glen (VIC) redevelopment approved Major redevelopment to capitalise on high income trade area and capture of escape expenditure
1. 100% interest. Vicinity’s share is 50%.
Key metrics
Cost1 $490m
Initial yield >6%
Expected IRR >10%
2Q 2017 target
commencement
+18,900 sqm
GLA
Artist’s impression
Artist’s impression
For
per
sona
l use
onl
y

Vicinity Centres | FY17 interim results | 15 February 2017
Tip (Header)
The header has been set up to give you the ability to change the colour and keep it consistent.
Click the Increase/Decrease List level button to change between the different available heading colours.
Tip (Header)
The header has been set up to give you the ability to change the colour and keep it consistent.
Click the Increase/Decrease List level button to change between the different available heading colours.
Tip (Header)
The header has been set up to give you the ability to change the colour and keep it consistent.
Click the Increase/Decrease List level button to change between the different available heading colours.
Tip (Header)
The header has been set up to give you the ability to change the colour and keep it consistent.
Click the Increase/Decrease List level button to change between the different available heading colours.
30
Galleria (WA) planning advanced Significant proposed redevelopment to become one of the leading retail destinations in Perth
Centre metrics Post Change
Majors 8 +1
Mini majors 18 +11
Specialties ~350 +180
Car spaces ~6,100 +2,000
GLA (sqm) ~126,000 +53,000
+53,000 sqm
GLA
FY18
target commencement
1. 100% interest. Vicinity’s share is 50%.
Proposed $700m1 major redevelopment
Development Approval obtained in September 2016 for up to 170,000 sqm of retail space
Enables Galleria to become one of the leading retail destinations in Perth
Major tenant discussions have commenced with strong demand for space
Artist’s impression
Artist’s impression
For
per
sona
l use
onl
y

Summary and FY17 guidance
and focus
Angus McNaughton
Emporium Melbourne, VIC
For
per
sona
l use
onl
y

Vicinity Centres | FY17 interim results | 15 February 2017
Tip (Header)
The header has been set up to give you the ability to change the colour and keep it consistent.
Click the Increase/Decrease List level button to change between the different available heading colours.
Tip (Header)
The header has been set up to give you the ability to change the colour and keep it consistent.
Click the Increase/Decrease List level button to change between the different available heading colours.
Tip (Header)
The header has been set up to give you the ability to change the colour and keep it consistent.
Click the Increase/Decrease List level button to change between the different available heading colours.
Tip (Header)
The header has been set up to give you the ability to change the colour and keep it consistent.
Click the Increase/Decrease List level button to change between the different available heading colours. Comparable underlying earnings growth of 4.8%
Enhanced portfolio quality through asset divestment program, strategic acquisitions and progressing development projects
Solid portfolio fundamentals reflected in key metrics
Extensive development pipeline advancing
Strong balance sheet, well positioned for future opportunities
FY17 interim results summary Another active period for Vicinity
Warriewood Square, NSW
32
For
per
sona
l use
onl
y

Vicinity Centres | FY17 interim results | 15 February 2017
Tip (Header)
The header has been set up to give you the ability to change the colour and keep it consistent.
Click the Increase/Decrease List level button to change between the different available heading colours.
Tip (Header)
The header has been set up to give you the ability to change the colour and keep it consistent.
Click the Increase/Decrease List level button to change between the different available heading colours.
Tip (Header)
The header has been set up to give you the ability to change the colour and keep it consistent.
Click the Increase/Decrease List level button to change between the different available heading colours.
Tip (Header)
The header has been set up to give you the ability to change the colour and keep it consistent.
Click the Increase/Decrease List level button to change between the different available heading colours. Broader economic environment expected to remain supportive
of retail spending growth
FY17 underlying EPS guidance of 18.6 to 18.8 cents1 unchanged
• Reflects 4.5% to 5.6% growth in comparable2 underlying earnings
• Payout ratio is expected to be 90% to 95% of underlying earnings
Continue focus on extracting additional value through intensive asset management, particularly from tenant remixing and cost efficiencies
Significantly progress Mandurah Forum and DFO Perth Airport developments and commence The Glen redevelopment
Complete connection of all assets to a single high-speed digital network with WiFi capabilities and significantly advance other digital initiatives
33
FY17 guidance and focus Well positioned to create long-term value and sustainable growth
1. Assuming no material deterioration to existing economic conditions. 2. Adjusting for the impact of acquisitions and divestments.
Ellenbrook Central, WA
For
per
sona
l use
onl
y

Tip (Picture)
If the image goes over the Asset box:
Select the image > Right click > Send to back
Tip (Cropping)
Click the icon to insert a picture. Use the Crop Tools to position your image appropriately.
The Fit and Fill buttons can automatically size your picture to the placeholder.
nb Fit & Fill are not available in PPT 2007.
Tip (Agenda)
The agenda is made up of a table with two columns.
To add extra rows:
• Put your cursor in the last row, press the tab key.
• Type in the next number
• Press the tab key to move to the text area
This slide should be duplicated should you need alternate versions as to retain the agenda table formatting.
Tip (Asset Box)
The asset box is designed to expand with the text.
Occasionally it can appear as though the text is falling off.
To fix this:
• Press the Reset button on the ribbon.
Or
• Place your cursor in the box, press the spacebar.
It should then expand correctly.
Asset boxes should be positioned 1cm from the edge of the slide and flush with the bottom or top.
NOTE: This slide needs to be duplicated in order to retain the graphic elements Select the slide > right click > Duplicate
35 Our strategy 46 Tenants
36 Direct portfolio 47 Non-comparable centres for sales
38 Assets under management 48 Asset summaries
39 Financial results 56 Organisational chart
44 Capital transactions 57 Key dates
45 Development pipeline 58 Contact details
Appendices
Chadstone, VIC
For
per
sona
l use
onl
y

Vicinity Centres | FY17 interim results | 15 February 2017
Tip (Header)
The header has been set up to give you the ability to change the colour and keep it consistent.
Click the Increase/Decrease List level button to change between the different available heading colours. Invest in quality Australian assets across the retail spectrum
Focus on long-term value creation and sustainable earnings growth
Maintain strong balance sheet with access to diverse capital sources
Efficient cost structure and low management expense ratio
Clear financial objectives set at the corporate and asset level
35
Our Strategy: simple and transparent business model, with a single sector focus Creating value and sustainable growth by owning, managing and developing quality Australian retail assets
85 centres under management
$24.5b assets under management
~8,700 tenants
~3,200 retailer relationships
$17.8b moving annual turnover
2.8m sqm gross lettable area
Group level Target1
Total return >9.0% p.a.
Underlying EPS growth >3.0% p.a.
Portfolio level Target1
Property level returns >8.5% p.a.
Development returns Initial yield 6% to 8+% Incremental IRR 10% to 15+%
1. On a ‘through cycle’ basis.
For
per
sona
l use
onl
y

Vicinity Centres | FY17 interim results | 15 February 2017
Tip (Header)
The header has been set up to give you the ability to change the colour and keep it consistent.
Click the Increase/Decrease List level button to change between the different available heading colours.
City Centre 11% Regional 15%
Sub Regional 23%
Neighbourhood 5%
Outlet Centre 8%
36
Direct portfolio Well diversified by geographic and retail sub-sector exposure
Centre type composition
Super Regional 18%
Major Regional 21%
SA 5%
VIC and TAS 48%
17
27
Geographic exposure
4
$14.9b1
WA 14%
QLD 13%
14
NSW 20%
14
16
Super Regional 1 Sub Regional 12 Major Regional 3
Neighbourhood 3 City Centre 2 Outlet Centre 3 Regional 3
3 Major Regional 8 Sub Regional 2 Neighbourhood 1 Outlet Centre
2 City Centre 3 Regional 4 Sub Regional 4 Neighbourhood 1 Outlet Centre
Major Regional 1 Regional 2
Sub Regional 7 Neighbourhood 6
Regional 2 Sub Regional 2
Note: Totals may not sum due to rounding. 1. Includes equity accounted investments and excludes finance lease assets and planning and holding costs.
For
per
sona
l use
onl
y

Vicinity Centres | FY17 interim results | 15 February 2017
Tip (Header)
The header has been set up to give you the ability to change the colour and keep it consistent.
Click the Increase/Decrease List level button to change between the different available heading colours.
37
Direct portfolio Key statistics by centre type
Note: Totals may not sum due to rounding. 1. Includes Super Regional, Major Regional, City Centre and Regional centres. 2. Includes equity accounted investments and excludes finance lease assets and planning and holding costs.
As at 31 December 2016 Total portfolio Regional1 Sub Regional Neighbourhood Outlet Centre
Number of retail assets 75 22 33 15 5
Gross lettable area (000’s)(sqm) 2,572 1,490 758 134 189
Total value2 ($b) 14,922 9,674 3,383 705 1,160
Portfolio weighting by value (%) 100 65 23 5 8
Capitalisation rate (weighted average)(%) 5.75 5.34 6.52 6.60 6.35
Comparable NPI growth3 (%) 3.0 1.7 2.5 7.1 8.5
Occupancy rate (%) 99.4 99.4 99.3 98.9 100.0
Total MAT growth4 (%) 1.3 0.2 0.9 0.4 10.5
Specialty MAT growth4 (%) 2.2 0.3 1.0 1.2 9.5
Specialty sales productivity4 ($/sqm) 9,200 9,893 8,134 7,462 9,428
Specialty occupancy cost4 (%) 14.6 17.0 13.2 12.3 10.4
3. Excludes acquisitions, divestments and development-impacted centres and is calculated on a like-for-like basis versus the prior
corresponding period. 4. Excludes divestments and development-impacted centres in line with SCCA guidelines. Refer to slide 47 for details.
For
per
sona
l use
onl
y

Vicinity Centres | FY17 interim results | 15 February 2017
Tip (Header)
The header has been set up to give you the ability to change the colour and keep it consistent.
Click the Increase/Decrease List level button to change between the different available heading colours.
Tip (Header)
The header has been set up to give you the ability to change the colour and keep it consistent.
Click the Increase/Decrease List level button to change between the different available heading colours.
Tip (Header)
The header has been set up to give you the ability to change the colour and keep it consistent.
Click the Increase/Decrease List level button to change between the different available heading colours.
Tip (Header)
The header has been set up to give you the ability to change the colour and keep it consistent.
Click the Increase/Decrease List level button to change between the different available heading colours.
38
Assets under management ~8,700 tenants across 85 assets under management1
Direct portfolio Managed
Total AUM Wholly-owned1 Co-owned Total
Third party/ co-owned
Number of retail assets 48 27 75 10/27 85
Gross lettable area (000’s)(sqm) 1,149 1,423 2,572 250 2,821
Number of tenants 3,780 4,132 7,912 770 8,682
Annual retail sales ($m) 7,597 8,543 16,140 1,615 17,755
Total value ($m) 7,354 7,568 14,9222 1,562/8,042 24,526
Note: Totals may not sum due to rounding. 1. Includes DFO Brisbane. 2. Reflects ownership share in investment properties and equity-accounted investments.
For
per
sona
l use
onl
y

Vicinity Centres | FY17 interim results | 15 February 2017
Tip (Header)
The header has been set up to give you the ability to change the colour and keep it consistent.
Click the Increase/Decrease List level button to change between the different available heading colours.
39
Financial results Underlying earnings reconciliation to net profit after tax
For the six months to 31-Dec-16
($m) 31-Dec-15
($m)
Underlying earnings 376.0 377.6
Property revaluation increments for directly owned properties 546.8 428.3
Non-distributable gain relating to equity accounted investments 1.5 2.6
Amortisation of static lease incentives (5.2) (4.5)
Amortisation of other project items (7.8) (11.3)
Straight-lining of rent adjustment 1.6 4.6
Rent lost from undertaking developments (15.3) (9.1)
Stamp duty and other costs written off on acquisition of investment properties (2.1) (17.0)
Net gain/(loss) on mark-to-market of derivatives 34.1 (19.6)
Net unrealised foreign exchange gain 3.1 -
Integration costs (20.5) (26.9)
Impairment and amortisation of intangible assets (1.6) (296.6)
Other non-distributable items (1.8) (3.5)
Net profit after tax 908.8 424.6 For
per
sona
l use
onl
y

Vicinity Centres | FY17 interim results | 15 February 2017
Tip (Header)
The header has been set up to give you the ability to change the colour and keep it consistent.
Click the Increase/Decrease List level button to change between the different available heading colours.
Tip (Header)
The header has been set up to give you the ability to change the colour and keep it consistent.
Click the Increase/Decrease List level button to change between the different available heading colours.
Tip (Header)
The header has been set up to give you the ability to change the colour and keep it consistent.
Click the Increase/Decrease List level button to change between the different available heading colours.
Tip (Header)
The header has been set up to give you the ability to change the colour and keep it consistent.
Click the Increase/Decrease List level button to change between the different available heading colours.
Represents earnings from eighteen retail assets disposed since Jul-15 and two acquisitions made in 1H FY16.
Driven by 3.0% comparable NPI growth, incremental NPI from developments and continued cost savings.
Represents earnings from eight retail assets disposed in the six months to Dec-16 and four acquisitions made since Jul-15.
Financial results Reconciliation of actual and comparable underlying earnings growth
$m
40
1. Calculated as: Stable business and development growth ($16.5m)/Comparable 1H FY16 underlying earnings ($342.3m).
377.6
342.3
376.0
(31.2)
16.5
17.2
1H FY16underlying earnings
Impact ofportfolio changes
Comparable 1H FY16underlying earnings
Comparable underlyingearnings growth
Impact ofportfolio changes
1H FY17underlying earnings
Comparable growth1
+4.8%
For
per
sona
l use
onl
y

Vicinity Centres | FY17 interim results | 15 February 2017
Tip (Header)
The header has been set up to give you the ability to change the colour and keep it consistent.
Click the Increase/Decrease List level button to change between the different available heading colours.
41
Financial results Distribution reconciliation to earnings measures
For the six months to 31-Dec-16
($m) 31-Dec-15
($m)
Underlying earnings 376.0 377.6
Less: Rent lost from undertaking developments (15.3) (9.1)
Funds From Operations (FFO) 360.7 368.5
Less: Maintenance capex and tenant incentives paid (21.0) (27.0)
Adjusted FFO (AFFO) 339.7 341.5
Distribution declared 344.4 348.4
Underlying earnings payout ratio1 (%) 91.6 92.3
FFO payout ratio1 (%) 95.5 94.5
AFFO payout ratio1 (%) 101.4 102.0
1. Calculated as: Distribution as a percentage of the applicable earnings measure.
For
per
sona
l use
onl
y

Vicinity Centres | FY17 interim results | 15 February 2017
Tip (Header)
The header has been set up to give you the ability to change the colour and keep it consistent.
Click the Increase/Decrease List level button to change between the different available heading colours.
Tip (Header)
The header has been set up to give you the ability to change the colour and keep it consistent.
Click the Increase/Decrease List level button to change between the different available heading colours.
Tip (Header)
The header has been set up to give you the ability to change the colour and keep it consistent.
Click the Increase/Decrease List level button to change between the different available heading colours.
Tip (Header)
The header has been set up to give you the ability to change the colour and keep it consistent.
Click the Increase/Decrease List level button to change between the different available heading colours.
42
Financial results Interest rate hedging profile
As at period end 31-Dec-16 30-Jun-16
Weighted average hedge rate (%)1 4.3 4.23
Proportion of debt hedged (%) 92 91
Hedging profile1,2 Key hedging statistics
1. The calculation for weighted average hedge rate was revised during the period. From the December 2016 reporting period, it includes margin and establishment fees on fixed rate debt and margin, line and establishment fees on floating debt that has been hedged with interest rate swaps.
2. Hedge rate is the average for the financial years. 3. The calculation of hedged rate was revised during the period. Accordingly the 30 June 2016 figure has been restated.
Previously this figure was reported as 3.0% which included margin on fixed rate debt only.
1.5
2.0
2.5
3.0
3.5
4.0
4.5
5.0
5.5
0
500
1,000
1,500
2,000
2,500
3,000
3,500
4,000
FY17 FY18 FY19 FY20 FY21 FY22 FY23 FY24 FY25
Hed
ge r
ate
(%)
No
tio
nal
A$
m
Fixed rate debt (lhs) Interest rate swaps (lhs) Weighted average fixed rate (rhs)
For
per
sona
l use
onl
y

Vicinity Centres | FY17 interim results | 15 February 2017
Tip (Header)
The header has been set up to give you the ability to change the colour and keep it consistent.
Click the Increase/Decrease List level button to change between the different available heading colours.
Tip (Header)
The header has been set up to give you the ability to change the colour and keep it consistent.
Click the Increase/Decrease List level button to change between the different available heading colours.
Tip (Header)
The header has been set up to give you the ability to change the colour and keep it consistent.
Click the Increase/Decrease List level button to change between the different available heading colours.
Tip (Header)
The header has been set up to give you the ability to change the colour and keep it consistent.
Click the Increase/Decrease List level button to change between the different available heading colours.
43
Financial results Drawn debt by instrument
Instrument Maturity Limit ($m)
Drawn ($m)
Undrawn ($m)
US private placement (USPP) 1 Feb-17 177.6 177.6 -
Bank debt facilities Jun-18 260.0 260.0 -
Bank debt facilities Dec-18 450.0 450.0 -
USPP 1 Feb-19 38.0 38.0 -
Bank debt facilities Feb-19 100.0 50.0 50.0
Bank debt facilities Jun-19 782.3 704.3 78.0
Australian medium term notes (AMTN) Dec-19 400.0 400.0 -
Bank debt facilities Jun-20 700.0 - 700.0
Bank debt facilities Dec-20 500.0 43.0 457.0
AMTN May-21 150.0 150.0 -
Bank debt facilities Feb-21 100.0 - 100.0
USPP 2 Jul-22 40.0 40.0 -
USPP 3 Jul-24 58.9 58.9 -
USPP 4 Dec-25 309.0 309.0 -
European medium term notes (EMTN) 5 Apr-26 655.2 655.2 -
USPP 3 Jul-27 15.2 15.2 -
USPP 6 Dec-27 68.5 68.5 -
USPP 7 Dec-29 114.2 114.2 -
USPP 8 Dec-30 169.5 169.5 -
Total 5,088.4 3,703.4 1,385.0
1. USD value converted to AUD at AUD/USD 0.7885. 2. This USPP tranche is denominated in AUD. 3. USD value converted to AUD at AUD/USD 0.9855. 4. USD value converted to AUD as follows: AUD45.7m at AUD/USD 0.8756; and AUD263.3m at AUD/USD 0.6988. 5. GBP value converted to AUD at AUD/GBP 0.5342 6. USD value converted to AUD at AUD/USD 0.8755. 7. USD value converted to AUD at AUD/USD 0.8754. 8. Consists of two tranches denominated in AUD and USD, including: AUD75.0m USPP tranche denominated in AUD,
and AUD94.4m USD value converted to AUD at AUD/USD 0.6988.
For
per
sona
l use
onl
y

Vicinity Centres | FY17 interim results | 15 February 2017
Tip (Header)
The header has been set up to give you the ability to change the colour and keep it consistent.
Click the Increase/Decrease List level button to change between the different available heading colours.
44
Capital transactions Active portfolio enhancement
Divestment program
Settlement date
Sale price ($m)
Passing yield
(%) Toombul Jun-16 228.1
7.3 Clifford Gardens Jun-16
613.3 Forest Hill Chase Jun-16 Brimbank Central Jun-16 Indooroopilly Central Jun-16 85.0 5.9 Settled in FY16 926.4 Hilton Plaza Aug-16
65.4 6.1 Maitland Hunter Mall Sep-16 Monier Village Sep-16 The Myer Centre Brisbane (25%) Oct-16 192.1 6.2 Tweed Mall Nov-16 81.31 8.5 Mornington Central (50%) Nov-16 32.5 7.0 Tuggeranong Hyperdome (50%) Nov-16 120.0 9.8 Albany Brooks Garden2 Dec-16 20.0 7.3 Settled in 1H FY17 511.2 Total divestment program sold to date 1,437.7 Total divestment program ~1,500.0
Acquisitions
Settlement date
Purchase price3 ($m)
Passing yield
(%)
Bentons Square (50%) Aug-16 38.3 6.5
DFO South Wharf (25%)4 Apr-17 141.3 7.0
Total acquisitions 179.5 6.9
1. Includes a two-year rental guarantee of up to approximately $2.35m. 2. Acquired by M Group. 3. Excluding transaction costs and other costs associated with the acquisitions. 4. Contracts exchanged in February 2017 and expected to settle in April 2017.
Divestments Acquisitions
Note: Totals may not sum due to rounding.
For
per
sona
l use
onl
y

Vicinity Centres | FY17 interim results | 15 February 2017
Tip (Header)
The header has been set up to give you the ability to change the colour and keep it consistent.
Click the Increase/Decrease List level button to change between the different available heading colours.
Tip (Header)
The header has been set up to give you the ability to change the colour and keep it consistent.
Click the Increase/Decrease List level button to change between the different available heading colours.
Tip (Header)
The header has been set up to give you the ability to change the colour and keep it consistent.
Click the Increase/Decrease List level button to change between the different available heading colours.
Tip (Header)
The header has been set up to give you the ability to change the colour and keep it consistent.
Click the Increase/Decrease List level button to change between the different available heading colours.
45
Development pipeline Vicinity’s share of costs to complete projects under construction is $165m
Identified development pipeline ($m) Total project cost
Vicinity’s share
Project cost
Spent to 31-Dec-16
Cost to complete
Chadstone Retail and Office 666 333 303 30
Mandurah Forum 350 175 56 119
DFO South Wharf 61 46 30 16
Gateway Plaza 85 - - -
Total under construction 1,162 554 389 165
The Glen 490 245
DFO Perth Airport 150 75
Total FY17 commencements 640 320
Galleria 700 350
Chadstone Hotel 120 60
Midland Gate 100 -
Total FY18 commencements 920 410
The Myer Centre Brisbane 300 75
Total FY19 commencements 300 75
Total development pipeline 3,022 1,359
For
per
sona
l use
onl
y

Vicinity Centres | FY17 interim results | 15 February 2017
Tip (Header)
The header has been set up to give you the ability to change the colour and keep it consistent.
Click the Increase/Decrease List level button to change between the different available heading colours.
Tip (Header)
The header has been set up to give you the ability to change the colour and keep it consistent.
Click the Increase/Decrease List level button to change between the different available heading colours.
Tip (Header)
The header has been set up to give you the ability to change the colour and keep it consistent.
Click the Increase/Decrease List level button to change between the different available heading colours.
Tip (Header)
The header has been set up to give you the ability to change the colour and keep it consistent.
Click the Increase/Decrease List level button to change between the different available heading colours. Top 10 tenants
Rank Retailer Retailer type Number of stores
% of income
1 Supermarket 50 4.2
2 Supermarket 46 4.0
3 Discount department store 29 3.0
4 Department store 4 2.3
5 Department store 10 2.1
6 Discount department store 20 1.7
7 Discount department store 19 1.7
8 Specialty/Mini major 36 0.9
9 Specialty/ATM 33 0.7
10 Entertainment 5 0.7
Top 10 Total 252 21.3
Tenants Key portfolio tenants
46
Top 10 tenant groups
Rank Retailer Number of leases
% of income Brands
1 126 9.4 Coles, Kmart, Liquorland, Target
2 97 6.0 Big W, BWS, Dan Murphy’s, Food For Less, Thomas Dux, Woolworths
3 32 3.1 Country Road, David Jones, Mimco, Trenery, Witchery
4 16 2.2 Myer, sass & bide
5 123 1.5 Dotti, Jacqui E, Jay Jays, Just Jeans, Peter Alexander, Portmans, Smiggle
6 124 1.1 Autograph, City Chic, Crossroads, Katies, Millers Fashion Club, Rivers
7 92 1.0 Cotton On, Cotton On Body, Cotton On Kids, Cotton On Mega, Factorie, Rubi Shoes, Supre, Typo
8 173 1.0 Commonwealth Bank, BankWest
9 36 0.9 Priceline and Priceline Pharmacy
10
145 0.9 Westpac, Bank of Melbourne, St George
Top 10 Total 964 27.1
For
per
sona
l use
onl
y

Vicinity Centres | FY17 interim results | 15 February 2017
Tip (Header)
The header has been set up to give you the ability to change the colour and keep it consistent.
Click the Increase/Decrease List level button to change between the different available heading colours.
47
Non-comparable centres for sales Centres excluded from comparable portfolio for sales reporting
Centre1 Reason Broadmeadows Major tenant changeover
Chadstone Development
Cranbourne Park Development
Currambine Central Development
Dianella Plaza Major tenant changeover
Elizabeth City Centre Major tenant changeover
Halls Head Central Development
Lake Haven Centre Major tenant addition
Lavington Square Major tenant changeover
Mandurah Forum Development
The Glen Pre-development
Warriewood Square Development
1. For sales reporting, non-comparable centres include divestments and development-impacted centres and is prepared in accordance with SCCA guidelines.
For
per
sona
l use
onl
y
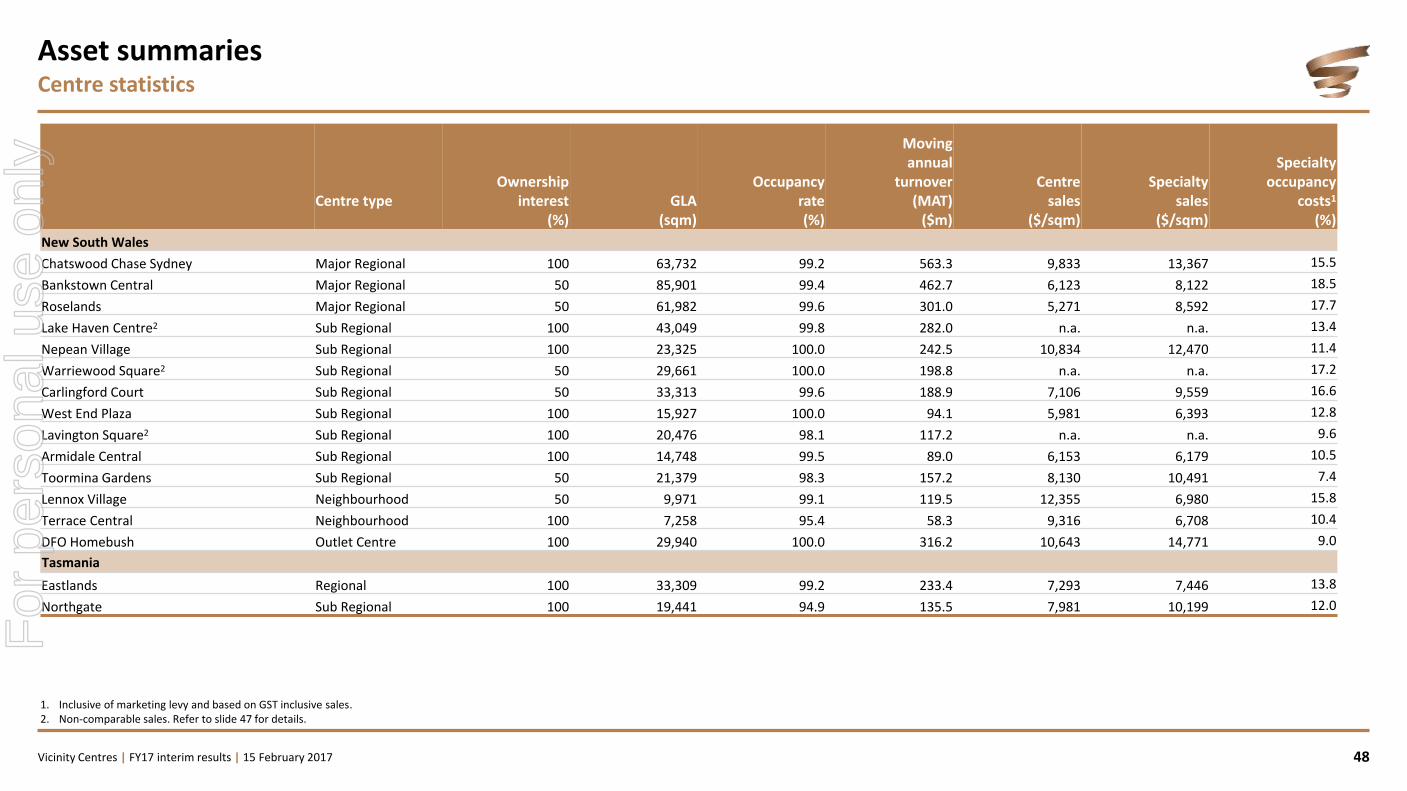
Vicinity Centres | FY17 interim results | 15 February 2017
Tip (Header)
The header has been set up to give you the ability to change the colour and keep it consistent.
Click the Increase/Decrease List level button to change between the different available heading colours.
48
Asset summaries Centre statistics
1. Inclusive of marketing levy and based on GST inclusive sales. 2. Non-comparable sales. Refer to slide 47 for details.
Centre type
Ownership interest
(%)
GLA
(sqm)
Occupancy rate (%)
Moving annual
turnover (MAT)
($m)
Centre sales
($/sqm)
Specialty sales
($/sqm)
Specialty occupancy
costs1 (%)
New South Wales
Chatswood Chase Sydney Major Regional 100 63,732 99.2 563.3 9,833 13,367 15.5
Bankstown Central Major Regional 50 85,901 99.4 462.7 6,123 8,122 18.5
Roselands Major Regional 50 61,982 99.6 301.0 5,271 8,592 17.7
Lake Haven Centre2 Sub Regional 100 43,049 99.8 282.0 n.a. n.a. 13.4
Nepean Village Sub Regional 100 23,325 100.0 242.5 10,834 12,470 11.4
Warriewood Square2 Sub Regional 50 29,661 100.0 198.8 n.a. n.a. 17.2
Carlingford Court Sub Regional 50 33,313 99.6 188.9 7,106 9,559 16.6
West End Plaza Sub Regional 100 15,927 100.0 94.1 5,981 6,393 12.8
Lavington Square2 Sub Regional 100 20,476 98.1 117.2 n.a. n.a. 9.6
Armidale Central Sub Regional 100 14,748 99.5 89.0 6,153 6,179 10.5
Toormina Gardens Sub Regional 50 21,379 98.3 157.2 8,130 10,491 7.4
Lennox Village Neighbourhood 50 9,971 99.1 119.5 12,355 6,980 15.8
Terrace Central Neighbourhood 100 7,258 95.4 58.3 9,316 6,708 10.4
DFO Homebush Outlet Centre 100 29,940 100.0 316.2 10,643 14,771 9.0
Tasmania
Eastlands Regional 100 33,309 99.2 233.4 7,293 7,446 13.8
Northgate Sub Regional 100 19,441 94.9 135.5 7,981 10,199 12.0
For
per
sona
l use
onl
y

Vicinity Centres | FY17 interim results | 15 February 2017
Tip (Header)
The header has been set up to give you the ability to change the colour and keep it consistent.
Click the Increase/Decrease List level button to change between the different available heading colours.
49
Asset summaries Centre statistics (continued)
Centre type
Ownership interest
(%)
GLA
(sqm)
Occupancy rate (%)
Moving annual
turnover (MAT)
($m)
Centre sales
($/sqm)
Specialty sales
($/sqm)
Specialty occupancy
costs1 (%)
Queensland
QueensPlaza City Centre 100 39,066 99.0 302.1 8,520 20,831 14.6
The Myer Centre Brisbane City Centre 25 63,718 99.3 331.3 5,400 10,641 21.0
Grand Plaza Regional 50 53,421 99.8 353.5 7,039 9,785 15.9
Runaway Bay Centre Regional 50 43,002 99.6 293.5 8,275 9,711 12.4
Mt Ommaney Centre Regional 25 56,610 98.8 315.6 6,653 8,064 15.4
Taigum Square Sub Regional 100 23,151 99.7 105.3 5,982 6,114 12.8
Gympie Central Sub Regional 100 14,119 98.9 121.2 9,105 11,065 9.8
Whitsunday Plaza Sub Regional 100 22,247 100.0 113.0 6,191 12,478 6.3
Buranda Village Sub Regional 100 11,642 100.0 62.2 6,196 8,006 12.8
Oxenford Village Neighbourhood 100 5,808 100.0 76.9 17,928 13,430 9.1
Goldfields Plaza Neighbourhood 100 7,670 96.3 62.7 9,277 9,553 8.3
Milton Village Neighbourhood 100 2,827 100.0 24.9 17,575 13,895 10.7
North Shore Village Neighbourhood 100 4,083 100.0 48.1 15,051 4,957 17.7
DFO Brisbane Outlet Centre 100 26,095 99.9 208.8 7,970 8,145 10.6
South Australia
Elizabeth City Centre2 Regional 100 80,365 98.6 345.3 n.a. n.a. 15.9
Colonnades Regional 50 83,523 98.3 298.5 5,178 6,060 16.4
Castle Plaza Sub Regional 100 22,839 98.8 148.5 7,151 8,598 14.3
Kurralta Central Sub Regional 100 10,678 100.0 79.7 7,733 9,578 11.4
1. Inclusive of marketing levy and based on GST inclusive sales. 2. Non-comparable sales. Refer to slide 47 for details.
For
per
sona
l use
onl
y

Vicinity Centres | FY17 interim results | 15 February 2017
Tip (Header)
The header has been set up to give you the ability to change the colour and keep it consistent.
Click the Increase/Decrease List level button to change between the different available heading colours.
50
Asset summaries Centre statistics (continued)
1. Inclusive of marketing levy and based on GST inclusive sales. 2. Non-comparable sales. Refer to slide 47 for details.
Centre type
Ownership interest
(%)
GLA
(sqm)
Occupancy rate (%)
Moving annual
turnover (MAT)
($m)
Centre sales
($/sqm)
Specialty sales
($/sqm)
Specialty occupancy
costs1 (%)
Victoria
Chadstone Shopping Centre2 Super Regional 50 209,116 99.8 1,524.4 n.a. n.a. 14.8
Bayside Major Regional 100 88,905 99.2 419.1 5,077 7,810 16.5
Northland Major Regional 50 97,412 99.9 538.7 5,991 8,731 19.2
The Glen2 Major Regional 50 59,350 98.3 328.2 n.a. n.a. 17.5
Emporium Melbourne City Centre 50 45,241 99.4 458.6 10,449 13,418 17.0
Myer Bourke Street City Centre 33 39,924 100.0 n.a. n.a. n.a. n.a.
Broadmeadows Shopping Centre2 Regional 100 61,335 99.9 262.9 n.a. n.a. 19.0
Cranbourne Park2 Regional 50 47,058 99.8 236.4 n.a. n.a. 16.5
Box Hill Central (South Precinct) Sub Regional 100 23,644 100.0 174.6 8,279 9,518 14.6
Corio Central Sub Regional 100 31,325 98.6 159.6 6,553 6,043 14.7
Victoria Gardens Shopping Centre Sub Regional 50 34,744 99.7 189.7 6,592 10,294 13.1
Roxburgh Village Sub Regional 100 24,743 100.0 145.7 6,568 5,794 14.4
Altona Gate Shopping Centre Sub Regional 100 26,262 98.0 143.4 6,184 6,787 15.6
Box Hill Central (North Precinct) Sub Regional 100 14,584 100.0 79.2 6,610 5,846 18.1
Brandon Park Sub Regional 50 23,062 98.4 133.1 6,929 5,339 18.0
Sunshine Marketplace Sub Regional 50 34,062 99.8 133.1 4,537 6,658 14.4
Belmont Village Sub Regional 100 14,032 100.0 99.3 7,250 9,693 11.4
Wodonga Plaza Sub Regional 100 17,565 98.0 89.9 5,334 6,120 13.6
Mornington Central Sub Regional 50 11,763 100.0 100.3 8,587 9,042 16.4
Bentons Square Neighbourhood 100 10,085 99.2 138.5 15,289 7,547 13.7
Oakleigh Central Neighbourhood 100 13,953 99.6 121.7 9,145 5,548 13.1 For
per
sona
l use
onl
y

Vicinity Centres | FY17 interim results | 15 February 2017
Tip (Header)
The header has been set up to give you the ability to change the colour and keep it consistent.
Click the Increase/Decrease List level button to change between the different available heading colours.
51
Asset summaries Centre statistics (continued)
1. Excludes DFO South Wharf and DFO Essendon Homemaker retailers. 2. Inclusive of marketing levy and based on GST inclusive sales.
Centre type
Ownership interest
(%)
GLA
(sqm)
Occupancy rate1
(%)
Moving annual
turnover (MAT)
($m)
Centre sales1
($/sqm)
Specialty sales1
($/sqm)
Specialty occupancy
costs1,2 (%)
Victoria (continued)
The Gateway Neighbourhood 100 10,871 98.0 85.1 9,641 8,322 8.4
DFO South Wharf Outlet Centre 75 56,450 100.0 387.6 9,321 9,154 10.2
DFO Essendon Outlet Centre 100 52,325 100.0 235.9 9,165 8,996 11.6
DFO Moorabbin Outlet Centre 100 24,298 100.0 146.4 6,371 6,945 11.5
Western Australia
Galleria Major Regional 50 80,793 99.9 496.4 6,980 10,996 18.5
Rockingham Centre Regional 50 62,331 99.3 434.3 7,612 8,590 16.9
Mandurah Forum3 Regional 50 34,190 100.0 220.5 n.a. n.a. 19.7
Ellenbrook Central Sub Regional 100 34,845 99.5 246.2 8,660 8,929 9.5
Warwick Grove Sub Regional 100 31,973 99.9 208.7 8,230 7,690 15.1
Warnbro Centre Sub Regional 100 21,419 99.3 161.3 8,070 7,100 17.1
Maddington Central Sub Regional 100 27,669 98.6 180.4 7,118 7,150 14.8
Livingston Marketplace Sub Regional 100 15,556 100.0 127.6 9,046 9,654 10.6
Karratha City Sub Regional 50 23,931 98.9 211.2 9,249 9,033 11.3
Halls Head Central3 Sub Regional 50 21,000 100.0 130.3 n.a. n.a. 9.2
Currambine Central3 Neighbourhood 100 16,352 100.0 158.9 n.a. n.a. 14.6
Dianella Plaza3 Neighbourhood 100 16,870 99.0 99.3 n.a. n.a. 13.3
Stirlings Central Neighbourhood 100 8,532 98.4 92.9 11,623 10,332 11.8
Kalamunda Central Neighbourhood 100 8,368 99.6 77.5 9,778 5,534 13.0
Flinders Square Neighbourhood 100 5,992 99.1 64.1 12,098 7,528 11.5
Victoria Park Central Neighbourhood 100 5,475 100.0 48.2 9,109 5,143 16.5
3. Non-comparable sales. Refer to slide 47 for details.
For
per
sona
l use
onl
y

Vicinity Centres | FY17 interim results | 15 February 2017
Tip (Header)
The header has been set up to give you the ability to change the colour and keep it consistent.
Click the Increase/Decrease List level button to change between the different available heading colours.
52
Asset summaries Valuations
1. Based on ownership interest. 2. Net revaluation movement excludes non-cash adjustments for the amortisation of lease incentives and straight lining of rent.
Centre type
Ownership interest
(%)
Net revaluation
movement1,2 ($m)
Value As at
31-Dec-161 ($m)
Capitalisation rate Discount rate As at
31-Dec-16 (%)
As at 31-Dec-16
(%)
As at 30-Jun-16
(%) Movement
New South Wales
Chatswood Chase Sydney Major Regional 100 12.9 1,026.2 5.25 5.25 - 7.75
Bankstown Central Major Regional 50 2.8 347.5 6.25 6.25 - 8.00
Roselands Major Regional 50 (9.1) 185.0 6.50 6.50 - 8.00
Lake Haven Centre Sub Regional 100 10.4 284.2 6.75 7.00 (0.25) 8.00
Nepean Village Sub Regional 100 9.6 176.5 5.75 6.25 (0.50) 7.75
Warriewood Square Sub Regional 50 4.1 137.5 6.00 6.00 - 8.00
Carlingford Court Sub Regional 50 0.3 109.5 6.25 6.25 - 8.00
West End Plaza Sub Regional 100 1.6 67.0 7.00 7.25 (0.25) 8.25
Lavington Square Sub Regional 100 2.3 61.0 7.50 7.75 (0.25) 7.50
Armidale Central Sub Regional 100 0.4 46.0 7.00 7.00 - 8.25
Toormina Gardens Sub Regional 50 0.5 40.5 6.75 7.00 (0.25) 8.00
Lennox Village Neighbourhood 50 2.0 35.0 6.25 6.50 (0.25) 7.75
Terrace Central Neighbourhood 100 (2.5) 30.0 7.25 7.25 - 8.50
DFO Homebush Outlet Centre 100 17.9 408.8 6.00 6.00 - 8.00
Tasmania
Eastlands Regional 100 4.2 168.0 6.50 6.75 (0.25) 7.25
Northgate Sub Regional 100 5.9 110.0 7.00 7.25 (0.25) 8.25
For
per
sona
l use
onl
y

Vicinity Centres | FY17 interim results | 15 February 2017
Tip (Header)
The header has been set up to give you the ability to change the colour and keep it consistent.
Click the Increase/Decrease List level button to change between the different available heading colours.
53
Asset summaries Valuations (continued)
1. Based on ownership interest. 2. Net revaluation movement excludes non-cash adjustments for the amortisation of lease incentives and straight lining of rent.
Centre type
Ownership interest
(%)
Net revaluation
movement1,2 ($m)
Value As at
31-Dec-161 ($m)
Capitalisation rate Discount rate As at
31-Dec-16 (%)
As at 31-Dec-16
(%)
As at 30-Jun-16
(%) Movement
Queensland
QueensPlaza City Centre 100 15.4 760.0 5.00 5.00 - 7.25
The Myer Centre Brisbane City Centre 25 2.0 193.8 5.75 5.75 - 7.75
Grand Plaza Regional 50 2.8 208.5 5.75 5.75 - 7.75
Runaway Bay Centre Regional 50 (0.7) 160.0 5.75 5.75 - 7.75
Mt Ommaney Centre Regional 25 (0.3) 105.2 6.00 6.00 - 7.75
Taigum Square Sub Regional 100 1.6 93.0 6.50 6.50 - 8.00
Gympie Central Sub Regional 100 (0.3) 78.0 6.50 6.50 - 7.75
Whitsunday Plaza Sub Regional 100 1.5 65.0 6.75 7.00 (0.25) 8.00
Buranda Village Sub Regional 100 (0.2) 41.8 6.50 6.75 (0.25) 7.50
Oxenford Village Neighbourhood 100 2.4 30.8 6.25 6.75 (0.50) 7.75
Goldfields Plaza Neighbourhood 100 (0.1) 27.0 7.50 7.50 - 8.25
Milton Village Neighbourhood 100 0.9 26.5 6.75 6.75 - 8.25
North Shore Village Neighbourhood 100 1.4 25.0 6.25 6.50 (0.25) 8.00
DFO Brisbane Outlet Centre 100 (0.8) 55.0 7.50 7.50 - 8.50
South Australia
Elizabeth City Centre Regional 100 5.9 382.1 7.00 7.00 - 8.50
Colonnades Regional 50 0.0 155.6 7.00 7.00 - 8.25
Castle Plaza Sub Regional 100 2.5 172.9 6.75 7.00 (0.25) 8.50
Kurralta Central Sub Regional 100 2.9 40.1 6.25 6.75 (0.50) 7.00
For
per
sona
l use
onl
y

Vicinity Centres | FY17 interim results | 15 February 2017
Tip (Header)
The header has been set up to give you the ability to change the colour and keep it consistent.
Click the Increase/Decrease List level button to change between the different available heading colours.
54
Asset summaries Valuations (continued)
1. Based on ownership interest. 2. Net revaluation movement excludes non-cash adjustments for the amortisation of lease incentives and straight lining of rent.
Centre type
Ownership interest
(%)
Net revaluation
movement1,2 ($m)
Value As at
31-Dec-161 ($m)
Capitalisation rate Discount rate As at
31-Dec-16 (%)
As at 31-Dec-16
(%)
As at 30-Jun-16
(%) Movement
Victoria
Chadstone Shopping Centre Super Regional 50 286.3 2,625.0 4.25 4.75 (0.50) 7.00
Bayside Major Regional 100 3.5 575.0 6.25 6.25 - 8.00
Northland Major Regional 50 (2.5) 482.5 5.75 5.75 - 7.75
The Glen Major Regional 50 (0.2) 170.0 6.50 6.50 - 8.00
Emporium Melbourne City Centre 50 12.0 582.5 4.75 4.75 - 7.50
Myer Bourke Street City Centre 33 4.9 156.2 4.75 4.75 - 6.75
Broadmeadows Shopping Centre Regional 100 1.1 325.0 6.75 6.75 - 8.00
Cranbourne Park Regional 50 2.3 151.3 6.00 6.00 - 7.75
Box Hill Central (South Precinct) Sub Regional 100 14.9 177.0 6.50 6.75 (0.25) 7.75
Corio Central Sub Regional 100 4.4 131.0 7.25 7.50 (0.25) 8.00
Victoria Gardens Shopping Centre Sub Regional 50 1.7 129.0 6.00 6.00 - 7.75
Roxburgh Village Sub Regional 100 1.3 113.1 6.75 6.75 - 7.75
Altona Gate Shopping Centre Sub Regional 100 5.1 100.0 6.50 7.25 (0.75) 7.75
Box Hill Central (North Precinct) Sub Regional 100 4.5 94.0 6.75 7.00 (0.25) 8.25
Brandon Park Sub Regional 50 2.3 62.5 7.00 7.25 (0.25) 8.00
Sunshine Marketplace Sub Regional 50 0.8 58.5 6.50 6.50 - 8.00
Belmont Village Sub Regional 100 2.1 48.5 6.25 6.75 (0.50) 7.50
Wodonga Plaza Sub Regional 100 (5.0) 41.5 8.50 8.25 0.25 8.75
Mornington Central Sub Regional 50 1.4 34.0 6.25 6.50 (0.25) 8.00
Bentons Square Neighbourhood 100 3.8 81.5 6.25 6.25 - 8.25
Oakleigh Central Neighbourhood 100 2.5 65.5 6.50 6.75 (0.25) 8.25 For
per
sona
l use
onl
y

Vicinity Centres | FY17 interim results | 15 February 2017
Tip (Header)
The header has been set up to give you the ability to change the colour and keep it consistent.
Click the Increase/Decrease List level button to change between the different available heading colours.
55
Asset summaries Valuations (continued)
1. Based on ownership interest. 2. Net revaluation movement excludes non-cash adjustments for the amortisation of lease incentives and straight lining of rent.
Centre type
Ownership interest
(%)
Net revaluation
movement1,2 ($m)
Value As at
31-Dec-161 ($m)
Capitalisation rate Discount rate As at
31-Dec-16 (%)
As at 31-Dec-16
(%)
As at 30-Jun-16
(%) Movement
Victoria (continued)
The Gateway Neighbourhood 100 2.3 45.0 6.50 6.75 (0.25) 7.50
DFO South Wharf Outlet Centre 75 25.3 416.6 6.00 6.25 (0.25) 8.25
DFO Essendon Outlet Centre 100 3.5 167.5 6.75 7.00 (0.25) 8.25
DFO Moorabbin Outlet Centre 100 0.8 112.5 7.75 7.75 - 8.50
Western Australia
Galleria Major Regional 50 9.1 392.5 5.50 5.50 - 7.75
Rockingham Centre Regional 50 3.7 306.0 5.75 5.75 - 7.75
Mandurah Forum Regional 50 1.9 216.4 5.75 5.75 - 8.00
Ellenbrook Central Sub Regional 100 0.4 236.0 5.75 5.75 - 8.00
Warwick Grove Sub Regional 100 0.6 198.5 6.50 6.50 - 8.25
Warnbro Centre Sub Regional 100 1.2 125.0 6.25 6.25 - 8.25
Maddington Central Sub Regional 100 (0.6) 119.0 7.00 7.00 - 8.50
Livingston Marketplace Sub Regional 100 0.5 85.0 6.00 6.00 - 8.00
Karratha City Sub Regional 50 (1.1) 56.0 7.00 7.00 - 8.25
Halls Head Central Sub Regional 50 3.6 51.3 6.00 6.25 (0.25) 8.00
Currambine Central Neighbourhood 100 5.0 103.5 6.50 6.75 (0.25) 8.25
Dianella Plaza Neighbourhood 100 1.8 83.5 6.75 6.75 - 8.25
Stirlings Central Neighbourhood 100 (0.7) 50.0 7.00 7.00 - 8.00
Kalamunda Central Neighbourhood 100 0.9 38.5 6.75 7.00 (0.25) 8.00
Flinders Square Neighbourhood 100 0.7 31.8 6.50 7.00 (0.50) 8.25
Victoria Park Central Neighbourhood 100 1.6 31.3 6.50 6.75 (0.25) 7.75 For
per
sona
l use
onl
y
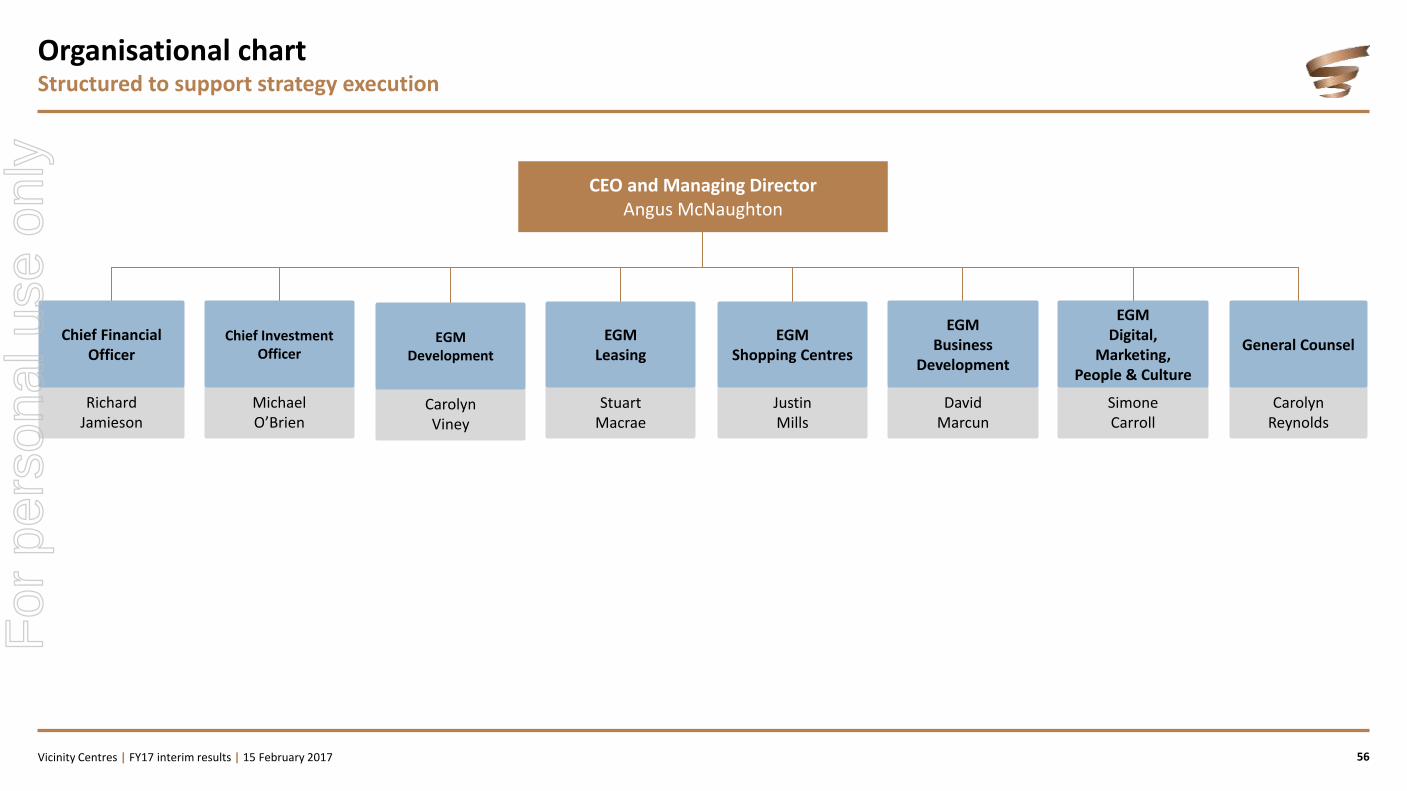
Vicinity Centres | FY17 interim results | 15 February 2017
Tip (Header)
The header has been set up to give you the ability to change the colour and keep it consistent.
Click the Increase/Decrease List level button to change between the different available heading colours.
56
Organisational chart Structured to support strategy execution
CEO and Managing Director Angus McNaughton
Stuart Macrae
Michael O’Brien
Richard Jamieson
David Marcun
Justin Mills
Carolyn Reynolds
Simone Carroll
Carolyn Viney
EGM Leasing
EGM Digital,
Marketing, People & Culture
Chief Investment Officer
Chief Financial Officer
EGM Business
Development
EGM Shopping Centres
General Counsel EGM Development
For
per
sona
l use
onl
y

Vicinity Centres | FY17 interim results | 15 February 2017
Tip (Header)
The header has been set up to give you the ability to change the colour and keep it consistent.
Click the Increase/Decrease List level button to change between the different available heading colours.
Tip (Header)
The header has been set up to give you the ability to change the colour and keep it consistent.
Click the Increase/Decrease List level button to change between the different available heading colours.
Tip (Header)
The header has been set up to give you the ability to change the colour and keep it consistent.
Click the Increase/Decrease List level button to change between the different available heading colours.
Tip (Header)
The header has been set up to give you the ability to change the colour and keep it consistent.
Click the Increase/Decrease List level button to change between the different available heading colours.
57
Key dates
Ex-distribution date for December 2016 distribution 29 December 2016
Record date for December 2016 distribution 30 December 2016
FY17 interim results 15 February 2017
December 2016 distribution payment 2 March 2017
Ex-distribution date for June 2017 distribution 29 June 2017
Record date for June 2017 distribution 30 June 2017
FY17 annual results 16 August 2017
June 2017 distribution payment 30 August 2017
2017 Annual General Meeting 16 November 2017
Note: These dates are indicative only and may be subject to change.
Key dates Investor calendar
For
per
sona
l use
onl
y

Vicinity Centres | FY17 interim results | 15 February 2017
Tip (Header)
The header has been set up to give you the ability to change the colour and keep it consistent.
Click the Increase/Decrease List level button to change between the different available heading colours.
Disclaimer
This document is a presentation of general background information about the activities of Vicinity Centres (ASX:VCX) current at the date of lodgement of the presentation (15 February 2017). It is information in a summary form and does not purport to be complete. It is to be read in conjunction with the Half year financial report lodged with the Australian Securities Exchange on 15 February 2017. It is not intended to be relied upon as advice to investors or potential investors and does not take into account the investment objectives, financial situation or needs of any particular investor. These should be considered, with or without professional advice, when deciding if an investment objective is appropriate. This presentation contains certain forecast financial information along with forward-looking statements in relation to the financial performance and strategy of Vicinity Centres. The words ‘anticipate’, ‘believe’, ‘expect’, ‘project’, ‘forecast’, ‘estimate’, ‘outlook’, ‘upside’, ‘likely’, ‘intend’, ‘should’, ‘could’, ‘may’, ‘target’, ‘plan’ and other similar expressions are intended to identify forward-looking statements. Indications of, and guidance on, future earnings, financial position, performance and distributions are also forward-looking statements. The forward-looking statements included in this presentation are based on information available to Vicinity Centres as at the date of this presentation. Such forward-looking statements are not representations, assurances, predictions or guarantees of future results, performance or achievements expressed or implied by the forward-looking statements and involve known and unknown risks, uncertainties, assumptions and other factors, many of which are beyond the control of Vicinity Centres. The actual results of Vicinity Centres may differ materially from the anticipated results, performance or achievements expressed, projected or implied by these forward-looking statements and you should not place undue reliance on such forward-looking statements. Except as required by law or regulation (including the ASX Listing Rules), Vicinity Centres disclaims any obligation to update these forward-looking statements.
For further information please contact: Penny Berger Head of Investor Relations T +61 2 8229 7760 E [email protected]
Troy Dahms Senior Investor Relations Manager T +61 2 8229 7763 E [email protected]
58
Contact details and disclaimer
For
per
sona
l use
onl
y