Embed Size (px)
Citation preview
Annual Report2008
Level 3 Hyatt Centre123 Adelaide TerraceEast Perth WA 6004
GPO Box 2606Perth WA 6001
Telephone: +61 8 9220 5700Facsimile: +61 8 9220 5757Email: [email protected]: www.metalsx.com.au
For
per
sona
l use
onl
y
1
Corporate Directory
DirectorsPeter J Newton (Chairman)Peter G Cook (Managing Director)Warren S HallamD Mark OkebyMichael L JefferiesWang WeiYimin Zhang (Alternate for Wang Wei)
Company SecretaryFiona Van Maanen
Key ManagementScott J Huffadine (Chief Operating Offi cer)Duncan J Coutts (Chief Development Offi cer)Paul M Cmrlec (GM – Central Musgrave Project)
Share RegistrySecurity Transfer Registrars Pty Ltd770 Canning HighwayAPPLECROSS WA 6153
Phone: 61-8-9315 2333Fax: 61-8-9315 2233E-mail: [email protected]
Registered Offi ceLevel 3, Hyatt Centre123 Adelaide TerraceEAST PERTH WA 6004
Phone: 61-8-9220 5700Fax: 61-8-9220 5757E-mail: [email protected]: www.metalsx.com.au
Postal AddressGPO Box 2606PERTH WA 6001
Securities ExchangeListed on the Australian Securities Exchange
Codes: MLX and MLXO
Domicile and Country of IncorporationAustralia
For
per
sona
l use
onl
y
2
Table of Contents
Corporate Directory 1
Chairman’s Letter 3
Managing Director’s Report 4
Director’s Report 17
Auditor’s Independence Declaration 38
Corporate Governance Statement 39
Income Statement for the year Ended 30 June 2008 49
Balance Sheet as at 30 June 2008 50
Cash Flow Statement for the Year Ended 30 June 2008 51
Statement of Changes in Equity for the Year Ended 30 June 2008 52
Notes to the Financial Statements for the Year Ended 30 June 2008 54
Director’s Declaration 121
Independent Audit Report 122
Security Holder Information as at 22 September 2008 124
Summary of Mining Tenements as at 22 September 2008 126
For
per
sona
l use
onl
y
Chairman’s Letter
3
Dear Shareholders
I present to you the Metals X Limited (“Metals X” or “the Company”) Annual Report for the period ending 30 June 2008.
The fi nancial year just past has been one of signifi cant progress for Metals X.
The Board continued with its diversifi cation strategy and the Company has now positioned itself as a truly diversifi ed explorer and developer of Australian resource projects.
Our strategic decisions to maintain our core focus on the tin and nickel industries has been vindicated by these two metals, specifi cally Tin, climbing its way to be amongst the highest priced commodities on the LME.
Capital raisings of $59.4 million dollars mid-way through the fi nancial year resulted in a signifi cant strengthening of our balance sheet and cash reserves which has funded the growth plans of the company.
We closed the smaller and struggling Collingwood Tin Project during the year to focus on the larger and more signifi cant Renison.
We re-started our expanded Renison Tin project in early 2008 and at the time of writing we are building up to full capacity. We commenced mining at Mt Bischoff in March 2008 and underground mining from the Renison Bell mine in May 2008 and a signifi cant stockpile of ore was available for the commencement of operations. Renison will in 2008/2009 emerge as a tin and copper producer and in addition to being the largest tin producer in Australia, the project will build to become a signifi cant player in the world tin market.
The phase 1 feasibility study on Wingellina was completed and confi rmed that the project is capable of materialising to be a major and long term nickel-cobalt producer. The signifi cant value of this project has not been missed by Jinchuan Group Limited, China’s largest nickel producer and for that matter by APAC Resources Ltd (HK1104) who have emerged as our largest single shareholder. Both of these companies are focussed on the potential and long term benefi ts that will come from the development of Wingellina. We are grateful and appreciative of their support and commitment to the Wingellina Project and the Company.
During the year we have diversifi ed our exploration with brownfi elds exploration in and around our existing key projects and additional greenfi elds exposure through signifi cant shareholdings in Westgold Resources Limited (“Westgold”), Aragon Resources Limited (“Aragon”) and Agaton Phosphate Pty Ltd (“Agaton”). These have given the group excellent exploration projects and exposure to gold, copper, lead, zinc, silver, uranium and phosphates. Each of these entities has delivered strong exploration results from their specialised areas and we expect some of these projects to turn into development projects in future years.
We look forward to the ensuing fi nancial year as one that will see the company evolve as a miner with strong earnings and further enhanced growth prospects.
On behalf of my Board, I would like to thank senior management and employees for their contribution to the Company’s activities and the Company’s shareholders for their continued support.
Peter NewtonChairmanF
or p
erso
nal u
se o
nly
Managing Director’s Report
4
Strategic Review
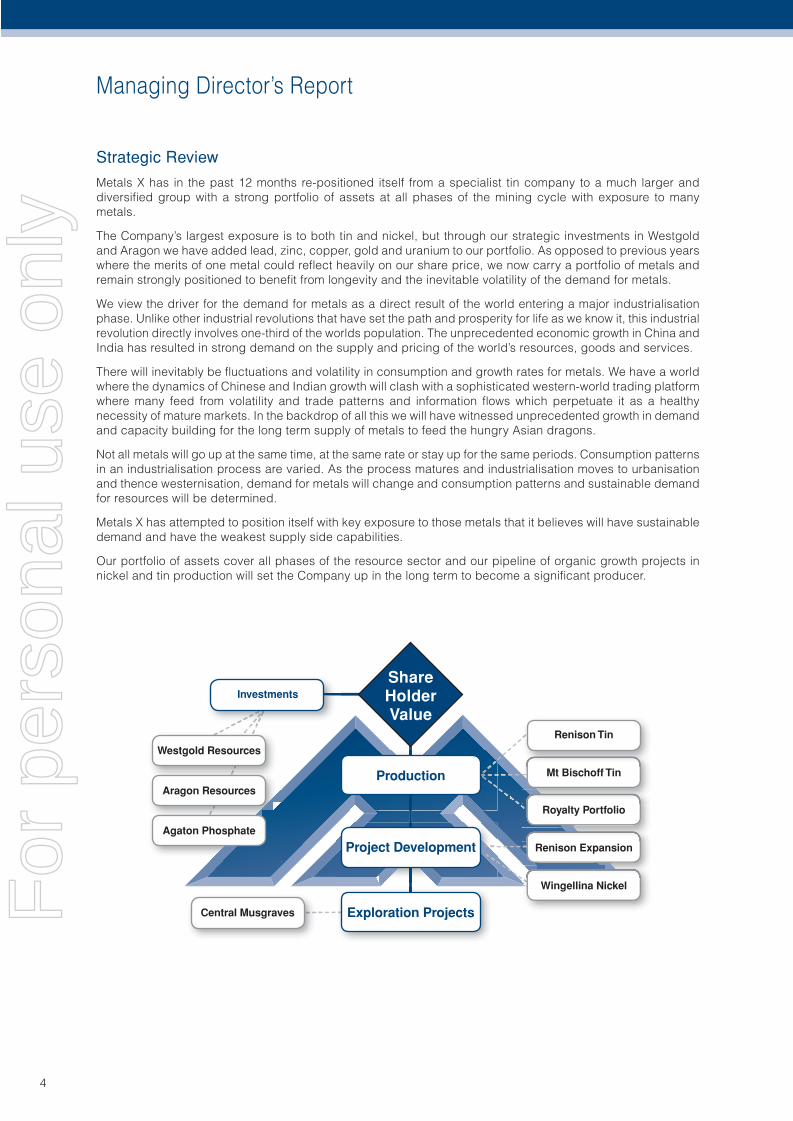
Metals X has in the past 12 months re-positioned itself from a specialist tin company to a much larger and diversifi ed group with a strong portfolio of assets at all phases of the mining cycle with exposure to many metals.
The Company’s largest exposure is to both tin and nickel, but through our strategic investments in Westgold and Aragon we have added lead, zinc, copper, gold and uranium to our portfolio. As opposed to previous years where the merits of one metal could refl ect heavily on our share price, we now carry a portfolio of metals and remain strongly positioned to benefi t from longevity and the inevitable volatility of the demand for metals.
We view the driver for the demand for metals as a direct result of the world entering a major industrialisation phase. Unlike other industrial revolutions that have set the path and prosperity for life as we know it, this industrial revolution directly involves one-third of the worlds population. The unprecedented economic growth in China and India has resulted in strong demand on the supply and pricing of the world’s resources, goods and services.
There will inevitably be fl uctuations and volatility in consumption and growth rates for metals. We have a world where the dynamics of Chinese and Indian growth will clash with a sophisticated western-world trading platform where many feed from volatility and trade patterns and information fl ows which perpetuate it as a healthy necessity of mature markets. In the backdrop of all this we will have witnessed unprecedented growth in demand and capacity building for the long term supply of metals to feed the hungry Asian dragons.
Not all metals will go up at the same time, at the same rate or stay up for the same periods. Consumption patterns in an industrialisation process are varied. As the process matures and industrialisation moves to urbanisation and thence westernisation, demand for metals will change and consumption patterns and sustainable demand for resources will be determined.
Metals X has attempted to position itself with key exposure to those metals that it believes will have sustainable demand and have the weakest supply side capabilities.
Our portfolio of assets cover all phases of the resource sector and our pipeline of organic growth projects in nickel and tin production will set the Company up in the long term to become a signifi cant producer.
ShareHolderValue
Production
Investments
Westgold Resources
Aragon Resources
Agaton Phosphate
Central Musgraves
Wingellina Nickel
Renison Expansion
Royalty Portfolio
Mt Bischoff Tin
Renison Tin
Project Development
Exploration ProjectsFor
per
sona
l use
onl
y
Managing Director’s Report (continued)
5
NICKEL DIVISION
The group’s nickel division has two key components:
1. The Central Musgrave Project (including Wingellina);2. A Nickel Royalty Portfolio.
Central Musgrave Project
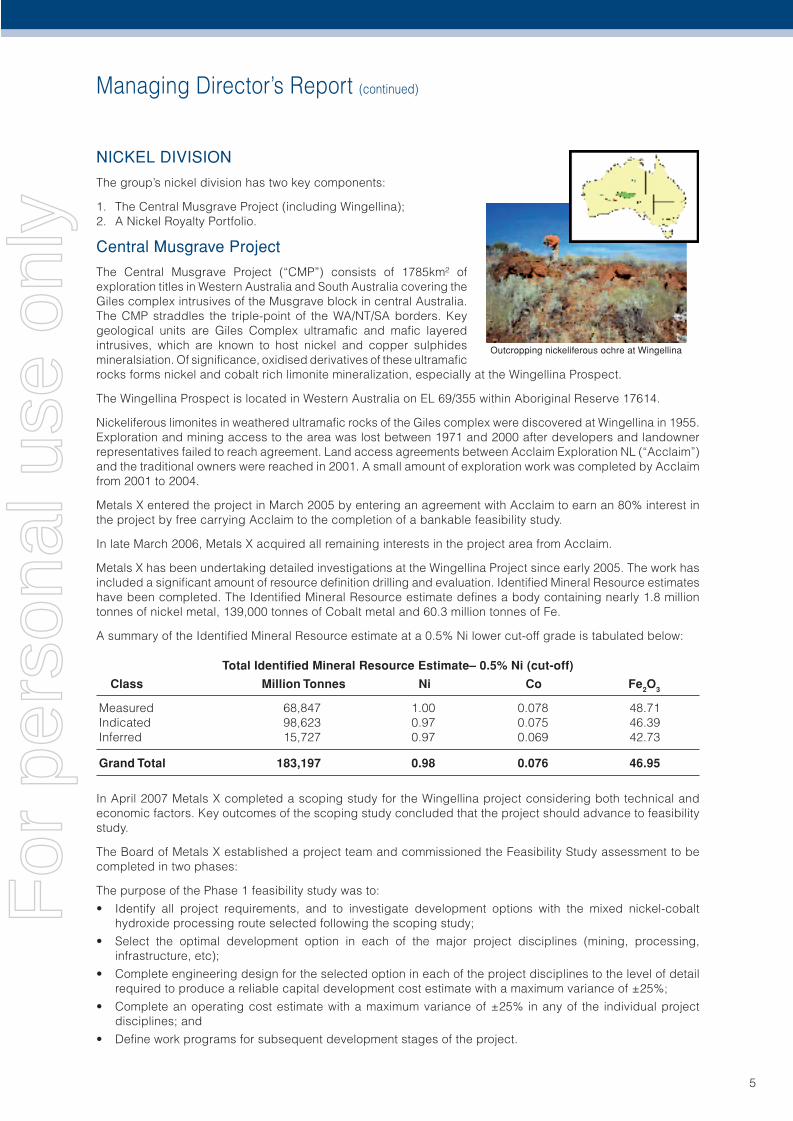
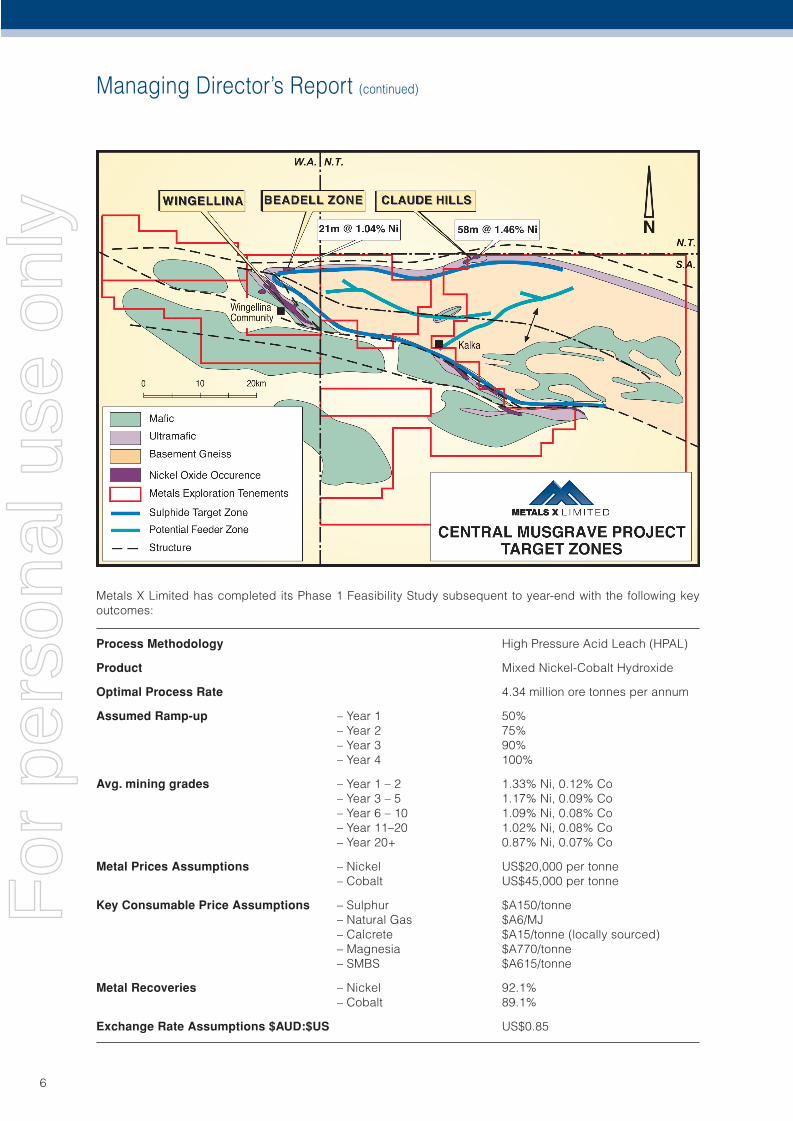
The Central Musgrave Project (“CMP”) consists of 1785km² of exploration titles in Western Australia and South Australia covering the Giles complex intrusives of the Musgrave block in central Australia. The CMP straddles the triple-point of the WA/NT/SA borders. Key geological units are Giles Complex ultramafi c and mafi c layered intrusives, which are known to host nickel and copper sulphides mineralsiation. Of signifi cance, oxidised derivatives of these ultramafi c rocks forms nickel and cobalt rich limonite mineralization, especially at the Wingellina Prospect.
The Wingellina Prospect is located in Western Australia on EL 69/355 within Aboriginal Reserve 17614.
Nickeliferous limonites in weathered ultramafi c rocks of the Giles complex were discovered at Wingellina in 1955. Exploration and mining access to the area was lost between 1971 and 2000 after developers and landowner representatives failed to reach agreement. Land access agreements between Acclaim Exploration NL (“Acclaim”) and the traditional owners were reached in 2001. A small amount of exploration work was completed by Acclaim from 2001 to 2004.
Metals X entered the project in March 2005 by entering an agreement with Acclaim to earn an 80% interest in the project by free carrying Acclaim to the completion of a bankable feasibility study.
In late March 2006, Metals X acquired all remaining interests in the project area from Acclaim.
Metals X has been undertaking detailed investigations at the Wingellina Project since early 2005. The work has included a signifi cant amount of resource defi nition drilling and evaluation. Identifi ed Mineral Resource estimates have been completed. The Identifi ed Mineral Resource estimate defi nes a body containing nearly 1.8 million tonnes of nickel metal, 139,000 tonnes of Cobalt metal and 60.3 million tonnes of Fe.
A summary of the Identifi ed Mineral Resource estimate at a 0.5% Ni lower cut-off grade is tabulated below:
Total Identifi ed Mineral Resource Estimate– 0.5% Ni (cut-off)
Class Million Tonnes Ni Co Fe2O3
Measured 68,847 1.00 0.078 48.71 Indicated 98,623 0.97 0.075 46.39 Inferred 15,727 0.97 0.069 42.73
Grand Total 183,197 0.98 0.076 46.95
In April 2007 Metals X completed a scoping study for the Wingellina project considering both technical and economic factors. Key outcomes of the scoping study concluded that the project should advance to feasibility study.
The Board of Metals X established a project team and commissioned the Feasibility Study assessment to be completed in two phases:
The purpose of the Phase 1 feasibility study was to:
• Identify all project requirements, and to investigate development options with the mixed nickel-cobalt hydroxide processing route selected following the scoping study;
• Select the optimal development option in each of the major project disciplines (mining, processing, infrastructure, etc);
• Complete engineering design for the selected option in each of the project disciplines to the level of detail required to produce a reliable capital development cost estimate with a maximum variance of ±25%;
• Complete an operating cost estimate with a maximum variance of ±25% in any of the individual project disciplines; and
• Defi ne work programs for subsequent development stages of the project.
Outcropping nickeliferous ochre at Wingellina
For
per
sona
l use
onl
y
Managing Director’s Report (continued)
6
Metals X Limited has completed its Phase 1 Feasibility Study subsequent to year-end with the following key outcomes:
Process Methodology High Pressure Acid Leach (HPAL)
Product Mixed Nickel-Cobalt Hydroxide
Optimal Process Rate 4.34 million ore tonnes per annum
Assumed Ramp-up – Year 1 50% – Year 2 75% – Year 3 90% – Year 4 100%
Avg. mining grades – Year 1 – 2 1.33% Ni, 0.12% Co – Year 3 – 5 1.17% Ni, 0.09% Co – Year 6 – 10 1.09% Ni, 0.08% Co – Year 11–20 1.02% Ni, 0.08% Co – Year 20+ 0.87% Ni, 0.07% Co
Metal Prices Assumptions – Nickel US$20,000 per tonne – Cobalt US$45,000 per tonne
Key Consumable Price Assumptions – Sulphur $A150/tonne – Natural Gas $A6/MJ – Calcrete $A15/tonne (locally sourced) – Magnesia $A770/tonne – SMBS $A615/tonne
Metal Recoveries – Nickel 92.1% – Cobalt 89.1%
Exchange Rate Assumptions $AUD:$US US$0.85
For
per
sona
l use
onl
y
Managing Director’s Report (continued)
7
The feasibility study has determined a project development strategy that builds a High Pressure Acid Leach (“HPAL”) plant on site to produce a mixed nickel-cobalt hydroxide concentrate for shipping to third party refi neries. The project has a nameplate annual production of 40,000 tonnes of nickel and 3,000 tonnes of cobalt metal and a mine life of 39 years.
The feasibility study has signifi cantly eliminated the perceived disadvantage of location and isolation by identifying local supplies of gas for power supply, calcrete for neutralisation, sources of process water, and the delineation of road, rail and transport logistics to service the project.
The feasibility study has distinguished the project from other operating nickel laterite deposits in Australia on the basis of the ore style being a limonite or tropical laterite. The chemical make-up and physical characteristics of the ore vary markedly from typical Australian laterite deposits, having an iron oxide content averaging 47%, magnesium content of less than 2%, a low strip ratio and the ability to excavate the ore without blasting. In addition acid and consumable consumptions are low.
Key fi nancial outcomes for the feasibility study are tabulated: 39 yr Mine Life 20 yr Mine Life
Average Annualised Prod’n – Ni (t) 38,200 41,600 – Co (t) 2,900 3,250
Capital Cost $US 1.882 Billion $US 1.882 Billion (A$2.214 Billion) (A$2.214 Billion)
Avg. Capital Cost US$/pound Ni–equiv. $US 0.57/lb $US 1.02/lb
Operating Cost – average $A p. annum $US 411m $US 414M
Avg. OpCost $US/t Ni. $US 10,300/t $US 9,950/tAvg. OpCost $US/t Ni (after Co Credits) $US 7,370/t $US 7,180/t ($US 3.34/lb) ($US 2.92/lb)
Total Prod’n Cost $US/t Ni. $US 12,040/t US$ 12,210/t
Total Prod’n Cost $US/Ni (after Co Cr) $US 8,680/t $US 8,880/t ($US 3.91/lb) ($US 3.94/lb)
Est. Avg. EBITDA – A$ per annum $US 483 Million $US 565 Million (A$ 568 M) (A$ 665 M)
Est Avg. EBIT – A$ per annum $US 434 Million $US 470 Million (A$ 511 M) (A$ 553M)
Based on the assumptions used in the feasibility study the estimated NPV (8%) of the projet is A$3.4 billion.
For
per
sona
l use
onl
y
Managing Director’s Report (continued)
8
Nickel Royalty Portfolio
Metals X holds a portfolio of production royalty streams, payable from Australia’s most productive nickel fi elds being Kambalda and Mt Keith. The three royalty streams are:
• Mt Keith;• Kingston;• Kambalda.
During the fi nancial year royalty payments were $6.76 million.
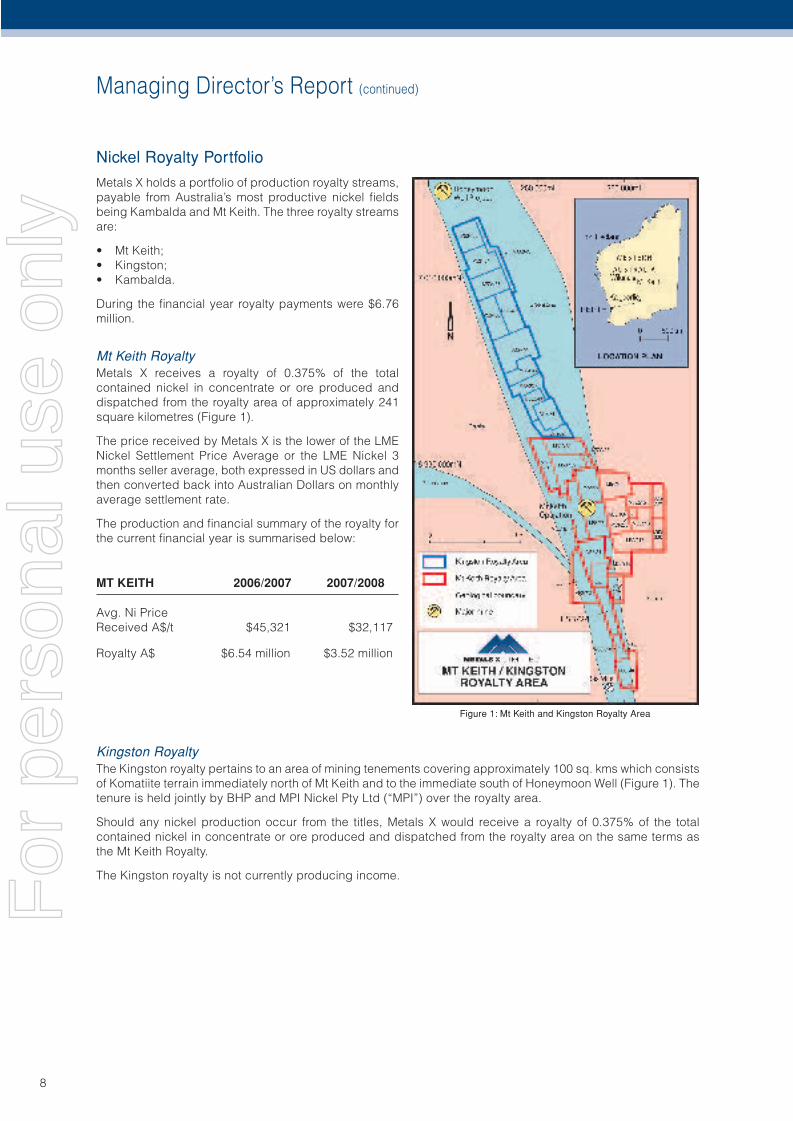
Mt Keith RoyaltyMetals X receives a royalty of 0.375% of the total contained nickel in concentrate or ore produced and dispatched from the royalty area of approximately 241 square kilometres (Figure 1).
The price received by Metals X is the lower of the LME Nickel Settlement Price Average or the LME Nickel 3 months seller average, both expressed in US dollars and then converted back into Australian Dollars on monthly average settlement rate.
The production and fi nancial summary of the royalty for the current fi nancial year is summarised below:
MT KEITH 2006/2007 2007/2008
Avg. Ni Price Received A$/t $45,321 $32,117
Royalty A$ $6.54 million $3.52 million
Kingston RoyaltyThe Kingston royalty pertains to an area of mining tenements covering approximately 100 sq. kms which consists of Komatiite terrain immediately north of Mt Keith and to the immediate south of Honeymoon Well (Figure 1). The tenure is held jointly by BHP and MPI Nickel Pty Ltd (“MPI”) over the royalty area.
Should any nickel production occur from the titles, Metals X would receive a royalty of 0.375% of the total contained nickel in concentrate or ore produced and dispatched from the royalty area on the same terms as the Mt Keith Royalty.
The Kingston royalty is not currently producing income.
Figure 1: Mt Keith and Kingston Royalty Area
For
per
sona
l use
onl
y
Managing Director’s Report (continued)
9
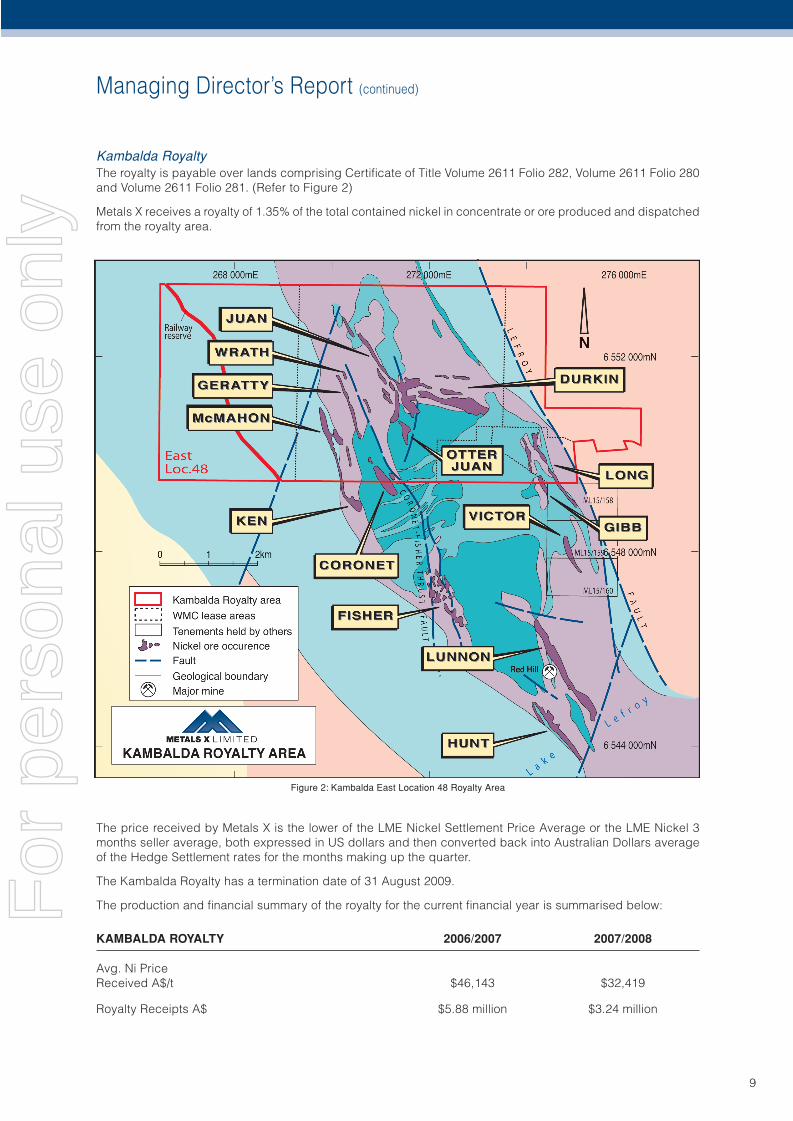
Kambalda RoyaltyThe royalty is payable over lands comprising Certifi cate of Title Volume 2611 Folio 282, Volume 2611 Folio 280 and Volume 2611 Folio 281. (Refer to Figure 2)
Metals X receives a royalty of 1.35% of the total contained nickel in concentrate or ore produced and dispatched from the royalty area.
The price received by Metals X is the lower of the LME Nickel Settlement Price Average or the LME Nickel 3 months seller average, both expressed in US dollars and then converted back into Australian Dollars average of the Hedge Settlement rates for the months making up the quarter.
The Kambalda Royalty has a termination date of 31 August 2009.
The production and fi nancial summary of the royalty for the current fi nancial year is summarised below:
KAMBALDA ROYALTY 2006/2007 2007/2008
Avg. Ni PriceReceived A$/t $46,143 $32,419
Royalty Receipts A$ $5.88 million $3.24 million
Figure 2: Kambalda East Location 48 Royalty Area
For
per
sona
l use
onl
y
Managing Director’s Report (continued)
10
TIN DIVISION
The backbone of Metals X’s tin division is its Tasmanian Tin Strategy which looks to generate maximum effi ciency and shareholder value from Metals X’s tin assets and infrastructure in Tasmania. These assets are held within a wholly owned subsidiary company, Bluestone Mines Tasmania Pty Ltd (“BMT”).
The key assets of BMT are the cornerstone of Tasmania’s and Australia’s hard-rock tin history. They include:
1. The Renison Bell Mine;
2. The Renison Tin Concentrator;
3. The Mt Bischoff Tin Project;
4. The Renison Expansion Project (“Rentails”).
Collectively they are referred to as the Renison Project with the Rentails Project forming the Renison Expansion Project. The key development steps in chronological order of the strategy are:
1. Re-start the Renison Project with ores sourced from the Renison Bell underground mine and the Mt Bischoff open pit, with the re-commissioning of the Renison Tin Concentrator.
2. The completion of a defi nitive feasibility study on the Rentails Project.
3. The construction of the Rentails tailings re-treatment “Tin Fumer” project.
4. The integration of tin fuming within the Renison Tin process route.
5. The extension of project life for the tin fumer plan by integration of other tin ores and known stannite rich ores into the process.
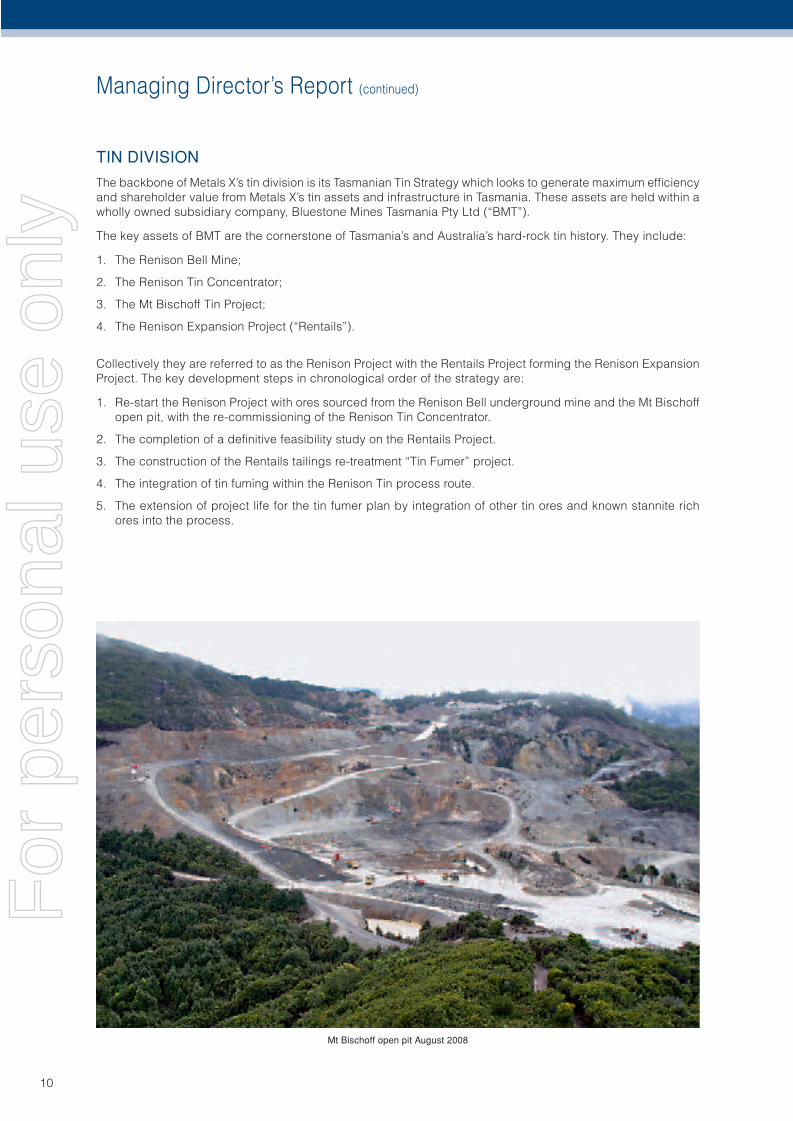
Mt Bischoff open pit August 2008
For
per
sona
l use
onl
y
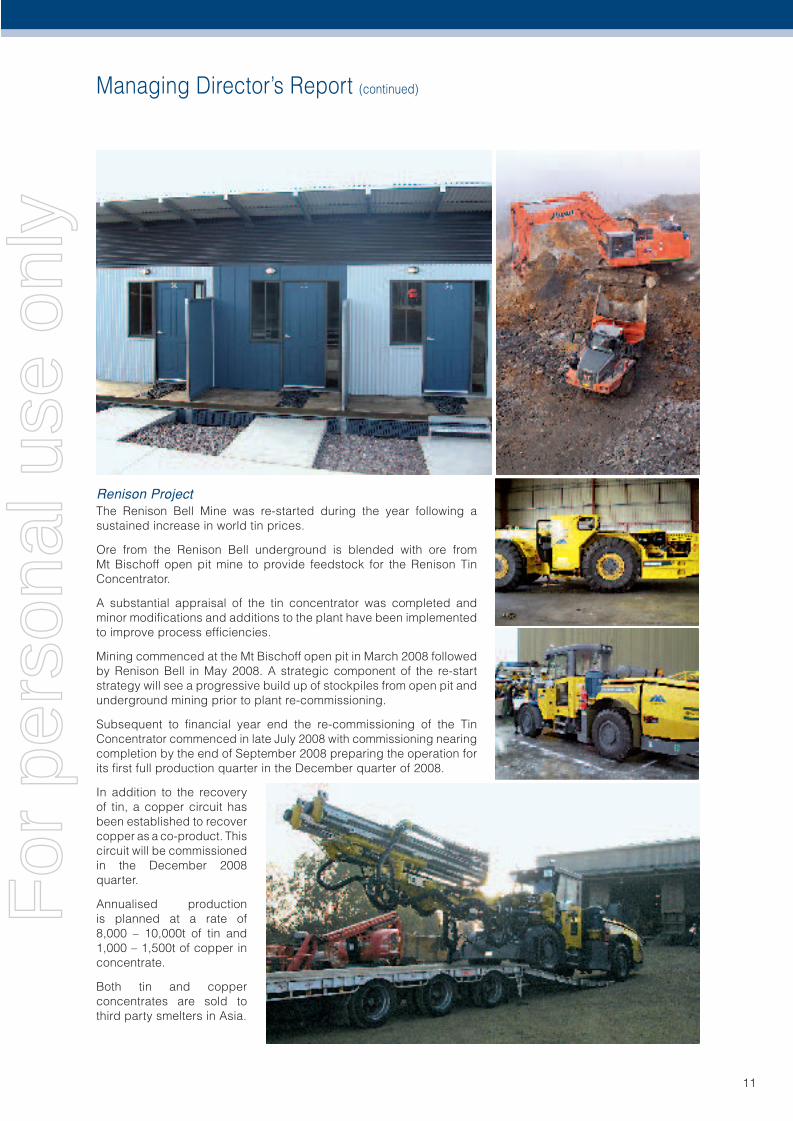
Renison ProjectThe Renison Bell Mine was re-started during the year following a sustained increase in world tin prices.
Ore from the Renison Bell underground is blended with ore from Mt Bischoff open pit mine to provide feedstock for the Renison Tin Concentrator.
A substantial appraisal of the tin concentrator was completed and minor modifi cations and additions to the plant have been implemented to improve process effi ciencies.
Mining commenced at the Mt Bischoff open pit in March 2008 followed by Renison Bell in May 2008. A strategic component of the re-start strategy will see a progressive build up of stockpiles from open pit and underground mining prior to plant re-commissioning.
Subsequent to fi nancial year end the re-commissioning of the Tin Concentrator commenced in late July 2008 with commissioning nearing completion by the end of September 2008 preparing the operation for its fi rst full production quarter in the December quarter of 2008.
In addition to the recovery of tin, a copper circuit has been established to recover copper as a co-product. This circuit will be commissioned in the December 2008 quarter.
Annualised production is planned at a rate of 8,000 – 10,000t of tin and 1,000 – 1,500t of copper in concentrate.
Both tin and copper concentrates are sold to third party smelters in Asia.
Managing Director’s Report (continued)
11
For
per
sona
l use
onl
y
Managing Director’s Report (continued)
12
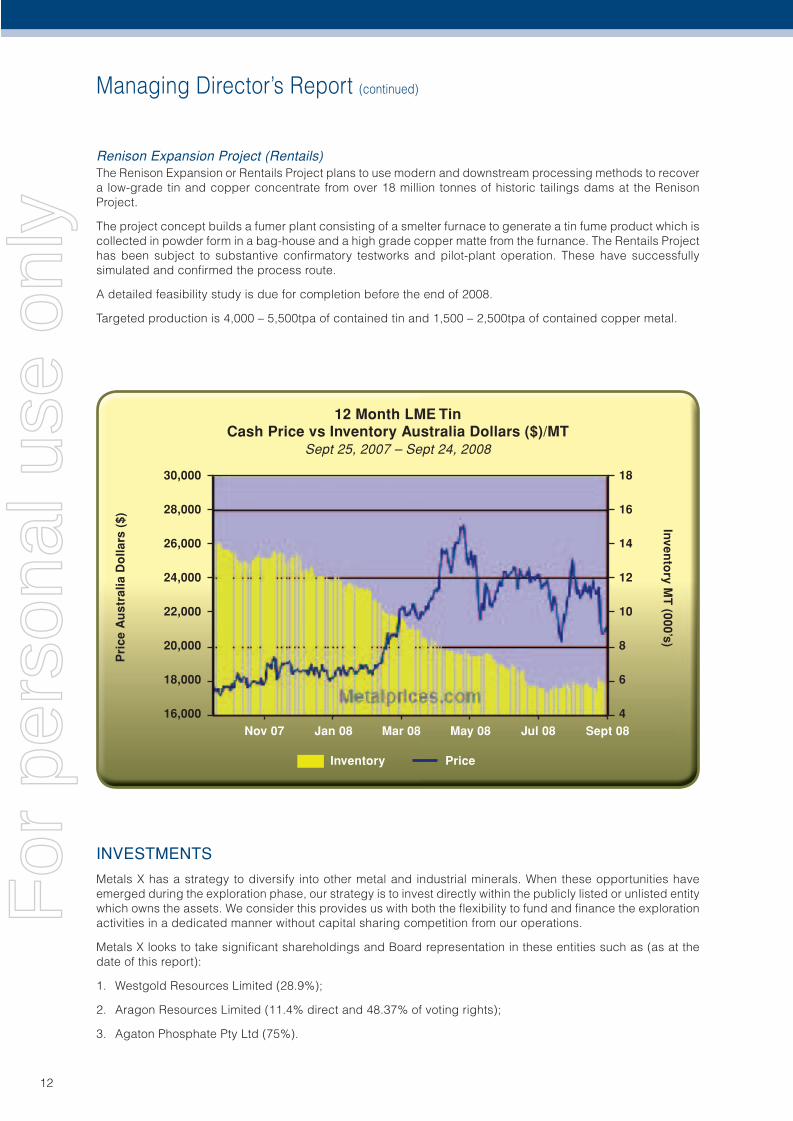
Renison Expansion Project (Rentails)The Renison Expansion or Rentails Project plans to use modern and downstream processing methods to recover a low-grade tin and copper concentrate from over 18 million tonnes of historic tailings dams at the Renison Project.
The project concept builds a fumer plant consisting of a smelter furnace to generate a tin fume product which is collected in powder form in a bag-house and a high grade copper matte from the furnance. The Rentails Project has been subject to substantive confi rmatory testworks and pilot-plant operation. These have successfully simulated and confi rmed the process route.
A detailed feasibility study is due for completion before the end of 2008.
Targeted production is 4,000 – 5,500tpa of contained tin and 1,500 – 2,500tpa of contained copper metal.
INVESTMENTS
Metals X has a strategy to diversify into other metal and industrial minerals. When these opportunities have emerged during the exploration phase, our strategy is to invest directly within the publicly listed or unlisted entity which owns the assets. We consider this provides us with both the fl exibility to fund and fi nance the exploration activities in a dedicated manner without capital sharing competition from our operations.
Metals X looks to take signifi cant shareholdings and Board representation in these entities such as (as at the date of this report):
1. Westgold Resources Limited (28.9%);
2. Aragon Resources Limited (11.4% direct and 48.37% of voting rights);
3. Agaton Phosphate Pty Ltd (75%).
12 Month LME TinCash Price vs Inventory Australia Dollars ($)/MT
Sept 25, 2007 – Sept 24, 2008
30,000
28,000
26,000
24,000
22,000
20,000
18,000
16,000
18
16
14
12
10
8
6
4
Pri
ce A
ust
ralia
Do
llars
($) Inven
tory M
T (000’s)
Nov 07 Jan 08 Mar 08 May 08 Jul 08 Sept 08
Inventory Price
For
per
sona
l use
onl
y
Managing Director’s Report (continued)
13
Westgold Resources Limited
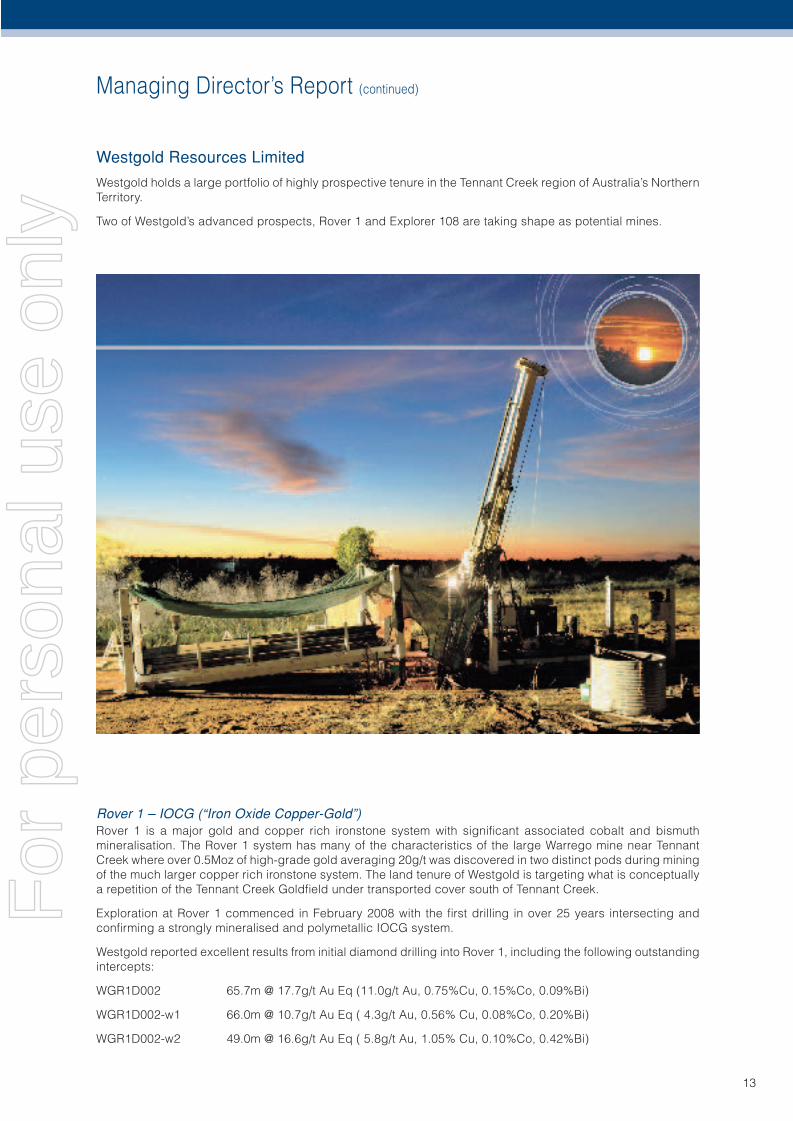
Westgold holds a large portfolio of highly prospective tenure in the Tennant Creek region of Australia’s Northern Territory.
Two of Westgold’s advanced prospects, Rover 1 and Explorer 108 are taking shape as potential mines.
Rover 1 – IOCG (“Iron Oxide Copper-Gold”)Rover 1 is a major gold and copper rich ironstone system with signifi cant associated cobalt and bismuth mineralisation. The Rover 1 system has many of the characteristics of the large Warrego mine near Tennant Creek where over 0.5Moz of high-grade gold averaging 20g/t was discovered in two distinct pods during mining of the much larger copper rich ironstone system. The land tenure of Westgold is targeting what is conceptually a repetition of the Tennant Creek Goldfi eld under transported cover south of Tennant Creek.
Exploration at Rover 1 commenced in February 2008 with the fi rst drilling in over 25 years intersecting and confi rming a strongly mineralised and polymetallic IOCG system.
Westgold reported excellent results from initial diamond drilling into Rover 1, including the following outstanding intercepts:
WGR1D002 65.7m @ 17.7g/t Au Eq (11.0g/t Au, 0.75%Cu, 0.15%Co, 0.09%Bi)
WGR1D002-w1 66.0m @ 10.7g/t Au Eq ( 4.3g/t Au, 0.56% Cu, 0.08%Co, 0.20%Bi)
WGR1D002-w2 49.0m @ 16.6g/t Au Eq ( 5.8g/t Au, 1.05% Cu, 0.10%Co, 0.42%Bi)
For
per
sona
l use
onl
y
Managing Director’s Report (continued)
14
Explorer 108Explorer 108 is a large alteration system, mineralised throughout with broad (100m+) intervals grading 2 to 5% Zn + Pb, but importantly contains a number of high grade lenses up to 60 metres thick containing grades over 7% Zn + Pb. The most signifi cant of these discovered to date occurs in the base of dolomite sequence directly above the contact with the underlying acid volcanic sequence.
Westgold continued exploration of this target in the fi rst half of the year, before pausing to estimate a resource.
Westgold announced a maiden identifi ed mineral resource estimate for Explorer 108 as follows:
8.7 million tonnes @ 5.7% (Zn + Pb) using a 2.5% Zn+Pb lower cut-off or4.0 million tonnes @ 8.2% (Zn + Pb) using a 5.0% Zn + Pb lower cut-off
Aragon Resources Limited
Metals X invested in the spin-off of Westgold’s Western Australian gold, nickel and uranium assets early in the fi nancial year. Aragon holds a large portfolio of gold nickel and uranium assets in Western Australia. The key of these is a +2000 sq. km land position covering highly prospective gold and uranium tenure in the Yandal Gold Belt.
Aragon completed its IPO raising $8.75 million and listing on the ASX on 10 August 2007.
Aragon achieved early exploration success in gold exploration at its Mission and Cables prospects, approximately 7km north of the Darlot Mine. Aragon reported excellent drill intercepts suggest two primary gold discoveries during the year, with best results of:
Mission ProspectADRC004 1m @ 75.6g/t Au from 48mADRC007 2m @ 18.6g/t Au from 74mADRC008 2m @ 28.3g/t Au from 52m
Cables ProspectADRC019 4m @ 18.8g/t Au from 182mADRC022 7m @ 27.5g/t Au from 133mADRC027 4m @ 42.0g/t Au from 78m
Subsequent to year end Aragon acquired all of the assets of Territory Phosphate Pty Ltd and has moved into phosphate exploration in the Southern Georgina and West Wiso basins near Tennant Creek in the Northern Territory.
Agaton Phosphate Pty Ltd
During the year Metals X entered into a Heads of Agreement with All Classic Enterprises Pty Ltd and Bishop Exploration Pty Ltd (the Vendors) to establish a 75% Metals X owned subsidiary company to acquire a 90% interest in the Agaton Phosphate Project. The remaining 10% owned by the Vendors is free carried to the completion of a feasibility study.
The Project is located between the town of Moora and the Cooljaroo Mineral Sands areas approximately 120km north of Perth. Agaton is a phosphate sands project, with phosphate occurring as nodules and precipitates within sedimentation phases of the Dandaragan Trough. The phosphate mineralization is considered to have formed by precipitation during the mixing of cold phosphate rich waters with warm continental shelf waters, as has occurred in the giant phosphate deposits of Florida.
Exploration titles were granted and land access agreements over key areas were established during the period. Preliminary shallow seismic geophysics was completed to outline the basement of the trough and phosphate nodule trap structures. Reconnaissance drilling is planned to commence in the September 2008 quarter with results to follow later in the year.
For
per
sona
l use
onl
y
Managing Director’s Report (continued)
15
IDENTIFIED MINERAL RESOURCES & MINING RESERVE ESTIMATES
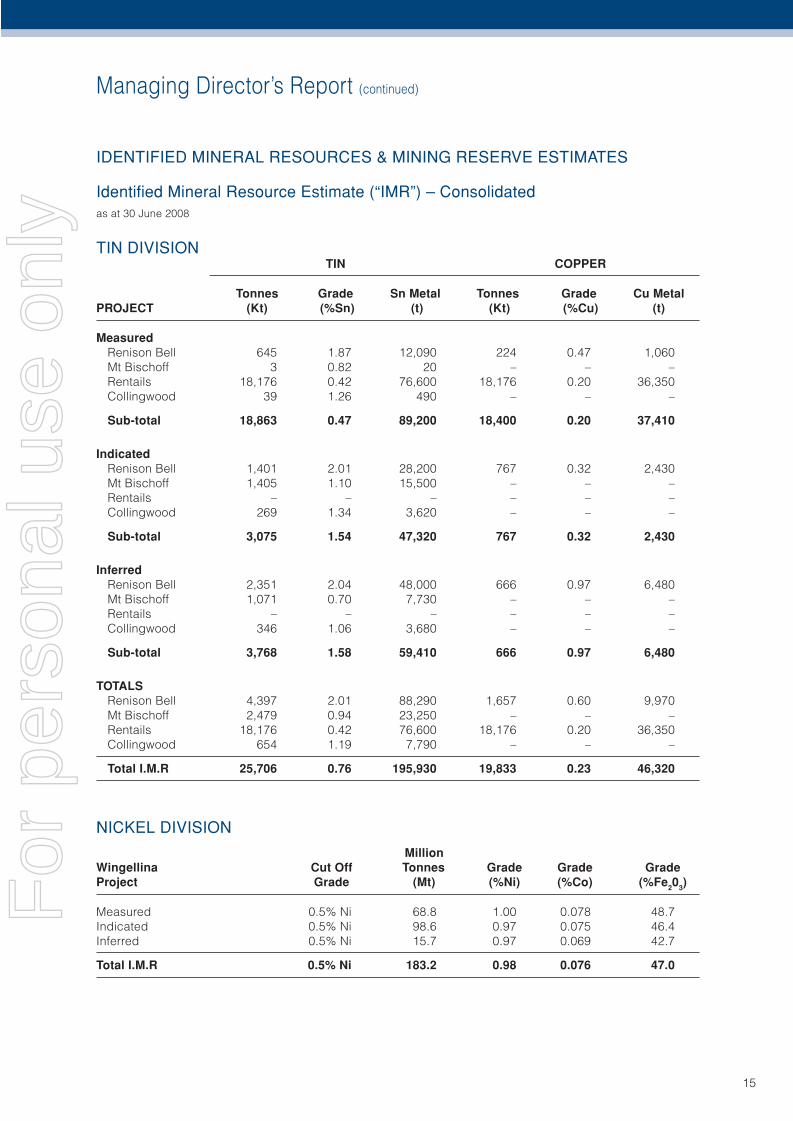
Identifi ed Mineral Resource Estimate (“IMR”) – Consolidatedas at 30 June 2008
TIN DIVISION TIN COPPER
Tonnes Grade Sn Metal Tonnes Grade Cu MetalPROJECT (Kt) (%Sn) (t) (Kt) (%Cu) (t)
Measured Renison Bell 645 1.87 12,090 224 0.47 1,060Mt Bischoff 3 0.82 20 – – –Rentails 18,176 0.42 76,600 18,176 0.20 36,350Collingwood 39 1.26 490 – – –
Sub-total 18,863 0.47 89,200 18,400 0.20 37,410
Indicated Renison Bell 1,401 2.01 28,200 767 0.32 2,430Mt Bischoff 1,405 1.10 15,500 – – –Rentails – – – – – –Collingwood 269 1.34 3,620 – – –
Sub-total 3,075 1.54 47,320 767 0.32 2,430
Inferred Renison Bell 2,351 2.04 48,000 666 0.97 6,480Mt Bischoff 1,071 0.70 7,730 – – –Rentails – – – – – –Collingwood 346 1.06 3,680 – – –
Sub-total 3,768 1.58 59,410 666 0.97 6,480
TOTALS Renison Bell 4,397 2.01 88,290 1,657 0.60 9,970Mt Bischoff 2,479 0.94 23,250 – – –Rentails 18,176 0.42 76,600 18,176 0.20 36,350Collingwood 654 1.19 7,790 – – –
Total I.M.R 25,706 0.76 195,930 19,833 0.23 46,320
NICKEL DIVISION
MillionWingellina Cut Off Tonnes Grade Grade GradeProject Grade (Mt) (%Ni) (%Co) (%Fe203)
Measured 0.5% Ni 68.8 1.00 0.078 48.7Indicated 0.5% Ni 98.6 0.97 0.075 46.4Inferred 0.5% Ni 15.7 0.97 0.069 42.7
Total I.M.R 0.5% Ni 183.2 0.98 0.076 47.0
For
per
sona
l use
onl
y
Managing Director’s Report (continued)
16
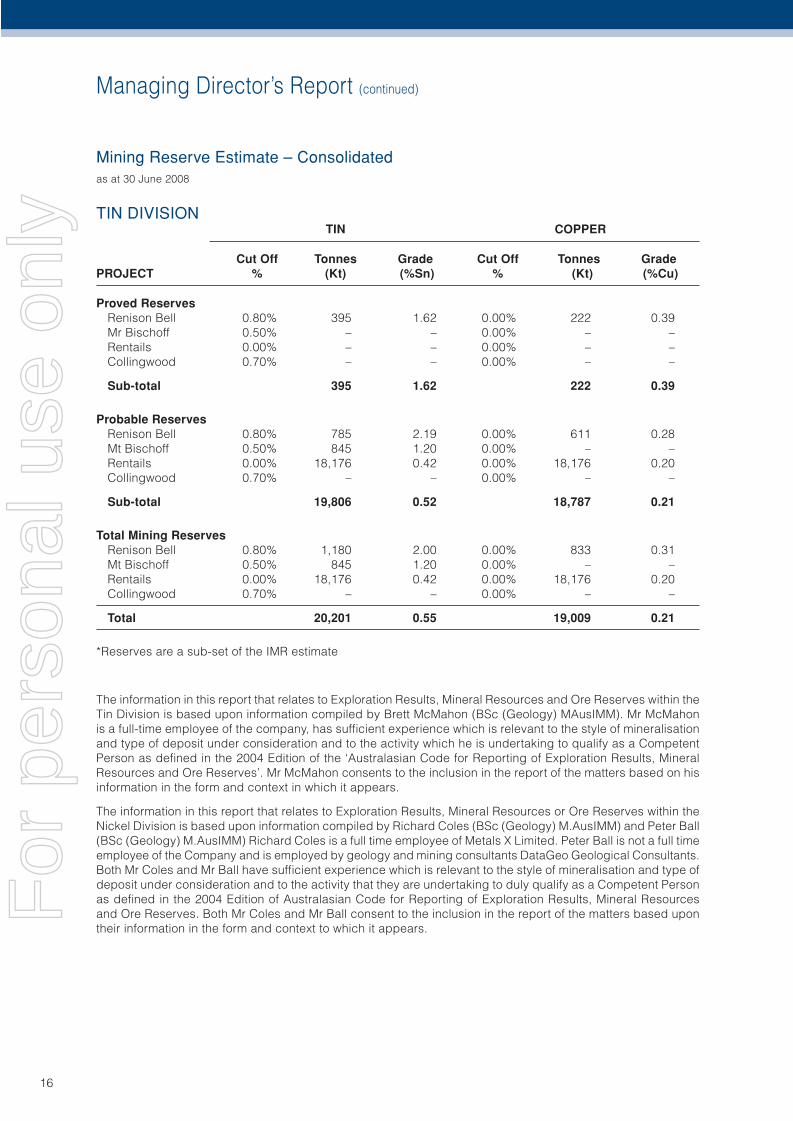
Mining Reserve Estimate – Consolidatedas at 30 June 2008
TIN DIVISION TIN COPPER
Cut Off Tonnes Grade Cut Off Tonnes GradePROJECT % (Kt) (%Sn) % (Kt) (%Cu)
Proved Reserves Renison Bell 0.80% 395 1.62 0.00% 222 0.39Mr Bischoff 0.50% – – 0.00% – –Rentails 0.00% – – 0.00% – –Collingwood 0.70% – – 0.00% – –
Sub-total 395 1.62 222 0.39
Probable Reserves Renison Bell 0.80% 785 2.19 0.00% 611 0.28Mt Bischoff 0.50% 845 1.20 0.00% – –Rentails 0.00% 18,176 0.42 0.00% 18,176 0.20Collingwood 0.70% – – 0.00% – –
Sub-total 19,806 0.52 18,787 0.21
Total Mining Reserves Renison Bell 0.80% 1,180 2.00 0.00% 833 0.31Mt Bischoff 0.50% 845 1.20 0.00% – –Rentails 0.00% 18,176 0.42 0.00% 18,176 0.20Collingwood 0.70% – – 0.00% – –
Total 20,201 0.55 19,009 0.21
*Reserves are a sub-set of the IMR estimate
The information in this report that relates to Exploration Results, Mineral Resources and Ore Reserves within the Tin Division is based upon information compiled by Brett McMahon (BSc (Geology) MAusIMM). Mr McMahon is a full-time employee of the company, has suffi cient experience which is relevant to the style of mineralisation and type of deposit under consideration and to the activity which he is undertaking to qualify as a Competent Person as defi ned in the 2004 Edition of the ‘Australasian Code for Reporting of Exploration Results, Mineral Resources and Ore Reserves’. Mr McMahon consents to the inclusion in the report of the matters based on his information in the form and context in which it appears.
The information in this report that relates to Exploration Results, Mineral Resources or Ore Reserves within the Nickel Division is based upon information compiled by Richard Coles (BSc (Geology) M.AusIMM) and Peter Ball (BSc (Geology) M.AusIMM) Richard Coles is a full time employee of Metals X Limited. Peter Ball is not a full time employee of the Company and is employed by geology and mining consultants DataGeo Geological Consultants. Both Mr Coles and Mr Ball have suffi cient experience which is relevant to the style of mineralisation and type of deposit under consideration and to the activity that they are undertaking to duly qualify as a Competent Person as defi ned in the 2004 Edition of Australasian Code for Reporting of Exploration Results, Mineral Resources and Ore Reserves. Both Mr Coles and Mr Ball consent to the inclusion in the report of the matters based upon their information in the form and context to which it appears.
AF
or p
erso
nal u
se o
nly
Director’s Report
17
The Directors submit their report together with the fi nancial report of Metals X Limited (“Metals X” or “the Company”) and of the Consolidated Entity, being the Company and its controlled entities, for the year ended 30 June 2008.
DIRECTORS
The names and details of the Company’s Directors in offi ce during the fi nancial period and until the date of this report are as follows. Directors were in offi ce for this entire period unless otherwise stated.
Names, qualifi cations, experience and special responsibilitiesPeter John Newton – ChairmanMr Newton was a stockbroker for 25 years until 1994. Since then he has been a signifi cant participant in the Australian resource industry as an investor and a director of a number of listed companies. In recent years he has been the Chairman of both Hill 50 Limited and Abelle Limited. Mr Newton is also the Chairman of the Company’s Remuneration Committee.
During the past three years he has served as a director of the following public listed companies:
• Lynas Corporation Ltd (Appointed 24 November 2004 – Resigned 8 December 2005); and• Metals Exploration Limited** (Appointed 14 June 2004).
Peter Gerard Cook – Managing DirectorMr Cook is a Geologist (BSc (Applied Geology)) and a Mineral Economist (MSc (Min. Econ), MAusIMM). In recent years he has been the Managing Director of Hill 50 Limited, the Chief Executive Offi cer of Harmony Gold Australia Pty Ltd and the Managing Director of Abelle Limited. He has considerable experience in the fi elds of exploration and project and corporate management of mining companies. He is also a director of Westgold Resources Limited and the Chairman of Aragon Resources Limited.
During the past three years he has served as a director of the following public listed companies:
• Metals Exploration Limited** (Appointed 14 June 2004);• Westgold Resources Limited* (Appointed 19 March 2007); and• Aragon Resources Limited* (Appointed 18 May 2007).
Warren Shaye Hallam – Executive DirectorMr Hallam is a Metallurgist (B. App Sci (Metallurgy)) and a Mineral Economist (MSc (Min. Econ)) and holds a Graduate Diploma in fi nance. He has considerable technical and commercial experience within the resources industry. In recent times he was the Managing Director of Metals Exploration and previously worked for WMC Resources Ltd (“WMC”). In his last position with WMC, he was Group Manager – Corporate Planning and Strategy.
During the past three years he has served as a director of the following public listed company:
• Metals Exploration Limited** (Appointed 14 June 2004).
Donald Mark Okeby – Non-Executive DirectorMr Okeby has considerable experience in the resources industry both as a Solicitor and as a director of listed companies. He holds a Master of Laws (LLM). In recent years he has been an Executive Director of Hill 50 Limited, Abelle Limited and a non-executive director of Lynas Corporation Ltd. He is presently a director of Westgold Resources Limited. Mr Okeby also serves on the Company’s Audit and Remuneration Committees.
During the past three years he has served as a director of the following public listed companies:
• Lynas Corporation Ltd (Appointed 24 November 2004 – Resigned 8 December 2005);• Metals Exploration Limited** (Appointed 14 June 2004); and• Westgold Resources Limited* (Appointed 19 March 2007).
Michael Leslie Jefferies – Non-Executive DirectorMr Jefferies is an executive of Guinness Peat Group plc (“GPG”). He is a director of Tower Limited and Chairman of TAFMO Limited. He has extensive experience in fi nance and investment, including 16 years as an executive of GPG. He is a chartered accountant and holds a B. Comm. Mr Jefferies also serves on the Company’s Audit Committee.
For
per
sona
l use
onl
y
Director’s Report (continued)
18
During the past three years he has served as a director of the following public listed companies:
• Metals Exploration Limited** (Appointed 14 June 2004);• Australian Wealth Management Limited (Appointed 29 October 2004 – Resigned 24 April 2007);• Ozgrove Limited* (Appointed 31 October 2007)• Tower Australia Group Limited (Appointed 8 August 2006 – Resigned 8 August 2008 ); and• Tower Limited* (Appointed 14 December 2006).
Wang Wei – Non-Executive Director (Appointed 3 October 2007)Mr Wei is currently the Vice President of Jinchuan Group Limited (“Jinchuan”) in charge of engineering construction of overseas projects in which Jinchuan participates. Mr Wang is a professor classed engineer specialising in non-ferrous metallurgy and he brings to the Company substantial experience and knowledge of metallurgical nickel processing techniques, in particular high pressure acid leach technology and operation.
Yimin Zhang – Alternate Non-Executive Director (Appointed 3 October 2007)Mr Zhang joined the Board to act as an alternate director for Wang Wei. Mr Zhang is the Chief Representative for Jinchuan Australia and is also an Executive Director of Sino Nickel Pty Limited. Mr Zhang has worked for Jinchuan since 1981 and has been posted to several overseas positions to which he has been involved in numerous Jinchuan overseas co-operative ventures. Mr Zhang holds a Diploma from the Metallurgical and Architectural Institute of Chung Chan.
During the past three years he has served as a director of the following public listed company:
• Allegiance Mining NL (Appointed 7 November 2007 – Resigned 2 June 2008)
Donald James Head – Non-Executive Director (Deceased 19 November 2007)Mr Head was a metallurgist with more than 30 years experience in the mining industry. He held several senior management positions with WMC Resources Limited, including a number of years as the manager of the Kwinana Refi nery. He was a member of the Australian Institute of Mining and Metallurgy and ran his own metallurgical consulting business providing services to several mining and construction groups. In recent years he was a Non-Executive Director of Tectonic Resources NL, Abelle Limited and Acclaim Exploration NL. Mr Head also served on the Company’s Remuneration Committee.
During the past three years he has served as a director of the following public listed company:
• Acclaim Exploration NL (Appointed 1 December 2003 – Resigned 27 March 2006).
* Denotes current directorship.** Metals Exploration Limited was delisted by the ASX on 17 January 2007 subsequent to the merger with the
Company.
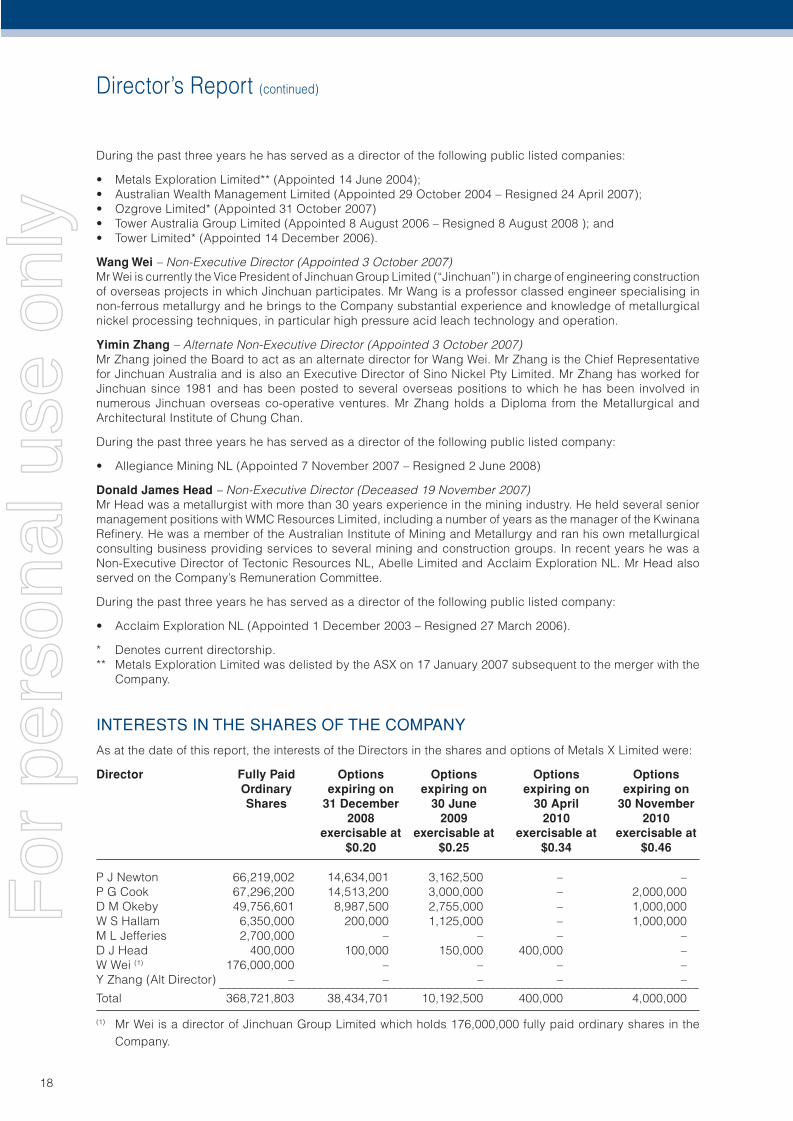
INTERESTS IN THE SHARES OF THE COMPANY
As at the date of this report, the interests of the Directors in the shares and options of Metals X Limited were:
Director Fully Paid Options Options Options Options Ordinary expiring on expiring on expiring on expiring on Shares 31 December 30 June 30 April 30 November 2008 2009 2010 2010 exercisable at exercisable at exercisable at exercisable at $0.20 $0.25 $0.34 $0.46
P J Newton 66,219,002 14,634,001 3,162,500 – –P G Cook 67,296,200 14,513,200 3,000,000 – 2,000,000D M Okeby 49,756,601 8,987,500 2,755,000 – 1,000,000W S Hallam 6,350,000 200,000 1,125,000 – 1,000,000M L Jefferies 2,700,000 – – – –D J Head 400,000 100,000 150,000 400,000 –W Wei (1) 176,000,000 – – – –Y Zhang (Alt Director) – – – – – ______________________________________________________________________________Total 368,721,803 38,434,701 10,192,500 400,000 4,000,000
(1) Mr Wei is a director of Jinchuan Group Limited which holds 176,000,000 fully paid ordinary shares in the Company.
For
per
sona
l use
onl
y
Director’s Report (continued)
19
COMPANY SECRETARY
Fiona Van Maanen – Company SecretaryMrs Van Maanen is a CPA, holds a Bachelor of Business (Accounting) degree and a Graduate Diploma in Company Secretarial Practice. She has 16 years of accounting and fi nancial management experience in the mining and resources industry and has been with the Company since incorporation.
DIVIDENDS
No dividends have been paid or declared by the Company during the fi nancial period or up to the date of this report.
Refer to note 8 for available franking credits.
PRINCIPAL ACTIVITIES
The principal activities during the year of entities within the Consolidated Entity were:
• exploration for and the mining, treatment and marketing of tin concentrate in Australia;• exploration for nickel in Australia;• exploration for phosphate in Australia;• development of nickel projects;• development and construction of tin mine projects; and• the ownership of nickel mining royalty rights; and• exploration for precious and base metals through signifi cant shareholdings in Westgold Resources Limited
and Aragon Resources Limited.
Other than the addition of the exploration for phosphate minerals, there have been no other signifi cant changes in the nature of these activites during the year.
EMPLOYEES
The Consolidated Entity employed 188 employees at 30 June 2008 (2007: 132).
For
per
sona
l use
onl
y
Director’s Report (continued)
20
BL
UE
STO
NE
MIN
ES
TA
SM
AN
IA P
TY
LT
DA
CN
108
492
628
Ren
ison
Tin
Min
e,
Mt B
isch
off P
roje
ct &
R
enta
ils P
roje
ct
BL
UE
STO
NE
A
US
TR
AL
IA P
TY
LT
DA
CN
108
490
820
ME
TAL
S X
LIM
ITE
DA
CN
110
150
055
ME
TAL
S
EX
PL
OR
AT
ION
L
IMIT
ED
AC
N 0
05 4
83 0
09
AG
ATO
N P
HO
SP
HA
TE
P
TY
LT
D
AC
N 1
29 9
01 0
97
BL
UE
STO
NE
N
OM
INE
ES
PT
Y L
TD
A
CN
092
257
013
Col
ling
woo
d T
in P
roje
ct
HA
RB
OU
R C
AP
ITA
L
(WA
) P
TY
LT
DA
CN
008
738
289
BH
P N
icke
l Roy
altie
s
ME
TE
X N
ICK
EL
P
TY
LT
DA
CN
108
243
358
Cen
tral
Mus
gra
veP
roje
ct
Exp
lora
tion
Pro
ject
HIN
CK
LE
Y R
AN
GE
P
TY
LT
DA
CN
052
098
496
Win
gel
lina
Nic
kel
Exp
lora
tion
Pro
ject
AU
ST
RA
L N
ICK
EL
P
TY
LT
DA
CN
092
816
558
Cla
ude
Hill
s N
icke
l E
xplo
ratio
n P
roje
ct
100%
100%
100%
100%
100%
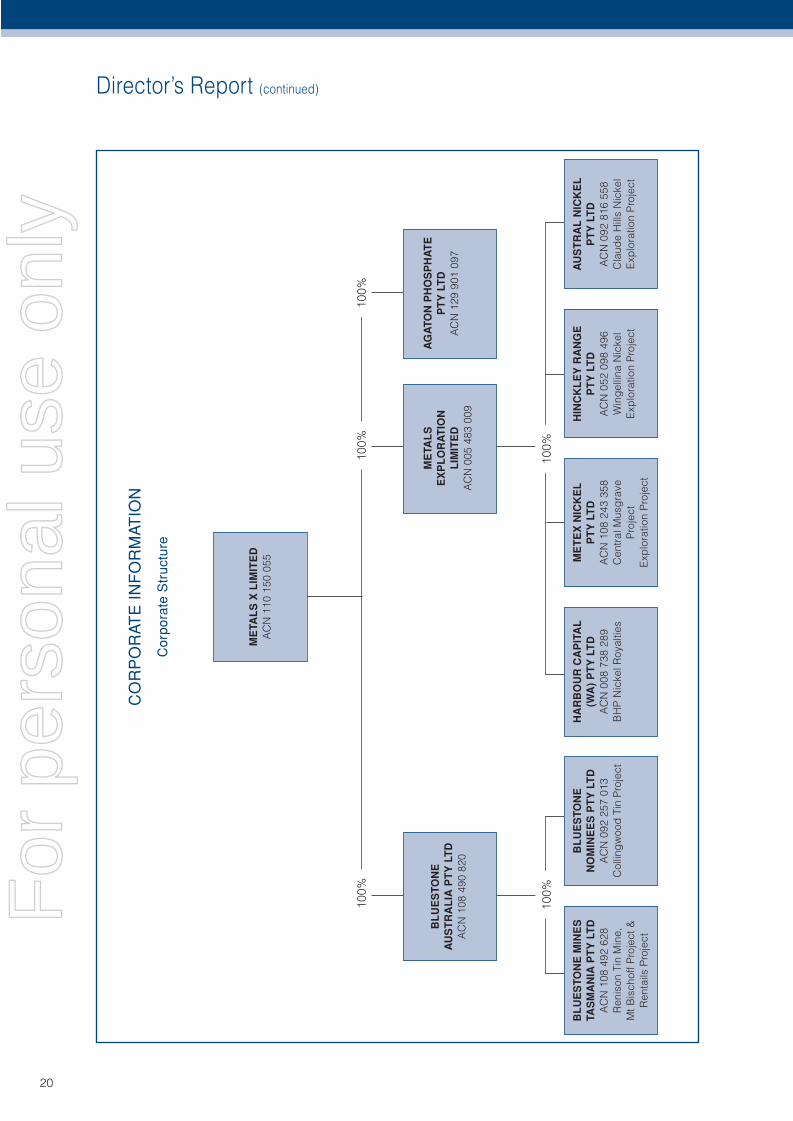
CO
RP
OR
ATE
IN
FO
RM
ATIO
N
Cor
pora
te S
truc
ture
20
For
per
sona
l use
onl
y
Director’s Report (continued)
21
OPERATING AND FINANCIAL REVIEW
Group OverviewMetals X Limited was incorporated as Bluestone Tin Limited on 23 July 2004 in Western Australia.
On 19 December 2006 the Company completed the merger with Metals Exploration Limited by way of a Scheme of Arrangement.
On 2 January 2007 the Company changed its name from Bluestone Tin Limited to Metals X Limited to refl ect the diversifi ed nature of the new business. On 9 January 2007 the Company commenced trading on the Australian Securities Exchange (“ASX”) under its new trading code MLX.
Metals X is a diversifi ed explorer and developer of minerals and metals. It owns a royalty portfolio generating revenue from sales of nickel at third party operations. It’s activities span brownfi eld exploration and production from its development and mining projects. Metals X performs greenfi elds exploration in its own right and through signifi cant investment in other publicly listed exploration companies.
The Company holds a 28.9% (2007: 19.1%) interest in Westgold Resources Limited (“Westgold”), which is involved in the exploration for base metals in the Northern Territory. Westgold is listed on the ASX. On 30 August 2007 the Company increased its interest from 19.1% to 22.4% and gained signifi cant infl uence over Westgold. During the year the Company charged Westgold for Directors fees for Mr Cook and Mr Okeby.
On 30 July 2007 the Company acquired a 12.8% interest in Aragon Resources Limited (“Aragon”), which is involved in the exploration for base and precious metals in Western Australia. Aragon is listed on the ASX. Westgold has a 41.7% interest in Aragon. As a result of the Company increasing its interest in Westgold in August 2007, it has gained signifi cant infl uence over Aragon. During the year the Company charged Aragon for accounting, secretarial and administrative services at cost, and for Directors fees for Mr Cook.
On 26 February 2008 Agaton Phosphate Pty Ltd was incorporated in which the Company will hold a 75% interest. Agaton phosphate Pty Ltd was established to acquire phosphate exploration prospects in the Dandaragan area of Western Australia.
The Company has signifi cantly expanded and diversifi ed its resource assets. It has resulted in a larger single company with revenue from royalties and mining operations and a pipeline of growth assets ranging from greenfi elds exploration to large scale resource developments.
Review of Financial Position
Share issues during the year
Share PlacementsThe Company allotted and issued 139,000,000 shares at 30 cents each on 22 January 2008 pursuant to a placement to raise an amount of $41,700,000 and contributed equity increased by $41,231,789 after costs of capital raising of $468,211.
The Company allotted and issued 59,000,000 shares at 30 cents each on 14 March 2008 pursuant to a placement to raise an amount of $17,700,000 and contributed equity increased by $17,680,706 after costs of capital raising of $19,294.
Option ConversionsDuring the year option holders converted 74,326,004 options into ordinary shares increasing equity by $15,131,200 (refer to note 28(f) for details).
Liquidity and Capital ResourcesThe consolidated cash fl ow statement illustrates that there was an increase in cash and cash equivalents in the year ended 30 June 2008 of $24,456,559 (2007: $27,027,949). The increase in cash infl ow in comparison with the prior year is caused by a number of factors. Financing activities generated $65,987,779 (2007: $43,557,636) of net cash in-fl ows. This increase in comparison to 30 June 2007 is largely due to the placement of 139,000,000 shares to Apac Resources Limited and 59,000,000 shares to Jinchuan Group Limited and to option conversions for a total of $74,010,814 after capital raising costs. This net increase in cash fl ows from fi nancing activities has been offset by an increase in the amount of cash used for investing activities $55,779,632 (2007: $6,219,169), which was mainly attributable to the re-start of the Renison Tin Project.
For
per
sona
l use
onl
y
Director’s Report (continued)
22
There has also been a net increase in the amount of cash from operating activities of $14,248,416 (2007: decrease $10,310,458), which is largely due to an increase in revenue from tin concentrate sales from the Collingwood Tin Project.
The Consolidated Entity’s debt has decreased by $5,716,913 over the last year mainly due to the repayment of unsecured loans of $10,100,000, which was offset by fi nance agreements secured by mobile plant and equipment of $5,947,232 entered into during the year. Of the Consolidated Entity’s debt, 30% is repayable within one year of 30 June 2008, compared to 42% in the previous year.
Capital ExpenditureThere has been an increase in cash used on capital expenditure for 30 June 2008 to $55,779,632 from $6,219,169 in the year ended 30 June 2007 due primarily to the re-start of the Renison Tin Project (including the Mt Bischoff open pit mine). Further capital commitments of $3,120,220 existed at the balance sheet date, principally relating to the construction of residential accommodation and plant refurbishment for the Renison Tin Project.
Operating ResultsThe consolidated operating loss before income tax of the Consolidated Entity attributable to members for the period was $11,968,573 (2007: $23,697,800), down by 49% as compared to the previous year. This result refl ects an increase in income from tin concentrate sales. The consolidated operating loss after tax for the period was $7,993,987 (2007: $2,734,841). This refl ects the recognition in the previous year of an income tax credit of $20,962,959 relating to carried forward losses recognised.
REVIEW OF OPERATIONS
The key activities of the Consolidated Entity are listed below:
TIN PROJECTSDuring the year the Company’s tin projects were:
1. Tasmanian Tin Strategy• Renison Tin Project• Rentails Tin Project• Tasmanian Tin Exploration
2. Far North Queensland Tin Strategy• Collingwood Tin Project• Gillian and Windemere Tin Projects (Gillian sold on 21 February 2008)
TASMANIAN TIN STRATEGY
Renison Tin ProjectThe Renison Tin Project is located approximately 15km NE of Zeehan on Tasmania’s West Coast. The Renison Project is built around the Renison Bell underground mine and the Renison Tin Concentrator. These were both extensively refurbished during the 2005 fi nancial year and operated until October 2005 before being placed on care & maintenance due to low tin prices.
The Mt Bischoff Tin Project is located approximately 80km north of the Renison Project. Mt Bischoff contains a moderately sized open pit resource and an advanced exploration project with considerable potential for additional tin discovery and mining.
During the fi nancial period the Company progressed with the re-start of the Renison Tin Project. Open pit and underground mining had commenced with commissioning of the Concentrator and a ramp up to full capacity underway by the end of the fi nancial period. First tin concentrates from the re-started project were dispatched in July 2008.
The new operating plan for the Renison Tin Project is based predominantly on owner-operated underground mining at the Renison Bell Mine with open pit mining at the Mt Bischoff mine using mining contractors. Ore from both sources are blended at the Tin Concentrator (approx 1/3rd from Mt Bischoff) to create a ROM feedstock averaging 1.5-2.0% Sn. Ore is processed at approximately 85 tonne per hour through the tin concentrator to generate a high grade tin concentrate. The tin concentrate is trucked to port and then shipped to Malaysia or Thailand for smelting into LME grade tin ingots.
For
per
sona
l use
onl
y
Director’s Report (continued)
23
Additional new technology has been incorporated into the Concentrator which is expected to have a positive impact on overall tin recoveries. The revised Renison Project will be upgraded to include a copper circuit that will enable the generation of a copper co-product. The copper circuit is expected to be commissioned in late September 2008.
At full capacity and in steady-state the Renison Project is forecast to produce 8,500 – 10,000 tonnes of tin metal and 1,000 tonnes of copper per annum.
The net operating profi t after income tax for the Renison Project for the fi nancial year was $3,419,908 compared to an operating loss of $3,786,991 for the previous year. The operating profi t for the current fi nancial period is due to the reversal of impairment losses on mine properties and developments costs of $11,042,607 associated with the increase in tin prices during the period, the approval to mine at Mt Bischoff and the re-start of the Renison Project.
There was no revenue from tin concentrate sales from the Renison Project for the fi nancial year or in the previous year due to the project being on care and maintenance during these periods.
Rentails Tin ProjectThe Rentails project is aimed at the re-processing and recovery of tin and copper from an estimated 18.2 million tonnes of tailings at an average grade of 0.42% Tin and 0.20% Copper (containing over 76,000 tonnes of tin and over 36,000 tonnes of copper metal) that remain at the site from the historic processing of tin ores from the Renison Bell mine.
The project has been through a conceptual pre-feasibility study in 2005, which identifi ed that a combination of sulphide fl otation and tin fl otation separation techniques could produce a low-grade concentrate, which could be fumed to produce a saleable tin product. During the fi nancial period a complete phase of pilot testing, including concentration, pilot fuming and gas emissions studies have been completed that confi rm the technical merits of the project.
GR Engineering was commissioned to complete the detailed feasibility on the project. In consultation with and following a review of the available data, there has been a conscious decision by the Company to shift itself along the concentrate grade-tonnage curve to a position of more optimal operating performance and higher overall metal recovery.
This shift change has been from a target of 55% recovery of tin to concentrate and a 15% concentrate grade to that of a 62% recovery of tin to concentrate and a 10% concentrate grade. Coincident with this shift is an associated reduction in operating risk and the optimisation of coincident copper recovery from the process. The consequence of such a shift is an increase in the overall scale of the tin fumer project. This will result in higher capital costs which is expected to be compensated for by improved operating performance and lower operating risk.
The stages of the fl ow sheet remain relatively unchanged and the process fl ow sheet consists of fi ve key stages:
1. Grinding;2. Sulphide Flotation;3. High-G Gravity separation;4. Tin (cassiterite) Flotation; and5. Fuming.
During the fi nancial year, a review of the tailings resource estimate and a complete reconciliation against mill production via the establishment of an historic dam construction plan based upon actual plant outputs was completed. In addition a dam de-construction strategy and ore recovery has been developed which will enable a mining reserve estimate to be fi nalised in August. The fi nal bankable standard feasibility is due for completion in late 2008.
Tasmanian Tin ExplorationPlans for underground tin exploration programs coincident with the ensuing re-start of the Renison project were completed during the period. Renison underground exploration delivered excellent early success, encountering high grade tin and copper mineralisation over considerable widths outside the existing Resource and Reserve.
Underground exploration to extend and in particular upgrade the inferred resources into measured and indicated category commenced during May 2008. A drill rig equipped to drill holes beyond 1,000m vertical to test depth extensions and conceptual targets beneath the existing mine will commence work on the Renison underground
For
per
sona
l use
onl
y
Director’s Report (continued)
24
operation by September 2008. In particular, the key target area is for greisen style mineralisation coinciding with the intersection of the major Federal Basset Fault system and the Pine Hill Granite carapace. This represents an integral part of the Tasmanian Tin Strategy aimed at proving new resources to enhance the development pipeline and complement the conversion of the existing resource base to reserves.
A program of Reverse Circulation drilling at Mt Bischoff aimed at extending the existing resource, providing resource infi ll and waste characterisation at Mt Bischoff and exploring for additional tin mineralisation was completed during the period and a further program has commenced in August 2008.
FAR NORTH QUEENSLAND TIN
Collingwood Tin ProjectThe Company’s Collingwood Tin Project is located in Far North Queensland approximately 30km south of Cooktown.
The Collingwood mine operated for most of the reporting period before being placed on care & maintenance in May 2008. The mine has experienced production shortfalls and these have been associated with three key areas; mine grade estimates, equipment reliability and skilled manpower.
Mine reconciliations for the Collingwood mine continued to under-call in tonnes and grade compared to pre-mining and reserve estimates. During the period forward production estimates were factored based upon historic performance and revised mines plans were developed based upon these parameters. Underground exploration was undertaken during the period to target extensions to the known mineralisation. Drilling returned a number of signifi cant intercepts of narrow zones of tin in greisen showing that the orebody continues to both the north and south and at depth, although depth potential appeared limited due to the narrowing of the lodes.
Metals X made the decision to undertake an orderly closure of the Collingwood Tin Mine and the sale of its other North Queensland tin exploration assets in order to focus its attention on the Renison and Rentails Projects of its Tasmanian Tin Strategy. The operation was successfully put on care and maintenance in May 2008. The project will remain on care and maintenance whilst a review of all options is undertaken.
The net operating loss after income tax for the Collingwood Project for the fi nancial year was $13,202,061 compared to $15,963,251 for the previous year. The operating loss for the current year is higher due to the mine production constraints, termination costs and the impairment of property, plant and equipment and mine properties and development assets of $7,328,432 (2007: $6,493,315). Revenue from tin concentrate sales was $35,562,632 for the period compared to $25,588,717 sales in the previous year.
Collingwood Project performance is summarised below:
Mining 2008 2007Ore Hoisted 232,003 tonnes 251,530 tonnesGrade 0.87 % Sn 1.03 % Sn
Tin ConcentrationTonnes Processed 232,297 tonnes 251,130 tonnesGrade 0.87 % Sn 1.01 % SnRecovery to Conc. 80% 76%Concentrate Grade 57% Sn 59% SnSn Metal Produced 1,632 tonnes Sn metal 1,917 tonnes Sn metalSn Metal Sales 1,773 tonnes Sn metal 1,686 tonnes Sn metal
Gillian & Windemere Tin ProspectsThe Company signed option agreements on 17 October 2007 to sell the Gillian prospect for $250,000 in cash and a royalty of 1.5% of total tin sales and subject to renewal of the title, the Windemere prospect for $1 in cash and a royalty of 1.5% of total tin sales to Consolidated Tin Mines Ltd. The transactions were contingent upon Consolidated Tin Mines Ltd listing on the ASX.
Consolidated Tin Mines Ltd exercised the option to acquire the Gillian tenement on 21 February and subsequently listed on the ASX on 26 February 2008.
For
per
sona
l use
onl
y
Director’s Report (continued)
25
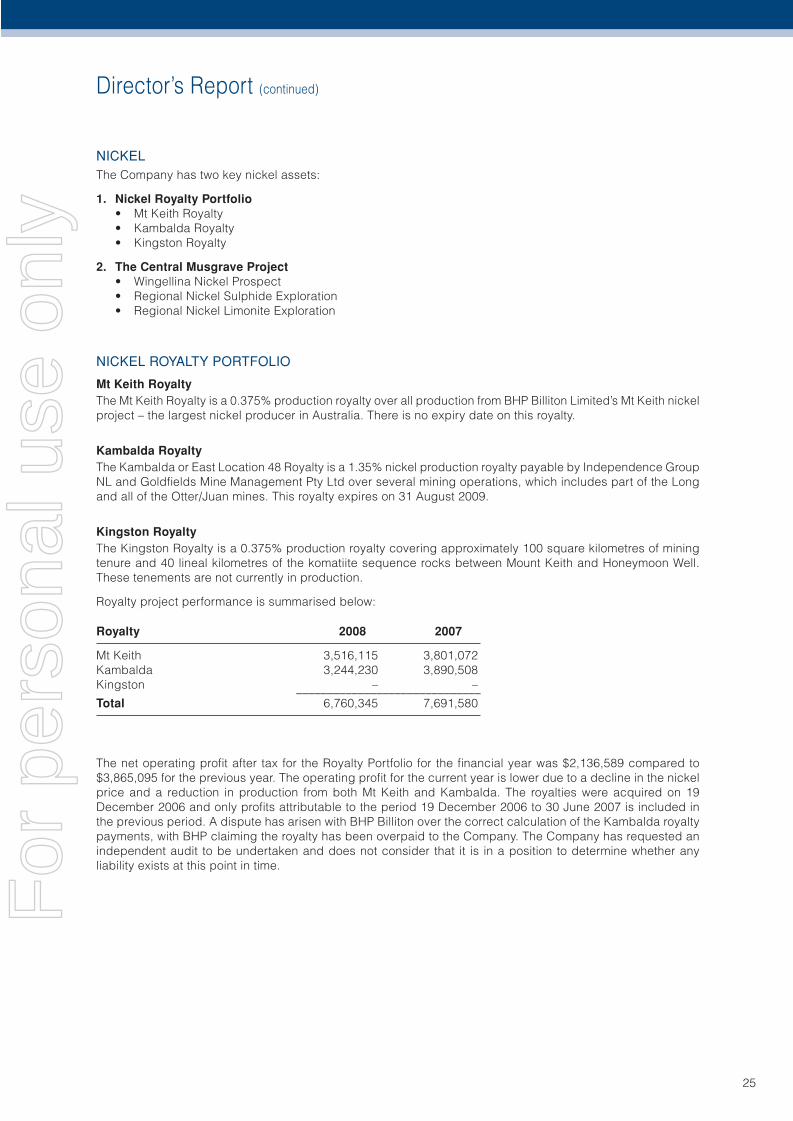
NICKELThe Company has two key nickel assets:
1. Nickel Royalty Portfolio• Mt Keith Royalty• Kambalda Royalty• Kingston Royalty
2. The Central Musgrave Project• Wingellina Nickel Prospect• Regional Nickel Sulphide Exploration• Regional Nickel Limonite Exploration
NICKEL ROYALTY PORTFOLIO
Mt Keith RoyaltyThe Mt Keith Royalty is a 0.375% production royalty over all production from BHP Billiton Limited’s Mt Keith nickel project – the largest nickel producer in Australia. There is no expiry date on this royalty.
Kambalda RoyaltyThe Kambalda or East Location 48 Royalty is a 1.35% nickel production royalty payable by Independence Group NL and Goldfi elds Mine Management Pty Ltd over several mining operations, which includes part of the Long and all of the Otter/Juan mines. This royalty expires on 31 August 2009.
Kingston RoyaltyThe Kingston Royalty is a 0.375% production royalty covering approximately 100 square kilometres of mining tenure and 40 lineal kilometres of the komatiite sequence rocks between Mount Keith and Honeymoon Well. These tenements are not currently in production.
Royalty project performance is summarised below:
Royalty 2008 2007
Mt Keith 3,516,115 3,801,072Kambalda 3,244,230 3,890,508Kingston – – ______________________________Total 6,760,345 7,691,580
The net operating profi t after tax for the Royalty Portfolio for the fi nancial year was $2,136,589 compared to $3,865,095 for the previous year. The operating profi t for the current year is lower due to a decline in the nickel price and a reduction in production from both Mt Keith and Kambalda. The royalties were acquired on 19 December 2006 and only profi ts attributable to the period 19 December 2006 to 30 June 2007 is included in the previous period. A dispute has arisen with BHP Billiton over the correct calculation of the Kambalda royalty payments, with BHP claiming the royalty has been overpaid to the Company. The Company has requested an independent audit to be undertaken and does not consider that it is in a position to determine whether any liability exists at this point in time.
For
per
sona
l use
onl
y
Director’s Report (continued)
26
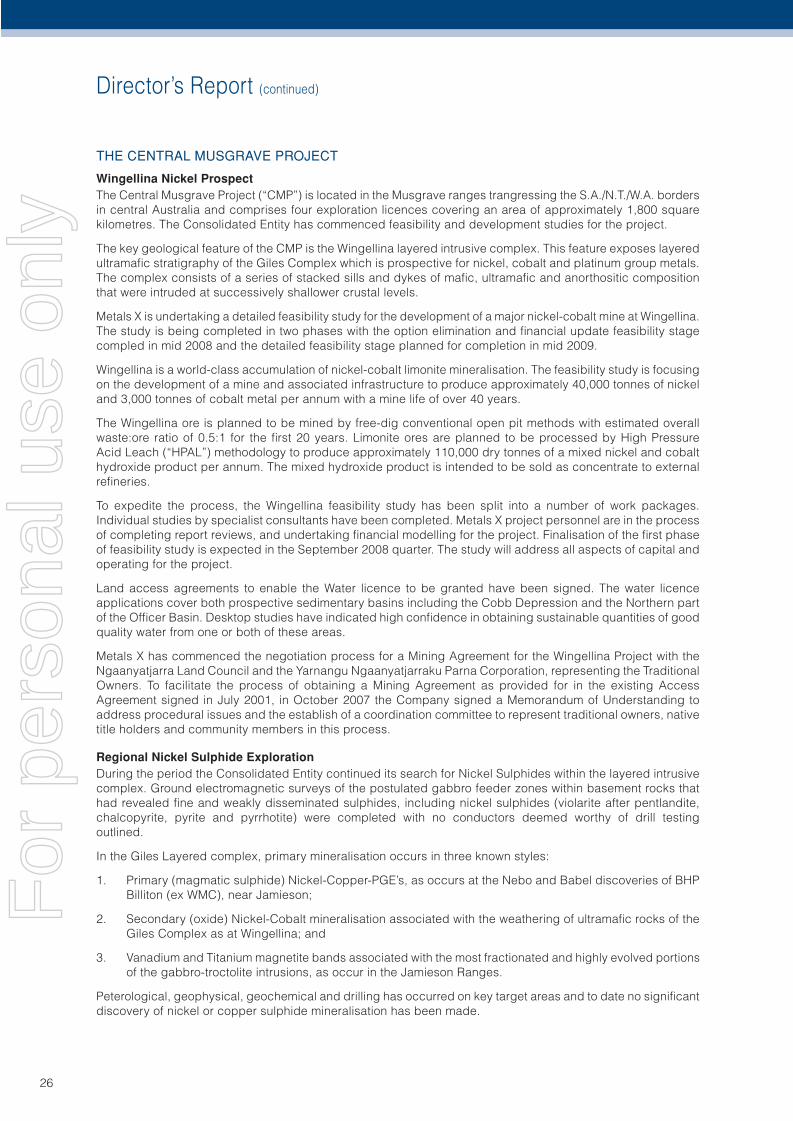
THE CENTRAL MUSGRAVE PROJECT
Wingellina Nickel ProspectThe Central Musgrave Project (“CMP”) is located in the Musgrave ranges trangressing the S.A./N.T./W.A. borders in central Australia and comprises four exploration licences covering an area of approximately 1,800 square kilometres. The Consolidated Entity has commenced feasibility and development studies for the project.
The key geological feature of the CMP is the Wingellina layered intrusive complex. This feature exposes layered ultramafi c stratigraphy of the Giles Complex which is prospective for nickel, cobalt and platinum group metals. The complex consists of a series of stacked sills and dykes of mafi c, ultramafi c and anorthositic composition that were intruded at successively shallower crustal levels.
Metals X is undertaking a detailed feasibility study for the development of a major nickel-cobalt mine at Wingellina. The study is being completed in two phases with the option elimination and fi nancial update feasibility stage compled in mid 2008 and the detailed feasibility stage planned for completion in mid 2009.
Wingellina is a world-class accumulation of nickel-cobalt limonite mineralisation. The feasibility study is focusing on the development of a mine and associated infrastructure to produce approximately 40,000 tonnes of nickel and 3,000 tonnes of cobalt metal per annum with a mine life of over 40 years.
The Wingellina ore is planned to be mined by free-dig conventional open pit methods with estimated overall waste:ore ratio of 0.5:1 for the fi rst 20 years. Limonite ores are planned to be processed by High Pressure Acid Leach (“HPAL”) methodology to produce approximately 110,000 dry tonnes of a mixed nickel and cobalt hydroxide product per annum. The mixed hydroxide product is intended to be sold as concentrate to external refi neries.
To expedite the process, the Wingellina feasibility study has been split into a number of work packages. Individual studies by specialist consultants have been completed. Metals X project personnel are in the process of completing report reviews, and undertaking fi nancial modelling for the project. Finalisation of the fi rst phase of feasibility study is expected in the September 2008 quarter. The study will address all aspects of capital and operating for the project.
Land access agreements to enable the Water licence to be granted have been signed. The water licence applications cover both prospective sedimentary basins including the Cobb Depression and the Northern part of the Offi cer Basin. Desktop studies have indicated high confi dence in obtaining sustainable quantities of good quality water from one or both of these areas.
Metals X has commenced the negotiation process for a Mining Agreement for the Wingellina Project with the Ngaanyatjarra Land Council and the Yarnangu Ngaanyatjarraku Parna Corporation, representing the Traditional Owners. To facilitate the process of obtaining a Mining Agreement as provided for in the existing Access Agreement signed in July 2001, in October 2007 the Company signed a Memorandum of Understanding to address procedural issues and the establish of a coordination committee to represent traditional owners, native title holders and community members in this process.
Regional Nickel Sulphide ExplorationDuring the period the Consolidated Entity continued its search for Nickel Sulphides within the layered intrusive complex. Ground electromagnetic surveys of the postulated gabbro feeder zones within basement rocks that had revealed fi ne and weakly disseminated sulphides, including nickel sulphides (violarite after pentlandite, chalcopyrite, pyrite and pyrrhotite) were completed with no conductors deemed worthy of drill testing outlined.
In the Giles Layered complex, primary mineralisation occurs in three known styles:
1. Primary (magmatic sulphide) Nickel-Copper-PGE’s, as occurs at the Nebo and Babel discoveries of BHP Billiton (ex WMC), near Jamieson;
2. Secondary (oxide) Nickel-Cobalt mineralisation associated with the weathering of ultramafi c rocks of the Giles Complex as at Wingellina; and
3. Vanadium and Titanium magnetite bands associated with the most fractionated and highly evolved portions of the gabbro-troctolite intrusions, as occur in the Jamieson Ranges.
Peterological, geophysical, geochemical and drilling has occurred on key target areas and to date no signifi cant discovery of nickel or copper sulphide mineralisation has been made.
For
per
sona
l use
onl
y
Director’s Report (continued)
27
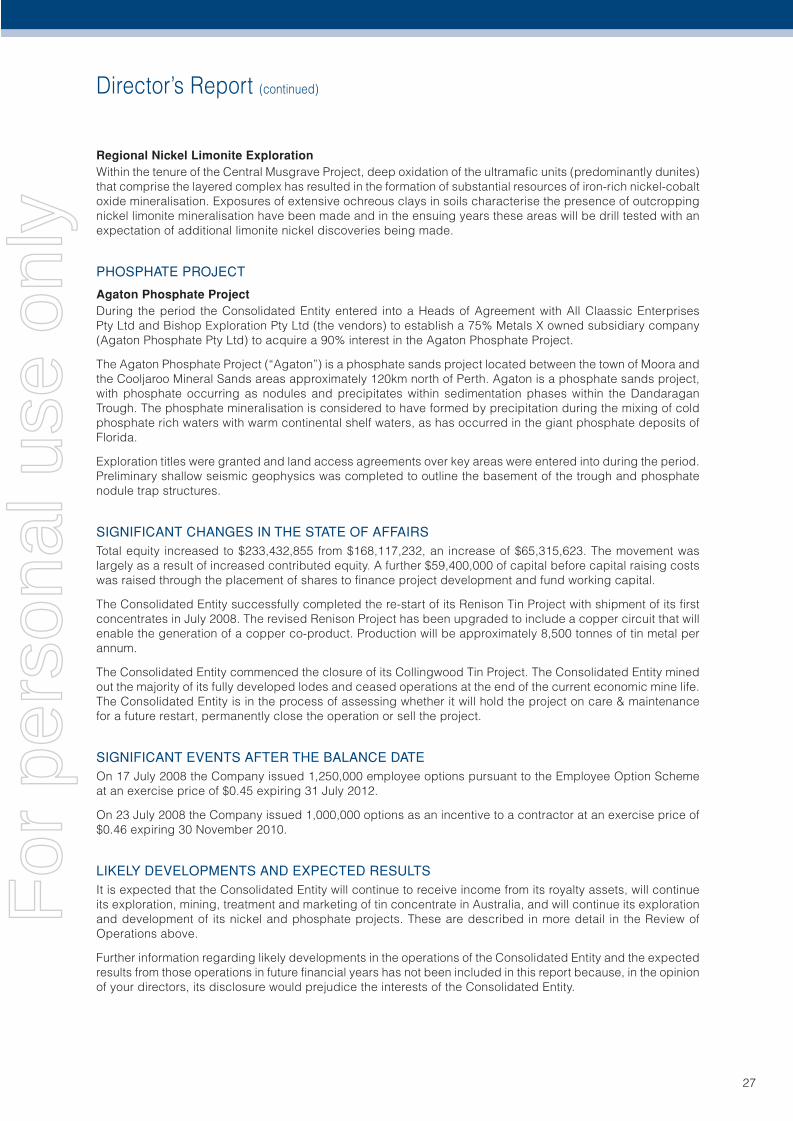
Regional Nickel Limonite ExplorationWithin the tenure of the Central Musgrave Project, deep oxidation of the ultramafi c units (predominantly dunites) that comprise the layered complex has resulted in the formation of substantial resources of iron-rich nickel-cobalt oxide mineralisation. Exposures of extensive ochreous clays in soils characterise the presence of outcropping nickel limonite mineralisation have been made and in the ensuing years these areas will be drill tested with an expectation of additional limonite nickel discoveries being made.
PHOSPHATE PROJECT
Agaton Phosphate ProjectDuring the period the Consolidated Entity entered into a Heads of Agreement with All Claassic Enterprises Pty Ltd and Bishop Exploration Pty Ltd (the vendors) to establish a 75% Metals X owned subsidiary company (Agaton Phosphate Pty Ltd) to acquire a 90% interest in the Agaton Phosphate Project.
The Agaton Phosphate Project (“Agaton”) is a phosphate sands project located between the town of Moora and the Cooljaroo Mineral Sands areas approximately 120km north of Perth. Agaton is a phosphate sands project, with phosphate occurring as nodules and precipitates within sedimentation phases within the Dandaragan Trough. The phosphate mineralisation is considered to have formed by precipitation during the mixing of cold phosphate rich waters with warm continental shelf waters, as has occurred in the giant phosphate deposits of Florida.
Exploration titles were granted and land access agreements over key areas were entered into during the period. Preliminary shallow seismic geophysics was completed to outline the basement of the trough and phosphate nodule trap structures.
SIGNIFICANT CHANGES IN THE STATE OF AFFAIRSTotal equity increased to $233,432,855 from $168,117,232, an increase of $65,315,623. The movement was largely as a result of increased contributed equity. A further $59,400,000 of capital before capital raising costs was raised through the placement of shares to fi nance project development and fund working capital.
The Consolidated Entity successfully completed the re-start of its Renison Tin Project with shipment of its fi rst concentrates in July 2008. The revised Renison Project has been upgraded to include a copper circuit that will enable the generation of a copper co-product. Production will be approximately 8,500 tonnes of tin metal per annum.
The Consolidated Entity commenced the closure of its Collingwood Tin Project. The Consolidated Entity mined out the majority of its fully developed lodes and ceased operations at the end of the current economic mine life. The Consolidated Entity is in the process of assessing whether it will hold the project on care & maintenance for a future restart, permanently close the operation or sell the project.
SIGNIFICANT EVENTS AFTER THE BALANCE DATEOn 17 July 2008 the Company issued 1,250,000 employee options pursuant to the Employee Option Scheme at an exercise price of $0.45 expiring 31 July 2012.
On 23 July 2008 the Company issued 1,000,000 options as an incentive to a contractor at an exercise price of $0.46 expiring 30 November 2010.
LIKELY DEVELOPMENTS AND EXPECTED RESULTSIt is expected that the Consolidated Entity will continue to receive income from its royalty assets, will continue its exploration, mining, treatment and marketing of tin concentrate in Australia, and will continue its exploration and development of its nickel and phosphate projects. These are described in more detail in the Review of Operations above.
Further information regarding likely developments in the operations of the Consolidated Entity and the expected results from those operations in future fi nancial years has not been included in this report because, in the opinion of your directors, its disclosure would prejudice the interests of the Consolidated Entity.
For
per
sona
l use
onl
y
Director’s Report (continued)
28
ENVIRONMENTAL REGULATION AND PERFORMANCEThe Consolidated Entity’s activities are subject to the relevant environmental protection legislation (Commonwealth and State legislation) at its projects. The Consolidated Entity believes that sound environmental practice is not only a management obligation but the responsibility of every employee and contractor.
During the period our achievements in the environmental area included:
• Continued focus on environmental management; and• Continuous review and improvement of our environmental management systems across all projects.
Bluestone Nominees Pty Ltd the Operator of the Collingwood Tin Mine received a $600 infringement notice during the period as a result of a hydrocarbons discharge from the waste oil sump and a hydraulic leak on an out of service drilling rig.
SHARE OPTIONS
Unissued sharesAs at the date of this report, there were 139,399,196 unissued ordinary shares under option (137,149,596 at reporting date), refer to note 28(e) for further details.
There are no participating rights or entitlements inherent in the options and option holders are not entitled to participate in new issues of capital or bonus issues offered or made to shareholders during the currency of the options.
Shares issued as a result of exercising optionsDuring the fi nancial year 74,326,004 options were exercised to acquire fully paid ordinary shares in the Company at a weighted average exercise price of $0.20, refer to note 28(f) for further details.
INDEMNIFICATION AND INSURANCE OF DIRECTORS AND OFFICERSDuring the fi nancial year, the Company paid a premium in respect to a contract of insurance to insure Directors and offi cers of the Company and related bodies corporate against those liabilities for which insurance is permitted under section 199B of the Corporations Act 2001. Disclosure of the nature of the liabilities and the amount of the premium is prohibited under the conditions of the contract of insurance.
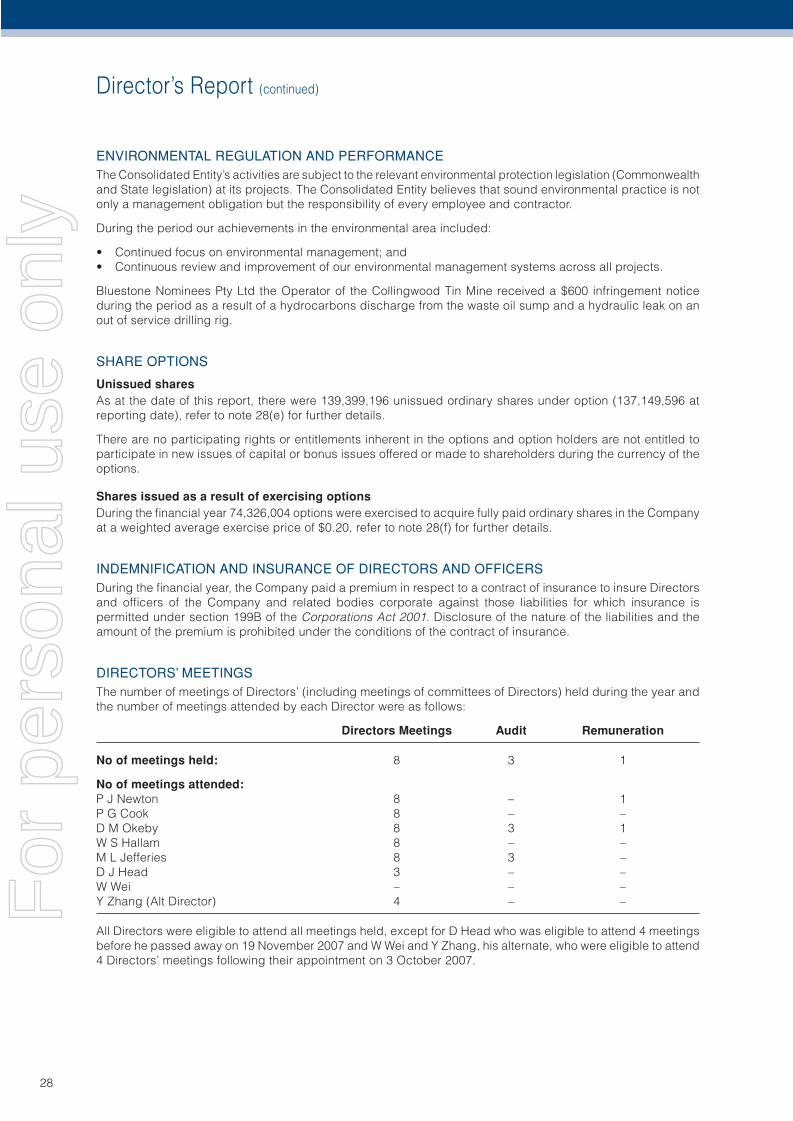
DIRECTORS’ MEETINGSThe number of meetings of Directors’ (including meetings of committees of Directors) held during the year and the number of meetings attended by each Director were as follows:
Directors Meetings Audit Remuneration
No of meetings held: 8 3 1
No of meetings attended:P J Newton 8 – 1P G Cook 8 – –D M Okeby 8 3 1W S Hallam 8 – –M L Jefferies 8 3 –D J Head 3 – –W Wei – – –Y Zhang (Alt Director) 4 – –
All Directors were eligible to attend all meetings held, except for D Head who was eligible to attend 4 meetings before he passed away on 19 November 2007 and W Wei and Y Zhang, his alternate, who were eligible to attend 4 Directors’ meetings following their appointment on 3 October 2007.
For
per
sona
l use
onl
y
Director’s Report (continued)
29
Committee MembershipAs at the date of this report, the Company had an Audit Committee and a Remuneration Committee of the Board of Directors.
Members acting on the committees of the Board during the year were:
Audit RemunerationM L Jefferies * P J Newton *D M Okeby D M OkebyF J Van Maanen ** M L Jefferies
Notes:
* Designates the Chairman of the Committee.** Mrs Van Maanen is the Company Secretary and is not a Director.
REMUNERATION REPORT (Audited)This remuneration report outlines the director and executive remuneration arrangements of the Consolidated Entity in accordance with the Corporations Act 2001 and its Regulations. For the purposes of this report Key Management Personnel (“KMP”) of the Consolidated Entity are defi ned as those persons having authority and responsibility for planning, directing and controlling the major activities of the Company and the Consolidated Entity, directly or indirectly, including any Director (whether executive or otherwise) of the parent company, and includes the fi ve executives in the parent and the Consolidated Entity receiving the highest remuneration.
For the purposes of this remuneration report, the term ‘executive’ encompasses the Managing Director, senior executives, general managers and secretary of the parent and the Consolidated Entity.
Remuneration CommitteeThe Remuneration Committee of the Board of Directors of the Company is responsible for determining and reviewing remuneration arrangements for the Board and executives.
The Remuneration Committee assesses the appropriateness of the nature and amount of remuneration of executives on a periodic basis by reference to relevant employment market conditions with the overall objective of ensuring maximum stakeholder benefi t from the retention of a high quality, high performing Board and executive team.
Remuneration PhilosophyThe performance of the Company depends upon the quality of its Directors and executives. To prosper, the company must attract, motivate and retain highly skilled Directors and executives.
To this end, the company embodies the following principles in its remuneration framework:
• retention and motivation of key executives;• attraction of quality management to the Company; and• performance incentives which allow executives to share the rewards of the success of the Company.
Remuneration StructureIn accordance with best practice corporate governance, the structure of non-executive director and senior executive remuneration is separate and distinct.F
or p
erso
nal u
se o
nly
Director’s Report (continued)
30
REMUNERATION REPORT (Audited) (continued)
Non-executive Director Remuneration
ObjectiveThe Board seeks to set aggregate remuneration at a level which provides the Company with the ability to attract and retain Directors of the highest calibre, whilst incurring a cost which is acceptable to shareholders.
StructureThe Constitution and the ASX Listing Rules specify that the aggregate remuneration of non-executive directors shall be determined from time to time by a general meeting. The latest determination was on the incorporation of the Company (23 July 2004) and the remuneration was set at $40,000 (excluding superannuation) per year for each non-executive Director, except for Mr Okeby who receives $1,853 (including superannuation) per day for each day worked on behalf of the Company.
The amount of aggregate remuneration and the fee structure is reviewed annually. The Board considers advice from external consultants as well as the fees paid to non-executive Directors of comparable companies when undertaking the annual review process.
Non-executive Directors have long been encouraged by the Board to hold shares in the Company. The shares are purchased at the prevailing market share price. The non-executive Directors are entitled to receive retirement benefi ts and to participate in any incentive programs. There are currently no specifi c incentive programs.
The remuneration report for the non-executive Directors for the year ending 30 June 2008 and 30 June 2007 is detailed in Table 1 and Table 2 respectively of this report.
Executive RemunerationObjectiveThe Company aims to reward executives with a level and mix of remuneration commensurate with their position and responsibilities within the Company. The current remuneration policy adopted is that no element of any executive package be directly related to the Company’s fi nancial performance. Indeed there are no elements of any executive remuneration that are dependent upon the satisfaction of any specifi c condition. Remuneration is not linked to the performance of the Company but rather on the ability to attract and retain executives of the highest calibre. The overall remuneration policy framework however is structured in an endeavour to advance/create shareholder wealth.
StructureIn determining the level and make-up of executive remuneration, the Remuneration Committee engages external consultants as needed to provide independent advice.
Remuneration consists of the following key elements:
• Fixed remuneration (base salary and superannuation); and• Variable remuneration (share options).
The proportion of fi xed remuneration and variable remuneration for each executive for the period ending 30 June 2008 and 30 June 2007 are set out in Table 1 and Table 2.
Fixed RemunerationObjectiveFixed remuneration is reviewed annually by the Remuneration Committee. The process consists of a review of the Company, business unit and individual performance, relevant comparative remuneration in the market and internally and, where appropriate, external advice on policies and practices. As noted above, the Committee has access to external advice independent of management.
StructureExecutives are given the opportunity to receive their fi xed (primary) remuneration in a variety of forms including cash and fringe benefi ts such as motor vehicles. It is intended that the manner of payment chosen will be optimal for the recipient without creating undue cost for the Company.
The fi xed remuneration component for executives for the period ending 30 June 2008 and 30 June 2007 are set out in Table 1 and Table 2.
For
per
sona
l use
onl
y
Director’s Report (continued)
31
REMUNERATION REPORT (Audited) (continued)
Variable Remuneration – Long Term Incentive (LTI)
ObjectiveThe objective of the LTI plan is to reward executives in a manner that aligns remuneration with the creation of shareholder wealth.
LTI grants to executives are delivered in the form of shares options under the Metals X Limited Employee Option Scheme. The scheme has no direct performance requirements but has specifi ed time restrictions on the exercise of options.The granting of options is in substance a performance incentive which allows executives to share the rewards of the success of the Company. The share options will vest after one year and executives are able to exercise the share options for up to three years after vesting before the options lapse. Where a participant ceases employment prior to the vesting of their share options, the share options are forfeited. Where a participant ceases employment after the vesting of their share options, the share options automatically lapse after six months of ceasing employment. Table 3 provides details of LTI options granted and the value of options granted, exercised and lapsed during the year.
The Company does not have a policy to prohibit executives from entering into arrangements to protect the value of unvested LTI awards.
Employment Contracts
Managing DirectorThe Managing Director, Mr Cook is employed under an annual salary employment contract. The current employment contract commenced on 1 June 2004. Under the terms of the present contract:
• Mr Cook receives a fi xed remuneration of $475,000 (excluding superannuation) per annum.
• Mr Cook may resign from his position and thus terminate this contract by giving three months written notice. On resignation any unvested options will be forfeited.
• The Company may terminate this employment agreement by providing three months written notice or providing payment in lieu of notice period (based on the fi xed component of Mr Cook’s remuneration). On termination on notice by the Company, any LTI options that have vested or that will vest during the notice period will be released.
• The Company may terminate the contract at any time without notice if serious misconduct has occurred. Where termination with cause occurs the Managing Director is only entitled to that portion of remuneration that is fi xed, and only up to the date of termination. On termination with cause by the Company, any LTI options that have vested will be released. LTI options that have not yet vested will be forfeited.
Other Executive DirectorsMr Okeby became a Non-Executive Director on 13 August 2007 and receives $1,853 (including superannuation) per day for each day worked on behalf of the Company. Mr Hallam is employed under an annual salary employment contract and receives a fi xed remuneration of $400,000 (excluding superannuation) per annum. The other terms of the employment contracts are:
• Executive Directors may resign from their position and thus terminate their contract by giving three months written notice. On resignation any unvested options will be forfeited.
• The Company may terminate the employment agreement by providing three months written notice or providing payment in lieu of notice period (based on the fi xed component of the executive director’s remuneration). On termination on notice by the Company, any LTI options that have vested or that will vest during the notice period will be released. LTI options that have not yet vested will be forfeited.
• The Company may terminate the contract at any time without notice if serious misconduct has occurred. Where termination with cause occurs the executive director is only entitled to that portion of remuneration that is fi xed, and only up to the date of termination. On termination with cause by the Company, any LTI options that have vested will be released. LTI options that have not yet vested will be forfeited.
For
per
sona
l use
onl
y
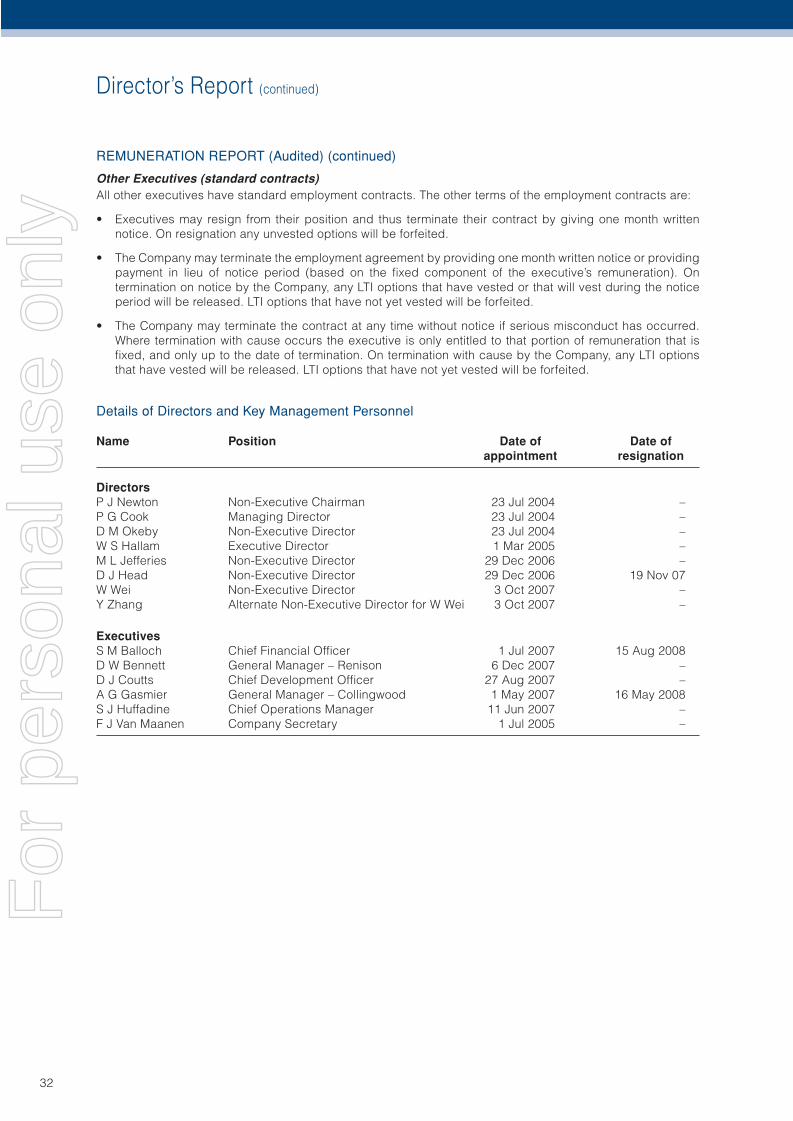
Director’s Report (continued)
32
REMUNERATION REPORT (Audited) (continued)
Other Executives (standard contracts)All other executives have standard employment contracts. The other terms of the employment contracts are:
• Executives may resign from their position and thus terminate their contract by giving one month written notice. On resignation any unvested options will be forfeited.
• The Company may terminate the employment agreement by providing one month written notice or providing payment in lieu of notice period (based on the fi xed component of the executive’s remuneration). On termination on notice by the Company, any LTI options that have vested or that will vest during the notice period will be released. LTI options that have not yet vested will be forfeited.
• The Company may terminate the contract at any time without notice if serious misconduct has occurred. Where termination with cause occurs the executive is only entitled to that portion of remuneration that is fi xed, and only up to the date of termination. On termination with cause by the Company, any LTI options that have vested will be released. LTI options that have not yet vested will be forfeited.
Details of Directors and Key Management Personnel
Name Position Date of Date of appointment resignation
DirectorsP J Newton Non-Executive Chairman 23 Jul 2004 –P G Cook Managing Director 23 Jul 2004 –D M Okeby Non-Executive Director 23 Jul 2004 –W S Hallam Executive Director 1 Mar 2005 –M L Jefferies Non-Executive Director 29 Dec 2006 –D J Head Non-Executive Director 29 Dec 2006 19 Nov 07W Wei Non-Executive Director 3 Oct 2007 –Y Zhang Alternate Non-Executive Director for W Wei 3 Oct 2007 –
ExecutivesS M Balloch Chief Financial Offi cer 1 Jul 2007 15 Aug 2008D W Bennett General Manager – Renison 6 Dec 2007 –D J Coutts Chief Development Offi cer 27 Aug 2007 –A G Gasmier General Manager – Collingwood 1 May 2007 16 May 2008S J Huffadine Chief Operations Manager 11 Jun 2007 –F J Van Maanen Company Secretary 1 Jul 2005 –
B
For
per
sona
l use
onl
y
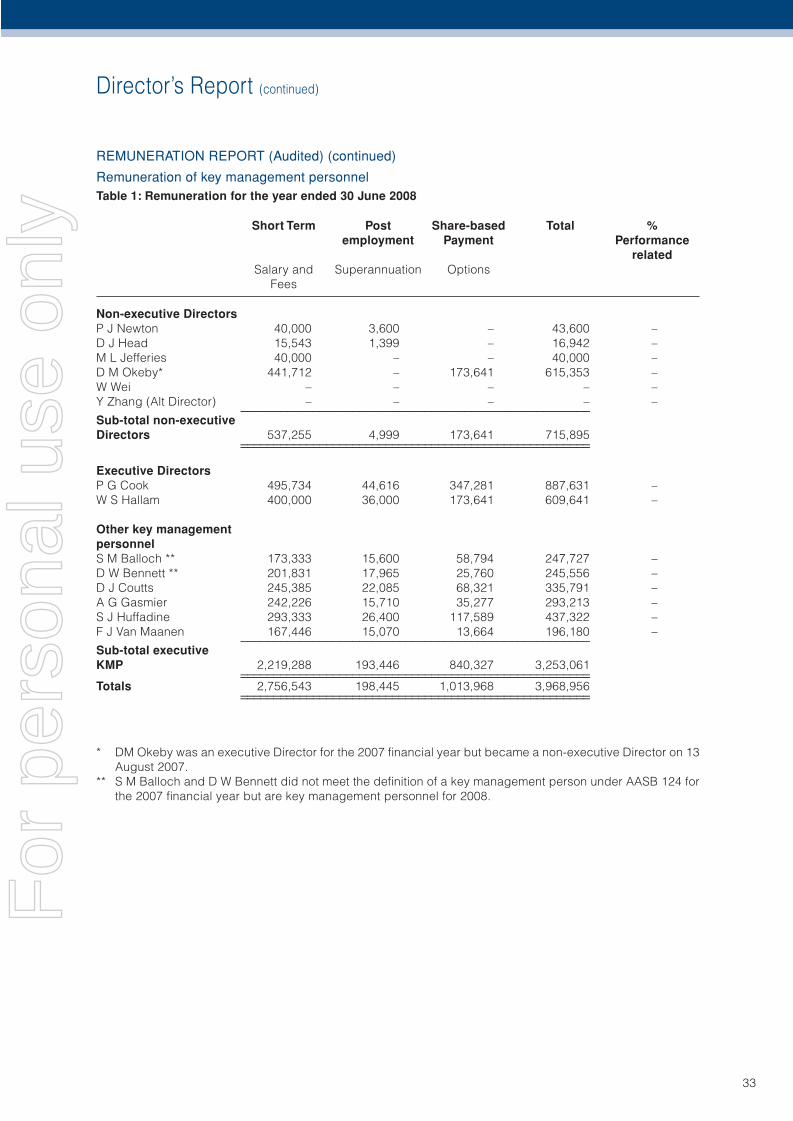
Director’s Report (continued)
33
REMUNERATION REPORT (Audited) (continued)
Remuneration of key management personnelTable 1: Remuneration for the year ended 30 June 2008
Short Term Post Share-based Total % employment Payment Performance related Salary and Superannuation Options Fees
Non-executive DirectorsP J Newton 40,000 3,600 – 43,600 –D J Head 15,543 1,399 – 16,942 –M L Jefferies 40,000 – – 40,000 –D M Okeby* 441,712 – 173,641 615,353 –W Wei – – – – –Y Zhang (Alt Director) – – – – – _____________________________________________________Sub-total non-executive Directors 537,255 4,999 173,641 715,895 _____________________________________________________ _____________________________________________________
Executive DirectorsP G Cook 495,734 44,616 347,281 887,631 –W S Hallam 400,000 36,000 173,641 609,641 –
Other key management personnelS M Balloch ** 173,333 15,600 58,794 247,727 –D W Bennett ** 201,831 17,965 25,760 245,556 –D J Coutts 245,385 22,085 68,321 335,791 –A G Gasmier 242,226 15,710 35,277 293,213 –S J Huffadine 293,333 26,400 117,589 437,322 –F J Van Maanen 167,446 15,070 13,664 196,180 – _____________________________________________________Sub-total executive KMP 2,219,288 193,446 840,327 3,253,061 _____________________________________________________ _____________________________________________________Totals 2,756,543 198,445 1,013,968 3,968,956 _____________________________________________________ _____________________________________________________
* DM Okeby was an executive Director for the 2007 fi nancial year but became a non-executive Director on 13 August 2007.
** S M Balloch and D W Bennett did not meet the defi nition of a key management person under AASB 124 for the 2007 fi nancial year but are key management personnel for 2008.
For
per
sona
l use
onl
y
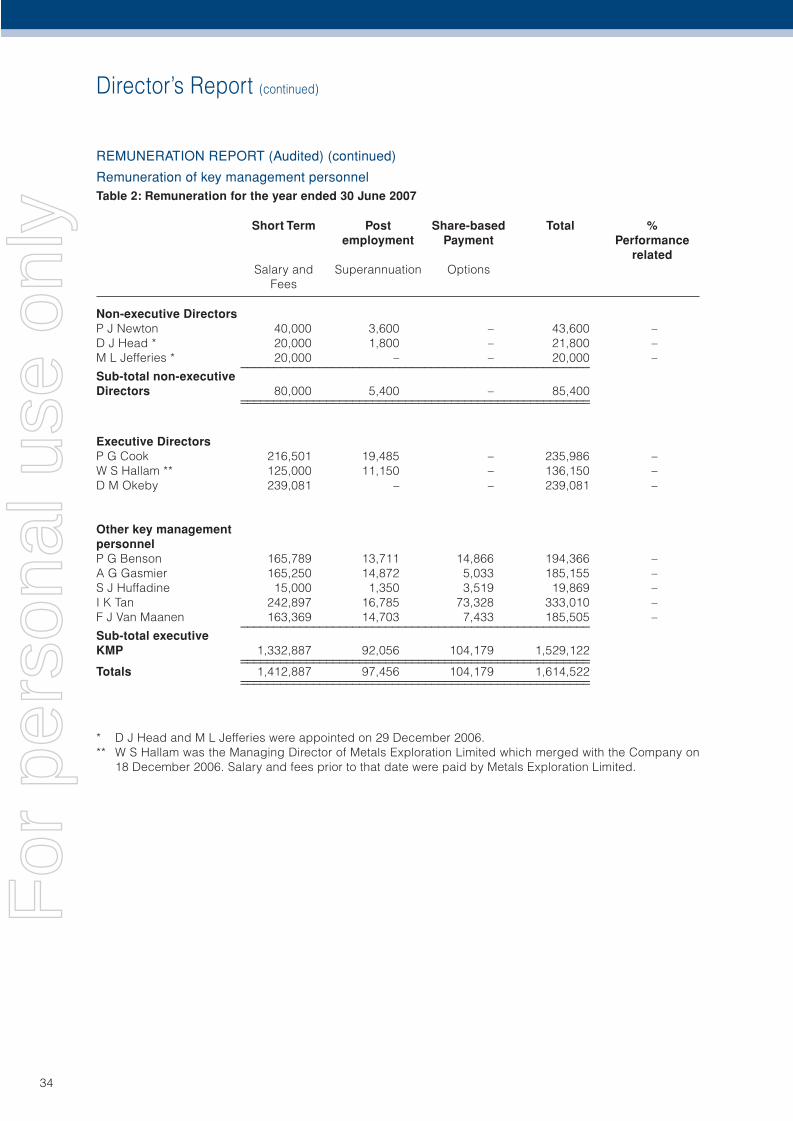
Director’s Report (continued)
34
REMUNERATION REPORT (Audited) (continued)
Remuneration of key management personnelTable 2: Remuneration for the year ended 30 June 2007
Short Term Post Share-based Total % employment Payment Performance related Salary and Superannuation Options Fees
Non-executive DirectorsP J Newton 40,000 3,600 – 43,600 –D J Head * 20,000 1,800 – 21,800 –M L Jefferies * 20,000 – – 20,000 – _____________________________________________________Sub-total non-executive Directors 80,000 5,400 – 85,400 _____________________________________________________ _____________________________________________________
Executive DirectorsP G Cook 216,501 19,485 – 235,986 –W S Hallam ** 125,000 11,150 – 136,150 –D M Okeby 239,081 – – 239,081 –
Other key management personnelP G Benson 165,789 13,711 14,866 194,366 –A G Gasmier 165,250 14,872 5,033 185,155 –S J Huffadine 15,000 1,350 3,519 19,869 –I K Tan 242,897 16,785 73,328 333,010 –F J Van Maanen 163,369 14,703 7,433 185,505 – _____________________________________________________Sub-total executive KMP 1,332,887 92,056 104,179 1,529,122 _____________________________________________________ _____________________________________________________Totals 1,412,887 97,456 104,179 1,614,522 _____________________________________________________ _____________________________________________________
* D J Head and M L Jefferies were appointed on 29 December 2006.** W S Hallam was the Managing Director of Metals Exploration Limited which merged with the Company on
18 December 2006. Salary and fees prior to that date were paid by Metals Exploration Limited.
For
per
sona
l use
onl
y
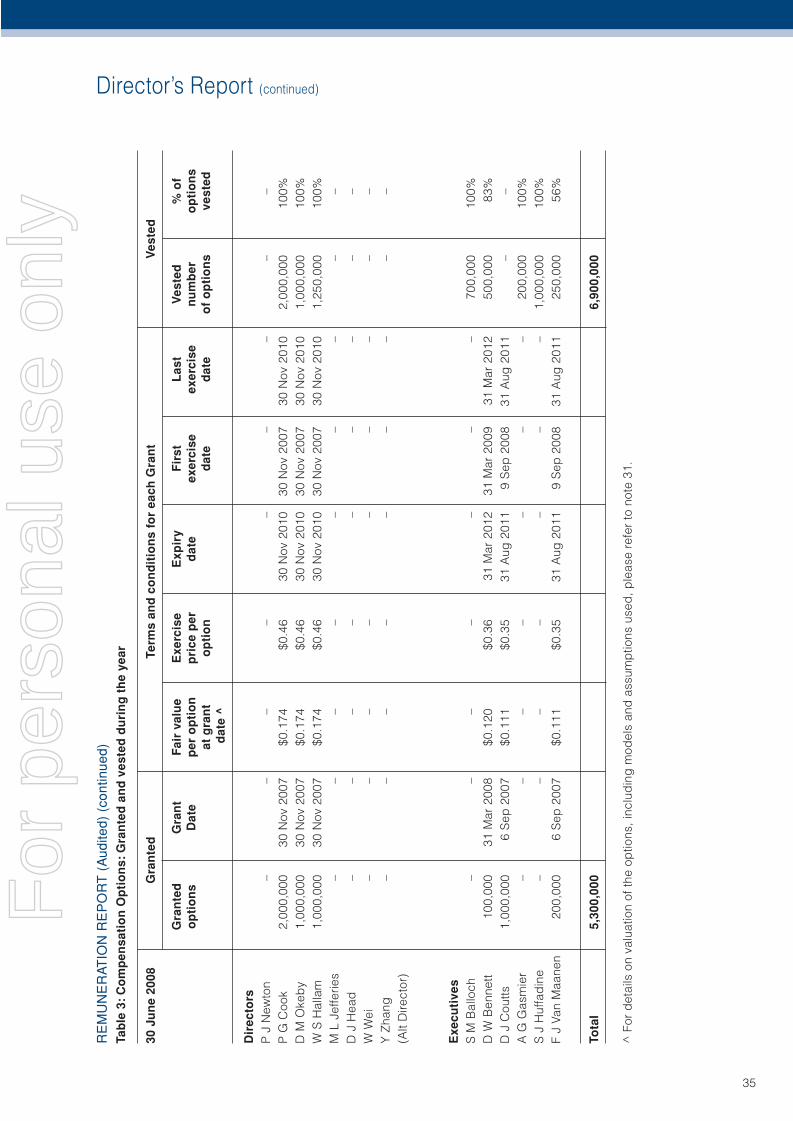
Director’s Report (continued)
35
RE
MU
NE
RAT
ION
RE
PO
RT
(A
udite
d) (
cont
inue
d)Ta
ble
3:
Co
mp
ensa
tio
n O
pti
on
s: G
ran
ted
an
d v
este
d d
uri
ng
th
e ye
ar
30 J
un
e 20
08
Gra
nte
d
Term
s an
d c
on
dit
ion
s fo
r ea
ch G
ran
t V
este
d
G
ran
ted
G
ran
t F
air
valu
e E
xerc
ise
Exp
iry
Fir
st
Las
t V
este
d
% o
f
op
tio
ns
Dat
e p
er o
pti
on
p
rice
per
d
ate
exer
cise
ex
erci
se
nu
mb
er
op
tio
ns
at
gra
nt
op
tio
n
d
ate
dat
e o
f o
pti
on
s ve
sted
d
ate
^
Dir
ecto
rsP
J N
ewto
n –
– –
– –
– –
– –
P G
Coo
k 2,
000,
000
30 N
ov 2
007
$0.1
74
$0.4
6 30
Nov
201
0 30
Nov
200
7 30
Nov
201
0 2,
000,
000
100%
D M
Oke
by
1,00
0,00
0 30
Nov
200
7 $0
.174
$0
.46
30 N
ov 2
010
30 N
ov 2
007
30 N
ov 2
010
1,00
0,00
0 10
0%W
S H
alla
m
1,00
0,00
0 30
Nov
200
7 $0
.174
$0
.46
30 N
ov 2
010
30 N
ov 2
007
30 N
ov 2
010
1,25
0,00
0 10
0%M
L J
effe
ries
– –
– –
– –
– –
–D
J H
ead
–
– –
– –
– –
– –
W W
ei
– –
– –
– –
– –
–Y
Zha
ng
– –
– –
– –
– –
–(A
lt D
irect
or)
Exe
cuti
ves
S M
Bal
loch
–
– –
– –
– –
700,
000
100%
D W
Ben
nett
100,
000
31 M
ar 2
008
$0.1
20
$0.3
6 31
Mar
201
2 31
Mar
200
9 31
Mar
201
2 50
0,00
0 83
%D
J C
outts
1,
000,
000
6 S
ep 2
007
$0.1
11
$0.3
5 31
Aug
201
1 9
Sep
200
8 31
Aug
201
1 –
–A
G G
asm
ier
– –
– –
– –
– 20
0,00
0 10
0%S
J H
uffa
din
e –
– –
– –
– –
1,00
0,00
0 10
0%F
J Va
n M
aane
n 20
0,00
0 6
Sep
200
7 $0
.111
$0
.35
31 A
ug 2
011
9 S
ep 2
008
31 A
ug 2
011
250,
000
56%
Tota
l 5,
300,
000
6,90
0,00
0
^ F
or d
etai
ls o
n va
luat
ion
of th
e op
tions
, inc
lud
ing
mod
els
and
ass
ump
tions
use
d, p
leas
e re
fer
to n
ote
31.
For
per
sona
l use
onl
y
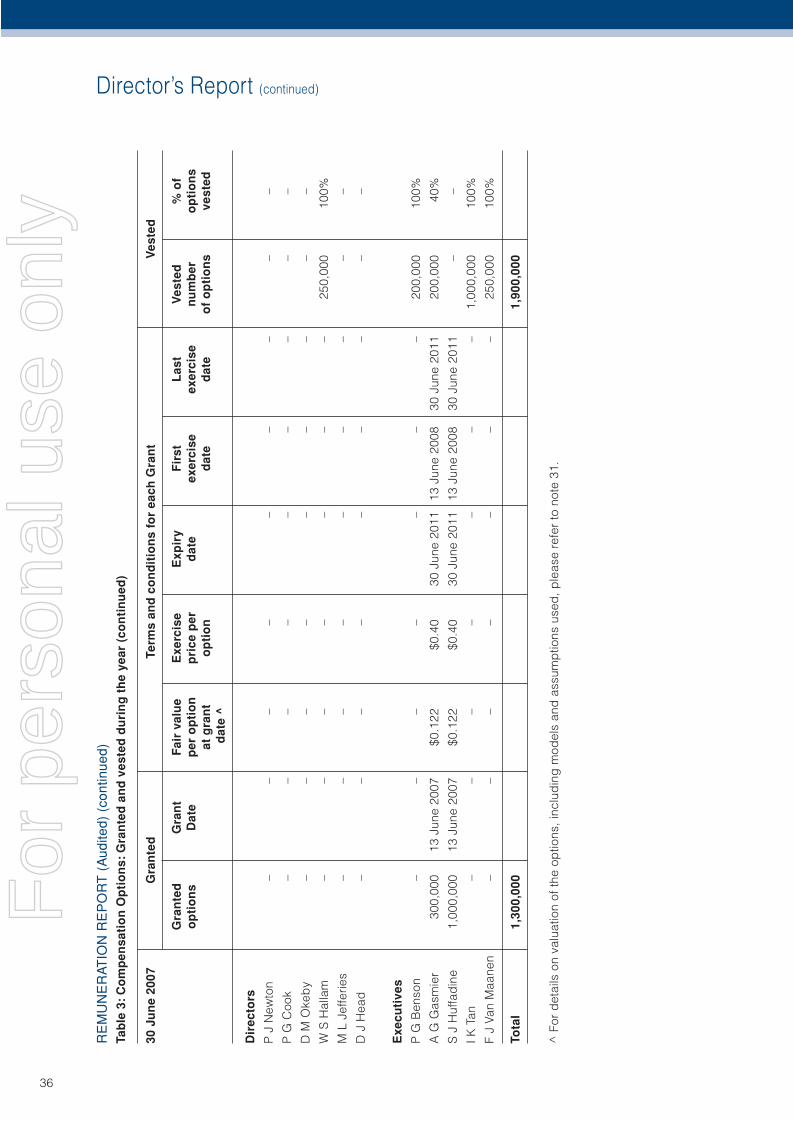
Director’s Report (continued)
36
RE
MU
NE
RAT
ION
RE
PO
RT
(A
udite
d) (
cont
inue
d)Ta
ble
3:
Co
mp
ensa
tio
n O
pti
on
s: G
ran
ted
an
d v
este
d d
uri
ng
th
e ye
ar (
con
tin
ued
)
30 J
un
e 20
07
Gra
nte
d
Term
s an
d c
on
dit
ion
s fo
r ea
ch G
ran
t V
este
d
G
ran
ted
G
ran
t F
air
valu
e E
xerc
ise
Exp
iry
Fir
st
Las
t V
este
d
% o
f
op
tio
ns
Dat
e p
er o
pti
on
p
rice
per
d
ate
exer
cise
ex
erci
se
nu
mb
er
op
tio
ns
at
gra
nt
op
tio
n
d
ate
dat
e o
f o
pti
on
s ve
sted
d
ate
^
Dir
ecto
rs
P J
New
ton
– –
– –
– –
– –
–
P G
Coo
k –
– –
– –
– –
– –
D M
Oke
by
– –
– –
– –
– –
–
W S
Hal
lam
–
– –
– –
– –
250,
000
100%
M L
Jef
ferie
s –
– –
– –
– –
– –
D J
Hea
d
– –
– –
– –
– –
–
Exe
cuti
ves
P G
Ben
son
– –
– –
– –
– 20
0,00
0 10
0%
A G
Gas
mie
r 30
0,00
0 13
Jun
e 20
07
$0.1
22
$0.4
0 30
Jun
e 20
11
13 J
une
2008
30
Jun
e 20
11
200,
000
40%
S J
Huf
fad
ine
1,00
0,00
0 13
Jun
e 20
07
$0.1
22
$0.4
0 30
Jun
e 20
11
13 J
une
2008
30
Jun
e 20
11
– –
I K T
an
– –
– –
– –
– 1,
000,
000
100%
F J
Van
Maa
nen
– –
– –
– –
– 25
0,00
0 10
0%
Tota
l 1,
300,
000
1,90
0,00
0
^ F
or d
etai
ls o
n va
luat
ion
of th
e op
tions
, inc
lud
ing
mod
els
and
ass
ump
tions
use
d, p
leas
e re
fer
to n
ote
31.
For
per
sona
l use
onl
y
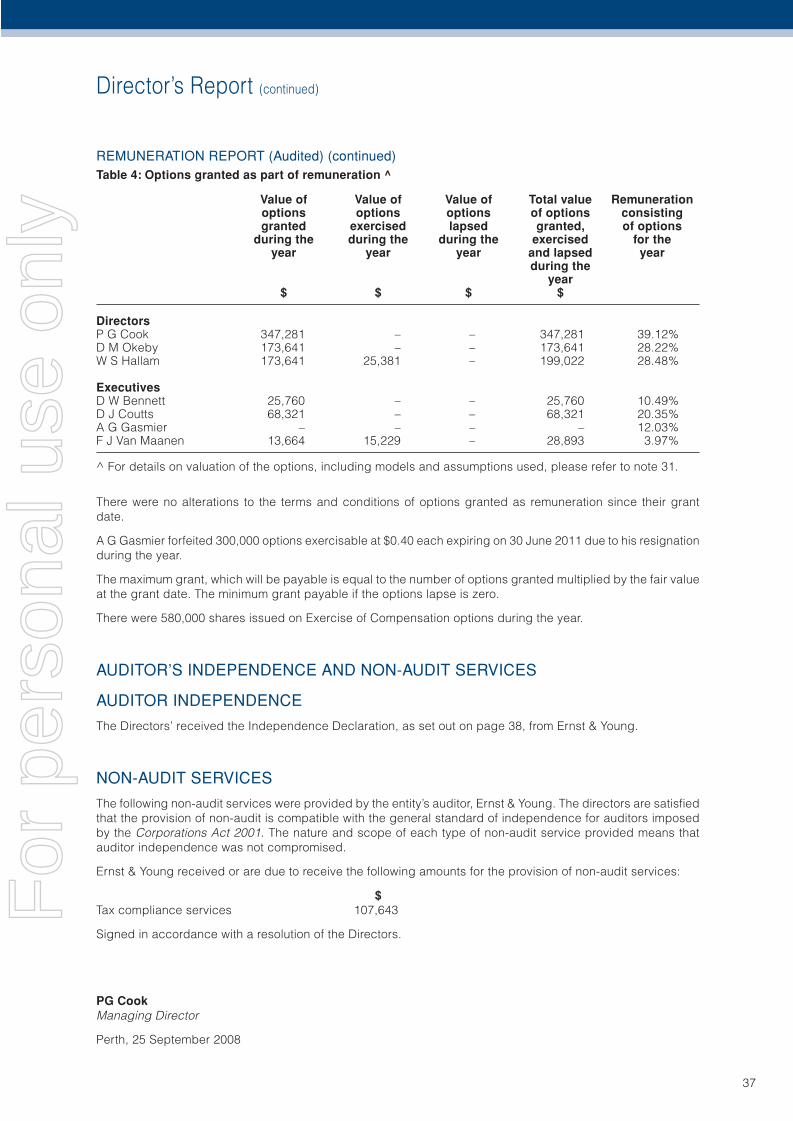
Director’s Report (continued)
37
REMUNERATION REPORT (Audited) (continued)Table 4: Options granted as part of remuneration ^
Value of Value of Value of Total value Remuneration options options options of options consisting granted exercised lapsed granted, of options during the during the during the exercised for the year year year and lapsed year during the year $ $ $ $
DirectorsP G Cook 347,281 – – 347,281 39.12%D M Okeby 173,641 – – 173,641 28.22%W S Hallam 173,641 25,381 – 199,022 28.48%
ExecutivesD W Bennett 25,760 – – 25,760 10.49%D J Coutts 68,321 – – 68,321 20.35%A G Gasmier – – – – 12.03%F J Van Maanen 13,664 15,229 – 28,893 3.97%
^ For details on valuation of the options, including models and assumptions used, please refer to note 31.
There were no alterations to the terms and conditions of options granted as remuneration since their grant date.
A G Gasmier forfeited 300,000 options exercisable at $0.40 each expiring on 30 June 2011 due to his resignation during the year.
The maximum grant, which will be payable is equal to the number of options granted multiplied by the fair value at the grant date. The minimum grant payable if the options lapse is zero.
There were 580,000 shares issued on Exercise of Compensation options during the year.
AUDITOR’S INDEPENDENCE AND NON-AUDIT SERVICES
AUDITOR INDEPENDENCE
The Directors’ received the Independence Declaration, as set out on page 38, from Ernst & Young.
NON-AUDIT SERVICES
The following non-audit services were provided by the entity’s auditor, Ernst & Young. The directors are satisfi ed that the provision of non-audit is compatible with the general standard of independence for auditors imposed by the Corporations Act 2001. The nature and scope of each type of non-audit service provided means that auditor independence was not compromised.
Ernst & Young received or are due to receive the following amounts for the provision of non-audit services:
$Tax compliance services 107,643
Signed in accordance with a resolution of the Directors.
PG CookManaging Director
Perth, 25 September 2008
For
per
sona
l use
onl
y
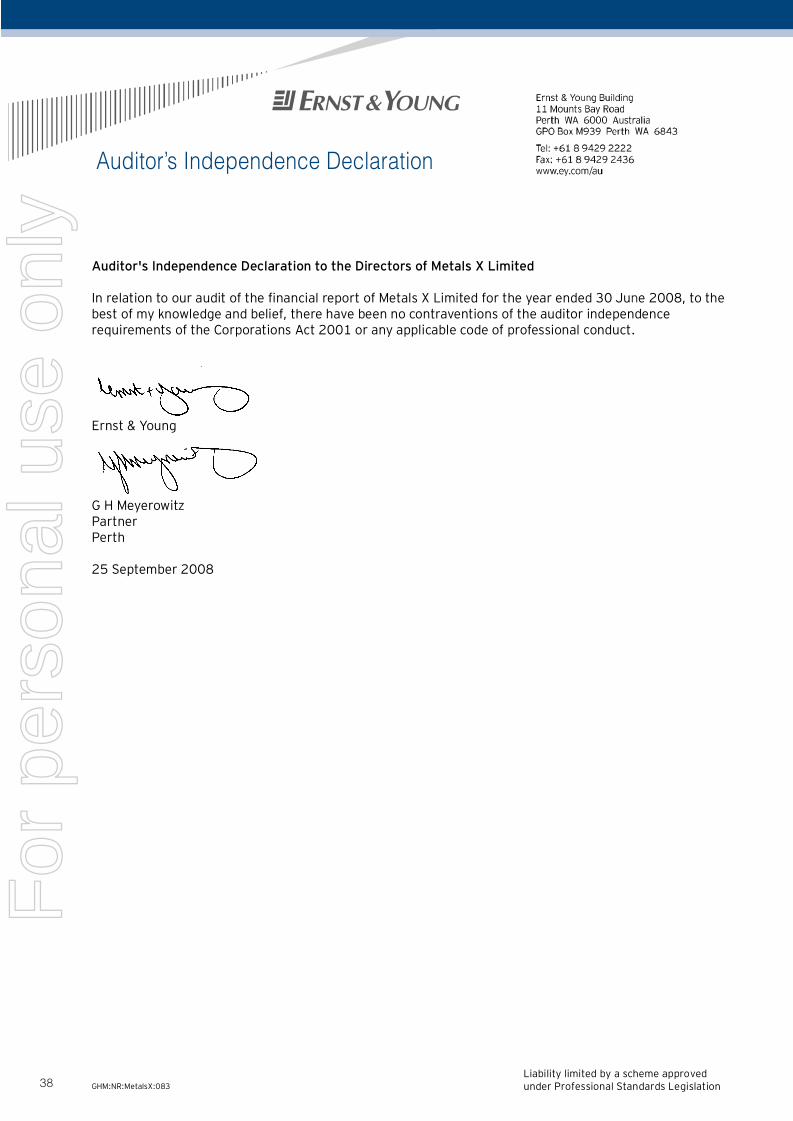
Liability limited by a scheme approved under Professional Standards Legislation
GHM:NR:MetalsX:083
Auditor's Independence Declaration to the Directors of Metals X Limited In relation to our audit of the financial report of Metals X Limited for the year ended 30 June 2008, to the best of my knowledge and belief, there have been no contraventions of the auditor independence requirements of the Corporations Act 2001 or any applicable code of professional conduct. Ernst & Young G H Meyerowitz Partner Perth 25 September 2008
Auditor’s Independence Declaration
38
For
per
sona
l use
onl
y
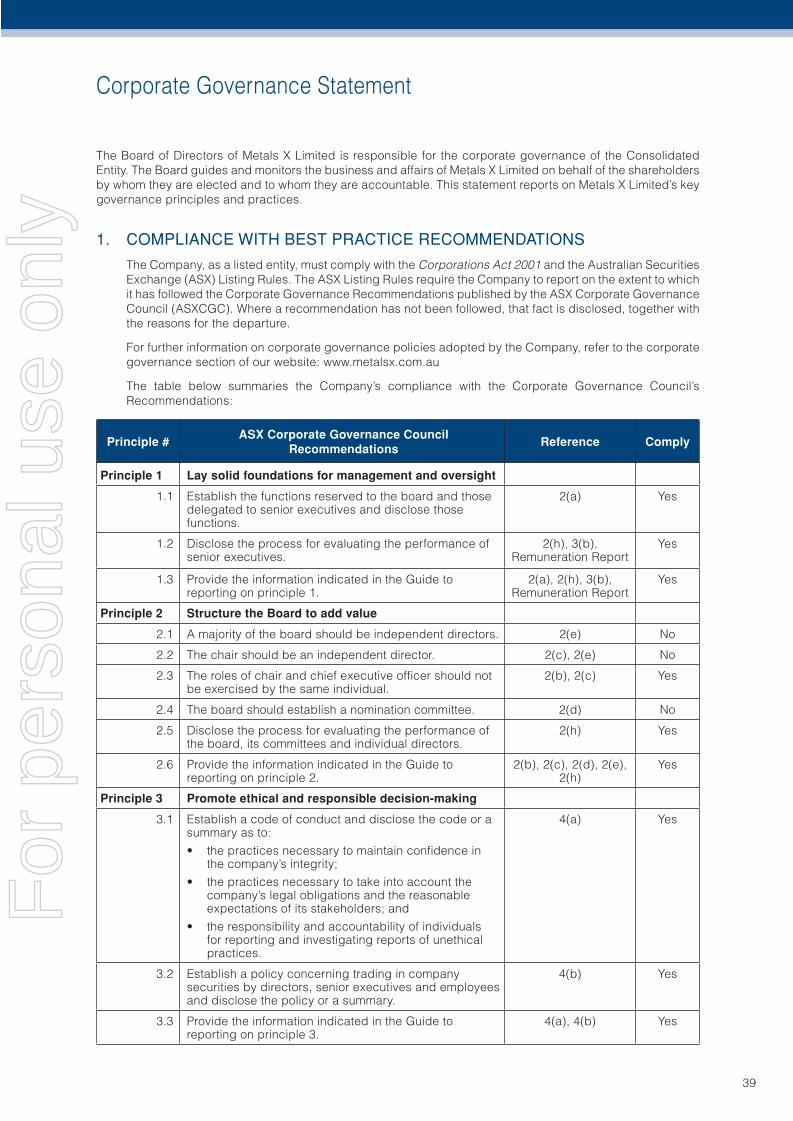
Corporate Governance Statement
39
The Board of Directors of Metals X Limited is responsible for the corporate governance of the Consolidated Entity. The Board guides and monitors the business and affairs of Metals X Limited on behalf of the shareholders by whom they are elected and to whom they are accountable. This statement reports on Metals X Limited’s key governance principles and practices.
1. COMPLIANCE WITH BEST PRACTICE RECOMMENDATIONS
The Company, as a listed entity, must comply with the Corporations Act 2001 and the Australian Securities Exchange (ASX) Listing Rules. The ASX Listing Rules require the Company to report on the extent to which it has followed the Corporate Governance Recommendations published by the ASX Corporate Governance Council (ASXCGC). Where a recommendation has not been followed, that fact is disclosed, together with the reasons for the departure.
For further information on corporate governance policies adopted by the Company, refer to the corporate governance section of our website: www.metalsx.com.au
The table below summaries the Company’s compliance with the Corporate Governance Council’s Recommendations:
Principle #ASX Corporate Governance Council
RecommendationsReference Comply
Principle 1 Lay solid foundations for management and oversight
1.1 Establish the functions reserved to the board and those delegated to senior executives and disclose those functions.
2(a) Yes
1.2 Disclose the process for evaluating the performance of senior executives.
2(h), 3(b), Remuneration Report
Yes
1.3 Provide the information indicated in the Guide to reporting on principle 1.
2(a), 2(h), 3(b), Remuneration Report
Yes
Principle 2 Structure the Board to add value
2.1 A majority of the board should be independent directors. 2(e) No
2.2 The chair should be an independent director. 2(c), 2(e) No
2.3 The roles of chair and chief executive offi cer should not be exercised by the same individual.
2(b), 2(c) Yes
2.4 The board should establish a nomination committee. 2(d) No
2.5 Disclose the process for evaluating the performance of the board, its committees and individual directors.
2(h) Yes
2.6 Provide the information indicated in the Guide to reporting on principle 2.
2(b), 2(c), 2(d), 2(e), 2(h)
Yes
Principle 3 Promote ethical and responsible decision-making
3.1 Establish a code of conduct and disclose the code or a summary as to:
• the practices necessary to maintain confi dence in the company’s integrity;
• the practices necessary to take into account the company’s legal obligations and the reasonable expectations of its stakeholders; and
• the responsibility and accountability of individuals for reporting and investigating reports of unethical practices.
4(a) Yes
3.2 Establish a policy concerning trading in company securities by directors, senior executives and employees and disclose the policy or a summary.
4(b) Yes
3.3 Provide the information indicated in the Guide to reporting on principle 3.
4(a), 4(b) Yes
For
per
sona
l use
onl
y
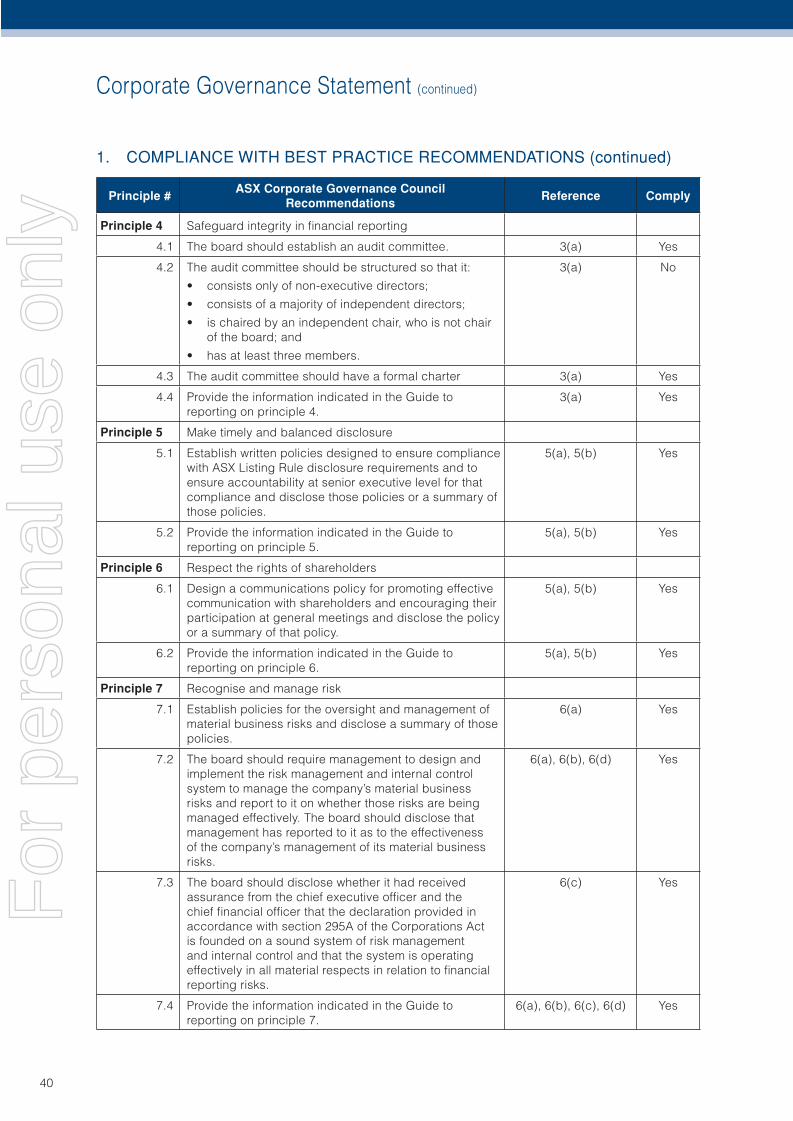
Corporate Governance Statement (continued)
40
1. COMPLIANCE WITH BEST PRACTICE RECOMMENDATIONS (continued)
Principle #ASX Corporate Governance Council
RecommendationsReference Comply
Principle 4 Safeguard integrity in fi nancial reporting
4.1 The board should establish an audit committee. 3(a) Yes
4.2 The audit committee should be structured so that it:
• consists only of non-executive directors;
• consists of a majority of independent directors;
• is chaired by an independent chair, who is not chair of the board; and
• has at least three members.
3(a) No
4.3 The audit committee should have a formal charter 3(a) Yes
4.4 Provide the information indicated in the Guide to reporting on principle 4.
3(a) Yes
Principle 5 Make timely and balanced disclosure
5.1 Establish written policies designed to ensure compliance with ASX Listing Rule disclosure requirements and to ensure accountability at senior executive level for that compliance and disclose those policies or a summary of those policies.
5(a), 5(b) Yes
5.2 Provide the information indicated in the Guide to reporting on principle 5.
5(a), 5(b) Yes
Principle 6 Respect the rights of shareholders
6.1 Design a communications policy for promoting effective communication with shareholders and encouraging their participation at general meetings and disclose the policy or a summary of that policy.
5(a), 5(b) Yes
6.2 Provide the information indicated in the Guide to reporting on principle 6.
5(a), 5(b) Yes
Principle 7 Recognise and manage risk
7.1 Establish policies for the oversight and management of material business risks and disclose a summary of those policies.
6(a) Yes
7.2 The board should require management to design and implement the risk management and internal control system to manage the company’s material business risks and report to it on whether those risks are being managed effectively. The board should disclose that management has reported to it as to the effectiveness of the company’s management of its material business risks.
6(a), 6(b), 6(d) Yes
7.3 The board should disclose whether it had received assurance from the chief executive offi cer and the chief fi nancial offi cer that the declaration provided in accordance with section 295A of the Corporations Act is founded on a sound system of risk management and internal control and that the system is operating effectively in all material respects in relation to fi nancial reporting risks.
6(c) Yes
7.4 Provide the information indicated in the Guide to reporting on principle 7.
6(a), 6(b), 6(c), 6(d) Yes
For
per
sona
l use
onl
y
Corporate Governance Statement (continued)
41
Principle #ASX Corporate Governance Council
RecommendationsReference Comply
Principle 8 Remunerate fairly and responsibly
8.1 The board should establish a remuneration committee. 3(b) Yes
8.2 Clearly distinguish the structure on non-executive directors’ remuneration from that of executive directors and senior executives.
3(b), Remuneration Report
Yes
8.3 Provide the information indicated in the Guide to reporting on principle 8.
3(b) Yes
2. THE BOARD OF DIRECTORS
2(a) Roles and Responsibilities of the BoardThe Board is accountable to the shareholders and investors for the overall performance of the Company and takes responsibility for monitoring the Company’s business and affairs and setting its strategic direction, establishing and overseeing the Company’s fi nancial position.
The Board is responsible for:
• Appointing, evaluating, rewarding and if necessary the removal of the Managing Director (“MD”) and senior management;
• Development of corporate objectives and strategy with management and approving plans, new investments, major capital and operating expenditures and major funding activities proposed by management;
• Monitoring actual performance against defi ned performance expectations and reviewing operating information to understand at all times the state of the health of the Company;
• Overseeing the management of business risks, safety and occupational health, environmental issues and community development;
• Satisfying itself that the fi nancial statements of the Company fairly and accurately set out the fi nancial position and fi nancial performance of the Company for the period under review;
• Satisfying itself that there are appropriate reporting systems and controls in place to assure the board that proper operational, fi nancial, compliance, risk management and internal control process are in place and functioning appropriately;
• Approving and monitoring fi nancial and other reporting;
• Assuring itself that appropriate audit arrangements are in place;
• Ensuring that the Company acts legally and responsibly on all matters and assuring itself that the Company has adopted a Code of Conduct and that the Company practice is consistent with that Code; and other policies; and
• Reporting to and advising shareholders.
Other than as specifi cally reserved to the Board, responsibility for the day-to-day management of the Company’s business activities is delegated to the Managing Director and Executive Management.
1. COMPLIANCE WITH BEST PRACTICE RECOMMENDATIONS (continued)
For
per
sona
l use
onl
y
Corporate Governance Statement (continued)
42
2. THE BOARD OF DIRECTORS (continued)
2(b) Board CompositionThe Directors determine the composition of the Board employing the following principles:
• the Board, in accordance with the Company’s constitution must comprise a minimum of three Directors;
• the roles of the Chairman of the Board and of the Managing Director should be exercised by different individuals;
• the majority of the Board should comprise Directors who are non-executive;
• the Board should represent a broad range of qualifi cations, experience and expertise considered of benefi t to the Company; and
• the Board must be structured in such a way that it has a proper understanding of, and competency in, the current and emerging issues facing the Company, and can effectively review management’s decisions.
The Board is currently comprised of four non-executive Directors and two executive Directors. Details of the members of the Board, their experience, expertise, qualifi cations, terms of offi ce and independent status are set out in the Directors’ Report of the Annual Report under the heading “Directors”.
The Company’s constitution requires one-third of the Directors (or the next lowest whole number) to retire by rotation at each Annual General Meeting (AGM). The Directors to retire at each AGM are those who have been longest in offi ce since their last election. Where Directors have served for equal periods, they may agree amongst themselves or determine by lot who will retire. A Director must retire in any event at the third AGM since he or she was last elected or re-elected.
Retiring Directors may offer themselves for re-election.
A Director appointed as an additional or casual Director by the Board will hold offi ce until the next AGM when they may be re-elected.
The Managing Director is not subject to retirement by rotation and, along with any Director appointed as an additional or casual Director, is not to be taken into account in determining the number of Directors required to retire by rotation.
2(c) Chairman and Managing DirectorThe Chairman is responsible for:
• leadership of the Board;
• the effi cient organisation and conduct of the Board’s functions;
• the promotion of constructive and respectful relations between Board members and between the Board and management;
• contributing to the briefi ng of Directors in relation to issues arising at Board meetings;
• facilitating the effective contribution of all Board members; and
• committing the time necessary to effectively discharge the role of the Chairman.
The Board does not comply with the ASX Recommendation 2.2 in that the Chairman, whilst a non-executive, is not an independent Director due to his substantial interest in the Company (refer to 2(e) Independent Directors). The Board has considered this matter and decided that the non-compliance does not effect the operation of the Company.
The Managing Director is responsible for:
• implementing the Company’s strategies and policies; and
• the day-to-day management of the Consolidated Entity’s business activities
The Board specifi es that the roles of the Chairman and the Managing Director are separate roles to be undertaken by separate people.
For
per
sona
l use
onl
y
Corporate Governance Statement (continued)
43
2. THE BOARD OF DIRECTORS (continued)
2(d) Nomination CommitteeThe Company does not comply with ASX Recommendation 2.4. The Company is not of a relevant size to consider formation of a nomination committee to deal with the selection and appointment of new Directors and as such a nomination committee has not been formed.
Nominations of new Directors are considered by the full Board in accordance with the Company’s “Selection of New Directors Policy”.
2(e) Independent DirectorsThe Company recognises that independent directors are important in assuring shareholders that the Board is properly fulfi lling its role and is diligent in holding senior management accountable for its performance. The Board assesses each of the directors against specifi c criteria to decide whether they are in a position to exercise independent judgment.
Directors of Metals X Limited are considered to be independent when they are independent of management and free from any business or other relationship that could materially interfere with, or could reasonably be perceived to materially interfere with, the exercise of their unfettered and independent judgement.
In making this assessment, the Board considers all relevant facts and circumstances. Relationships that the Board will take into consideration when assessing independence are whether a Director:
• is a substantial shareholder of the Company or an offi cer of, or otherwise associated directly with, a substantial shareholder of the Company;
• is employed, or has previously been employed in an executive capacity by the Company or another group member, and there has not been a period of at least three years between ceasing such employment and serving on the Board;
• has within the last three years been a principal of a material professional advisor or a material consultant to the Company or another group member, or an employee materially associated with the service provided;
• is a material supplier or customer of the Company or other group member, or an offi cer of or otherwise associated directly or indirectly with a material supplier or customer; or
• has a material contractual relationship with the Company or another group member other than as a Director.
The Company does not comply with ASX Recommendation 2.1, there is a majority of non-executive Directors but there is not a majority of independent Directors on the Board. In accordance with the defi nition of independence above, none of the Directors of the Company are considered to be independent.
The Board believes that the Company is not of suffi cient size to warrant the inclusion of more independent non-executive Directors in order to meet the ASX recommendation of maintaining a majority of independent non-executive Directors. The Company maintains a mix of Directors from different backgrounds with complementary skills and experience.
In recognition of the importance of independent views and the Board’s role in supervising the activities of management the Chairman must be a non-executive director.
2(f) Avoidance of confl icts of interest by a DirectorIn order to ensure that any interests of a Director in a particular matter to be considered by the Board are known by each Director, each Director is required by the Company to disclose any relationships, duties or interests held that may give rise to a potential confl ict. Directors are required to adhere strictly to constraints on their participation and voting in relation to any matters in which they may have an interest.
For
per
sona
l use
onl
y
Corporate Governance Statement (continued)
44
2. THE BOARD OF DIRECTORS (continued)
2(g) Board access to information and independent adviceDirectors are able to access members of the management team at any time to request relevant information.
There are procedures in place, agreed by the board, to enable Directors, in furtherance of their duties, to seek independent professional advice at the Company’s expense.
2(h) Review of Board performanceThe performance of the board and each of its committees is reviewed regularly by the Chairman. The Chairman conducts performance evaluations which involve an assessment of each board member’s performance against specifi c and measurable qualitative and quantitative performance criteria. The performance criteria against which directors and executives are assessed is aligned with the fi nancial and non-fi nancial objectives of Metals X Limited. Directors whose performance is consistently unsatisfactory may be asked to retire.
The performance of each committee is against the requirements of their respective charters.
3. BOARD COMMITTEES
To assist the Board in fulfi lling its duties and responsibilities, it has established the following committees:
• Audit Committee; and
• Remuneration Committee.
3(a) Audit CommitteeThe Board has established an Audit Committee that has three members, comprising two non-executive directors and the Company Secretary. The Audit Committee is governed by its charter, as approved by the Board. It is the Board’s responsibility to ensure that an effective internal control framework exists within the entity. This includes internal controls to deal with both the effectiveness and effi ciency of signifi cant business processes, the safeguarding of assets, the maintenance of proper accounting records, and the reliability of fi nancial information as well as non-fi nancial considerations such as the benchmarking of operational key performance indicators. The Board has delegated responsibility for establishing and maintaining a framework of internal control and ethical standards to the Audit Committee.
The Committee also provides the Board with additional assurance regarding the reliability of fi nancial information for inclusion in fi nancial report.
The Audit Committee’s main responsibilities include:
• approval of the scope and plan for the external audit;
• review of the independence and performance of the external auditor;
• review of signifi cant accounting policies and practices; and
• review and recommendation to the Board for the adoption of the Consolidated Entity’s half- year and annual fi nancial statements.
The Audit Committee does not comply with ASX Recommendation 4.2 as only two of the three members are non-executive Directors and none are considered to be independent Directors (refer 2(e)). The Company believes that the committee has appropriate fi nancial expertise, all members are fi nancially literate and have an appropriate understanding of the Company’s activities. The Audit Committee is comprised of:
Name Position
M L Jefferies (Chairman) Non-executive DirectorD M Okeby Non-executive DirectorF J Van Maanen Company Secretary
The qualifi cations of the committee are set out in the Directors’ Report of the Annual Report under the heading “Directors”.
For
per
sona
l use
onl
y
Corporate Governance Statement (continued)
45
3. BOARD COMMITTEES (continued)
3(a) Audit Committee (continued)The number of times the Audit Committee has formerly met and the number of meetings attended by directors during the fi nancial year are reported in Directors’ Report of the Annual Report under the heading “Directors’ Meetings”.
External AuditorsThe Company’s policy is to appoint external auditors who clearly demonstrate quality and independence. The performance of the external auditor is reviewed annually and applications for tender of external audit services are requested as deemed appropriate, taking into consideration assessment of performance, existing value and tender costs. It is Ernst & Young’s policy to rotate engagement partners on listed companies at least every fi ve years.
An analysis of fees paid to the external auditors, including a break-down of fees for non-audit services, is provided in the notes to the fi nancial statements in the Annual Report.
There is no indemnity provided by the company to the auditor in respect of any potential liability to third parties.
The external auditor is requested to attend the annual general meeting and be available to answer shareholder questions about the conduct of the audit and preparation and content of the audit report.
The directors are satisfi ed that the provision of non-audit services during the year by the auditors is compatible with the general standard of independence for auditors imposed by the Corporations Act.
The directors are satisfi ed that the provision of the non-audit services did not compromise the auditor’s independence requirements of the Corporations Act because the services were provided by persons who were not involved in the audit and the decision as to whether or not to accept the tax planning advice was made by management.
3(b) Remuneration CommitteeThe Board is responsible for determining and reviewing compensation arrangements for the directors themselves and the Managing Director and executive team. The Board has established a Remuneration Committee, comprising three non-executives. The Remuneration Committee is governed by its charter, as approved by the Board. Members of the Remuneration Committee are:
Name Position
P J Newton (Chairman) Non-executive ChairmanM L Jefferies Non-executive DirectorD M Okeby Non-executive Director
The Remuneration Committee advises the Board on remuneration policies and practices generally, and makes specifi c recommendations on remuneration packages and other terms of employment for executive directors, senior executives and non-executive directors. Executive remuneration and other terms of employment are reviewed annually by the Committee having regard to personal and corporate performance contribution to long-term growth, relevant comparative information and independent expert advice. Each member of the senior executive team signs a formal employment contract at the time of their appointment covering a range of matters including their duties, rights and responsibilities. As well as base salary, remuneration packages may include superannuation and retirement and termination entitlements. There is no scheme to provide retirement benefi ts, other than statutory superannuation, to non-executive directors.
The remuneration received by directors and executives in the current period is contained in the “Remuneration Report” within the Directors’ Report of the Annual Report.
The number of times the Remuneration Committee has formally met and the number of meetings attended by directors during the fi nancial year are reported in the Directors’ Report of the Annual Report under the heading “Directors’ Meetings”.
For
per
sona
l use
onl
y
Corporate Governance Statement (continued)
46
4. ETHICAL AND RESPONSIBLE DECISION MAKING
4(a) Code of Ethics and ConductThe Board endeavours to ensure that the Directors, offi cers and employees of the Company act with integrity and observe the highest standards of behaviour and business ethics in relation to their corporate activities. The “Code of Conduct” sets out the principles, practices, and standards of personal behaviour the Company expects people to adopt in their daily business activities.
All Directors, offi cers and employees are required to comply with the Code of Conduct. Senior managers are expected to ensure that employees, contractors, consultants, agents and partners under their supervision are aware of the Company’s expectations as set out in the Code of Conduct.
All Directors, offi cers and employees are expected to:
• comply with the law;
• act in the best interests of the Company;
• be responsible and accountable for their actions; and
• observe the ethical principles of fairness, honesty and truthfulness, including prompt disclosure of potential confl icts.
4(b) Policy concerning trading in Company securitiesThe Company’s “Dealings in Company Shares and Options Policy” applies to all Directors, offi cers and employees. This policy sets out the restrictions on dealing in securities by people who work for, or are associated with the Company and is intended to assist in maintaining market confi dence in the integrity of dealings in the Company’s securities. The policy stipulates that the only appropriate time for a Director, offi cer or employee to deal in the Company’s securities is when they are not in possession of price sensitive information that is not generally available to the market.
As a matter of practice, Company shares may only be dealt with by Directors and offi cers of the Company under the following guidelines:
• No trading is permitted in the period of 21 days prior to the announcement to the ASX of the Company’s full year and half year results;
• Guidelines are to be considered complementary to and not replace the various sections of the Corporations Act 2001 dealing with insider trading; and
• Prior approval of the Chairman, or in his absence, the approval of two directors is required prior to any trading being undertaken.
5. TIMELY AND BALANCED DISCLOSURE
5(a) Shareholder communicationThe Company believes that all shareholders should have equal and timely access to material information about the Company including its fi nancial situation, performance, ownership and governance. The Company’s “ASX Disclosure Policy” encourages effective communication with its shareholders by requiring that Company announcements:
• be factual and subject to internal vetting and authorisation before issue;
• be made in a timely manner;
• not omit material information;
• be expressed in a clear and objective manner to allow investors to assess the impact of the information when making investment decisions;
• be in compliance with ASX Listing Rules continuous disclosure requirements; and
• be placed on the Company’s website promptly following release.
For
per
sona
l use
onl
y
Corporate Governance Statement (continued)
47
5. TIMELY AND BALANCED DISCLOSURE (continued)
5(a) Shareholder communication (continued)Shareholders are encouraged to participate in general meetings. Copies of addresses by the Chairman or Managing Director are disclosed to the market and posted on the Company’s website. The Company’s external auditor attends the Company’s annual general meeting to answer shareholder questions about the conduct of the audit, the preparation and content of the audit report, the accounting policies adopted by the Company and the independence of the auditor in relation to the conduct of the audit.
5(b) Continuous disclosure policyThe Company is committed to ensuring that shareholders and the market are provided with full and timely information and that all stakeholders have equal opportunities to receive externally available information issued by the Company. The Company’s “ASX Disclosure Policy” described in 5(a) reinforces the Company’s commitment to continuous disclosure and outline management’s accountabilities and the processes to be followed for ensuring compliance.
The policy also contains guidelines on information that may be price sensitive. The Company Secretary has been nominated as the person responsible for communications with the ASX. This role includes responsibility for ensuring compliance with the continuous disclosure requirements with the ASX Listing Rules and overseeing and coordinating information disclosure to the ASX.
6. RECOGNISING AND MANAGING RISK
The Board is responsible for ensuring there are adequate policies in relation to risk management, compliance and internal control systems. The Company’s policies are designed to ensure strategic, operational, legal, reputation and fi nancial risks are identifi ed, assessed, effectively and effi ciently managed and monitored to enable achievement of the Company’s business objectives. A written policy in relation to risk oversight and management has been established (“Risk Management and Internal Control Policy”). Considerable importance is placed on maintaining a strong control environment. There is an organisation structure with clearly drawn responsibilities.
6(a) Board oversight of the risk management systemThe Board is responsible for approving and overseeing the risk management system. The Board reviews, at least annually, the effectiveness of the implementation of the risk management controls and procedures.
The principle aim of the system of internal control is the management of business risks, with a view to enhancing the value of shareholders’ investments and safeguarding assets. Although no system of internal control can provide absolute assurance that the business risks will be fully mitigated, the internal control systems have been designed to meet the Company’s specifi c needs and the risks to which it is exposed.
Annually, the Board is responsible for identifying the risks facing the Company, assessing the risks and ensuring that there are controls for these risks, which are to be designed to ensure that any identifi ed risk is reduced to an acceptable level.
The Board is also responsible for identifying and monitoring areas of signifi cant business risk. Internal control measures currently adopted by the Board include:
• monthly reporting to the Board in respect of operations and the Company’s fi nancial position, with a comparison of actual results against budget; and
• regular reports to the Board by appropriate members of the management team and/or independent advisers, outlining the nature of particular risks and highlighting measures which are either in place or can be adopted to manage or mitigate those risks.
For
per
sona
l use
onl
y
Corporate Governance Statement (continued)
48
6. RECOGNISING AND MANAGING RISK (continued)
6(b) Risk management roles and responsibilitiesThe Board is responsible for approving and reviewing the Company’s risk management strategy and policy. Executive management is responsible for implementing the Board approved risk management strategy and developing policies, controls, processes and procedures to identify and manage risks in all of the Company’s activities.
The board is responsible for satisfying itself that management has developed and implemented a sound system of risk management and internal control.
6(c) Managing Director and Chief Financial Offi cer Certifi cationThe Managing Director and Chief Financial Offi cer provide to the Board written certifi cation that in all material respects:
• The Company’s fi nancial statements present a true and fair view of the Company’s fi nancial condition and operational results and are in accordance with relevant accounting standards;
• The statement given to the Board on the integrity of the Company’s fi nancial statements is founded on a sound system of risk management and internal compliance and controls which implement the policies adopted by the Board; and
• The Company’s risk management and internal compliance and control system is operating effi ciently and effectively in all material respects.
6(d) Internal review and risk evaluationAssurance is provided to the Board by executive management on the adequacy and effectiveness of management controls for risk on a regular basis.
For
per
sona
l use
onl
y
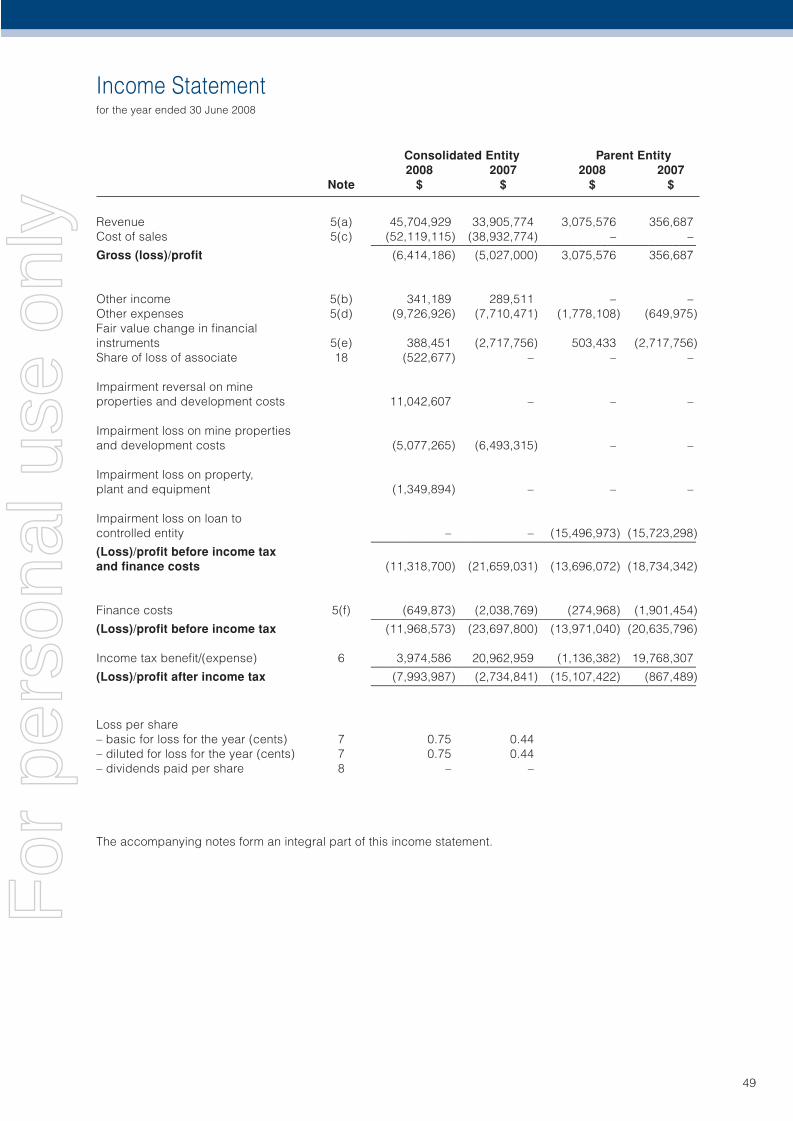
Income Statementfor the year ended 30 June 2008
49
Consolidated Entity Parent Entity 2008 2007 2008 2007 Note $ $ $ $
Revenue 5(a) 45,704,929 33,905,774 3,075,576 356,687Cost of sales 5(c) (52,119,115) (38,932,774) – – _______________________________________________________Gross (loss)/profi t (6,414,186) (5,027,000) 3,075,576 356,687
Other income 5(b) 341,189 289,511 – –Other expenses 5(d) (9,726,926) (7,710,471) (1,778,108) (649,975)Fair value change in fi nancial instruments 5(e) 388,451 (2,717,756) 503,433 (2,717,756)Share of loss of associate 18 (522,677) – – –
Impairment reversal on mine properties and development costs 11,042,607 – – –
Impairment loss on mine properties and development costs (5,077,265) (6,493,315) – –
Impairment loss on property, plant and equipment (1,349,894) – – –
Impairment loss on loan to controlled entity – – (15,496,973) (15,723,298) _______________________________________________________(Loss)/profi t before income tax and fi nance costs (11,318,700) (21,659,031) (13,696,072) (18,734,342)
Finance costs 5(f) (649,873) (2,038,769) (274,968) (1,901,454) _______________________________________________________(Loss)/profi t before income tax (11,968,573) (23,697,800) (13,971,040) (20,635,796)
Income tax benefi t/(expense) 6 3,974,586 20,962,959 (1,136,382) 19,768,307 _______________________________________________________(Loss)/profi t after income tax (7,993,987) (2,734,841) (15,107,422) (867,489) _______________________________________________________
Loss per share– basic for loss for the year (cents) 7 0.75 0.44– diluted for loss for the year (cents) 7 0.75 0.44– dividends paid per share 8 – –
The accompanying notes form an integral part of this income statement.
For
per
sona
l use
onl
y
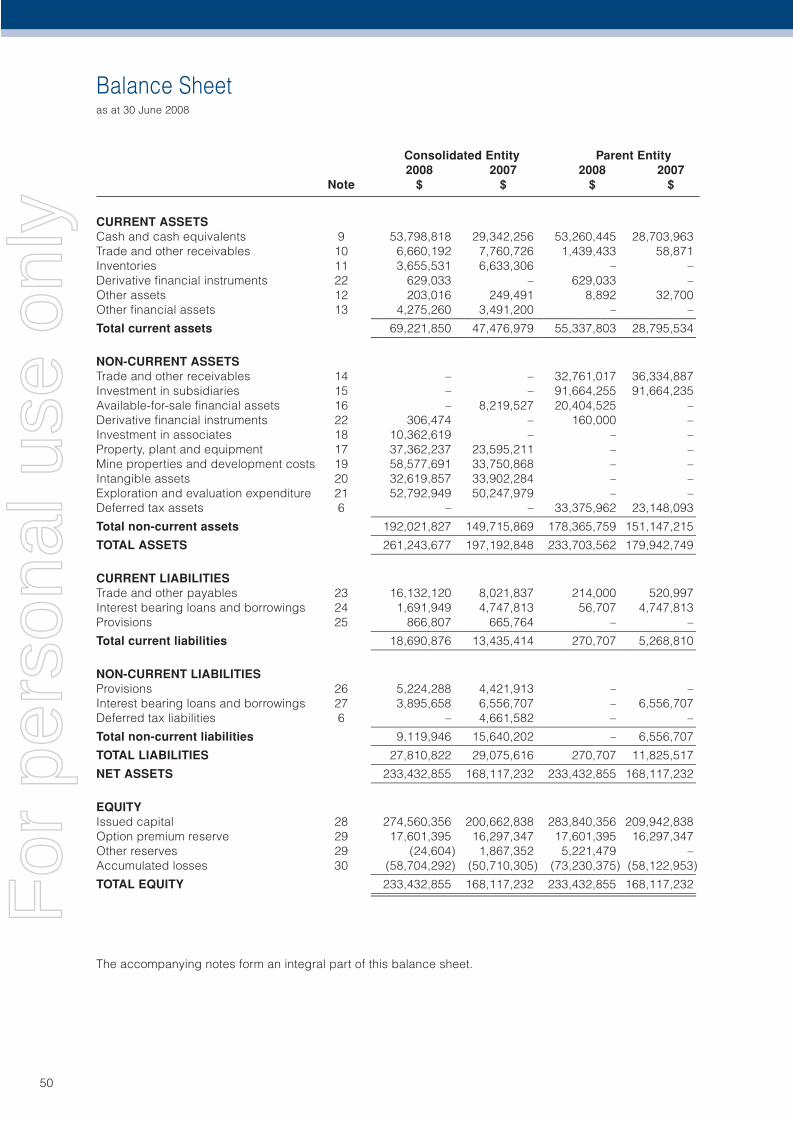
Balance Sheetas at 30 June 2008
50
Consolidated Entity Parent Entity 2008 2007 2008 2007 Note $ $ $ $
CURRENT ASSETSCash and cash equivalents 9 53,798,818 29,342,256 53,260,445 28,703,963Trade and other receivables 10 6,660,192 7,760,726 1,439,433 58,871Inventories 11 3,655,531 6,633,306 – –Derivative fi nancial instruments 22 629,033 – 629,033 –Other assets 12 203,016 249,491 8,892 32,700Other fi nancial assets 13 4,275,260 3,491,200 – – _______________________________________________________Total current assets 69,221,850 47,476,979 55,337,803 28,795,534 _______________________________________________________
NON-CURRENT ASSETSTrade and other receivables 14 – – 32,761,017 36,334,887Investment in subsidiaries 15 – – 91,664,255 91,664,235Available-for-sale fi nancial assets 16 – 8,219,527 20,404,525 –Derivative fi nancial instruments 22 306,474 – 160,000 –Investment in associates 18 10,362,619 – – –Property, plant and equipment 17 37,362,237 23,595,211 – –Mine properties and development costs 19 58,577,691 33,750,868 – –Intangible assets 20 32,619,857 33,902,284 – –Exploration and evaluation expenditure 21 52,792,949 50,247,979 – –Deferred tax assets 6 – – 33,375,962 23,148,093 _______________________________________________________Total non-current assets 192,021,827 149,715,869 178,365,759 151,147,215 _______________________________________________________TOTAL ASSETS 261,243,677 197,192,848 233,703,562 179,942,749 _______________________________________________________
CURRENT LIABILITIESTrade and other payables 23 16,132,120 8,021,837 214,000 520,997Interest bearing loans and borrowings 24 1,691,949 4,747,813 56,707 4,747,813Provisions 25 866,807 665,764 – – _______________________________________________________Total current liabilities 18,690,876 13,435,414 270,707 5,268,810 _______________________________________________________
NON-CURRENT LIABILITIESProvisions 26 5,224,288 4,421,913 – –Interest bearing loans and borrowings 27 3,895,658 6,556,707 – 6,556,707Deferred tax liabilities 6 – 4,661,582 – – _______________________________________________________Total non-current liabilities 9,119,946 15,640,202 – 6,556,707 _______________________________________________________TOTAL LIABILITIES 27,810,822 29,075,616 270,707 11,825,517 _______________________________________________________NET ASSETS 233,432,855 168,117,232 233,432,855 168,117,232 _______________________________________________________
EQUITYIssued capital 28 274,560,356 200,662,838 283,840,356 209,942,838Option premium reserve 29 17,601,395 16,297,347 17,601,395 16,297,347Other reserves 29 (24,604) 1,867,352 5,221,479 –Accumulated losses 30 (58,704,292) (50,710,305) (73,230,375) (58,122,953) _______________________________________________________TOTAL EQUITY 233,432,855 168,117,232 233,432,855 168,117,232 _______________________________________________________ _______________________________________________________
The accompanying notes form an integral part of this balance sheet.
For
per
sona
l use
onl
y
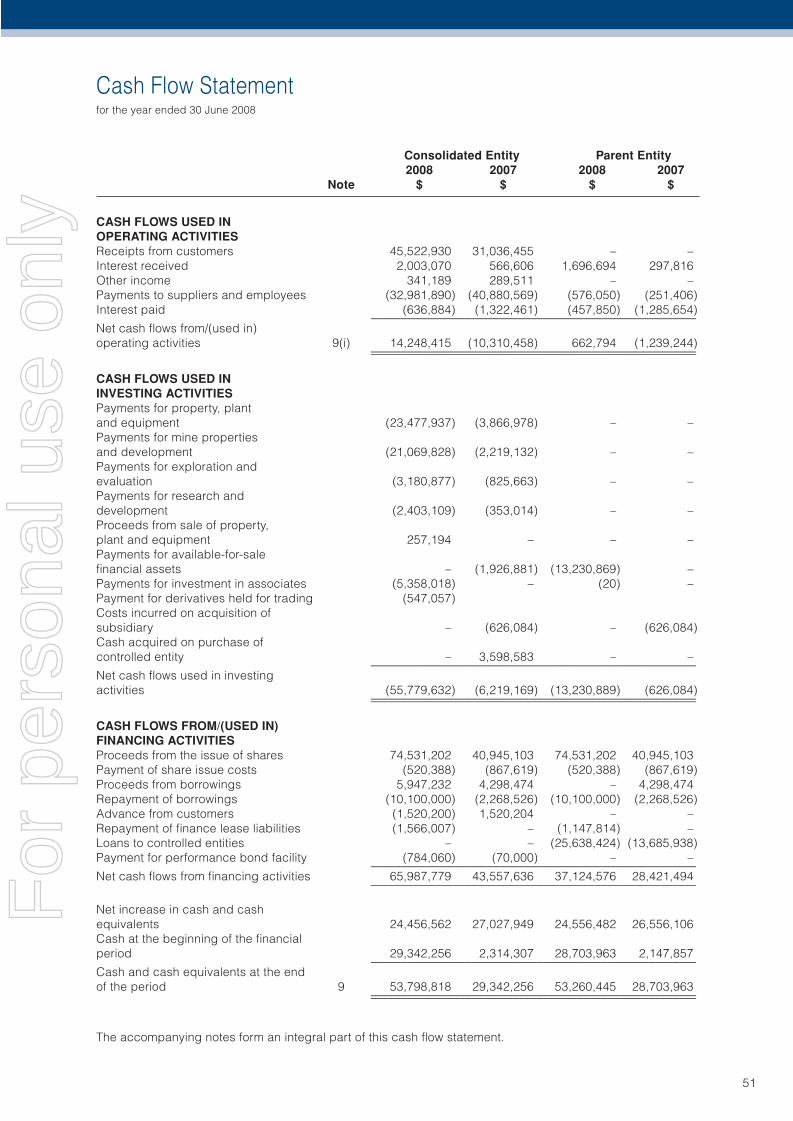
Cash Flow Statementfor the year ended 30 June 2008
51
Consolidated Entity Parent Entity 2008 2007 2008 2007 Note $ $ $ $
CASH FLOWS USED IN OPERATING ACTIVITIESReceipts from customers 45,522,930 31,036,455 – –Interest received 2,003,070 566,606 1,696,694 297,816Other income 341,189 289,511 – –Payments to suppliers and employees (32,981,890) (40,880,569) (576,050) (251,406)Interest paid (636,884) (1,322,461) (457,850) (1,285,654) _______________________________________________________Net cash fl ows from/(used in) operating activities 9(i) 14,248,415 (10,310,458) 662,794 (1,239,244) _______________________________________________________ _______________________________________________________
CASH FLOWS USED IN INVESTING ACTIVITIESPayments for property, plant and equipment (23,477,937) (3,866,978) – –Payments for mine properties and development (21,069,828) (2,219,132) – –Payments for exploration and evaluation (3,180,877) (825,663) – –Payments for research and development (2,403,109) (353,014) – –Proceeds from sale of property, plant and equipment 257,194 – – –Payments for available-for-sale fi nancial assets – (1,926,881) (13,230,869) –Payments for investment in associates (5,358,018) – (20) –Payment for derivatives held for trading (547,057)Costs incurred on acquisition of subsidiary – (626,084) – (626,084)Cash acquired on purchase of controlled entity – 3,598,583 – – _______________________________________________________Net cash fl ows used in investing activities (55,779,632) (6,219,169) (13,230,889) (626,084) _______________________________________________________ _______________________________________________________
CASH FLOWS FROM/(USED IN) FINANCING ACTIVITIESProceeds from the issue of shares 74,531,202 40,945,103 74,531,202 40,945,103Payment of share issue costs (520,388) (867,619) (520,388) (867,619)Proceeds from borrowings 5,947,232 4,298,474 – 4,298,474Repayment of borrowings (10,100,000) (2,268,526) (10,100,000) (2,268,526)Advance from customers (1,520,200) 1,520,204 – –Repayment of fi nance lease liabilities (1,566,007) – (1,147,814) –Loans to controlled entities – – (25,638,424) (13,685,938)Payment for performance bond facility (784,060) (70,000) – – _______________________________________________________Net cash fl ows from fi nancing activities 65,987,779 43,557,636 37,124,576 28,421,494 _______________________________________________________
Net increase in cash and cash equivalents 24,456,562 27,027,949 24,556,482 26,556,106Cash at the beginning of the fi nancial period 29,342,256 2,314,307 28,703,963 2,147,857 _______________________________________________________Cash and cash equivalents at the end of the period 9 53,798,818 29,342,256 53,260,445 28,703,963 _______________________________________________________ _______________________________________________________
The accompanying notes form an integral part of this cash fl ow statement.
For
per
sona
l use
onl
y
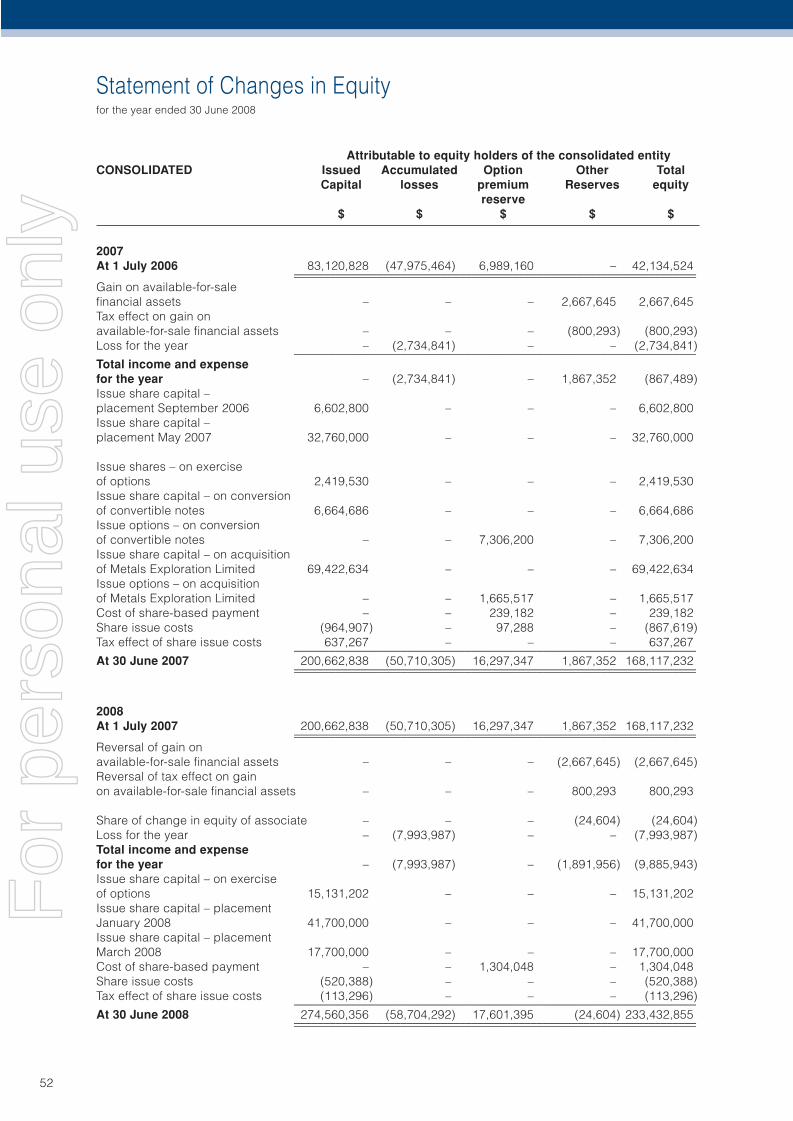
Statement of Changes in Equityfor the year ended 30 June 2008
52
Attributable to equity holders of the consolidated entityCONSOLIDATED Issued Accumulated Option Other Total Capital losses premium Reserves equity reserve $ $ $ $ $
2007At 1 July 2006 83,120,828 (47,975,464) 6,989,160 – 42,134,524 ____________________________________________________________________ ____________________________________________________________________Gain on available-for-sale fi nancial assets – – – 2,667,645 2,667,645Tax effect on gain on available-for-sale fi nancial assets – – – (800,293) (800,293)Loss for the year – (2,734,841) – – (2,734,841) ____________________________________________________________________Total income and expense for the year – (2,734,841) – 1,867,352 (867,489)Issue share capital – placement September 2006 6,602,800 – – – 6,602,800Issue share capital – placement May 2007 32,760,000 – – – 32,760,000
Issue shares – on exercise of options 2,419,530 – – – 2,419,530Issue share capital – on conversion of convertible notes 6,664,686 – – – 6,664,686Issue options – on conversion of convertible notes – – 7,306,200 – 7,306,200Issue share capital – on acquisition of Metals Exploration Limited 69,422,634 – – – 69,422,634Issue options – on acquisition of Metals Exploration Limited – – 1,665,517 – 1,665,517Cost of share-based payment – – 239,182 – 239,182Share issue costs (964,907) – 97,288 – (867,619)Tax effect of share issue costs 637,267 – – – 637,267 ____________________________________________________________________At 30 June 2007 200,662,838 (50,710,305) 16,297,347 1,867,352 168,117,232 ____________________________________________________________________ ____________________________________________________________________
2008At 1 July 2007 200,662,838 (50,710,305) 16,297,347 1,867,352 168,117,232 ____________________________________________________________________ ____________________________________________________________________Reversal of gain on available-for-sale fi nancial assets – – – (2,667,645) (2,667,645)Reversal of tax effect on gain on available-for-sale fi nancial assets – – – 800,293 800,293
Share of change in equity of associate – – – (24,604) (24,604)Loss for the year – (7,993,987) – – (7,993,987)Total income and expense for the year – (7,993,987) – (1,891,956) (9,885,943)Issue share capital – on exercise of options 15,131,202 – – – 15,131,202Issue share capital – placement January 2008 41,700,000 – – – 41,700,000Issue share capital – placement March 2008 17,700,000 – – – 17,700,000Cost of share-based payment – – 1,304,048 – 1,304,048Share issue costs (520,388) – – – (520,388)Tax effect of share issue costs (113,296) – – – (113,296) ____________________________________________________________________At 30 June 2008 274,560,356 (58,704,292) 17,601,395 (24,604) 233,432,855 ____________________________________________________________________ ____________________________________________________________________
For
per
sona
l use
onl
y
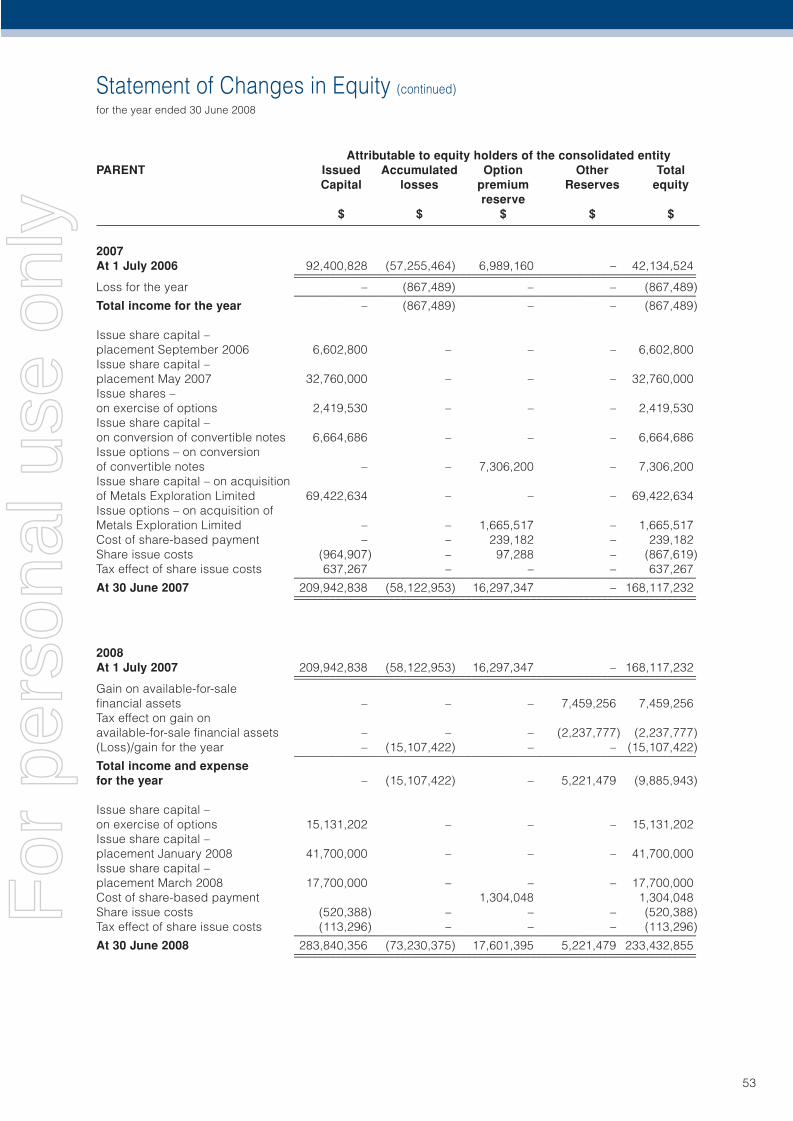
Statement of Changes in Equity (continued)
for the year ended 30 June 2008
53
Attributable to equity holders of the consolidated entityPARENT Issued Accumulated Option Other Total Capital losses premium Reserves equity reserve $ $ $ $ $
2007At 1 July 2006 92,400,828 (57,255,464) 6,989,160 – 42,134,524 ____________________________________________________________________ ____________________________________________________________________Loss for the year – (867,489) – – (867,489) ____________________________________________________________________Total income for the year – (867,489) – – (867,489)
Issue share capital – placement September 2006 6,602,800 – – – 6,602,800Issue share capital – placement May 2007 32,760,000 – – – 32,760,000Issue shares – on exercise of options 2,419,530 – – – 2,419,530Issue share capital – on conversion of convertible notes 6,664,686 – – – 6,664,686Issue options – on conversion of convertible notes – – 7,306,200 – 7,306,200Issue share capital – on acquisition of Metals Exploration Limited 69,422,634 – – – 69,422,634Issue options – on acquisition of Metals Exploration Limited – – 1,665,517 – 1,665,517Cost of share-based payment – – 239,182 – 239,182Share issue costs (964,907) – 97,288 – (867,619)Tax effect of share issue costs 637,267 – – – 637,267 ____________________________________________________________________At 30 June 2007 209,942,838 (58,122,953) 16,297,347 – 168,117,232 ____________________________________________________________________ ____________________________________________________________________
2008At 1 July 2007 209,942,838 (58,122,953) 16,297,347 – 168,117,232 ____________________________________________________________________ ____________________________________________________________________Gain on available-for-sale fi nancial assets – – – 7,459,256 7,459,256Tax effect on gain on available-for-sale fi nancial assets – – – (2,237,777) (2,237,777)(Loss)/gain for the year – (15,107,422) – – (15,107,422) ____________________________________________________________________Total income and expense for the year – (15,107,422) – 5,221,479 (9,885,943)
Issue share capital – on exercise of options 15,131,202 – – – 15,131,202Issue share capital – placement January 2008 41,700,000 – – – 41,700,000Issue share capital – placement March 2008 17,700,000 – – – 17,700,000Cost of share-based payment 1,304,048 1,304,048Share issue costs (520,388) – – – (520,388)Tax effect of share issue costs (113,296) – – – (113,296) ____________________________________________________________________At 30 June 2008 283,840,356 (73,230,375) 17,601,395 5,221,479 233,432,855 ____________________________________________________________________ ____________________________________________________________________
For
per
sona
l use
onl
y
Notes to the Financial Statementsfor the year ended 30 June 2008
54
1. CORPORATE INFORMATION
The fi nancial report of Metals X Limited for the year ended 30 June 2008 was authorised for issue in accordance with a resolution of the Directors on 23 September 2008.
Metals X Limited (“the parent entity”) is a company limited by shares incorporated in Australia whose shares are publicly traded on the Australian Securities Exchange.
The nature of the operations and principal activities of the Consolidated Entity are described in the Directors’ Report.
The address of the registered offi ce is Level 3 Hyatt Centre, 123 Adelaide Terrace, East Perth, WA 6004.
2. SUMMARY OF SIGNIFICANT ACCOUNTING POLICIES
(a) Basis of PreparationThe fi nancial report is a general purpose fi nancial report, which has been prepared in accordance with the requirements of the Corporations Act 2001 and Australian Accounting Standards and other authorative pronouncements of the Australian Accounting Standards Board.
The fi nancial report has been prepared on a historical cost basis, except for investment properties, land and buildings, derivative fi nancial instruments and available-for-sale investments, which have been measured at fair value.
The fi nancial report is presented in Australian dollars.
(b) Statement of complianceThe fi nancial report complies with Australian Accounting Standards as issued by the Australian Accounting Standards Board and, which include Australian equivalent to International Financial Reporting Standards (AIFRS). The fi nancial report also complies with International Financial Reporting Standards (IFRS) as issued by the International Accounting Standards Board.
Adoption of new accounting standardsIn the current year, the Consolidated Entity has adopted all of the new and revised Standards and Interpretations issued by the Australian Accounting Standards Board (the AASB) that are relevant to its operations and effective for annual reporting periods beginning on 1 July 2007. The adoption of these new and revised Standards and Interpretations did not have any effect on the fi nancial position or performance of the Consolidated Entity.
The Consolidated Entity has adopted AASB 7 Financial Instruments; Disclosures and all consequential amendments which became applicable on 1 January 2007. The adoption of this standard has only affected the disclosures in these fi nancial statements. There has been no effect on profi t and loss or the fi nancial position of the Consolidated Entity.
The Consolidated Entity has adopted AASB124 Related Party Disclosures and all consequential amendments which became applicable on 1 July 2007. The adoption of this standard has resulted in the transfer of the remuneration disclosures to the Remuneration Report section of the Directors’ Report. This has only affected the disclosures in these fi nancial statements. There has been no effect on profi t and loss or the fi nancial position of the Consolidated Entity.
Australian Accounting Standards and Interpretations that have recently been issued or amended but are not yet effective have not been adopted by the Consolidated Entity for the annual reporting period ending 30 June 2008. These are outlined in the table below:F
or p
erso
nal u
se o
nly
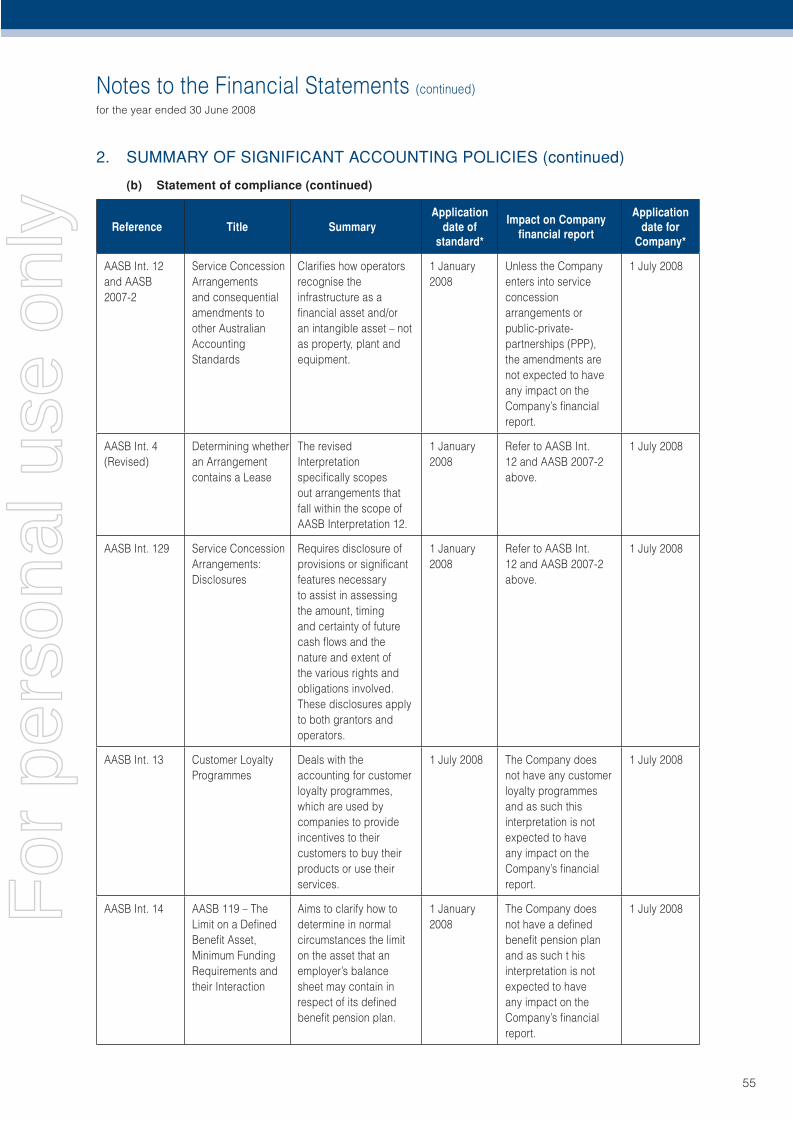
Notes to the Financial Statements (continued)
for the year ended 30 June 2008
55
Reference Title SummaryApplication
date of standard*
Impact on Company fi nancial report
Application date for
Company*
AASB Int. 12 and AASB 2007-2
Service Concession Arrangements and consequential amendments to other Australian Accounting Standards
Clarifi es how operators recognise the infrastructure as a fi nancial asset and/or an intangible asset – not as property, plant and equipment.
1 January 2008
Unless the Company enters into service concession arrangements or public-private-partnerships (PPP), the amendments are not expected to have any impact on the Company’s fi nancial report.
1 July 2008
AASB Int. 4 (Revised)
Determining whether an Arrangement contains a Lease
The revised Interpretation specifi cally scopes out arrangements that fall within the scope of AASB Interpretation 12.
1 January 2008
Refer to AASB Int. 12 and AASB 2007-2 above.
1 July 2008
AASB Int. 129 Service Concession Arrangements: Disclosures
Requires disclosure of provisions or signifi cant features necessary to assist in assessing the amount, timing and certainty of future cash fl ows and the nature and extent of the various rights and obligations involved. These disclosures apply to both grantors and operators.
1 January 2008
Refer to AASB Int. 12 and AASB 2007-2 above.
1 July 2008
AASB Int. 13 Customer Loyalty Programmes
Deals with the accounting for customer loyalty programmes, which are used by companies to provide incentives to their customers to buy their products or use their services.
1 July 2008 The Company does not have any customer loyalty programmes and as such this interpretation is not expected to have any impact on the Company’s fi nancial report.
1 July 2008
AASB Int. 14 AASB 119 – The Limit on a Defi ned Benefi t Asset, Minimum Funding Requirements and their Interaction
Aims to clarify how to determine in normal circumstances the limit on the asset that an employer’s balance sheet may contain in respect of its defi ned benefi t pension plan.
1 January 2008
The Company does not have a defi ned benefi t pension plan and as such t his interpretation is not expected to have any impact on the Company’s fi nancial report.
1 July 2008
2. SUMMARY OF SIGNIFICANT ACCOUNTING POLICIES (continued)
(b) Statement of compliance (continued)
For
per
sona
l use
onl
y
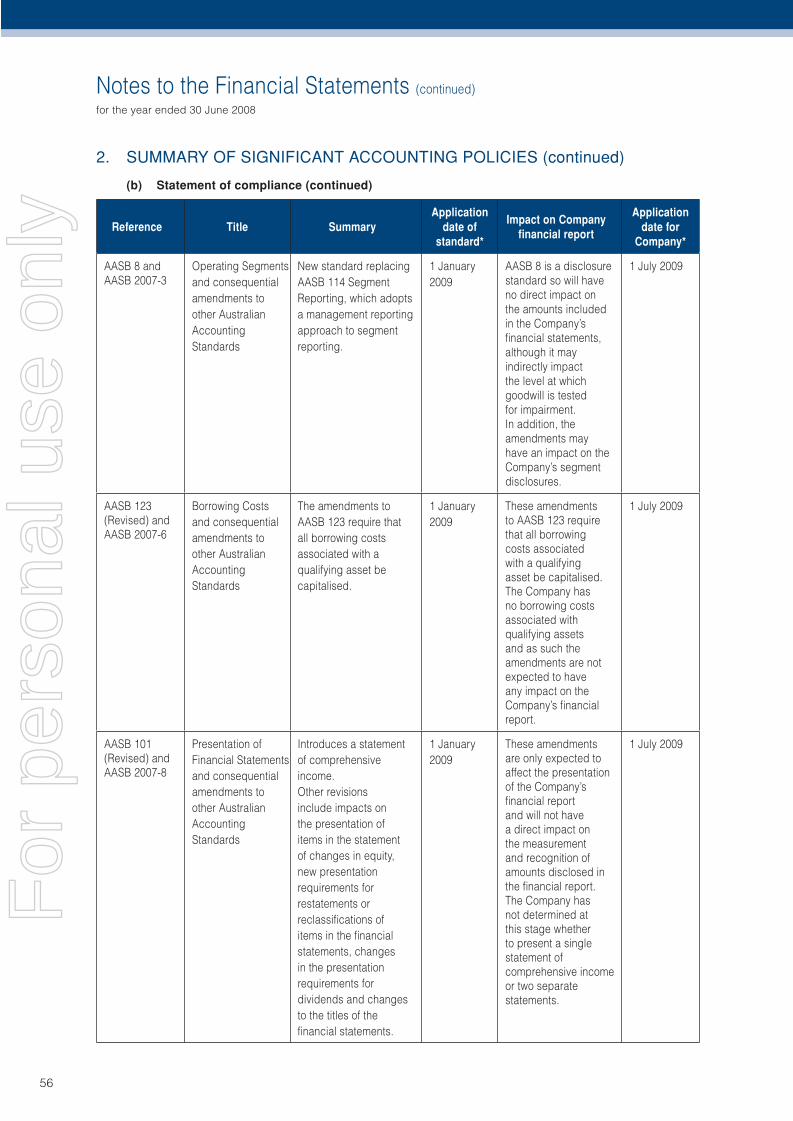
Notes to the Financial Statements (continued)
for the year ended 30 June 2008
56
Reference Title SummaryApplication
date of standard*
Impact on Company fi nancial report
Application date for
Company*
AASB 8 and AASB 2007-3
Operating Segments and consequential amendments to other Australian Accounting Standards
New standard replacing AASB 114 Segment Reporting, which adopts a management reporting approach to segment reporting.
1 January 2009
AASB 8 is a disclosure standard so will have no direct impact on the amounts included in the Company’s fi nancial statements, although it may indirectly impact the level at which goodwill is tested for impairment. In addition, the amendments may have an impact on the Company’s segment disclosures.
1 July 2009
AASB 123 (Revised) and AASB 2007-6
Borrowing Costs and consequential amendments to other Australian Accounting Standards
The amendments to AASB 123 require that all borrowing costs associated with a qualifying asset be capitalised.
1 January 2009
These amendments to AASB 123 require that all borrowing costs associated with a qualifying asset be capitalised. The Company has no borrowing costs associated with qualifying assets and as such the amendments are not expected to have any impact on the Company’s fi nancial report.
1 July 2009
AASB 101 (Revised) and AASB 2007-8
Presentation of Financial Statements and consequential amendments to other Australian Accounting Standards
Introduces a statement of comprehensive income.Other revisions include impacts on the presentation of items in the statement of changes in equity, new presentation requirements for restatements or reclassifi cations of items in the fi nancial statements, changes in the presentation requirements for dividends and changes to the titles of the fi nancial statements.
1 January2009
These amendments are only expected to affect the presentation of the Company’s fi nancial report and will not have a direct impact on the measurement and recognition of amounts disclosed in the fi nancial report. The Company has not determined at this stage whether to present a single statement of comprehensive income or two separate statements.
1 July 2009
2. SUMMARY OF SIGNIFICANT ACCOUNTING POLICIES (continued)
(b) Statement of compliance (continued)
For
per
sona
l use
onl
y
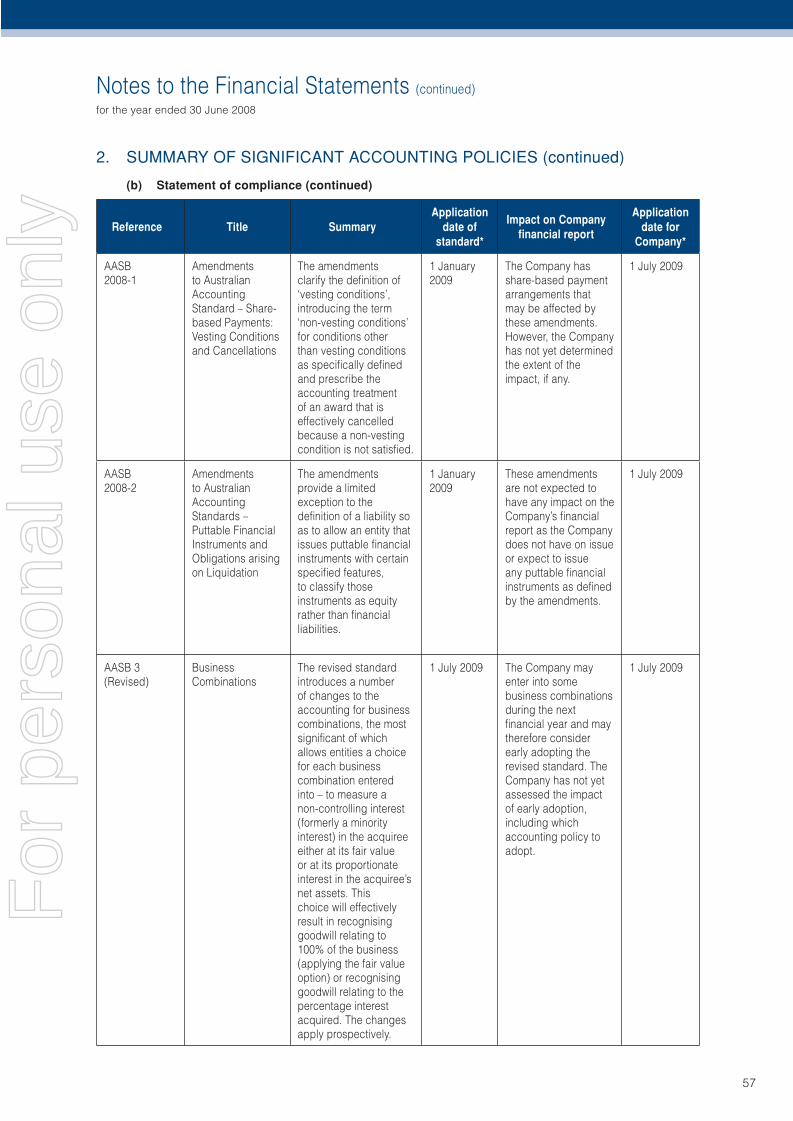
Notes to the Financial Statements (continued)
for the year ended 30 June 2008
57
Reference Title SummaryApplication
date of standard*
Impact on Company fi nancial report
Application date for
Company*
AASB2008-1
Amendments to Australian Accounting Standard – Share-based Payments: Vesting Conditions and Cancellations
The amendments clarify the defi nition of ‘vesting conditions’, introducing the term ‘non-vesting conditions’ for conditions other than vesting conditions as specifi cally defi ned and prescribe the accounting treatment of an award that is effectively cancelled because a non-vesting condition is not satisfi ed.
1 January2009
The Company has share-based payment arrangements that may be affected by these amendments. However, the Company has not yet determined the extent of the impact, if any.
1 July 2009
AASB2008-2
Amendments to Australian Accounting Standards – Puttable Financial Instruments and Obligations arising on Liquidation
The amendments provide a limited exception to the defi nition of a liability so as to allow an entity that issues puttable fi nancial instruments with certain specifi ed features, to classify those instruments as equity rather than fi nancial liabilities.
1 January2009
These amendments are not expected to have any impact on the Company’s fi nancial report as the Company does not have on issue or expect to issue any puttable fi nancial instruments as defi ned by the amendments.
1 July 2009
AASB 3 (Revised)
Business Combinations
The revised standard introduces a number of changes to the accounting for business combinations, the most signifi cant of which allows entities a choice for each business combination entered into – to measure a non-controlling interest (formerly a minority interest) in the acquiree either at its fair value or at its proportionate interest in the acquiree’s net assets. This choice will effectively result in recognising goodwill relating to 100% of the business (applying the fair value option) or recognising goodwill relating to the percentage interest acquired. The changes apply prospectively.
1 July 2009 The Company may enter into some business combinations during the next fi nancial year and may therefore consider early adopting the revised standard. The Company has not yet assessed the impact of early adoption, including which accounting policy to adopt.
1 July 2009
2. SUMMARY OF SIGNIFICANT ACCOUNTING POLICIES (continued)
(b) Statement of compliance (continued)
For
per
sona
l use
onl
y
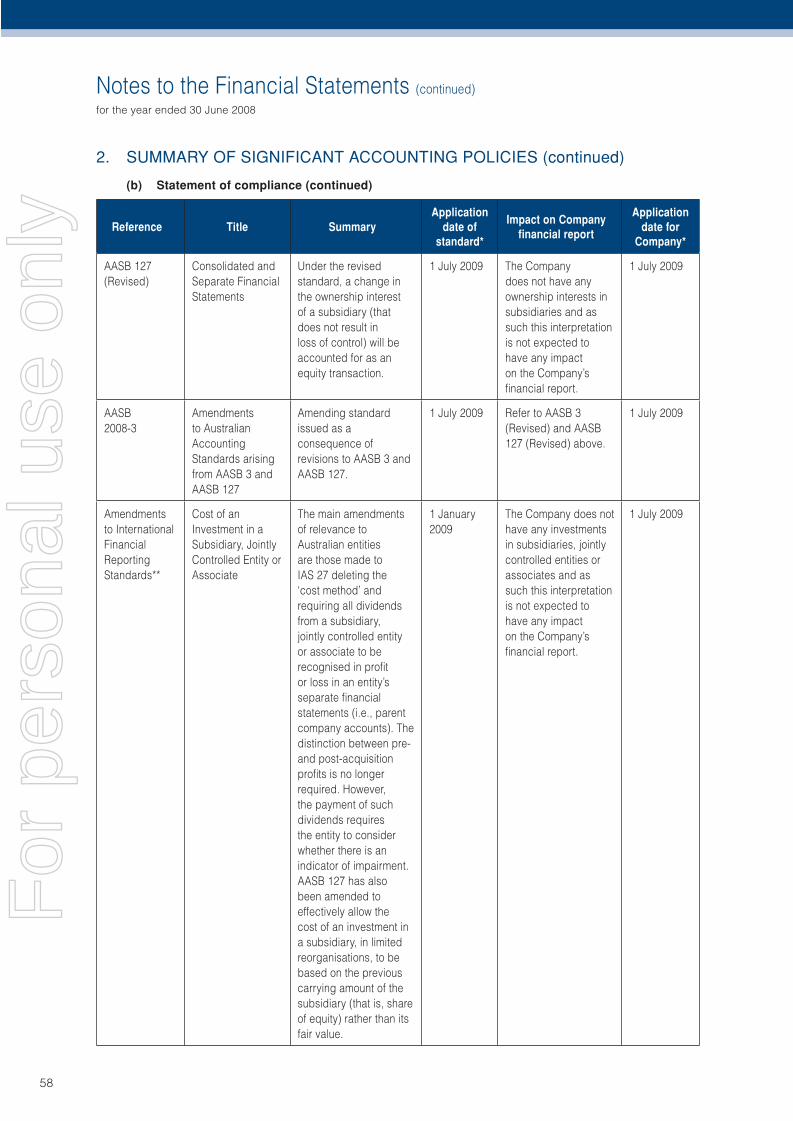
Notes to the Financial Statements (continued)
for the year ended 30 June 2008
58
Reference Title SummaryApplication
date of standard*
Impact on Company fi nancial report
Application date for
Company*
AASB 127 (Revised)
Consolidated and Separate Financial Statements
Under the revised standard, a change in the ownership interest of a subsidiary (that does not result in loss of control) will be accounted for as an equity transaction.
1 July 2009 The Company does not have any ownership interests in subsidiaries and as such this interpretation is not expected to have any impact on the Company’s fi nancial report.
1 July 2009
AASB2008-3
Amendments to Australian Accounting Standards arising from AASB 3 and AASB 127
Amending standard issued as a consequence of revisions to AASB 3 and AASB 127.
1 July 2009 Refer to AASB 3 (Revised) and AASB 127 (Revised) above.
1 July 2009
Amendments to International Financial Reporting Standards**
Cost of an Investment in a Subsidiary, Jointly Controlled Entity or Associate
The main amendments of relevance to Australian entities are those made to IAS 27 deleting the ‘cost method’ and requiring all dividends from a subsidiary, jointly controlled entity or associate to be recognised in profi t or loss in an entity’s separate fi nancial statements (i.e., parent company accounts). The distinction between pre- and post-acquisition profi ts is no longer required. However, the payment of such dividends requires the entity to consider whether there is an indicator of impairment.AASB 127 has also been amended to effectively allow the cost of an investment in a subsidiary, in limited reorganisations, to be based on the previous carrying amount of the subsidiary (that is, share of equity) rather than its fair value.
1 January2009
The Company does not have any investments in subsidiaries, jointly controlled entities or associates and as such this interpretation is not expected to have any impact on the Company’s fi nancial report.
1 July 2009
2. SUMMARY OF SIGNIFICANT ACCOUNTING POLICIES (continued)
(b) Statement of compliance (continued)
For
per
sona
l use
onl
y
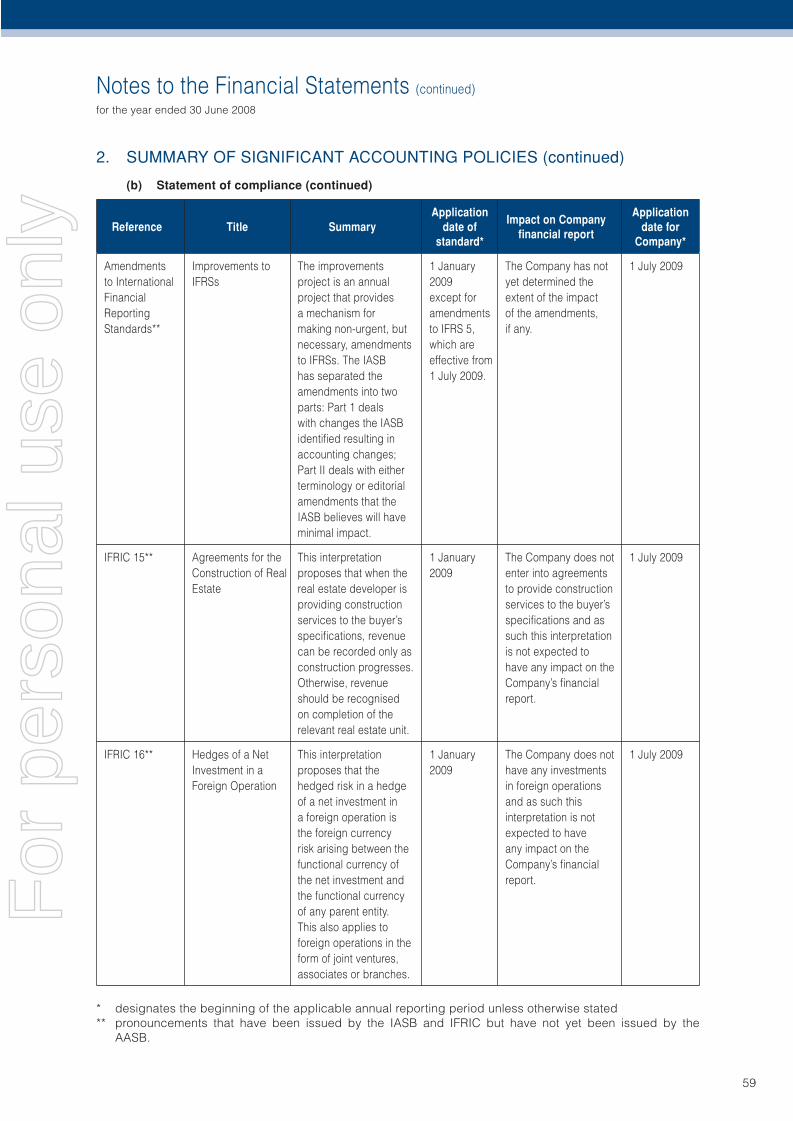
Notes to the Financial Statements (continued)
for the year ended 30 June 2008
59
Reference Title SummaryApplication
date of standard*
Impact on Company fi nancial report
Application date for
Company*
Amendments to International Financial Reporting Standards**
Improvements to IFRSs
The improvements project is an annual project that provides a mechanism for making non-urgent, but necessary, amendments to IFRSs. The IASB has separated the amendments into two parts: Part 1 deals with changes the IASB identifi ed resulting in accounting changes; Part II deals with either terminology or editorial amendments that the IASB believes will have minimal impact.
1 January 2009 except for amendments to IFRS 5, which are effective from 1 July 2009.
The Company has not yet determined the extent of the impact of the amendments, if any.
1 July 2009
IFRIC 15** Agreements for the Construction of Real Estate
This interpretation proposes that when the real estate developer is providing construction services to the buyer’s specifi cations, revenue can be recorded only as construction progresses. Otherwise, revenue should be recognised on completion of the relevant real estate unit.
1 January 2009
The Company does not enter into agreements to provide construction services to the buyer’s specifi cations and as such this interpretation is not expected to have any impact on the Company’s fi nancial report.
1 July 2009
IFRIC 16** Hedges of a Net Investment in a Foreign Operation
This interpretation proposes that the hedged risk in a hedge of a net investment in a foreign operation is the foreign currency risk arising between the functional currency of the net investment and the functional currency of any parent entity. This also applies to foreign operations in the form of joint ventures, associates or branches.
1 January 2009
The Company does not have any investments in foreign operations and as such this interpretation is not expected to have any impact on the Company’s fi nancial report.
1 July 2009
* designates the beginning of the applicable annual reporting period unless otherwise stated** pronouncements that have been issued by the IASB and IFRIC but have not yet been issued by the
AASB.
2. SUMMARY OF SIGNIFICANT ACCOUNTING POLICIES (continued)
(b) Statement of compliance (continued)
For
per
sona
l use
onl
y
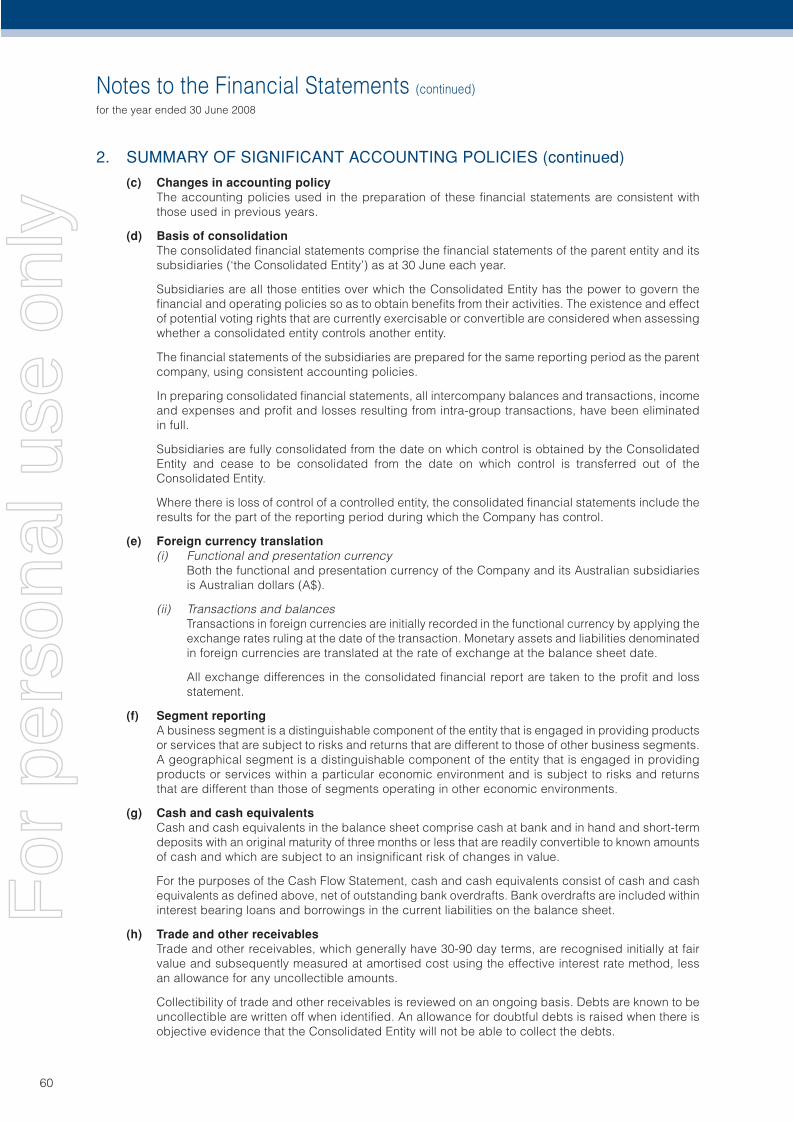
Notes to the Financial Statements (continued)
for the year ended 30 June 2008
60
2. SUMMARY OF SIGNIFICANT ACCOUNTING POLICIES (continued)
(c) Changes in accounting policyThe accounting policies used in the preparation of these fi nancial statements are consistent with those used in previous years.
(d) Basis of consolidationThe consolidated fi nancial statements comprise the fi nancial statements of the parent entity and its subsidiaries (‘the Consolidated Entity’) as at 30 June each year.
Subsidiaries are all those entities over which the Consolidated Entity has the power to govern the fi nancial and operating policies so as to obtain benefi ts from their activities. The existence and effect of potential voting rights that are currently exercisable or convertible are considered when assessing whether a consolidated entity controls another entity.
The fi nancial statements of the subsidiaries are prepared for the same reporting period as the parent company, using consistent accounting policies.
In preparing consolidated fi nancial statements, all intercompany balances and transactions, income and expenses and profi t and losses resulting from intra-group transactions, have been eliminated in full.
Subsidiaries are fully consolidated from the date on which control is obtained by the Consolidated Entity and cease to be consolidated from the date on which control is transferred out of the Consolidated Entity.
Where there is loss of control of a controlled entity, the consolidated fi nancial statements include the results for the part of the reporting period during which the Company has control.
(e) Foreign currency translation(i) Functional and presentation currency
Both the functional and presentation currency of the Company and its Australian subsidiaries is Australian dollars (A$).
(ii) Transactions and balancesTransactions in foreign currencies are initially recorded in the functional currency by applying the exchange rates ruling at the date of the transaction. Monetary assets and liabilities denominated in foreign currencies are translated at the rate of exchange at the balance sheet date.
All exchange differences in the consolidated fi nancial report are taken to the profi t and loss statement.
(f) Segment reportingA business segment is a distinguishable component of the entity that is engaged in providing products or services that are subject to risks and returns that are different to those of other business segments. A geographical segment is a distinguishable component of the entity that is engaged in providing products or services within a particular economic environment and is subject to risks and returns that are different than those of segments operating in other economic environments.
(g) Cash and cash equivalentsCash and cash equivalents in the balance sheet comprise cash at bank and in hand and short-term deposits with an original maturity of three months or less that are readily convertible to known amounts of cash and which are subject to an insignifi cant risk of changes in value.
For the purposes of the Cash Flow Statement, cash and cash equivalents consist of cash and cash equivalents as defi ned above, net of outstanding bank overdrafts. Bank overdrafts are included within interest bearing loans and borrowings in the current liabilities on the balance sheet.
(h) Trade and other receivablesTrade and other receivables, which generally have 30-90 day terms, are recognised initially at fair value and subsequently measured at amortised cost using the effective interest rate method, less an allowance for any uncollectible amounts.
Collectibility of trade and other receivables is reviewed on an ongoing basis. Debts are known to be uncollectible are written off when identifi ed. An allowance for doubtful debts is raised when there is objective evidence that the Consolidated Entity will not be able to collect the debts.
For
per
sona
l use
onl
y
Notes to the Financial Statements (continued)
for the year ended 30 June 2008
61
2. SUMMARY OF SIGNIFICANT ACCOUNTING POLICIES (Continued)
(i) InventoriesInventories are valued at the lower of cost and net realisable value.
Cost includes expenditure incurred in acquiring and bringing the inventories to their existing condition and location and is determined using the weighted average cost method.
(j) Derivative fi nancial instruments and hedgingThe Consolidated Entity uses derivative fi nancial instruments to manage commodity price exposures. Such derivative fi nancial instruments are initially recorded at fair value on the date on which the derivative contract is entered into and are subsequently remeasured to fair value. Certain derivative instruments are also held for trading for the purpose of making short term gains. None of the derivatives qualify for hedge accounting and changes in fair value are recognised immediately in profi t or loss in other revenue and expenses. Derivatives are carried as assets when their fair value is positive and as liabilities when their fair value is negative.
(k) Available-for-sale investmentsAll available-for-sale investments are initially recognised at fair value plus directly attributable transaction costs.
Available-for-sale investments are those non-derivative fi nancial assets, principally equity securities, that are designated as available-for-sale.
After initial recognition, available-for-sale investments are measured at fair value. Gains or losses are recognised as a separate component of equity until the investment is sold, collected or otherwise disposed of, or until the investment is determined to be impaired, at which time the cumulative gain or loss previously reported in equity is included in the income statement.
The fair value of investments that are actively traded in organised markets is determined by reference to quoted market bid prices at the close of business on the balance sheet date.
For investments with no active market, fair value is determined using valuation techniques. Such valuation techniques include using recent arm’s length transactions; reference to the current market value of another instrument that is substantially the same; discounted cash fl ow analysis and option pricing models. Where fair value cannot be reliably measured for certain unquoted investments, these investments are measured at cost.
(l) Investments in associatesThe Consolidated Entity’s investment in its associates is accounted for using the equity method of accounting in the consolidated fi nancial statements and at cost in the parent. The associates are entities over which the Consolidated Entity has signifi cant infl uence and that are neither subsidiaries nor joint ventures.
The Consolidated Entity generally deems it has signifi cant infl uence if it has over 20% of the voting rights.
Under the equity method, investments in the associates are carried in the consolidated balance sheet at cost plus post-acquisition changes in the Consolidated Entity’s share of net assets of the associates. Goodwill relating to an associate is included in the carrying amount of the investment and is not amortised. After application of the equity method, the Consolidated Entity determines whether it is necessary to recognise any impairment loss with respect to the Consolidated Entity’s net investment in associates.
The Consolidated Entity’s share of its associates’ post-acquisition profi ts or losses is recognised in the income statement, and its share of post-acquisition movements in reserves is recognised in reserves. The cumulative post-acquisition movements are adjusted against the carrying amount of the investment. Dividends receivable from associates are recognised in the parent entity’s income statement, while in the consolidated fi nancial statements they reduce the carrying amount of the investment.
When the Consolidated Entity’s share of losses in an associate equals or exceeds its interest in the associate, including any unsecured long-term receivables and loans, the Consolidated Entity does not recognise further losses, unless it has incurred obligations or made payments on behalf of the associate.
For
per
sona
l use
onl
y
Notes to the Financial Statements (continued)
for the year ended 30 June 2008
62
2. SUMMARY OF SIGNIFICANT ACCOUNTING POLICIES (continued)
(l) Investments in associates (continued)The reporting dates of the associates and the Consolidated Entity are identical and the associates’ accounting policies conform to those used by the Consolidated Entity for like transactions and events in similar.
(m) Business combinationsThe purchase method of accounting is used to account for all business combinations regardless of whether equity instruments or other assets are acquired. Cost is measured as the fair value of the assets given, shares issued or liabilities incurred or assumed at the date of exchange plus costs directly attributable to the combination. Where equity instruments are issued in a business combination, the fair value of the instruments is their published market price as at the date of exchange unless, in rare circumstances, it can be demonstrated that the published process at the date of exchange is an unreliable indicator of fair value and that other evidence and valuation methods provide a more reliable measure of fair value. Transaction costs arising on the issue of equity instruments are recognised directly in equity.
Except for non-current assets or disposal groups classifi ed as held for sale (which are measured at fair value less costs to sell), all identifi able assets acquired and liabilities and contingent liabilities assumed in a business combination are measured initially at their fair values at the acquisition date, irrespective of the extent of any minority interest. The excess of the cost of the business over the net fair value of the Consolidated Entity’s share of the identifi able assets acquired is recognised as goodwill. If the cost of acquisition is less than the Consolidated Entity’s share of the net fair value of the identifi able net assets of the subsidiary, the difference is recognised as a gain in the income statement, but only after a reassessment of the identifi cation and measurement of the net assets acquired.
Where settlement of any part of the consideration is deferred, the amounts payable in the future are discounted to their present value as at the date of exchange. The discount rate used is the entity’s incremental borrowing rate, being the rate at which a similar borrowing could be obtained from an independent fi nancier under comparable terms and conditions.
(n) Property, plant and equipmentPlant and equipment is stated at historical cost less accumulated depreciation and any impairment in value.
Capital work-in-progress is stated at cost and comprises all costs directly attributable to bringing the assets under construction ready to their intended use. Capital work-in-progress is transferred to property, plant and equipment at cost on completion.
Depreciation is calculated on a straight-line basis over the estimated useful life of the asset, or where appropriate, over the estimated life of the mine.
Major depreciation periods are:
– Mine specifi c plant and equipment is depreciated using – the shorter of life of mine or useful life. Useful life ranges from 2 to 10 years.
– Mine Buildings – the shorter of life of mine or useful life. Useful life ranges from 5 to 10 years.
– Offi ce Plant and equipment is depreciated at 33% per annum for computers and offi ce machines and 20% per annum for other offi ce equipment and furniture.
ImpairmentThe carrying values of plant and equipment are reviewed for impairment when events or changes in circumstances indicate the carrying value may not be recoverable.
For an asset that does not generate largely independent cash infl ows, the recoverable amount is determined for the cash-generating unit to which the asset belongs.
If any such indication exists and where the carrying values exceed the estimated recoverable amount, the assets or cash-generating units are written down to their recoverable amount.
For
per
sona
l use
onl
y
Notes to the Financial Statements (continued)
for the year ended 30 June 2008
63
2. SUMMARY OF SIGNIFICANT ACCOUNTING POLICIES (continued)
(n) Property, plant and equipment (continued)DerecognitionAn item of property, plant and equipment is derecognised upon disposal or when no future economic benefi ts are expected to arise from the continued use of the asset.
Any gain or loss arising on derecognition of the asset (calculated as the difference between the net disposal proceeds and the carrying amount of the item) is included in the income statement in the period the item is derecognised.
(o) Exploration and evaluation expenditureExpenditure on acquisition, exploration and evaluation relating to an area of interest is carried forward at cost where rights to tenure of the area of interest are current and;
i) it is expected that expenditure will be recouped through successful development and exploitation of the area of interest or alternatively by its sale and/or;
ii) exploration and evaluation activities are continuing in an area of interest but at balance date have not yet reached a stage which permits a reasonable assessment of the existence or otherwise of economically recoverable reserves.
A regular review is undertaken of each area of interest to determine the appropriateness of continuing to carry forward costs in relation to that area of interest. Where uncertainty exists as to the future viability of certain areas, the value of the area of interest is written off to the income statement or provided against.
ImpairmentThe carrying value of capitalised exploration and evaluation expenditure is assessed for impairment at the cash generating unit level whenever facts and circumstances suggest that the carrying amount of the asset may exceed its recoverable amount.
An impairment exists when the carrying amount of an asset or cash-generating unit exceeds its estimated recoverable amount. The asset or cash-generating unit is then written down to its recoverable amount. Any impairment losses are recognised in the income statement.
(p) Mine properties and developmentExpenditure on the acquisition and development of mine properties within an area of interest are carried forward at cost separately for each area of interest. Accumulated expenditure is amortised over the life of the area of interest to which such costs relate on a production output basis.
A regular review is undertaken of each area of interest to determine the appropriateness of continuing to carry forward costs in relation to that area of interest.
ImpairmentThe carrying value of capitalised mine properties and development expenditure is assessed for impairment whenever facts and circumstances suggest that the carrying amount of the asset may exceed its recoverable amount.
The recoverable amount of capitalised mine properties and development expenditure is the higher of fair value less costs to sell and value in use. In assessing value in use, the estimated future cash fl ows are discounted to their present value using a pre-tax discount rate that refl ects current market assessments of the time value of money and the risks specifi c to the asset.
For an asset that does not generate largely independent cash infl ows, recoverable amount is determined for the cash-generating unit to which the asset belongs, unless the asset’s value in use can be estimated to be close to its fair value.
An impairment exists when the carrying amount of an asset or cash-generating unit exceeds its estimated recoverable amount. The asset or cash-generating unit is then written down to its recoverable amount. Any impairment losses are recognised in the income statement.
For
per
sona
l use
onl
y
Notes to the Financial Statements (continued)
for the year ended 30 June 2008
64
2. SUMMARY OF SIGNIFICANT ACCOUNTING POLICIES (continued)
(q) IntangiblesIntangible assets acquired separately or in a business combination are initially measured at cost. The cost of an intangible asset acquired in a business combination is its fair value as at the date of acquisition. Following initial recognition, intangible assets are carried at cost less any accumulated amortisation and any accumulated impairment losses. Internally generated assets, excluding capitalised development costs, are not capitalised and expenditure is charged against profi ts or losses in the year the expenditure is incurred.
The useful lives of intangible assets are assessed to be either fi nite or indefi nite. Intangible assets with fi nite lives are amortised over the useful life and assessed for impairment whenever there is an indication that the intangible asset may be impaired. The amortisation period and the amortisation method for an intangible asset with a fi nite useful life is reviewed at least at each fi nancial year-end. Changes in the expected useful life or the expected pattern of consumption of future economic benefi ts embodied in the asset are accounted for by changing the amortisation period or method, as appropriate, which is a change in accounting estimate. The amortisation expense on intangible assets with fi nite lives is recognised in profi t or loss in the expense category consistent with the function of the intangible asset.
Intangible assets with indefi nite useful lives are tested for impairment annually either individually or at the cash-generating unit level. Such intangibles are not amortised. The useful life of an intangible asset with an indefi nite life is reviewed each reporting period to determine whether indefi nite life assessment continues to be supportable. If not, the change in the useful life assessment from indefi nite to fi nite is accounted for as a change in an accounting estimate and is thus accounted for on a prospective basis.
Research and development costsResearch costs are expensed as incurred. An asset arising from development expenditure on an internal project is recognised only when the Consolidated Entity can demonstrate the technical feasibility of completing the intangible asset so that it will be available for use or sale, or its intention to complete and its ability to use or sell the asset, how the asset will generate future economic benefi ts, the availability of resources to complete the development and the ability to measure reliably the expenditure attributable to the intangible asset during its development. Following the initial recognition of the development expenditure, the cost model is applied requiring the asset to be carried at cost less any accumulated amortisation and accumulated impairment losses. Any expenditure so capitalised is amortised over the period of expected benefi ts from the related project.
The carrying value of an asset arising from development expenditure is tested for impairment annually when the asset is not yet available for use, or more frequently when an indication of impairment arises during the reporting period.
A summary of policies applied to the Consolidated Entity’s intangible assets is as follows:
Royalty AssetsUseful livesFinite
Amortisation method usedAmortised over the period of expected future benefi t from the related project on a unit of production basis.
Internally generated or acquiredAcquired
Impairment testingAnnually and more frequently when an indication of impairment exists. The amortisation method is reviewed at each fi nancial period end.
D
For
per
sona
l use
onl
y
Notes to the Financial Statements (continued)
for the year ended 30 June 2008
65
2. SUMMARY OF SIGNIFICANT ACCOUNTING POLICIES (continued)
(q) Intangibles (continued)Development CostsUseful livesFinite
Amortisation method usedAmortised over the period of expected future benefi t from the related project on a straight-line basis.
Internally generated or acquiredInternally generated
Impairment testingAnnually for assets not yet available for use and more frequently when an indication of impairment exists. The amortisation method is reviewed at each fi nancial period end.
(r) Rehabilitation costsThe Group is required to decommission and rehabilitate mines and processing sites at the end of their producing lives to a condition acceptable to the relevant authorities.
The expected cost of any approved decommissioning or rehabilitation programme, discounted to its net present value, is provided when the related environmental disturbance occurs. The cost is capitalised when it gives rise to future benefi ts, whether the rehabilitation activity is expected to occur over the life of the operation or at the time of closure. The capitalised cost is amortised over the life of the operation and the increase in the net present value of the provision for the expected cost is included in fi nancing expenses. Expected decommissioning and rehabilitation costs are based on the discounted value of the estimated future cost of detailed plans prepared for each site. Where there is a change in the expected decommissioning and restoration costs, the value of the provision and any related asset are adjusted and the effect is recognised in profi t or loss on a prospective basis over the remaining life of the operation.
The estimated costs of rehabilitation are reviewed annually and adjusted as appropriate for changes in legislation, technology or other circumstances. Cost estimates are not reduced by potential proceeds from the sale of assets or from plant clean up at closure.
(s) Recoverable amount of assetsAt each reporting date, the Consolidated Entity assesses whether there is any indication that an asset may be impaired. Where an indicator of impairment exists, the Consolidated Entity makes a formal estimate of recoverable amount. Where the carrying amount of an asset exceeds its recoverable amount the asset is considered impaired and is written down to its recoverable amount.
The recoverable amount of plant and equipment, mine properties and development and exploration and evaluation expenditure is the higher of fair value less costs to sell and value in use. In assessing value in use, the estimated future cash fl ows are discounted to their present value using a pre-tax discount rate that refl ects current market assessments of the time value of money and the risks specifi c to the asset.
For an asset that does not generate largely independent cash infl ows, recoverable amount is determined for the cash-generating unit to which the assets belongs, unless the asset’s value in use can be estimated to be close to its fair value.
An assessment is also made at each reporting date as to whether there is any indication that a previously recognised impairment loss may no longer exist or may have decreased. If such indication exists, the recoverable amount is estimated. A previously recognised impairment loss is reversed only if there has been a change in the estimates used to determine the asset’s recoverable amount since the last impairment loss was recognised. If that is the case the carrying amount of the asset is increased to its recoverable amount. That increased amount cannot exceed the carrying amount that would have been determined, net of depreciation, had no impairment loss been recognised for the asset in prior years. Such reversal is recognised in profi t or loss unless the asset is carried at revalued amount, in which case the reversal is treated as a revaluation increase. After such a reversal the depreciation charge is adjusted in future periods to allocate the asset’s revised carrying amount, less any residual value, on a systematic basis over its remaining useful life.
For
per
sona
l use
onl
y
Notes to the Financial Statements (continued)
for the year ended 30 June 2008
66
2. SUMMARY OF SIGNIFICANT ACCOUNTING POLICIES (continued)
(t) Trade and other payablesTrade payables and other payables are carried at amortised cost. They represent liabilities for goods and services provided to the Consolidated Entity prior to the end of the fi nancial year that are unpaid and arise when the Consolidated Entity becomes obliged to make future payments in respect of the purchase of these goods and services. The amounts are unsecured and usually paid within 30 days of recognition.
(u) Interest-bearing loans and borrowingsAll loans and borrowings are initially recognised at the fair value of the consideration received less directly attributable transaction costs.
After initial recognition, interest-bearing loans and borrowings are subsequently measured at amortised cost using the effective interest rate method.
Borrowings are classifi ed as current liabilities unless the Consolidated Entity has the unconditional right to defer settlement of the liability for at least 12 months after the balance sheet date.
(v) Borrowing costsBorrowing costs are recognised as an expense when incurred, except when they relate to the funding of qualifying assets, at which time such borrowing costs are capitalised.
(w) ProvisionsProvisions are recognised when the Consolidated Entity has a present obligation (legal or constructive) as a result of a past event, it is probable that an outfl ow of resources embodying economic benefi ts will be required to settle the obligation and a reliable estimate can be made of the amount of the obligation.
Provisions are measured at the present value of management’s best estimate of the expenditure required to settle the present obligation at the balance sheet date. If the effect of the time value of money is material, provisions are discounted using a current pre-tax rate that refl ects the time value of money and, the risks specifi c to the liability. The increase in the provision resulting from the passage of time is recognised in fi nance costs.
(x) LeasesLeases are classifi ed at their inception as either operating or fi nance leases based on the economic substance of the agreement so as to refl ect the risks and benefi ts incidental to ownership.
(i) Operating LeasesThe minimum lease payments of operating leases, where the lessor effectively retains substantially all of the risks and benefi ts of ownership of the leased item, are recognised as an expense in the income statement on a straight-line basis over the lease term.
Contingent rentals are recognised as an expense in the fi nancial year in which they are incurred.
(ii) Finance LeasesLeases which effectively transfer substantially all the risks and benefi ts incidental to ownership of the leased item to the Consolidated Entity are capitalised at the inception of the lease at the fair value of the leased property or, if lower, at the present value of the minimum lease payments.
Lease payments are apportioned between the fi nance charges and reduction of the lease liability so as to achieve a constant rate of interest on the remaining balance of the liability. Finance charges are charged directly to the income statement.
Capitalised leased assets are depreciated over the estimated useful life of the asset or where appropriate, over the estimated life of the mine.
The cost of improvements to or on leasehold property is capitalised, disclosed as leasehold improvements, and amortised over the unexpired period of the lease or the estimated useful lives of the improvements, whichever is the shorter.
For
per
sona
l use
onl
y
Notes to the Financial Statements (continued)
for the year ended 30 June 2008
67
2. SUMMARY OF SIGNIFICANT ACCOUNTING POLICIES (continued)
(y) Issued capitalIssued and paid up capital is recognised at the fair value of the consideration received by the Consolidated Entity. Any transaction costs arising on the issue of ordinary shares are recognised directly in equity as a reduction in the proceeds received.
(z) RevenueRevenue is measured at the fair value of the consideration received or receivable to the extent it is probable that the economic benefi ts will fl ow to the Consolidated Entity and the revenue can be reliably measured. The following specifi c recognition criteria must also be met before revenue is recognised:
Tin salesRevenue from tin production is recognised when the signifi cant risks and rewards of ownership in the product has passed to the buyer and can be measured reliably.
Interest incomeRevenue is recognised as interest accrues using the effective interest method. This is a method of calculating the amortised cost of a fi nancial asset and allocating the interest income over the relevant period using the effective interest rate, which is the rate that exactly discounts estimated future cash receipts through the expected life of the fi nancial asset to the net carrying amount of the fi nancial asset.
Nickel royalty revenueRevenue from nickel royalties is recognised on an accruals basis in accordance with the substance of the relevant agreement.
(aa) Share-based payment transactionsThe Consolidated Entity provides benefi ts to employees (including Directors) in the form of share-based payment transactions, whereby employees render services in exchange for shares or rights over shares (equity-settled transactions).
The Consolidated Entity has one plan in place that provides these benefi ts. It is the Employee Share Option Plan (“ESOP”) which provides benefi ts to all employees including Directors. The scheme has no direct performance requirements but has specifi ed time restrictions on the exercise of options. The share options will vest after one year and employees and Directors are able to exercise the share options for up to three years after vesting before the options lapse. Where a participant ceases employment prior to the vesting of their share options, the share options are forfeited. Where a participant ceases employment after the vesting of their share options, the share options automatically lapse after six months of ceasing employment. The Company does not have a policy to prohibit executives from entering into arrangements to protect the value of unvested LTI awards.
The cost of these equity-settled transactions with employees is measured by reference to the fair value at the date at which they are granted. The fair value is determined by using a Black & Scholes model. Further details of which are given in note 31.
In valuing equity-settled transactions, no account is taken of any vesting conditions, other than conditions linked to the price of the shares of Metals X Limited (market conditions) if applicable.
The cost of equity-settled transactions is recognised, together with a corresponding increase in equity, over the period in which the performance and/or service conditions are fulfi lled (the vesting period), ending on the date on which the relevant employees become fully entitled to the award (the vesting date).
At each subsequent reporting date until vesting, the cumulative charge to the income statement is the product of (i) the grant date fair value of the award; (ii) the current best estimate of the number of awards that will vest, taking into account such factors as the likelihood of employee turnover during the vesting period and the likelihood of non-market performance conditions being meet; and (iii) the expired portion of the vesting period.
The charge to the income statement for the period is the cumulative amount as calculated above less the amounts already charged in previous periods. There is a corresponding credit to equity.
For
per
sona
l use
onl
y
Notes to the Financial Statements (continued)
for the year ended 30 June 2008
68
2. SUMMARY OF SIGNIFICANT ACCOUNTING POLICIES (continued)
(aa) Share-based payment transactions (continued)Until an award has vested, any amounts recorded are contingent and will be adjusted if more or fewer awards vest than were originally anticipated to do so. Any award subject to a market condition is considered to vest irrespective of whether or not the market condition is fulfi lled, provided that all other conditions are satisfi ed.
If the terms of an equity-settled award are modifi ed, as a minimum an expense is recognised as if the terms had not been modifi ed. An additional expense is recognised for any modifi cation that increases the total fair value of the share-based payment arrangement, or is otherwise benefi cial to the employee, as measured at the date of modifi cation.
If an equity-settled award is cancelled, it is treated as if it had vested on the date of cancellation, and any expense not yet recognised for the award is recognised immediately. However, if a new award is substituted for the cancelled award, and designated as a replacement award on the date that it is granted, the cancelled and new award are treated as if they were a modifi cation of the original award, as described in the previous paragraph.
The dilutive effect, if any, of outstanding options is refl ected as additional share dilution in the computation of earnings per share.
(ab) Employee benefi ts(i) Wages, salaries, annual leave and sick leave
Liabilities for wages and salaries, including non-monetary benefi ts, annual leave and accumulating sick leave expected to be settled within 12 months of the reporting date are recognised in respect of employees’ services up to the reporting date. They are measured at the amounts expected to be paid when the liabilities are settled. Liabilities for non-accumulating sick leave are recognised when the leave is taken and are measured at the rates paid or payable.
(ii) Long service leaveThe liability for long service leave is recognised and measured as the present value of expected future payments to be made in respect of services provided by employees up to the reporting date using the projected unit credit method. Consideration is given to expected future wage and salary levels, experience of employee departures, and periods of service. Expected future payments are discounted using market yields at the reporting date on national government bonds with terms to maturity and currencies that match, as closely as possible, the estimated future cash outfl ows.
(iii) SuperannuationContributions made by the Consolidated Entity to employee superannuation funds, which are defi ned contribution plans, are charged as an expense when incurred.
(ac) Income taxThe Consolidated Entity entered into a tax consolidated group as of 1 July 2004.
Deferred income tax is provided on all temporary differences at the balance sheet date between the tax bases of assets and liabilities and their carrying amounts for fi nancial reporting purposes.
Deferred income tax liabilities are recognised for all taxable temporary differences:
• when the deferred income tax liability arises from the initial recognition of an asset or liability in a transaction that is not a business combination and, at the time of the transaction, affects neither the accounting profi t nor taxable profi t or loss; and
• when the taxable temporary differences associated with investments in subsidiaries, associates and interests in joint ventures, except where the timing of the reversal of the temporary differences can be controlled and it is probable that the temporary differences will not reverse in the foreseeable future.
For
per
sona
l use
onl
y
Notes to the Financial Statements (continued)
for the year ended 30 June 2008
69
2. SUMMARY OF SIGNIFICANT ACCOUNTING POLICIES (continued)
(ac) Income tax (continued)Deferred income tax assets are recognised for all deductible temporary differences, carry-forward of unused tax assets and unused tax losses, to the extent that it is probable that taxable profi t will be available against which the deductible temporary differences, and the carry-forward of unused tax assets and unused tax losses can be utilised:
• when the deferred income tax asset relating to the deductible temporary difference arises from the initial recognition of an asset or liability in a transaction that is not a business combination and, at the time of the transaction, affects neither the accounting profi t nor taxable profi t or loss; and
• when the deductible temporary differences associated with investments in subsidiaries, associates and interests in joint ventures, deferred tax assets are only recognised to the extent that it is probable that the temporary differences will reverse in the foreseeable future and taxable profi t will be available against which the temporary differences can be utilised.
The carrying amount of deferred income tax assets is reviewed at each balance sheet date and reduced to the extent that it is no longer probable that suffi cient taxable profi t will be available to allow all or part of the deferred income tax asset to be utilised.
Unrecognised income taxes are reassessed at each balance sheet and are recognised to the extent that it has become probable that future taxable profi t will allow the deferred tax asset to be recovered.
Deferred income tax assets and liabilities are measured at the tax rates that are expected to apply to the year when the asset is realised or the liability is settled, based on tax rates (and tax laws) that have been enacted or substantively enacted at the balance sheet date.
Income taxes relating to items recognised directly in equity are recognised in equity and not in the income statement.
Deferred tax assets and deferred tax liabilities are offset only if a legally enforceable right exists to set off current tax assets against current tax liabilities and the deferred tax assets and liabilities relate to the same entity and the same taxation authority.
Tax consolidation legislationMetals X Limited and its wholly-owned Australian controlled entities have implemented the tax consolidation legislation as of 1 July 2004. The head entity, Metals X Limited and the controlled entities in the tax consolidated group continue to account for their own current and deferred tax amounts. The Consolidated Entity has applied the group allocation approach in determining the appropriate amount of current taxes and deferred taxes to allocate to members of the tax consolidated group.
(ad) Other taxesRevenues, expenses and assets are recognised net of the amount of GST except:
• where the GST incurred on a purchase of goods and services is not recoverable from the taxation authority, in which case the GST is recognised as part of the cost of acquisition of the asset or as part of the expense item as applicable; and
• receivables and payables are stated with the amount of GST included.
The net amount of GST recoverable from, or payable to, the taxation authority is included as part of receivables or payables in the balance sheet.
Cash fl ows are included in the Cash Flow Statement on a gross basis and the GST component of cash fl ows arising from investing and fi nancing activities, which is recoverable from, or payable to, the taxation authority are classifi ed as operating cash fl ows.
Commitments and contingencies are disclosed net of amounts of GST recoverable from, or payable to, the taxation authority.
For
per
sona
l use
onl
y
Notes to the Financial Statements (continued)
for the year ended 30 June 2008
70
2. SUMMARY OF SIGNIFICANT ACCOUNTING POLICIES (continued)
(ae) Earnings per shareBasic earnings per share is calculated as net profi t attributable to members of the parent, adjusted to exclude any costs of servicing equity (other than dividends) and preference share dividends, divided by the weighted average number of ordinary shares, adjusted for any bonus element.
Diluted earnings per share is calculated as net profi t attributable to members of the parent adjusted for:
• cost of servicing equity (other than dividends) and preference share dividends;
• the after tax effect of dividends and interest associated with dilutive potential ordinary shares that have been recognised as expenses; and
• other non-discriminatory changes in revenues or expenses during the period that would result from the dilution of potential ordinary shares;
divided by the weighted average number of ordinary shares and dilutive potential ordinary shares, adjusted for any bonus element.
3. SIGNIFICANT ACCOUNTING JUDGEMENTS, ESTIMATES AND ASSUMPTIONS
In applying the Consolidated Entity’s accounting policies management continually evaluates judgements, estimates and assumptions based on experience and other factors, including expectations of future events that may have an impact on the Consolidated Entity. All judgements, estimates and assumptions made are believed to be reasonable based on the most current set of circumstances available to management. Actual results may differ from the judgments, estimates and assumptions. Signifi cant judgements, estimates and assumptions made by management in the preparation of these fi nancial statements are outlined below:
(i) Signifi cant accounting judgments• Classifi cation of and valuation of investments
The Consolidated Entity has decided to classify investments in listed securities as “available-for-sale” investments and movements in fair value are recognised directly in equity. The fair value of listed shares has been determined by reference to published price quotations on an active market.
(ii) Signifi cant accounting estimates and assumptions• Mine rehabilitation provision
The Consolidated Entity assesses its mine rehabilitation provision on an annual basis in accordance with the accounting policy stated in note 2(r). Signifi cant judgement is required in determining the provision for mine rehabilitation as there are many transactions and other factors that will affect the ultimate liability payable to rehabilitate the mine site. Factors that will affect this liability include future development, changes in technology and changes in interest rates. When these factors change or become known in the future, such difference will impact the mine rehabilitation provision in the period in which they change or become known.
• Life of mine method of amortisation and depreciationThe Consolidated Entity applies the life of mine method of amortisation and depreciation to its mine specifi c plant and to mine properties and development based on ore tonnes mined. These calculations require the use of estimates and assumptions. Signifi cant judgement is required in assessing the available reserves and the production capacity of the plants to be depreciated under this method. Factors that are considered in determining reserves and resources and production capacity are the Consolidated Entity’s history of converting resources to reserves and the relevant time frames, the complexity of metallurgy, markets and future developments. When these factors change or become known in the future, such differences will impact pre tax profi t and carrying values of assets. During the year there was a decrease in the available reserves, which has had an impact on assets being amortised using the unit of production amortisation method resulting in an increase in the amortisation expense for the period.
For
per
sona
l use
onl
y
Notes to the Financial Statements (continued)
for the year ended 30 June 2008
71
3. SIGNIFICANT ACCOUNTING JUDGEMENTS, ESTIMATES AND ASSUMPTIONS (continued)
(ii) Signifi cant accounting estimates and assumptions (continued)• Share-based payment transactions
The Consolidated Entity measures the cost of equity-settled transactions with employees by reference to the fair value of the equity instruments at the date at which they are granted. The fair value is determined by using a Black & Scholes model, using the assumptions as discussed in note 31. The accounting estimates and assumptions relating to equity-settled share-based payments would have no impact on the carrying amounts of assets and liabilities in the next annual reporting period but may impact expenses and equity.
4. FINANCIAL RISK MANAGEMENT OBJECTIVES AND POLICIES
The Consolidated Entity’s and the Parent Entity’s principal fi nancial instruments comprise receivables, payables, unsecured loans, fi nance lease and hire purchase contracts, cash and short-term deposits and derivatives. The Consolidated Entity and the Parent Entity manages its exposure to key fi nancial risks, including interest rate risk and currency risk in accordance with the Consolidated Entity’s and the Parent Entity’s fi nancial risk management policy. The objective of the policy is to support the delivery of the Consolidated Entity’s and the Parent Entity’s fi nancial targets while protecting future fi nancial security.
The Consolidated Entity and the Parent Entity enters into derivative transactions, principally zero cost collar put and call options. The purpose is to manage the commodity price risks arising from the Consolidated Entity’s and the Parent Entity’s operations. These derivatives provide economic hedges, but do not qualify for hedge accounting and are based on limits set by the board. The main risks arising from the Consolidated Entity’s and the Parent Entity’s fi nancial instruments are interest rate risk, foreign currency risk, commodity risk, credit risk, equity price risk and liquidity risk. The Consolidated Entity and the Parent Entity uses different methods to measure and manage different types of risks to which it is exposed. These include monitoring levels of exposure to interest rate, foreign exchange risk and assessments of market forecasts for interest rate, foreign exchange and commodity prices. Ageing analysis of and monitoring of receivables are undertaken to manage credit risk, liquidity risk is monitored through the development of future rolling cash fl ow forecasts.
The board reviews and agrees policies for managing each of these risks as summarised below.
Primary responsibility for identifi cation and control of fi nancial risks rests with the Board. The Board reviews and agrees policies for managing each of the risks identifi ed below, including for interest rate risk, credit allowances and cash fl ow forecast projections.
Details of the signifi cant accounting policies and methods adopted, including the criteria for recognition, the basis of measurement and the basis on which income and expenses are recognised, in respect of each class of fi nancial asset, fi nancial liability and equity instrument are disclosed in note 2 to the fi nancial statements.
The Consolidated and Parent Entity’s principal fi nancial instruments include investments in cash, equities, payables, interest bearing liabilities and derivatives. The accounting classifi cation of each category of fi nancial instruments as defi ned in Note 2, and their carrying amounts, are set out below:
For
per
sona
l use
onl
y
Notes to the Financial Statements (continued)
for the year ended 30 June 2008
72
4. FINANCIAL RISK MANAGEMENT OBJECTIVES AND POLICIES (continued)
CONSOLIDATED ENTITY2008 Financial Available- Financial liabilities at for-sale Total Loans and assets held amortised fi nancial carrying Note receivables for trading cost assets amount
Financial assetsTrade and other receivables (current) 10 6,660,192 – – – 6,660,192Derivatives (current) 22 – 629,033 – – 629,033Derivatives (non-current) 22 – 306,474 – – 306,474 ___________________________________________________________________ 6,660,192 935,507 – – 7,595,699 ___________________________________________________________________
Financial liabilitiesTrade and other payables (current) 23 – – (16,132,120) – (16,132,120)Interest bearing loans (current) 24 – – (1,691,949) – (1,691,949)Interest bearing loans (non-current) 27 – – (3,895,658) – (3,895,658) ___________________________________________________________________ – – 21,719,727) – (21,719,727) ___________________________________________________________________Net maturity 6,660,192 935,507 (21,719,727) – (14,124,028) ___________________________________________________________________ ___________________________________________________________________
CONSOLIDATED ENTITY2007 Financial Available- Financial liabilities at for-sale Total Loans and assets held amortised fi nancial carrying Note receivables for trading cost assets amount
Financial assetsTrade and other receivables (current) 10 7,760,726 – – – 7,760,726Available-for-sale fi nancial assets 16 – – – 8,219,527 8,219,527 ___________________________________________________________________ 7,760,726 – – 8,219,527 15,980,253 ___________________________________________________________________
Financial liabilitiesTrade and other payables (current) 23 – – (8,021,837) – (8,021,837)Interest bearing loans (current) 24 – – (4,747,813) – (4,747,813)Interest bearing loans (non-current) 27 – – (6,556,707) – (6,556,707) ___________________________________________________________________ – – (19,326,357) – (19,326,357) ___________________________________________________________________Net maturity 7,760,726 – (19,326,357) 8,219,527 (3,346,104) ___________________________________________________________________ ___________________________________________________________________F
or p
erso
nal u
se o
nly
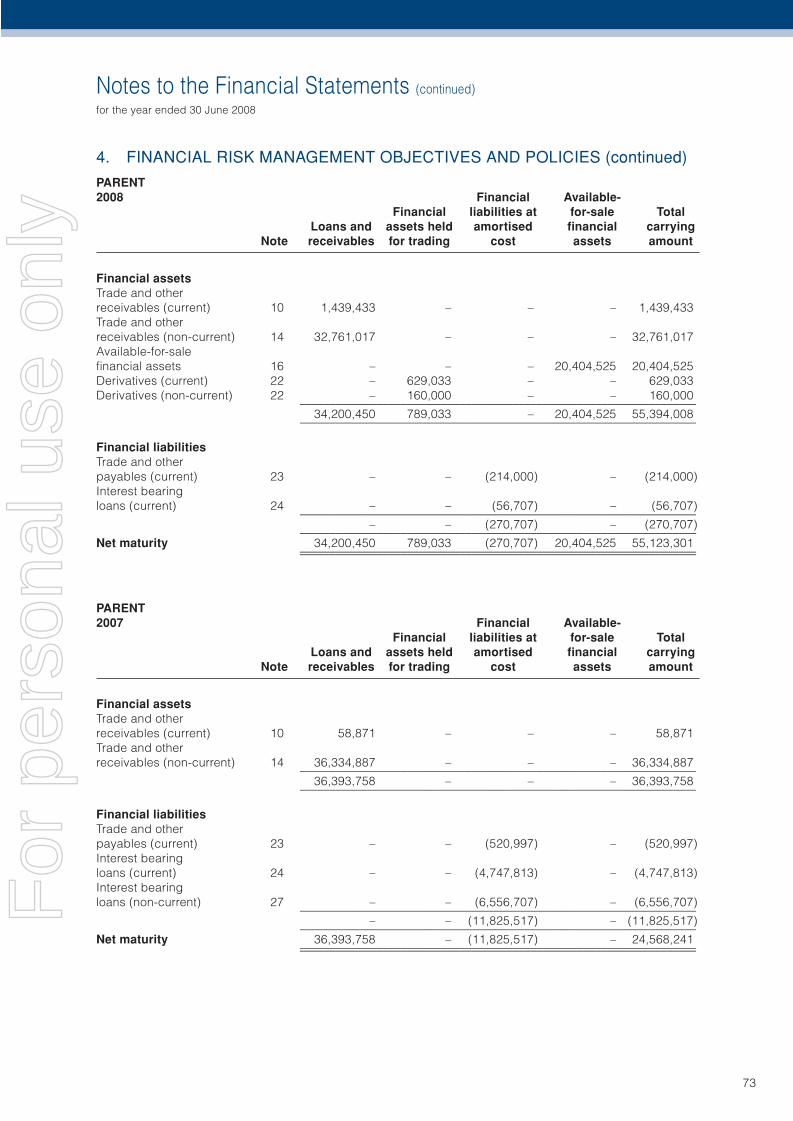
Notes to the Financial Statements (continued)
for the year ended 30 June 2008
73
4. FINANCIAL RISK MANAGEMENT OBJECTIVES AND POLICIES (continued)
PARENT2008 Financial Available- Financial liabilities at for-sale Total Loans and assets held amortised fi nancial carrying Note receivables for trading cost assets amount
Financial assetsTrade and other receivables (current) 10 1,439,433 – – – 1,439,433Trade and other receivables (non-current) 14 32,761,017 – – – 32,761,017Available-for-sale fi nancial assets 16 – – – 20,404,525 20,404,525Derivatives (current) 22 – 629,033 – – 629,033Derivatives (non-current) 22 – 160,000 – – 160,000 ___________________________________________________________________ 34,200,450 789,033 – 20,404,525 55,394,008 ___________________________________________________________________
Financial liabilitiesTrade and other payables (current) 23 – – (214,000) – (214,000)Interest bearing loans (current) 24 – – (56,707) – (56,707) ___________________________________________________________________ – – (270,707) – (270,707) ___________________________________________________________________Net maturity 34,200,450 789,033 (270,707) 20,404,525 55,123,301 ___________________________________________________________________ ___________________________________________________________________
PARENT2007 Financial Available- Financial liabilities at for-sale Total Loans and assets held amortised fi nancial carrying Note receivables for trading cost assets amount
Financial assetsTrade and other receivables (current) 10 58,871 – – – 58,871Trade and other receivables (non-current) 14 36,334,887 – – – 36,334,887 ___________________________________________________________________ 36,393,758 – – – 36,393,758 ___________________________________________________________________
Financial liabilitiesTrade and other payables (current) 23 – – (520,997) – (520,997)Interest bearing loans (current) 24 – – (4,747,813) – (4,747,813)Interest bearing loans (non-current) 27 – – (6,556,707) – (6,556,707) ___________________________________________________________________ – – (11,825,517) – (11,825,517) ___________________________________________________________________Net maturity 36,393,758 – (11,825,517) – 24,568,241 ___________________________________________________________________ ___________________________________________________________________
For
per
sona
l use
onl
y
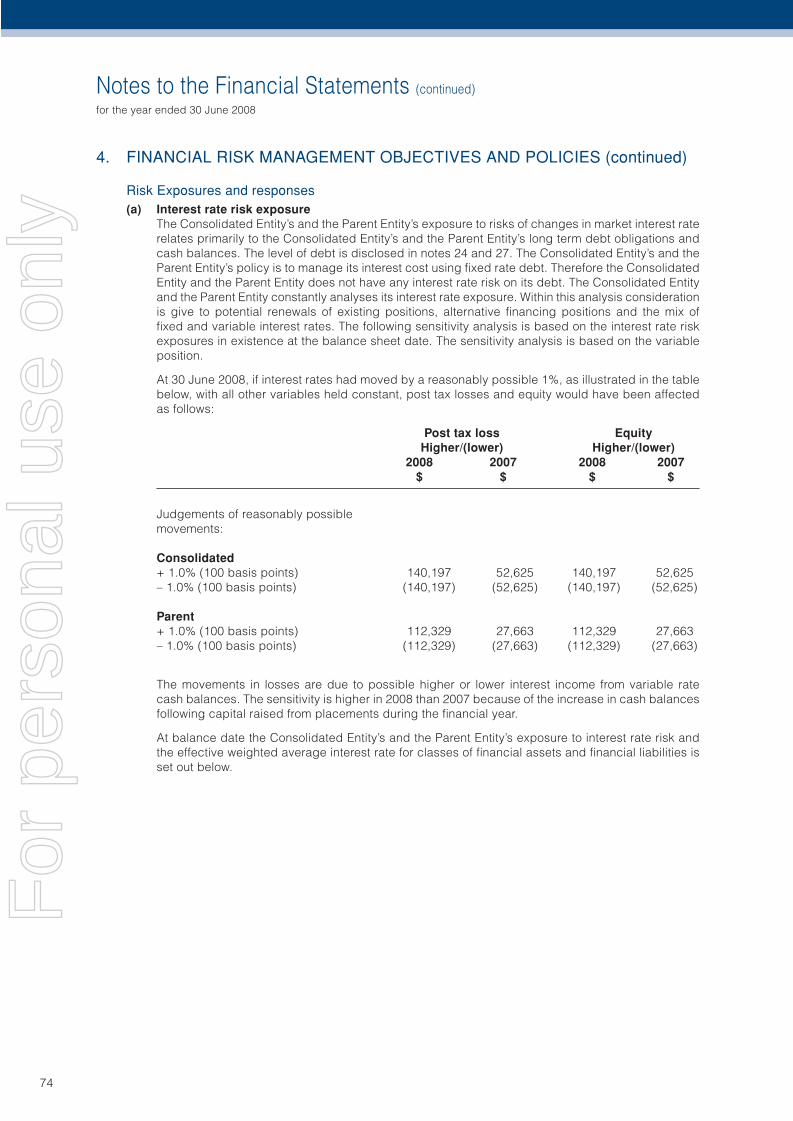
Notes to the Financial Statements (continued)
for the year ended 30 June 2008
74
4. FINANCIAL RISK MANAGEMENT OBJECTIVES AND POLICIES (continued)
Risk Exposures and responses(a) Interest rate risk exposure
The Consolidated Entity’s and the Parent Entity’s exposure to risks of changes in market interest rate relates primarily to the Consolidated Entity’s and the Parent Entity’s long term debt obligations and cash balances. The level of debt is disclosed in notes 24 and 27. The Consolidated Entity’s and the Parent Entity’s policy is to manage its interest cost using fi xed rate debt. Therefore the Consolidated Entity and the Parent Entity does not have any interest rate risk on its debt. The Consolidated Entity and the Parent Entity constantly analyses its interest rate exposure. Within this analysis consideration is give to potential renewals of existing positions, alternative fi nancing positions and the mix of fi xed and variable interest rates. The following sensitivity analysis is based on the interest rate risk exposures in existence at the balance sheet date. The sensitivity analysis is based on the variable position.
At 30 June 2008, if interest rates had moved by a reasonably possible 1%, as illustrated in the table below, with all other variables held constant, post tax losses and equity would have been affected as follows:
Post tax loss Equity Higher/(lower) Higher/(lower) 2008 2007 2008 2007 $ $ $ $
Judgements of reasonably possible movements:
Consolidated+ 1.0% (100 basis points) 140,197 52,625 140,197 52,625– 1.0% (100 basis points) (140,197) (52,625) (140,197) (52,625)
Parent+ 1.0% (100 basis points) 112,329 27,663 112,329 27,663– 1.0% (100 basis points) (112,329) (27,663) (112,329) (27,663)
The movements in losses are due to possible higher or lower interest income from variable rate cash balances. The sensitivity is higher in 2008 than 2007 because of the increase in cash balances following capital raised from placements during the fi nancial year.
At balance date the Consolidated Entity’s and the Parent Entity’s exposure to interest rate risk and the effective weighted average interest rate for classes of fi nancial assets and fi nancial liabilities is set out below.
For
per
sona
l use
onl
y
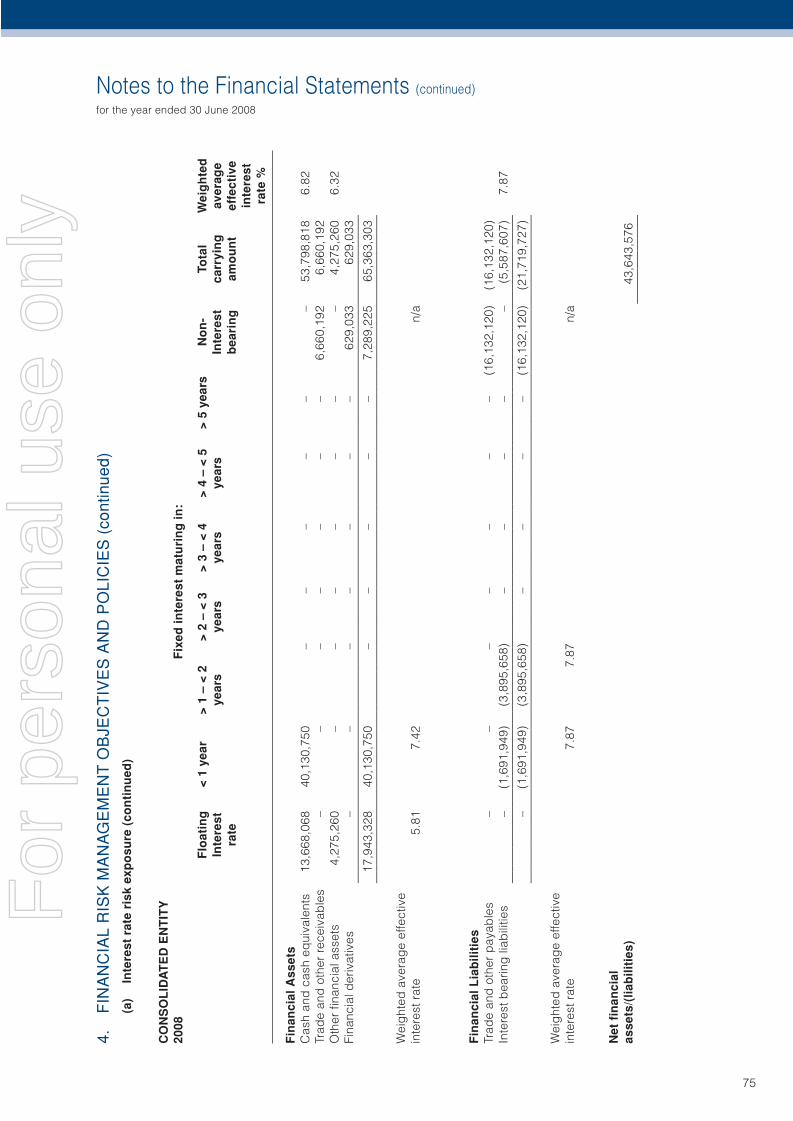
Notes to the Financial Statements (continued)
for the year ended 30 June 2008
75
4.
FIN
AN
CIA
L R
ISK
MA
NA
GE
ME
NT
OB
JEC
TIV
ES
AN
D P
OLI
CIE
S (
cont
inue
d)(a
) In
tere
st r
ate
risk
exp
osu
re (
con
tin
ued
)
CO
NS
OL
IDA
TE
D E
NT
ITY
2008
F
ixed
inte
rest
mat
uri
ng
in:
F
loat
ing
<
1 y
ear
> 1
– <
2
> 2
– <
3
> 3
– <
4
> 4
– <
5
> 5
yea
rs
No
n-
Tota
l W
eig
hte
d
Inte
rest
year
s ye
ars
year
s ye
ars
In
tere
st
carr
yin
g
aver
age
ra
te
bea
rin
g
amo
un
t ef
fect
ive
inte
rest
rate
%
Fin
anci
al A
sset
sC
ash
and
cas
h eq
uiva
lent
s 13
,668
,068
40
,130
,750
–
– –
– –
– 53
,798
,818
6.
82Tr
ade
and
oth
er r
ecei
vab
les
– –
– –
– –
– 6,
660,
192
6,66
0,19
2O
ther
fi na
ncia
l ass
ets
4,27
5,26
0 –
– –
– –
– –
4,27
5,26
0 6.
32Fi
nanc
ial d
eriv
ativ
es
– –
– –
– –
– 62
9,03
3 62
9,03
3
____
____
____
____
____
____
____
____
____
____
____
____
____
____
____
____
____
____
____
____
____
____
____
____
____
____
____
____
_
17,9
43,3
28
40,1
30,7
50
– –
– –
– 7,
289,
225
65,3
63,3
03
____
____
____
____
____
____
____
____
____
____
____
____
____
____
____
____
____
____
____
____
____
____
____
____
____
____
____
____
_
Wei
ght
ed a
vera
ge
effe
ctiv
e in
tere
st r
ate
5.81
7.
42
n/
a
Fin
anci
al L
iab
iliti
esTr
ade
and
oth
er p
ayab
les
– –
– –
– –
– (1
6,13
2,12
0)
(16,
132,
120)
Inte
rest
bea
ring
liab
ilitie
s –
(1,6
91,9
49)
(3,8
95,6
58)
– –
– –
– (5
,587
,607
) 7.
87
____
____
____
____
____
____
____
____
____
____
____
____
____
____
____
____
____
____
____
____
____
____
____
____
____
____
____
____
_
– (1
,691
,949
) (3
,895
,658
) –
– –
– (1
6,13
2,12
0)
(21,
719,
727)
__
____
____
____
____
____
____
____
____
____
____
____
____
____
____
____
____
____
____
____
____
____
____
____
____
____
____
____
___
Wei
ght
ed a
vera
ge
effe
ctiv
e in
tere
st r
ate
7.
87
7.87
n/
a
Net
fi n
anci
al
asse
ts/(
liab
iliti
es)
43,6
43,5
76
____
____
____
___
For
per
sona
l use
onl
y
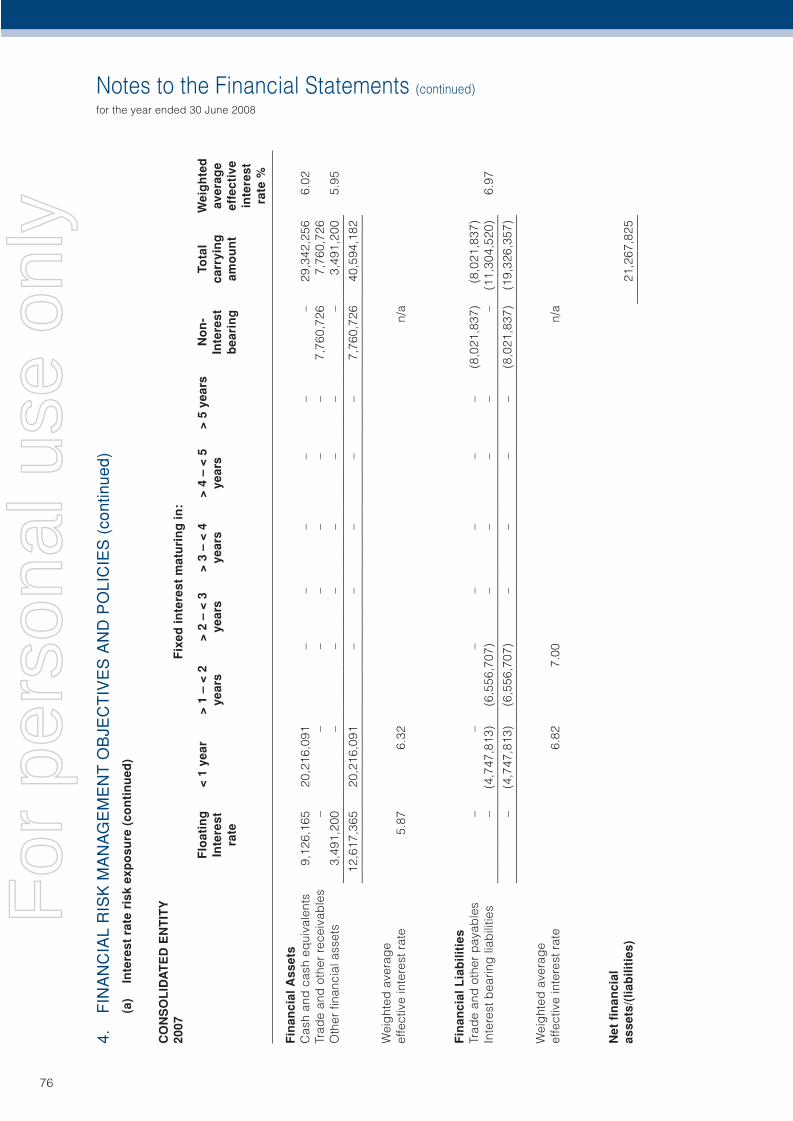
Notes to the Financial Statements (continued)
for the year ended 30 June 2008
76
4.
FIN
AN
CIA
L R
ISK
MA
NA
GE
ME
NT
OB
JEC
TIV
ES
AN
D P
OLI
CIE
S (
cont
inue
d)(a
) In
tere
st r
ate
risk
exp
osu
re (
con
tin
ued
)
CO
NS
OL
IDA
TE
D E
NT
ITY
2007
F
ixed
inte
rest
mat
uri
ng
in:
F
loat
ing
<
1 y
ear
> 1
– <
2
> 2
– <
3
> 3
– <
4
> 4
– <
5
> 5
yea
rs
No
n-
Tota
l W
eig
hte
d
Inte
rest
year
s ye
ars
year
s ye
ars
In
tere
st
carr
yin
g
aver
age
ra
te
bea
rin
g
amo
un
t ef
fect
ive
inte
rest
rate
%
Fin
anci
al A
sset
sC
ash
and
cas
h eq
uiva
lent
s 9,
126,
165
20,2
16,0
91
– –
– –
– –
29,3
42,2
56
6.02
Trad
e an
d o
ther
rec
eiva
ble
s –
– –
– –
– –
7,76
0,72
6 7,
760,
726
Oth
er fi
nanc
ial a
sset
s 3,
491,
200
– –
– –
– –
– 3,
491,
200
5.95
__
____
____
____
____
____
____
____
____
____
____
____
____
____
____
____
____
____
____
____
____
____
____
____
____
____
____
____
___
12
,617
,365
20
,216
,091
–
– –
– –
7,76
0,72
6 40
,594
,182
__
____
____
____
____
____
____
____
____
____
____
____
____
____
____
____
____
____
____
____
____
____
____
____
____
____
____
____
___
Wei
ght
ed a
vera
ge
effe
ctiv
e in
tere
st r
ate
5.87
6.
32
n/
a
Fin
anci
al L
iab
iliti
esTr
ade
and
oth
er p
ayab
les
– –
– –
– –
– (8
,021
,837
) (8
,021
,837
)In
tere
st b
earin
g li
abili
ties
– (4
,747
,813
) (6
,556
,707
) –
– –
– –
(11,
304,
520)
6.
97
____
____
____
____
____
____
____
____
____
____
____
____
____
____
____
____
____
____
____
____
____
____
____
____
____
____
____
____
_
– (4
,747
,813
) (6
,556
,707
) –
– –
– (8
,021
,837
) (1
9,32
6,35
7)
____
____
____
____
____
____
____
____
____
____
____
____
____
____
____
____
____
____
____
____
____
____
____
____
____
____
____
____
_
Wei
ght
ed a
vera
ge
effe
ctiv
e in
tere
st r
ate
6.
82
7.00
n/
a
Net
fi n
anci
al
asse
ts/(
liab
iliti
es)
21,2
67,8
25
____
____
____
___
For
per
sona
l use
onl
y
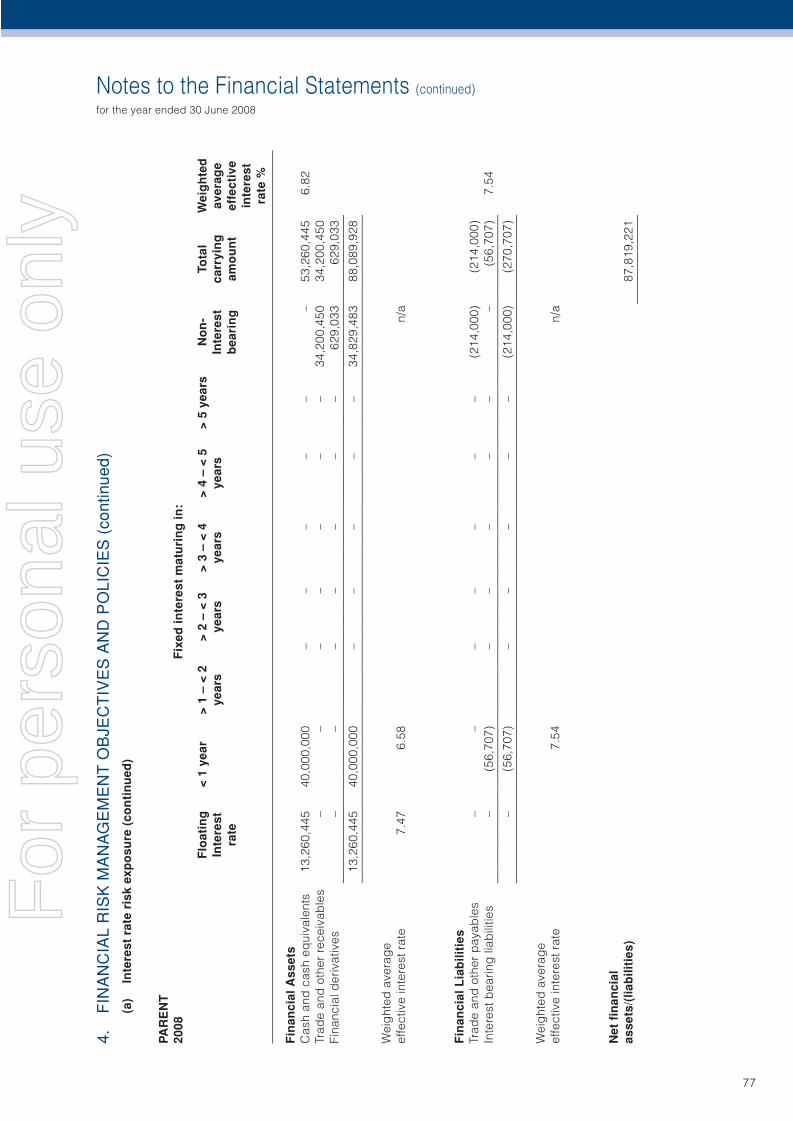
Notes to the Financial Statements (continued)
for the year ended 30 June 2008
77
4.
FIN
AN
CIA
L R
ISK
MA
NA
GE
ME
NT
OB
JEC
TIV
ES
AN
D P
OLI
CIE
S (
cont
inue
d)(a
) In
tere
st r
ate
risk
exp
osu
re (
con
tin
ued
)
PAR
EN
T20
08
Fix
ed in
tere
st m
atu
rin
g in
:
F
loat
ing
<
1 y
ear
> 1
– <
2
> 2
– <
3
> 3
– <
4
> 4
– <
5
> 5
yea
rs
No
n-
Tota
l W
eig
hte
d
Inte
rest
year
s ye
ars
year
s ye
ars
In
tere
st
carr
yin
g
aver
age
ra
te
bea
rin
g
amo
un
t ef
fect
ive
inte
rest
rate
%
Fin
anci
al A
sset
sC
ash
and
cas
h eq
uiva
lent
s 13
,260
,445
40
,000
,000
–
– –
– –
– 53
,260
,445
6.
82Tr
ade
and
oth
er r
ecei
vab
les
– –
– –
– –
– 34
,200
,450
34
,200
,450
Fina
ncia
l der
ivat
ives
–
– –
– –
– –
629,
033
629,
033
__
____
____
____
____
____
____
____
____
____
____
____
____
____
____
____
____
____
____
____
____
____
____
____
____
____
____
____
___
13
,260
,445
40
,000
,000
–
– –
– –
34,8
29,4
83
88,0
89,9
28
____
____
____
____
____
____
____
____
____
____
____
____
____
____
____
____
____
____
____
____
____
____
____
____
____
____
____
____
_
Wei
ght
ed a
vera
ge
effe
ctiv
e in
tere
st r
ate
7.47
6.
58
n/
a
Fin
anci
al L
iab
iliti
esTr
ade
and
oth
er p
ayab
les
– –
– –
– –
– (2
14,0
00)
(214
,000
)In
tere
st b
earin
g li
abili
ties
– (5
6,70
7)
– –
– –
– –
(56,
707)
7.
54
____
____
____
____
____
____
____
____
____
____
____
____
____
____
____
____
____
____
____
____
____
____
____
____
____
____
____
____
_
– (5
6,70
7)
– –
– –
– (2
14,0
00)
(270
,707
)
____
____
____
____
____
____
____
____
____
____
____
____
____
____
____
____
____
____
____
____
____
____
____
____
____
____
____
____
_
Wei
ght
ed a
vera
ge
effe
ctiv
e in
tere
st r
ate
7.
54
n/
a
Net
fi n
anci
al
asse
ts/(
liab
iliti
es)
87,8
19,2
21
____
____
____
___
For
per
sona
l use
onl
y
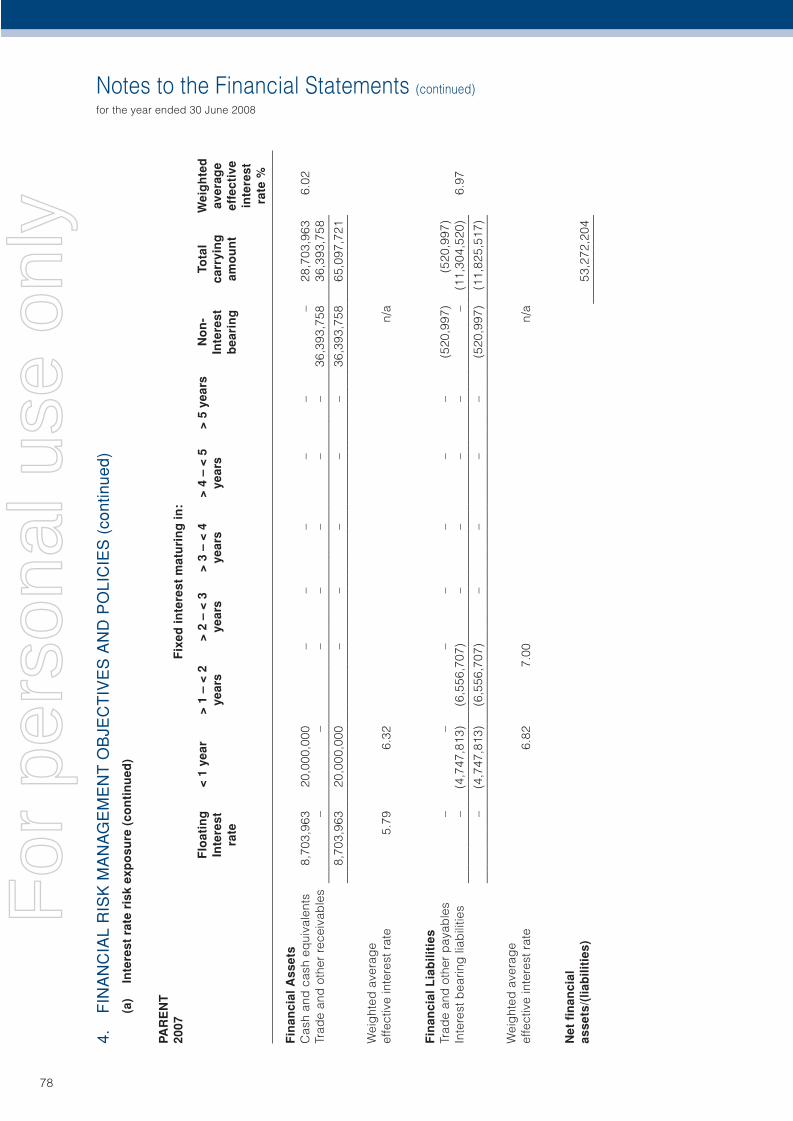
Notes to the Financial Statements (continued)
for the year ended 30 June 2008
78
4.
FIN
AN
CIA
L R
ISK
MA
NA
GE
ME
NT
OB
JEC
TIV
ES
AN
D P
OLI
CIE
S (
cont
inue
d)(a
) In
tere
st r
ate
risk
exp
osu
re (
con
tin
ued
)
PAR
EN
T20
07
Fix
ed in
tere
st m
atu
rin
g in
:
F
loat
ing
<
1 y
ear
> 1
– <
2
> 2
– <
3
> 3
– <
4
> 4
– <
5
> 5
yea
rs
No
n-
Tota
l W
eig
hte
d
Inte
rest
year
s ye
ars
year
s ye
ars
In
tere
st
carr
yin
g
aver
age
ra
te
bea
rin
g
amo
un
t ef
fect
ive
inte
rest
rate
%
Fin
anci
al A
sset
sC
ash
and
cas
h eq
uiva
lent
s 8,
703,
963
20,0
00,0
00
– –
– –
– –
28,7
03,9
63
6.02
Trad
e an
d o
ther
rec
eiva
ble
s –
– –
– –
– –
36,3
93,7
58
36,3
93,7
58
____
____
____
____
____
____
____
____
____
____
____
____
____
____
____
____
____
____
____
____
____
____
____
____
____
____
____
____
_
8,70
3,96
3 20
,000
,000
–
– –
– –
36,3
93,7
58
65,0
97,7
21
____
____
____
____
____
____
____
____
____
____
____
____
____
____
____
____
____
____
____
____
____
____
____
____
____
____
____
____
_
Wei
ght
ed a
vera
ge
effe
ctiv
e in
tere
st r
ate
5.79
6.
32
n/
a
Fin
anci
al L
iab
iliti
esTr
ade
and
oth
er p
ayab
les
– –
– –
– –
– (5
20,9
97)
(520
,997
)In
tere
st b
earin
g li
abili
ties
– (4
,747
,813
) (6
,556
,707
) –
– –
– –
(11,
304,
520)
6.
97
____
____
____
____
____
____
____
____
____
____
____
____
____
____
____
____
____
____
____
____
____
____
____
____
____
____
____
____
_
– (4
,747
,813
) (6
,556
,707
) –
– –
– (5
20,9
97)
(11,
825,
517)
__
____
____
____
____
____
____
____
____
____
____
____
____
____
____
____
____
____
____
____
____
____
____
____
____
____
____
____
___
Wei
ght
ed a
vera
ge
effe
ctiv
e in
tere
st r
ate
6.
82
7.00
n/
a
Net
fi n
anci
al
asse
ts/(
liab
iliti
es)
53,2
72,2
04
____
____
____
___
For
per
sona
l use
onl
y
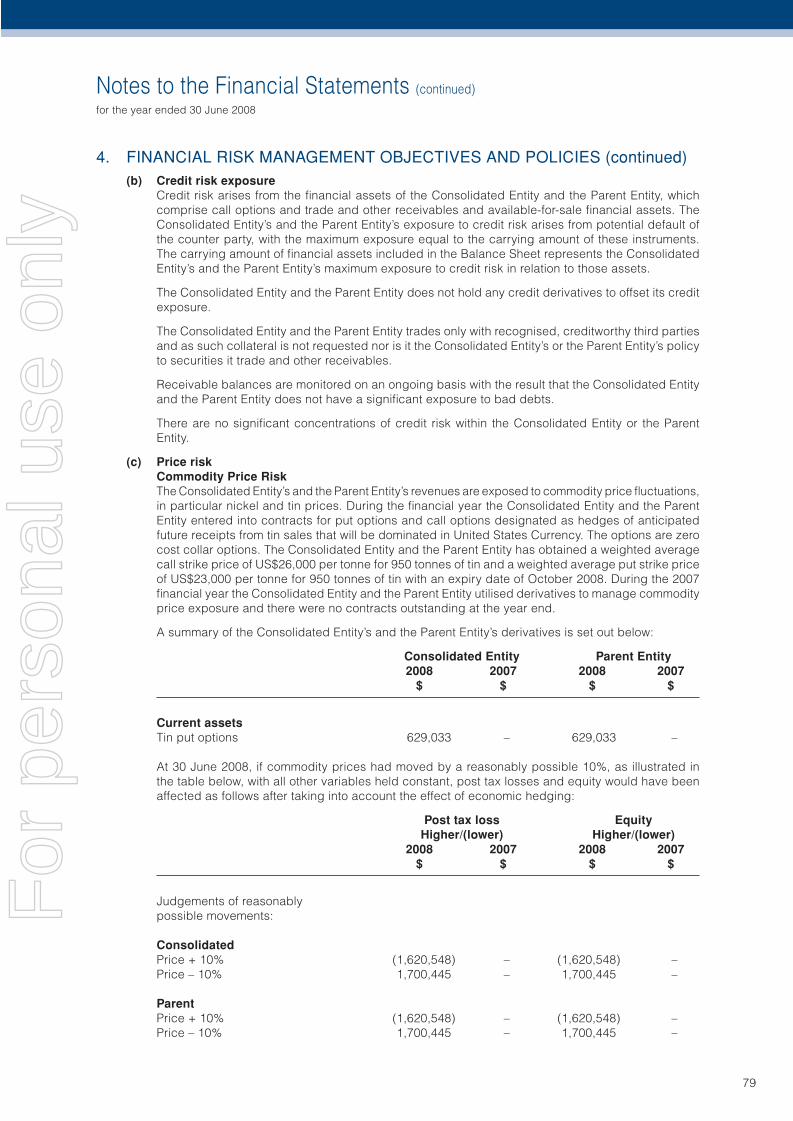
Notes to the Financial Statements (continued)
for the year ended 30 June 2008
79
4. FINANCIAL RISK MANAGEMENT OBJECTIVES AND POLICIES (continued)(b) Credit risk exposure
Credit risk arises from the fi nancial assets of the Consolidated Entity and the Parent Entity, which comprise call options and trade and other receivables and available-for-sale fi nancial assets. The Consolidated Entity’s and the Parent Entity’s exposure to credit risk arises from potential default of the counter party, with the maximum exposure equal to the carrying amount of these instruments. The carrying amount of fi nancial assets included in the Balance Sheet represents the Consolidated Entity’s and the Parent Entity’s maximum exposure to credit risk in relation to those assets.
The Consolidated Entity and the Parent Entity does not hold any credit derivatives to offset its credit exposure.
The Consolidated Entity and the Parent Entity trades only with recognised, creditworthy third parties and as such collateral is not requested nor is it the Consolidated Entity’s or the Parent Entity’s policy to securities it trade and other receivables.
Receivable balances are monitored on an ongoing basis with the result that the Consolidated Entity and the Parent Entity does not have a signifi cant exposure to bad debts.
There are no signifi cant concentrations of credit risk within the Consolidated Entity or the Parent Entity.
(c) Price riskCommodity Price RiskThe Consolidated Entity’s and the Parent Entity’s revenues are exposed to commodity price fl uctuations, in particular nickel and tin prices. During the fi nancial year the Consolidated Entity and the Parent Entity entered into contracts for put options and call options designated as hedges of anticipated future receipts from tin sales that will be dominated in United States Currency. The options are zero cost collar options. The Consolidated Entity and the Parent Entity has obtained a weighted average call strike price of US$26,000 per tonne for 950 tonnes of tin and a weighted average put strike price of US$23,000 per tonne for 950 tonnes of tin with an expiry date of October 2008. During the 2007 fi nancial year the Consolidated Entity and the Parent Entity utilised derivatives to manage commodity price exposure and there were no contracts outstanding at the year end.
A summary of the Consolidated Entity’s and the Parent Entity’s derivatives is set out below:
Consolidated Entity Parent Entity 2008 2007 2008 2007 $ $ $ $
Current assetsTin put options 629,033 – 629,033 –
At 30 June 2008, if commodity prices had moved by a reasonably possible 10%, as illustrated in the table below, with all other variables held constant, post tax losses and equity would have been affected as follows after taking into account the effect of economic hedging:
Post tax loss Equity Higher/(lower) Higher/(lower) 2008 2007 2008 2007 $ $ $ $
Judgements of reasonably possible movements:
ConsolidatedPrice + 10% (1,620,548) – (1,620,548) –Price – 10% 1,700,445 – 1,700,445 –
ParentPrice + 10% (1,620,548) – (1,620,548) –Price – 10% 1,700,445 – 1,700,445 –
For
per
sona
l use
onl
y
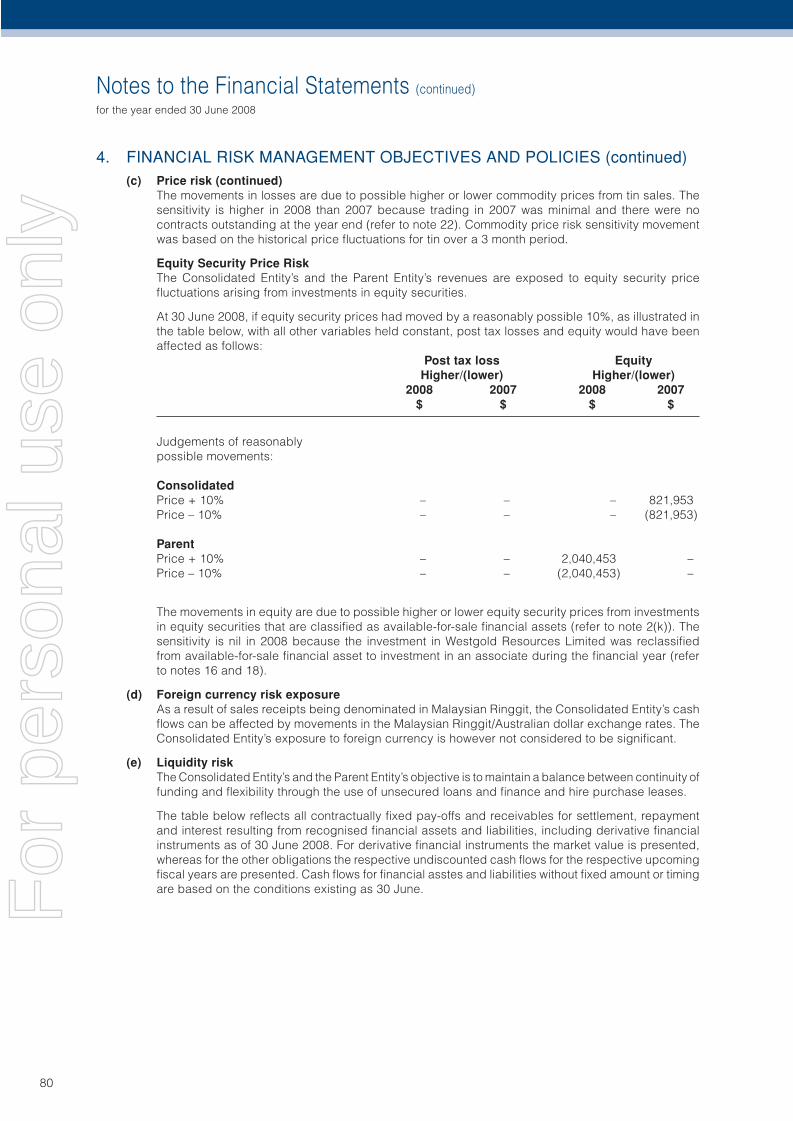
Notes to the Financial Statements (continued)
for the year ended 30 June 2008
80
4. FINANCIAL RISK MANAGEMENT OBJECTIVES AND POLICIES (continued)(c) Price risk (continued)
The movements in losses are due to possible higher or lower commodity prices from tin sales. The sensitivity is higher in 2008 than 2007 because trading in 2007 was minimal and there were no contracts outstanding at the year end (refer to note 22). Commodity price risk sensitivity movement was based on the historical price fl uctuations for tin over a 3 month period.
Equity Security Price RiskThe Consolidated Entity’s and the Parent Entity’s revenues are exposed to equity security price fl uctuations arising from investments in equity securities.
At 30 June 2008, if equity security prices had moved by a reasonably possible 10%, as illustrated in the table below, with all other variables held constant, post tax losses and equity would have been affected as follows:
Post tax loss Equity Higher/(lower) Higher/(lower) 2008 2007 2008 2007 $ $ $ $
Judgements of reasonably possible movements:
ConsolidatedPrice + 10% – – – 821,953Price – 10% – – – (821,953)
ParentPrice + 10% – – 2,040,453 –Price – 10% – – (2,040,453) –
The movements in equity are due to possible higher or lower equity security prices from investments in equity securities that are classifi ed as available-for-sale fi nancial assets (refer to note 2(k)). The sensitivity is nil in 2008 because the investment in Westgold Resources Limited was reclassifi ed from available-for-sale fi nancial asset to investment in an associate during the fi nancial year (refer to notes 16 and 18).
(d) Foreign currency risk exposureAs a result of sales receipts being denominated in Malaysian Ringgit, the Consolidated Entity’s cash fl ows can be affected by movements in the Malaysian Ringgit/Australian dollar exchange rates. The Consolidated Entity’s exposure to foreign currency is however not considered to be signifi cant.
(e) Liquidity riskThe Consolidated Entity’s and the Parent Entity’s objective is to maintain a balance between continuity of funding and fl exibility through the use of unsecured loans and fi nance and hire purchase leases.
The table below refl ects all contractually fi xed pay-offs and receivables for settlement, repayment and interest resulting from recognised fi nancial assets and liabilities, including derivative fi nancial instruments as of 30 June 2008. For derivative fi nancial instruments the market value is presented, whereas for the other obligations the respective undiscounted cash fl ows for the respective upcoming fi scal years are presented. Cash fl ows for fi nancial asstes and liabilities without fi xed amount or timing are based on the conditions existing as 30 June.
E
For
per
sona
l use
onl
y
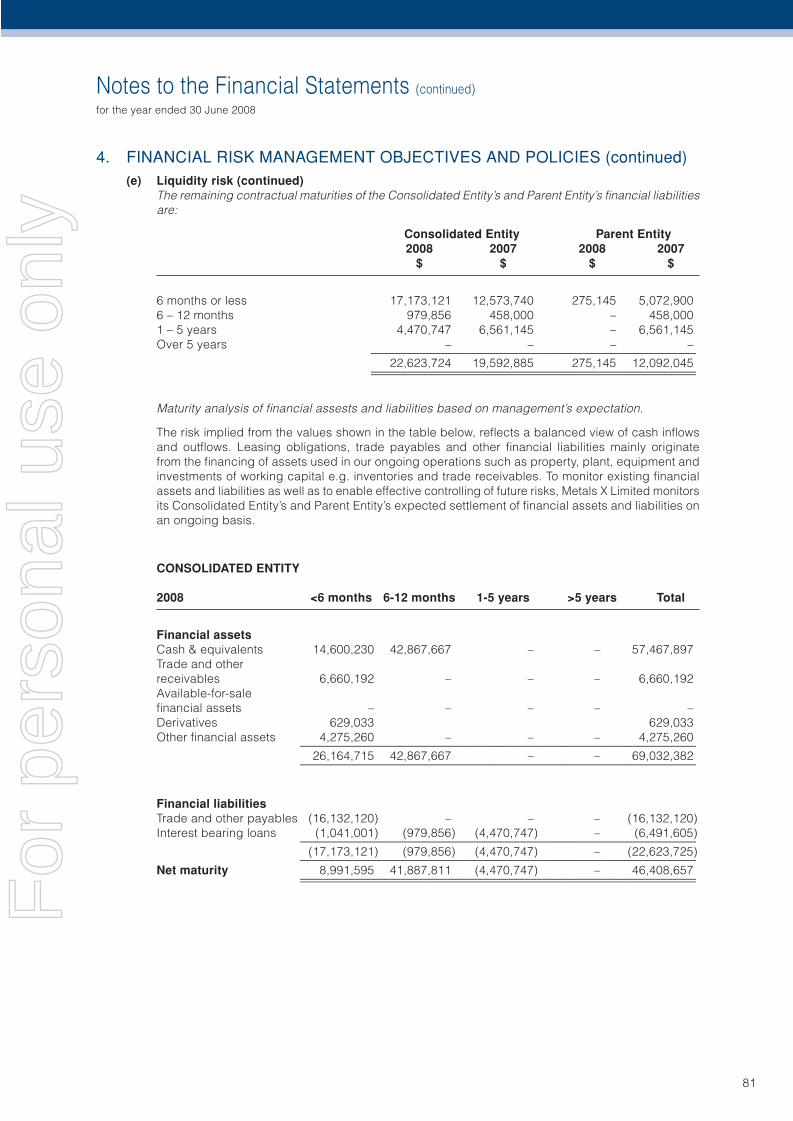
Notes to the Financial Statements (continued)
for the year ended 30 June 2008
81
4. FINANCIAL RISK MANAGEMENT OBJECTIVES AND POLICIES (continued)(e) Liquidity risk (continued)
The remaining contractual maturities of the Consolidated Entity’s and Parent Entity’s fi nancial liabilities are:
Consolidated Entity Parent Entity 2008 2007 2008 2007 $ $ $ $
6 months or less 17,173,121 12,573,740 275,145 5,072,9006 – 12 months 979,856 458,000 – 458,0001 – 5 years 4,470,747 6,561,145 – 6,561,145Over 5 years – – – – _______________________________________________________ 22,623,724 19,592,885 275,145 12,092,045 _______________________________________________________ _______________________________________________________
Maturity analysis of fi nancial assests and liabilities based on management’s expectation.
The risk implied from the values shown in the table below, refl ects a balanced view of cash infl ows and outfl ows. Leasing obligations, trade payables and other fi nancial liabilities mainly originate from the fi nancing of assets used in our ongoing operations such as property, plant, equipment and investments of working capital e.g. inventories and trade receivables. To monitor existing fi nancial assets and liabilities as well as to enable effective controlling of future risks, Metals X Limited monitors its Consolidated Entity’s and Parent Entity’s expected settlement of fi nancial assets and liabilities on an ongoing basis.
CONSOLIDATED ENTITY
2008 <6 months 6-12 months 1-5 years >5 years Total
Financial assetsCash & equivalents 14,600,230 42,867,667 – – 57,467,897Trade and other receivables 6,660,192 – – – 6,660,192Available-for-sale fi nancial assets – – – – –Derivatives 629,033 629,033Other fi nancial assets 4,275,260 – – – 4,275,260 ___________________________________________________________________ 26,164,715 42,867,667 – – 69,032,382 ___________________________________________________________________
Financial liabilitiesTrade and other payables (16,132,120) – – – (16,132,120)Interest bearing loans (1,041,001) (979,856) (4,470,747) – (6,491,605) ___________________________________________________________________ (17,173,121) (979,856) (4,470,747) – (22,623,725) ___________________________________________________________________Net maturity 8,991,595 41,887,811 (4,470,747) – 46,408,657 ___________________________________________________________________ ___________________________________________________________________F
or p
erso
nal u
se o
nly
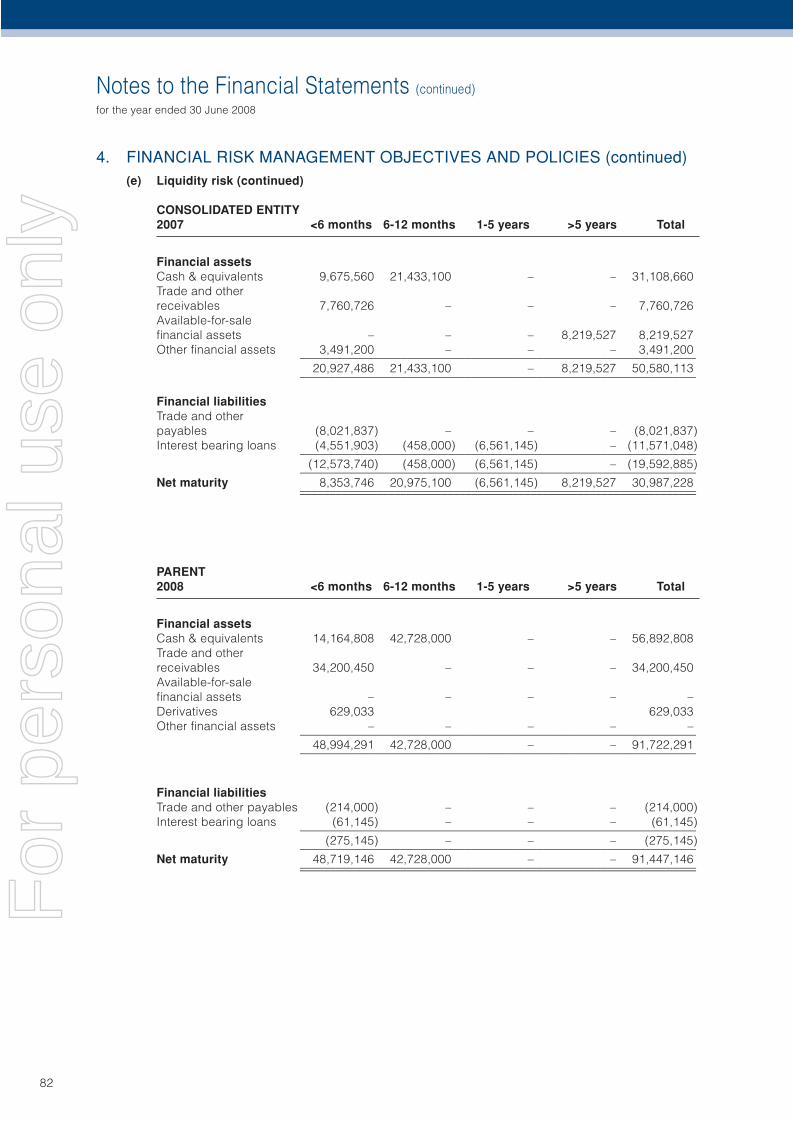
Notes to the Financial Statements (continued)
for the year ended 30 June 2008
82
4. FINANCIAL RISK MANAGEMENT OBJECTIVES AND POLICIES (continued)(e) Liquidity risk (continued)
CONSOLIDATED ENTITY2007 <6 months 6-12 months 1-5 years >5 years Total
Financial assetsCash & equivalents 9,675,560 21,433,100 – – 31,108,660Trade and other receivables 7,760,726 – – – 7,760,726Available-for-sale fi nancial assets – – – 8,219,527 8,219,527Other fi nancial assets 3,491,200 – – – 3,491,200 ___________________________________________________________________ 20,927,486 21,433,100 – 8,219,527 50,580,113 ___________________________________________________________________
Financial liabilitiesTrade and other payables (8,021,837) – – – (8,021,837)Interest bearing loans (4,551,903) (458,000) (6,561,145) – (11,571,048) ___________________________________________________________________ (12,573,740) (458,000) (6,561,145) – (19,592,885) ___________________________________________________________________Net maturity 8,353,746 20,975,100 (6,561,145) 8,219,527 30,987,228 ___________________________________________________________________ ___________________________________________________________________
PARENT2008 <6 months 6-12 months 1-5 years >5 years Total
Financial assetsCash & equivalents 14,164,808 42,728,000 – – 56,892,808Trade and other receivables 34,200,450 – – – 34,200,450Available-for-sale fi nancial assets – – – – –Derivatives 629,033 629,033Other fi nancial assets – – – – – ___________________________________________________________________ 48,994,291 42,728,000 – – 91,722,291 ___________________________________________________________________
Financial liabilitiesTrade and other payables (214,000) – – – (214,000)Interest bearing loans (61,145) – – – (61,145) ___________________________________________________________________ (275,145) – – – (275,145) ___________________________________________________________________Net maturity 48,719,146 42,728,000 – – 91,447,146 ___________________________________________________________________ ___________________________________________________________________
For
per
sona
l use
onl
y
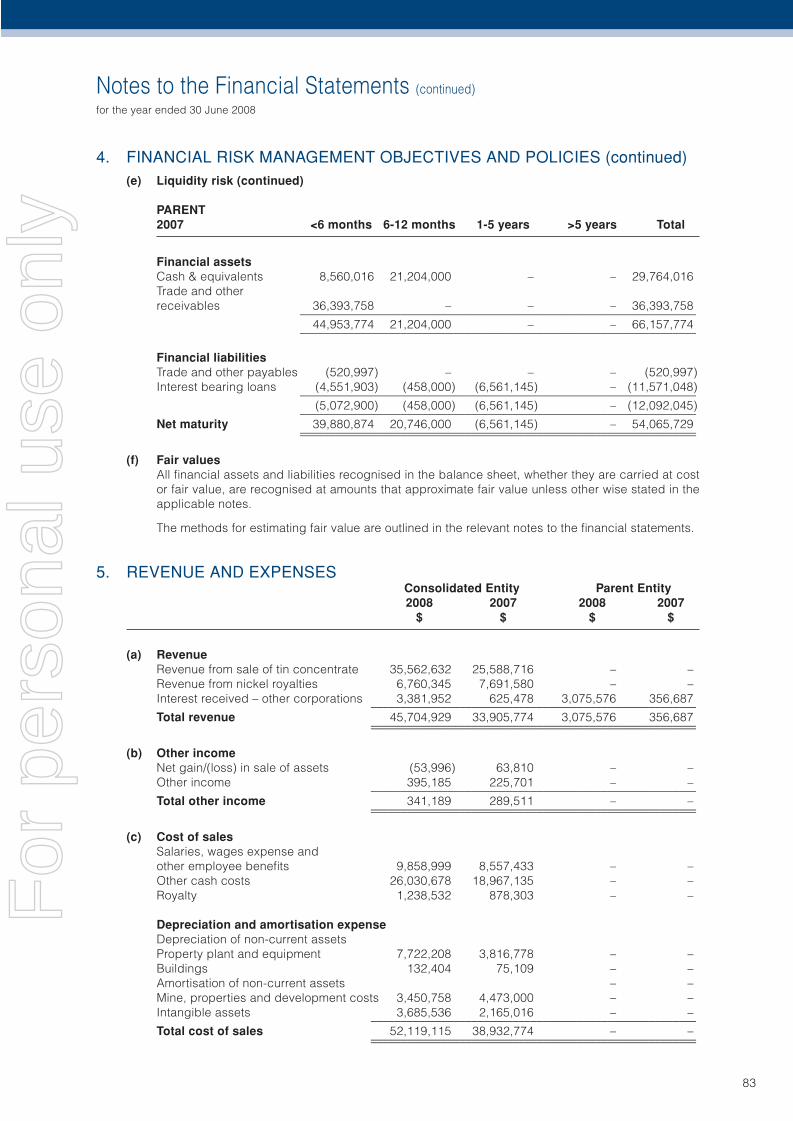
Notes to the Financial Statements (continued)
for the year ended 30 June 2008
83
4. FINANCIAL RISK MANAGEMENT OBJECTIVES AND POLICIES (continued)(e) Liquidity risk (continued)
PARENT2007 <6 months 6-12 months 1-5 years >5 years Total
Financial assetsCash & equivalents 8,560,016 21,204,000 – – 29,764,016Trade and other receivables 36,393,758 – – – 36,393,758 ___________________________________________________________________ 44,953,774 21,204,000 – – 66,157,774 ___________________________________________________________________
Financial liabilitiesTrade and other payables (520,997) – – – (520,997)Interest bearing loans (4,551,903) (458,000) (6,561,145) – (11,571,048) ___________________________________________________________________ (5,072,900) (458,000) (6,561,145) – (12,092,045) ___________________________________________________________________Net maturity 39,880,874 20,746,000 (6,561,145) – 54,065,729 ___________________________________________________________________ ___________________________________________________________________
(f) Fair valuesAll fi nancial assets and liabilities recognised in the balance sheet, whether they are carried at cost or fair value, are recognised at amounts that approximate fair value unless other wise stated in the applicable notes.
The methods for estimating fair value are outlined in the relevant notes to the fi nancial statements.
5. REVENUE AND EXPENSES Consolidated Entity Parent Entity 2008 2007 2008 2007 $ $ $ $
(a) RevenueRevenue from sale of tin concentrate 35,562,632 25,588,716 – –Revenue from nickel royalties 6,760,345 7,691,580 – –Interest received – other corporations 3,381,952 625,478 3,075,576 356,687 _______________________________________________________Total revenue 45,704,929 33,905,774 3,075,576 356,687 _______________________________________________________ _______________________________________________________
(b) Other incomeNet gain/(loss) in sale of assets (53,996) 63,810 – –Other income 395,185 225,701 – – _______________________________________________________Total other income 341,189 289,511 – – _______________________________________________________ _______________________________________________________
(c) Cost of salesSalaries, wages expense and other employee benefi ts 9,858,999 8,557,433 – –Other cash costs 26,030,678 18,967,135 – –Royalty 1,238,532 878,303 – –
Depreciation and amortisation expenseDepreciation of non-current assetsProperty plant and equipment 7,722,208 3,816,778 – –Buildings 132,404 75,109 – –Amortisation of non-current assets – –Mine, properties and development costs 3,450,758 4,473,000 – –Intangible assets 3,685,536 2,165,016 – – _______________________________________________________Total cost of sales 52,119,115 38,932,774 – – _______________________________________________________ _______________________________________________________
For
per
sona
l use
onl
y
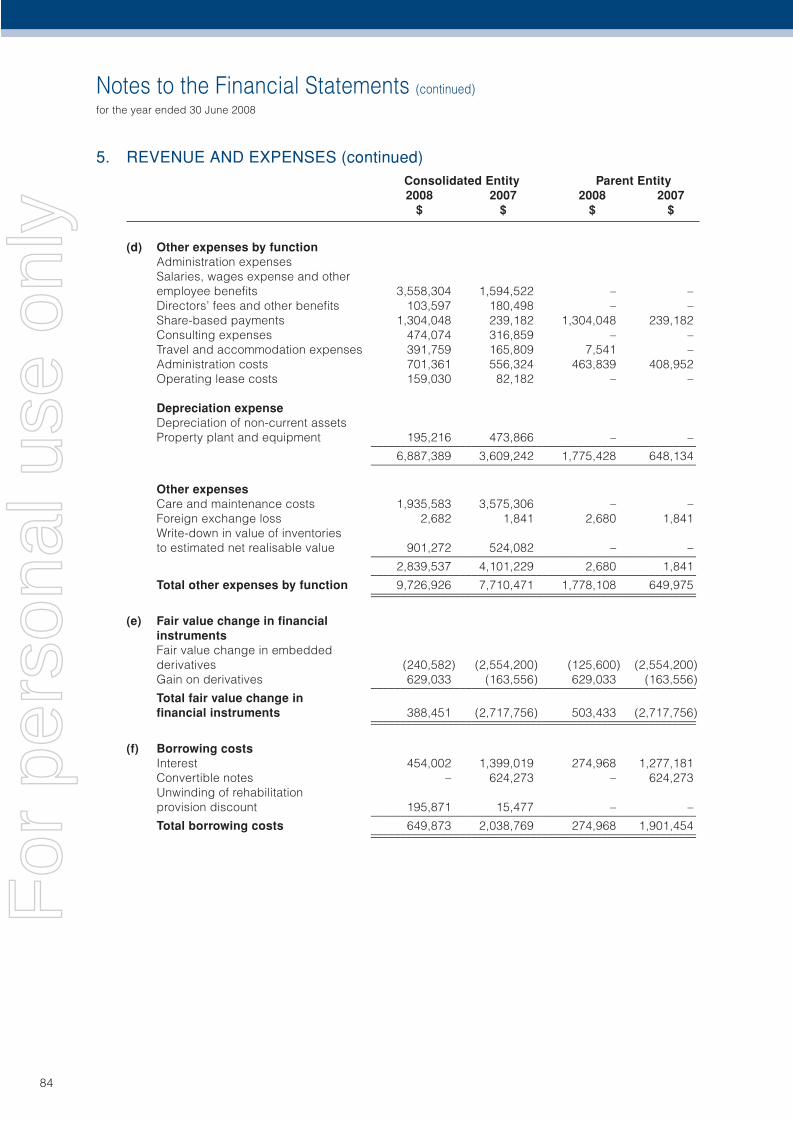
Notes to the Financial Statements (continued)
for the year ended 30 June 2008
84
5. REVENUE AND EXPENSES (continued) Consolidated Entity Parent Entity 2008 2007 2008 2007 $ $ $ $
(d) Other expenses by functionAdministration expensesSalaries, wages expense and other employee benefi ts 3,558,304 1,594,522 – –Directors’ fees and other benefi ts 103,597 180,498 – –Share-based payments 1,304,048 239,182 1,304,048 239,182Consulting expenses 474,074 316,859 – –Travel and accommodation expenses 391,759 165,809 7,541 –Administration costs 701,361 556,324 463,839 408,952Operating lease costs 159,030 82,182 – –
Depreciation expenseDepreciation of non-current assetsProperty plant and equipment 195,216 473,866 – – _______________________________________________________ 6,887,389 3,609,242 1,775,428 648,134 _______________________________________________________
Other expensesCare and maintenance costs 1,935,583 3,575,306 – –Foreign exchange loss 2,682 1,841 2,680 1,841Write-down in value of inventories to estimated net realisable value 901,272 524,082 – – _______________________________________________________ 2,839,537 4,101,229 2,680 1,841 _______________________________________________________Total other expenses by function 9,726,926 7,710,471 1,778,108 649,975 _______________________________________________________ _______________________________________________________
(e) Fair value change in fi nancial instruments
Fair value change in embedded derivatives (240,582) (2,554,200) (125,600) (2,554,200)Gain on derivatives 629,033 (163,556) 629,033 (163,556) _______________________________________________________Total fair value change in fi nancial instruments 388,451 (2,717,756) 503,433 (2,717,756) _______________________________________________________ _______________________________________________________
(f) Borrowing costsInterest 454,002 1,399,019 274,968 1,277,181Convertible notes – 624,273 – 624,273Unwinding of rehabilitation provision discount 195,871 15,477 – – _______________________________________________________Total borrowing costs 649,873 2,038,769 274,968 1,901,454 _______________________________________________________ _______________________________________________________
For
per
sona
l use
onl
y
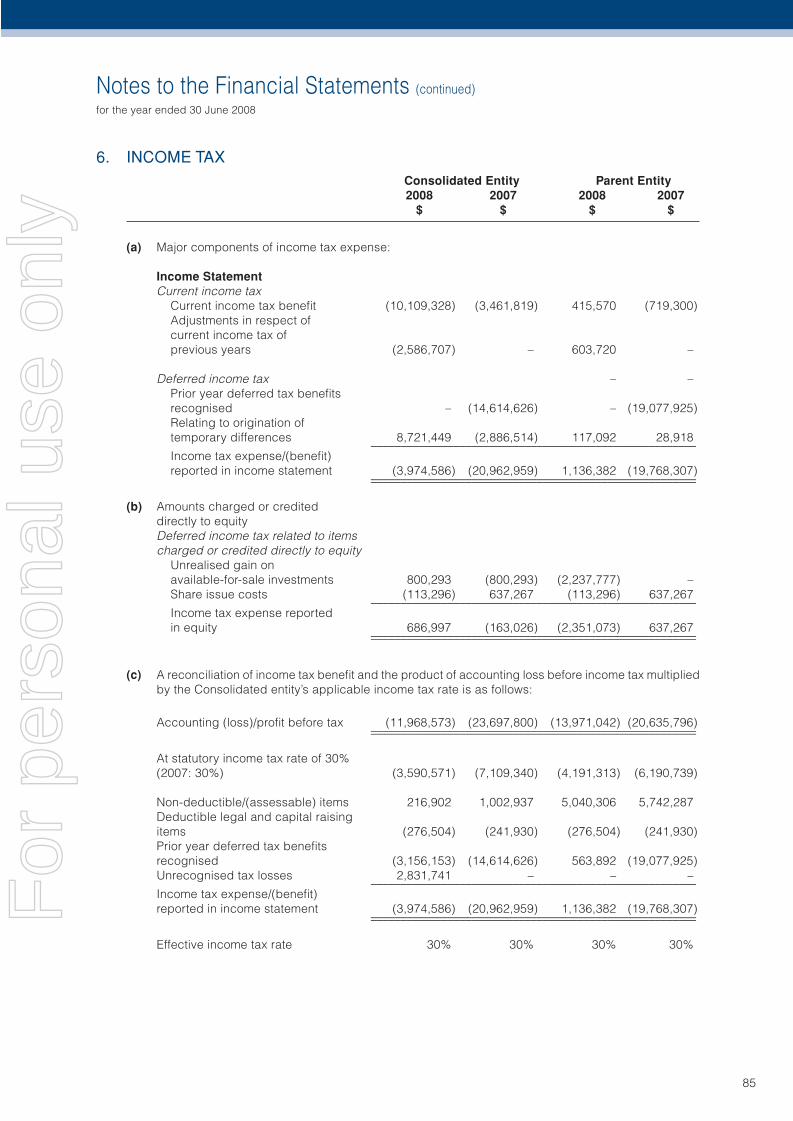
Notes to the Financial Statements (continued)
for the year ended 30 June 2008
85
6. INCOME TAX Consolidated Entity Parent Entity 2008 2007 2008 2007 $ $ $ $
(a) Major components of income tax expense:
Income StatementCurrent income tax Current income tax benefi t (10,109,328) (3,461,819) 415,570 (719,300) Adjustments in respect of current income tax of previous years (2,586,707) – 603,720 –
Deferred income tax – – Prior year deferred tax benefi ts recognised – (14,614,626) – (19,077,925) Relating to origination of temporary differences 8,721,449 (2,886,514) 117,092 28,918 _______________________________________________________ Income tax expense/(benefi t) reported in income statement (3,974,586) (20,962,959) 1,136,382 (19,768,307) _______________________________________________________ _______________________________________________________
(b) Amounts charged or credited directly to equity
Deferred income tax related to items charged or credited directly to equity Unrealised gain on available-for-sale investments 800,293 (800,293) (2,237,777) – Share issue costs (113,296) 637,267 (113,296) 637,267 _______________________________________________________ Income tax expense reported in equity 686,997 (163,026) (2,351,073) 637,267 _______________________________________________________ _______________________________________________________
(c) A reconciliation of income tax benefi t and the product of accounting loss before income tax multiplied by the Consolidated entity’s applicable income tax rate is as follows:
Accounting (loss)/profi t before tax (11,968,573) (23,697,800) (13,971,042) (20,635,796) _______________________________________________________ _______________________________________________________
At statutory income tax rate of 30% (2007: 30%) (3,590,571) (7,109,340) (4,191,313) (6,190,739)
Non-deductible/(assessable) items 216,902 1,002,937 5,040,306 5,742,287Deductible legal and capital raising items (276,504) (241,930) (276,504) (241,930)Prior year deferred tax benefi ts recognised (3,156,153) (14,614,626) 563,892 (19,077,925)Unrecognised tax losses 2,831,741 – – – _______________________________________________________Income tax expense/(benefi t) reported in income statement (3,974,586) (20,962,959) 1,136,382 (19,768,307) _______________________________________________________ _______________________________________________________
Effective income tax rate 30% 30% 30% 30%
For
per
sona
l use
onl
y
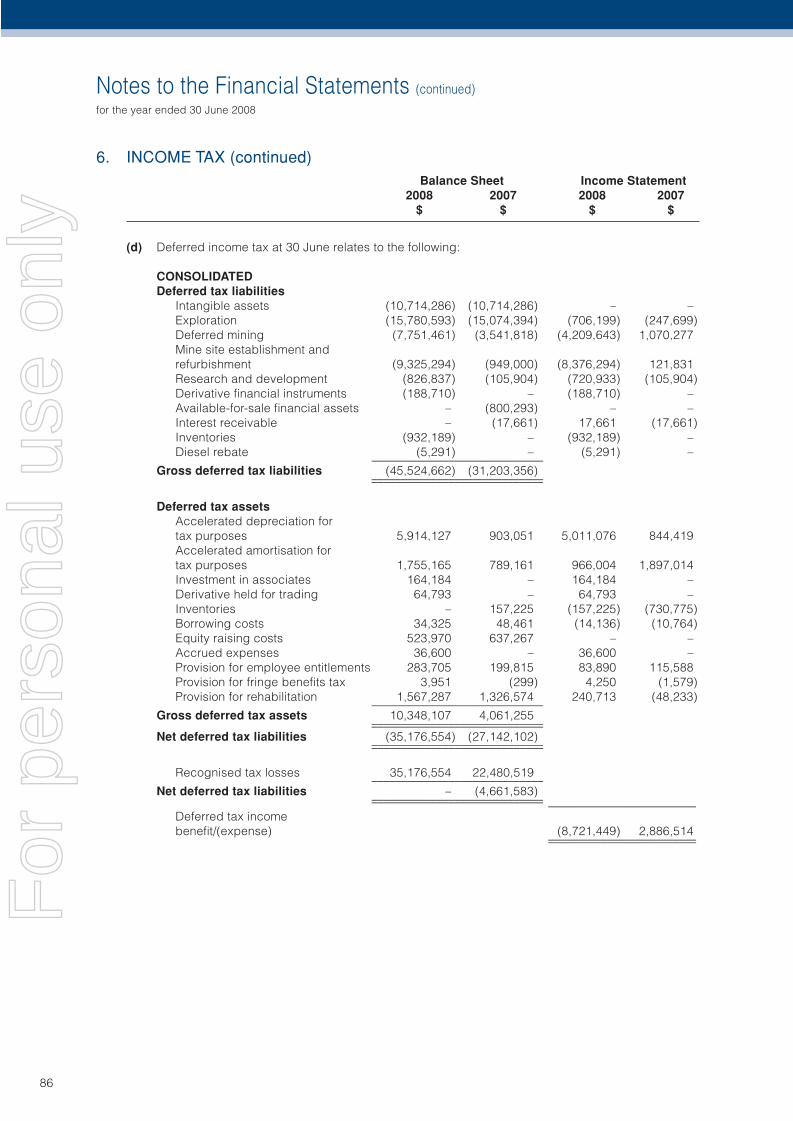
Notes to the Financial Statements (continued)
for the year ended 30 June 2008
86
6. INCOME TAX (continued) Balance Sheet Income Statement 2008 2007 2008 2007 $ $ $ $
(d) Deferred income tax at 30 June relates to the following:
CONSOLIDATEDDeferred tax liabilities
Intangible assets (10,714,286) (10,714,286) – –Exploration (15,780,593) (15,074,394) (706,199) (247,699)Deferred mining (7,751,461) (3,541,818) (4,209,643) 1,070,277Mine site establishment and refurbishment (9,325,294) (949,000) (8,376,294) 121,831Research and development (826,837) (105,904) (720,933) (105,904)Derivative fi nancial instruments (188,710) – (188,710) –Available-for-sale fi nancial assets – (800,293) – –Interest receivable – (17,661) 17,661 (17,661)Inventories (932,189) – (932,189) –Diesel rebate (5,291) – (5,291) – _____________________________
Gross deferred tax liabilities (45,524,662) (31,203,356) _____________________________ _____________________________
Deferred tax assetsAccelerated depreciation for tax purposes 5,914,127 903,051 5,011,076 844,419Accelerated amortisation for tax purposes 1,755,165 789,161 966,004 1,897,014Investment in associates 164,184 – 164,184 –Derivative held for trading 64,793 – 64,793 –Inventories – 157,225 (157,225) (730,775)Borrowing costs 34,325 48,461 (14,136) (10,764)Equity raising costs 523,970 637,267 – –Accrued expenses 36,600 – 36,600 –Provision for employee entitlements 283,705 199,815 83,890 115,588Provision for fringe benefi ts tax 3,951 (299) 4,250 (1,579)Provision for rehabilitation 1,567,287 1,326,574 240,713 (48,233) _____________________________
Gross deferred tax assets 10,348,107 4,061,255 _____________________________ _____________________________Net deferred tax liabilities (35,176,554) (27,142,102) _____________________________ _____________________________
Recognised tax losses 35,176,554 22,480,519 _____________________________Net deferred tax liabilities – (4,661,583) _____________________________ _____________________________ _________________________
Deferred tax income benefi t/(expense) (8,721,449) 2,886,514 _________________________ _________________________
For
per
sona
l use
onl
y
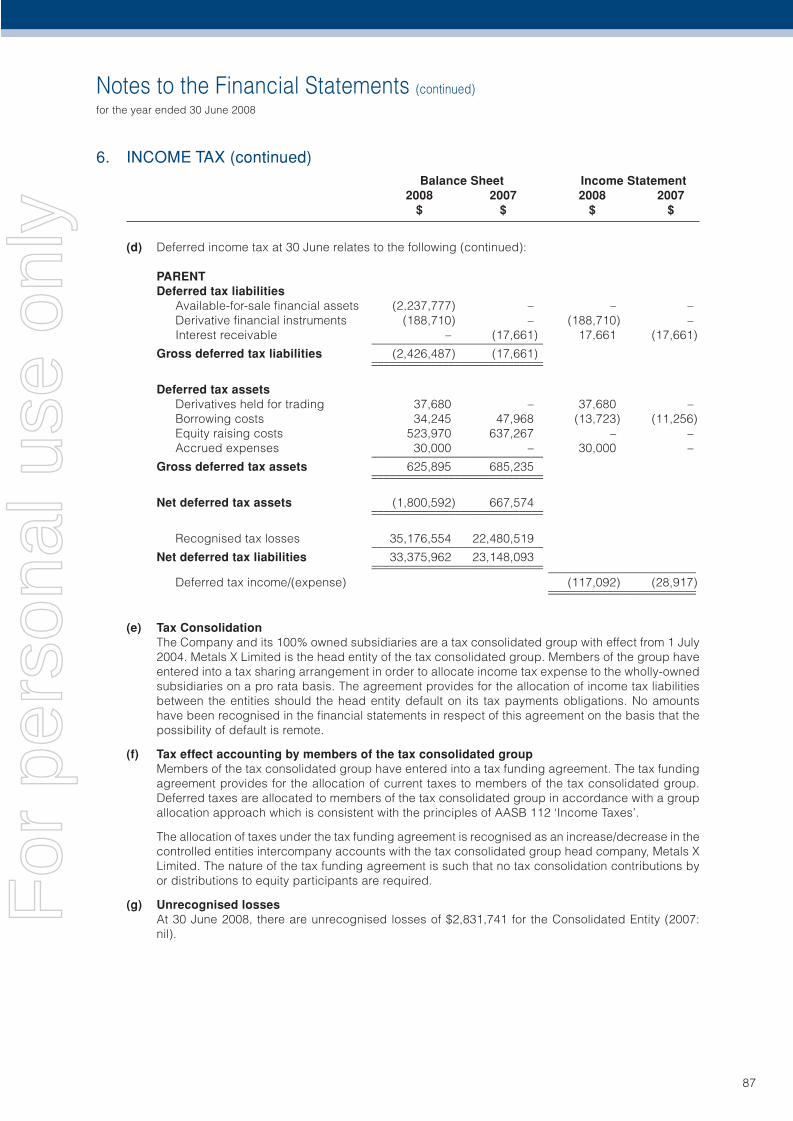
Notes to the Financial Statements (continued)
for the year ended 30 June 2008
87
6. INCOME TAX (continued) Balance Sheet Income Statement 2008 2007 2008 2007 $ $ $ $
(d) Deferred income tax at 30 June relates to the following (continued):
PARENTDeferred tax liabilities
Available-for-sale fi nancial assets (2,237,777) – – –Derivative fi nancial instruments (188,710) – (188,710) –Interest receivable – (17,661) 17,661 (17,661) _____________________________
Gross deferred tax liabilities (2,426,487) (17,661) _____________________________ _____________________________
Deferred tax assetsDerivatives held for trading 37,680 – 37,680 –Borrowing costs 34,245 47,968 (13,723) (11,256)Equity raising costs 523,970 637,267 – –Accrued expenses 30,000 – 30,000 – _____________________________
Gross deferred tax assets 625,895 685,235 _____________________________ _____________________________
Net deferred tax assets (1,800,592) 667,574 _____________________________ _____________________________
Recognised tax losses 35,176,554 22,480,519 _____________________________Net deferred tax liabilities 33,375,962 23,148,093 _____________________________ _____________________________ _________________________
Deferred tax income/(expense) (117,092) (28,917) _________________________ _________________________
(e) Tax ConsolidationThe Company and its 100% owned subsidiaries are a tax consolidated group with effect from 1 July 2004. Metals X Limited is the head entity of the tax consolidated group. Members of the group have entered into a tax sharing arrangement in order to allocate income tax expense to the wholly-owned subsidiaries on a pro rata basis. The agreement provides for the allocation of income tax liabilities between the entities should the head entity default on its tax payments obligations. No amounts have been recognised in the fi nancial statements in respect of this agreement on the basis that the possibility of default is remote.
(f) Tax effect accounting by members of the tax consolidated groupMembers of the tax consolidated group have entered into a tax funding agreement. The tax funding agreement provides for the allocation of current taxes to members of the tax consolidated group. Deferred taxes are allocated to members of the tax consolidated group in accordance with a group allocation approach which is consistent with the principles of AASB 112 ‘Income Taxes’.
The allocation of taxes under the tax funding agreement is recognised as an increase/decrease in the controlled entities intercompany accounts with the tax consolidated group head company, Metals X Limited. The nature of the tax funding agreement is such that no tax consolidation contributions by or distributions to equity participants are required.
(g) Unrecognised lossesAt 30 June 2008, there are unrecognised losses of $2,831,741 for the Consolidated Entity (2007: nil).
For
per
sona
l use
onl
y
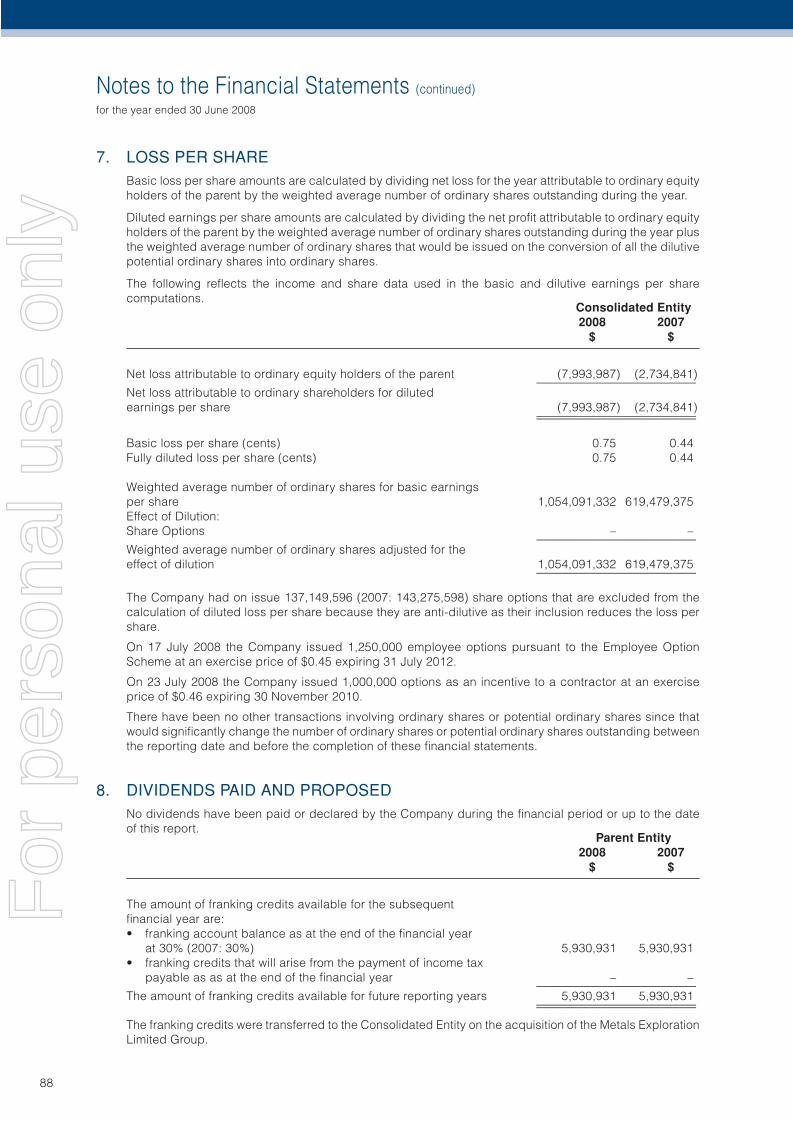
Notes to the Financial Statements (continued)
for the year ended 30 June 2008
88
7. LOSS PER SHAREBasic loss per share amounts are calculated by dividing net loss for the year attributable to ordinary equity holders of the parent by the weighted average number of ordinary shares outstanding during the year.
Diluted earnings per share amounts are calculated by dividing the net profi t attributable to ordinary equity holders of the parent by the weighted average number of ordinary shares outstanding during the year plus the weighted average number of ordinary shares that would be issued on the conversion of all the dilutive potential ordinary shares into ordinary shares.
The following refl ects the income and share data used in the basic and dilutive earnings per share computations.
Consolidated Entity 2008 2007 $ $
Net loss attributable to ordinary equity holders of the parent (7,993,987) (2,734,841) ___________________________Net loss attributable to ordinary shareholders for diluted earnings per share (7,993,987) (2,734,841) ___________________________ ___________________________
Basic loss per share (cents) 0.75 0.44Fully diluted loss per share (cents) 0.75 0.44
Weighted average number of ordinary shares for basic earnings per share 1,054,091,332 619,479,375Effect of Dilution:Share Options – – ___________________________Weighted average number of ordinary shares adjusted for the effect of dilution 1,054,091,332 619,479,375 ___________________________
The Company had on issue 137,149,596 (2007: 143,275,598) share options that are excluded from the calculation of diluted loss per share because they are anti-dilutive as their inclusion reduces the loss per share.
On 17 July 2008 the Company issued 1,250,000 employee options pursuant to the Employee Option Scheme at an exercise price of $0.45 expiring 31 July 2012.
On 23 July 2008 the Company issued 1,000,000 options as an incentive to a contractor at an exercise price of $0.46 expiring 30 November 2010.
There have been no other transactions involving ordinary shares or potential ordinary shares since that would signifi cantly change the number of ordinary shares or potential ordinary shares outstanding between the reporting date and before the completion of these fi nancial statements.
8. DIVIDENDS PAID AND PROPOSEDNo dividends have been paid or declared by the Company during the fi nancial period or up to the date of this report.
Parent Entity 2008 2007 $ $
The amount of franking credits available for the subsequent fi nancial year are:• franking account balance as at the end of the fi nancial year at 30% (2007: 30%) 5,930,931 5,930,931• franking credits that will arise from the payment of income tax payable as as at the end of the fi nancial year – – ___________________________The amount of franking credits available for future reporting years 5,930,931 5,930,931 ___________________________ ___________________________
The franking credits were transferred to the Consolidated Entity on the acquisition of the Metals Exploration Limited Group.
For
per
sona
l use
onl
y
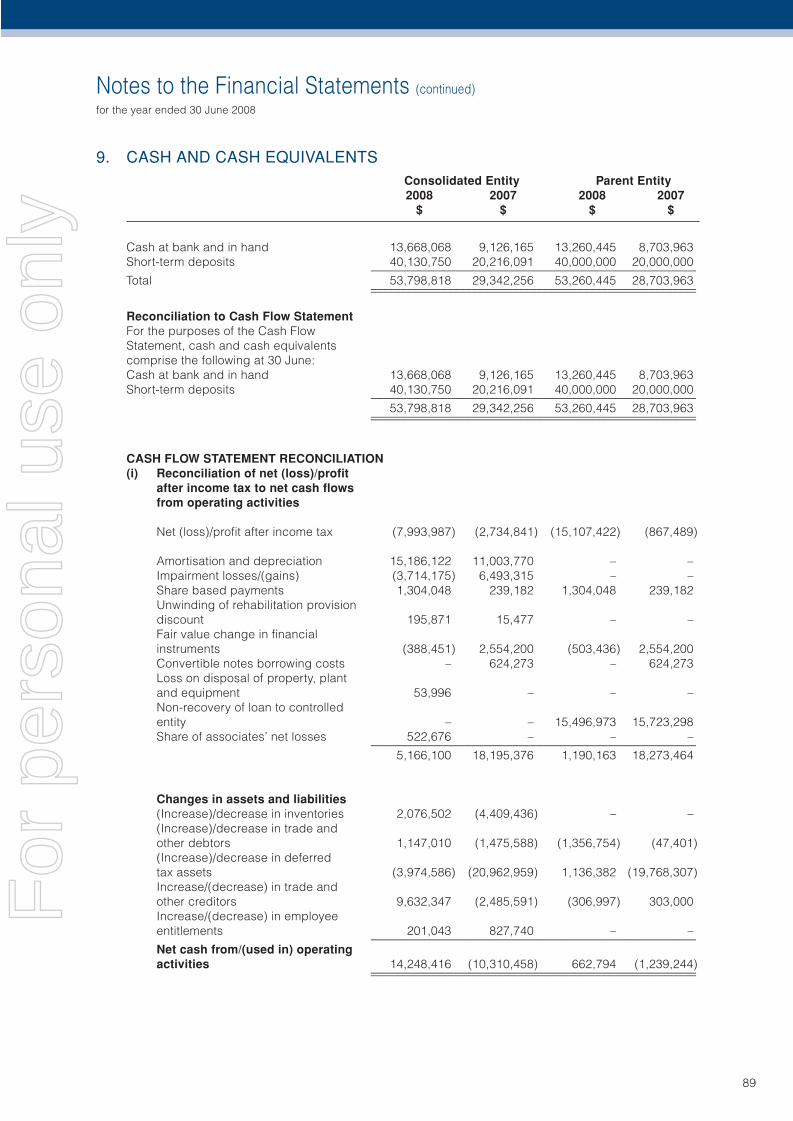
Notes to the Financial Statements (continued)
for the year ended 30 June 2008
89
9. CASH AND CASH EQUIVALENTS Consolidated Entity Parent Entity 2008 2007 2008 2007 $ $ $ $
Cash at bank and in hand 13,668,068 9,126,165 13,260,445 8,703,963Short-term deposits 40,130,750 20,216,091 40,000,000 20,000,000 _______________________________________________________Total 53,798,818 29,342,256 53,260,445 28,703,963 _______________________________________________________ _______________________________________________________
Reconciliation to Cash Flow StatementFor the purposes of the Cash Flow Statement, cash and cash equivalents comprise the following at 30 June:Cash at bank and in hand 13,668,068 9,126,165 13,260,445 8,703,963Short-term deposits 40,130,750 20,216,091 40,000,000 20,000,000 _______________________________________________________ 53,798,818 29,342,256 53,260,445 28,703,963 _______________________________________________________ _______________________________________________________
CASH FLOW STATEMENT RECONCILIATION(i) Reconciliation of net (loss)/profi t after income tax to net cash fl ows from operating activities
Net (loss)/profi t after income tax (7,993,987) (2,734,841) (15,107,422) (867,489)
Amortisation and depreciation 15,186,122 11,003,770 – –Impairment losses/(gains) (3,714,175) 6,493,315 – –Share based payments 1,304,048 239,182 1,304,048 239,182Unwinding of rehabilitation provision discount 195,871 15,477 – –Fair value change in fi nancial instruments (388,451) 2,554,200 (503,436) 2,554,200Convertible notes borrowing costs – 624,273 – 624,273Loss on disposal of property, plant and equipment 53,996 – – –Non-recovery of loan to controlled entity – – 15,496,973 15,723,298Share of associates’ net losses 522,676 – – – _______________________________________________________ 5,166,100 18,195,376 1,190,163 18,273,464
Changes in assets and liabilities(Increase)/decrease in inventories 2,076,502 (4,409,436) – –(Increase)/decrease in trade and other debtors 1,147,010 (1,475,588) (1,356,754) (47,401)(Increase)/decrease in deferred tax assets (3,974,586) (20,962,959) 1,136,382 (19,768,307)Increase/(decrease) in trade and other creditors 9,632,347 (2,485,591) (306,997) 303,000Increase/(decrease) in employeeentitlements 201,043 827,740 – – _______________________________________________________Net cash from/(used in) operating activities 14,248,416 (10,310,458) 662,794 (1,239,244) _______________________________________________________ _______________________________________________________
For
per
sona
l use
onl
y
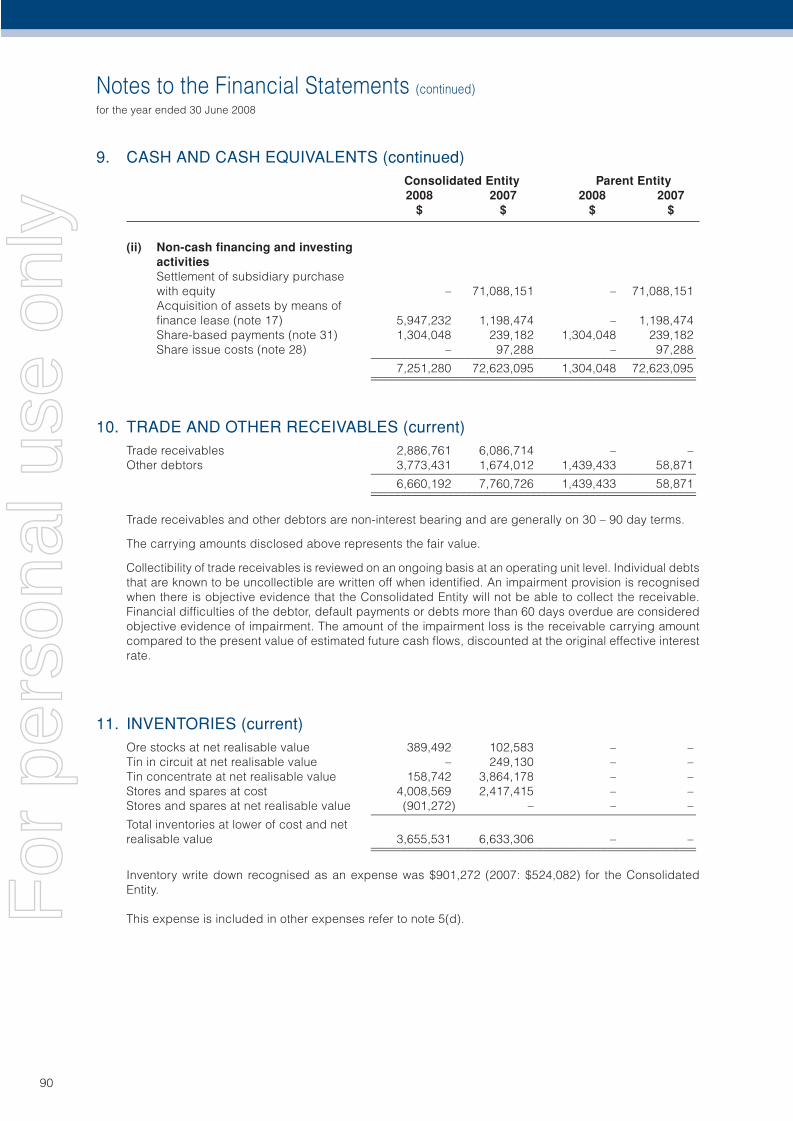
Notes to the Financial Statements (continued)
for the year ended 30 June 2008
90
9. CASH AND CASH EQUIVALENTS (continued) Consolidated Entity Parent Entity 2008 2007 2008 2007 $ $ $ $
(ii) Non-cash fi nancing and investing activities
Settlement of subsidiary purchase with equity – 71,088,151 – 71,088,151Acquisition of assets by means of fi nance lease (note 17) 5,947,232 1,198,474 – 1,198,474Share-based payments (note 31) 1,304,048 239,182 1,304,048 239,182Share issue costs (note 28) – 97,288 – 97,288 _______________________________________________________ 7,251,280 72,623,095 1,304,048 72,623,095 _______________________________________________________ _______________________________________________________
10. TRADE AND OTHER RECEIVABLES (current)Trade receivables 2,886,761 6,086,714 – –Other debtors 3,773,431 1,674,012 1,439,433 58,871 _______________________________________________________ 6,660,192 7,760,726 1,439,433 58,871 _______________________________________________________ _______________________________________________________
Trade receivables and other debtors are non-interest bearing and are generally on 30 – 90 day terms.
The carrying amounts disclosed above represents the fair value.
Collectibility of trade receivables is reviewed on an ongoing basis at an operating unit level. Individual debts that are known to be uncollectible are written off when identifi ed. An impairment provision is recognised when there is objective evidence that the Consolidated Entity will not be able to collect the receivable. Financial diffi culties of the debtor, default payments or debts more than 60 days overdue are considered objective evidence of impairment. The amount of the impairment loss is the receivable carrying amount compared to the present value of estimated future cash fl ows, discounted at the original effective interest rate.
11. INVENTORIES (current)Ore stocks at net realisable value 389,492 102,583 – –Tin in circuit at net realisable value – 249,130 – –Tin concentrate at net realisable value 158,742 3,864,178 – –Stores and spares at cost 4,008,569 2,417,415 – –Stores and spares at net realisable value (901,272) – – – _______________________________________________________Total inventories at lower of cost and net realisable value 3,655,531 6,633,306 – – _______________________________________________________ _______________________________________________________
Inventory write down recognised as an expense was $901,272 (2007: $524,082) for the Consolidated Entity.
This expense is included in other expenses refer to note 5(d).For
per
sona
l use
onl
y
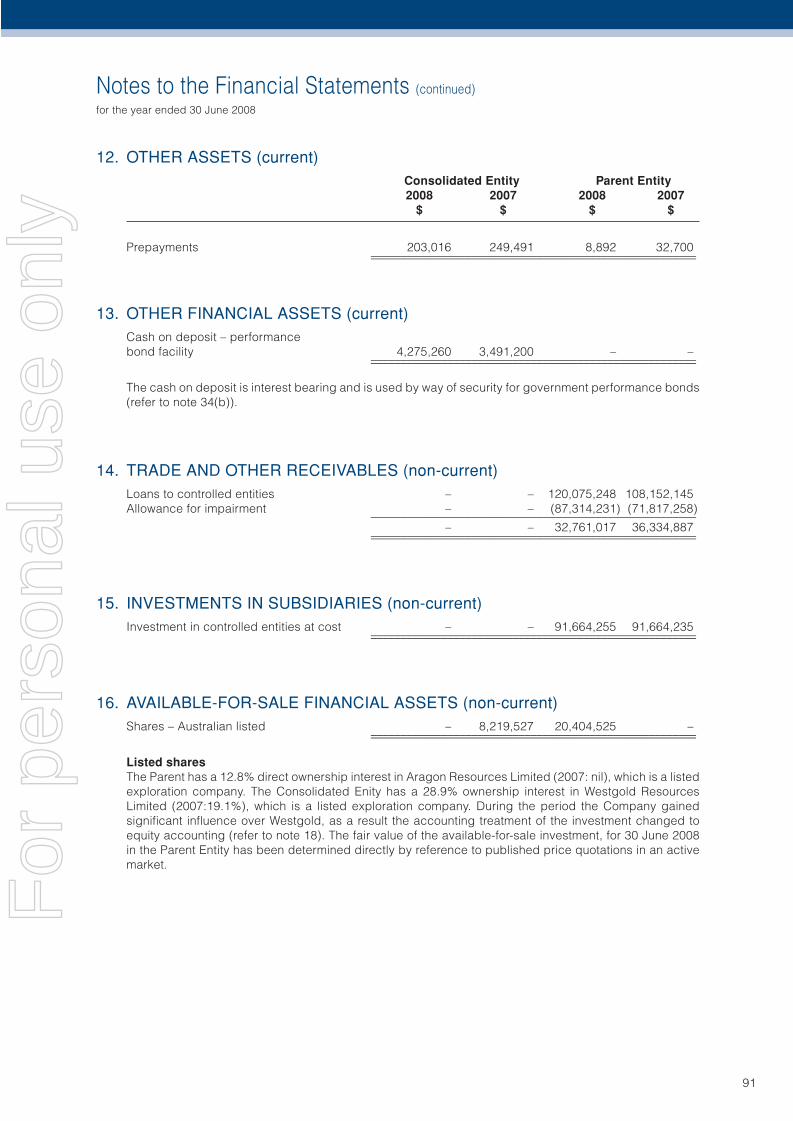
Notes to the Financial Statements (continued)
for the year ended 30 June 2008
91
12. OTHER ASSETS (current) Consolidated Entity Parent Entity 2008 2007 2008 2007 $ $ $ $
Prepayments 203,016 249,491 8,892 32,700 _______________________________________________________ _______________________________________________________
13. OTHER FINANCIAL ASSETS (current)Cash on deposit – performance bond facility 4,275,260 3,491,200 – – _______________________________________________________ _______________________________________________________
The cash on deposit is interest bearing and is used by way of security for government performance bonds (refer to note 34(b)).
14. TRADE AND OTHER RECEIVABLES (non-current)Loans to controlled entities – – 120,075,248 108,152,145Allowance for impairment – – (87,314,231) (71,817,258) _______________________________________________________ – – 32,761,017 36,334,887 _______________________________________________________ _______________________________________________________
15. INVESTMENTS IN SUBSIDIARIES (non-current)Investment in controlled entities at cost – – 91,664,255 91,664,235 _______________________________________________________ _______________________________________________________
16. AVAILABLE-FOR-SALE FINANCIAL ASSETS (non-current)Shares – Australian listed – 8,219,527 20,404,525 – _______________________________________________________ _______________________________________________________
Listed sharesThe Parent has a 12.8% direct ownership interest in Aragon Resources Limited (2007: nil), which is a listed exploration company. The Consolidated Enity has a 28.9% ownership interest in Westgold Resources Limited (2007:19.1%), which is a listed exploration company. During the period the Company gained signifi cant infl uence over Westgold, as a result the accounting treatment of the investment changed to equity accounting (refer to note 18). The fair value of the available-for-sale investment, for 30 June 2008 in the Parent Entity has been determined directly by reference to published price quotations in an active market.
For
per
sona
l use
onl
y
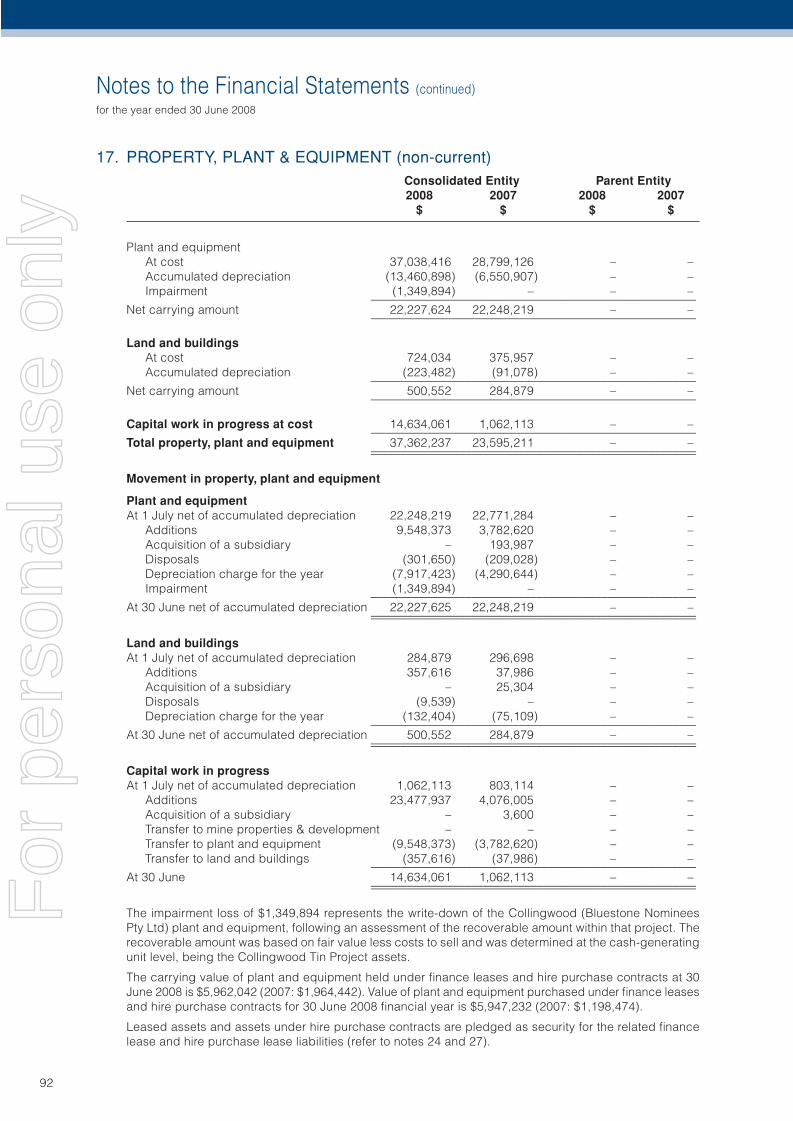
Notes to the Financial Statements (continued)
for the year ended 30 June 2008
92
17. PROPERTY, PLANT & EQUIPMENT (non-current) Consolidated Entity Parent Entity 2008 2007 2008 2007 $ $ $ $
Plant and equipmentAt cost 37,038,416 28,799,126 – –Accumulated depreciation (13,460,898) (6,550,907) – –Impairment (1,349,894) – – – _______________________________________________________
Net carrying amount 22,227,624 22,248,219 – – _______________________________________________________
Land and buildingsAt cost 724,034 375,957 – –Accumulated depreciation (223,482) (91,078) – – _______________________________________________________
Net carrying amount 500,552 284,879 – – _______________________________________________________
Capital work in progress at cost 14,634,061 1,062,113 – – _______________________________________________________Total property, plant and equipment 37,362,237 23,595,211 – – _______________________________________________________ _______________________________________________________
Movement in property, plant and equipment
Plant and equipmentAt 1 July net of accumulated depreciation 22,248,219 22,771,284 – –
Additions 9,548,373 3,782,620 – –Acquisition of a subsidiary – 193,987 – –Disposals (301,650) (209,028) – –Depreciation charge for the year (7,917,423) (4,290,644) – –Impairment (1,349,894) – – – _______________________________________________________
At 30 June net of accumulated depreciation 22,227,625 22,248,219 – – _______________________________________________________ _______________________________________________________
Land and buildingsAt 1 July net of accumulated depreciation 284,879 296,698 – –
Additions 357,616 37,986 – –Acquisition of a subsidiary – 25,304 – –Disposals (9,539) – – –Depreciation charge for the year (132,404) (75,109) – – _______________________________________________________
At 30 June net of accumulated depreciation 500,552 284,879 – – _______________________________________________________ _______________________________________________________
Capital work in progressAt 1 July net of accumulated depreciation 1,062,113 803,114 – –
Additions 23,477,937 4,076,005 – –Acquisition of a subsidiary – 3,600 – –Transfer to mine properties & development – – – –Transfer to plant and equipment (9,548,373) (3,782,620) – –Transfer to land and buildings (357,616) (37,986) – – _______________________________________________________
At 30 June 14,634,061 1,062,113 – – _______________________________________________________ _______________________________________________________
The impairment loss of $1,349,894 represents the write-down of the Collingwood (Bluestone Nominees Pty Ltd) plant and equipment, following an assessment of the recoverable amount within that project. The recoverable amount was based on fair value less costs to sell and was determined at the cash-generating unit level, being the Collingwood Tin Project assets.
The carrying value of plant and equipment held under fi nance leases and hire purchase contracts at 30 June 2008 is $5,962,042 (2007: $1,964,442). Value of plant and equipment purchased under fi nance leases and hire purchase contracts for 30 June 2008 fi nancial year is $5,947,232 (2007: $1,198,474).
Leased assets and assets under hire purchase contracts are pledged as security for the related fi nance lease and hire purchase lease liabilities (refer to notes 24 and 27).
For
per
sona
l use
onl
y
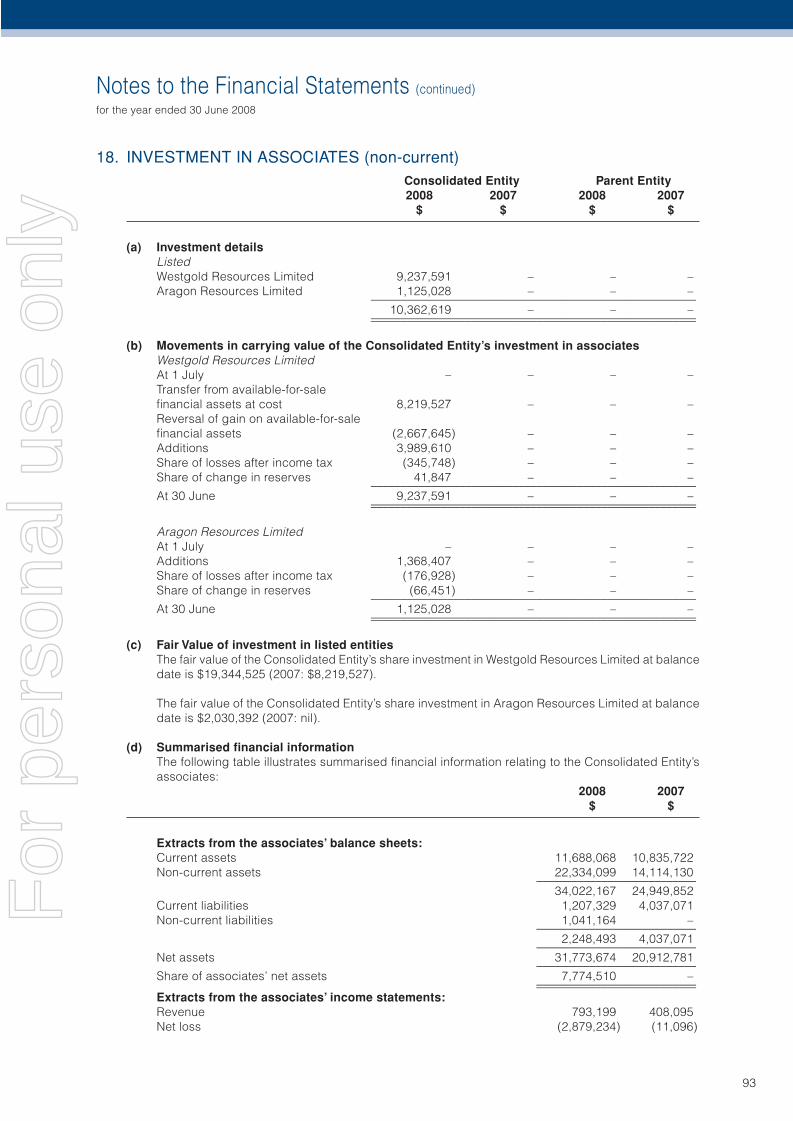
Notes to the Financial Statements (continued)
for the year ended 30 June 2008
93
18. INVESTMENT IN ASSOCIATES (non-current) Consolidated Entity Parent Entity 2008 2007 2008 2007 $ $ $ $
(a) Investment detailsListedWestgold Resources Limited 9,237,591 – – –Aragon Resources Limited 1,125,028 – – – _______________________________________________________
10,362,619 – – – _______________________________________________________ _______________________________________________________
(b) Movements in carrying value of the Consolidated Entity’s investment in associatesWestgold Resources LimitedAt 1 July – – – –Transfer from available-for-sale fi nancial assets at cost 8,219,527 – – –Reversal of gain on available-for-sale fi nancial assets (2,667,645) – – –Additions 3,989,610 – – –Share of losses after income tax (345,748) – – –Share of change in reserves 41,847 – – – _______________________________________________________At 30 June 9,237,591 – – – _______________________________________________________ _______________________________________________________
Aragon Resources LimitedAt 1 July – – – –Additions 1,368,407 – – –Share of losses after income tax (176,928) – – –Share of change in reserves (66,451) – – – _______________________________________________________At 30 June 1,125,028 – – – _______________________________________________________ _______________________________________________________
(c) Fair Value of investment in listed entitiesThe fair value of the Consolidated Entity’s share investment in Westgold Resources Limited at balance date is $19,344,525 (2007: $8,219,527).
The fair value of the Consolidated Entity’s share investment in Aragon Resources Limited at balance date is $2,030,392 (2007: nil).
(d) Summarised fi nancial informationThe following table illustrates summarised fi nancial information relating to the Consolidated Entity’s associates:
2008 2007 $ $
Extracts from the associates’ balance sheets:Current assets 11,688,068 10,835,722Non-current assets 22,334,099 14,114,130 ___________________________ 34,022,167 24,949,852Current liabilities 1,207,329 4,037,071Non-current liabilities 1,041,164 – ___________________________ 2,248,493 4,037,071 ___________________________Net assets 31,773,674 20,912,781 ___________________________Share of associates’ net assets 7,774,510 – ___________________________ ___________________________Extracts from the associates’ income statements:Revenue 793,199 408,095Net loss (2,879,234) (11,096)
For
per
sona
l use
onl
y
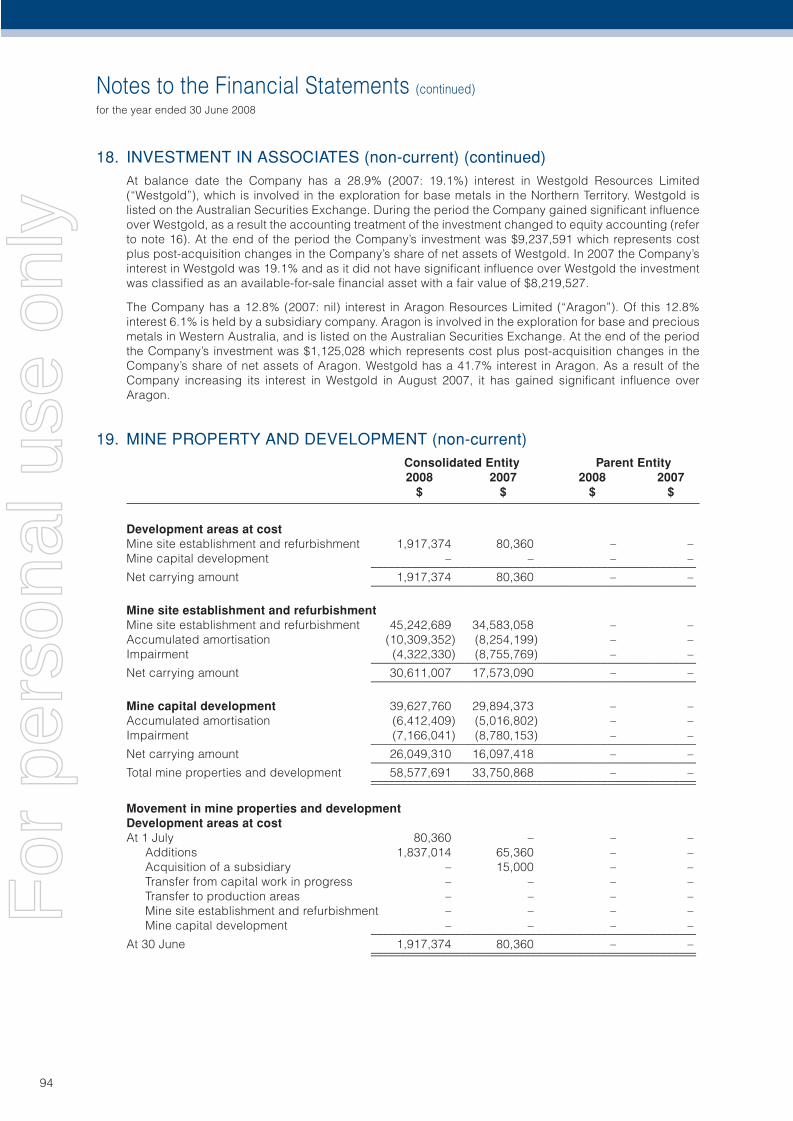
Notes to the Financial Statements (continued)
for the year ended 30 June 2008
94
18. INVESTMENT IN ASSOCIATES (non-current) (continued)At balance date the Company has a 28.9% (2007: 19.1%) interest in Westgold Resources Limited (“Westgold”), which is involved in the exploration for base metals in the Northern Territory. Westgold is listed on the Australian Securities Exchange. During the period the Company gained signifi cant infl uence over Westgold, as a result the accounting treatment of the investment changed to equity accounting (refer to note 16). At the end of the period the Company’s investment was $9,237,591 which represents cost plus post-acquisition changes in the Company’s share of net assets of Westgold. In 2007 the Company’s interest in Westgold was 19.1% and as it did not have signifi cant infl uence over Westgold the investment was classifi ed as an available-for-sale fi nancial asset with a fair value of $8,219,527.
The Company has a 12.8% (2007: nil) interest in Aragon Resources Limited (“Aragon”). Of this 12.8% interest 6.1% is held by a subsidiary company. Aragon is involved in the exploration for base and precious metals in Western Australia, and is listed on the Australian Securities Exchange. At the end of the period the Company’s investment was $1,125,028 which represents cost plus post-acquisition changes in the Company’s share of net assets of Aragon. Westgold has a 41.7% interest in Aragon. As a result of the Company increasing its interest in Westgold in August 2007, it has gained signifi cant infl uence over Aragon.
19. MINE PROPERTY AND DEVELOPMENT (non-current) Consolidated Entity Parent Entity 2008 2007 2008 2007 $ $ $ $
Development areas at costMine site establishment and refurbishment 1,917,374 80,360 – –Mine capital development – – – – _______________________________________________________Net carrying amount 1,917,374 80,360 – – _______________________________________________________
Mine site establishment and refurbishmentMine site establishment and refurbishment 45,242,689 34,583,058 – –Accumulated amortisation (10,309,352) (8,254,199) – –Impairment (4,322,330) (8,755,769) – – _______________________________________________________Net carrying amount 30,611,007 17,573,090 – – _______________________________________________________
Mine capital development 39,627,760 29,894,373 – –Accumulated amortisation (6,412,409) (5,016,802) – –Impairment (7,166,041) (8,780,153) – – _______________________________________________________Net carrying amount 26,049,310 16,097,418 – – _______________________________________________________Total mine properties and development 58,577,691 33,750,868 – – _______________________________________________________ _______________________________________________________
Movement in mine properties and developmentDevelopment areas at costAt 1 July 80,360 – – –
Additions 1,837,014 65,360 – –Acquisition of a subsidiary – 15,000 – –Transfer from capital work in progress – – – –Transfer to production areas – – – –Mine site establishment and refurbishment – – – –Mine capital development – – – – _______________________________________________________
At 30 June 1,917,374 80,360 – – _______________________________________________________ _______________________________________________________
For
per
sona
l use
onl
y
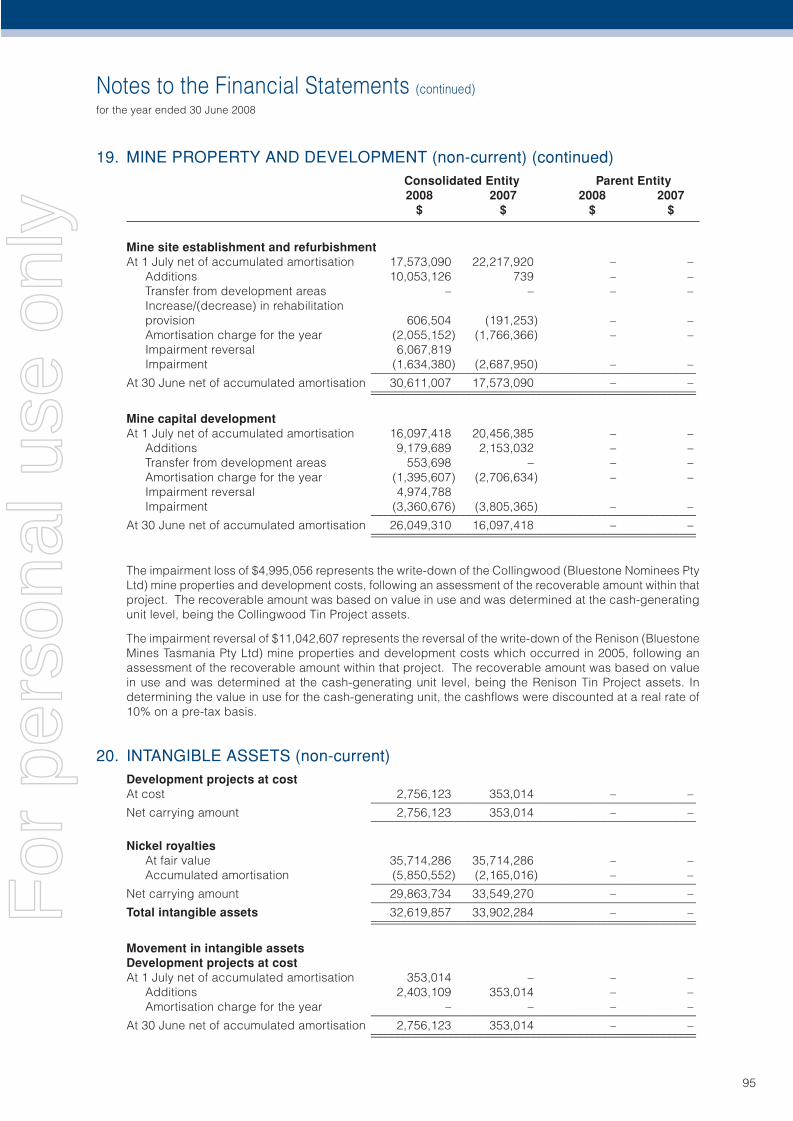
Notes to the Financial Statements (continued)
for the year ended 30 June 2008
95
19. MINE PROPERTY AND DEVELOPMENT (non-current) (continued) Consolidated Entity Parent Entity 2008 2007 2008 2007 $ $ $ $
Mine site establishment and refurbishmentAt 1 July net of accumulated amortisation 17,573,090 22,217,920 – –
Additions 10,053,126 739 – –Transfer from development areas – – – –Increase/(decrease) in rehabilitation provision 606,504 (191,253) – –Amortisation charge for the year (2,055,152) (1,766,366) – –Impairment reversal 6,067,819Impairment (1,634,380) (2,687,950) – – _______________________________________________________
At 30 June net of accumulated amortisation 30,611,007 17,573,090 – – _______________________________________________________ _______________________________________________________
Mine capital developmentAt 1 July net of accumulated amortisation 16,097,418 20,456,385 – –
Additions 9,179,689 2,153,032 – –Transfer from development areas 553,698 – – –Amortisation charge for the year (1,395,607) (2,706,634) – –Impairment reversal 4,974,788Impairment (3,360,676) (3,805,365) – – _______________________________________________________
At 30 June net of accumulated amortisation 26,049,310 16,097,418 – – _______________________________________________________ _______________________________________________________
The impairment loss of $4,995,056 represents the write-down of the Collingwood (Bluestone Nominees Pty Ltd) mine properties and development costs, following an assessment of the recoverable amount within that project. The recoverable amount was based on value in use and was determined at the cash-generating unit level, being the Collingwood Tin Project assets.
The impairment reversal of $11,042,607 represents the reversal of the write-down of the Renison (Bluestone Mines Tasmania Pty Ltd) mine properties and development costs which occurred in 2005, following an assessment of the recoverable amount within that project. The recoverable amount was based on value in use and was determined at the cash-generating unit level, being the Renison Tin Project assets. In determining the value in use for the cash-generating unit, the cashfl ows were discounted at a real rate of 10% on a pre-tax basis.
20. INTANGIBLE ASSETS (non-current)Development projects at costAt cost 2,756,123 353,014 – – _______________________________________________________Net carrying amount 2,756,123 353,014 – – _______________________________________________________
Nickel royaltiesAt fair value 35,714,286 35,714,286 – –Accumulated amortisation (5,850,552) (2,165,016) – – _______________________________________________________
Net carrying amount 29,863,734 33,549,270 – – _______________________________________________________Total intangible assets 32,619,857 33,902,284 – – _______________________________________________________ _______________________________________________________
Movement in intangible assetsDevelopment projects at costAt 1 July net of accumulated amortisation 353,014 – – –
Additions 2,403,109 353,014 – –Amortisation charge for the year – – – – _______________________________________________________
At 30 June net of accumulated amortisation 2,756,123 353,014 – – _______________________________________________________ _______________________________________________________
For
per
sona
l use
onl
y
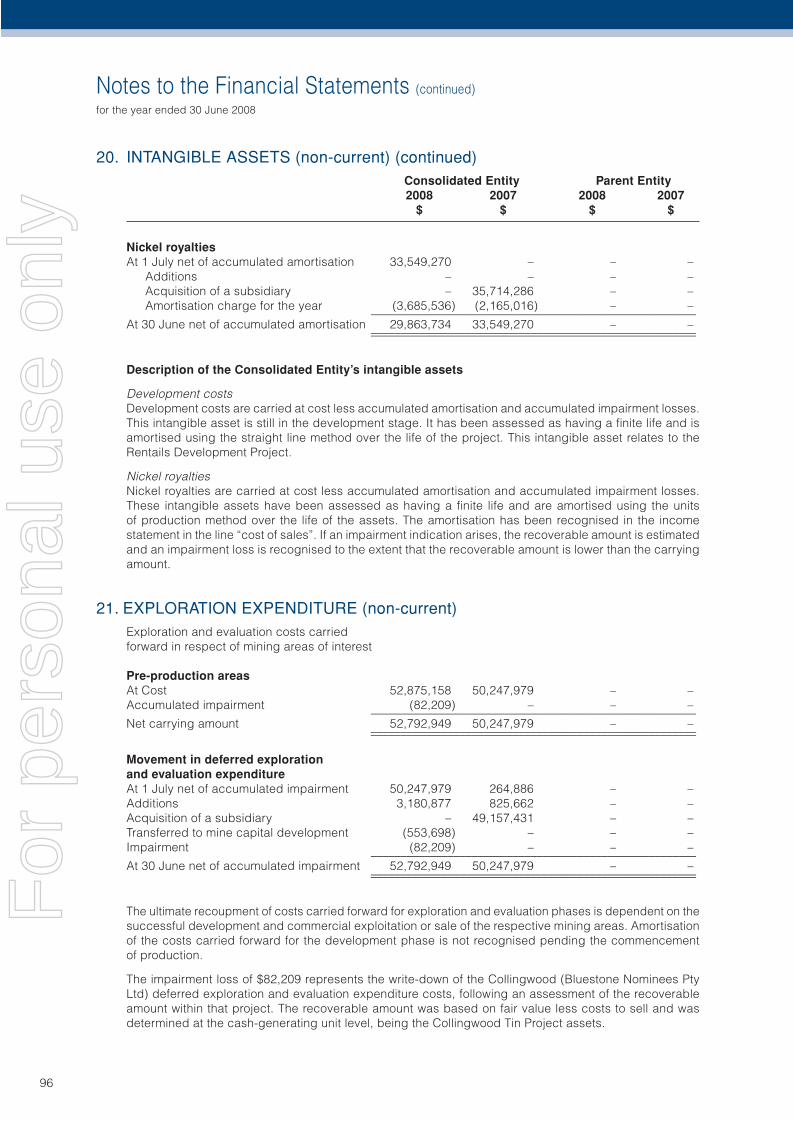
Notes to the Financial Statements (continued)
for the year ended 30 June 2008
96
20. INTANGIBLE ASSETS (non-current) (continued) Consolidated Entity Parent Entity 2008 2007 2008 2007 $ $ $ $
Nickel royaltiesAt 1 July net of accumulated amortisation 33,549,270 – – –
Additions – – – –Acquisition of a subsidiary – 35,714,286 – –Amortisation charge for the year (3,685,536) (2,165,016) – – _______________________________________________________
At 30 June net of accumulated amortisation 29,863,734 33,549,270 – – _______________________________________________________ _______________________________________________________
Description of the Consolidated Entity’s intangible assets
Development costsDevelopment costs are carried at cost less accumulated amortisation and accumulated impairment losses. This intangible asset is still in the development stage. It has been assessed as having a fi nite life and is amortised using the straight line method over the life of the project. This intangible asset relates to the Rentails Development Project.
Nickel royaltiesNickel royalties are carried at cost less accumulated amortisation and accumulated impairment losses. These intangible assets have been assessed as having a fi nite life and are amortised using the units of production method over the life of the assets. The amortisation has been recognised in the income statement in the line “cost of sales”. If an impairment indication arises, the recoverable amount is estimated and an impairment loss is recognised to the extent that the recoverable amount is lower than the carrying amount.
21. EXPLORATION EXPENDITURE (non-current)Exploration and evaluation costs carried forward in respect of mining areas of interest
Pre-production areasAt Cost 52,875,158 50,247,979 – –Accumulated impairment (82,209) – – – _______________________________________________________Net carrying amount 52,792,949 50,247,979 – – _______________________________________________________ _______________________________________________________
Movement in deferred exploration and evaluation expenditureAt 1 July net of accumulated impairment 50,247,979 264,886 – –Additions 3,180,877 825,662 – –Acquisition of a subsidiary – 49,157,431 – –Transferred to mine capital development (553,698) – – –Impairment (82,209) – – – _______________________________________________________At 30 June net of accumulated impairment 52,792,949 50,247,979 – – _______________________________________________________ _______________________________________________________
The ultimate recoupment of costs carried forward for exploration and evaluation phases is dependent on the successful development and commercial exploitation or sale of the respective mining areas. Amortisation of the costs carried forward for the development phase is not recognised pending the commencement of production.
The impairment loss of $82,209 represents the write-down of the Collingwood (Bluestone Nominees Pty Ltd) deferred exploration and evaluation expenditure costs, following an assessment of the recoverable amount within that project. The recoverable amount was based on fair value less costs to sell and was determined at the cash-generating unit level, being the Collingwood Tin Project assets.
F
For
per
sona
l use
onl
y
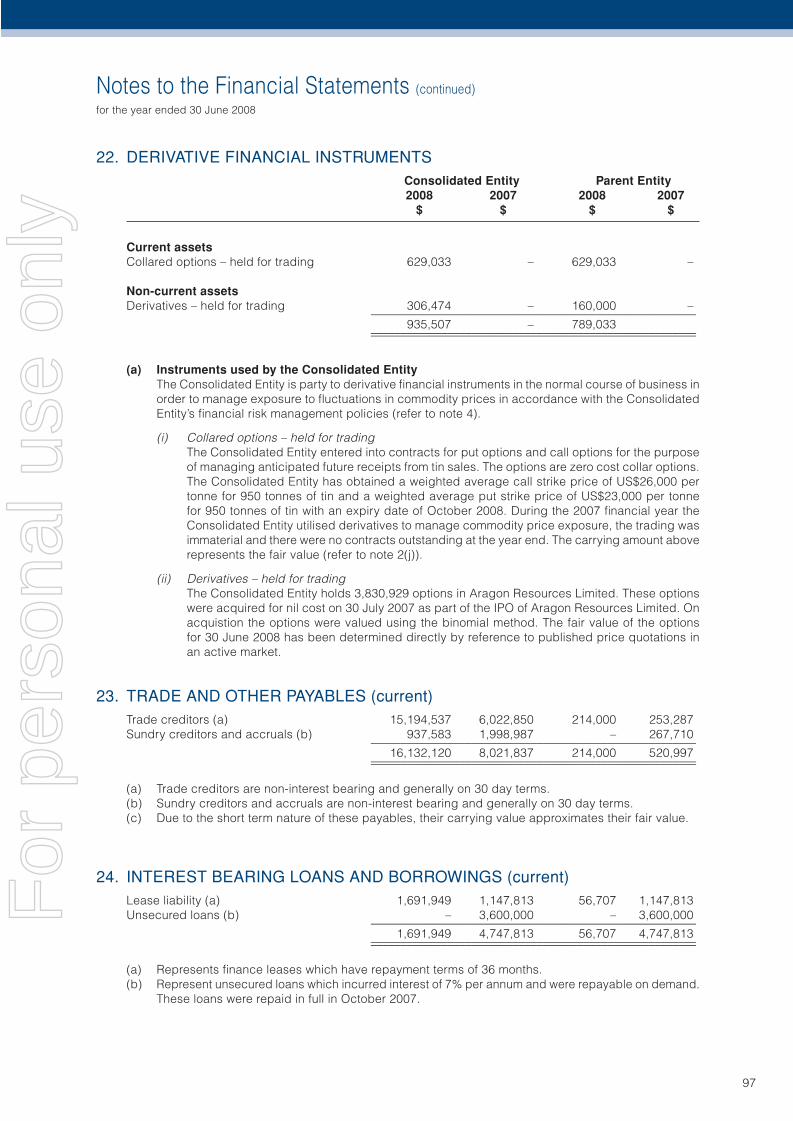
Notes to the Financial Statements (continued)
for the year ended 30 June 2008
97
22. DERIVATIVE FINANCIAL INSTRUMENTS Consolidated Entity Parent Entity 2008 2007 2008 2007 $ $ $ $
Current assetsCollared options – held for trading 629,033 – 629,033 –
Non-current assetsDerivatives – held for trading 306,474 – 160,000 – _______________________________________________________ 935,507 – 789,033 _______________________________________________________ _______________________________________________________
(a) Instruments used by the Consolidated EntityThe Consolidated Entity is party to derivative fi nancial instruments in the normal course of business in order to manage exposure to fl uctuations in commodity prices in accordance with the Consolidated Entity’s fi nancial risk management policies (refer to note 4).
(i) Collared options – held for tradingThe Consolidated Entity entered into contracts for put options and call options for the purpose of managing anticipated future receipts from tin sales. The options are zero cost collar options. The Consolidated Entity has obtained a weighted average call strike price of US$26,000 per tonne for 950 tonnes of tin and a weighted average put strike price of US$23,000 per tonne for 950 tonnes of tin with an expiry date of October 2008. During the 2007 fi nancial year the Consolidated Entity utilised derivatives to manage commodity price exposure, the trading was immaterial and there were no contracts outstanding at the year end. The carrying amount above represents the fair value (refer to note 2(j)).
(ii) Derivatives – held for tradingThe Consolidated Entity holds 3,830,929 options in Aragon Resources Limited. These options were acquired for nil cost on 30 July 2007 as part of the IPO of Aragon Resources Limited. On acquistion the options were valued using the binomial method. The fair value of the options for 30 June 2008 has been determined directly by reference to published price quotations in an active market.
23. TRADE AND OTHER PAYABLES (current)Trade creditors (a) 15,194,537 6,022,850 214,000 253,287Sundry creditors and accruals (b) 937,583 1,998,987 – 267,710 _______________________________________________________ 16,132,120 8,021,837 214,000 520,997 _______________________________________________________ _______________________________________________________
(a) Trade creditors are non-interest bearing and generally on 30 day terms.(b) Sundry creditors and accruals are non-interest bearing and generally on 30 day terms.(c) Due to the short term nature of these payables, their carrying value approximates their fair value.
24. INTEREST BEARING LOANS AND BORROWINGS (current)Lease liability (a) 1,691,949 1,147,813 56,707 1,147,813Unsecured loans (b) – 3,600,000 – 3,600,000 _______________________________________________________ 1,691,949 4,747,813 56,707 4,747,813 _______________________________________________________ _______________________________________________________
(a) Represents fi nance leases which have repayment terms of 36 months.(b) Represent unsecured loans which incurred interest of 7% per annum and were repayable on demand.
These loans were repaid in full in October 2007.
For
per
sona
l use
onl
y
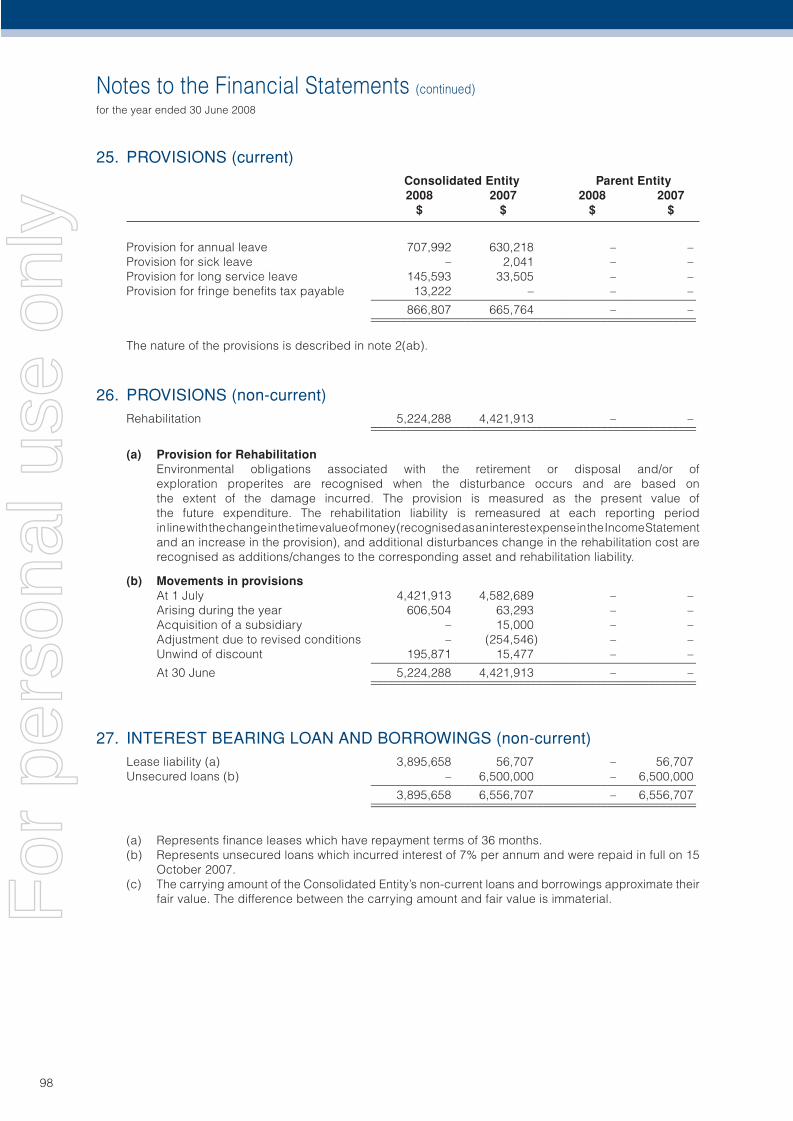
Notes to the Financial Statements (continued)
for the year ended 30 June 2008
98
25. PROVISIONS (current) Consolidated Entity Parent Entity 2008 2007 2008 2007 $ $ $ $
Provision for annual leave 707,992 630,218 – –Provision for sick leave – 2,041 – –Provision for long service leave 145,593 33,505 – –Provision for fringe benefi ts tax payable 13,222 – – – _______________________________________________________ 866,807 665,764 – – _______________________________________________________ _______________________________________________________
The nature of the provisions is described in note 2(ab).
26. PROVISIONS (non-current)Rehabilitation 5,224,288 4,421,913 – – _______________________________________________________ _______________________________________________________
(a) Provision for RehabilitationEnvironmental obligations associated with the retirement or disposal and/or of exploration properites are recognised when the disturbance occurs and are based on the extent of the damage incurred. The provision is measured as the present value of the future expenditure. The rehabilitation liability is remeasured at each reporting period in line with the change in the time value of money (recognised as an interest expense in the Income Statement and an increase in the provision), and additional disturbances change in the rehabilitation cost are recognised as additions/changes to the corresponding asset and rehabilitation liability.
(b) Movements in provisionsAt 1 July 4,421,913 4,582,689 – –Arising during the year 606,504 63,293 – –Acquisition of a subsidiary – 15,000 – –Adjustment due to revised conditions – (254,546) – –Unwind of discount 195,871 15,477 – – _______________________________________________________At 30 June 5,224,288 4,421,913 – – _______________________________________________________ _______________________________________________________
27. INTEREST BEARING LOAN AND BORROWINGS (non-current)Lease liability (a) 3,895,658 56,707 – 56,707Unsecured loans (b) – 6,500,000 – 6,500,000 _______________________________________________________ 3,895,658 6,556,707 – 6,556,707 _______________________________________________________ _______________________________________________________
(a) Represents fi nance leases which have repayment terms of 36 months.(b) Represents unsecured loans which incurred interest of 7% per annum and were repaid in full on 15
October 2007.(c) The carrying amount of the Consolidated Entity’s non-current loans and borrowings approximate their
fair value. The difference between the carrying amount and fair value is immaterial.For
per
sona
l use
onl
y
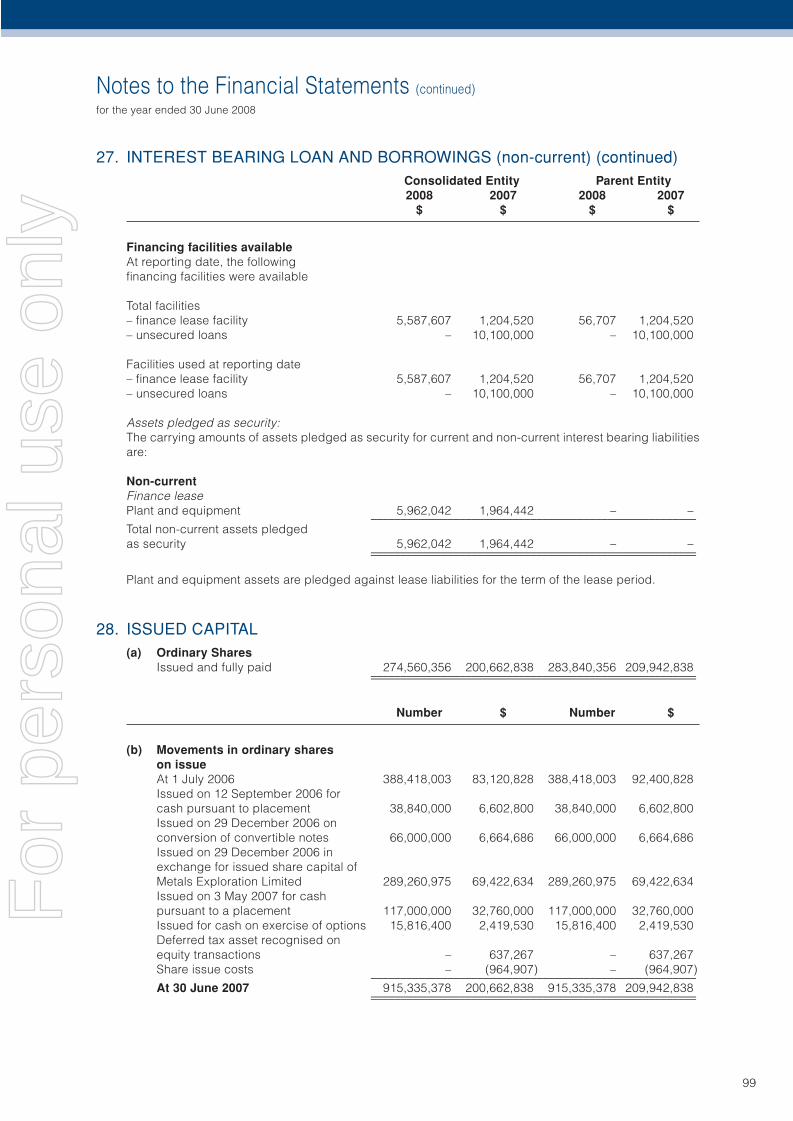
Notes to the Financial Statements (continued)
for the year ended 30 June 2008
99
27. INTEREST BEARING LOAN AND BORROWINGS (non-current) (continued) Consolidated Entity Parent Entity 2008 2007 2008 2007 $ $ $ $
Financing facilities availableAt reporting date, the following fi nancing facilities were available
Total facilities– fi nance lease facility 5,587,607 1,204,520 56,707 1,204,520– unsecured loans – 10,100,000 – 10,100,000
Facilities used at reporting date– fi nance lease facility 5,587,607 1,204,520 56,707 1,204,520– unsecured loans – 10,100,000 – 10,100,000
Assets pledged as security:The carrying amounts of assets pledged as security for current and non-current interest bearing liabilities are:
Non-currentFinance leasePlant and equipment 5,962,042 1,964,442 – – _______________________________________________________Total non-current assets pledged as security 5,962,042 1,964,442 – – _______________________________________________________ _______________________________________________________
Plant and equipment assets are pledged against lease liabilities for the term of the lease period.
28. ISSUED CAPITAL(a) Ordinary Shares
Issued and fully paid 274,560,356 200,662,838 283,840,356 209,942,838 _______________________________________________________ _______________________________________________________
Number $ Number $
(b) Movements in ordinary shares on issue
At 1 July 2006 388,418,003 83,120,828 388,418,003 92,400,828Issued on 12 September 2006 for cash pursuant to placement 38,840,000 6,602,800 38,840,000 6,602,800Issued on 29 December 2006 on conversion of convertible notes 66,000,000 6,664,686 66,000,000 6,664,686Issued on 29 December 2006 in exchange for issued share capital of Metals Exploration Limited 289,260,975 69,422,634 289,260,975 69,422,634Issued on 3 May 2007 for cash pursuant to a placement 117,000,000 32,760,000 117,000,000 32,760,000Issued for cash on exercise of options 15,816,400 2,419,530 15,816,400 2,419,530Deferred tax asset recognised on equity transactions – 637,267 – 637,267Share issue costs – (964,907) – (964,907) _______________________________________________________At 30 June 2007 915,335,378 200,662,838 915,335,378 209,942,838 _______________________________________________________ _______________________________________________________
For
per
sona
l use
onl
y
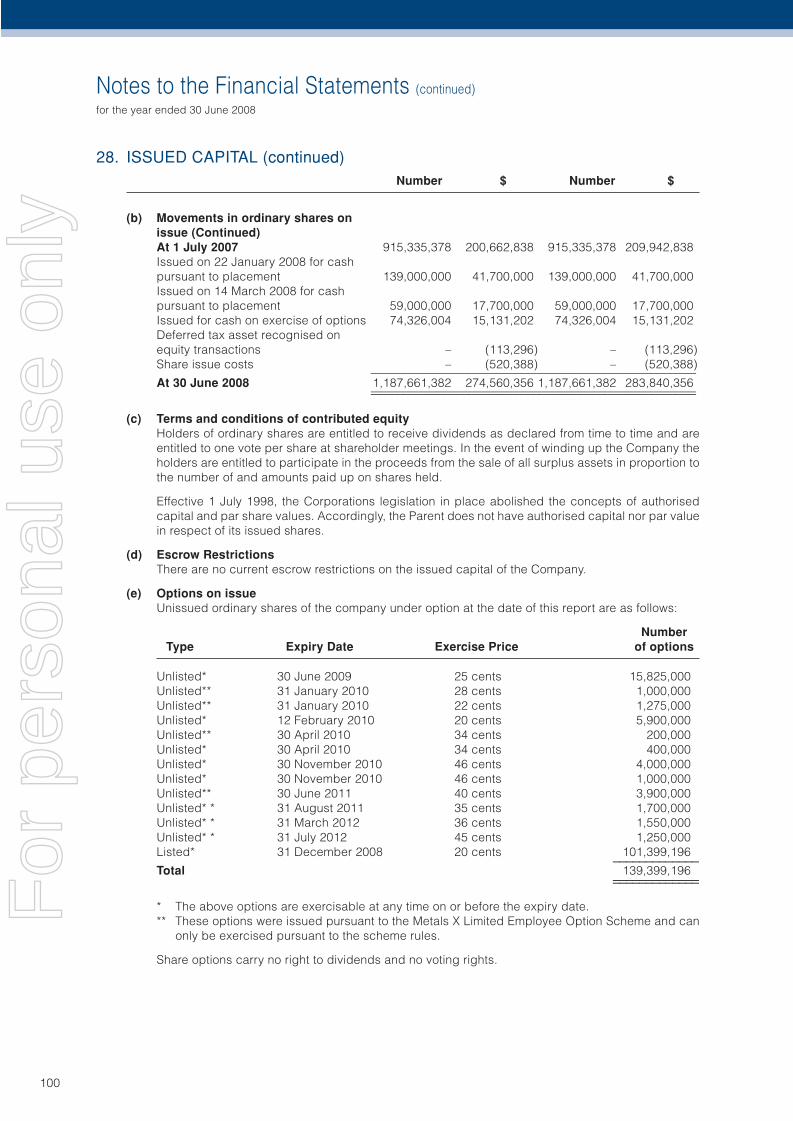
Notes to the Financial Statements (continued)
for the year ended 30 June 2008
100
28. ISSUED CAPITAL (continued) Number $ Number $
(b) Movements in ordinary shares on issue (Continued)
At 1 July 2007 915,335,378 200,662,838 915,335,378 209,942,838Issued on 22 January 2008 for cash pursuant to placement 139,000,000 41,700,000 139,000,000 41,700,000Issued on 14 March 2008 for cash pursuant to placement 59,000,000 17,700,000 59,000,000 17,700,000Issued for cash on exercise of options 74,326,004 15,131,202 74,326,004 15,131,202Deferred tax asset recognised on equity transactions – (113,296) – (113,296)Share issue costs – (520,388) – (520,388) _______________________________________________________At 30 June 2008 1,187,661,382 274,560,356 1,187,661,382 283,840,356 _______________________________________________________ _______________________________________________________
(c) Terms and conditions of contributed equityHolders of ordinary shares are entitled to receive dividends as declared from time to time and are entitled to one vote per share at shareholder meetings. In the event of winding up the Company the holders are entitled to participate in the proceeds from the sale of all surplus assets in proportion to the number of and amounts paid up on shares held.
Effective 1 July 1998, the Corporations legislation in place abolished the concepts of authorised capital and par share values. Accordingly, the Parent does not have authorised capital nor par value in respect of its issued shares.
(d) Escrow RestrictionsThere are no current escrow restrictions on the issued capital of the Company.
(e) Options on issueUnissued ordinary shares of the company under option at the date of this report are as follows:
Number Type Expiry Date Exercise Price of options
Unlisted* 30 June 2009 25 cents 15,825,000Unlisted** 31 January 2010 28 cents 1,000,000Unlisted** 31 January 2010 22 cents 1,275,000Unlisted* 12 February 2010 20 cents 5,900,000Unlisted** 30 April 2010 34 cents 200,000Unlisted* 30 April 2010 34 cents 400,000Unlisted* 30 November 2010 46 cents 4,000,000Unlisted* 30 November 2010 46 cents 1,000,000Unlisted** 30 June 2011 40 cents 3,900,000Unlisted* * 31 August 2011 35 cents 1,700,000Unlisted* * 31 March 2012 36 cents 1,550,000Unlisted* * 31 July 2012 45 cents 1,250,000Listed* 31 December 2008 20 cents 101,399,196 _____________Total 139,399,196 _____________ _____________
* The above options are exercisable at any time on or before the expiry date.** These options were issued pursuant to the Metals X Limited Employee Option Scheme and can
only be exercised pursuant to the scheme rules.
Share options carry no right to dividends and no voting rights.
For
per
sona
l use
onl
y
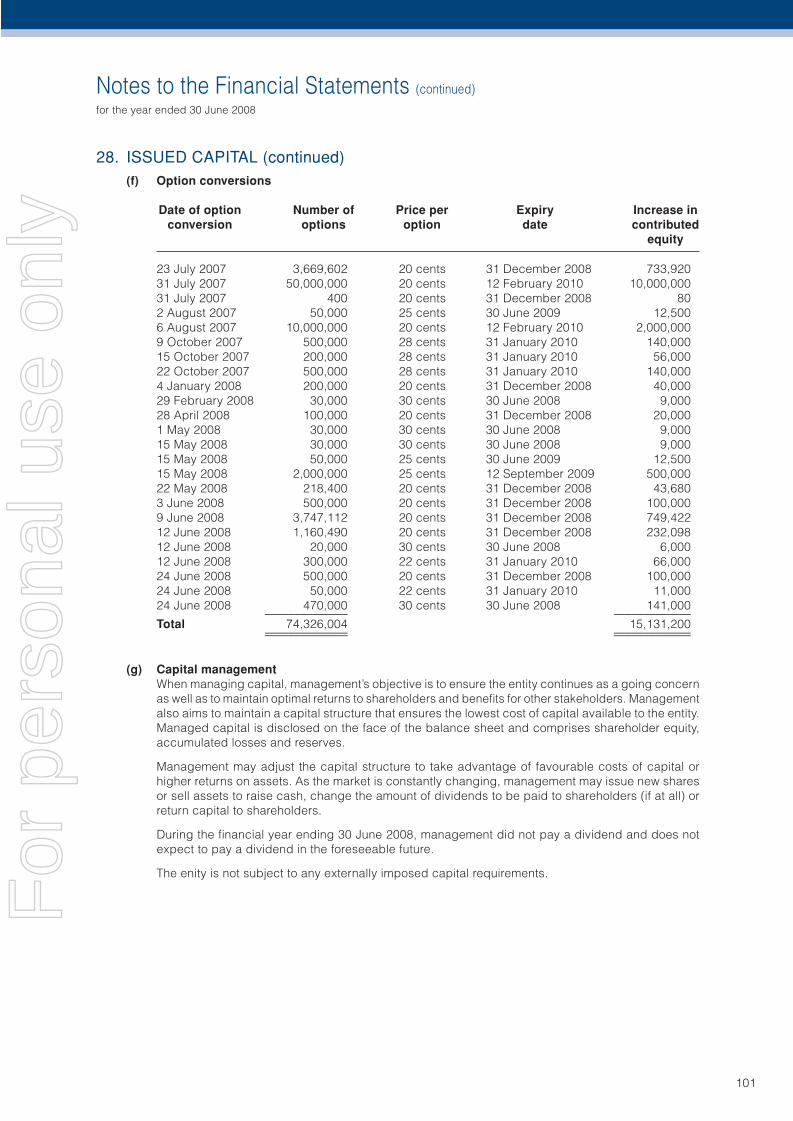
Notes to the Financial Statements (continued)
for the year ended 30 June 2008
101
28. ISSUED CAPITAL (continued)(f) Option conversions
Date of option Number of Price per Expiry Increase in conversion options option date contributed equity
23 July 2007 3,669,602 20 cents 31 December 2008 733,92031 July 2007 50,000,000 20 cents 12 February 2010 10,000,00031 July 2007 400 20 cents 31 December 2008 802 August 2007 50,000 25 cents 30 June 2009 12,5006 August 2007 10,000,000 20 cents 12 February 2010 2,000,0009 October 2007 500,000 28 cents 31 January 2010 140,00015 October 2007 200,000 28 cents 31 January 2010 56,00022 October 2007 500,000 28 cents 31 January 2010 140,0004 January 2008 200,000 20 cents 31 December 2008 40,00029 February 2008 30,000 30 cents 30 June 2008 9,00028 April 2008 100,000 20 cents 31 December 2008 20,0001 May 2008 30,000 30 cents 30 June 2008 9,00015 May 2008 30,000 30 cents 30 June 2008 9,00015 May 2008 50,000 25 cents 30 June 2009 12,50015 May 2008 2,000,000 25 cents 12 September 2009 500,00022 May 2008 218,400 20 cents 31 December 2008 43,6803 June 2008 500,000 20 cents 31 December 2008 100,0009 June 2008 3,747,112 20 cents 31 December 2008 749,42212 June 2008 1,160,490 20 cents 31 December 2008 232,09812 June 2008 20,000 30 cents 30 June 2008 6,00012 June 2008 300,000 22 cents 31 January 2010 66,00024 June 2008 500,000 20 cents 31 December 2008 100,00024 June 2008 50,000 22 cents 31 January 2010 11,00024 June 2008 470,000 30 cents 30 June 2008 141,000 ______________ _____________Total 74,326,004 15,131,200 ______________ _____________ ______________ _____________
(g) Capital managementWhen managing capital, management’s objective is to ensure the entity continues as a going concern as well as to maintain optimal returns to shareholders and benefi ts for other stakeholders. Management also aims to maintain a capital structure that ensures the lowest cost of capital available to the entity. Managed capital is disclosed on the face of the balance sheet and comprises shareholder equity, accumulated losses and reserves.
Management may adjust the capital structure to take advantage of favourable costs of capital or higher returns on assets. As the market is constantly changing, management may issue new shares or sell assets to raise cash, change the amount of dividends to be paid to shareholders (if at all) or return capital to shareholders.
During the fi nancial year ending 30 June 2008, management did not pay a dividend and does not expect to pay a dividend in the foreseeable future.
The enity is not subject to any externally imposed capital requirements.
For
per
sona
l use
onl
y
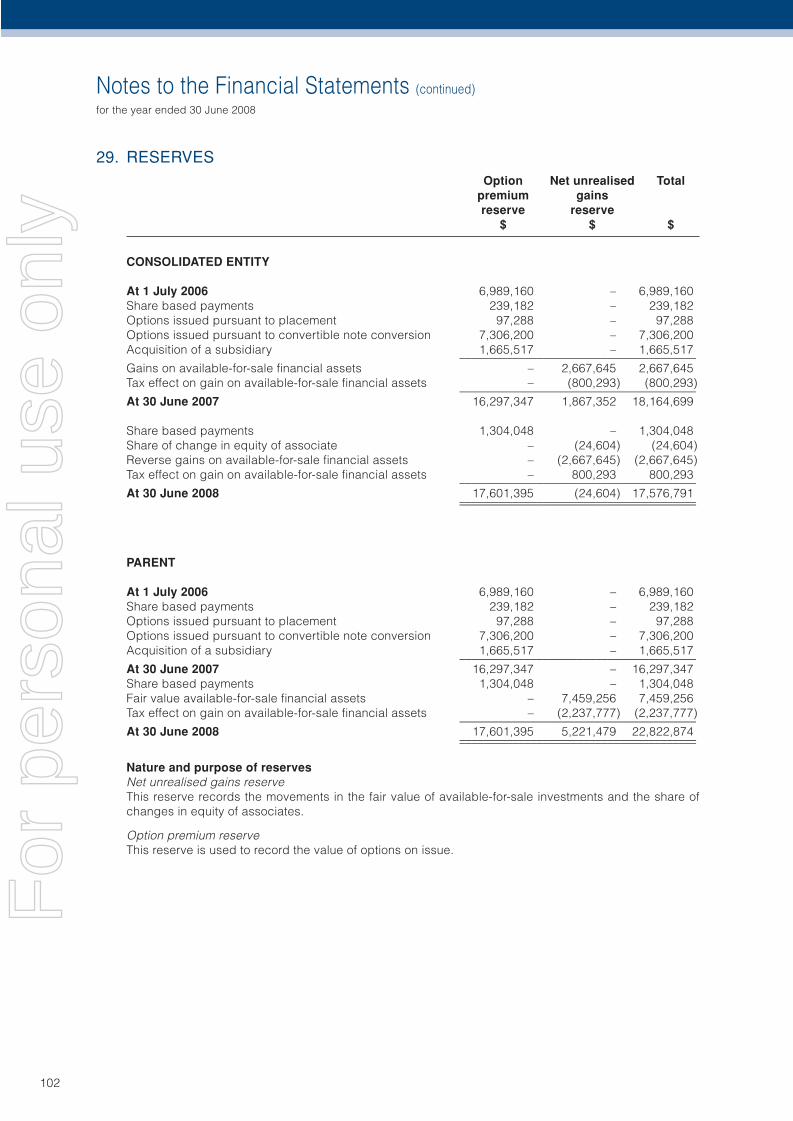
Notes to the Financial Statements (continued)
for the year ended 30 June 2008
102
29. RESERVES Option Net unrealised Total premium gains reserve reserve $ $ $
CONSOLIDATED ENTITY
At 1 July 2006 6,989,160 – 6,989,160Share based payments 239,182 – 239,182Options issued pursuant to placement 97,288 – 97,288Options issued pursuant to convertible note conversion 7,306,200 – 7,306,200Acquisition of a subsidiary 1,665,517 – 1,665,517 ________________________________________Gains on available-for-sale fi nancial assets – 2,667,645 2,667,645Tax effect on gain on available-for-sale fi nancial assets – (800,293) (800,293) ________________________________________At 30 June 2007 16,297,347 1,867,352 18,164,699
Share based payments 1,304,048 – 1,304,048Share of change in equity of associate – (24,604) (24,604)Reverse gains on available-for-sale fi nancial assets – (2,667,645) (2,667,645)Tax effect on gain on available-for-sale fi nancial assets – 800,293 800,293 ________________________________________At 30 June 2008 17,601,395 (24,604) 17,576,791 ________________________________________ ________________________________________
PARENT
At 1 July 2006 6,989,160 – 6,989,160Share based payments 239,182 – 239,182Options issued pursuant to placement 97,288 – 97,288Options issued pursuant to convertible note conversion 7,306,200 – 7,306,200Acquisition of a subsidiary 1,665,517 – 1,665,517 ________________________________________At 30 June 2007 16,297,347 – 16,297,347Share based payments 1,304,048 – 1,304,048Fair value available-for-sale fi nancial assets – 7,459,256 7,459,256Tax effect on gain on available-for-sale fi nancial assets – (2,237,777) (2,237,777) ________________________________________At 30 June 2008 17,601,395 5,221,479 22,822,874 ________________________________________ ________________________________________
Nature and purpose of reservesNet unrealised gains reserveThis reserve records the movements in the fair value of available-for-sale investments and the share of changes in equity of associates.
Option premium reserveThis reserve is used to record the value of options on issue.
For
per
sona
l use
onl
y
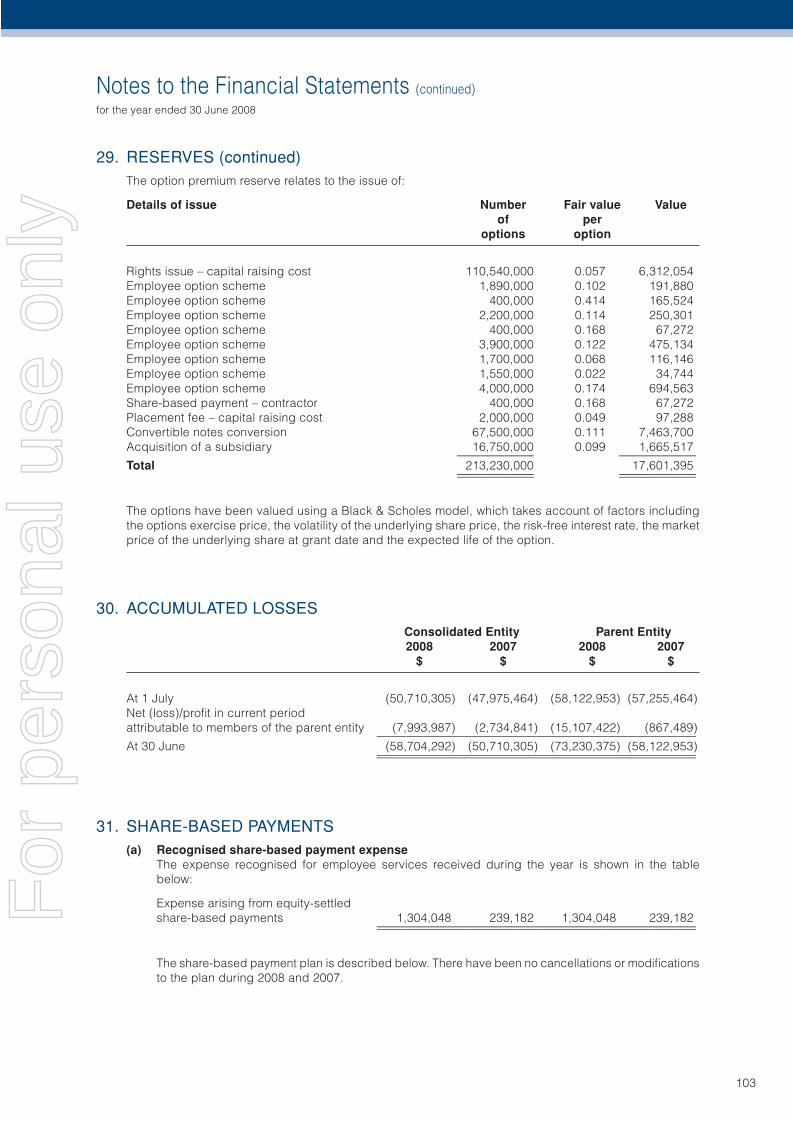
Notes to the Financial Statements (continued)
for the year ended 30 June 2008
103
29. RESERVES (continued)The option premium reserve relates to the issue of:
Details of issue Number Fair value Value of per options option
Rights issue – capital raising cost 110,540,000 0.057 6,312,054Employee option scheme 1,890,000 0.102 191,880Employee option scheme 400,000 0.414 165,524Employee option scheme 2,200,000 0.114 250,301Employee option scheme 400,000 0.168 67,272Employee option scheme 3,900,000 0.122 475,134Employee option scheme 1,700,000 0.068 116,146Employee option scheme 1,550,000 0.022 34,744Employee option scheme 4,000,000 0.174 694,563Share-based payment – contractor 400,000 0.168 67,272Placement fee – capital raising cost 2,000,000 0.049 97,288Convertible notes conversion 67,500,000 0.111 7,463,700Acquisition of a subsidiary 16,750,000 0.099 1,665,517 _____________ _____________Total 213,230,000 17,601,395 _____________ _____________ _____________ _____________
The options have been valued using a Black & Scholes model, which takes account of factors including the options exercise price, the volatility of the underlying share price, the risk-free interest rate, the market price of the underlying share at grant date and the expected life of the option.
30. ACCUMULATED LOSSES Consolidated Entity Parent Entity 2008 2007 2008 2007 $ $ $ $
At 1 July (50,710,305) (47,975,464) (58,122,953) (57,255,464)Net (loss)/profi t in current period attributable to members of the parent entity (7,993,987) (2,734,841) (15,107,422) (867,489) ______________________________________________________At 30 June (58,704,292) (50,710,305) (73,230,375) (58,122,953) ______________________________________________________ ______________________________________________________
31. SHARE-BASED PAYMENTS(a) Recognised share-based payment expense
The expense recognised for employee services received during the year is shown in the table below:
Expense arising from equity-settled share-based payments 1,304,048 239,182 1,304,048 239,182 ______________________________________________________ ______________________________________________________
The share-based payment plan is described below. There have been no cancellations or modifi cations to the plan during 2008 and 2007.
For
per
sona
l use
onl
y
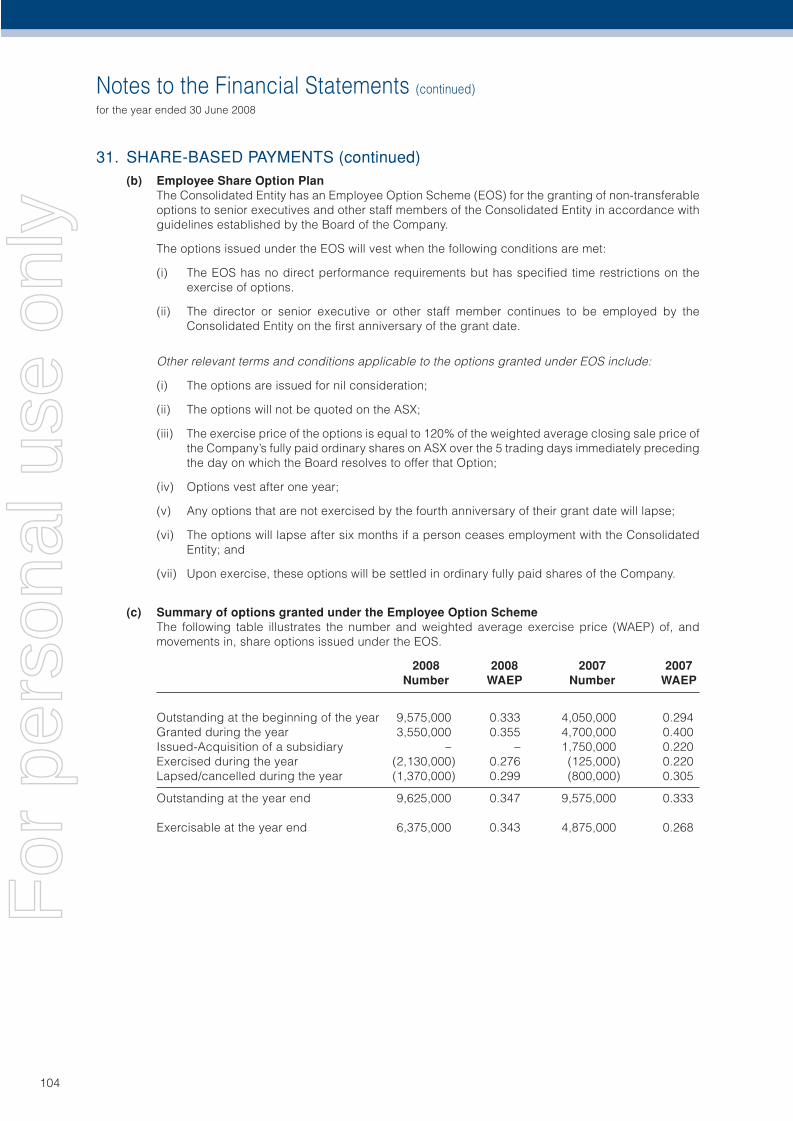
Notes to the Financial Statements (continued)
for the year ended 30 June 2008
104
31. SHARE-BASED PAYMENTS (continued)(b) Employee Share Option Plan
The Consolidated Entity has an Employee Option Scheme (EOS) for the granting of non-transferable options to senior executives and other staff members of the Consolidated Entity in accordance with guidelines established by the Board of the Company.
The options issued under the EOS will vest when the following conditions are met:
(i) The EOS has no direct performance requirements but has specifi ed time restrictions on the exercise of options.
(ii) The director or senior executive or other staff member continues to be employed by the Consolidated Entity on the fi rst anniversary of the grant date.
Other relevant terms and conditions applicable to the options granted under EOS include:
(i) The options are issued for nil consideration;
(ii) The options will not be quoted on the ASX;
(iii) The exercise price of the options is equal to 120% of the weighted average closing sale price of the Company’s fully paid ordinary shares on ASX over the 5 trading days immediately preceding the day on which the Board resolves to offer that Option;
(iv) Options vest after one year;
(v) Any options that are not exercised by the fourth anniversary of their grant date will lapse;
(vi) The options will lapse after six months if a person ceases employment with the Consolidated Entity; and
(vii) Upon exercise, these options will be settled in ordinary fully paid shares of the Company.
(c) Summary of options granted under the Employee Option SchemeThe following table illustrates the number and weighted average exercise price (WAEP) of, and movements in, share options issued under the EOS.
2008 2008 2007 2007 Number WAEP Number WAEP
Outstanding at the beginning of the year 9,575,000 0.333 4,050,000 0.294Granted during the year 3,550,000 0.355 4,700,000 0.400Issued-Acquisition of a subsidiary – – 1,750,000 0.220Exercised during the year (2,130,000) 0.276 (125,000) 0.220Lapsed/cancelled during the year (1,370,000) 0.299 (800,000) 0.305
Outstanding at the year end 9,625,000 0.347 9,575,000 0.333
Exercisable at the year end 6,375,000 0.343 4,875,000 0.268
For
per
sona
l use
onl
y
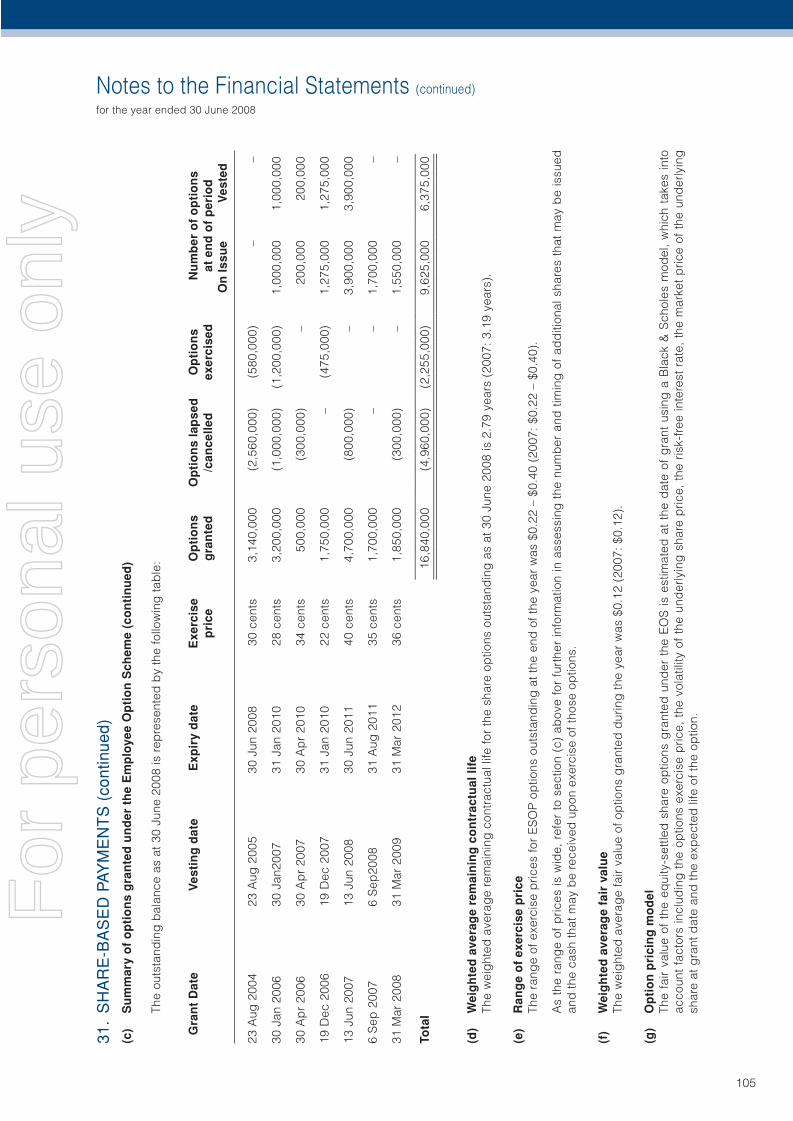
Notes to the Financial Statements (continued)
for the year ended 30 June 2008
105
31.
SH
AR
E-B
AS
ED
PA
YM
EN
TS
(co
ntin
ued)
(c)
Su
mm
ary
of
op
tio
ns
gra
nte
d u
nd
er t
he
Em
plo
yee
Op
tio
n S
chem
e (c
on
tin
ued
)
The
outs
tand
ing
bal
ance
as
at 3
0 Ju
ne 2
008
is r
epre
sent
ed b
y th
e fo
llow
ing
tab
le:
G
ran
t D
ate
Ves
tin
g d
ate
Exp
iry
dat
e E
xerc
ise
Op
tio
ns
Op
tio
ns
lap
sed
O
pti
on
s N
um
ber
of
op
tio
ns
pri
ce
gra
nte
d
/can
celle
d
exer
cise
d
at e
nd
of
per
iod
O
n Is
sue
Ves
ted
23 A
ug 2
004
23 A
ug 2
005
30 J
un 2
008
30 c
ents
3,
140,
000
(2,5
60,0
00)
(580
,000
) –
–
30 J
an 2
006
30 J
an20
07
31 J
an 2
010
28 c
ents
3,
200,
000
(1,0
00,0
00)
(1,2
00,0
00)
1,00
0,00
0 1,
000,
000
30 A
pr
2006
30
Ap
r 20
07
30 A
pr
2010
34
cen
ts
500,
000
(300
,000
) –
200,
000
200,
000
19 D
ec 2
006
19 D
ec 2
007
31 J
an 2
010
22 c
ents
1,
750,
000
– (4
75,0
00)
1,27
5,00
0 1,
275,
000
13 J
un 2
007
13 J
un 2
008
30 J
un 2
011
40 c
ents
4,
700,
000
(800
,000
) –
3,90
0,00
0 3,
900,
000
6 S
ep 2
007
6 S
ep20
08
31 A
ug 2
011
35 c
ents
1,
700,
000
– –
1,70
0,00
0 –
31 M
ar 2
008
31 M
ar 2
009
31 M
ar 2
012
36 c
ents
1,
850,
000
(300
,000
) –
1,55
0,00
0 –
__
____
____
____
____
____
____
____
____
____
____
____
____
____
____
____
____
____
__To
tal
16
,840
,000
(4
,960
,000
) (2
,255
,000
) 9,
625,
000
6,37
5,00
0
____
____
____
____
____
____
____
____
____
____
____
____
____
____
____
____
____
____
__
____
____
____
____
____
____
____
____
____
____
____
____
____
____
____
____
____
__
(d)
Wei
gh
ted
ave
rag
e re
mai
nin
g c
on
trac
tual
life
The
wei
ght
ed a
vera
ge
rem
aini
ng c
ontr
actu
al li
fe fo
r th
e sh
are
optio
ns o
utst
and
ing
as
at 3
0 Ju
ne 2
008
is 2
.79
year
s (2
007:
3.1
9 ye
ars)
.
(e)
Ran
ge
of
exer
cise
pri
ceTh
e ra
nge
of e
xerc
ise
pric
es fo
r E
SO
P o
ptio
ns o
utst
and
ing
at t
he e
nd o
f the
yea
r w
as $
0.22
– $
0.40
(20
07: $
0.22
– $
0.40
).
As
the
rang
e of
pric
es is
wid
e, r
efer
to
sect
ion
(c)
abov
e fo
r fu
rthe
r in
form
atio
n in
ass
essi
ng t
he n
umb
er a
nd t
imin
g o
f ad
diti
onal
sha
res
that
may
be
issu
ed
and
the
cash
that
may
be
rece
ived
up
on e
xerc
ise
of th
ose
optio
ns.
(f)
Wei
gh
ted
ave
rag
e fa
ir v
alu
eTh
e w
eig
hted
ave
rag
e fa
ir va
lue
of o
ptio
ns g
rant
ed d
urin
g th
e ye
ar w
as $
0.12
(20
07: $
0.12
).
(g)
Op
tio
n p
rici
ng
mo
del
The
fair
valu
e of
the
eq
uity
-set
tled
sha
re o
ptio
ns g
rant
ed u
nder
the
EO
S is
est
imat
ed a
t th
e d
ate
of g
rant
usi
ng a
Bla
ck &
Sch
oles
mod
el,
whi
ch t
akes
into
ac
coun
t fa
ctor
s in
clud
ing
the
op
tions
exe
rcis
e p
rice,
the
vol
atili
ty o
f th
e un
der
lyin
g s
hare
pric
e, t
he r
isk-
free
inte
rest
rat
e, t
he m
arke
t p
rice
of t
he u
nder
lyin
g
shar
e at
gra
nt d
ate
and
the
exp
ecte
d li
fe o
f the
op
tion.
For
per
sona
l use
onl
y
Notes to the Financial Statements (continued)
for the year ended 30 June 2008
106
31. SHARE-BASED PAYMENTS (continued)(g) Option pricing model (continued)
The following table gives the assumptions made in determining the fair value of the options granted:
2008 2007Grant date 31 March 30 November 6 September 13 June 19 December
2008 2007 2007 2007 2006
Expected Volatility (%) 77% 76% 77% 70% 70%Risk-free interest rate (%) 6.18% 6.44% 6.22% 6.46% 6.11%Expected life of options (yrs) 2.5 2.25 2.5 2.5 1.6Options exercise price ($) $0.36 $0.46 $0.35 $0.40 $0.22Share price at grant date ($) $0.28 $0.40 $0.27 $0.31 $0.24Fair value at grant date ($) $0.120 $0.174 $0.111 $0.122 $0.097
The effects of early exercise have been incorporated into the calculations by using an expected life for the option that is shorter than the contractual life based on historical exercise behaviour, which is not necessarily indicative of exercise patterns that may occur in the future. The expected volatility was determined using a historical sample of the Company’s share price over a 12 month period. The resulting expected volatility therefore refl ects the assumptions that the historical volatility is indicative of future trends, which may also not necessarily be the actual outcome.
(h) Directors optionsIn addition to the EOS, the Company has issued options to Directors.
Other relevant terms and conditions applicable to the options granted under EOS include:
(i) The options issued to Directors vest immediately;
(ii) The option issue has no direct performance requirements;
(iii) The options are issued for nil consideration;
(iv) The options will not be quoted on the ASX;
(v) The exercise price of the options is equal to 120% of the weighted average closing sale price of the Company’s fully paid ordinary shares on ASX over the 5 trading days immediately preceding the day on which the members resolve to offer that Option;
(vi) Any options that are not exercised by the third anniversary of their grant date will lapse; and
(vii) Upon exercise, these options will be settled in ordinary fully paid shares of the Company.
(i) Summary of options granted to DirectorsThe following table illustrates the number and weighted average (WAEP) of, and movements in, share options issued under the EOS:
2008 Number
Outstanding at the beginning of the year –Granted during the year 4,000,000Exercised during the year –Lapsed/cancelled during the year –Outstanding at the year end 4,000,000
Exercisable at the end of the year 4,000,000
For
per
sona
l use
onl
y
Notes to the Financial Statements (continued)
for the year ended 30 June 2008
107
31. SHARE-BASED PAYMENTS (continued)(i) Summary of options granted to Directors (continued)
The outstanding balance as at 30 June 2008 is represented by the following table:
2008 Number
Grant Date 30 November 2007Vesting Date 30 November 2007Expiry Date 30 November 2010Exercise Price $0.46
Options granted 4,000,000Options lapsed /cancelled –Options exercised –
Number of options at end of period – on issue 4,000,000Number of options at end of period – vested 4,000,000
(j) Weighted average remaining contractual lifeThe weighted average remaining contractual life for the share options outstanding as at 30 June 2008 is 2.42 years (2007: nil).
(k) Range of exercise priceThe exercise price for options outstanding at the end of the year was $0.46 (2007: nil).
(l) Weighted average fair valueThe weighted average fair value of options granted during the year was $0.174 (2007: nil).
32. BUSINESS COMBINATIONAcquisition of Metals Exploration LimitedIn the prior period, Metlas X Limited acquired 100% of the voting shares of Metals Exploration Limited, a listed public company based in Australia with principal activities being the ownership of Nickel mining royalty rights and exploration for Nickel in Australia
The total cost of the combination was $71,714,235 and comprised an issue of equity instruments and costs directly attributable to the combination. The parent entity issued 289,260,975 shares at fair value of 24 cents and 15,000,000 options with a fair value of 9.97 cents and 1,750,000 options with a fair value of 9.69 cents, based on the quoted price of the shares of the parent entoty at the date of acquisition, 19 December 2006.
For
per
sona
l use
onl
y
Notes to the Financial Statements (continued)
for the year ended 30 June 2008
108
32. BUSINESS COMBINATION (continued)The fair value of the identifi able assets and liabilities of Metals Exploration Limited as at the date of the acquisition are:
Consolidated Recognised on Carrying
acquisition value
Cash and cash equivalents 3,598,583 3,598,583Trade and other receivables 5,830,357 5,830,357Current tax receivable 447,384 447,384Other assets 7,204 7,204Other fi nancial assets 15,000 15,000Available-for-sale fi nancial assets 3,625,000 3,625,000Property, plant and equipment 222,891 222,891Intangible assets 35,714,286 610,368Mine, properties and development 15,000 15,000Exploration assets 49,157,431 15,583,284 ______________________________ 98,633,136 29,955,071 ______________________________
Trade and other payables 1,376,344 1,376,344Provisions 81,042 81,042Deferred tax liabilities 25,461,515 – ______________________________ 26,918,901 1,457,386 ______________________________Fair value of identifi able assets 71,714,235 28,497,685 ______________________________ ______________________________
Cost of the combinationShares issued, at fair value 69,422,634Options issued, at fair value 1,665,517Costs associated with the acquisition 626,084 _______________Total cost of the combination 71,714,235 _______________ _______________
Total cash infl ow on acquisition is as follows:Net cash acquired with the subsidiary 3,598,583 _______________Net cash infl ow 3,598,583 _______________ _______________
From the date of acquisition to 30 June 2007, Metals X Limited recognised a profi t of $5,692,875 relating to Metals Exploration and its consolidated entities.
If the combination had taken place at 1 July 2006, the loss before tax for the Consolidated Entity would have been $12,658,077 and revenue would have been $39,096,219.
For
per
sona
l use
onl
y
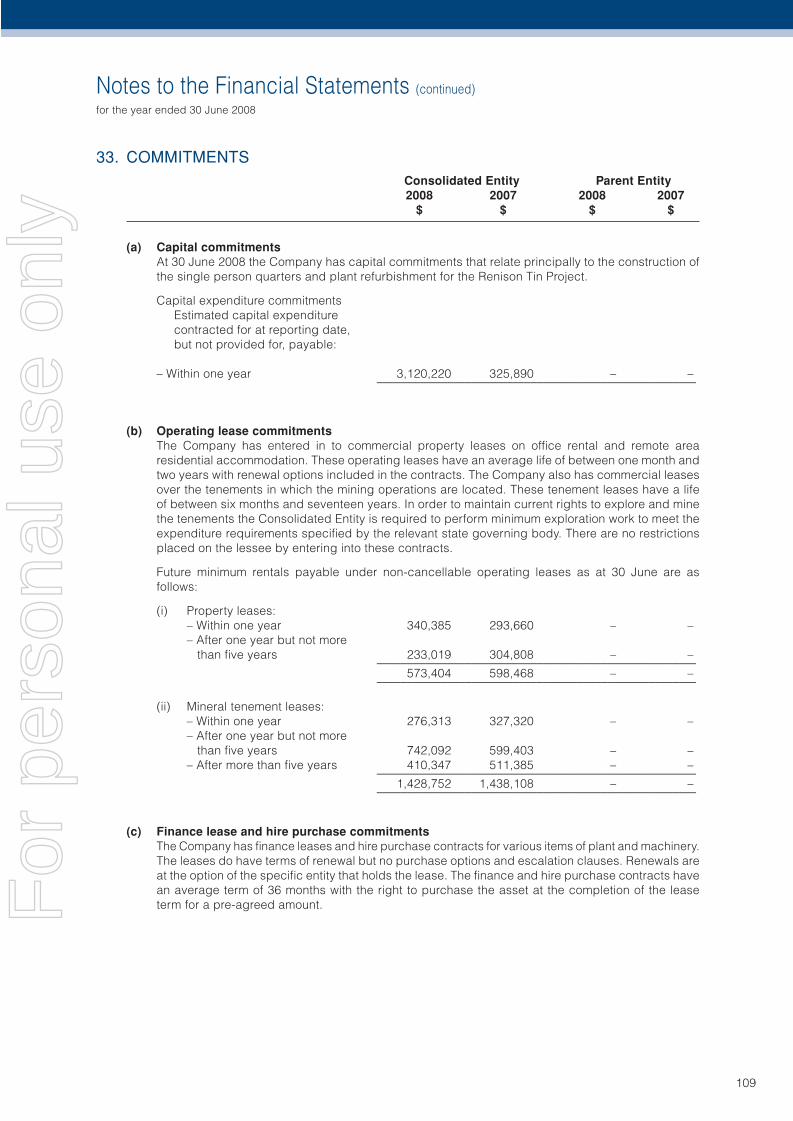
Notes to the Financial Statements (continued)
for the year ended 30 June 2008
109
33. COMMITMENTS Consolidated Entity Parent Entity 2008 2007 2008 2007 $ $ $ $
(a) Capital commitmentsAt 30 June 2008 the Company has capital commitments that relate principally to the construction of the single person quarters and plant refurbishment for the Renison Tin Project.
Capital expenditure commitments Estimated capital expenditure contracted for at reporting date, but not provided for, payable:
– Within one year 3,120,220 325,890 – – ______________________________________________________
(b) Operating lease commitmentsThe Company has entered in to commercial property leases on offi ce rental and remote area residential accommodation. These operating leases have an average life of between one month and two years with renewal options included in the contracts. The Company also has commercial leases over the tenements in which the mining operations are located. These tenement leases have a life of between six months and seventeen years. In order to maintain current rights to explore and mine the tenements the Consolidated Entity is required to perform minimum exploration work to meet the expenditure requirements specifi ed by the relevant state governing body. There are no restrictions placed on the lessee by entering into these contracts.
Future minimum rentals payable under non-cancellable operating leases as at 30 June are as follows:
(i) Property leases: – Within one year 340,385 293,660 – – – After one year but not more than fi ve years 233,019 304,808 – – ______________________________________________________ 573,404 598,468 – – ______________________________________________________
(ii) Mineral tenement leases: – Within one year 276,313 327,320 – – – After one year but not more than fi ve years 742,092 599,403 – – – After more than fi ve years 410,347 511,385 – – ______________________________________________________ 1,428,752 1,438,108 – – ______________________________________________________
(c) Finance lease and hire purchase commitmentsThe Company has fi nance leases and hire purchase contracts for various items of plant and machinery. The leases do have terms of renewal but no purchase options and escalation clauses. Renewals are at the option of the specifi c entity that holds the lease. The fi nance and hire purchase contracts have an average term of 36 months with the right to purchase the asset at the completion of the lease term for a pre-agreed amount.F
or p
erso
nal u
se o
nly
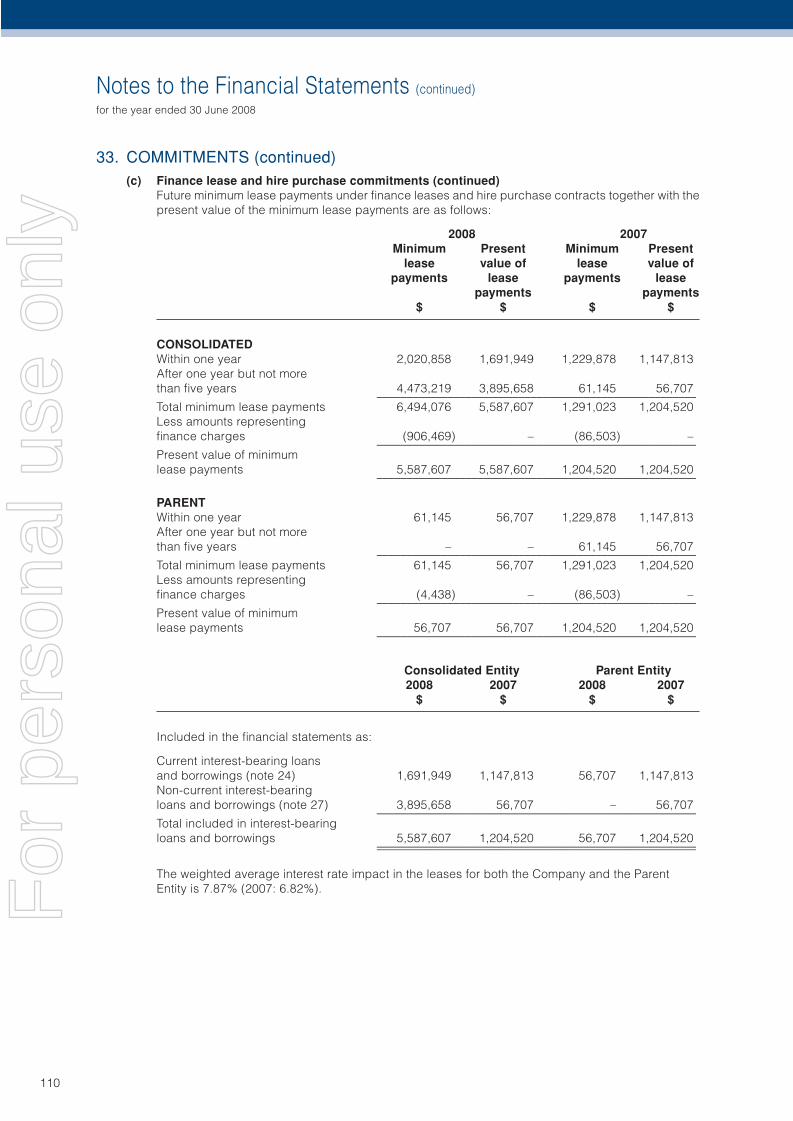
Notes to the Financial Statements (continued)
for the year ended 30 June 2008
110
33. COMMITMENTS (continued)(c) Finance lease and hire purchase commitments (continued)
Future minimum lease payments under fi nance leases and hire purchase contracts together with the present value of the minimum lease payments are as follows:
2008 2007 Minimum Present Minimum Present lease value of lease value of payments lease payments lease payments payments $ $ $ $
CONSOLIDATEDWithin one year 2,020,858 1,691,949 1,229,878 1,147,813After one year but not more than fi ve years 4,473,219 3,895,658 61,145 56,707 ______________________________________________________Total minimum lease payments 6,494,076 5,587,607 1,291,023 1,204,520Less amounts representing fi nance charges (906,469) – (86,503) – ______________________________________________________Present value of minimumlease payments 5,587,607 5,587,607 1,204,520 1,204,520 ______________________________________________________
PARENTWithin one year 61,145 56,707 1,229,878 1,147,813After one year but not more than fi ve years – – 61,145 56,707 ______________________________________________________Total minimum lease payments 61,145 56,707 1,291,023 1,204,520Less amounts representing fi nance charges (4,438) – (86,503) – ______________________________________________________Present value of minimum lease payments 56,707 56,707 1,204,520 1,204,520 ______________________________________________________
Consolidated Entity Parent Entity 2008 2007 2008 2007 $ $ $ $
Included in the fi nancial statements as:
Current interest-bearing loans and borrowings (note 24) 1,691,949 1,147,813 56,707 1,147,813Non-current interest-bearing loans and borrowings (note 27) 3,895,658 56,707 – 56,707 ______________________________________________________Total included in interest-bearing loans and borrowings 5,587,607 1,204,520 56,707 1,204,520 ______________________________________________________ ______________________________________________________
The weighted average interest rate impact in the leases for both the Company and the Parent Entity is 7.87% (2007: 6.82%).F
or p
erso
nal u
se o
nly
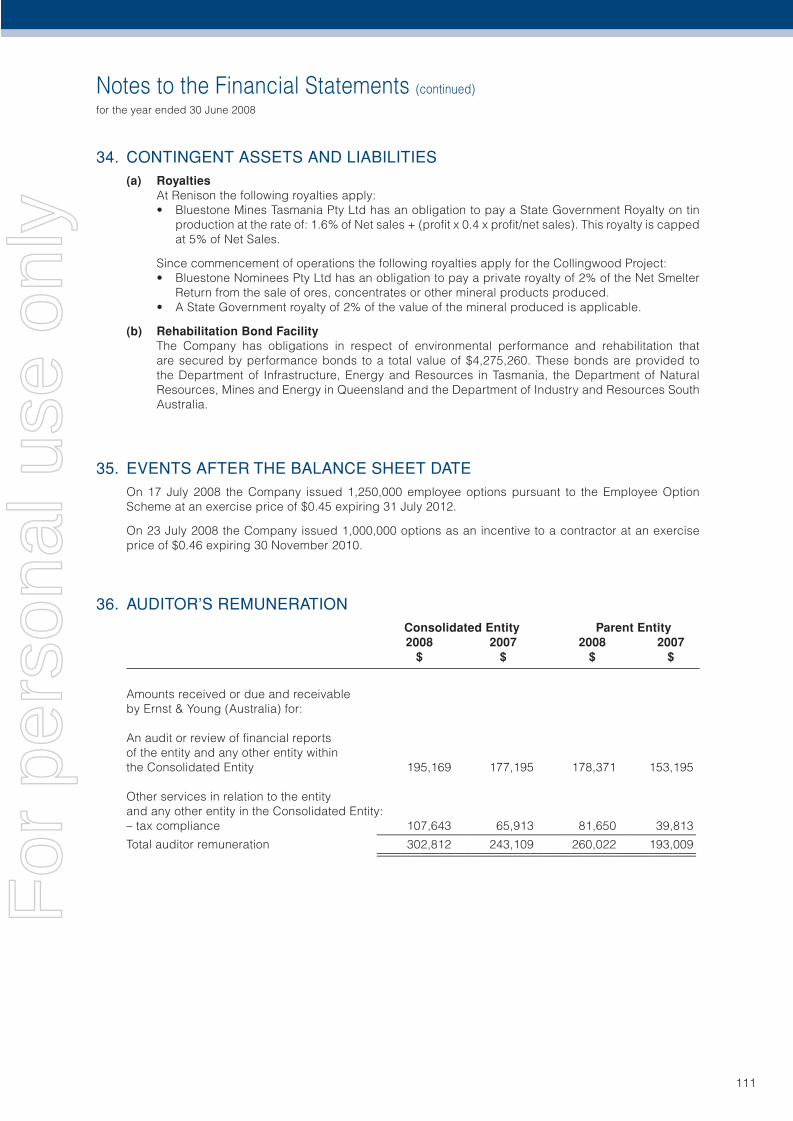
Notes to the Financial Statements (continued)
for the year ended 30 June 2008
111
34. CONTINGENT ASSETS AND LIABILITIES(a) Royalties
At Renison the following royalties apply:• Bluestone Mines Tasmania Pty Ltd has an obligation to pay a State Government Royalty on tin
production at the rate of: 1.6% of Net sales + (profi t x 0.4 x profi t/net sales). This royalty is capped at 5% of Net Sales.
Since commencement of operations the following royalties apply for the Collingwood Project:• Bluestone Nominees Pty Ltd has an obligation to pay a private royalty of 2% of the Net Smelter
Return from the sale of ores, concentrates or other mineral products produced.• A State Government royalty of 2% of the value of the mineral produced is applicable.
(b) Rehabilitation Bond FacilityThe Company has obligations in respect of environmental performance and rehabilitation that are secured by performance bonds to a total value of $4,275,260. These bonds are provided to the Department of Infrastructure, Energy and Resources in Tasmania, the Department of Natural Resources, Mines and Energy in Queensland and the Department of Industry and Resources South Australia.
35. EVENTS AFTER THE BALANCE SHEET DATEOn 17 July 2008 the Company issued 1,250,000 employee options pursuant to the Employee Option Scheme at an exercise price of $0.45 expiring 31 July 2012.
On 23 July 2008 the Company issued 1,000,000 options as an incentive to a contractor at an exercise price of $0.46 expiring 30 November 2010.
36. AUDITOR’S REMUNERATION Consolidated Entity Parent Entity 2008 2007 2008 2007 $ $ $ $
Amounts received or due and receivable by Ernst & Young (Australia) for:
An audit or review of fi nancial reports of the entity and any other entity within the Consolidated Entity 195,169 177,195 178,371 153,195
Other services in relation to the entity and any other entity in the Consolidated Entity:– tax compliance 107,643 65,913 81,650 39,813 ______________________________________________________Total auditor remuneration 302,812 243,109 260,022 193,009 ______________________________________________________ ______________________________________________________
For
per
sona
l use
onl
y
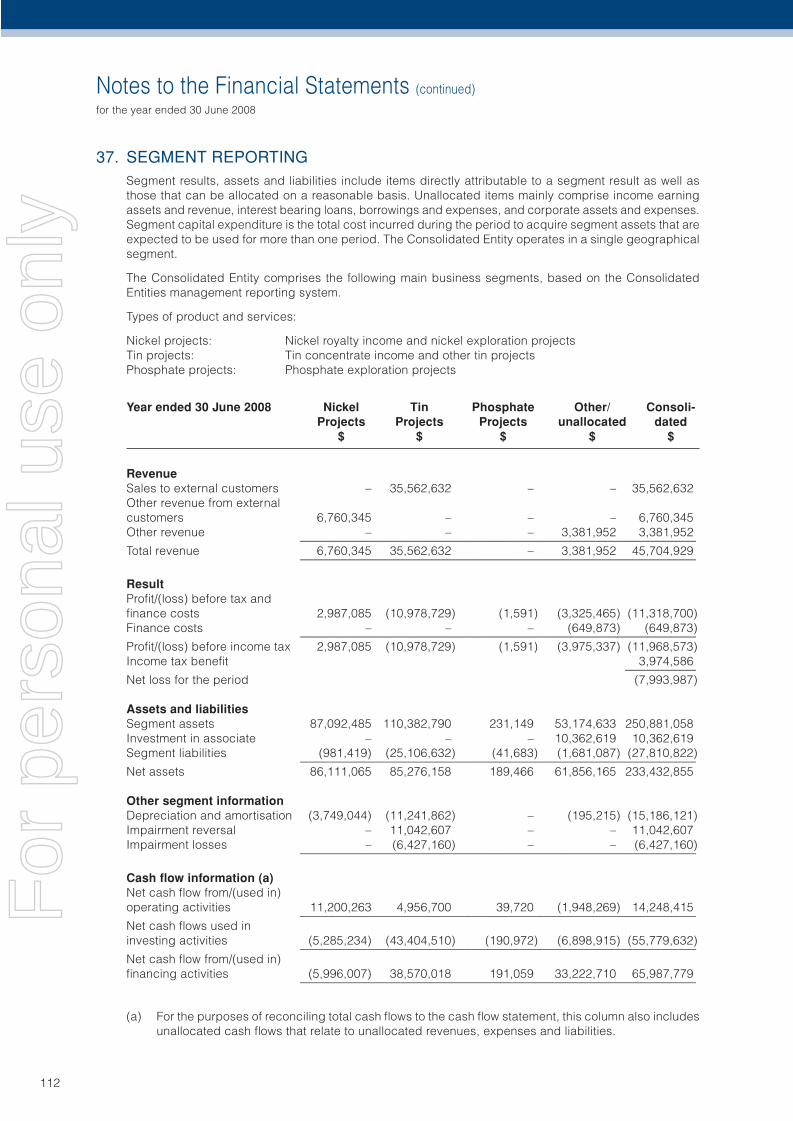
Notes to the Financial Statements (continued)
for the year ended 30 June 2008
112
37. SEGMENT REPORTINGSegment results, assets and liabilities include items directly attributable to a segment result as well as those that can be allocated on a reasonable basis. Unallocated items mainly comprise income earning assets and revenue, interest bearing loans, borrowings and expenses, and corporate assets and expenses. Segment capital expenditure is the total cost incurred during the period to acquire segment assets that are expected to be used for more than one period. The Consolidated Entity operates in a single geographical segment.
The Consolidated Entity comprises the following main business segments, based on the Consolidated Entities management reporting system.
Types of product and services:
Nickel projects: Nickel royalty income and nickel exploration projectsTin projects: Tin concentrate income and other tin projectsPhosphate projects: Phosphate exploration projects
Year ended 30 June 2008 Nickel Tin Phosphate Other/ Consoli- Projects Projects Projects unallocated dated $ $ $ $ $
RevenueSales to external customers – 35,562,632 – – 35,562,632Other revenue from external customers 6,760,345 – – – 6,760,345Other revenue – – – 3,381,952 3,381,952 ___________________________________________________________________Total revenue 6,760,345 35,562,632 – 3,381,952 45,704,929 ___________________________________________________________________
ResultProfi t/(loss) before tax and fi nance costs 2,987,085 (10,978,729) (1,591) (3,325,465) (11,318,700)Finance costs – – – (649,873) (649,873) ___________________________________________________________________Profi t/(loss) before income tax 2,987,085 (10,978,729) (1,591) (3,975,337) (11,968,573)Income tax benefi t 3,974,586 ____________Net loss for the period (7,993,987)
Assets and liabilitiesSegment assets 87,092,485 110,382,790 231,149 53,174,633 250,881,058Investment in associate – – – 10,362,619 10,362,619Segment liabilities (981,419) (25,106,632) (41,683) (1,681,087) (27,810,822) ___________________________________________________________________Net assets 86,111,065 85,276,158 189,466 61,856,165 233,432,855
Other segment informationDepreciation and amortisation (3,749,044) (11,241,862) – (195,215) (15,186,121)Impairment reversal – 11,042,607 – – 11,042,607Impairment losses – (6,427,160) – – (6,427,160) ___________________________________________________________________
Cash fl ow information (a)Net cash fl ow from/(used in) operating activities 11,200,263 4,956,700 39,720 (1,948,269) 14,248,415 ___________________________________________________________________Net cash fl ows used in investing activities (5,285,234) (43,404,510) (190,972) (6,898,915) (55,779,632) ___________________________________________________________________Net cash fl ow from/(used in) fi nancing activities (5,996,007) 38,570,018 191,059 33,222,710 65,987,779 ___________________________________________________________________
(a) For the purposes of reconciling total cash fl ows to the cash fl ow statement, this column also includes unallocated cash fl ows that relate to unallocated revenues, expenses and liabilities.
G
For
per
sona
l use
onl
y
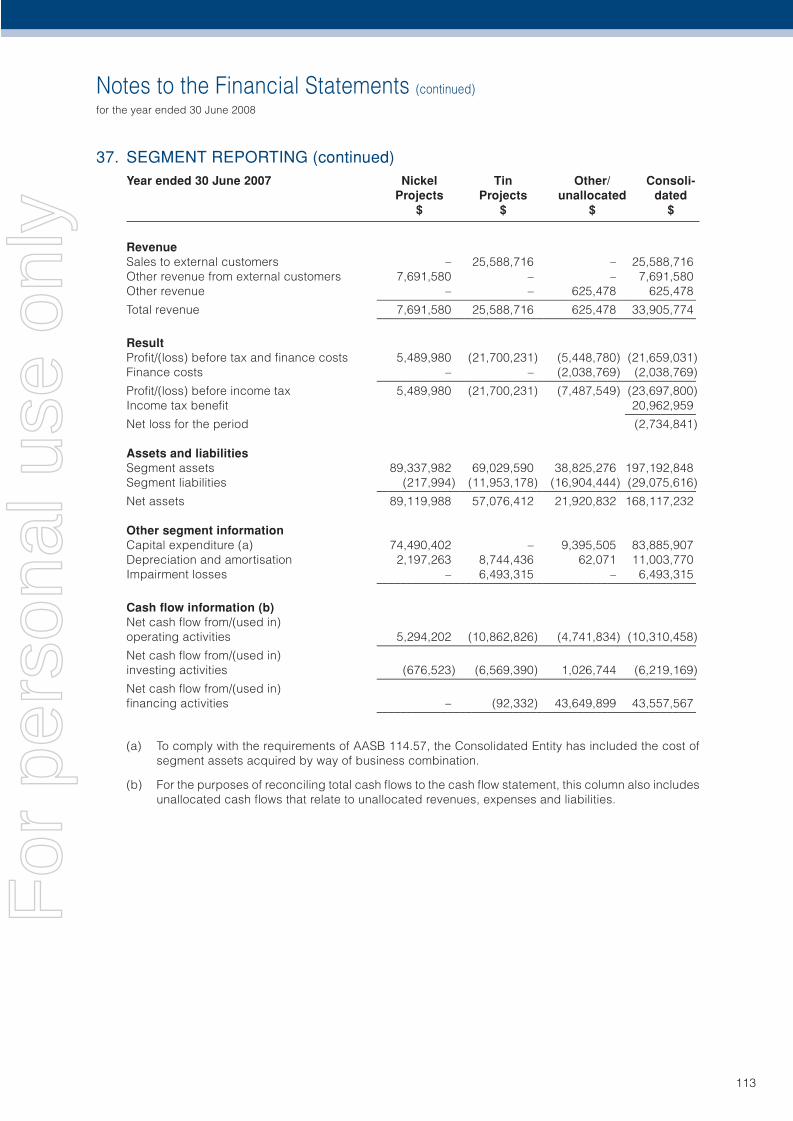
Notes to the Financial Statements (continued)
for the year ended 30 June 2008
113
37. SEGMENT REPORTING (continued)Year ended 30 June 2007 Nickel Tin Other/ Consoli-
Projects Projects unallocated dated $ $ $ $
RevenueSales to external customers – 25,588,716 – 25,588,716Other revenue from external customers 7,691,580 – – 7,691,580Other revenue – – 625,478 625,478 ______________________________________________________Total revenue 7,691,580 25,588,716 625,478 33,905,774 ______________________________________________________
ResultProfi t/(loss) before tax and fi nance costs 5,489,980 (21,700,231) (5,448,780) (21,659,031)Finance costs – – (2,038,769) (2,038,769) ______________________________________________________Profi t/(loss) before income tax 5,489,980 (21,700,231) (7,487,549) (23,697,800)Income tax benefi t 20,962,959 ____________Net loss for the period (2,734,841)
Assets and liabilitiesSegment assets 89,337,982 69,029,590 38,825,276 197,192,848Segment liabilities (217,994) (11,953,178) (16,904,444) (29,075,616) ______________________________________________________Net assets 89,119,988 57,076,412 21,920,832 168,117,232
Other segment informationCapital expenditure (a) 74,490,402 – 9,395,505 83,885,907Depreciation and amortisation 2,197,263 8,744,436 62,071 11,003,770Impairment losses – 6,493,315 – 6,493,315 ______________________________________________________
Cash fl ow information (b)Net cash fl ow from/(used in) operating activities 5,294,202 (10,862,826) (4,741,834) (10,310,458) ______________________________________________________Net cash fl ow from/(used in) investing activities (676,523) (6,569,390) 1,026,744 (6,219,169) ______________________________________________________Net cash fl ow from/(used in) fi nancing activities – (92,332) 43,649,899 43,557,567 ______________________________________________________
(a) To comply with the requirements of AASB 114.57, the Consolidated Entity has included the cost of segment assets acquired by way of business combination.
(b) For the purposes of reconciling total cash fl ows to the cash fl ow statement, this column also includes unallocated cash fl ows that relate to unallocated revenues, expenses and liabilities.
For
per
sona
l use
onl
y
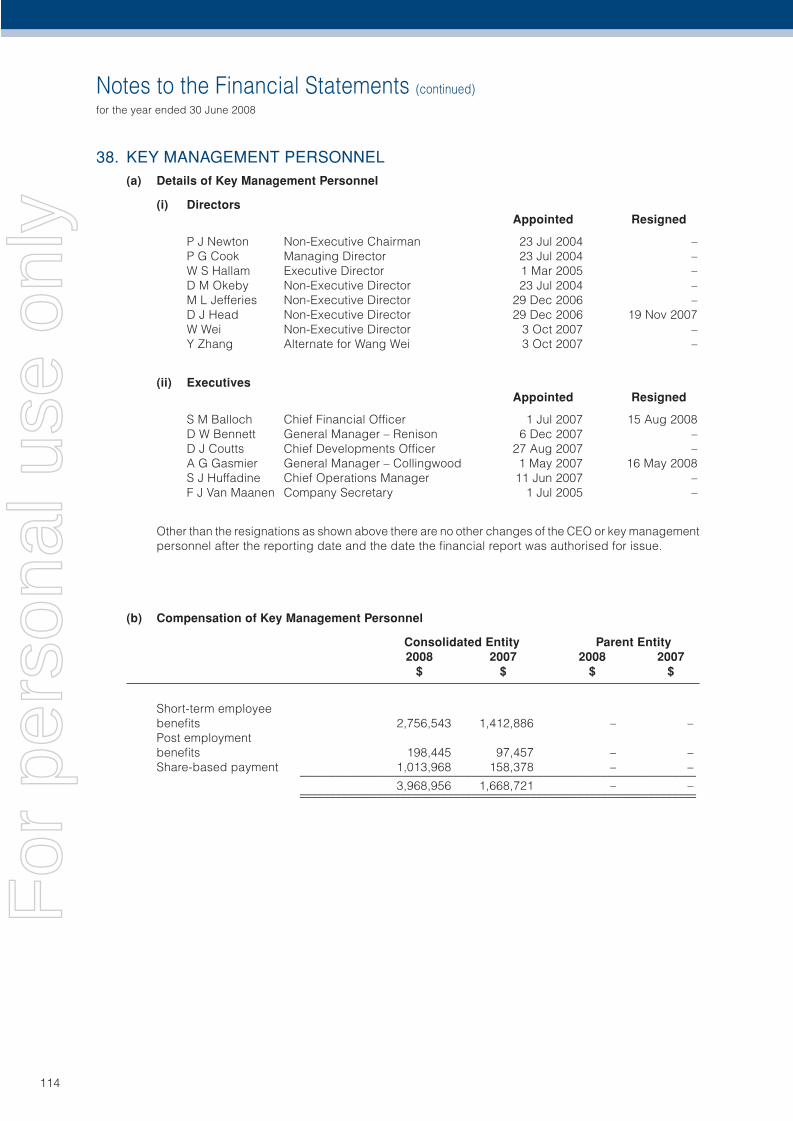
Notes to the Financial Statements (continued)
for the year ended 30 June 2008
114
38. KEY MANAGEMENT PERSONNEL(a) Details of Key Management Personnel
(i) Directors Appointed Resigned
P J Newton Non-Executive Chairman 23 Jul 2004 –P G Cook Managing Director 23 Jul 2004 –W S Hallam Executive Director 1 Mar 2005 –D M Okeby Non-Executive Director 23 Jul 2004 –M L Jefferies Non-Executive Director 29 Dec 2006 –D J Head Non-Executive Director 29 Dec 2006 19 Nov 2007W Wei Non-Executive Director 3 Oct 2007 –Y Zhang Alternate for Wang Wei 3 Oct 2007 –
(ii) Executives Appointed Resigned
S M Balloch Chief Financial Offi cer 1 Jul 2007 15 Aug 2008D W Bennett General Manager – Renison 6 Dec 2007 –D J Coutts Chief Developments Offi cer 27 Aug 2007 –A G Gasmier General Manager – Collingwood 1 May 2007 16 May 2008S J Huffadine Chief Operations Manager 11 Jun 2007 –F J Van Maanen Company Secretary 1 Jul 2005 –
Other than the resignations as shown above there are no other changes of the CEO or key management personnel after the reporting date and the date the fi nancial report was authorised for issue.
(b) Compensation of Key Management Personnel
Consolidated Entity Parent Entity 2008 2007 2008 2007 $ $ $ $
Short-term employee benefi ts 2,756,543 1,412,886 – –Post employment benefi ts 198,445 97,457 – –Share-based payment 1,013,968 158,378 – – ___________________________________________________________________
3,968,956 1,668,721 – – ___________________________________________________________________ ___________________________________________________________________
For
per
sona
l use
onl
y
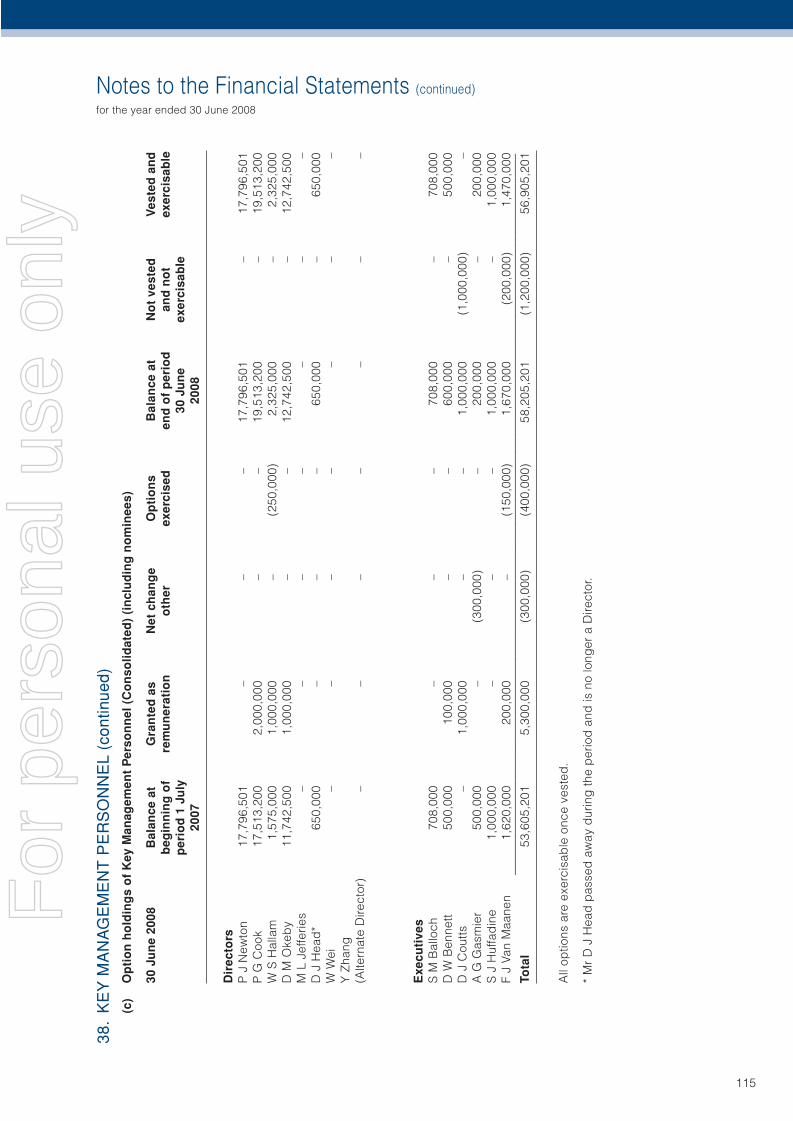
Notes to the Financial Statements (continued)
for the year ended 30 June 2008
115
38.
KE
Y M
AN
AG
EM
EN
T P
ER
SO
NN
EL
(con
tinue
d)(c
) O
pti
on
ho
ldin
gs
of
Key
Man
agem
ent
Per
son
nel
(C
on
solid
ated
) (i
ncl
ud
ing
no
min
ees)
30 J
un
e 20
08
Bal
ance
at
G
ran
ted
as
Net
ch
ang
e O
pti
on
s B
alan
ce a
t N
ot
vest
ed
Ves
ted
an
d
beg
inn
ing
of
re
mu
ner
atio
n
oth
er
exer
cise
d
end
of
per
iod
an
d n
ot
exer
cisa
ble
p
erio
d 1
Ju
ly
30
Ju
ne
exer
cisa
ble
20
07
20
08
Dir
ecto
rsP
J N
ewto
n 17
,796
,501
–
– –
17,7
96,5
01
– 17
,796
,501
P G
Coo
k 17
,513
,200
2,
000,
000
– –
19,5
13,2
00
– 19
,513
,200
W S
Hal
lam
1,
575,
000
1,00
0,00
0 –
(250
,000
) 2,
325,
000
– 2,
325,
000
D M
Oke
by
11,7
42,5
00
1,00
0,00
0 –
– 12
,742
,500
–
12,7
42,5
00M
L J
effe
ries
– –
– –
– –
–D
J H
ead
* 65
0,00
0 –
– –
650,
000
– 65
0,00
0W
Wei
–
– –
– –
– –
Y Z
hang
(A
ltern
ate
Dire
ctor
) –
– –
– –
– –
Exe
cuti
ves
S M
Bal
loch
70
8,00
0 –
– –
708,
000
– 70
8,00
0D
W B
enne
tt 50
0,00
0 10
0,00
0 –
– 60
0,00
0 –
500,
000
D J
Cou
tts
– 1,
000,
000
– –
1,00
0,00
0 (1
,000
,000
) –
A G
Gas
mie
r 50
0,00
0 –
(300
,000
) –
200,
000
– 20
0,00
0S
J H
uffa
din
e 1,
000,
000
– –
– 1,
000,
000
– 1,
000,
000
F J
Van
Maa
nen
1,62
0,00
0 20
0,00
0 –
(150
,000
) 1,
670,
000
(200
,000
) 1,
470,
000
__
____
____
____
____
____
____
____
____
____
____
____
____
____
____
____
____
____
____
____
____
____
____
____
____
____
____
____
____
____
____
Tota
l 53
,605
,201
5,
300,
000
(300
,000
) (4
00,0
00)
58,2
05,2
01
(1,2
00,0
00)
56,9
05,2
01
All
optio
ns a
re e
xerc
isab
le o
nce
vest
ed.
* M
r D
J H
ead
pas
sed
aw
ay d
urin
g th
e p
erio
d a
nd is
no
long
er a
Dir e
ctor
.
For
per
sona
l use
onl
y
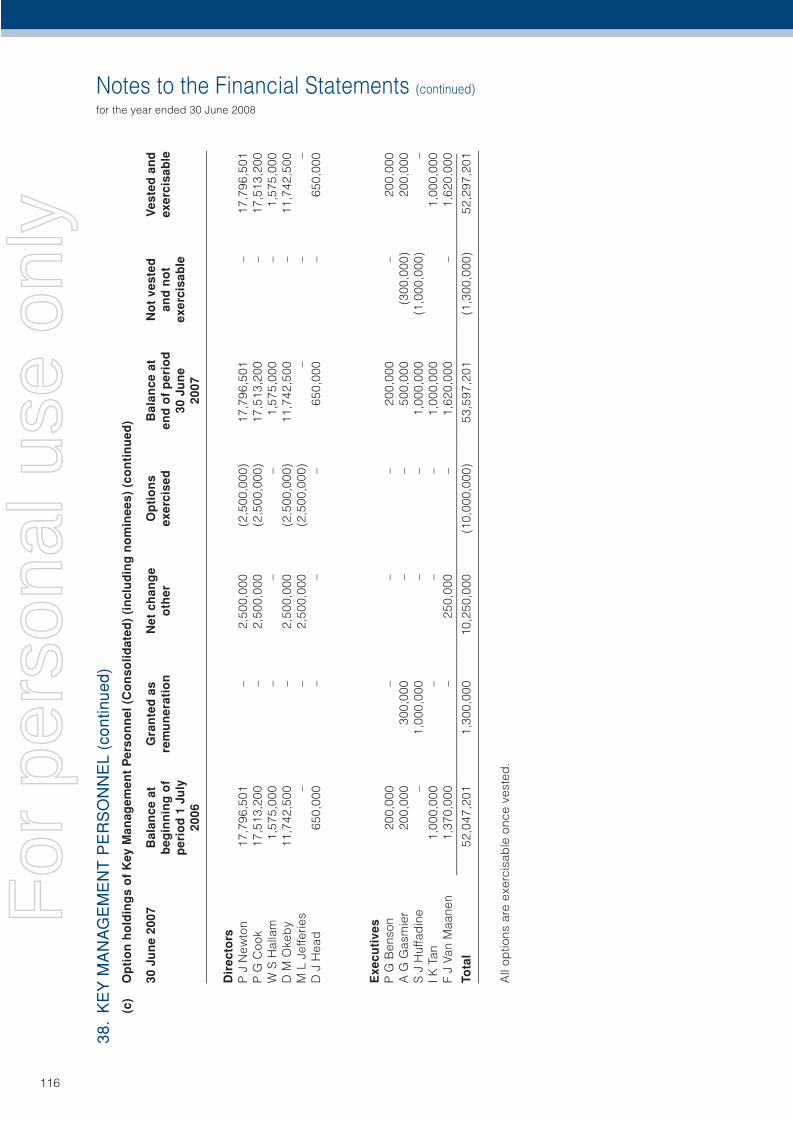
Notes to the Financial Statements (continued)
for the year ended 30 June 2008
116
38.
KE
Y M
AN
AG
EM
EN
T P
ER
SO
NN
EL
(con
tinue
d)(c
) O
pti
on
ho
ldin
gs
of
Key
Man
agem
ent
Per
son
nel
(C
on
solid
ated
) (i
ncl
ud
ing
no
min
ees)
(co
nti
nu
ed)
30 J
un
e 20
07
Bal
ance
at
G
ran
ted
as
Net
ch
ang
e O
pti
on
s B
alan
ce a
t N
ot
vest
ed
Ves
ted
an
d
beg
inn
ing
of
re
mu
ner
atio
n
oth
er
exer
cise
d
end
of
per
iod
an
d n
ot
exer
cisa
ble
p
erio
d 1
Ju
ly
30
Ju
ne
exer
cisa
ble
20
06
20
07
Dir
ecto
rsP
J N
ewto
n 17
,796
,501
–
2,50
0,00
0 (2
,500
,000
) 17
,796
,501
–
17,7
96,5
01P
G C
ook
17,5
13,2
00
– 2,
500,
000
(2,5
00,0
00)
17,5
13,2
00
– 17
,513
,200
W S
Hal
lam
1,
575,
000
– –
– 1,
575,
000
– 1,
575,
000
D M
Oke
by
11,7
42,5
00
– 2,
500,
000
(2,5
00,0
00)
11,7
42,5
00
– 11
,742
,500
M L
Jef
ferie
s –
– 2,
500,
000
(2,5
00,0
00)
– –
–D
J H
ead
65
0,00
0 –
– –
650,
000
– 65
0,00
0
Exe
cuti
ves
P G
Ben
son
200,
000
– –
– 20
0,00
0 –
200,
000
A G
Gas
mie
r 20
0,00
0 30
0,00
0 –
– 50
0,00
0 (3
00,0
00)
200,
000
S J
Huf
fad
ine
– 1,
000,
000
– –
1,00
0,00
0 (1
,000
,000
) –
I K T
an
1,00
0,00
0 –
– –
1,00
0,00
0
1,00
0,00
0F
J Va
n M
aane
n 1,
370,
000
– 25
0,00
0 –
1,62
0,00
0 –
1,62
0,00
0
____
____
____
____
____
____
____
____
____
____
____
____
____
____
____
____
____
____
____
____
____
____
____
____
____
____
____
____
____
____
__To
tal
52,0
47,2
01
1,30
0,00
0 10
,250
,000
(1
0,00
0,00
0)
53,5
97,2
01
(1,3
00,0
00)
52,2
97,2
01
All
optio
ns a
re e
xerc
isab
le o
nce
vest
ed.
For
per
sona
l use
onl
y
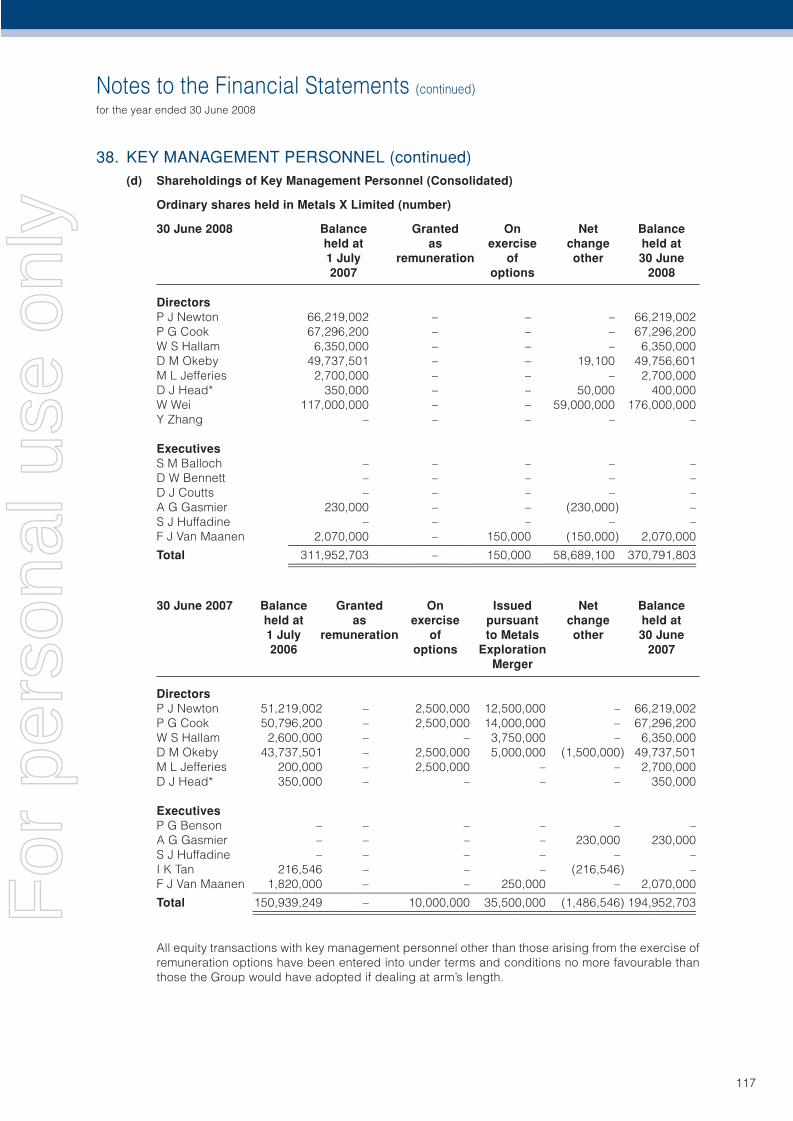
Notes to the Financial Statements (continued)
for the year ended 30 June 2008
117
38. KEY MANAGEMENT PERSONNEL (continued)(d) Shareholdings of Key Management Personnel (Consolidated)
Ordinary shares held in Metals X Limited (number)
30 June 2008 Balance Granted On Net Balance held at as exercise change held at 1 July remuneration of other 30 June 2007 options 2008
DirectorsP J Newton 66,219,002 – – – 66,219,002P G Cook 67,296,200 – – – 67,296,200W S Hallam 6,350,000 – – – 6,350,000D M Okeby 49,737,501 – – 19,100 49,756,601M L Jefferies 2,700,000 – – – 2,700,000D J Head* 350,000 – – 50,000 400,000W Wei 117,000,000 – – 59,000,000 176,000,000Y Zhang – – – – –
ExecutivesS M Balloch – – – – –D W Bennett – – – – –D J Coutts – – – – –A G Gasmier 230,000 – – (230,000) –S J Huffadine – – – – –F J Van Maanen 2,070,000 – 150,000 (150,000) 2,070,000 _____________________________________________________________________Total 311,952,703 – 150,000 58,689,100 370,791,803 _____________________________________________________________________ _____________________________________________________________________
30 June 2007 Balance Granted On Issued Net Balance held at as exercise pursuant change held at 1 July remuneration of to Metals other 30 June 2006 options Exploration 2007 Merger
DirectorsP J Newton 51,219,002 – 2,500,000 12,500,000 – 66,219,002P G Cook 50,796,200 – 2,500,000 14,000,000 – 67,296,200W S Hallam 2,600,000 – – 3,750,000 – 6,350,000D M Okeby 43,737,501 – 2,500,000 5,000,000 (1,500,000) 49,737,501M L Jefferies 200,000 – 2,500,000 – – 2,700,000D J Head* 350,000 – – – – 350,000
ExecutivesP G Benson – – – – – –A G Gasmier – – – – 230,000 230,000S J Huffadine – – – – – –I K Tan 216,546 – – – (216,546) –F J Van Maanen 1,820,000 – – 250,000 – 2,070,000 ___________________________________________________________________________Total 150,939,249 – 10,000,000 35,500,000 (1,486,546) 194,952,703 ___________________________________________________________________________ ___________________________________________________________________________
All equity transactions with key management personnel other than those arising from the exercise of remuneration options have been entered into under terms and conditions no more favourable than those the Group would have adopted if dealing at arm’s length.
For
per
sona
l use
onl
y
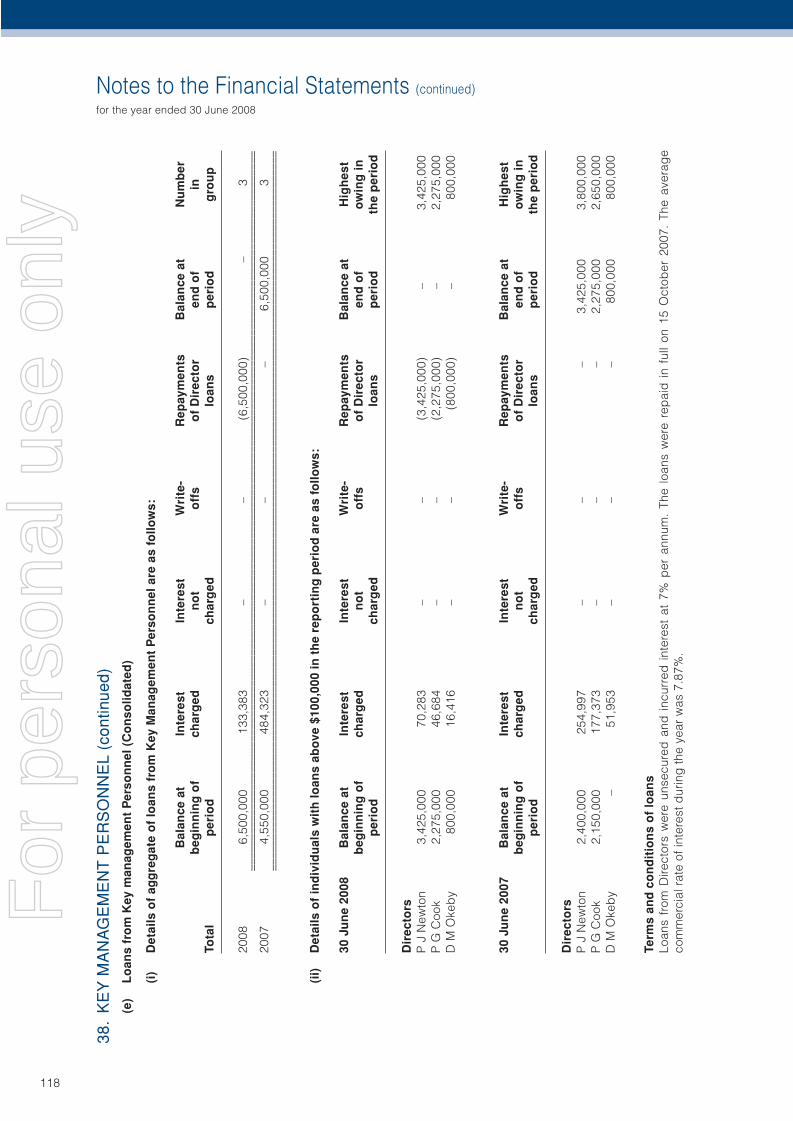
Notes to the Financial Statements (continued)
for the year ended 30 June 2008
118
38.
KE
Y M
AN
AG
EM
EN
T P
ER
SO
NN
EL
(con
tinue
d)(e
) L
oan
s fr
om
Key
man
agem
ent
Per
son
nel
(C
on
solid
ated
)
(i)
Det
ails
of
agg
reg
ate
of
loan
s fr
om
Key
Man
agem
ent
Per
son
nel
are
as
follo
ws:
B
alan
ce a
t
Inte
rest
In
tere
st
Wri
te-
Rep
aym
ents
B
alan
ce a
t N
um
ber
b
egin
nin
g o
f
char
ged
n
ot
off
s o
f D
irec
tor
end
of
inTo
tal
per
iod
char
ged
loan
s p
erio
d
gro
up
2008
6,
500,
000
133,
383
– –
(6,5
00,0
00)
– 3
__
____
____
____
____
____
____
____
____
____
____
____
____
____
____
____
____
____
____
____
____
____
____
____
____
____
____
____
____
___
__
____
____
____
____
____
____
____
____
____
____
____
____
____
____
____
____
____
____
____
____
____
____
____
____
____
____
____
____
___
2007
4,
550,
000
484,
323
– –
– 6,
500,
000
3
____
____
____
____
____
____
____
____
____
____
____
____
____
____
____
____
____
____
____
____
____
____
____
____
____
____
____
____
____
_
____
____
____
____
____
____
____
____
____
____
____
____
____
____
____
____
____
____
____
____
____
____
____
____
____
____
____
____
____
_
(ii)
D
etai
ls o
f in
div
idu
als
wit
h lo
ans
abo
ve $
100,
000
in t
he
rep
or t
ing
per
iod
are
as
follo
ws:
30 J
un
e 20
08
Bal
ance
at
In
tere
st
Inte
rest
W
rite
- R
epay
men
ts
Bal
ance
at
Hig
hes
t
beg
inn
ing
of
ch
arg
ed
no
t o
ffs
of
Dir
ecto
r en
d o
f o
win
g in
p
erio
d
ch
arg
ed
lo
ans
per
iod
th
e p
erio
d
Dir
ecto
rsP
J N
ewto
n 3,
425,
000
70,2
83
– –
(3,4
25,0
00)
– 3,
425,
000
P G
Coo
k 2,
275,
000
46,6
84
– –
(2,2
75,0
00)
– 2,
275,
000
D M
Oke
by
800,
000
16,4
16
– –
(800
,000
) –
800,
000
30 J
un
e 20
07
Bal
ance
at
In
tere
st
Inte
rest
W
rite
- R
epay
men
ts
Bal
ance
at
Hig
hes
t
beg
inn
ing
of
ch
arg
ed
no
t o
ffs
of
Dir
ecto
r en
d o
f o
win
g in
p
erio
d
ch
arg
ed
lo
ans
per
iod
th
e p
erio
d
Dir
ecto
rsP
J N
ewto
n 2,
400,
000
254,
997
– –
– 3,
425,
000
3,80
0,00
0P
G C
ook
2,15
0,00
0 17
7,37
3 –
– –
2,27
5,00
0 2,
650,
000
D M
Oke
by
– 51
,953
–
– –
800,
000
800,
000
Term
s an
d c
on
dit
ion
s o
f lo
ans
Loan
s fr
om D
irect
ors
wer
e un
secu
red
and
inc
urre
d i
nter
est
at 7
% p
er a
nnum
. Th
e lo
ans
wer
e re
pai
d i
n fu
ll on
15
Oct
ober
200
7. T
he a
vera
ge
com
mer
cial
rat
e of
inte
rest
dur
ing
the
year
was
7.8
7%.
For
per
sona
l use
onl
y
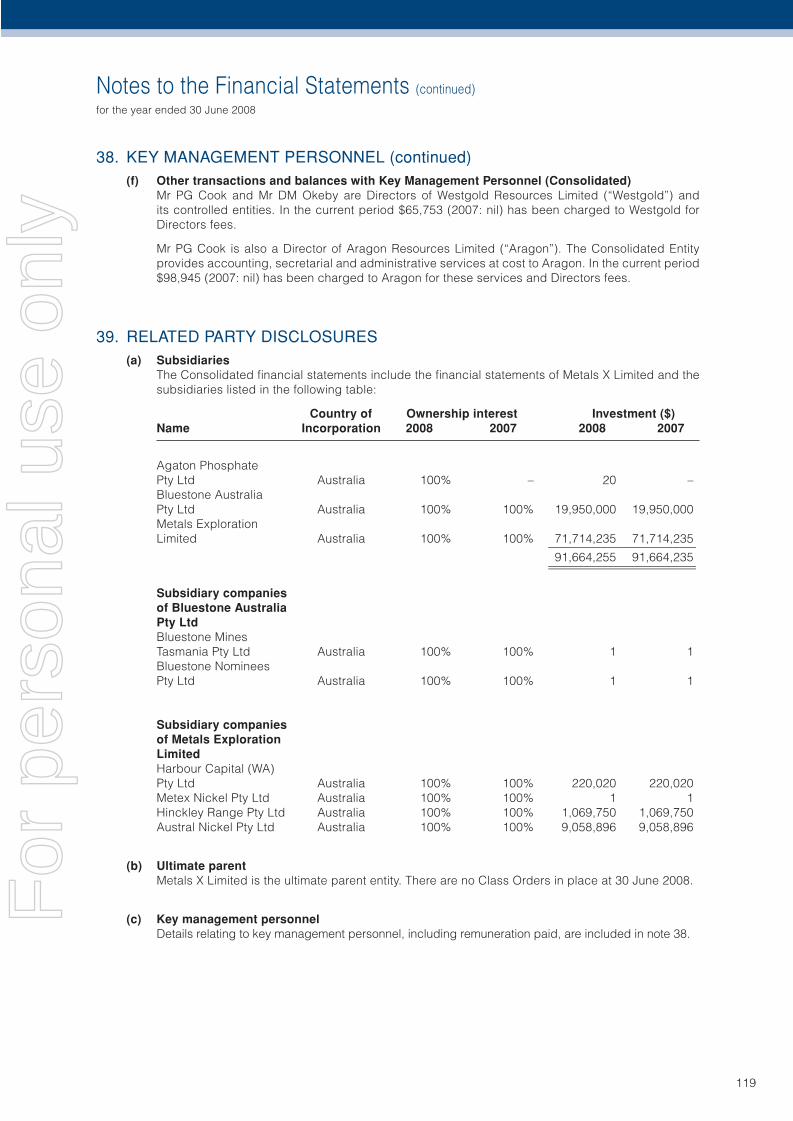
Notes to the Financial Statements (continued)
for the year ended 30 June 2008
119
38. KEY MANAGEMENT PERSONNEL (continued)(f) Other transactions and balances with Key Management Personnel (Consolidated)
Mr PG Cook and Mr DM Okeby are Directors of Westgold Resources Limited (“Westgold”) and its controlled entities. In the current period $65,753 (2007: nil) has been charged to Westgold for Directors fees.
Mr PG Cook is also a Director of Aragon Resources Limited (“Aragon”). The Consolidated Entity provides accounting, secretarial and administrative services at cost to Aragon. In the current period $98,945 (2007: nil) has been charged to Aragon for these services and Directors fees.
39. RELATED PARTY DISCLOSURES(a) Subsidiaries
The Consolidated fi nancial statements include the fi nancial statements of Metals X Limited and the subsidiaries listed in the following table:
Country of Ownership interest Investment ($)Name Incorporation 2008 2007 2008 2007
Agaton Phosphate Pty Ltd Australia 100% – 20 –Bluestone Australia Pty Ltd Australia 100% 100% 19,950,000 19,950,000Metals Exploration Limited Australia 100% 100% 71,714,235 71,714,235 _________________________ 91,664,255 91,664,235 _________________________ _________________________
Subsidiary companies of Bluestone Australia Pty LtdBluestone Mines Tasmania Pty Ltd Australia 100% 100% 1 1Bluestone Nominees Pty Ltd Australia 100% 100% 1 1
Subsidiary companies of Metals Exploration LimitedHarbour Capital (WA) Pty Ltd Australia 100% 100% 220,020 220,020Metex Nickel Pty Ltd Australia 100% 100% 1 1Hinckley Range Pty Ltd Australia 100% 100% 1,069,750 1,069,750Austral Nickel Pty Ltd Australia 100% 100% 9,058,896 9,058,896
(b) Ultimate parentMetals X Limited is the ultimate parent entity. There are no Class Orders in place at 30 June 2008.
(c) Key management personnelDetails relating to key management personnel, including remuneration paid, are included in note 38.
For
per
sona
l use
onl
y
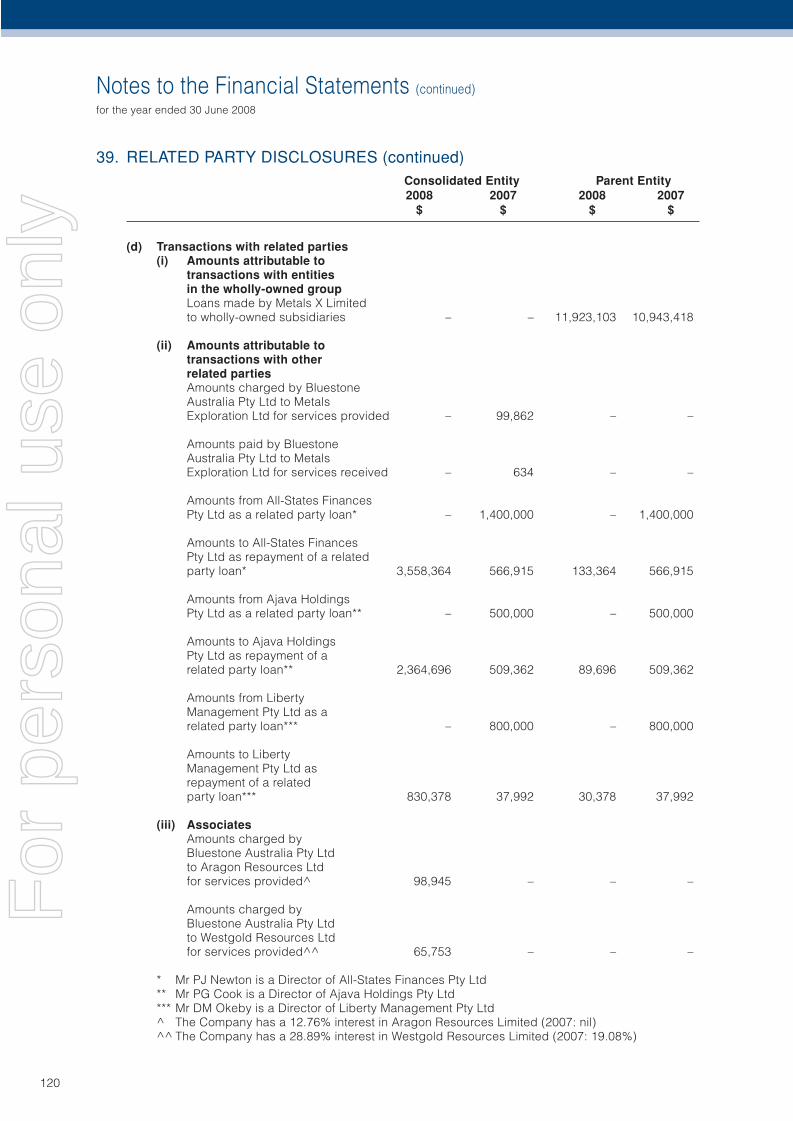
Notes to the Financial Statements (continued)
for the year ended 30 June 2008
120
39. RELATED PARTY DISCLOSURES (continued) Consolidated Entity Parent Entity 2008 2007 2008 2007 $ $ $ $
(d) Transactions with related parties(i) Amounts attributable to
transactions with entities in the wholly-owned groupLoans made by Metals X Limited to wholly-owned subsidiaries – – 11,923,103 10,943,418
(ii) Amounts attributable to transactions with other related partiesAmounts charged by Bluestone Australia Pty Ltd to Metals Exploration Ltd for services provided – 99,862 – –
Amounts paid by Bluestone Australia Pty Ltd to Metals Exploration Ltd for services received – 634 – –
Amounts from All-States Finances Pty Ltd as a related party loan* – 1,400,000 – 1,400,000
Amounts to All-States Finances Pty Ltd as repayment of a related party loan* 3,558,364 566,915 133,364 566,915
Amounts from Ajava Holdings Pty Ltd as a related party loan** – 500,000 – 500,000
Amounts to Ajava Holdings Pty Ltd as repayment of a related party loan** 2,364,696 509,362 89,696 509,362
Amounts from Liberty Management Pty Ltd as a related party loan*** – 800,000 – 800,000
Amounts to Liberty Management Pty Ltd as repayment of a related party loan*** 830,378 37,992 30,378 37,992
(iii) AssociatesAmounts charged by Bluestone Australia Pty Ltd to Aragon Resources Ltd for services provided^ 98,945 – – –
Amounts charged by Bluestone Australia Pty Ltd to Westgold Resources Ltd for services provided^^ 65,753 – – –
* Mr PJ Newton is a Director of All-States Finances Pty Ltd** Mr PG Cook is a Director of Ajava Holdings Pty Ltd*** Mr DM Okeby is a Director of Liberty Management Pty Ltd^ The Company has a 12.76% interest in Aragon Resources Limited (2007: nil)^^ The Company has a 28.89% interest in Westgold Resources Limited (2007: 19.08%)
For
per
sona
l use
onl
y
121
Director’s Declaration
In accordance with a resolution of the Directors of Metals X Limited, I state that:
(1) In the opinion of the Directors:
(a) the fi nancial statements, notes and the additional disclosures included in the Directors’ report designated as audited, of the Company and of the Consolidated Entity are in accordance with the Corporations Act 2001, including:
(i) giving a true and fair view of the Company’s and the Consolidated Entity’s fi nancial position as at 30 June 2008 and of their performance for the year ended on that date; and
(ii) complying with the Accounting Standards and Corporations Regulations 2001; and
(b) there are reasonable grounds to believe that the Company will be able to pay its debts as and when they become due and payable.
(2) This declaration has been made after receiving the declarations required to be made to the Directors in accordance with section 295A of the Corporations Act 2001 for the fi nancial year ended 30 June 2008.
On behalf of the Board.
PG CookManaging Director
Perth, 25 September 2008
For
per
sona
l use
onl
y
Liability limited by a scheme approved under Professional Standards Legislation
GHM:NR:MetalsX:082
Independent audit report to members of Metals X Limited Scope We have audited the accompanying financial report of Metals X Limited which comprises the balance sheet as at 30 June 2008, and the income statement, statement of changes in equity and cash flow statement for the year ended on that date, a summary of significant accounting policies, other explanatory notes and the Directors’ Declaration of the consolidated entity comprising the company and the entities it controlled at the year’s end or from time to time during the financial year.
Directors’ Responsibility for the Financial Report The directors of the company are responsible for the preparation and fair presentation of the financial report in accordance with the Australian Accounting Standards (including the Australian Accounting Interpretations) and the Corporations Act 2001. This responsibility includes establishing and maintaining internal controls relevant to the preparation and fair presentation of the financial report that is free from material misstatement, whether due to fraud or error; selecting and applying appropriate accounting policies; and making accounting estimates that are reasonable in the circumstances. In Note 2(b), the directors also state, that the financial report, comprising the financial statements and notes, complies with International Financial Reporting Standards as issued by the International Accounting Standards Board. Auditor’s Responsibility Our responsibility is to express an opinion on the financial report based on our audit. We conducted our audit in accordance with Australian Auditing Standards. These Auditing Standards require that we comply with relevant ethical requirements relating to audit engagements and plan and perform the audit to obtain reasonable assurance whether the financial report is free from material misstatement. An audit involves performing procedures to obtain audit evidence about the amounts and disclosures in the financial report. The procedures selected depend on our judgment, including the assessment of the risks of material misstatement of the financial report, whether due to fraud or error. In making those risk assessments, we consider internal controls relevant to the entity’s preparation and fair presentation of the financial report in order to design audit procedures that are appropriate in the circumstances, but not for the purpose of expressing an opinion on the effectiveness of the entity’s internal controls. An audit also includes evaluating the appropriateness of accounting policies used and the reasonableness of accounting estimates made by the directors, as well as evaluating the overall presentation of the financial report. We believe that the audit evidence we have obtained is sufficient and appropriate to provide a basis for our audit opinion. Independence In conducting our audit we have met the independence requirements of the Corporations Act 2001. We have given to the directors of the company a written Auditor’s Independence Declaration, a copy of which is included in the Directors’ Report. In addition to our audit of the financial report, we were engaged to undertake the services disclosed in the notes to the financial statements. The provision of these services has not impaired our independence.
122
Independent Audit Report
For
per
sona
l use
onl
y
In our opinion: 1. the financial report of Metals X Limited is in accordance with the Corporations Act 2001, including: i giving a true and fair view of the financial position of Metals X Limited and the consolidated entity at 30 June 2008 and of their performance for the year ended on that date; and ii complying with Australian Accounting Standards (including the Australian Accounting Interpretations); and the Corporations Regulations 2001. 2. the financial report also complies with International Financial Reporting Standards as issued by the International Accounting Standards Board. Report on the Remuneration Report We have audited the Remuneration Report included in pages 14 to 22 of the Directors’ Report for the year ended 30 June 2008. The directors of the company are responsible for the preparation and presentation of the Remuneration Report in accordance with section 300A of the Corporations Act 2001. Our responsibility is to express an opinion on the Remuneration Report, based on our audit conducted in accordance with Australian Auditing Standards. Auditor’s Opinion In our opinion the Remuneration Report of Metals X Limited for the year ended 30 June 2008, complies with section 300A of the Corporations Act 2001. Ernst & Young G H Meyerowitz Partner Perth 25 September 2008
GHM:NR:MetalsX:082
123
Independent Audit Report (continued)
For
per
sona
l use
onl
y
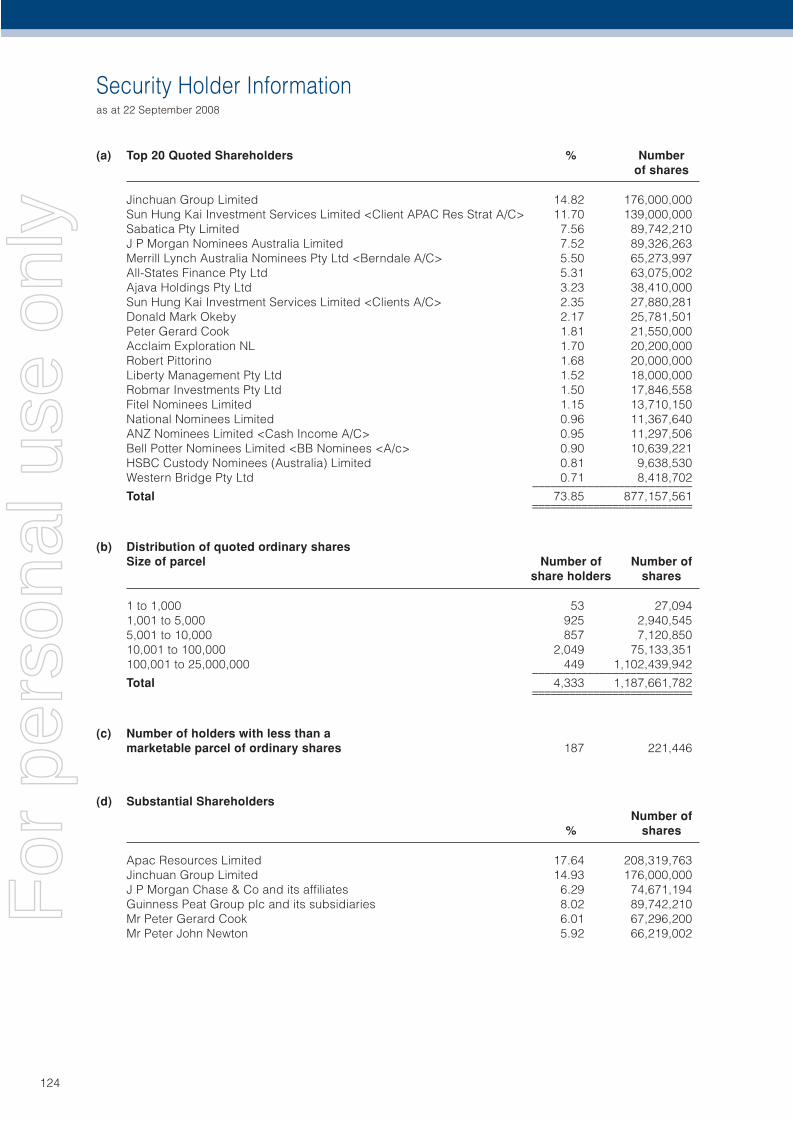
Security Holder Informationas at 22 September 2008
124
(a) Top 20 Quoted Shareholders % Number of shares
Jinchuan Group Limited 14.82 176,000,000Sun Hung Kai Investment Services Limited <Client APAC Res Strat A/C> 11.70 139,000,000Sabatica Pty Limited 7.56 89,742,210J P Morgan Nominees Australia Limited 7.52 89,326,263Merrill Lynch Australia Nominees Pty Ltd <Berndale A/C> 5.50 65,273,997All-States Finance Pty Ltd 5.31 63,075,002Ajava Holdings Pty Ltd 3.23 38,410,000Sun Hung Kai Investment Services Limited <Clients A/C> 2.35 27,880,281Donald Mark Okeby 2.17 25,781,501Peter Gerard Cook 1.81 21,550,000Acclaim Exploration NL 1.70 20,200,000Robert Pittorino 1.68 20,000,000Liberty Management Pty Ltd 1.52 18,000,000Robmar Investments Pty Ltd 1.50 17,846,558Fitel Nominees Limited 1.15 13,710,150National Nominees Limited 0.96 11,367,640ANZ Nominees Limited <Cash Income A/C> 0.95 11,297,506Bell Potter Nominees Limited <BB Nominees <A/c> 0.90 10,639,221HSBC Custody Nominees (Australia) Limited 0.81 9,638,530Western Bridge Pty Ltd 0.71 8,418,702 __________________________Total 73.85 877,157,561 __________________________ __________________________
(b) Distribution of quoted ordinary sharesSize of parcel Number of Number of share holders shares
1 to 1,000 53 27,0941,001 to 5,000 925 2,940,5455,001 to 10,000 857 7,120,85010,001 to 100,000 2,049 75,133,351100,001 to 25,000,000 449 1,102,439,942 __________________________Total 4,333 1,187,661,782 __________________________ __________________________
(c) Number of holders with less than a marketable parcel of ordinary shares 187 221,446
(d) Substantial Shareholders Number of % shares
Apac Resources Limited 17.64 208,319,763Jinchuan Group Limited 14.93 176,000,000J P Morgan Chase & Co and its affi liates 6.29 74,671,194Guinness Peat Group plc and its subsidiaries 8.02 89,742,210Mr Peter Gerard Cook 6.01 67,296,200Mr Peter John Newton 5.92 66,219,002
For
per
sona
l use
onl
y
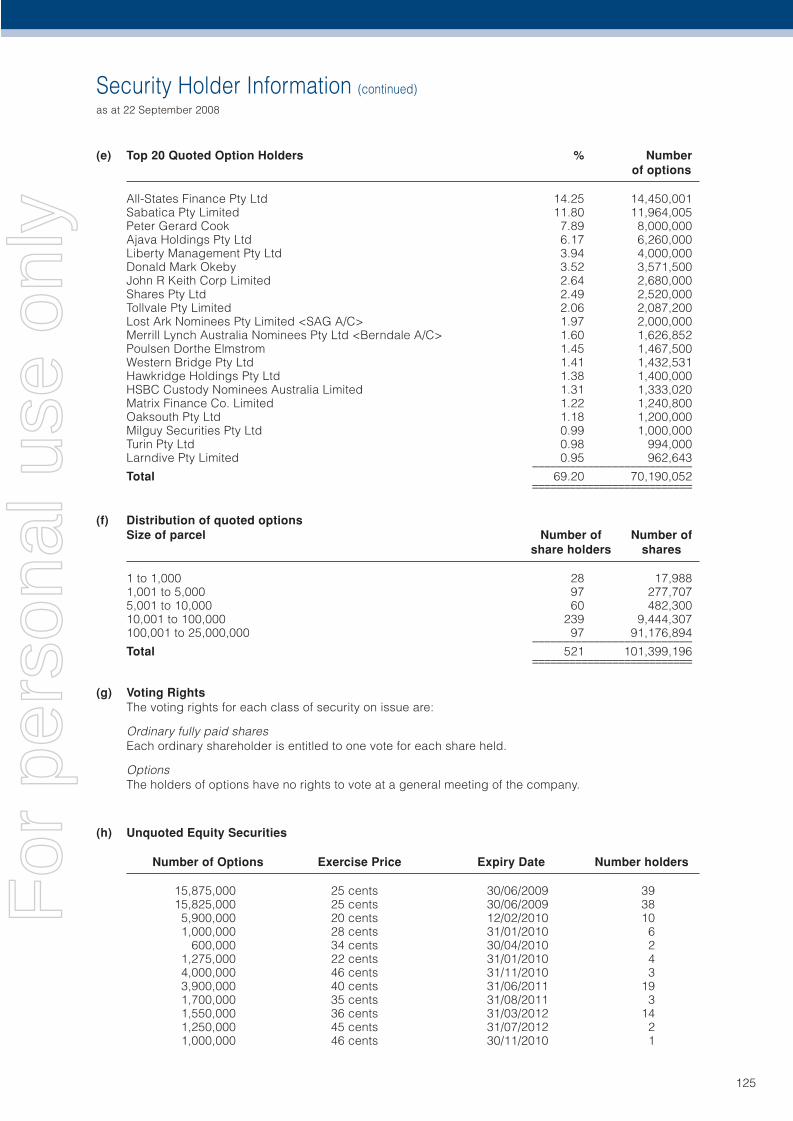
Security Holder Information (continued)
as at 22 September 2008
125
(e) Top 20 Quoted Option Holders % Number of options
All-States Finance Pty Ltd 14.25 14,450,001Sabatica Pty Limited 11.80 11,964,005Peter Gerard Cook 7.89 8,000,000Ajava Holdings Pty Ltd 6.17 6,260,000Liberty Management Pty Ltd 3.94 4,000,000Donald Mark Okeby 3.52 3,571,500John R Keith Corp Limited 2.64 2,680,000Shares Pty Ltd 2.49 2,520,000Tollvale Pty Limited 2.06 2,087,200Lost Ark Nominees Pty Limited <SAG A/C> 1.97 2,000,000Merrill Lynch Australia Nominees Pty Ltd <Berndale A/C> 1.60 1,626,852Poulsen Dorthe Elmstrom 1.45 1,467,500Western Bridge Pty Ltd 1.41 1,432,531Hawkridge Holdings Pty Ltd 1.38 1,400,000HSBC Custody Nominees Australia Limited 1.31 1,333,020Matrix Finance Co. Limited 1.22 1,240,800Oaksouth Pty Ltd 1.18 1,200,000Milguy Securities Pty Ltd 0.99 1,000,000Turin Pty Ltd 0.98 994,000Larndive Pty Limited 0.95 962,643 __________________________Total 69.20 70,190,052 __________________________ __________________________
(f) Distribution of quoted optionsSize of parcel Number of Number of share holders shares
1 to 1,000 28 17,9881,001 to 5,000 97 277,7075,001 to 10,000 60 482,30010,001 to 100,000 239 9,444,307100,001 to 25,000,000 97 91,176,894 __________________________Total 521 101,399,196 __________________________ __________________________
(g) Voting RightsThe voting rights for each class of security on issue are:
Ordinary fully paid sharesEach ordinary shareholder is entitled to one vote for each share held.
OptionsThe holders of options have no rights to vote at a general meeting of the company.
(h) Unquoted Equity Securities
Number of Options Exercise Price Expiry Date Number holders
15,875,000 25 cents 30/06/2009 39 15,825,000 25 cents 30/06/2009 38 5,900,000 20 cents 12/02/2010 10 1,000,000 28 cents 31/01/2010 6 600,000 34 cents 30/04/2010 2 1,275,000 22 cents 31/01/2010 4 4,000,000 46 cents 31/11/2010 3 3,900,000 40 cents 31/06/2011 19 1,700,000 35 cents 31/08/2011 3 1,550,000 36 cents 31/03/2012 14 1,250,000 45 cents 31/07/2012 2 1,000,000 46 cents 30/11/2010 1
For
per
sona
l use
onl
y
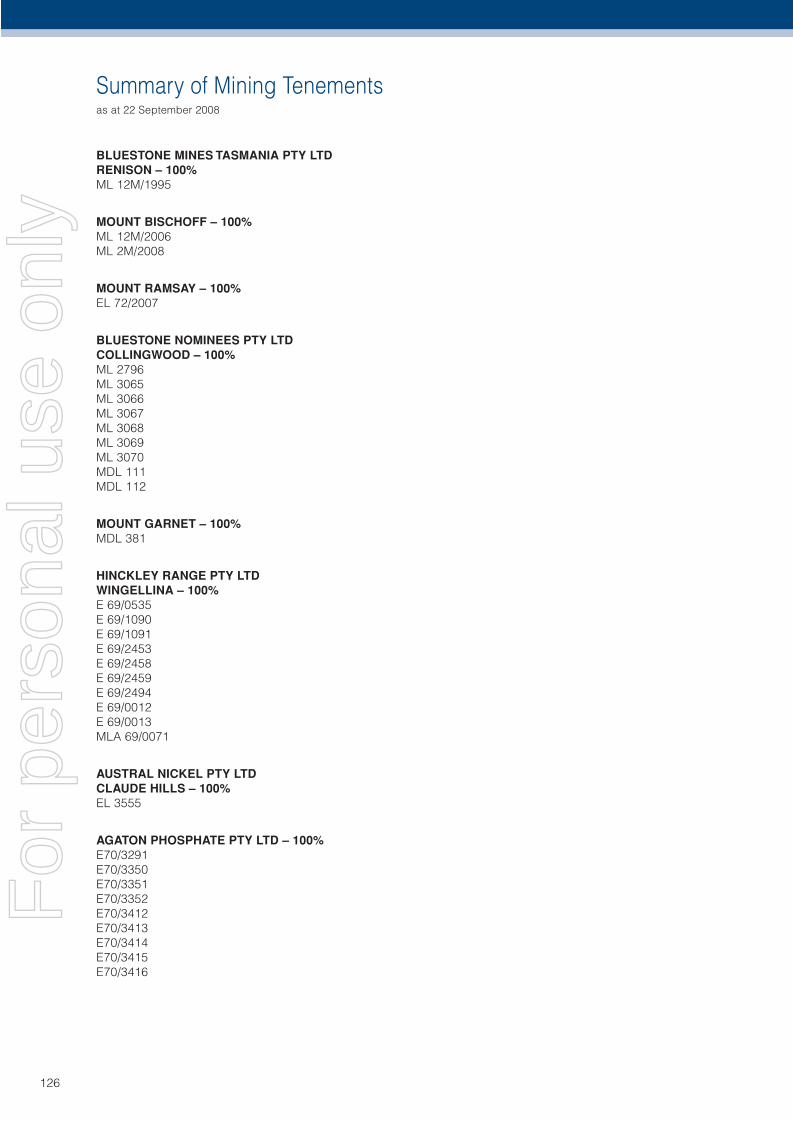
Summary of Mining Tenementsas at 22 September 2008
126
BLUESTONE MINES TASMANIA PTY LTDRENISON – 100%ML 12M/1995
MOUNT BISCHOFF – 100%ML 12M/2006ML 2M/2008
MOUNT RAMSAY – 100%EL 72/2007
BLUESTONE NOMINEES PTY LTDCOLLINGWOOD – 100%ML 2796ML 3065ML 3066ML 3067ML 3068ML 3069ML 3070MDL 111MDL 112
MOUNT GARNET – 100%MDL 381
HINCKLEY RANGE PTY LTDWINGELLINA – 100%E 69/0535E 69/1090E 69/1091E 69/2453E 69/2458E 69/2459E 69/2494E 69/0012E 69/0013MLA 69/0071
AUSTRAL NICKEL PTY LTDCLAUDE HILLS – 100%EL 3555
AGATON PHOSPHATE PTY LTD – 100%E70/3291E70/3350E70/3351E70/3352E70/3412E70/3413E70/3414E70/3415E70/3416
For
per
sona
l use
onl
y

127
This page has been left blank intentionally
For
per
sona
l use
onl
y

128
This page has been left blank intentionally
H
For
per
sona
l use
onl
y
Annual Report2008
Level 3 Hyatt Centre123 Adelaide TerraceEast Perth WA 6004
GPO Box 2606Perth WA 6001
Telephone: +61 8 9220 5700Facsimile: +61 8 9220 5757Email: [email protected]: www.metalsx.com.au
For
per
sona
l use
onl
y


![intro [Modo de Compatibilidade] - w3.ualg.ptw3.ualg.pt/~rsilva/Aqua_07-08/class slides/Aqua1_pb.pdf · “Aquacultura é o cultivo de organismos ... –– 59.4 milhões tons 59.4](https://img.pdfslide.net/doc/110x75/5c4df00e93f3c3245e29a923/intro-modo-de-compatibilidade-w3ualgptw3ualgptrsilvaaqua07-08class.jpg)