Embed Size (px)
Citation preview

A
Financial Statements
Webster Ltd
15-month period ended 30 September 2017
For
per
sona
l use
onl
y

Pages 1 to 17 are left intentionally blank.
For
per
sona
l use
onl
y

18
The directors of Webster Limited (ACN 009 476 000) submit herewith the annual financial report of the Company for the 15-month period ended 30 September 2017. In order to comply with the provisions of the Corporations Act 2001, the Directors’ Report follows:
1. Directors
The directors of the Company at any time during or since the end of the 15-month period are:
Chris Corrigan – BEc (Executive Chairman)
Mr. Corrigan was appointed non-executive director in November 2007 until July 2010 and again from 15 October 2012. Mr Corrigan was appointed Executive Chairman on 29 February 2016.
Mr Corrigan was Managing Director of Patrick Corporation Limited, Australia’s largest stevedore company with interests in rail transportation and aviation from March 1990 to May 2006. Prior to that, he had a career with Bankers Trust spanning 20 years, including periods as Managing Director of Bankers Trust in Australia and for the Asia-Pacific region.
In September 2011, Mr Corrigan was appointed Chairman of Qube Logistics Holdings Limited.
Directorships of other listed companies held during the last three years:
Qube Logistics Holdings Limited – from March 2011 to June 2017
Hawthorn Resources Limited – from October 2017
Rod Roberts – BEc, MBA, FAICD (Non-executive Director)
Mr Roberts was appointed Managing Director in October 1996 until 2001 and Chairman from October 2001 to August 2007 and again from November 2008 to June 2015. Mr Roberts retired from the Board on 31 March 2017.
Mr Roberts has previously held roles including Head of Corporate Finance at Bain & Co, Director of County NatWest Australia Limited, Chairman of Harris & Company Limited, Director of Tassal Group Limited and Deputy Chancellor of University of Tasmania. He is a director of the Australian Institute of Company Directors and President of the Tasmanian branch.
David Cushing – BCom, ACA (Non-executive Director)
Mr Cushing was appointed non-executive director on 31 October 2012.
Mr Cushing is Executive Chairman of Rural Equities Limited, one of New Zealand’s largest rural property companies, and is also a director of the private investment company H & G Limited. Mr Cushing was formerly an investment banker with National Australia Bank Limited subsidiary, Bank of New Zealand. Mr Cushing has considerable experience in the agricultural sector having previously been a director of horticultural company Fruitfed Supplies Limited, rural services company Williams & Kettle Limited and New Zealand Farming Systems Uruguay Limited. He has also acted as an alternate director of rural services and seed company PGG Wrightson Limited for the Chinese company Agria Corporation.
Chris Langdon – BCom (Econ) (Non-executive Director)
Mr Langdon was appointed non-executive director on 14 March 2013.
Mr Langdon is a major shareholder and Chief Executive of Langdon Group Pty Ltd. The Langdon Group is 160 years old and is a leading company in its sector, primarily involved in food ingredient distribution, and herb & spice processing. Mr Langdon’s early career was in investment banking with roles in Australia, London and New York. Since the early 1990s, apart from his corporate role at Langdon Group, Mr Langdon has been involved in various external corporate directorships.
He has also held directorships at the listed Text Media Limited and Fresh Food Industries Holdings Limited, as well as Nutshack Group Pty Ltd.
Directorships of other listed companies held during the last three years:
Panoramic Resources Limited – from August 2004 to June 2016
John Joseph Robinson – BFA (Non-executive Director)
Mr J Robinson was appointed non-executive director on 23 June 2016.
Mr Robinson is the Managing Director of Australian Food and Fibre Limited and has over 20 years’ experience in irrigated and dry land farming, prior to which he traded futures with Bankers Trust. He is currently the Chairman of the Gwydir Valley Irrigators Association, Chairman of the Gwydir Customer Advising Groups, the Presiding Member of the Cotton Research and Development Corporation Selection Committee and a member of The Primary Industries Ministerial Advisory Council.
Joseph Corrigan – BA MCA (Alternate for Chris Corrigan)
Mr Corrigan was appointed alternate for Mr Chris Corrigan on 14 October 2013.
Mr Corrigan holds a bachelor and masters in creative arts and has interests and experience in the agricultural industry particularly wheat, canola and beef. Mr Corrigan is also managing director of an entertainment production company.
The above-named directors held office during the whole of the 15-month period financial year and since the end of the 15-month period year except for:
� Mr R Roberts – retired 31 March 2017
Director’s shareholdings are disclosed on page 28 of the Directors Report. There has been no change in Director’s shareholdings between the end of the 15-month period and the date of this Director’s Report.
2. Company Secretary
Mr Maurice Felizzi – BA Acc, CPA AGIM joined Webster Limited on 18 April 2016 and was appointed Company Secretary from 28 April 2016. He is a member of CPA Australia, Institute of Chartered Secretaries and holds a Bachelor of Arts from the University of Canberra.
For the 15-month period ended 30 September 2017
Directors’ Report
For
per
sona
l use
onl
y

19
3. Principal Activities
The principal activity of the consolidated entity during the year was the production, processing and marketing of walnuts, cotton, crops and livestock.
4. Review of Operations
The consolidated entity’s financial performance resulted in a net profit before tax for the 15-month period of $49.1 million (2016 Loss $81.6 million).
5. Directors’ Meetings
The following table sets out the number of directors’ meetings (including meetings of committees of directors) held during the 15-month period and the number of meetings attended by each director (while they were a director or committee member). During the 15-month period ended 30 September 2017, 8 Board Meetings and 3 Audit and Risk Committee Meetings were held.
Board of Directors Audit and Risk Committee
Directors Held Attended Held Attended
CD Corrigan 8 8 3 1
CD Langdon 8 8 3 3
RJ Roberts (i) 8 5 3 2
BD Cushing 8 8 3 3
JJ Robinson 8 8 3 3
(i) RJ Roberts retired on 31 March 2017
6. Corporate Governance
In fulfilling its obligations and responsibilities to its various stakeholders, the Board of Webster Limited recognises the need to implement and maintain a robust system of governance. The Board has established a program that aims to meet best practice in standards of accountability, disclosure, responsibility and transparency.
The Australian Stock Exchange (“ASX”) Corporate Governance Council has released guidelines under which companies are now obliged to report on whether they comply with their published “Corporate Governance Principles and Recommendations”, as outlined in those guidelines.
The Company complies with most of the principles outlined in the ASX guidelines and the Board remains committed to reviewing all practices to ensure that an appropriate and functional solution is in place for a company of Webster Limited’s size and type of operation.
Set out below is a summary of the Company’s current practices in each of the areas identified in the ASX guidelines.
6.1 Lay solid foundations for management and oversight
The Webster Limited Board of Directors is responsible for the overall corporate governance of the consolidated group including its strategic direction, establishing goals for management and monitoring the achievement of these goals.
The relationship between the Board and management is a partnership that is crucial to the Company’s long-term success. The separation of responsibilities between the Board and management is clearly understood and respected.F
or p
erso
nal u
se o
nly
20
6.2 Structure the Board to add value
The Company has recognised the importance of having a balanced Board comprised of directors with an appropriate range of backgrounds, skills and experience. As at the date of this report the Board comprises one executive director and three non-executive directors.
It is the intention of the Board to maintain a majority of non-executive directors on the Board. The Board is of the view that directors possess an appropriate mix of skills, experience, expertise and diversity to enable the Board to discharge its responsibilities.
The Board considers the independence of directors to be assessed on their capacity to act in accordance with their duties and put the interests of the Company and its shareholders first, so that they are objectively capable of exercising independent judgement. The Board considers that each of the current directors has this capacity. The Board notes the definition of “independence” contained in the ASX guidelines and recognises that Mr C Langdon meets the guidelines’ definition of “independent”.
The directors as a group are responsible for reviewing membership of the Board and for selecting new directors. The constitution requires that any new non-executive director appointed by the Board must seek election at the next Annual General Meeting.
The Board of Webster Limited is supported by the Audit and Risk Committee. This committee, has its own charter and operating procedures and assists the Board in the discharge of its obligations by the review of financial reports, audit, risk and compliance. In addition, directors meet outside normal Board and Committee Meetings from time to time, in accordance with good corporate governance practice.
Audit and Risk Committee
The Audit and Risk Committee monitors internal control policies and procedures designed to safeguard company assets and to ensure the integrity of financial reporting. It advises on the establishment and maintenance of a framework of internal controls and appropriate ethical standards for the management of the consolidated group.
The Committee is also responsible for identifying areas of significant business risk and ensuring arrangements are in place to manage them. It reviews the annual and half-year financial statements before the Board considers them. It is also responsible for ensuring compliance with the Corporations Act 2001, ASX Listing Rules and any other matters with external governing or statutory bodies.
Among its specific responsibilities, the Committee reviews and advises the Board on the nomination and remuneration of external auditors and the adequacy of existing external and internal audit arrangements including the scope and quality of audits. The Audit and Risk Committee Charter is available on the Company’s website and contains information on procedures for the selection and appointment of the external auditor, and for the rotation of external audit engagement partners.
The Committee met three times during the 15-month period ended 30 September 2017. Current members of the Audit & Risk Committee are Messrs C D Langdon (Chairman) and B D Cushing.
Details of the names and qualifications of those appointed to the Audit and Risk Committee are contained on page 19 of the Directors’ Report. The number of meetings of the Audit and Risk Committee and names of the attendees is contained on page 19.
The Executive Chairman, other independent Directors, Chief Financial Officer and the external audit partner in charge of the Webster Limited audit attend meetings of this Committee by invitation.
The Committee also meets from time to time with the external auditors, independent of management.
6.3 Promote ethical and responsible decision making
As part of the Board’s continuing commitment to promote ethical and responsible decision making, the Company has a Code of Conduct which establishes a range of procedures and guidelines to ensure that the highest ethical standards, corporate behaviour, and accountability are maintained.
The Code of Conduct was established in 1994 to guide executives, management and employees in carrying out their duties and responsibilities.
The Code of Conduct covers such matters as:
� responsibilities to shareholders;
� conflict of interest;
� confidentiality;
� protection of the company assets;
� relations with customers and suppliers;
� employment practices; and
� responsibilities to the community.
Webster Limited has developed and adopted a Securities Trading Policy that prohibits employees trading the Company’s shares due to knowledge of undisclosed information. At other times, directors and employees are permitted to trade in Webster Limited securities subject to compliance with the Securities Trading Policy, statutory and other relevant regulatory restrictions. Directors refer all trading of company shares by them to the Company Secretary for ASX lodgement requirements.
Directors may, after prior approval of the Chairman, obtain independent professional advice at the Company’s expense for the purpose of the proper performance of their duties.
The Company is an equal opportunity employer and recruit’s personnel from a diverse range of backgrounds. Workplace diversity includes, but is not limited to gender, age, race, ethnicity, disability and cultural background. The Company is committed to further enhancing the Group’s diversity and recognises that embracing diversity in its workforce contributes to the achievement of the Group’s objectives.
Directors’ Report continued
For
per
sona
l use
onl
y

21
Although the Company has a rich diversity amongst its employees, the Board recognise the need to improve the diversity at senior executive and Board level. As at 30 September 2017, the Chair and the Company Secretary of AGW Funds Management Limited (a wholly owned subsidiary of Webster Limited that acts as the Responsible Entity for three Managed Investment Schemes) were female. The Company is an equal opportunity employer and the number of female employees has increased over recent years and now females comprise approximately 22% of senior executives, 19% of permanent employees and 40% of seasonal/casual employees.
To further enhance the commitment to gender diversity the Company had developed the following objectives which will be monitored and evaluated by the Board.
� Aim to increase the number of females in executive positions which become vacant, subject to identifying candidates with appropriate skills
� Review means by which the Company can identify and develop high performing female employees to prepare them for senior/executive roles
� Increase the focus on gender participation across the Company
6.4 Safeguard integrity in financial reporting
The Board is responsible for the integrity of financial data and has instigated an internal control framework to ensure accurate financial reporting of monthly actual results against budgets approved by directors and revised forecasts. In accordance with section 295A of the Corporations Act 2001, the Executive Chairman and Chief Financial Officer stated in writing to the Board that the consolidated entity’s financial reports present a true and fair view, in all material respects, of the consolidated entity’s financial condition and operational results and are in accordance with relevant accounting standards.
The Audit and Risk Committee provides assistance to directors in fulfilling their responsibility to the Company’s shareholders and potential investors in relation to the financial risk, audit, corporate accounting and reporting practices of the Company.
6.5 Make timely and balanced disclosures
Webster Limited places considerable importance on accurate and effective communication with its existing and potential shareholders.
Webster Limited is committed to complying with the continuous disclosure obligations of the Corporations Act 2001 and the ASX Listing Rules. The Company has developed and adopted a continuous disclosure policy and procedure, which ensures all material matters concerning the Company are conveyed immediately and effectively. Webster Limited understands and respects the fact that timely disclosure of relevant information is central to the efficient operation of the securities market.
Consistent with best practice disclosure and continuous disclosure requirements, all market-sensitive data, annual and half yearly reports and addresses by the Chairman and are released to the stock exchange through ASX On-Line. Webster Limited also posts reports, newsletters, ASX releases, Annual General Meeting and other major presentations on its website – ww w.websterltd.c om.au.
The external audit partner in charge of the Webster Limited audit is invited to attend the Annual General Meeting and is available to answer shareholder questions related to the conduct of the audit, and the preparation and content of the auditor’s report.
6.6 Respect the rights of shareholders
Webster Limited is committed to providing shareholders with comprehensive information about the Company and its activities, and to fulfilling its obligations to the broader market for continuous disclosure.
The Company publishes a comprehensive Annual Report incorporating financial and other information. This is sent to shareholders on request and is available to the public, as well as being posted on the Company’s website. A Half-Year Report incorporating abbreviated financial data and market commentary is also made available on the same basis.
The Company maintains a website (ww w.websterltd.c om.au) that contains shareholder and stakeholder information in addition to information about the Company’s products. Previous Annual and Half-Year Reports are available on the site.
The Company Secretary’s Office is responsible for the distribution of material and responding to requests for information from shareholders and the public. The Board, and in particular the Chairman, bear responsibility for communication with shareholders and members. This occurs formally through the Annual Report and the Annual General Meeting. At other times, senior management and the Chairman liaise between the Board and key shareholders and analysts.
Notice of the Company’s Annual General Meeting is sent to shareholders, as well as being posted on the website and released to the ASX. The Company’s auditor attends the Annual General Meeting and is invited to answer relevant questions and make statements to the meeting. The directors and senior management attend all General Meetings and are available to shareholders and other stakeholders. The public and the media are welcome to attend General Meetings as observers.
6.7 Recognise and manage risk
The Audit and Risk Committee is responsible for the establishment of a group-wide risk profile. The objective is to identify, evaluate, and monitor material risks that the Company is facing, and to ensure effective management or monitoring of those risks.
The Board is responsible for the Company’s system of internal controls and monitors the operational and financial aspects of the Company’s activities through the Audit and Risk Committee.
For
per
sona
l use
onl
y

22
The Board and the Audit and Risk Committee are both involved in identifying key areas of risk such as insurance, interest rate and exchange exposure and ensuring that appropriate measures of protection are taken.
The Company has in place a number of risk management controls which include the following:
� risk management policy and practices;
� policies and procedures for the management of financial risk and treasury operations including exposures to foreign currencies, financial instruments, and movements in interest rates;
� guidelines and limits for the approval of capital expenditure and investments; and
� a comprehensive insurance program.
Management is required to provide regular reports on each of these matters.
6.8 Remunerate fairly and responsibly
The Company recognises that the process of enhancing shareholder value is dependent upon the performance of directors and management. Ensuring they each have the knowledge and information required to perform their duties, together with the regular review of performance, are important factors in meeting the Company’s objectives.
The only benefits currently paid to non-executive directors are the base fee and superannuation, approved in aggregate by shareholders. There is no scheme for the payment of retirement benefits to executive and non-executive directors.
7. Remuneration Report
The Non-Executive Directors are responsible for reviewing the compensation arrangements for all senior executives and Directors. The review is conducted annually, having regard to management performance and comparative, external compensation levels. Independent advice may be sought on compensation packages and Directors’ fees. The compensation of key management personnel includes salary/fees, movements in accrued annual and long service leave, benefits
(including the provision of motor vehicles, superannuation and fringe benefits) and incentive schemes (including performance-related bonuses).
7.1 Remuneration Policy
The objective of the Company’s executive remuneration policy is to set remuneration levels to attract and retain appropriately qualified and experienced Directors and senior executives. The policy aligns executive rewards with achievement of specific business goals and key performance indicators, which include both financial and operational targets. Remuneration packages include a mix of fixed remuneration and performance-based remuneration. Senior executives may receive short-term incentives.
Remuneration packages are reviewed and determined by the Board, with due regards to current rates, and are benchmarked against comparable industry salaries. The Board may obtain independent advice with regard to the appropriateness of remuneration packages.
Non-Executive Directors receive fees but do not receive any performance-related remuneration. Non-Executive Directors’ fees are reviewed by the Board annually to ensure that they are appropriate and in line with market expectations. The total amount of remuneration provided to Non-Executive Directors must not exceed an aggregate maximum of $500,000 per annum.
7.2 Performance Based Remuneration
Short-Term Incentives
A cash-based Short-Term Incentive Program (STI) continued to be adopted for the 2017 financial period. In the 2017 financial period executive bonus payments of $444,874 have been earned (2016: $176,176). The Program is applicable to key management personnel that act in an executive capacity. The executive STI Program is linked to the budget which aims to align executive performance to the financial performance of the Company.
Executives are eligible for personal Incentives up to a maximum of 50% of their total cost to company (TCC) package based on achieving specific goals and/or KPIs. The Board is responsible for assessing whether the KPIs are met based on detailed reports on performance prepared by management. Financial targets ensure that reward is only available when value has been created for shareholders. Operational targets allow for the recognition of efficiencies that will provide for future shareholder value.
Short-term incentives are payable 50% following approval with the remaining 50% payable after 12-months on the condition the executive is still employed by the Company.
Long-Term Incentives
On 27 August 2013 the Board adopted an Executive Long-Term Incentive Plan (ELTIP) to provide eligible executives the opportunity to acquire shares in the Company. Under the ELTIP, eligible executives are invited to apply for a set number of Webster Limited ordinary shares and a non-recourse interest free loan will be made available to them by the Company for this purpose. The Board may from time to time determine which executives are entitled to participate in the ELTIP based on individual performance as assessed under the annual review process. Shares issued to eligible executives under the ELTIP are subject to a holding lock from their issue date until applicable vesting conditions (eligible executive must be employed by the Company) have been satisfied and the loans applicable to them repaid. The issue price of shares under the ELTIP is determined on the basis of trading in Webster Limited ordinary shares over the five trading days prior to the date of issue. Shares issued under the ELTIP rank pari passu with existing ordinary shares and are entitled to participate in dividends as well as future rights and bonus issues. The ELTIP rewards participating executives against the extent of the consolidated entity’s achievement against improvement in share price and hence shareholder value over the long term.
Directors’ Report continued
For
per
sona
l use
onl
y

23
Details of ELTIP shares granted/vested as compensation to key management personnel:
30 September 2017
Executive
Share Rights Issued
Share Rights Vested
Issue/Exercise
Price Issue DateVesting/
Expiry Date
Revised Vesting
Date
Current Period
ExpenseTotal Value
Granted(i)
D C Goullet 387,500(ii) $0.86 05/09/2013 05/09/2016 05/09/2018 $4,284 $70,079
387,500(ii) $0.86 05/09/2013 05/09/2017 05/09/2018 $23,575 $79,728
193,750 $1.21 21/09/2016 21/09/2019 $19,791 $57,943
193,750 $1.21 21/09/2016 21/09/2020 $16,662 $65,089
200,000 $1.34 25/09/2017 25/09/2020 $245 $53,812
200,000 $1.34 25/09/2017 25/09/2021 $208 $60,698
M Felizzi 250,000 $1.10 30/05/2016 30/05/2019 $31,458 $75,376
250,000 $1.10 30/05/2016 30/05/2020 $26,436 $84,513
250,000 $1.21 21/09/2016 21/09/2019 $25,536 $74,766
250,000 $1.21 21/09/2016 21/09/2020 $21,500 $83,986
B Barry 250,000 $1.21 21/09/2016 21/09/2019 $25,536 $74,766
250,000 $1.21 21/09/2016 21/09/2020 $21,500 $83,986
G J Lok 350,000 $1.34 25/09/2017 25/09/2020 $430 $94,171
350,000 $1.34 25/09/2017 25/09/2021 $364 $106,222
W Andreatta 200,000 $1.34 25/09/2017 25/09/2020 $245 $53,812
200,000 $1.34 25/09/2017 25/09/2021 $208 $60,698
4,162,500 $217,978 $1,179,645
(i) The value of benefits granted under the LTIP during the period is calculated at the issue date using the Black-Scholes pricing model. This value is allocated to the
remuneration of key management personnel on a straight-line basis over the period from issue to vesting date.
(ii) In accordance with the ELTIP plan rules Mr D C Goullet requested a further extension of 12-months to the loan relating to the ELTIP shares. The request was granted
by the Company.
For
per
sona
l use
onl
y

24
30 June 2016
ExecutiveShare Rights
IssuedShare Rights
Forfeited
Issue/Exercise
Price Issue DateVesting/
Expiry DateCurrent Year
ExpenseTotal Value
Granted(i)
J C Hosken (ii) 625,000 625,000 $0.86 05/09/2013 30/06/2016 – –
625,000 625,000 $0.86 05/09/2013 30/06/2016 – –
S J Stegmann (iii) 550,000 275,000 $0.86 05/09/2013 05/09/2016 $16,608 $99,467
550,000 275,000 $0.86 05/09/2013 05/09/2017 $14,174 $113,162
D C Goullet 387,500 $0.86 05/09/2013 05/09/2016 $23,402 $70,079
387,500 $0.86 05/09/2013 05/09/2017 $19,973 $79,728
M Felizzi 250,000 $1.10 30/05/2016 30/05/2019 $2,134 $75,376
250,000 $1.10 30/05/2016 30/05/2020 $1,793 $84,513
C Barnes (ii) 367,500 367,500 $1.28 05/09/2014 30/06/2016 – –
367,500 367,500 $1.28 05/09/2014 30/06/2016 – –
4,360,000 $78,084 $522,324
(i) The value of benefits granted under the LTIP during the year is calculated at the issue date using the Black-Scholes pricing model. This value is allocated to the
remuneration of key management personnel on a straight-line basis over the period from issue to vesting date.
(ii) J Hosken’s entitlements were forfeited on 30 June 2016.
(iii) S J Stegmann’s entitlements were forfeited on 25 February 2016.
(ii) C Barnes resigned during the financial year (16 November 2015); therefore the full value of his share rights was forfeited.
7.3 Relationship between remuneration policy and Company performance
The following tables set out summary information about the consolidated entity’s earnings and movements in shareholder wealth for the five financial periods to 30 September 2017. Analysis of the figures shows that 2017 was affected by the sale of the water entitlements at Lake Tandou and 2016 year was affected by the impairment of goodwill. The 2015 year was affected by acquisition costs from the purchase of Bengerang Limited and takeover of Tandou Limited. The Company’s performance over the five financial periods has been reflected in an increase in the Company’s share price over the same period.
30 September 2017 $’000
30 June 2016 $’000
30 June 2015 $’000
30 June 2014 $’000
30 June 2013 $’000
Revenue and other income 275,761 175,964 77,503 65,650 61,774
Net profit/(loss) before tax 49,059 (81,554) 8,568 11,977 9,922
Net profit/(loss) after tax 58,284 (80,669) 5,759 8,328 6,967
Directors’ Report continued
For
per
sona
l use
onl
y

25
30 September 2017 $’000
30 June 2016 $’000
30 June 2015 $’000
30 June 2014 $’000
30 June 2013 $’000
Share price at start of year $1.12 $1.57 $0.86 $0.70 $0.50
Share price at end of year $1.30 $1.12 $1.57 $0.86 $0.70
Interim Dividend – – – 1.50 cps 1.00 cps
Final Dividend 3.00 cps 1.00 cps 1.00 cps 2.00 cps 1.50 cps
Basic earnings per share 16.44 cps (23.28) cps 3.70 cps 6.21 cps 5.62 cps
7.4 Key Management Personnel details
The Directors and other key management personnel of Webster Limited during the financial period were:
Directors
� C D Corrigan (Executive Chairman)
� B D Cushing (Non-Executive Director)
� C D Langdon (Non-Executive Director)
� J J Robinson (Non-Executive Director)
� R J Roberts (Non-Executive Director) – retired 31 March 2017
Executives
� M Felizzi (Chief Financial Officer and Company Secretary)
� D C Goullet (General Manager Operations, Walnuts Australia)
� B Barry (General Manager, Water Operations)
� G J Lok (General Manager, Webster Southern Ag) – appointed 1 July 2017
� W Andreatta (Development Director) – appointed 1 July 2017
Except as noted, the named persons held their current position for the whole of the financial period and since the end of the financial period.
For
per
sona
l use
onl
y

26
Directors’ Report continued
7.5 Remuneration details of Key Management Personnel
The following tables disclose compensation of key management personnel of the consolidated entity. The term “Key Management Personnel” refers to those persons having authority and responsibility for planning, directing and controlling the activities of the consolidated entity, directly or indirectly, including any Director (whether executive or otherwise) of the consolidated entity.
2017 Short-Term Post EmploymentTerminat-
ion
Share-Based
Amounts Total
Fixed Rem-
uneration
Rem-uneration Linked to
Performance
Key Management Personnel
Salary and fees
Bonus Paid
Bonus Deferred
Non-Monetary Super LTIP (iv)
Directors
C D Corrigan 87,500 – – 11,936 8,315 – – 107,751 100% –
B D Cushing 87,500 – – 11,936 8,315 – – 107,751 100% –
R J Roberts (i) 52,500 – – 7,162 4,988 – – 64,649 100% –
C D Langdon 96,250 – – 11,936 9,144 – – 117,330 100% –
J J Robinson 87,500 – – 11,936 8,315 – – 107,751 100% –
Executives
B Barry 267,176 53,750 53,750 36,311 24,902 – 47,036 482,924 68% 32%
M Felizzi 419,224 87,500 87,500 11,936 25,006 – 104,930 736,097 62% 38%
D C Goullet 289,480 90,619 71,755 36,311 28,052 – 64,765 580,982 61% 39%
G J Lok (ii) 46,570 – – 2,387 4,424 – 794 54,176 99% 1%
W Andreatta (iii) 59,550 – – 2,387 – – 453 62,390 99% 1%
Total 1,493,250 231,869 213,005 144,238 121,460 – 217,978 2,421,801
(i) Mr R J Roberts retired on 31 March 2017.
(ii) Mr G J Lok appointed on 01 July 2017.
(iii) Mr W Andreatta appointed on 01 July 2017.
(iv) The value of the Long-Term Incentive Plan benefits granted to key management personnel as part of their remuneration is calculated as at the issue date using the
Black-Scholes pricing model. The amounts disclosed as part of the remuneration for part of the financial year have been determined by allocating the issue date value
on a straight-line basis over the period from issue date to vesting date.
For
per
sona
l use
onl
y

27
2016 Short-Term Post EmploymentTerminat-
ion
Share-Based
Amounts Total
Fixed Rem-
uneration
Rem-uneration Linked to
Performance
Key Management Personnel
Salary and fees
Bonus Paid
Bonus Deferred
Non-Monetary Super LTIP (iv)
Directors
C D Corrigan 75,200 – – 7,418 7,144 – – 89,762 100% –
B D Cushing 65,307 – – 7,418 6,204 – – 78,929 100% –
R J Roberts 78,490 – – 7,418 10,510 – – 96,418 100% –
D W Robinson (i) 67,505 – – 7,418 6,413 – – 81,336 100% –
C D Langdon 64,546 – – 7,418 – – – 71,964 100% –
R Haire (ii) 189,673 – – 4,896 15,482 – – 210,051 100% –
J J Robinson (iii) – – – 141 – – – 141 100% –
Executives
S J Stegmann (iv) 53,748 77,853 – 2,626 12,223 148,643 61,375 356,468 61% 39%
J Hosken (v) 75,468 57,171 – 12,001 12,196 240,185 – 397,021 86% 14%
B Barry 141,119 – – 26,918 12,581 – – 180,618 100% –
M Felizzi (vi) 61,274 – – 1,484 3,342 – 3,927 70,027 94% 6%
C D Barnes (vii) 65,181 41,152 – 10,251 9,123 10,299 – 136,006 70% 30%
D C Goullet 172,189 – – 26,918 20,567 – 43,375 263,049 84% 16%
A T Reilly (viii) 182,561 – – 15,856 14,573 156,340 – 369,330 100% –
Total 1,292,260 176,176 – 138,180 130,358 555,467 108,677 2,401,118
(i) Mr D W Robinson retired on 23 June 2016.
(ii) Mr R A G Haire retired on 29 February 2016.
(iii) Mr J J Robinson was appointed on 23 June 2016.
(iv) Ms S J Stegmann retired on 30 September 2015.
(v) Mr C J Hosken retired on 18 November 2015.
(vi) Mr M Felizzi was appointed on 18 April 2016.
(vii) Mr C D Barnes retired on 16 November 2015.
(viii) Mr A T Reilly was appointed on 28 August 2015 and retired on 31 March 2016.
(ix) The value of the Long-Term Incentive Plan benefits granted to key management personnel as part of their remuneration is calculated as at the issue date using the
Black-Scholes pricing model. The amounts disclosed as part of the remuneration for part of the financial year have been determined by allocating the issue date value
on a straight-line basis over the period from issue date to vesting date.For
per
sona
l use
onl
y

28
Directors’ Report continued
7.6 Transactions with Key Management Personnel
During the financial period where, Directors and their Director-related entities, and executives purchased goods, which were domestic or trivial in nature, from the Company on the same terms and conditions available to other employees and customers.
The Company entered into management agreements with Australian Food and Fibre Ltd (pursuant to the purchase of the Kooba Aggregation, Bengerang Ltd and Tandou Ltd) a company in which Mr Joe Robinson is an associate. The original management agreement was a for a 2 year term expiring 30 June 2017 with an annual fee of $550,000 plus bonus incentives based on performance to a maximum potential of $500,000 (100% of incentive achieved). The agreement was renewed on 01 July 2017 for a 3 year term with an annual fee of $300,000 plus bonus incentives based on performance to a maximum potential of $500,000. Australian Food and Fibre also incurred expenses on behalf of the Company and were reimbursed at cost for those expenses amounting to $854,760.
The Company entered into an agreement with Corrigan Air, a company which Mr Christopher Corrigan and Mr Joseph Corrigan are associates. The current agreement is for the provision of the use of light aircraft to transport management to its properties. The arrangement is charged at cost which amounted to $272,140 for the 15-month period ended 30 September 2017.
The Company supplied walnuts to Langdon Ingredients, Bakery Craft and The Natural Foods Trading Company, all companies which Mr Chris Langdon is an associate. The goods were supplied at arms length on normal commercial terms. The value of goods supplied was $326,893 for the 15-month period ended 30 September 2017.
Other than the above, and contracts of employment, no other key management personnel have entered into a contract with the Company during the financial period.
7.7 Equity Holdings of Key Management Personnel
The following tables disclosed details and movements in equity holdings of key management personnel of the consolidated entity:
2017
Number of ordinary shares (ORD) held directly, indirectly or beneficially Type
Balance at 1/7/16
Received on exercise of
optionsShare Rights
ELTIPNet other
changeBalance at
30/9/17
Directors
C D Corrigan ORD 45,132,434 – – – 45,132,434
B D Cushing ORD 20,244,413 – – – 20,244,413
R J Roberts (i) ORD 5,143,187 – – – 5,143,187
C D Langdon ORD 1,444 – – – 1,444
J J Robinson ORD 52,702,351 – – – 52,702,351
123,223,829 – – – 123,223,829
Executives
Options
M Felizzi ORD 500,000 – 500,000 – 1,000,000
D C Goullet ORD 776,232 – 787,500 – 1,563,732
B Barry ORD – – 500,000 – 500,000
G J Lok ORD – – 700,000 – 700,000
W Andreatta ORD – – 400,000 – 400,000
1,276,232 – 2,887,500 – 4,163,732
(i) Closing balance for R J Roberts is at the respective retirement date.
For
per
sona
l use
onl
y

29
2016
Number of ordinary shares (ORD) held directly, indirectly or beneficially Type
Balance at 1/7/15
Received on exercise
of optionsShare Rights
ELTIPNet other
changeBalance at
30/6/16
Directors
C D Corrigan ORD 43,106,493 – – 2,025,941 45,132,434
B D Cushing ORD 20,244,413 – – – 20,244,413
R J Roberts ORD 5,143,187 – – – 5,143,187
D W Robinson (ii) ORD 54,031,899 – – (54,029,399) 2,500
C D Langdon ORD 1,444 – – – 1,444
J J Robinson (i) ORD – – – 52,702,351 52,702,351
122,527,436 – – 698,893 123,226,329
Executives
Options
C D Barnes (iii) ORD 735,000 – (735,000) – –
M Felizzi ORD – – 500,000 – 500,000
D C Goullet ORD 776,232 – – – 776,232
J C Hosken (iv) ORD 1,250,000 – (1,250,000) – –
S J Stegmann (v) ORD 1,105,113 – (550,000) – 555,113
3,866,345 – (2,035,000) – 1,831,345
(i) Opening balance for J J Robinson is at the respective appointment date.
(ii) Closing balance for D W Robinson is at the respective retirement date.
(iii) C D Barnes retired 16/11/15.
(iv) J C Hosken retired 18/11/15.
(v) S J Stegmann retired on 30/9/15.
For
per
sona
l use
onl
y

30
Directors’ Report continued
8. Issue of Shares
In March 2017, 9,000,000 ordinary shares were issued as part consideration for the acquisition of Motspur Park. In September 2017, 1,500,000 ordinary shares were issued for the purposes of the Executive Long Term Incentive Plan.
9. Share Options
No shares of any controlled entity were issued during or since the end of the 15-month period by virtue of the exercise of any options.
10. Dividends
During the period, directors declared and paid the following dividends:
� Dividends of 9.0 cents per share on the cumulative non-redeeming preference shares were paid on 24 March 2017.
� Dividends of 3.0 cents per ordinary share, fully franked, was declared in regard to the 15-month period ended 30 September 2017 for payment on 8 December 2017.
11. Changes in State of Affairs
Other than as disclosed in this report or in the accompanying financial statements and notes thereto, there has been no significant change in the state of affairs of the consolidated Group during the period.
12. Subsequent Events
The directors are not aware of any other matter or circumstance that has arisen, other than that which has been described above, that has significantly or may significantly affect the operations of the consolidated group, the results of those operations or the state of affairs of the consolidated group in subsequent financial years.
13. Likely Developments
Likely developments in the consolidated Group’s operations known at the date of this report have been covered elsewhere within this report.
14. Officers’ Indemnities and Insurance
During the 15-month period, the Company paid a premium in respect of a contract insuring the directors of the Company (as named above), the Company Secretary, and all executive officers of the Company and of any related body corporate against a liability incurred as such a director, secretary or executive officer to the extent permitted by the Corporations Act 2001. The contract of insurance prohibits disclosure of the nature of the liability and the amount of the premium. The Company has not otherwise, during or since 30 September 2017, indemnified or agreed to indemnify an officer or auditor of the Company or of any related body corporate against a liability incurred as such an officer or auditor.
15. Environmental Regulations
The consolidated group operates various processing facilities that are subject to environmental controls. There are no known issues that are outstanding with regulatory authorities and the group is operating within accepted guidelines.
16. Non-Audit Services
The directors are satisfied that the provision of non-audit services during the year by the auditors (or by another person or firm on the auditor’s behalf) is compatible with the general standard of independence for auditors imposed by the Corporations Act 2001. Details of amounts paid or payable to the auditor for non-audit services provided during the 15-month period by the auditor are outlined in note 4 to the financial statements.
The directors are of the opinion that the services disclosed in note 4 to the financial statements do not compromise the external auditor’s independence, based on the advice received from the Audit and Risk Committee, for the following reasons:
� All non-audit services have been reviewed and approved to ensure that they do not impact the integrity and objectivity of the auditor, and
� None of the services undermine the general principles relating to auditor independence as set out in Code of Conduct APES 110 Code of Ethics for Professional Accountants issued by the Accounting Professional & Ethical Standards Board, including reviewing or auditing the auditors own work, acting in a management or decision-making capacity for the Company, acting as advocate for the Company or jointly sharing economic risks and rewards.
17. Rounding Off of Amounts
The Company is a company of the kind referred to in ASIC Corporations (Rounding in Financials/Directors’ reports) Instrument 2016/191, dated 24 March 2016, and in accordance with that Corporations instrument, amounts in the director’s report and the financial statements are rounded off to the nearest thousand dollars, unless otherwise indicated.
18. Independence Declaration by Auditor
The auditor’s independence declaration is included on page 32.
Signed in accordance with a resolution of the directors made pursuant to s.298(2) of the Corporations Act 2001.
On behalf of the Directors
C D Corrigan Executive Chairman
Leeton, 2 November 2017
For
per
sona
l use
onl
y

31
The directors declare that:
(a) In the directors’ opinion, there are reasonable grounds to believe that the company will be able to pay its debts as and when they become due and payable;
(b) In the directors’ opinion, the attached financial statements are in compliance with International Financial Reporting Standards, as stated in note 1 to the financial statements;
(c) In the directors’ opinion, the attached financial statements and notes thereto are in accordance with the Corporations Act 2001, including compliance with accounting standards and giving a true and fair view of the financial position and performance of the consolidated entity; and
(d) The directors have been given the declarations required by section 295A of the Corporations Act 2001.
At the date of this declaration, the company is within the class of companies affected by legislative instrument 2016/191. The company is within the class of company as affected by ASIC Class Order 98/1418. The nature of the deed of cross guarantee is such that each company which is party to the deed guarantees to each creditor payment in full of any debt in accordance with the deed of cross guarantee.
In the directors’ opinion, there are reasonable grounds to believe that the company and the companies to which the ASIC Class Order applies, as detailed in note 17 to the financial statements will, as a group, be able to meet any obligations or liabilities to which they are, or may become, subject by virtue of the deed of cross guarantee.
Signed in accordance with a resolution of the directors made pursuant to s.295(5) of the Corporations Act 2001.
On behalf of the Directors
C D Corrigan Executive Chairman
Leeton, 2 November 2017
Directors’ DeclarationFor the 15-month period ended 30 September 2017
For
per
sona
l use
onl
y

32
Auditor Reports
Deloitte refers to one or more of Deloitte Touche Tohmatsu Limited, a UK private company limited by guarantee, and its network of member firms, each of which is a legally separate and independent entity. Please see www.deloitte.com/au/about for a detailed description of the legal structure of Deloitte Touche Tohmatsu Limited and its member firms. Liability limited by a scheme approved under Professional Standards Legislation. Member of Deloitte Touche Tohmatsu Limited
Dear Board Members
Webster Limited In accordance with section 307C of the Corporations Act 2001, I am pleased to provide the following declaration of independence to the directors of Webster Limited. As lead audit partner for the audit of the financial statements of Webster Limited for the 15 month period ended 30 September 2017, I declare that to the best of my knowledge and belief, there have been no contraventions of:
(i) the auditor independence requirements of the Corporations Act 2001 in relation to the audit; and
(ii) any applicable code of professional conduct in relation to the audit. Yours faithfully
DELOITTE TOUCHE TOHMATSU
John Leotta Partner Chartered Accountants Sydney, 2 November 2017
Deloitte Touche Tohmatsu A.C.N. 74 490 121 060 Grosvenor Place 225 George Street Sydney NSW 2000 PO Box N250 Grosvenor Place Sydney NSW 1217 Australia DX 10307SSE Tel: +61 (0) 2 9322 7000 Fax: +61 (0) 2 9322 7001 www.deloitte.com.au
The Board of Directors Webster Limited 61 Kurrajong Avenue Leeton NSW 2705
For
per
sona
l use
onl
y

33
Deloitte Touche Tohmatsu A.C.N. 74 490 121 060
Grosvenor Place
225 George Street Sydney NSW 2000
PO Box N250 Grosvenor Place Sydney NSW 1217 Australia
DX 10307SSE
Tel: +61 (0) 2 9322 7000 Fax: +61 (0) 2 9322 7001
www.deloitte.com.au
Deloitte refers to one or more of Deloitte Touche Tohmatsu Limited, a UK private company limited by guarantee, and its network of member firms, each of which is a legally separate and independent entity. Please see www.deloitte.com/au/about for a detailed description of the legal structure of Deloitte Touche Tohmatsu Limited and its member firms. Liability limited by a scheme approved under Professional Standards Legislation. Member of Deloitte Touche Tohmatsu Limited
Independent Auditor’s Report to the Members of Webster Limited
Report on the Audit of the Financial Report Opinion We have audited the financial report of Webster Limited (the “Company”) and its subsidiaries (the “Group”), which comprises the consolidated statement of financial position as at 30 September 2017, the consolidated statement of comprehensive income, the consolidated statement of changes in equity and the consolidated statement of cash flows for the 15 month period then ended, and notes to the financial statements, including a summary of significant accounting policies, and the directors’ declaration. In our opinion, the accompanying financial report of the Group is in accordance with the Corporations Act 2001, including: (i) giving a true and fair view of the Group’s financial position as at 30 September
2017 and of its financial performance for the 15 month period ended; and
(ii) complying with Australian Accounting Standards and the Corporations Regulations 2001.
Basis for Opinion We conducted our audit in accordance with Australian Auditing Standards. Our responsibilities under those standards are further described in the Auditor’s Responsibilities for the Audit of the Financial Report section of our report. We are independent of the Group in accordance with the auditor independence requirements of the Corporations Act 2001 and the ethical requirements of the Accounting Professional and Ethical Standards Board’s APES 110 Code of Ethics for Professional Accountants (the Code) that are relevant to our audit of the financial report in Australia. We have also fulfilled our other ethical responsibilities in accordance with the Code. We confirm that the independence declaration required by the Corporations Act 2001, which has been given to the directors of the Company, would be in the same terms if given to the directors as at the time of this auditor’s report. We believe that the audit evidence we have obtained is sufficient and appropriate to provide a basis for our opinion.F
or p
erso
nal u
se o
nly

34
Auditor Reports continued
Key Audit Matters Key audit matters are those matters that, in our professional judgement, were of most significance in our audit of the financial report for the current period. These matters were addressed in the context of our audit of the financial report as a whole, and in forming our opinion thereon, and we do not provide a separate opinion on these matters. Key Audit Matter How the scope of our audit responded to
the Key Audit Matter Carrying Value of Permanent Water Licences Refer to Note 9 ‘Intangibles’ As at 30 September 2017 the Group’s Consolidated Statement of Financial Position includes Permanent Water Rights amounting to $212.9 million. The assessment of impairment of the Group’s Permanent Water Rights involves the exercise of significant judgement in respect of key assumptions relating to current market prices of water licences. Management has disclosed its basis for determining the recoverable amount of Permanent Water Rights in note 9 (d).
Our procedures included, but were not limited to: evaluating management and the Board’s
determination to use current market price as an appropriate methodology to estimate recoverable amount;
evaluating management’s impairment analysis based on current market prices;
agreeing the current market prices used in the impairment assessment to market data and where appropriate, values achieved in the Group’s most recent sale of Permanent Water Rights; and
assessing the appropriateness of the related disclosures included in Note 9 to the financial statements.
Goodwill Agriculture Refer to Note 9 ‘Intangibles’ As at 30 September 2017 the Group’s Consolidated Statement of Financial Position includes Goodwill relating to Agriculture of $23.3 million. Management has assessed the recoverable amount of goodwill utilising a discounted cash flow model which incorporates significant judgement in respect of key assumptions such as discount rate, the terminal growth rate, commodity prices and forecast future cash flows.
Our procedures included, but were not limited to: obtaining an understanding of the key
controls associated with the preparation of the valuation model used to assess the recoverable amount of the Group’s goodwill relating to Agriculture:
evaluating the ‘fair value less costs to sell’ discounted cash flow model developed by management to assess the recoverable amount of goodwill including assessing the following assumptions: the discount rate; the terminal growth rate; commodity prices; and forecast cash flows;
testing on a sample basis the mathematical accuracy of the cash flow models and agreeing relevant data to Board approved budgets;
assessing the historical accuracy of forecasting of the Group in relation to cash flows;
performing a sensitivity analysis on key assumptions.
For
per
sona
l use
onl
y

35
assessing the appropriateness of the disclosures included in Note 9 in the financial report.
Change in Bearer Plants Accounting Policy Refer to Note 27 “Application of new and revised accounting standards” Walnut Orchards of $50.5 million are used by the business for the long-term production of walnuts. Pursuant to a change in Australian Accounting Standards relating to Bearer Plants walnut trees that make up the Group’s Walnut Orchards are now required to be treated as an item of Property, Plant and Equipment. This mandated change represents a change in the Group’s accounting policy for its Walnut Orchards and has been disclosed in note 27. As a result of the above change and the transition in the accounting treatment of walnut trees, management is required to exercise significant judgement in respect to key assumptions used, including:
determining the remaining useful lives of walnut trees at the date of adoption of the new accounting standard;
selecting the depreciation method to be applied based on the way in which the Group will consume the benefit embodied in the walnut tree;
determining the point at which walnut trees are in a location and condition ready to produce commercial volumes of walnuts; and
assessing the accounting treatment for ongoing expenditure to cultivate walnut trees.
Our procedures included, but were not limited to: evaluating management’s methodologies
and documented basis for key judgements used in developing key estimates of: useful lives of walnut trees at the
date of transition to new accounting standard;
expected pattern of consumption; the point in time at which walnut
trees are in a location and condition ready to produce commercial volumes of walnuts; and
accounting treatment for ongoing expenditure to cultivate walnut trees.
reading external expert reports used by
management to assist them develop key assumptions noted.
agreeing the opening cost of walnut
orchards transferred into property plant and equipment to prior year fair value less costs to sell value measurement.
We also assessed the appropriateness of the disclosures included in Note 26 to the financial statements.
Other Information
(a) The auditor has obtained all of the other information prior to the date of the auditor’s report and has not identified a material misstatement of the other information.
Directors’ Responsibilities for the Financial Report
The directors of the Company are responsible for the preparation of the financial report that gives a true and fair view in accordance with Australian Accounting Standards and the
For
per
sona
l use
onl
y

36
Auditor Reports continued
Corporations Act 2001 and for such internal control as the directors determine is necessary to enable the preparation of the financial report that gives a true and fair view and is free from material misstatement, whether due to fraud or error.
In preparing the financial report, the directors are responsible for assessing the ability of the group to continue as a going concern, disclosing, as applicable, matters related to going concern and using the going concern basis of accounting unless the directors either intend to liquidate the Group or to cease operations, or has no realistic alternative but to do so.
Auditor’s Responsibilities for the Audit of the Financial Report
Our objectives are to obtain reasonable assurance about whether the financial report as a whole is free from material misstatement, whether due to fraud or error, and to issue an auditor’s report that includes our opinion. Reasonable assurance is a high level of assurance, but is not a guarantee that an audit conducted in accordance with the Australian Auditing Standards will always detect a material misstatement when it exists. Misstatements can arise from fraud or error and are considered material if, individually or in the aggregate, they could reasonably be expected to influence the economic decisions of users taken on the basis of this financial report.
As part of an audit in accordance with the Australian Auditing Standards, we exercise professional judgement and maintain professional scepticism throughout the audit. We also:
Identify and assess the risks of material misstatement of the financial report, whether due to fraud or error, design and perform audit procedures responsive to those risks, and obtain audit evidence that is sufficient and appropriate to provide a basis for our opinion. The risk of not detecting a material misstatement resulting from fraud is higher than for one resulting from error, as fraud may involve collusion, forgery, intentional omissions, misrepresentations, or the override of internal control.
Obtain an understanding of internal control relevant to the audit in order to design audit procedures that are appropriate in the circumstances, but not for the purpose of expressing an opinion on the effectiveness of the Group’s internal control.
Evaluate the appropriateness of accounting policies used and the reasonableness of accounting estimates and related disclosures made by the directors.
Conclude on the appropriateness of the directors’ use of the going concern basis of accounting and, based on the audit evidence obtained, whether a material uncertainty exists related to events or conditions that may cast significant doubt on the Group’s ability to continue as a going concern. If we conclude that a material uncertainty exists, we are required to draw attention in our auditor’s report to the related disclosures in the financial report or, if such disclosures are inadequate, to modify our opinion. Our conclusions are based on the audit evidence obtained up to the date of our auditor’s report. However, future events or conditions may cause the Group to cease to continue as a going concern.
Evaluate the overall presentation, structure and content of the financial report, including the disclosures, and whether the financial report represents the underlying transactions and events in a manner that achieves fair presentation.
Obtain sufficient appropriate audit evidence regarding the financial information of the entities or business activities within the Group to express an opinion on the financial report. We are responsible for the direction, supervision and performance of the Group audit. We remain solely responsible for our audit opinion.
For
per
sona
l use
onl
y

37
We communicate with the directors regarding, among other matters, the planned scope and timing of the audit and significant audit findings, including any significant deficiencies in internal control that we identify during our audit.
We also provide the directors with a statement that we have complied with relevant ethical requirements regarding independence, and to communicate with them all relationships and other matters that may reasonably be thought to bear on our independence, and where applicable, related safeguards.
From the matters communicated with the directors, we determine those matters that were of most significance in the audit of the financial report of the current period and are therefore the key audit matters. We describe these matters in our auditor’s report unless law or regulation precludes public disclosure about the matter or when, in extremely rare circumstances, we determine that a matter should not be communicated in our report because the adverse consequences of doing so would reasonably be expected to outweigh the public interest benefits of such communication. Report on the Remuneration Report Opinion on the Remuneration Report
We have audited the Remuneration Report included in pages 22 to 29 of the directors’ report for the 15 month period ended 30 September 2017.
In our opinion, the Remuneration Report of Webster Limited, for the 15 month period ended 30 September 2017, complies with section 300A of the Corporations Act 2001. Responsibilities
The directors of the Company are responsible for the preparation and presentation of the Remuneration Report in accordance with section 300A of the Corporations Act 2001. Our responsibility is to express an opinion on the Remuneration Report, based on our audit conducted in accordance with Australian Auditing Standards.
DELOITTE TOUCHE TOHMATSU
J A Leotta Partner Chartered Accountants Sydney, 2 November 2017
For
per
sona
l use
onl
y

38
Financial Statements
For
per
sona
l use
onl
y

39
For the 15-month period ended 30 September 2017
Note
15-months to 30 September
2017 $’000
12-months to 30 June
2016 $’000
Continuing Operations
Revenue 2(a) 166,087 119,782
Cost of sales 2(c) (136,318) (91,655)
Gross profit 29,769 28,127
Other income 2(b) 109,674 56,182
Distribution expenses (3,552) (3,902)
Marketing expenses (426) (671)
Operational expenses (51,315) (51,473)
Administration expenses (4,100) (6,182)
Finance costs 2(c) (7,976) (6,927)
Other expenses (102) (258)
Impairment loss 2(d) (22,913) (96,450)
Profit/(loss) before income tax expense 49,059 (81,554)
Income tax benefit 3 9,225 885
Net profit/(loss) for the period from continuing operations 58,284 (80,669)
Profit/(loss) attributable to:
Owners of the parent 58,284 (80,669)
58,284 (80,669)
Total comprehensive income/(loss) attributable to:
Owners of the parent 58,284 (80,669)
58,284 (80,669)
Earnings/(loss) per share
Basic (cents per share) 15 16.44 (23.28)
Diluted (cents per share) 15 16.44 (23.28)
Notes to the financial statements are included on pages 43 to 84.
Consolidated statement of profit or loss and other comprehensive income
For
per
sona
l use
onl
y

40
As at 30 September 2017
Consolidated statement of financial position
Note2017
$’0002016
$’000
Current Assets
Cash and cash equivalents 20(a) 15,442 12,450
Trade and other receivables 5 24,593 25,535
Inventories 6 47,259 60,353
Other assets 7 811 8,223
Total current assets 88,105 106,561
Non-Current Assets
Trade and other receivables 5 – 751
Property, plant and equipment 8 305,587 277,159
Investments 78 52
Intangibles – water 9 212,871 240,450
Intangibles – goodwill 9 25,896 24,700
Intangibles – other 9 1,763 1,920
Total non-current assets 546,195 545,032
Total assets 634,300 651,593
Current Liabilities
Trade and other payables 10 14,229 15,231
Borrowings 11 16,334 44,694
Current tax liability 3 3,796 1,038
Provisions 12 1,583 1,296
Other liability 13 1,433 –
Total current liabilities 37,375 62,259
Non-Current Liabilities
Borrowings 11 103,608 152,257
Net deferred tax liability 3 8,455 19,847
Provisions 12 85 374
Total non-current liabilities 112,148 172,478
Total liabilities 149,523 234,737
Net assets 484,777 416,856
Equity
Issued capital 14 477,865 462,844
Reserves (1,380) 371
Retained earnings/(accumulated losses) 8,292 (46,359)
Total equity 484,777 416,856
Notes to the financial statements are included on pages 43 to 84.
For
per
sona
l use
onl
y

41
Share capital $’000
Cash flow hedging reserve1
$’000
Equity settled employee benefits reserve2
$’000
Retained earnings/ (accumulated losses) $’000
Attributable to the owners of the parent $’000
Non- controlling interests $’000
Total $’000
Balance at 1 July 2015 459,468 (396) 367 37,812 497,251 3,840 501,091
Profit or loss for the year – – – (80,669) (80,669) – (80,669)
Other comprehensive income for the year, net of tax
– 566 – – 566 – 566
Total comprehensive income/(loss) for the year
– 566 – (80,669) (80,103) – (80,103)
Payment of dividends – – – (3,502) (3,502) – (3,502)
Equity issued as consideration for acquisition of subsidiaries
3,376 – – – 3,376 – 3,376
Non Controlling interest divestiture – – – – – (3,840) (3,840)
Foreign Exchange Contracts closed – (170) – – (170) – (170)
Forfeiture of share based payments – – (197) – (197) – (197)
Recognition of share based payments(3)
– – 201 – 201 – 201
Balance at 30 June 2016 462,844 – 371 (46,359) 416,856 – 416,856
Profit or loss for the 15-month period – – – 58,284 58,284 – 58,284
Other comprehensive income for the period, net of tax
– – – – – – –
Total comprehensive income for the period
– – – 58,284 58,284 – 58,284
Payment of dividends – – – (3,508) (3,508) – (3,508)
Equity issued as consideration for acquisition of subsidiaries
15,021 – – – 15,021 – 15,021
Recognition of share based payments(3)
– – (1,751) (125) (1,876) – (1,876)
Balance at 30 September 2017 477,865 – (1,380) 8,292 484,777 – 484,777
1. The hedging reserve represents hedging gains or losses recognised on the effective portion of cash flow hedges. The cumulative deferred gain or loss on the hedge
is recognised in profit or loss when the hedged transaction impacts the profit or loss, or is included as a basis adjustment to the non-financial hedged item, consistent
with the applicable accounting policy.
2. Equity settled employee benefits reserve relates to the Long Term Incentive Plan
3. The recognition of share based payments represents the 15-month period expense for all members of the Long Term Incentive Plan for the period whilst they were a participant.
It also recognises the cost associated with the shares being allocated.
Notes to the financial statements are included on pages 43 to 84.
For the 15-month period ended 30 September 2017
Consolidated statement of changes in equity
For
per
sona
l use
onl
y

42
Note
15-months to 30 September
2017 $’000
12-months to 30 June
2016 $’000
Cash Flows from Operating Activities
Receipts from customers 247,707 150,550
Payments to suppliers and employees (168,014) (103,310)
Interest paid (7,976) (6,927)
Income tax refund 2,758 –
Net cash provided by operating activities 20(e) 74,475 40,313
Cash Flows from Investing Activities
Interest Received 97 97
Payment for biological assets, property, plant and equipment (64,849) (38,350)
Payment for water entitlements (9,754) (19,904)
Net cash outflow on acquisition of subsidiaries (10,000) –
Proceeds from sale property, plant and equipment 14,446 5,983
Proceeds from government grants – development works 1,433 1,140
Proceeds from loans – 2,207
Proceeds from sale of investments – 53
Proceeds from sale water entitlements 77,786 6,970
Net cash provided by/(used) in investing activities 9,159 (41,804)
Cash Flows from Financing Activities
Proceeds from borrowings from others 279,772 217
Repayment of borrowings from others (356,781) –
Dividends paid (3,633) (3,502)
Net cash used in financing activities (80,642) (3,285)
Net increase/(decrease) in cash and cash equivalents 2,992 (4,776)
Cash and cash equivalents at the beginning of the period 12,450 17,226
Cash and cash equivalents at 30 September 2017 20(a) 15,442 12,450
Notes to the financial statements are included on pages 43 to 84.
For the 15-month period ended 30 September 2017
Consolidated statement of cash flows
For
per
sona
l use
onl
y

43
1. Basis of preparation
This section sets out the basis upon which the Webster Group’s financial statements are prepared as a whole. Significant and other accounting policies that summarises the measurement basis used and are relevant to an understanding of the financial statements are provided throughout the notes to the financial statements. All other accounting policies are outlined throughout the relevant notes.
Statement of Compliance: Webster Ltd is a limited company incorporated in Australia whose shares are publicly traded on the Australian Securities Exchange.
The general purpose financial report is prepared in accordance with the Corporations Act 2001 and Applicable Accounting Standards and Interpretation, and complied with other requirements of the law. Webster Limited is a “for profit entity”. The financial report includes the consolidated financial statements of Webster Ltd and its controlled entities Webster group.
Accounting Standards include Australian Accounting Standards. Compliance with Australian Accounting Standards ensures the financial statements and notes of the company and the Webster group comply with International Financial Reporting Standards.
The financial report has been prepared on the basis of historical cost, except for biological assets and inventories at realisable value and the revaluation of certain non-current assets and financial instruments. Cost is based on the fair values of the consideration given in exchange for assets.
All amounts are presented in Australian dollars, unless otherwise noted.
Fair value is the price that would be received to sell an asset or paid to transfer a liability in an orderly transaction between market participants at the measurement date, regardless of whether that price is directly observable or estimated using another valuation technique. In estimating the fair value of an asset or a liability, Webster Limited takes into account the characteristics of the asset or liability if market participants would take those characteristics into account when pricing the asset or liability at the measurement date. Fair value for measurement and/or disclosure purposes in these consolidated financial statements is determined on such a basis, except for share-based payment transactions that are within the scope of AASB 2, leasing transactions that are within the scope of AASB 117, and measurements that have some similarities to fair value but are not fair value, such as net realisable value in AASB 2 or value in use in AASB 136.
In addition, for financial reporting purposes, fair value measurements are categorised into Level 1, 2 or 3 based on the degree to which the inputs to the fair value measurements are observable and the significance of the inputs to the fair value measurement in its entirety, which are described as follows:
� Level 1 inputs are quoted prices (unadjusted) in active markets for identical assets or liabilities that the entity can access at the measurement date;
� Level 2 inputs are inputs, other than quoted prices included within Level 1, that are observable for the asset or liability, either directly or indirectly; and
� Level 3 inputs are unobservable inputs for the asset or liability.
Webster Limited is a company of the kind referred to in Legislative Instrument 2016/191, dated 24 March 2016.
The accounting policies adopted are consistent with those of the previous year, unless otherwise stated.
Basis of consolidation: The consolidated financial statements incorporate the financial statements of Webster Limited and entities controlled by the company and its subsidiaries (referred to as ‘Webster Limited in these financial statements). Control is achieved when Webster Limited:
� Has power over the investee;
� Is exposed, or has rights, to variable returns from our involvement with the investee; and
� Has the ability to use our power to affect its returns. The company has the power to govern the financial and operating policies of an entity so as to obtain benefits from its activities.
The results of subsidiaries acquired or disposed of during the 15-month period are included in the consolidated income statement from the effective date of acquisition or up to the effective date of disposal, as appropriate.
Where necessary, we make adjustments to the financial statements of subsidiaries to bring their accounting policies into line with those used by other members of Webster.
We eliminate all intra-group transactions, balances, income and expenses in full on consolidation. In the separate financial statements of Webster Limited, intra-group transactions (‘common control transactions’) are generally accounted for by reference to the existing (consolidated) book value of the items.
Where the transaction value of common control transactions differs from their consolidated book value, we recognise the difference as a contribution by or distribution to equity participants by the transacting entities.
For the 15-month period ended 30 September 2017
Notes to the Financial Statements
For
per
sona
l use
onl
y

44
For the 15-month period ended 30 September 2017
Comparative Information: Where applicable, comparative information has been reclassified in order to comply with current period disclosure requirements, the impact of which is not material to the financial report.
Rounding: Unless otherwise shown in the financial statements, amounts have been rounded to the nearest tenth of a thousand dollars and are shown by $’000. Webster Limited is a company of the kind referred toiin the Australian Securities and Investment Commission (ASIC) Class Order 98/1418.
Currency: Unless otherwise shown in the financial statements, amounts are in Australian dollars, which is Webster’s group functional currency.
Critical accounting judgements and key sources of estimation uncertainty: In the application of the Group’s accounting policies, management is required to make judgements, estimates and assumptions about carrying values of assets and liabilities that are not readily apparent from other sources. The estimates and associated assumptions are based on historical experience and other factors that are considered to be relevant. Actual results may differ from these estimates.
We review the estimates and underlying assumptions on an ongoing basis. We recognise revisions to accounting estimates in the period in which the estimate is revised if the revision affects only that period or in the period of the revision and future periods if the revision affects both current and future periods.
The following are key assumptions concerning the future, and other key sources of estimation uncertainty at the balance sheet date, that have a significant risk of causing a material adjustment to the carrying amounts of the assets and liabilities within the next financial year.
2. Profit/(loss) from Operations
Profit from operations before income tax includes the following items of revenue and expense:
2017 $’000
2016 $’000
(a) Revenue
Revenue from the sale of goods 166,087 119,782
Total revenue 166,087 119,782
(b) Other Income
Gain on disposal of permanent water rights and PPE 22,609 3,550
Increment in net market value of agricultural assets 28,409 37,116
Net foreign exchange loss (1,059) (15)
Net Income from sales of unused water allocations 4,627 2,415
Revenue from the rendering of services 7,338 7,937
lnterest revenue 97 97
Rental revenue 1,463 565
Income from sale of property compulsory acquired 39,999 –
Other 6,191 4,517
Total other income 109,674 56,182
Notes to the Financial Statements continued
For
per
sona
l use
onl
y

45
2017 $’000
2016 $’000
(c) Expenses
Cost of sales 136,318 91,655
Interest on loans 6,674 6,533
Dividends on instruments classified as financial liabilities 18 32
Other finance costs 1,284 362
Total finance costs 7,976 6,927
Depreciation of non-current assets 14,293 7,505
Amortisation of non-current assets 156 483
Total depreciation and amortisation 14,449 7,988
Equity settled share based payments 213 201
Post-employment benefits 1,722 1,512
Other employee benefits 23,187 15,914
Total employee benefits expense 25,122 17,627
(d) Significant items
Profit/(loss) before tax benefit includes the following specific expenses for which disclosure is relevant in explaining the financial performance of Webster Ltd:
Impairment of goodwill – 96,450
Impairment of property, plant and equipment 22,913 –
Total impairment 22,913 96,450
The impairment of property, plant and equipment in the current period relates to assets to be decommissioned following an agreement entered with the Commonwealth of Australia in May 2017 in respect of its Lake Tandou operations.
Recognition and measurement
Revenue is measured at the fair value of the consideration received or receivable. Revenue is reduced for estimated customer returns, stock rotation, price protection, rebates and other similar allowances.
Sale of goods – Revenue from the sale of goods and disposal of other assets is recognised when the consolidated entity has transferred to the buyer the significant risk and rewards of ownership of the goods.
Rendering of services – Revenue from a contract to provide services is recognised by reference to the stage of completion of the contract. The stage of completion of the contract is determined as revenue from a time and material basis and is recognised at the contractual rates as labour hours are delivered and direct expenses are incurred.
Dividend and interest revenue – Dividend revenue from investments is recognised when Webster Limited’s right to receive the payment has been established. Interest revenue is recognised on a time proportionate basis that takes into account the effective yield on the financial asset.
Borrowing Costs – Borrowing costs directly attributable to the acquisition, construction or production of qualifying assets, which are assets that necessarily take a substantial period of time to get ready for their intended use or sale, are added to the cost of those assets, until such time as the assets are substantially ready for their intended use or sale. Investment income earned on the temporary investment of specific borrowings pending their expenditure on qualifying assets is deducted from the borrowing costs eligible for capitalisation.
All other borrowing costs are recognised in the profit and loss in the period in which they are incurred.
For
per
sona
l use
onl
y

46
For the 15-month period ended 30 September 2017
Notes to the Financial Statements continued
Employee Benefits – We recognise for benefits accruing to employees in respect of wages and salaries, annual leave and long service leave when it is probable that settlement will be required and they are capable of being measured reliably.
We measure liabilities in respect of employee benefits expected to be settled wholly within 12-months at their nominal values using the remuneration rate expected to apply at the time of settlement.
Liabilities recognised in respect of employee benefits which are not expected to be settled within 12-months, are measured as the present value of the estimated future cash outflows to be made by Webster Limited in respect of services provided by employees up to reporting date.
Defined contribution plans – Contributions to defined contribution superannuation plans are expensed when incurred.
Interest income and expense are accrued on a time basis, by reference to the principal outstanding and at the applicable effective interest rates. Funding costs are capitalised and subsequently amortised over the term of the facility.
Depreciation of non-current assets includes the depreciation of biological assets (Walnut Trees) resulting from the adoption of accounting standard AASB 2014-6 as from July 1, 2016.
3. Income Taxes
2017 $’000
2016 $’000
(a) Income tax recognised in profit or loss
Tax (expense)/benefit comprises:
Current tax (expense) (3,796) (1,038)
Adjustments recognised in the current year in relation to the current tax of prior years 13,583 –
Deferred tax (expense)/benefit relating to the origination and reversal of temporary differences (562) 1,923
Total tax benefit (relating to continuing operations) 9,225 885
The prima facie income tax (expense)/benefit on pre-tax accounting (loss)/profit from operations reconciles to income tax benefit in the financial statements as follows:
Profit/(loss) before tax 49,060 (81,554)
Income tax (expense)/benefit calculated at 30% (14,718) 24,466
Non-deductible expenses (6,963) (28,781)
Restatement of tax costs of assets – 5,557
Non assessable gain 17,034 453
Utilisation of previously unrecognised losses 289 –
Change in recognition of (deferred tax asset)/deferred tax liability 12,307 (204)
Under/(over) provision of income tax in previous year 1,080 (606)
Other 196 –
9,225 885
The tax rate used in the above reconciliation is the corporate tax rate of 30% payable by Australian corporate entities on taxable profits under Australian tax law. There has been no change in the corporate tax rate when compared with the previous reporting period.
For
per
sona
l use
onl
y

47
Deferred tax assets and liabilities
2017
Opening balance
$’000
Charged to income
$’000
Charged to equity $’000
Acquisitions/disposals
$’000
Closing balance
$’000
Deferred tax assets:
Provisions 946 1,285 – – 2,231
Other Assets 732 (319) – – 413
Unused tax losses 11,217 (2,217) – – 9,000
12,895 (1,251) – – 11,644
Deferred tax liabilities:
Property, plant & equipment (14,351) (1,908) – (1,476) (17,735)
Financial assets – non receivables – (101) – – (101)
Inventory & biological assets (18,381) 16,118 – – (2,263)
Other (10) 10 – – –
(32,742) 14,119 – (1,476) 20,099
(19,847) 12,868 – (1,476) (8,455)
2016
Opening balance
$’000
Charged to income
$’000
Charged to equity $’000
Other $’000
Closing balance
$’000
Deferred tax assets:
Provisions 574 372 – – 946
Financial assets – receivables 586 (586) – – –
Other 4,314 (3,582) – – 732
Unused tax losses 7,402 3,815 – – 11,217
12,876 19 – – 12,895
Deferred tax liabilities:
Property, plant & equipment (22,662) 8,311 – – (14,351)
Financial assets – non receivables (46) 46 – – –
Inventory & biological assets (10,641) (7,740) – – (18,381)
Other (898) 888 – – (10)
(34,247) 1,505 – – (32,742)
(21,371) 1,524 – – (19,847)
For
per
sona
l use
onl
y

48
For the 15-month period ended 30 September 2017
Notes to the Financial Statements continued
Recognition and measurement
Webster Limited and its wholly-owned Australian resident entities became a tax-consolidated group with effect from 1 December 2010 and are therefore taxed as a single entity from that date. The head entity within the tax-consolidated group is Webster Limited. The members of the tax-consolidated group are identified in note 17. Tax expense/income, deferred tax liabilities and deferred tax assets arising from temporary differences of the members of the tax-consolidated group are recognised in the separate financial statements of the members of the tax-consolidated group using the ‘separate taxpayer within group’ approach by reference to the carrying amounts in the separate financial statements of each entity and the tax values applying under tax consolidation. Any current tax liabilities, current assets and deferred tax assets arising from unused tax losses and relevant tax credits of the members of the tax-consolidated group are recognised by the company (as head entity in the tax-consolidated group).
The directors have implemented a tax sharing agreement and tax funding agreement between members of the consolidated group. On the existence of a tax funding arrangement between the entities in the tax-consolidated group, amounts are recognised as payable to or receivable by the company and each member of the group in relation to the tax contribution amounts paid or payable between the parent entity and the other members of the tax-consolidated group in accordance with the arrangement. Under the terms of the tax funding arrangement, Webster Limited and each of the entities in the tax-consolidated group will agree to pay a tax equivalent payment to or from the head entity, based on the current tax liability or current tax asset of the entity. The tax sharing agreement will provide for the determination of the allocation of income tax liabilities between the entities should the head entity default on its tax payment
obligations or if an entity should leave the tax-consolidated group. The effect of the tax sharing agreement is that each member’s liability for tax payable by the tax consolidated group is limited to the amount payable to the head entity under the tax funding arrangement.
Current tax – Current tax is calculated by reference to the amount of income tax payable or recoverable in respect of the taxable profit or tax loss for the period. We calculate using tax rates and tax laws that have been enacted or substantively enacted by reporting date. Current tax for current and prior periods is recognised as a liability (or asset) to the extent that it is unpaid (or refundable).
Deferred tax – We account for Deferred tax using the balance sheet liability method. Temporary differences are differences between the tax base of an asset or liability and its carrying amount in the balance sheet. The tax base of an asset or liability is the amount attributed to that asset or liability to tax purposes.
In principle, deferred tax liabilities are recognised for all taxable temporary differences. Deferred tax assets are recognised to the extent that it is probable that sufficient taxable amounts will be available against which deductible temporary differences or unused tax losses and tax offsets can be utilised. However, deferred tax assets and liabilities are not recognised if the temporary differences giving rise to them arise from the initial recognition of assets and liabilities (other than as a result of a business combination) that affects neither taxable income nor accounting profit. Furthermore, a deferred tax liability is not recognised in relation to taxable temporary differences arising from goodwill.
Deferred tax liabilities are recognised for taxable temporary differences associated with investments in subsidiaries except where Webster is able to control the reversal of the temporary differences and it is probable that the temporary differences will not reverse in the foreseeable future. Deferred tax assets arising from deductible temporary differences associated with these investments and interests are only recognised to the extent that it is probable that there will be sufficient taxable profits against which to utilise the benefits of the temporary differences and they are expected to reverse in the foreseeable future.
Deferred tax assets and liabilities are measured at the tax rates that are expected to apply to the periods when the asset and liability giving rise to them are realised or settled, based on tax rates (and tax laws) that have been enacted or substantively enacted by reporting date. The measurement of deferred tax liabilities and assets reflects the tax consequences that would follow from the manner in which Webster Limited expects, at the reporting date, to recover or settle the carrying amount of its assets and liabilities.
Deferred tax assets and liabilities are offset when they relate to income taxes levied by the same taxation authority and Webster intends to settle its current tax assets and liabilities on a net basis.
Current and deferred tax for the period –We recognise current and deferred tax as an expense or income in the income statement, except when it relates to items credited or debited directly to equity, in which case the deferred tax is also recognised directly in equity, or where it arises from the initial accounting for a business combination, in which case we take into account in the determination of goodwill or excess.F
or p
erso
nal u
se o
nly

49
4. Remuneration of Auditors
2017 $
2016 $
Auditor of the parent entity
Audit or review of the financial report (i) 425,000 382,000
Taxation services 286,017 47,985
Other services – 62,215
711,017 492,200
Auditor of the subsidiary companies
Bengerang Limited (ii) – 48,000
AGW Funds Management Limited (ii) 22,600 14,000
The auditor of Webster Limited group is Deloitte Touche Tohmatsu.
Other services include services relating to general advice.
(i) Fees for audit services in respect of the 15-month period ended 30 September 2017 are fees incurred in respect of the half year review and the audit for the 15-month
period ended 30 September 2017.
(ii) The 12-month to 30 June 2016 has been restated to include fees for audit services and other services relating to the prior year paid in the 15-month period ended
to 30 September 2017.
For
per
sona
l use
onl
y

50
For the 15-month period ended 30 September 2017
Notes to the Financial Statements continued
5. Trade and Other Receivables
2017 $’000
2016 $’000
Current
Trade receivables 15,321 25,287
Other receivables (Lake Tandou Agreement) 8,000 –
Goods and services tax (GST) recoverable/(payable) 1,272 248
24,593 25,535
The average credit period on sales of goods of the operating divisions within the company is 60 days.
Non-Current
Trade receivables – 2,965
Allowance for doubtful debts – (2,214)
– 751
Ageing of past due but not impaired
61 – 90 days 1,661 69
91 – 120 days 3,605 55
121 + days 239 907
Total 5,505 1,031
Movement in allowance for doubtful debts
Balance at the beginning of the year (2,213) (2,084)
Impairment losses recognised on receivables (1,596) (129)
Amounts written off as uncollectible – –
Balance at the end of the year (3,809) (2,213)
Ageing of impaired
91 – 120 days 771
121 + days 3,038 2,213
Total 3,809 2,213
In determining the recoverability of a trade receivable, the consolidated entity considers any change in the credit quality of the trade receivables from the date credit was initially granted up to the reporting date. The Group has recognised an allowance for doubtful debts against receivables from Managed Investment Scheme (MIS) growers. The non-current trade receivable balance relates to fees owing from MIS investors.
Recognition and measurement
Trade receivables – are recognised initially at fair value and subsequently measured at amortised cost. An allowance for doubtful debts is raised based on a review of outstanding balances at balance date. Bad debts are written off against the allowance account and any other change in the allowance account is recognised in the statement of profit or loss and other comprehensive income.
For
per
sona
l use
onl
y

51
6. Inventories
2017 $’000
2016 $’000
Raw materials
Raw materials at cost 4,163 2,811
Walnut stocks
Walnut stock at cost 12,414 9,091
Cropping stocks
Cropping stock at cost 522 7,275
Cropping preparation – at cost 14,834 31,706
Livestock (Biological asset)
Livestock at fair value 13,662 9,470
Water
Water allocation 1,664 –
47,259 60,353
Recognition and measurement
Inventories are valued at the lower of cost and net realisable value except for walnut and cotton stocks which are measured at fair value less estimated cost to sell at the point of harvest, and subsequently net realisable value under AASB 102 Inventories.
We account for costs incurred in bringing each product to its present location and condition as follows:
� We value walnut stocks in accordance with AASB 141 Agriculture whereby the cost of the non-living (harvested)produce is deemed to be its fair value less cost to sell immediately after it becomes non-living. This valuation takes into account current walnut selling prices and current processing and selling costs.
� We value cotton stocks in accordance with AASB 141 Agriculture whereby the cost of the non-living (harvested produce is deemed to be its fair value less cost to sell immediately after it becomes non-living. This valuation takes into account current cotton selling prices and current processing and selling costs.
� We value livestock stock in accordance with AASB 141 Agriculture whereby its fair value less cost to sell is determined by an independent valuation at each reporting date.
� Costs associated with the preparation for future crop pre biological transformation are held at cost.
7. Other Assets
2017 $’000
2016 $’000
Current
Prepayments 811 500
Development Funding Due – 7,723
811 8,223
The consolidated entity has entered into several On Farm Irrigation Efficiency Programs (OFIEP), with the Commonwealth of Australia and its representatives in relation to the OFIEP pursuant to which funding will be provided to improve the efficiency of irrigation systems on its properties in return for the permanent assignment of selected Water Access Entitlements. Development Funding Due, represents the value of outstanding development works to be undertaken equal to the value of the Permanent Water Entitlements assigned.
For
per
sona
l use
onl
y
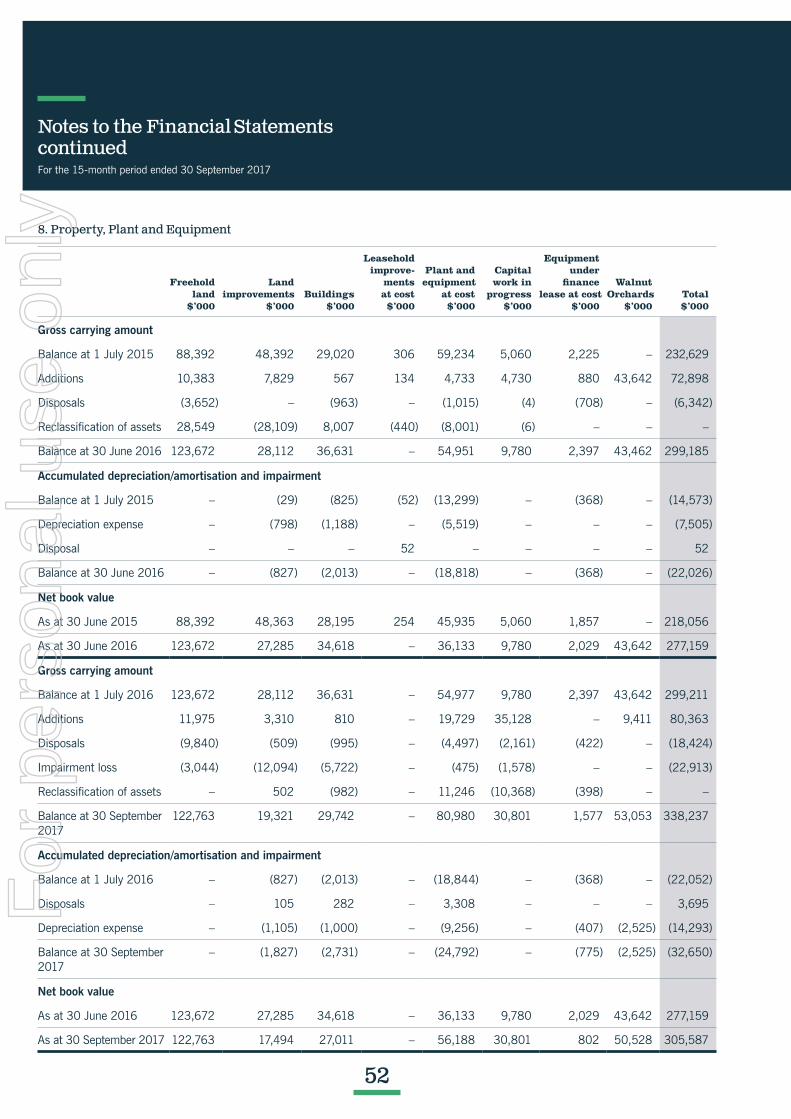
52
8. Property, Plant and Equipment
Freehold land $’000
Land improvements $’000
Buildings $’000
Leasehold improve- ments at cost $’000
Plant and equipment at cost $’000
Capital work in progress $’000
Equipment under finance lease at cost $’000
Walnut Orchards $’000
Total $’000
Gross carrying amount
Balance at 1 July 2015 88,392 48,392 29,020 306 59,234 5,060 2,225 – 232,629
Additions 10,383 7,829 567 134 4,733 4,730 880 43,642 72,898
Disposals (3,652) – (963) – (1,015) (4) (708) – (6,342)
Reclassification of assets 28,549 (28,109) 8,007 (440) (8,001) (6) – – –
Balance at 30 June 2016 123,672 28,112 36,631 – 54,951 9,780 2,397 43,462 299,185
Accumulated depreciation/amortisation and impairment
Balance at 1 July 2015 – (29) (825) (52) (13,299) – (368) – (14,573)
Depreciation expense – (798) (1,188) – (5,519) – – – (7,505)
Disposal – – – 52 – – – – 52
Balance at 30 June 2016 – (827) (2,013) – (18,818) – (368) – (22,026)
Net book value
As at 30 June 2015 88,392 48,363 28,195 254 45,935 5,060 1,857 – 218,056
As at 30 June 2016 123,672 27,285 34,618 – 36,133 9,780 2,029 43,642 277,159
Gross carrying amount
Balance at 1 July 2016 123,672 28,112 36,631 – 54,977 9,780 2,397 43,642 299,211
Additions 11,975 3,310 810 – 19,729 35,128 – 9,411 80,363
Disposals (9,840) (509) (995) – (4,497) (2,161) (422) – (18,424)
Impairment loss (3,044) (12,094) (5,722) – (475) (1,578) – – (22,913)
Reclassification of assets – 502 (982) – 11,246 (10,368) (398) – –
Balance at 30 September 2017
122,763 19,321 29,742 – 80,980 30,801 1,577 53,053 338,237
Accumulated depreciation/amortisation and impairment
Balance at 1 July 2016 – (827) (2,013) – (18,844) – (368) – (22,052)
Disposals – 105 282 – 3,308 – – – 3,695
Depreciation expense – (1,105) (1,000) – (9,256) – (407) (2,525) (14,293)
Balance at 30 September 2017
– (1,827) (2,731) – (24,792) – (775) (2,525) (32,650)
Net book value
As at 30 June 2016 123,672 27,285 34,618 – 36,133 9,780 2,029 43,642 277,159
As at 30 September 2017 122,763 17,494 27,011 – 56,188 30,801 802 50,528 305,587
For the 15-month period ended 30 September 2017
Notes to the Financial Statements continued
For
per
sona
l use
onl
y

53
Recognition and measurement
Land improvements and buildings – After initial recognition the asset is carried at cost less accumulated depreciation and any accumulated impairment losses. Depreciation on buildings is charged to profit or loss.
Plant and equipment, leasehold improvements and equipment under finance lease – are stated at cost less accumulated depreciation and impairment. Cost includes expenditure that is directly attributable to the acquisition of the item. In the event that settlement of all or part of the purchase consideration is deferred, we determine cost by discounting the amounts payable in the future to their present value as at the date of acquisition.
Orchard – During the year Orchard Assets previously classified as Biological Assets have been reclassified as Plant and Equipment in accordance with Accounting Standard AASB 2014 effective from 1 July, 2016. Refer Note 26, Other accounting policies.
Depreciation – is provided on property, plant and equipment, including freehold buildings but excluding land. We calculate depreciation is on a straight-line basis so as to write off the net cost or other revalued amount of each asset over its expected useful life to its estimated residual value. Leasehold improvements are depreciated over the period of the lease or estimated useful life, whichever is the shorter, using the straight-line method. The estimated useful lives, residual values and depreciation method are reviewed at the end of each annual reporting period.
We use the following estimated useful lives in the calculation of depreciation:
Land improvements (years) 5-20
Buildings (years) 4-25
Leasehold improvements (years) 2-20
Plant and equipment (years) 3-25
Orchards (years) 7-27
Leased assets – Leases are classified as finance leases whenever the terms of the lease transfer substantially all the risks and rewards of ownership to the lessee. We classify all other leases as operating leases.
Lease payments are apportioned between finance charges and reduction of the lease obligation so as to achieve a constant rate of interest on the remaining balance of the liability. Finance charges are charged directly against income, unless they are directly attributable to qualifying assets, in which case they are capitalised in accordance with the Webster’s general policy on borrowing costs.
Webster Limited as lessee – Assets held under finance leases are initially recognised at their fair value or, if lower, at amounts equal to the present value of the minimum lease payments, each determined at the inception of the lease. The corresponding liability to the lessor is included in the balance sheet as a finance lease obligation.
Webster Limited as lessor – Purchased assets where Webster Limited is a lessor under operating leases, are carried at cost and depreciated over their useful lives, which vary depending on the class of assets. Operating lease income is recognised on a straight-line basis over the period of the lease unless another systematic basis is more appropriate. Assets leased out under operating leases are included in property, plant and equipment.
Finance lease assets are amortised on a straight-line basis over the estimated useful life of the asset.
Operating lease payments are recognised as an expense on a straight-line basis over the lease term, except where another systematic basis is more representative of the time pattern in which economic benefits from the leased asset are consumed.
Lease incentives – In the event that lease incentives are received to enter into operating leases, such incentives are recognised as a liability. The aggregate benefits of incentives are recognised as a reduction of rental expense on a straight-line basis, except where another systematic basis is more representative of the time pattern in which economic benefits from the leased asset are consumed.
For
per
sona
l use
onl
y

54
9. Intangibles
Goodwill $’000
Licences $’000
Contracts $’000
Permanent Water Rights
$’000Total $’000
Net book value
Balance at 1 July 2015 121,150 100 1,944 231,741 354,935
Amortisation expense – – (125) – (125)
Impairment (96,450) – – – (96,450)
Additions – – – 19,904 19,904
Disposals – – – (11,195) (11,195)
Balance at 30 June 2016 24,700 100 1,819 240,450 267,069
Amortisation expense – – (156) – (156)
Additions 2,565 – – 17,141 19,706
Disposals – – – (46,089) (46,089)
Transfers (1,369) – – 1,369 –
Balance at 30 September 2017 25,896 100 1,663 212,871 240,530
(a) Impairment test for goodwill
Goodwill amounts recognised arose from the purchase of Bengerang Ltd and Tandou Ltd. The goodwill has been allocated to the Agriculture cash-generating unit. Webster test the recoverable amount of the goodwill at least annually or where there is an indication that the asset may be impaired (which is assessed at least each reporting date).
The recoverable amount of the cash generating unit has been determined based on the fair value less costs to dispose which was derived using a discounted cash flow model. Management judgement is required in these valuations to forecast future cash flows and a suitable discount rate to calculate the present value of these future cash flows. The first five years represent financial plans forecast by management with years six to ten applying average assumptions to ensure cash flows in year 10 are sufficiently stable to apply the terminal value. These are:
� A post-tax annual discount rate of 8.9%;
� Annual growth rate of 2.5%
Whilst the Agriculture CGU has a surplus the directors estimate that if EBITDA was to reduce by 2.5% from financial year 2018 across all the forecast periods, it would result in the aggregate carrying amount of the CGU exceeding the recoverable amount by a range of $8 million to $10 million.
(b) Licences
Licences are measured at cost and tested for impairment on an annual basis.
(c) Contracts
Contracts are measured at cost and amortised on a straight-line basis over the term of the contract.
(d) Permanent water rights
The value of permanent water rights is an integral part of land and irrigation infrastructure required to grow both walnuts and annual crops. The fair value of permanent water rights used for impairment testing is supported by the tradeable market value, which at current market prices is higher than the carrying value.
For the 15-month period ended 30 September 2017
Notes to the Financial Statements continued
For
per
sona
l use
onl
y

55
Recognition and measurement
Goodwill – we recognise goodwill arising in a business combination as an asset at the date that control is acquired (the acquisition date). Goodwill is measured as the excess of the sum of the consideration transferred, the amount of any non-controlling interests in the acquiree, and the fair value of the acquirer’s previously held equity interest in the acquiree (if any) over the net of the acquisition-date amounts of the identifiable assets acquired and the liabilities assumed.
If, after reassessment, the Group’s interest in the fair value of the acquiree’s identifiable net assets exceeds the sum of the consideration transferred, the amount of any non-controlling interests in the acquiree and the fair value of the acquirer’s previously held equity interest in the acquiree (if any), the excess is recognised immediately in profit or loss as a bargain purchase gain.
Goodwill is not amortised but is reviewed for impairment at least annually. For the purpose of impairment testing, we allocate goodwill to each of Webster’s cash generating units expected to benefit from the synergies of the combination. Cash-generating units to which goodwill has been allocated are tested for impairment annually, or more frequently when there is an indication that the unit may be impaired. If the recoverable amount of the cash generating unit is less than its carrying amount, the impairment loss is allocated first to reduce the carrying amount of any goodwill allocated to the unit and then to the other assets of the unit pro-rata on the basis of the carrying amount of each asset in the unit. An impairment loss recognised for goodwill is not reversed in a subsequent period.
On disposal of a subsidiary, the attributable amount of goodwill is included in the determination of the profit or loss on disposal.
Contracts – We measure contracts at cost. After initial recognition the asset is carried at cost less accumulated amortisation and any accumulated impairment losses. We amortise contracts on a straight line basis over the term of the contract.
Permanent water rights – we record permanent water rights at cost. Such rights have an indefinite life, and are not depreciated. As an integral component of the land and irrigation infrastructure required to grow walnuts, the carrying value is tested annually for impairment. If events or changes in circumstances indicate impairment, the carrying value is adjusted to take account of any impairment losses.
Licences – are measured at cost and tested for impairment on an annual basis.
Impairment of Assets – At each reporting date, Webster Limited reviews the carrying amounts of its tangible and intangible assets to determine whether there is any indication that those assets have suffered an impairment loss. If any indication exists, we estimate the recoverable amount of the asset in order to determine the extent of the impairment loss (if any). Where the assets do not generate cash flows that are independent from other assets, we estimate the recoverable amount of the cash-generating unit to which the assets belong.
We test goodwill for impairment annually and whenever there is an indication that the asset has been impaired. An impairment of goodwill is not subsequently reversed.
Recoverable amount is the higher of fair value less costs to sell and value in use. In assessing value in use, the estimated future cash flows are discounted to their present value using a pre-tax discount rate that reflects current market assessments of the time value of money and the risks specific to the asset for which the estimate of future cash flows have not been adjusted.
If the recoverable amount of an asset (or cash-generating unit) is estimated to be less than its carrying amount, the carrying amount of the asset (cash-generating unit) is reduced to its recoverable amount.
An impairment loss is recognised in profit or loss immediately, unless the relevant asset is carried at fair value, in which case the impairment loss is treated as a revaluation decrease.
Where an impairment loss is subsequently reversed, the carrying amount of the asset (cash-generating unit) is increased to the revised estimate of its recoverable amount, but only to the extent that the increased carrying amount does not exceed the carrying amount that would have been determined had no impairment loss been recognised for the asset (cash-generating unit) in prior years. A reversal of an impairment loss is recognised in profit or loss immediately, unless the relevant asset is carried at fair value, in which case the reversal of the impairment loss is treated as a revaluation increase.
For
per
sona
l use
onl
y

56
10. Trade and Other Payables
2017 $’000
2016 $’000
Current
Trade payables 14,229 12,794
Goods and services tax (GST) payable – 2,437
14,229 15,231
The average credit period on purchases is 30 days. Interest is charged on a creditor by creditor basis. The consolidated entity has financial risk management policies in place to ensure that all payables are paid within the credit time frame.
Recognition and measurement
Trade and other payables – are recognised when the Webster group becomes obliged to make future payments resulting from the purchase of goods and services. Payables are stated at their amortised cost.
11. Borrowings
Note2017
$’0002016
$’000
(a) Current
At amortised cost
Secured
Bank loans (i) 16,088 43,887
Finance lease liabilities (ii) 246 807
16,334 44,694
(b) Non-Current
At amortised cost
Secured
Bank loans (i) 102,635 150,000
Finance lease liabilities (ii) 579 1,863
Unsecured
Non-redeemable cumulative preference shares (iii) 394 394
103,608 152,257
(i) Secured by mortgage over property and floating charge over assets, the value of which exceeds the loan.
(ii) Secured by assets leased, the value of which exceeds the lease liability.
(iii) 394,000 9% non-redeemable cumulative preference shares at a par value of $1.00 per share.
For the 15-month period ended 30 September 2017
Notes to the Financial Statements continued
For
per
sona
l use
onl
y

57
Credit facilities – At 30 September 2017 the Webster group had a total of $220.0 million (30 June 2016: $250 million) committed credit facilities with external financial institutions. These facilities have fixed maturity dates as follows: $70 million in July 2018, $150 million in January 2022. As at 30 September 2017 $100.7 million of the facilities available to Webster was undrawn.
Recognition and measurement
Borrowings – are recorded initially at fair value, net of transactions costs. Subsequent to initial recognition, borrowings are measured at amortised cost with any difference between the initial recognised amount and the redemption value being recognised in profit and loss over the period of the borrowing using the effective interest rate method.
12. Provisions
Note2017
$’0002016
$’000
Current
Employee benefits 1,430 1,296
Quality Claims 153 –
1,583 1,296
Non-Current
Employee benefits 85 374
85 374
1,668 1,670
Movements in provisions
Balance at 1 July 2016 1,670 2,658
Reductions arising from payments/other sacrifices of future economic benefits (2) (988)
Balance at 30 September 2017 1,668 1,670
Recognition and measurement
Provisions are recognised when the Group has a present obligation (legal or constructive) and, as a result of a past event, it is probable that the Group will be required to settle the obligation, and a reliable estimate can be made of the amount of obligation.
The amount recognised as a provision is the best estimate of the consideration required to settle the present obligation at reporting date, taking into account the risks and uncertainties surrounding the obligation. Where a provision is measured using the cash flows estimated to settle the present obligation, its carrying amount is the present value of those cash flows.
When some or all of the economic benefits required to settle a provision are expected to be recovered from a third party, the receivable is recognised as an asset if it is virtually certain that recovery will be received and the amount of the receivable can be measured reliably.
Employee benefits provisions is made for benefits accruing to employees in respect of wages and salaries, annual leave, long service leave and other employee obligations when it is probable that settlement will be required and they are capable of being reliably measured. Provisions made in respect of employee benefits expected to be settled within 12-months are measured at their nominal values using the remuneration rate expected to apply at the time of settlement.
For
per
sona
l use
onl
y

58
13. Other Liabilities
2017 $’000
2016 $’000
Current
Commonwealth grants received 1,433
1,433 –
14. Issued Capital
Note2017
$’0002016
$’000
361,245,163 (2016: 350,745,163) fully paid ordinary shares (i) 477,865 462,844
477,865 462,844
Changes to the then Corporations Law abolished the authorised capital and par value concept in relation to share capital from 1 July 1998. Therefore, the company does not have a limited amount of authorised capital and issued shares do not have a par value.
2017 2016
Note Number $’000 Number $’000
(i) Fully paid ordinary share capital
Balance at 1 July 2016 350,745,163 462,844 347,705,383 459,468
Shares issued (ii) 10,500,000 15,021 3,039,780 3,376
Balance at 30 September 2017 361,245,163 477,865 350,745,163 462,844
Fully paid ordinary shares carry one vote per share and carry the right to dividends.
(ii) Share capital issued during the 15-month period ended 30 September 2017
9,000,000 ordinary shares were issued during the 15-month period ended 30 September 2017 (March 2017) for the acquisition of shares in Motspur Park
1,500,000 ordinary shares were issued during the 15-month period ended 30 September 2017 for the Executive Long-Term Incentive Plan
For the 15-month period ended 30 September 2017
Notes to the Financial Statements continued
For
per
sona
l use
onl
y

59
15. Earnings/(loss) per share
Cents per share
Note 2017 2016
Basic earnings/(loss) per share (a) 16.44 (23.28)
Diluted earnings/(loss) per share (b) 16.44 (23.28)
(a) Basic earnings/(loss) per share
The earnings and weighted average number of ordinary shares used in the calculation of basic earnings/(loss) per share are as follows:
2017 $’000
2016 $’000 2017 2016
Earnings used in the calculation of basic earnings/(loss) per share
58,284 (80,669)
Weighted average number of ordinary shares for the purposes of basic earnings/(loss) per share
354,523,062 346,510,396
(b) Diluted earnings/(loss) per share
The earnings and weighted average number of ordinary and potential ordinary shares used in the calculation of diluted earnings/(loss) per share are as follows:
2017 $’000
2016 $’000 2017 2016
Earnings used in the calculation of diluted earnings/(loss) per share
58,284 (80,669)
Weighted average number of ordinary and potential ordinary shares for the purpose of diluted earnings/(loss) per share
354,523,062 346,510,396
For
per
sona
l use
onl
y

60
16. Dividends
2017 2016
Cents per share
Total $’000
Cents per share
Total $’000
(a) Dividends paid during the year
Fully paid ordinary shares
Final Dividend – FY 2016: paid October 2016, (FY2015 paid October 2015)
1.0 3,508 1.0 3,438
3,508 3,438
(b) Dividends proposed
The Directors have declared a fully franked 3.0 cent per share dividend on ordinary shares for the 15-month period ended 30 September 2017. The Directors have declared an unfranked 9.0 cent per share dividend on cumulative preference shares paid on 24 March 2017.
2017 $’000
2016 $’000
(c) Franking credits balance
Franking account balance at 1 July 2016 1,281 2,908
Tax paid/(refunded) 940 (124)
Dividends paid (1,474) (1,503)
Net Franking credits available at 30 September 2017 747 1,281
Impact on franking account balance of dividends not recognised – (1,503)
For the 15-month period ended 30 September 2017
Notes to the Financial Statements continued
For
per
sona
l use
onl
y

61
17. Subsidiaries
Country of Incorporation Ownership Interest
2017 %
2016 %
Parent Entity
Webster Limited Australia
Controlled Entities
AGW Finance Pty Ltd Australia 100 100
AGW Funds Management Ltd Australia 100 100
AGW Walnuts Pty Ltd Australia 100 100
Bengerang Ltd Australia 100 100
Clements and Marshall Pty Ltd Australia 100 100
Clements Marshall Consolidated Limited Australia 100 100
Cygnet Canning Company Pty Ltd Australia 100 100
Motspur Park Pty Limited Australia 100 –
Tandou Ltd Australia 100 100
Walnuts Australia Pty Ltd Australia 100 100
All the above entities are audited by Deloitte Touche Tohmatsu.
All entities carry on business in Australia.
These wholly-owned controlled entities have obtained approval under the ASIC Class Order granting relief from the requirement to produce audited financial reports and are party to a cross guarantee.
The parent entity has entered into a range of cross guarantees and registered mortgage debentures over assets and capital of Webster Limited, which include the above entities other than AGW Funds Management Ltd, under its banking arrangements with ANZ and Rabo Bank.
For
per
sona
l use
onl
y

62
(a) Financial performance
The following statement of financial performance represents the consolidated financial position of subsidiaries of Webster Ltd (Parent entity) and are party to the deed of cross guarantee. AGW Funds Management Ltd is not a party to the cross guarantee.
2017 $’000
2016 $’000
Revenue 166,087 119,782
Cost of sales (136,318) (91,655)
Gross Profit 29,769 28,127
Other income 104,495 56,406
Distribution expenses (3,552) (3,902)
Marketing expenses (425) (671)
Operational expenses (40,803) (50,154)
Administration expenses (1,323) (1,807)
Finance costs (147) (1,750)
Impairment loss (29,268) –
Other expenses (56) (323)
Profit before income tax expense 58,690 25,926
Income tax (expense)/benefit – (81)
Total comprehensive income for the period 58,690 25,845
For the 15-month period ended 30 September 2017
Notes to the Financial Statements continued
For
per
sona
l use
onl
y

63
(b) Financial position
The following statement of financial position represents the consolidated financial position of subsidiaries of Webster Ltd (Parent entity) and are party to the deed of cross guarantee. AGW Funds Management Ltd is not a party to the cross guarantee.
2017 $’000
2016 $’000
Current Assets
Cash and cash equivalents 6,489 2,441
Trade and other receivables 22,613 18,012
Inventories 47,259 60,353
Other assets 249 8,223
Total current assets 76,610 89,029
Non-Current Assets
Property, plant and equipment 299,366 277,313
Investments 78 52
Intangibles – water 170,745 199,693
Total non-current assets 470,189 477,058
Total Assets 546,799 566,087
Current Liabilities
Trade and other payables 11,944 13,199
Borrowings 246 807
Provisions 1,021 817
Other liability 1,433 –
Total current liabilities 14,644 14,823
Non-Current Liabilities
Borrowings 579 1,863
Net deferred tax liability 7,740 7,740
Provisions 64 339
Intercompany Loans 123,259 220,901
Total non-current liabilities 131,642 230,843
Total Liabilities 146,286 245,666
Net Assets 400,513 320,421
Equity
Issued capital 240,200 236,069
Reserves 42,909 27,347
Retained earnings 117,404 57,005
Total Equity 400,513 320,421
For
per
sona
l use
onl
y

64
18. Commitments for Expenditure
Note2017
$’0002016
$’000
(a) Lease commitments
Non-cancellable operating leases (i)
Not longer than one year 187 130
Longer than one year and not longer than five years 95 227
282 357
Finance lease liabilities (ii)
Not longer than one year 273 807
Longer than one year and not longer than five years 608 1,863
Minimum lease payments 881 2,670
Less: Future finance charges (56) (139)
Less: Goods and services tax (GST) – (218)
Finance lease liabilities 825 2,313
Present value of minimum future lease payments:
Not longer than one year 274 699
Longer than one year and not longer than five years 565 1,614
839 2,313
(i) Operating lease commitments relate to properties and equipment with lease terms of up to 10 years.
(ii) Finance lease liabilities relate to various plant and equipment with lease terms of up to 5 years.
(b) Capital expenditure commitments
Not longer than one year 56,891 16,721
Longer than one year and not longer than five years – –
Longer than five years – –
56,891 16,721
For the 15-month period ended 30 September 2017
Notes to the Financial Statements continued
For
per
sona
l use
onl
y

65
19. Segment Information
(a) Segments
Following the purchase of the Kooba Ag assets and the acquisition of Bengerang Ltd and Tandou Ltd, the group manages and reports its business operations under two main reportable segments, Agriculture and Horticulture. The Agriculture segment products are primarily annual row crops including cotton, wheat and maize as well as livestock, where as the Horticulture segment pertains to tree crops which are currently walnuts.
(b) Segment revenue and results
The following is an analysis of the Group’s revenue and results from continuing operations by reportable segment.
Segment Revenue and Other Income Segment Results
2017 $’000
2016 $’000
2017 $’000
2016 $’000
Agriculture 193,590 136,108 45,658 (71,628)
Horticulture 82,256 39,856 18,850 2,202
Total for continuing operations 275,846 175,964 64,508 (69,426)
Unallocated income/(expense) (85) 97
Corporate and directors costs (7,388) (5,298)
Finance costs (7,976) (6,927)
Profit/(loss) before tax (continuing operations) 49,059 (81,554)
Segment revenue reported above represents revenue generated from external customers. There were no inter-segment sales in the current year (2016: nil).
The accounting policies of the reportable segments are the same as the Group’s accounting policies.
(c) Segments assets and liabilities
2017 $’000
2016 $’000
Assets
Agriculture 424,377 520,850
Horticulture 144,893 120,423
Total segment assets 569,270 641,273
Unallocated 65,030 10,320
Consolidated total assets 634,300 651,593
Liabilities
Agriculture 34,958 23,827
Horticulture 9,830 6,085
Total segment liabilities 44,788 29,912
Unallocated 104,735 204,825
Consolidated total liabilities 149,523 234,737
For
per
sona
l use
onl
y

66
(d) Information on geographical areas
The consolidated entity’s goods are sold in both domestic and international markets. The following table details the consolidated entities revenues from continuing operations and non-current assets by geographical location.
Revenue from Customers Non-Current Assets
2017 $’000
2016 $’000
2017 $’000
2016 $’000
Australia 236,582 162,832 546,195 545,032
Europe 30,889 10,909 – –
Other 8,375 2,223 – –
275,846 175,964 546,195 545,032
20. Notes to the Cash Flow Statement
2017 $’000
2016 $’000
(a) Reconciliation of cash and cash equivalents
For the purpose of the cash flow statement, cash and cash equivalents include cash on hand and in banks and investments in money market instruments, net of outstanding bank overdrafts. Cash and cash equivalents at the end of the 15-month period ended 30 September 2017 as shown in the cash flow statement is reconciled to the related items in the balance sheet as follows:
Cash and cash equivalents 15,442 12,450
15,442 12,450
(b) Non-cash financing and investing activities
During the 15-month period ended 30 September 2017, the consolidated entity did not acquire equipment via finance leases.
(c) Financing facilities
Secured bank loan rolling facilities
– Amount used (i) 119,272 193,887
– Amount unused 100,728 56,113
220,000 250,000
(i) Amount used is gross of bank establishment fees.
(d) Cash balances not available for use
There were no cash balances unavailable for use at balance date.
For the 15-month period ended 30 September 2017
Notes to the Financial Statements continued
For
per
sona
l use
onl
y

67
(e) Reconciliation of profit/(loss) for the period to net cash flows from operating activities
2017 $’000
2016 $’000
Profit/(loss) for the period 58,284 (80,669)
Depreciation of non-current assets 14,293 7,505
Amortisation of non-current assets 156 483
Adjustments relating to agricultural/biological assets (28,409) (49,039)
Repayment of foreign exchange forward contract 259 400
Net profit relating to non-current assets (2,172) (52)
Profit on the sale of water rights (23,497) (3,498)
Impairment of goodwill – 96,450
Impairment of property, plant and equipment 22,913 –
Interest income received or receivable (97) (97)
Movements in working capital
� Decrease/(increase) in receivables 1,694 10,770
� Decrease/(increase) in inventories 41,503 70,138
� Decrease/(increase) in other assets (814) 1,729
� Increase/(decrease) in payables (1,002) (11,713)
� Increase/(decrease) in provisions 2,756 50
� Increase/(decrease) in tax balances (11,392) (2,144)
Net cash flows from/(used) in operating activities 74,475 40,313
For
per
sona
l use
onl
y

68
21. Related Party Disclosures
(a) Key management personnel compensation
The aggregate compensation of the key management personnel of the consolidated entity and the company is set out below:
2017 $’000
2016 $’000
Short-term employee benefits 1,938 1,606
Long-term employee benefits 218 109
Post-employment benefits 266 130
Termination benefits – 556
2,422 2,401
(b) Transactions with key management personnel
During the 15-month period ended 30 September 2017, directors and their director-related entities, and executives purchased goods, which were domestic or trivial in nature, from the Company on the same terms and conditions available to other employees and customers. The Company entered into management agreements with Australian Food and Fibre Ltd (pursuant to the purchase of the Kooba Aggregation, Bengerang Ltd and Tandou Ltd) a company in which Mr Joe Robinson is an associate. The management agreement was for a 2 year term expiring 30 June 2017 with an annual fee of $550,000 plus bonus incentives based on performance to a maximum potential of $500,000. The agreement was renewed on July 1, 2017 with an annual fee of $300,000 plus bonus incentives based on performance to a maximum potential of $500,000. Australian Food and Fibre also incurred expenses on behalf of the Company and were reimbursed at cost for those expenses amounting to $854,760. The Company entered into an agreement with Corrigan Air, a company which Mr Christopher Corrigan and Mr Joseph Corrigan are an associate. The current agreement is for the provision of the use of light aircraft to transport management to its properties. The arrangement is charged at cost which amounted to $272,140 for the 15-month period ended 30 September, 2017.
The Company supplied walnuts to Langdon Ingredients, Bakery Craft and The Natural Foods Trading Company, all companies which Mr Chris Langdon is an associate. The goods were supplied at arms length on normal commercial terms. The value of goods supplied was $326,893 for the 15-month period ended 30 September 2017.
Other than the above, and contracts of employment, no other key management personnel have entered into a contract with the Company during the financial period.
(b) Equity interests in related parties
Details of percentage of ordinary shares held in controlled entities are disclosed in note 17 to the financial statements.
(c) Parent entity
The parent entity in the consolidated entity is Webster Limited. The ultimate Australian parent entity is Webster Limited. There are no contingent liabilities.
For the 15-month period ended 30 September 2017
Notes to the Financial Statements continued
For
per
sona
l use
onl
y

69
22. Parent Entity Disclosures
2017 $’000
2016 $’000
(a) Financial Position
Assets
Current assets 10,644 9,268
Non-current assets 76,006 295,135
Total assets 86,650 304,403
Liabilities
Current liabilities 22,833 47,497
Non-current liabilities (14,526) 162,539
Total liabilities 8,307 210,036
Equity
Issued capital 237,615 226,725
Reserves (44,290) (26,976)
Retained Earnings (114,982) (105,382)
Total Equity 78,343 94,367
(b) Financial Performance
Loss for the period (4,270) (106,105)
Other comprehensive income/(loss) – –
Total comprehensive loss (4,207) (106,105)
23. Business Combinations
(a) Subsidiaries acquired
Principal Activity Date Acquired
Proportion of shares acquired
%
Consideration transferred
$’000
Motspur Park Pty Limited Horticulture 23/3/17 100 23,100
Motsur Park Pty Limited was acquired to continue the expansion of the Group’s activities in horticulture.
(b) Consideration transferred
$’000
Cash 10,000
Equity Issued 13,011
Total 23,011
Acquisition related costs have been excluded from the consideration.
For
per
sona
l use
onl
y

70
(c) Assets acquired and liabilities recognised at the date of acquisition
$’000
Non-current assets
Property 5,251
Plant and Equipment 7,846
Water Entitlements 8,864
Non-current liability
Deferred Tax Liability (1,515)
Total 20,446
(d) Goodwill arising on acquisition
$’000
Consideration Transferred 23,011
Less Fair value of identifiable net assets (20,446)
Goodwill arising on consolidation 2,565
Goodwill arose in the acquisition of Motspur Park Pty Limited because consideration paid for the combination effectively included amounts in relation to the benefits of expected synergies and revenue growth. These benefits are not recognised separately from goodwill because they do not meet the recognition criteria for identifiable intangible assets.
None of the goodwill arising through acquisition is expected to be tax deductible.
(e) Net Cash Outflow on acquisition of subsidiaries
$’000
Consideration paid in cash 10,000
Less: cash and cash equivalent balances acquired –
10,000
(f) Impact of acquisitions on the results of the Group
Included in the profit for the year is a loss of $380,000 attributable to the additional business generated by Motspur Park. There was no revenue attributable from orchard operations for the period to 30 September, 2017. There was revenue of $8,783,000 and profit of $3,522,000 realised from the purchase of the walnuts by the Group from Motspur Park at the time of acquisition.
Had these business combinations been effected at 1 July 2017, the Revenue of the Group from Orchard operations at Motspur Park would have been $8,783 and the profit for the period for a financial year would have been $3,233. The directors consider these proforma numbers to represent an approximate measure of the performance of the combined group on an annualised, basis and to provide a reference point for comparison in future periods.
In-determining the ‘pro-forma’ revenue and profit of the Group had Motspur Park been acquired at the beginning of the current year, the directors have calculated depreciation of plant and equipment acquired on the basis of the fair values arising in the initial accounting for the business combination rather than the carrying amounts recognised in the pre-acquisition financial statements.
For the 15-month period ended 30 September 2017
Notes to the Financial Statements continued
For
per
sona
l use
onl
y

71
24. Financial Instruments
(a) Capital risk management
The Group manages its capital to ensure that entities in the group will be able to continue as a going concern while maximising the return to stakeholders through the optimisation of the debt and equity balance.
The Group’s overall strategy remains unchanged from 30 June 2016.
The capital structure of the Group consists of debt, which includes the borrowings disclosed in note 11, cash and cash equivalents and equity attributable to equity holders of the parent, comprising issued capital as disclosed in note 14, reserves and retained profits.
The Group operates globally, primarily through subsidiary companies established in the markets in which the Group trades. None of the Group’s entities are subject to externally imposed capital requirements.
Gearing ratio
The Group’s Board of Directors reviews the capital structure on an annual basis. As a part of this review the committee considers the cost of capital and the risk associated with each class of capital. The Board of Directors of the Group in considering its overall capital structure takes into account the payment of dividends, new share issues as well as the issue of new debt or the redemption of existing debt.
The gearing ratio at year end was as follows:
Note2017
$’0002016
$’000
Financial assets
Debt (i) 119,942 196,951
Cash and cash equivalents (15,442) (12,450)
Net debt 104,500 184,501
Equity (ii) 484,777 418,018
Net debt to equity ratio 21.5% 44%
(i) Debt is defined as long- and short-term borrowings, as detailed in note 11
(ii) Equity includes all capital and reserves.
(b) Categories of financial instruments
2017 $’000
2016 $’000
Financial assets
Cash and cash equivalents 15,442 12,450
Loans and receivables 24,593 26,287
Financial liabilities
Trade and other payables 14,229 15,231
Borrowings 119,942 196,951
For
per
sona
l use
onl
y

72
(c) Financial risk management objectives
The Group’s key management personnel co-ordinate access to domestic and international financial markets and manage the financial risks relating to the operations of the consolidated entity.
The Group does not enter into or trade financial instruments, including derivative financial instruments, for speculative purposes.
The Group’s activities expose it primarily to the financial risks of changes in foreign currency exchange rates and interest rates. The Group enters into forward foreign exchange contracts to hedge the exchange rate risks arising on the export of produce to Europe and Asia.
(d) Market risk
The Group’s activities expose it primarily to the financial risks of changes in foreign currency exchange rates. The Group enters into derivative financial instruments to manage its exposure to foreign currency risk, including:
� Forward foreign exchange contracts to hedge the exchange rate risk arising on foreign sales or exports
There has been no change to the Group’s exposure to market risks or the manner in which these risks are managed and measured.
(e) Foreign currency risk management
The Group undertakes certain transactions denominated in foreign currencies, hence exposure to exchange rate fluctuations arise. Exchange rate exposures are managed within approved policy parameters utilising forward foreign exchange contracts and currency swap agreements. The Group’s exposure to foreign currency risk at balance date was as follows, based on notional amounts
2017
USD $’000
EUR $’000
GBP $’000
JPY $’000
Trade and other receivables 7,047 4,063 – –
Cash at bank 4,304 503 – 55
Trade and other payables (220) – – –
Net Exposure 11,131 4,566 – 55
2016
USD $’000
EUR $’000
GBP $’000
JPY $’000
Trade and other receivables 2,770 2,483 – –
Cash at bank 447 880 1 5
Trade and other payables – – – –
Net Exposure 3,217 3,363 1 5
For the 15-month period ended 30 September 2017
Notes to the Financial Statements continued
For
per
sona
l use
onl
y

73
Forward foreign exchange contracts
It is the policy of all entities in the Group to enter into forward foreign exchange contracts to cover up to 100% of the exposure generated by specific foreign currency payments and receipts. The Group also enters into forward foreign exchange contracts to manage the risk associated with anticipated horticultural export transactions. A progressive cover strategy is adopted from the time of budgeting through to harvest when up to 90% of exposure is hedged.
There were no outstanding forward foreign exchange contracts at the reporting date.
Foreign exchange sensitivity analysis
The following table details the Group’s sensitivity to a 10% increase and decrease in the Australian dollar against the relative currency. 10% is the sensitivity rate used as it represents management’s assessment of the possible change in foreign exchange rates. The sensitivity analysis includes outstanding foreign currency derivatives and adjusts their fair value at the year end for a 10% change in foreign currency rates. A positive number indicates an increase in other equity where the Australian Dollar strengthens against the respective currency. For a weakening of the Australian Dollar against the respective currency.
2017 2016
+10% $’000
-10% $’000
+10% $’000
-10% $’000
Other comprehensive income
– Euro – – – –
– United States Dollar – – – –
– – – –
2017 2016
+10% $’000
-10% $’000
+10% $’000
-10% $’000
Profit & Loss
– Euro (590) 721 (306) 374
– United States Dollar (1,281) 1,566 (292) 357
(1,871) 2,287 (598) 731
There were no outstanding forward foreign exchange contracts at the reporting date (2016: nil).
(f) Interest rate risk management
The company and the Group are exposed to interest rate risk as it borrows funds at both fixed and floating interest rates. This risk is managed by maintaining an appropriate mix between fixed and floating rate borrowings. The company and Group’s exposures to interest rates on financial assets and financial liabilities are detailed in the maturity profile of financial instruments section of this note.
Interest rate sensitivity analysis
The sensitivity analyses below have been determined based on the exposure to interest rates for both derivative and non-derivative instruments at the reporting date and the stipulated change taking place at the beginning of the financial year and held constant throughout the reporting period. A 100 basis point increase or decrease is used when reporting interest rate risk internally to key management personnel and represents management’s assessment of the possible change in interest rates.
For
per
sona
l use
onl
y

74
Notes to the Financial Statements continuedFor the 15-month period ended 30 September 2017
At reporting date, if interest rates had been 100 basis points higher or lower and all other variables were held constant, the impact on the group is as follows:
Effect on Profit and Loss
2017 2016
+1% -1% +1% -1%
Financial assets
Cash & cash equivalents 193 (90) 534 (534)
Financial liabilities
Borrowings (1,500) 4,452 (1,970) 1,970
The following tables detail the Group’s expected maturity for its non-derivative financial assets and contractual maturity for non-derivative financial liabilities.
Weighted Average
Effective Rate %
Less than 1 year $’000
1 to 5 years $’000
More than 5 years
$’000Total $’000
2017
Financial Assets
Non-interest bearing
Trade and other receivables – 24,593 – – 24,593
Variable interest rate
Cash and cash equivalents 0.47 15,442 – – 15,442
40,035 – – 40,035
Financial Liabilities
Non-interest bearing
Trade and other payables – 14,229 – – 14,229
Other financial liabilities
Variable interest rate
Bank loans 2.97 16,088 102,635 – 118,723
Fixed interest rate maturity
Finance lease liabilities 3.51 246 579 – 825
Cumulative non-redeemable preference shares*
9.00 35 142 394 571
30,598 103,356 394 134,348
For
per
sona
l use
onl
y

75
Weighted Average
Effective Rate %
Less than 1 year $’000
1 to 5 years $’000
More than 5 years
$’000Total $’000
2016
Financial Assets
Non-interest bearing
Trade and other receivables – 25,535 752 – 26,287
Variable interest rate
Cash and cash equivalents 1.40 12,450 – – 12,450
37,985 752 – 38,737
Financial Liabilities
Non-interest bearing
Trade and other payables – 15,231 – – 15,231
Other financial liabilities – 620 – – 620
– – – –
Variable interest rate
Bank loans
2.83 44,694 152,257 – 196,951
Variable interest rate
Bank loans
Fixed interest rate maturity
Finance lease liability 4.60 807 1,863 – 2,670
Cumulative non-redeemable preference shares*
9.00 35 142 394 571
61,387 154,262 394 216,043
* Amounts disclosed in more than 5 years represent principal amounts. There is no expiration term.
For
per
sona
l use
onl
y
76
(g) Credit risk management
Credit Risk refers to the risk that a counterparty will default on its contractual obligations resulting in financial loss to the Group. The Group undertakes credit check prior to dealing with any new counterparty and obtains sufficient collateral or other security, where appropriate, as a means of mitigating the risk of financial loss from defaults. The Group exposure and the credit ratings of its counterparties are continuously monitored and the aggregate value of transactions concluded are spread amongst approved counterparties.
Trade accounts receivable consist of a large number of customers, spread across diverse industries and geographical locations. Ongoing credit evaluation is performed on the financial condition of accounts receivable and, where appropriate, credit guarantee insurance cover is purchased.
The Group does not have any significant credit risk exposure to any single counterparty or any group of counterparties having similar characteristics. The credit risk on liquid funds and derivative financial instruments is limited because the counterparties are banks with high credit-ratings assigned by international credit rating agencies.
The carrying amount of financial instruments recorded in the financial statements, net of any allowances for losses, represent the group’s maximum exposure to credit risk without taking account of the value of any collateral obtained.
(h) Fair value of financial instruments
The directors consider that the carrying amount of financial assets and financial liabilities recorded in the financial statements approximate their fair value.
The fair values of financial assets and financial liabilities are determined as follows:
� The fair value of financial assets and financial liabilities with standard terms and conditions and traded on active liquid markets are determined with reference to quoted market prices.
� The fair value of other financial assets and financial liabilities are determined in accordance with generally accepted pricing models based on discounted cash flow analysis.
� The fair value of derivative instruments, included in hedging assets and liabilities, are calculated using quoted prices. Where such prices are not available use is made of discounted cash flow analysis using the applicable forward rates and yield curves for the duration of the instruments.
Some of the Group’s financial assets and financial liabilities are measured at fair value are grouped into Levels 1 to 3 based on the degree to which the fair value is observable.
� Level 1 fair value measurements are those derived from quoted prices (unadjusted) in active markets for identical assets or liabilities.
� Level 2 fair value measurements are those derived from inputs other than quoted prices included within Level 1 that are observable for the asset or liability, either directly (as prices) or indirectly (derived from prices).
� Level 3 fair value measurements are those derived from valuation techniques that include inputs for the asset or liability that are not based on observable market data (unobservable inputs).
There were no financial assets and financial liabilities measured at fair value that were outstanding at the end of the reporting period.
(i) Liquidity risk management
The Group manages liquidity risk by maintaining adequate reserves, banking facilities and reserve borrowing facilities by continually monitoring forecasts and actual cash flows and matching the maturity profiles of financial assets and liabilities. The following tables detail the contractual maturity (including future interest) for non-derivative financial liabilities. The tables have been drawn up based on the undiscounted cash flows of liabilities based on the earliest date on which the Group earned or required to pay.
The following table details the Group’s liquidity analysis for its derivative financial instruments. The table has been drawn up based on the undiscounted contractual net cash inflows and outflows on derivative instruments that settle on a net basis, and the undiscounted gross inflows and outflows on those derivatives that require gross settlement.
The following tables detail the Group’s expected maturity for its non-derivatived financial assets and contractual maturity for non-derivative financials.
Notes to the Financial Statements continuedFor the 15-month period ended 30 September 2017
For
per
sona
l use
onl
y

77
Weighted Average
Effective Rate %
Less than 1 year $’000
1 to 5 years $’000
More than 5 years
$’000Total $’000
2017
Financial Liabilities
Non-interest bearing
Trade and other payables – 14,229 – – 14,229
Variable interest rate
Bank loans 2.97 18,322 111,975 – 130,297
Fixed interest rate maturity
Finance lease liabilities 204 579 – 783
Cumulative non-redeemable preference shares*
9.00 35 142 394 571
32,790 112,696 394 145,880
Weighted Average
Effective Rate %
Less than 1 year $’000
1 to 5 years $’000
More than 5 years
$’000Total $’000
2016
Financial Liabilities
Non-interest bearing
Trade and other payables – 15,231 – – 15,231
Other financial liabilities 620 – – 620
Variable interest rate –
Bank loans 1.88 48,808 152,428 – 201,236
Fixed interest rate maturity
Finance lease liabilities 4.60 807 1,863 – 2,670
Cumulative non-redeemable preference shares*
9.00 35 142 394 571
65,501 154,433 394 220,328
* Amounts disclosed in more than 5 years represent principal amounts. There is no expiration term.
For
per
sona
l use
onl
y

78
Recognition and measurement
Webster enters into a variety of derivative financial instruments to manage our exposure to foreign exchange rate risks and interest rate risk, including forward foreign exchange contracts and interest rate swaps.
Derivatives are initially recognised at fair value on the date a derivative contract is entered into and are subsequently remeasured to their fair value at each reporting date. The resulting gain or loss is recognised in profit immediately, unless the derivative is designated and effective as a hedging instrument, in which event the timing of the recognition in profit and loss depends on the nature of the hedge relationship.
Webster designates certain derivatives as hedges of highly probable forecast transactions (cash flow hedges).
Cash flow hedge – The effective portion of changes in the fair value of derivatives that are designated and qualify as cash flow hedges is deferred in equity. The gain or loss relating to the ineffective portion is recognised immediately in profit and loss.
Amounts deferred in equity are recycled in profit and loss in the period when the hedged item is recognised in profit or loss. However, when the forecast transaction that is hedged results in the recognition of a non-financial asset or non-financial liability, the gains and losses previously deferred in equity are transferred from equity and included in the initial measurement of the cost of the asset or liability.
We discontinue hedge accounting when Webster Limited revokes the hedging relationship. The hedge instrument expires or is sold, terminates, or exercised, or no longer qualifies for hedge accounting. Any cumulative gain or loss at that time remains in equity and is recognised when the forecast transaction is ultimately recognised in profit and loss. When a forecast transaction is no longer expected to occur, the cumulative gain or loss that was deferred in equity is recognised immediately in profit and loss. When the Group revokes the hedging relationship, the hedge instrument expires or is sold, terminated, or exercised, or no longer qualifies for hedge accounting. Any cumulative gain or loss at that time remains in equity and is recognised when the forecast transaction is ultimately recognised in profit or loss. When a forecast transaction is no longer expected to occur, the cumulative gain or loss that was deferred in equity is recognised immediately in profit or loss.
Derivatives that do not qualify for hedge accounting – Certain derivative instruments do not qualify for hedge accounting. Changes in the fair value of any derivative instruments that do not qualify for hedge accounting are recognised immediately in profit and loss.
25. Events after the reporting period
There have been no other matters or circumstances, other than that referred to in the financial statements or notes thereto, that have arisen since 30 September 2017 that have significantly affected, or may significantly affect the operations of the Group, the results of those operations, or the state of affairs of the Group in future financial years.
26. Other accounting policies
Cash and cash equivalents – Cash comprises cash on hand and demand deposits. Cash equivalents are short-term, highly liquid investments that are readily convertible to known amounts of cash and which are subject to an insignificant risk of changes in value and have a maturity of three months or less at the date of acquisition. Bank overdrafts are shown within borrowings in current liabilities in the balance sheet.
Biological assets – Walnut Trees are classified as Property Plant and Equipment and are valued in accordance with AASB 141 Agriculture. Up until 30 June 2016 the Biological Assets were valued in accordance with AASB 141 Biological Assets. The values of the Biological Assets at 30 June 2016 have been adopted as the value for Property Plan and Equipment from 1 July 2016. All further additions to the Walnut Orchards will be valued at cost and will commence depreciating from the year they bear their first commercial crop.
Growing Crop – We value the growing walnut crop in accordance with AASB 141 Agriculture. This valuation takes into account current selling prices and current growing, processing and selling costs. The calculated crop value is then discounted to take into account that it is only partly developed, and then further discounted by a suitable factor to take into account the agricultural risk until crop maturity. Where little biological transformation has occurred in the growing crop, cost is used as an estimate of fair value.
The fair value of walnuts and cotton harvested during the period and recognised in revenue is determined as the fair value of walnuts and cotton after harvest and picking less estimated point of sale costs.
The fair value of livestock at the reporting date has been determined by using an external valuation.
Notes to the Financial Statements continuedFor the 15-month period ended 30 September 2017
For
per
sona
l use
onl
y

79
Financial Assets – Investments are recognised and derecognised on trade date where purchase or sale of an investment is under a contract whose terms require delivery of the investment within the timeframe established by the market concerned, and are initially measured at fair value.
Subsequent to initial recognition, investments in subsidiaries are measured at cost in the company financial statements.
Effective interest method – The effective interest method is a method of calculating the amortised cost of a financial asset and of allocating interest income over the relevant period. The effective interest rate is the rate that exactly discounts estimated future cash receipts (including all fees on points paid or received that form an integral part of the effective interest rate, transaction costs and other premiums or discounts) through the expected life of the financial asset or, where appropriate, a shorter period.
We recognise income on an effective interest rate basis for debt instruments other than those financial assets ‘at fair value through profit or loss.’
Financial assets at fair value through profit or loss –we classify financial assets as financial assets at fair value through profit or loss where the financial asset:
� has been acquired principally for the purpose of selling in the near future;
� is a part of an identified portfolio of financial instruments that Webster manages together and has a recent actual pattern of short-term profit-taking; or
� is a derivative that is not designated and effective as a hedging instrument.
Financial assets at fair value through profit or loss are stated at fair value, with any resultant gain or loss recognised in profit or loss. The net gain or loss recognised in profit or loss incorporates any dividend or interest earned on the financial asset. We determine fair value in the manner described in note 24.
Loans and receivables – Trade receivables, loans, and other receivables that have fixed or determinable payments that are not quoted in an active market are classified as ‘loans and receivables.’ We record loans and receivables at amortised cost using the effective interest method less impairment. Interest is recognised by applying the effective interest rate.
Impairment of financial assets – Financial assets, other than those at fair value through profit and loss, are assessed for indicators of impairment at each balance sheet date. Financial assets are impaired where there is objective evidence that as a result of one or more events that occurred after the initial recognition of the financial asset the estimated future cash flows of the investment have been impacted. For financial assets carried at amortised cost, the amount of impairment is the difference between the asset’s carrying amount and the present value of estimated future cash flows, discounted at the original effective interest rate.
The carrying amount of the financial asset is reduced by the impairment loss directly for all financial assets with the exception of trade receivables where the carrying amount is reduced through the use of an allowance account. When the trade receivable is uncollectible, it is written off against the allowance account. We credit subsequent recoveries of amounts previously written off against the allowance account. Changes in the carrying amount of the allowance account are recognised in profit and loss.
If in a subsequent period the amount of the impairment loss decreases and the decrease can be related objectively to an event occurring after the impairment loss was recognised, the previously recognised impairment loss is reversed through profit and loss to the extent the carrying amount of the investment at the date the impairment is reversed does not exceed what the amortised cost would have been had the impairment not been recognised.
Financial Instruments – Debt and equity instruments – We classify debt and equity instruments as either liabilities or as equity in accordance with the substance of the contractual arrangement. An equity instrument is any contract that evidences a residual interest in the assets of an entity after deducting all of its liabilities. We record equity instruments issued by Webster as the proceeds received, net of direct issue costs.
Financial guarantee contract liabilities – We measure financial guarantee contract liabilities initially at their fair value and subsequently at the higher of:
� the amount of the obligation under the contract, as determined under AASB 137 ‘Provisions, Contingent Liabilities and Contingent Assets’; and
� the amount initially recognised less, where appropriate, cumulative amortisation in accordance with revenue recognition policies described in note 1.5(b).
Financial liabilities – We classify financial liabilities as either financial liabilities ‘at fair value through profit or loss’ or other financial liabilities.
Other financial liabilities – Other financial liabilities, including borrowings, are initially measured at fair value, net of transaction costs. Other financial liabilities are subsequently measured at amortised cost using the effective interest method, with interest expense recognised on an effective yield basis.
Foreign currency – In preparing the financial statements of the individual entities, transactions in currencies other than the entity’s functional currency are recorded at the rates of exchange prevailing on the dates of the transactions. At each balance sheet date, monetary items denominated in foreign currencies are retranslated at the rates prevailing at the balance date.F
or p
erso
nal u
se o
nly

80
Non-monetary items carried at fair value that are denominated in foreign currencies are retranslated at the rates prevailing on the date when the fair value was determined. Non-monetary items that are measured in terms of historical cost in a foreign currency are not retranslated.
Exchange differences are recognised in profit or loss in the period in which they arise except for:
� exchange differences which relate to assets under construction for future productive use are included in the cost of those assets where they are regarded as an adjustment to interest costs on foreign currency borrowings;
� exchange differences on transactions entered into in order to hedge certain foreign currency risks (refer note 1(k)); and
� exchange differences on monetary items receivable from or payable to a foreign operation for which settlement is neither planned nor likely to occur, which form part of the net investment in a foreign operation, are recognised in the foreign currency translation reserve and recognised in profit or loss on disposal of the net investment.
Goods and Services Tax – Revenues, expenses and assets are recognised net of the amount of goods and services tax (GST), except:
� where the amount of GST incurred is not recoverable from the taxation authority, it is recognised as part of the cost of acquisition of an asset or as part of an item of expense; or
� for receivables and payables which are recognised inclusive of GST.
The net amount of GST recoverable from, or payable to, the taxation authority is included as part of receivables or payables.
We include cash flows in the cash flow statement on a gross basis. The GST component of cash flows arising from investing and financing activities which is recoverable from, or payable to, the taxation authority is classified as operating cash flows.
Government Grants – are assistance by the government in the form of transfers of resources to Webster Limited in return for past or future compliance with certain conditions relating to the operating activities.
Government Grants include government assistance where there are no conditions specifically relating to the operating activities of the consolidated entity other than the requirement to operate in certain regions or industry sectors.
We recognise government grants relating to income as income over the periods necessary to match them with related costs. Government Grants that are receivable as compensation for expenses or losses already incurred or for the purpose of giving immediate financial support to Webster with no future related costs are recognised as income of the period in which they become receivable.
Government Grants whose primary condition is that Webster Limited should purchase, construct or otherwise acquire non-current assets are recognised as a reduction in the cost of non-current assets in the statement of financial position.
Business Combinations – We account for acquisitions of subsidiaries and businesses using the acquisition method. We measure the consideration for each acquisition at the aggregate of the fair values (at the date of exchange) of assets given, liabilities incurred or assumed, and equity instruments issued by Webster Limited in exchange for control of the acquiree.
We recognise acquisition-related costs in profit or loss as incurred.
Where applicable, the consideration for the acquisition includes any asset or liability resulting from a contingent consideration arrangement, measured at its acquisition date fair value. We adjust subsequent changes in such fair values are adjusted against the cost of acquisition where they qualify as measurement period adjustments (see below). All other subsequent changes in the fair value of contingent consideration classified as an asset or liability are accounted for in accordance with relevant Standards. Changes in the fair value of contingent consideration classified as equity are not recognised.
Where a business combination is achieved in stages, we measure Webster Limited’s previously held interests in the acquired entity to fair value at the acquisition date (that is the date Webster attains control) and recognise the resulting gain or loss, if any. Amounts arising from interests in the acquiree prior to the acquisition date that have previously been recognised in other comprehensive income are reclassified to profit or loss, where such treatment would be appropriate if that interest were disposed of. The acquiree’s identifiable assets, liabilities and contingent liabilities that meet the conditions for recognition under AASB 3 are recognised at their fair value at the acquisition date, except that:
� deferred tax assets or liabilities and liabilities or assets related to employee benefit arrangements are recognised and measured in accordance with AASB 112 Income Taxes and AASB 119 Employee Benefits respectively;
� liabilities or equity instruments related to the replacement by the Group of an acquiree’s share-based payment awards are measured in accordance with AASB 2 Share-based Payment; and
� assets (or disposal groups) that are classified as held for sale in accordance with AASB 5 Non-current Assets Held for Sale and Discontinued Operations are measured in accordance with that Standard.
For the 15-month period ended 30 September 2017
Notes to the Financial Statements continued
For
per
sona
l use
onl
y

81
If the initial accounting for a business combination is incomplete by the end of the reporting period in which the combination occurs, Webster Limited reports provisional amounts for the items for which the accounting is incomplete. We adjust those provisional amounts during the measurement period (see below), or additional assets or liabilities are recognised, to reflect new information obtained about facts and circumstances that existed as of the acquisition date that, if known, would have affected the amounts recognised as of that date.
The measurement period is the period from the date of acquisition to the date the Group obtains complete information about facts and circumstances that existed as of the acquisition date – and is subject to a maximum of one year.
Share-based payments – We measure equity-settled share-based payments to employees at the fair value of the equity instruments at the issue date. Fair value is measured by use of a Black Scholes pricing model taking into account the terms and conditions upon which the equity-settled share-based payments were granted. The fair value determined at the issue date of the equity-settled share-based payments is expensed on a straight-line basis over the vesting period, with a corresponding increase in equity. At the end of each reporting period, the Group revises its estimate of the number of equity instruments expected to vest. We recognise the impact of the revision of the original estimates, if any, is recognised in profit or loss such that the cumulative expense reflects the revised estimate, with a corresponding adjustment to the equity-settled employee benefits reserve.
Material prior period errors shall be retrospectively corrected in the first financial statements authorised for issue after their discovery by:
(a) restating the comparative amounts for the prior period(s) presented in which the error occurred; or
(b) if the error occurred before the earliest prior period presented, restating the opening balances of assets, liabilities and equity for the earliest prior period presented.
However, to the extent that it is impracticable to determine either:
(a) the period-specific effects of an error on comparative information for one or more prior periods presented, the entity shall restate the opening balances of assets, liabilities and equity for the earliest period for which retrospective restatement is practicable (which may be the current period); or
(b) the cumulative effect, at the beginning of the current period, of an error on all prior periods, the entity shall restate the comparative information to correct the error prospectively from the earliest date practicable. The correction of a prior period error is excluded from profit or loss for the period in which the error is discovered. Any information presented about prior periods, including any historical summaries of financial data, is restated as far back as is practicable.
Critical accounting judgements and key sources of estimation uncertainty – In the application of the Group’s accounting policies, management is required to make judgement’s, estimates and assumptions about the carrying values of assets and liabilities that are not readily apparent from other sources. The estimates and associated assumptions are based on historical experience and other factors that are considered to be relevant.
The critical judgements and key assumptions that management has made that have the most significant effect on the amounts recognised in the financial statements are:
Biological Assets (Walnut Orchards) Refer to note 8
Impairment of goodwill Refer to note 9
Carrying value of permanent water rights Refer to note 9
27 Adoption of new and revised Accounting Standards
Application of New and Revised Accounting Standards
In the current year, the Group has adopted all of the new and revised Standards and Interpretations issued by the Australian Accounting Standards Board (the AASB) that are relevant to its operations and effective for the current reporting period. Other than AASB 2014-6 Amendments to Australian Accounting Standards – Agriculture: Bearer Plants, the adoption of the standard did not have a significant impact on the consolidated financial statements.
New and revised Australian Accounting Standards in issue but not yet effective
At the date of authorisation of the financial statements, the Group has not applied the following new revised Australian Accounting Standards, Interpretations and amendments that have been issued but are not yet effective.
For
per
sona
l use
onl
y

82
Standards and Interpretations in Issue Not Yet Adopted
Standard/Interpretation
Effective for Annual reporting periods
beginning on or after
Expected to be initially applied in the financial year ending
AASB 9 ‘ Financial Instruments’ and the relevant amending standards 1 January 2018 30 September 2019
AASB 15 Revenue from Contracts with Customers’ and AASB 2014-5 Amendments to Australian Accounting Standards arising from AASB 15”, AASB 2015-8 ‘Amendments to Australian Accounting Standards – Effective date of AASB 15’
1 January 2018 30 September 2019
AASB 16 ‘Leases’ 1 January 2019 30 September 2020
Impact of New and Revised Requirements
Management is currently assessing the potential impact of the following standards:
AASB 9 “Financial Instruments’ (December 2009, and three relevant amending standards
AASB 9 applies to annual periods beginning on or after 1 January 2018. The directors of the Company anticipate that the application of AASB 9 in the future is not anticipated to have a material impact on amounts reported, based on current transactions, in respect of the Groups financial assets and financial liabilities, but will affect the disclosures made in the Groups consolidated financial statements.
AASB 15 Revenue form Contracts with Customers, AASB 2014-5 Amendments to Australian Accounting Standards arising from AASB 15, AASB 2015-8 Amendments to Australian Accounting Standards – Effective Date of AASB 15, and AASB 2016-3 Amendments to Australian Accounting Standards – Clarifications to AASB 15.
AASB 15 applies to annual periods beginning on or after 1 January 2018. The directors of the Company anticipate that the application of AASB 15 in the future will not have a material impact on the amounts reported, based on current transactions, but will affect disclosures made in the Group’s consolidated financial statements.
AASB 16 ‘Leases’
AASB 16 provides a comprehensive model for identification of lease arrangements and their treatment in the financial statements of both lessees and lessors.
The accounting model for lessees to recognise all leases on balance sheet, except for short term leases of low value assets
AASB 16 applies to annual periods beginning on or after 1 January 2019. The directors of the Company anticipate that the application of AASB 16 in the future will not have a material impact on the amounts reported, based on current transactions, but will affect disclosures made in the Group’s consolidated financial statements.
Comparative Balances
Effective from 1 July 2016 the Group has adopted AASB2014-6 Amendments to Australian Accounting Standards – Agriculture: Bearer Plants, and the consequential amendments to AASB 116 Property, Plant and Equipment and AASB 141 Agriculture.
These amendments distinguish bearer plants (i.e. Walnut trees) from other biological assets (i.e. Walnuts). The updated standards consider bearer plants, which are solely used to grow produce over their productive lives, as similar to an item of machinery. Bearer plants are now accounted for under AASB 116. Agricultural produce growing on bearer plants remains within the scope of AASB 141 and continues to be measured at fair value less costs to sell.
Comparative financial information has been restated to reflect the above in accordance with relevant transitional requirements and AASB 108 Accounting Policies, Changes in Accounting Estimates and Errors. The changes reflect:
� Reclassification of the value of bearer plants from Agricultural assets to Property Plant and Equipment;
� Depreciation expense in connection with bearer plants; and
� The consequential tax impact of the above.
For the 15-month period ended 30 September 2017
Notes to the Financial Statements continued
For
per
sona
l use
onl
y

83
Additional information required by the Australian Securities Exchange Limited and not shown elsewhere in this report is as follows:
Number and distribution of shareholders
Number and distribution of shareholders OrdinaryCummulative
Preference
1 – 1,000 610 163
1,001 – 5,000 1,351 13
5,001 – 10,000 778 5
10,001 – 100,000 1,274 10
100,001 and over 162 0
Total number of shareholders 4,175 191
Total number of issued shares listed 361,245,163 394,000
Number of shareholders holding less than a marketable parcel 161 131
Voting Rights
Articles 63 to 70 of the Company’s Constitution govern the voting rights of members. In summary, but without prejudice to the provisions of the Constitution, at any meeting of the Company every member present in person or by proxy or by power of attorney or by duly authorised representative shall on a show of hands be entitled to vote and, on a poll be entitled to one vote for each share held. Preference shareholders’ voting rights are limited to matters affecting rights of such shareholders.
Substantial shareholdersNumber of
Shares %Class of Shares
AFF Properties No 1 Pty Ltd ATF The AFF Operations Trust 52,067,654 14.41 Ordinary
Verolot Limited 32,215,862 8.92 Ordinary
Mr Peter Robin Joy 30,462,790 8.43 Ordinary
Belfort Investment Advisors Limited 21,272,722 5.89 Ordinary
Mr Bevan David Cushing as trustee of the KD Cushing Family Trust 20,244,413 5.60 Ordinary
ASX Additional InformationF
or p
erso
nal u
se o
nly

84
Twenty largest shareholdersNumber
of Shares %
Listed Ordinary Shares
AFF Properties No 1 Pty Ltd atf The AFF Operations Trust 52,067,654 14.41Bell Potter Nominees Ltd <BB Nominees A/c> 37,140,914 10.28Verolot Limited 32,215,862 8.92Mr Peter Robin Joy 30,462,790 8.43National Nominees Limited 28,969,212 8.02Belfort Investment Advisors Limited 21,272,722 5.89Sir Selwyn John Cushing and Mr Bevan David Cushing <K D Cushing Family A/c> 11,431,136 3.16HSBC Custody Nominees (Australia) Limited 9,215,184 2.55Sandhurst Trustees Ltd <JMFG Consol A/c> 5,742,401 1.59Rel-Trust Management Limited 5,559,529 1.54The Tasmania Gifts Company Pty Ltd <Ossa Superannuation Fund A/c> 5,133,699 1.42Eagle Securities Limited 4,933,469 1.37Rathvale Pty Limited 4,314,336 1.19J P Morgan Nominees Australia Limited 3,282,437 0.91Ashfield Farm Limited 3,253,748 0.9Mr Andrew Roy Newbery Sisson 3,170,000 0.88Citicorp Nominees Pty Limited 2,716,899 0.73Xetrov Pty Limited 2,636,267 0.73Tasman Super Pty Limited <Robinson Family S/F A/c> 1,947,836 0.54Mr Derek Goullet 1,563,732 0.43
Twenty largest shareholders Number of
Shares %
Listed 9% Cumulative Preference Shares
Mr David Calvert and Mrs Lorne Calvert <Southpork Super Fd A/c> 73,155 18.57Winpar Holdings Limited 55,278 14.03Mr Brian David Faulkner and Mrs Wendy Jean Faulkner 50,000 12.69Mr Brian David Faulkner 35,019 8.89Mr Leonard Wallace Boyd 15,556 3.95Mr James Gordon Maxwell Moffatt 14,921 3.79Meggsies Pty Ltd 14,334 3.64Mrs Frances Lorne Calvert 14,156 3.59Mrs June Lorimer Tutty 14,062 3.57Lesley Patricia Colman 11,800 2.99Wilcorp No 41 Pty Limited 7,800 1.98Dr Gordon Bradley Elkington 7,340 1.86Mary Graham Neild 6,800 1.73Mr David John Doberer and Mrs Joyce Lynette Carrey <DJ Doberer Super Fund A/c> 5,800 1.47Anchorfield Nominees Pty Ltd <Peter Martin Super Fund A/c> 5,787 1.47Ladon Pty Ltd 4,822 1.22Mrs Gwendoline Mabel Shelton 4,062 1.03Seven Bob Investments Pty Ltd <R F Cameron Super Fund A/c> 3,500 0.89Dr David Megirian 2,666 0.68Luaz Pty Limited <Superannuation Fund A/c> 2,664 0.68
For the 15-month period ended 30 September 2017
Notes to the Financial Statements continued
For
per
sona
l use
onl
y

85
Board of Directors
Chris Corrigan, Executive Chairman
David Cushing, Non-Executive Director
Chris Langdon, Non-Executive Director
John Joseph Robinson, Non-Executive Director
Joseph Corrigan, Alternate for Chris Corrigan
Company Secretary
Maurice Felizzi corporate@ websterltd. com.au
Registered Office
148 Colinroobie Road Leeton NSW Australia 2705
ACN 009 476 000
T 61 2 6951 3000 F 61 2 6951 3001
ww w.websterltd. com.au corporate@ websterltd. com.au
Share Registry
Computershare Investor Services Pty Ltd 152 Johnston Street Abbotsford VIC Australia 3067
Investor enquiries within Australia 1300 850 505
Investor enquiries outside Australia T +61 3 9415 4000
ww w.computershare. com web.queries@computershare. com
Webster Limited shares are listed on the Australian Securities Exchange (ASX)
Contact us
For
per
sona
l use
onl
y