Embed Size (px)
Citation preview

DIRECTORS’ REPORT AND F INANCIAL STATEMENTS
2015 / 16
Create a better today
SUNCORP GROUP L IMITED
ABN 66 145 290 124
For
per
sona
l use
onl
y

Contents
CHAIRMAN’S REPORT 2
DIRECTORS’ REPORT 4
1. Directors’profiles 42. Directors’ meetings 73. Directors’ interests 74. CompanySecretary 85. RemunerationReport 86. Principalactivities 87. Dividends 98. Operatingandfinancialreview 99. SignificantchangesinSuncorp
Group’sstateofaffairs 1310. Eventssubsequentto
reportingdate 1311. Likelydevelopments 1412. Keyinternalandexternalrisks 1513. Impactoflegislationandother
externalrequirements 1614. Environmentalregulation 1915. Indemnificationandinsuranceof
officers 1916. CorporateGovernanceStatement
isonline 1917. Non-auditservices 2018. Leadauditor’sindependence
declaration 2019. Roundingofamounts 20
REMUNERATION REPORT 21
1. Summaryof2016performanceandremuneration 23
1.1 2016performancesummary 231.2 Remunerationsummary 242. Executiveremuneration 252.1 Remunerationgovernance
framework 252.2 Executiveremunerationstrategy
andframework 272.3 2016Executiveremuneration
outcomes 292.4 Fixedremuneration 302.5 Short-termincentives(STI) 302.6 Long-termincentives(LTI) 332.7 Remunerationalignswithrisk
management 37
2.8 Executiveremuneration– statutorydisclosures 40
2.9 Employmentagreements– summary 41
3. Non-executivedirector arrangements 42
3.1 Remunerationstructure 423.2 Non-ExecutiveDirectors’
SharePlan 433.3 Non-executivedirectors’
remunerationdisclosures 434. Relatedpartytransactions 444.1 LoanstoKeyManagement
Personnelandtheirrelatedparties 444.2 MovementinsharesheldbyKey
ManagementPersonnel 454.3 OtherKeyManagementPersonnel
transactions 46
LEAD AUDITOR’S INDEPENDENCE DECLARATION 47
CONSOLIDATED STATEMENT OF COMPREHENSIVE INCOME 48
CONSOLIDATED STATEMENT OF FINANCIAL POSITION 49
CONSOLIDATED STATEMENT OF CHANGES IN EQUITY 50
CONSOLIDATED STATEMENT OF CASH FLOWS 51
NOTES TO THE CONSOLIDATED FINANCIAL STATEMENTS 52
1. Reportingentity 522. Basisofpreparation 523. Earningspershare(EPS) 534. Dividends 535. Segmentreporting 546. Underwritingresultfromgeneral
insurancecontracts 567. Netincurredclaimsfromgeneral
insurancecontracts 578. Sourcesofoperatingprofitfromlife
insuranceandothercontracts 57
9. Employeebenefits 5810. Share-basedpayments 5911. Incometax 6112. Tradingandinvestmentsecurities 6413. Derivativefinancialinstruments 6414. Loansandadvances 6715. Provisionforimpairmentonloans
andadvances 6716. Goodwillandotherintangibleassets 6817. Depositsandshort-termborrowings 7018. Unearnedpremiumliabilities 7019. Outstandingclaimsliabilities 7120. Lifeinsuranceandinvestment
contractliabilities 7621. Debtissues 7922. Subordinatednotes 8023. Preferenceshares 8024. Sharecapital 8125. Reserves 8226. Groupcapitalmanagement 8327. Notestotheconsolidated
statementofcashflows 8428. Financialinstruments 8529. Riskmanagementobjectives
andstructure 9030. Insuranceriskmanagement 9231. Riskmanagementforfinancial
instruments 9432. Commitments 10933. Parententityandcomposition
oftheSuncorpGroup 11034. KeyManagementPersonnel(KMP)
andrelatedpartydisclosures 11335. Auditors’remuneration 11536. Contingentassetsandliabilities 11537. Significantaccountingpolicies 11638. Subsequentevents 126
DIRECTORS’ DECLARATION 127
INDEPENDENT AUDITOR’S REPORT TO THE MEMBERS OF SUNCORP GROUP LIMITED 128
SHAREHOLDER INFORMATION AND FINANCIAL CALENDAR 136
CONTENTSSUNCORPGROUPLIMITEDF
or p
erso
nal u
se o
nly
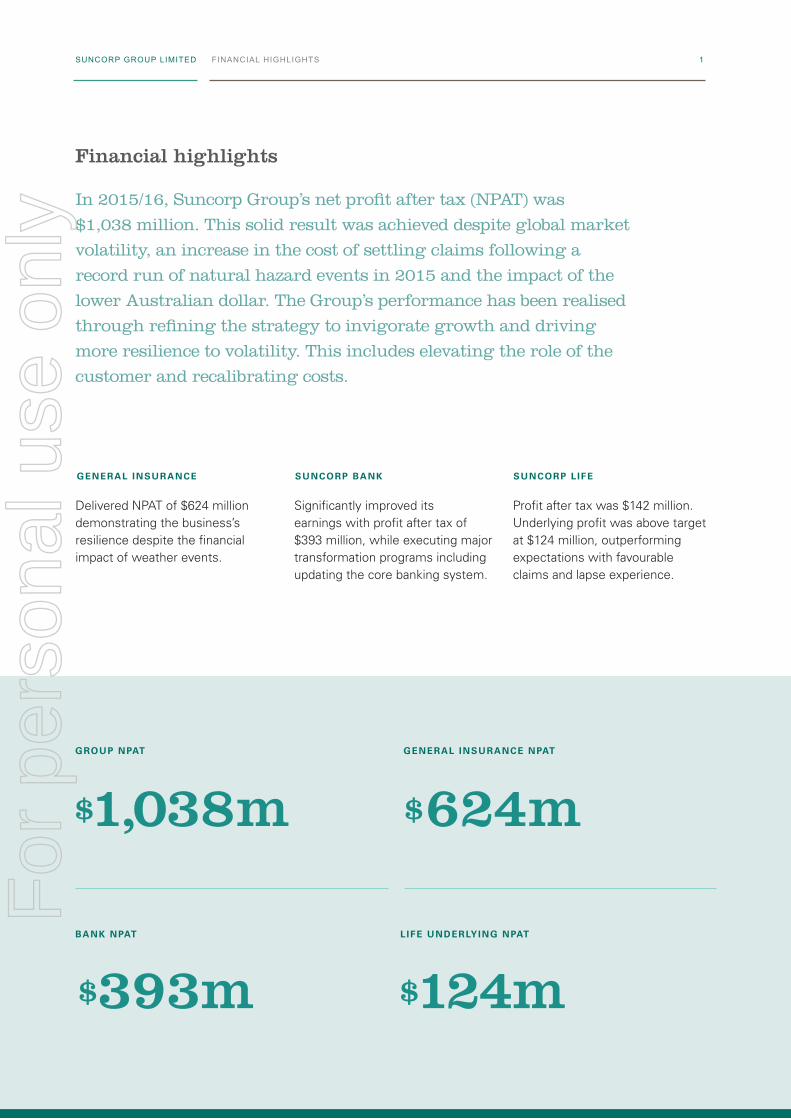
In 2015/16, Suncorp Group’s net profit after tax (NPAT) was
$1,038 million. This solid result was achieved despite global market
volatility, an increase in the cost of settling claims following a
record run of natural hazard events in 2015 and the impact of the
lower Australian dollar. The Group’s performance has been realised
through refining the strategy to invigorate growth and driving
more resilience to volatility. This includes elevating the role of the
customer and recalibrating costs.
Financial highlights
$1,038m $624m
$124m$393m
GROUP NPAT
LIFE UNDERLYING NPAT
GENERAL INSURANCE NPAT
BANK NPAT
GENERAL INSURANCE SUNCORP BANK SUNCORP L IFE
Delivered NPAT of $624 million demonstrating the business’s resilience despite the financial impact of weather events.
Significantly improved its earnings with profit after tax of $393 million, while executing major transformation programs including updating the core banking system.
Profit after tax was $142 million. Underlying profit was above target at $124 million, outperforming expectations with favourable claims and lapse experience.
FINANCIAL HIGHLIGHTS 1SUNCORP GROUP LIMITEDF
or p
erso
nal u
se o
nly
SUNCORP GROUP LIMITED CHAIRMAN’S REPORT 2
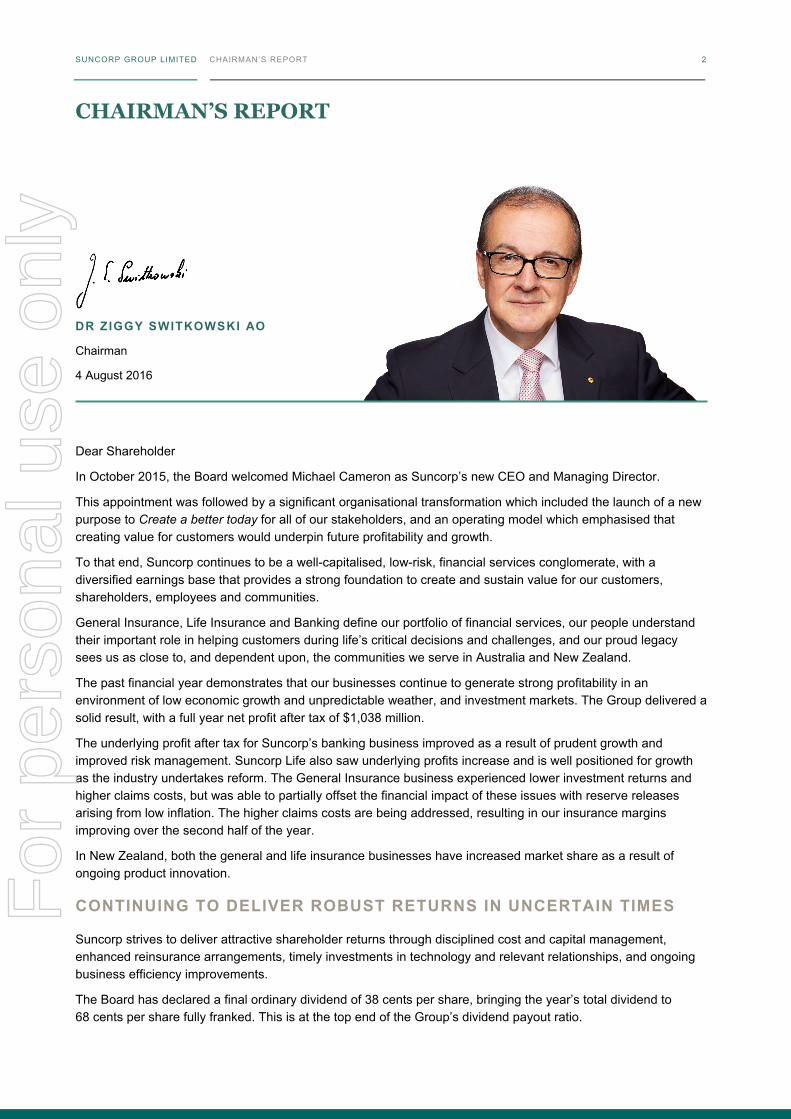
CHAIRMAN’S REPORT
DR ZIGGY SWITKOWSKI AO
Chairman
4 August 2016
Dear Shareholder
In October 2015, the Board welcomed Michael Cameron as Suncorp’s new CEO and Managing Director.
This appointment was followed by a significant organisational transformation which included the launch of a new purpose to Create a better today for all of our stakeholders, and an operating model which emphasised that creating value for customers would underpin future profitability and growth.
To that end, Suncorp continues to be a well-capitalised, low-risk, financial services conglomerate, with a diversified earnings base that provides a strong foundation to create and sustain value for our customers, shareholders, employees and communities.
General Insurance, Life Insurance and Banking define our portfolio of financial services, our people understand their important role in helping customers during life’s critical decisions and challenges, and our proud legacy sees us as close to, and dependent upon, the communities we serve in Australia and New Zealand.
The past financial year demonstrates that our businesses continue to generate strong profitability in an environment of low economic growth and unpredictable weather, and investment markets. The Group delivered a solid result, with a full year net profit after tax of $1,038 million.
The underlying profit after tax for Suncorp’s banking business improved as a result of prudent growth and improved risk management. Suncorp Life also saw underlying profits increase and is well positioned for growth as the industry undertakes reform. The General Insurance business experienced lower investment returns and higher claims costs, but was able to partially offset the financial impact of these issues with reserve releases arising from low inflation. The higher claims costs are being addressed, resulting in our insurance margins improving over the second half of the year.
In New Zealand, both the general and life insurance businesses have increased market share as a result of ongoing product innovation.
CONTINUING TO DELIVER ROBUST RETURNS IN UNCERTAIN TIMES
Suncorp strives to deliver attractive shareholder returns through disciplined cost and capital management, enhanced reinsurance arrangements, timely investments in technology and relevant relationships, and ongoing business efficiency improvements.
The Board has declared a final ordinary dividend of 38 cents per share, bringing the year’s total dividend to 68 cents per share fully franked. This is at the top end of the Group’s dividend payout ratio.
For
per
sona
l use
onl
y
SUNCORP GROUP LIMITED CHAIRMAN’S REPORT 2
CHAIRMAN’S REPORT
DR ZIGGY SWITKOWSKI AO
Chairman
4 August 2016
Dear Shareholder
In October 2015, the Board welcomed Michael Cameron as Suncorp’s new CEO and Managing Director.
This appointment was followed by a significant organisational transformation which included the launch of a new purpose to Create a better today for all of our stakeholders, and an operating model which emphasised that creating value for customers would underpin future profitability and growth.
To that end, Suncorp continues to be a well-capitalised, low-risk, financial services conglomerate, with a diversified earnings base that provides a strong foundation to create and sustain value for our customers, shareholders, employees and communities.
General Insurance, Life Insurance and Banking define our portfolio of financial services, our people understand their important role in helping customers during life’s critical decisions and challenges, and our proud legacy sees us as close to, and dependent upon, the communities we serve in Australia and New Zealand.
The past financial year demonstrates that our businesses continue to generate strong profitability in an environment of low economic growth and unpredictable weather, and investment markets. The Group delivered a solid result, with a full year net profit after tax of $1,038 million.
The underlying profit after tax for Suncorp’s banking business improved as a result of prudent growth and improved risk management. Suncorp Life also saw underlying profits increase and is well positioned for growth as the industry undertakes reform. The General Insurance business experienced lower investment returns and higher claims costs, but was able to partially offset the financial impact of these issues with reserve releases arising from low inflation. The higher claims costs are being addressed, resulting in our insurance margins improving over the second half of the year.
In New Zealand, both the general and life insurance businesses have increased market share as a result of ongoing product innovation.
CONTINUING TO DELIVER ROBUST RETURNS IN UNCERTAIN TIMES
Suncorp strives to deliver attractive shareholder returns through disciplined cost and capital management, enhanced reinsurance arrangements, timely investments in technology and relevant relationships, and ongoing business efficiency improvements.
The Board has declared a final ordinary dividend of 38 cents per share, bringing the year’s total dividend to 68 cents per share fully franked. This is at the top end of the Group’s dividend payout ratio.
SUNCORP GROUP LIMITED CHAIRMAN’S REPORT 3
During a year of substantial volatility, where the ASX 200 Accumulation Index returned 0.6%, the Group’s total return performance was negative 0.9%. While this is short of our aspirations and what we have delivered in recent periods, it compares to our peer group1 who delivered a total return of negative 6.5% for the year. Over the past five years our total returns are 104%, more than double the ASX 200 Accumulation Index return of 43% for the comparable period.
A REFINED SUNCORP STRATEGY
Suncorp’s refinement of its business strategy in early 2016 and the implementation of a new customer-focused operating model will help drive future growth, increase resilience to volatility and ensure long-term sustainability.
The Group should deliver greater value for customers by meeting their needs more consistently and adapting to evolving customer preferences.
The Board and executive team are galvanised behind the ‘One Suncorp’ business model and we are steadfast in our commitment to delivering long-term value for all of our stakeholders. The Group has outstanding people, advanced systems and established corporate functions that create a powerful foundation for future growth.
NEW LEADERSHIP
Nearing the end of his first year in the job, Michael has proven himself to be the right leader for the Group, refining Suncorp’s strategy to focus on growth and resilience.
With the Board’s endorsement, Michael has implemented the new operating model, putting customers at the centre of the organisation. Accordingly, a number of roles among the executive team have changed, delivering fresh perspectives and new energy for Michael’s ambitious plans for the Group.
In October 2015, we also welcomed Sally Herman to the Board. Sally brings extensive experience in corporate and retail banking, insurance and wealth management, and corporate social responsibility developed over the course of a long executive career.
Board Director Geoff Ricketts will retire at the 2016 AGM in September and he will not seek re-election. Geoff has made a significant contribution over a period of almost 10 years and I thank him for his service and consistently wise counsel.
I would like to express my gratitude to Suncorp’s people, whose dedication and passion for this business are both impressive and a great source of competitive advantage. I would also like to acknowledge my Board colleagues for their frank, fearless and invaluable contributions and conscientious stewardship of the Group.
Finally, thank you to our loyal customers and shareholders. Your interests have been at the centre of all our decisions as we have worked to evolve our strategy and implement the new operating model. We look forward to being able to deliver exceptional results.
1 the ASX 200 Financials excluding AREITS
For
per
sona
l use
onl
y

SUNCORP GROUP LIMITED DIRECTORS’ REPORT 4
DIRECTORS’ REPORT
The directors present their report together with the financial report of the Suncorp Group (the Suncorp Group, Suncorp or Group), being Suncorp Group Limited (the Company) and its subsidiaries for the financial year ended 30 June 2016 and the auditor’s report thereon. Terms that are defined appear in bold the first time they are used.
1. DIRECTORS’ PROFILES
The names of the people who served as directors of the Company at any time during or since the end of the financial year are set out below. All non-executive directors are members of the Nomination Committee.
Dr Zygmunt E Switkowski AO
BSc (Hons), PhD, FAICD, FAA, FTSE Non-executive Chairman, age 68
Dr Switkowski has been a director of the Group since September 2005, and Chairman since October 2011. He is an ex officio member of the Audit, Remuneration and Risk Committees. He is Chairman of NBN Co Limited, a director of Healthscope Limited (since April 2016), Tabcorp Holdings Limited (since October 2006) and Oil Search Limited (since November 2010). He is the Chancellor of RMIT University. During his career, Dr Switkowski has held senior executive positions in the communications industry with Telstra Corporation and Optus Communications, and previously at Kodak Australasia. In June 2014, he received the Order of Australia for his contribution to the arts, sciences, tertiary education and the telecommunications and business community.
Michael A Cameron
FCPA, FCA, FAICD CEO & Managing Director, age 56
Mr Cameron was appointed Chief Executive Officer & Managing Director (CEO & Managing Director) in October 2015. He was a non-executive director from April 2012–September 2015. Mr Cameron has over 30 years’ experience in finance and business. He was CEO and Managing Director of The GPT Group (2009–2015), Chief Financial Officer (CFO) at St George Bank from mid-2007 until the sale to Westpac Banking Corporation in 2008, and previously Group CFO and Group Executive at Commonwealth Bank of Australia’s Retail Bank Division. He also spent 10 years with Lendlease in a number of senior positions including CFO for MLC Limited.
Will iam J Bartlett
FCA, FCPA, FCMA, CA (SA) Non-executive director, age 67
Mr Bartlett has been a director of the Group since July 2003. He is a member of the Audit, Risk and Remuneration Committees. He is a director of Reinsurance Group of America Inc. (listed on NYSE) (since May 2004), RGA Reinsurance Company of Australia Limited, and both GWA International Limited and Abacus Property Group (since February 2007). He is Chairman of the Cerebral Palsy Foundation’s Council of Governors. Mr Bartlett has over 35 years’ experience in accounting. He was a partner of Ernst & Young in Australia for 23 years, retiring in mid-2003. Mr Bartlett has extensive experience in the actuarial, insurance and financial services sectors through membership of many industry and regulatory advisory bodies including the Life Insurance Actuarial Standards Board (1994–2007).
For
per
sona
l use
onl
y
SUNCORP GROUP LIMITED DIRECTORS’ REPORT 4
DIRECTORS’ REPORT
The directors present their report together with the financial report of the Suncorp Group (the Suncorp Group, Suncorp or Group), being Suncorp Group Limited (the Company) and its subsidiaries for the financial year ended 30 June 2016 and the auditor’s report thereon. Terms that are defined appear in bold the first time they are used.
1. DIRECTORS’ PROFILES
The names of the people who served as directors of the Company at any time during or since the end of the financial year are set out below. All non-executive directors are members of the Nomination Committee.
Dr Zygmunt E Switkowski AO
BSc (Hons), PhD, FAICD, FAA, FTSE Non-executive Chairman, age 68
Dr Switkowski has been a director of the Group since September 2005, and Chairman since October 2011. He is an ex officio member of the Audit, Remuneration and Risk Committees. He is Chairman of NBN Co Limited, a director of Healthscope Limited (since April 2016), Tabcorp Holdings Limited (since October 2006) and Oil Search Limited (since November 2010). He is the Chancellor of RMIT University. During his career, Dr Switkowski has held senior executive positions in the communications industry with Telstra Corporation and Optus Communications, and previously at Kodak Australasia. In June 2014, he received the Order of Australia for his contribution to the arts, sciences, tertiary education and the telecommunications and business community.
Michael A Cameron
FCPA, FCA, FAICD CEO & Managing Director, age 56
Mr Cameron was appointed Chief Executive Officer & Managing Director (CEO & Managing Director) in October 2015. He was a non-executive director from April 2012–September 2015. Mr Cameron has over 30 years’ experience in finance and business. He was CEO and Managing Director of The GPT Group (2009–2015), Chief Financial Officer (CFO) at St George Bank from mid-2007 until the sale to Westpac Banking Corporation in 2008, and previously Group CFO and Group Executive at Commonwealth Bank of Australia’s Retail Bank Division. He also spent 10 years with Lendlease in a number of senior positions including CFO for MLC Limited.
Will iam J Bartlett
FCA, FCPA, FCMA, CA (SA) Non-executive director, age 67
Mr Bartlett has been a director of the Group since July 2003. He is a member of the Audit, Risk and Remuneration Committees. He is a director of Reinsurance Group of America Inc. (listed on NYSE) (since May 2004), RGA Reinsurance Company of Australia Limited, and both GWA International Limited and Abacus Property Group (since February 2007). He is Chairman of the Cerebral Palsy Foundation’s Council of Governors. Mr Bartlett has over 35 years’ experience in accounting. He was a partner of Ernst & Young in Australia for 23 years, retiring in mid-2003. Mr Bartlett has extensive experience in the actuarial, insurance and financial services sectors through membership of many industry and regulatory advisory bodies including the Life Insurance Actuarial Standards Board (1994–2007).
SUNCORP GROUP LIMITED DIRECTORS’ REPORT 5
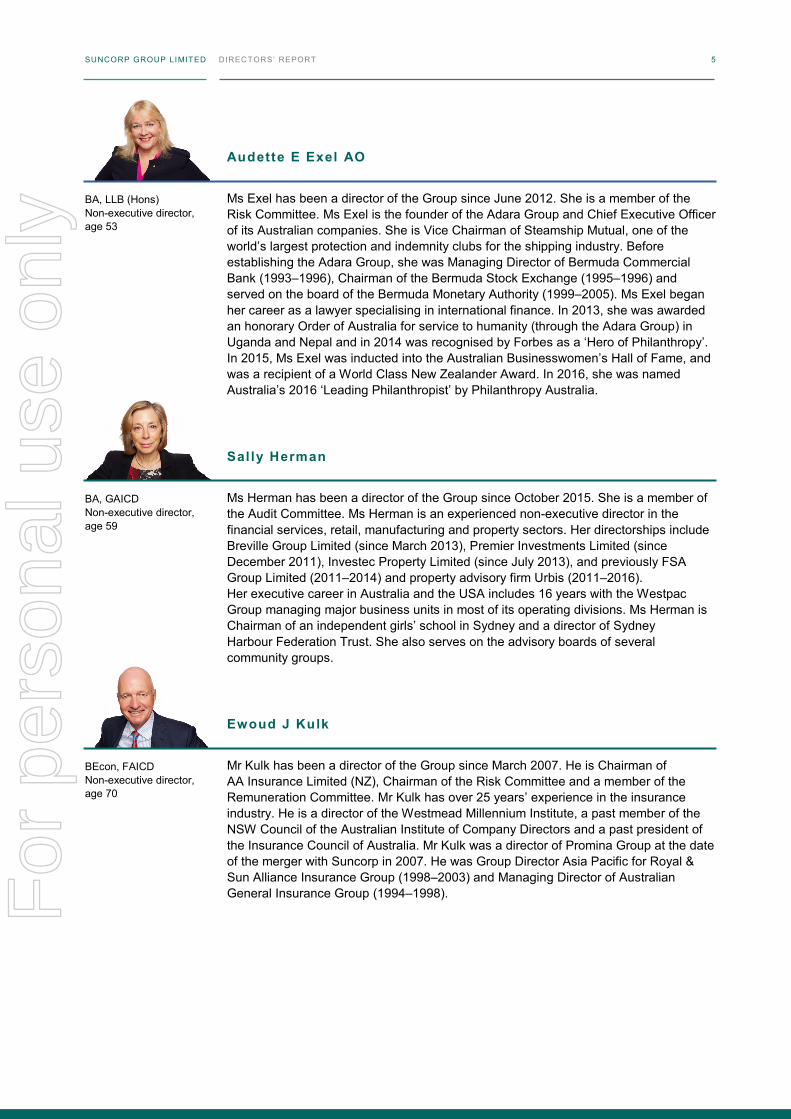
Audette E Exel AO
BA, LLB (Hons) Non-executive director, age 53
Ms Exel has been a director of the Group since June 2012. She is a member of the Risk Committee. Ms Exel is the founder of the Adara Group and Chief Executive Officer of its Australian companies. She is Vice Chairman of Steamship Mutual, one of the world’s largest protection and indemnity clubs for the shipping industry. Before establishing the Adara Group, she was Managing Director of Bermuda Commercial Bank (1993–1996), Chairman of the Bermuda Stock Exchange (1995–1996) and served on the board of the Bermuda Monetary Authority (1999–2005). Ms Exel began her career as a lawyer specialising in international finance. In 2013, she was awarded an honorary Order of Australia for service to humanity (through the Adara Group) in Uganda and Nepal and in 2014 was recognised by Forbes as a ‘Hero of Philanthropy’. In 2015, Ms Exel was inducted into the Australian Businesswomen’s Hall of Fame, and was a recipient of a World Class New Zealander Award. In 2016, she was named Australia’s 2016 ‘Leading Philanthropist’ by Philanthropy Australia.
Sally Herman
BA, GAICD Non-executive director, age 59
Ms Herman has been a director of the Group since October 2015. She is a member of the Audit Committee. Ms Herman is an experienced non-executive director in the financial services, retail, manufacturing and property sectors. Her directorships include Breville Group Limited (since March 2013), Premier Investments Limited (since December 2011), Investec Property Limited (since July 2013), and previously FSA Group Limited (2011–2014) and property advisory firm Urbis (2011–2016). Her executive career in Australia and the USA includes 16 years with the Westpac Group managing major business units in most of its operating divisions. Ms Herman is Chairman of an independent girls’ school in Sydney and a director of Sydney Harbour Federation Trust. She also serves on the advisory boards of several community groups.
Ewoud J Kulk
BEcon, FAICD Non-executive director, age 70
Mr Kulk has been a director of the Group since March 2007. He is Chairman of AA Insurance Limited (NZ), Chairman of the Risk Committee and a member of the Remuneration Committee. Mr Kulk has over 25 years’ experience in the insurance industry. He is a director of the Westmead Millennium Institute, a past member of the NSW Council of the Australian Institute of Company Directors and a past president of the Insurance Council of Australia. Mr Kulk was a director of Promina Group at the date of the merger with Suncorp in 2007. He was Group Director Asia Pacific for Royal & Sun Alliance Insurance Group (1998–2003) and Managing Director of Australian General Insurance Group (1994–1998). For
per
sona
l use
onl
y

SUNCORP GROUP LIMITED DIRECTORS’ REPORT 6
Christine F McLoughlin
BA, LLB (Hons), FAICD Non-executive director, age 53
Ms McLoughlin has been a director of the Group since February 2015. She is Chairman of the Remuneration Committee and a member of the Risk Committee. Ms McLoughlin began her career as a commercial lawyer. She has extensive business experience in Australia, the UK, New Zealand and South East Asia holding senior executive roles in the financial services and telecommunications sectors. Her current listed directorships include nib Holdings Ltd (since March 2011), Whitehaven Coal Limited (since May 2012) and Spark Infrastructure RE Limited (since October 2014). She is Chairman of Stadium Australia, a member of the Minter Ellison Advisory Council and a member of the Australian Securities and Investments Commission’s Director Advisory Panel.
Dr Douglas F McTaggart
BEcon (Hons), MA, PhD, DUniv, FAICD, SF Fin Non-executive director, age 63
Dr McTaggart has been a director of the Group since April 2012. He is Chairman of the Audit Committee and a member of the Remuneration Committee. Dr McTaggart has extensive experience in financial markets, having been Chief Executive of QIC Limited (1998–2012). Prior to QIC, he was Under Treasurer and Under Secretary of the Queensland Department of Treasury and had a distinguished academic career. He is currently Chairman of Spark Infrastructure RE Limited (since May 2016), the QIMR Berghofer Medical Research Institute Council and Suncentral Maroochydore Pty Ltd. He serves on the Queensland Council of the Australian Institute of Company Directors, the Australian National University Council and the Land Account Expert Advisory Panel to the Indigenous Land Corporation. He was a director of UGL Limited (2012–2015) and Telesso Technologies Limited (2007–2012). Dr McTaggart is a former chairman of corporate consultancy Galibier Partners and has served in various expert advisory roles to government and on several industry representative bodies.
Geoffrey T Ricketts CNZM
LLB (Hons), LLD (Honoris Causa), FInstD Non-executive director, age 70
Mr Ricketts has been a director of the Group since March 2007. He is Chairman of Vero Insurance New Zealand Limited, and a member of the Audit Committee. He is also Chairman of Todd Corporation Limited (NZ) and Heartland New Zealand Limited (having been a director of Heartland since 2011). He is a director of Shopping Centres Australasia Property Group Trustee NZ Limited and the Centre for Independent Studies Limited. He has extensive experience in New Zealand and Australia, having been a commercial lawyer and a partner at Russell McVeagh Solicitors (NZ) for over 25 years. Mr Ricketts was a director of Promina Group at the date of the merger with Suncorp in 2007. He was formerly Chairman of Royal & Sun Alliance’s New Zealand operations having been a non-executive director for over 10 years.
Former Managing Director and Group CEO
Patrick J R Snowball
MA, Hon. LLD Age 66
Mr Snowball was appointed to the Group on 1 September 2009, and resigned on 30 September 2015.
For
per
sona
l use
onl
y
SUNCORP GROUP LIMITED DIRECTORS’ REPORT 6
Christine F McLoughlin
BA, LLB (Hons), FAICD Non-executive director, age 53
Ms McLoughlin has been a director of the Group since February 2015. She is Chairman of the Remuneration Committee and a member of the Risk Committee. Ms McLoughlin began her career as a commercial lawyer. She has extensive business experience in Australia, the UK, New Zealand and South East Asia holding senior executive roles in the financial services and telecommunications sectors. Her current listed directorships include nib Holdings Ltd (since March 2011), Whitehaven Coal Limited (since May 2012) and Spark Infrastructure RE Limited (since October 2014). She is Chairman of Stadium Australia, a member of the Minter Ellison Advisory Council and a member of the Australian Securities and Investments Commission’s Director Advisory Panel.
Dr Douglas F McTaggart
BEcon (Hons), MA, PhD, DUniv, FAICD, SF Fin Non-executive director, age 63
Dr McTaggart has been a director of the Group since April 2012. He is Chairman of the Audit Committee and a member of the Remuneration Committee. Dr McTaggart has extensive experience in financial markets, having been Chief Executive of QIC Limited (1998–2012). Prior to QIC, he was Under Treasurer and Under Secretary of the Queensland Department of Treasury and had a distinguished academic career. He is currently Chairman of Spark Infrastructure RE Limited (since May 2016), the QIMR Berghofer Medical Research Institute Council and Suncentral Maroochydore Pty Ltd. He serves on the Queensland Council of the Australian Institute of Company Directors, the Australian National University Council and the Land Account Expert Advisory Panel to the Indigenous Land Corporation. He was a director of UGL Limited (2012–2015) and Telesso Technologies Limited (2007–2012). Dr McTaggart is a former chairman of corporate consultancy Galibier Partners and has served in various expert advisory roles to government and on several industry representative bodies.
Geoffrey T Ricketts CNZM
LLB (Hons), LLD (Honoris Causa), FInstD Non-executive director, age 70
Mr Ricketts has been a director of the Group since March 2007. He is Chairman of Vero Insurance New Zealand Limited, and a member of the Audit Committee. He is also Chairman of Todd Corporation Limited (NZ) and Heartland New Zealand Limited (having been a director of Heartland since 2011). He is a director of Shopping Centres Australasia Property Group Trustee NZ Limited and the Centre for Independent Studies Limited. He has extensive experience in New Zealand and Australia, having been a commercial lawyer and a partner at Russell McVeagh Solicitors (NZ) for over 25 years. Mr Ricketts was a director of Promina Group at the date of the merger with Suncorp in 2007. He was formerly Chairman of Royal & Sun Alliance’s New Zealand operations having been a non-executive director for over 10 years.
Former Managing Director and Group CEO
Patrick J R Snowball
MA, Hon. LLD Age 66
Mr Snowball was appointed to the Group on 1 September 2009, and resigned on 30 September 2015.
SUNCORP GROUP LIMITED DIRECTORS’ REPORT 7
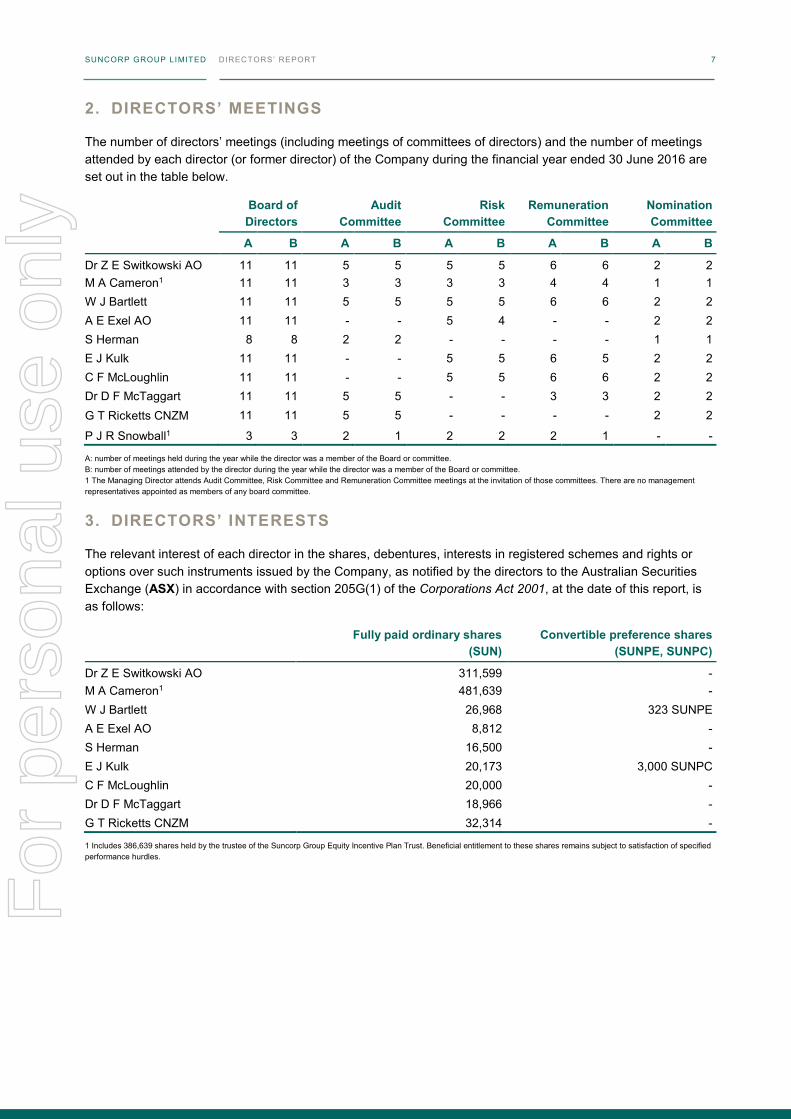
2. DIRECTORS’ MEETINGS
The number of directors’ meetings (including meetings of committees of directors) and the number of meetings attended by each director (or former director) of the Company during the financial year ended 30 June 2016 are set out in the table below.
Board of Directors
Audit Committee
Risk Committee
Remuneration Committee
Nomination Committee
A B A B A B A B A B
Dr Z E Switkowski AO 11 11 5 5 5 5 6 6 2 2 M A Cameron1 11 11 3 3 3 3 4 4 1 1 W J Bartlett 11 11 5 5 5 5 6 6 2 2 A E Exel AO 11 11 - - 5 4 - - 2 2 S Herman 8 8 2 2 - - - - 1 1 E J Kulk 11 11 - - 5 5 6 5 2 2 C F McLoughlin 11 11 - - 5 5 6 6 2 2 Dr D F McTaggart 11 11 5 5 - - 3 3 2 2 G T Ricketts CNZM 11 11 5 5 - - - - 2 2
P J R Snowball1 3 3 2 1 2 2 2 1 - -
A: number of meetings held during the year while the director was a member of the Board or committee. B: number of meetings attended by the director during the year while the director was a member of the Board or committee. 1 The Managing Director attends Audit Committee, Risk Committee and Remuneration Committee meetings at the invitation of those committees. There are no management representatives appointed as members of any board committee.
3. DIRECTORS’ INTERESTS
The relevant interest of each director in the shares, debentures, interests in registered schemes and rights or options over such instruments issued by the Company, as notified by the directors to the Australian Securities Exchange (ASX) in accordance with section 205G(1) of the Corporations Act 2001, at the date of this report, is as follows:
Fully paid ordinary shares
(SUN) Convertible preference shares
(SUNPE, SUNPC)
Dr Z E Switkowski AO 311,599 - M A Cameron1 481,639 - W J Bartlett 26,968 323 SUNPE A E Exel AO 8,812 - S Herman 16,500 - E J Kulk 20,173 3,000 SUNPC C F McLoughlin 20,000 - Dr D F McTaggart 18,966 - G T Ricketts CNZM 32,314 -
1 Includes 386,639 shares held by the trustee of the Suncorp Group Equity Incentive Plan Trust. Beneficial entitlement to these shares remains subject to satisfaction of specified performance hurdles.
For
per
sona
l use
onl
y
SUNCORP GROUP LIMITED DIRECTORS’ REPORT 8
4. COMPANY SECRETARY
Details of the Company Secretaries during the financial year to 30 June 2016 and as at the date of this report are set out below.
Ms Anna Lenahan BA (Hons), MA (Psych) (Hons), LLB (Hons) was appointed Chief Risk and Legal Officer in March 2016, and has been Company Secretary since joining Suncorp in March 2011 as Executive General Manager Group General Counsel and Company Secretary.
Mr Darren Solomon LLB was appointed Company Secretary in 2010. Mr Solomon commenced with the Group in 1989 as a senior lawyer in the Group’s legal department before moving to the Company Secretariat team in 2006. Mr Solomon’s Group role is Head of Company Secretariat.
Ms Kristy Huxtable FGIA, MAICD, MBA, Grad Dip (GIA), Grad Dip (HR) was appointed Company Secretary on 1 August 2016 and has been with the Company since January 2014 in the Company Secretariat team. Ms Huxtable has extensive corporate governance and secretarial experience within financial services.
The Company Secretaries are directly accountable to the Board, through the Board Chairman, for all governance matters that relate to the Board’s proper functioning.
5. REMUNERATION REPORT
The Remuneration Report is set out on pages 21 to 46 and forms part of the Directors’ Report for the financial year ended 30 June 2016.
6. PRINCIPAL ACTIVITIES
The principal activities of the Suncorp Group during the course of the financial year were the provision of general insurance, banking, life insurance, superannuation products and related services to the retail, corporate and commercial sectors in Australia and New Zealand.
There were no significant changes in the nature of Suncorp Group’s activities during the financial year.
6.1 SUNCORP GROUP’S OBJECTIVES
Suncorp Group’s revised business model takes the ‘One Company, Many Brands’ model a step further by integrating the businesses in Australia and New Zealand via a new operating structure with one view of the customer. This refreshed ‘One Suncorp’ business model, which will treat all customers as Group customers, will deliver more value to customers and shareholders than operating as independent businesses.
The Group has articulated its strategic vision and outlook to 2019. It is focused on building a business that creates value through an intense focus on increasing Connected Customers – that is customers who have more of their needs met through Suncorp.
One way in which the customer experience will be improved is by integrating all offerings into a platform known as the ‘marketplace’. The marketplace will deliver a unique combination of enhanced technology and solutions created by Suncorp and third parties, allowing customers to interact and move seamlessly through digital and physical channels, to find solutions that better meet their individual needs. Suncorp will benefit from improved retention of existing and established customers, providing the Group continued future earnings growth.
Suncorp Group thus aspires to be an agile, resilient financial services company that:
creates a better today for all its stakeholders
curates solutions from both Suncorp and third parties that better meet and anticipate customers’ needs
delivers sustainable shareholder returns through higher customer retention, sustaining margins and rebasing costs to drive earnings growth
is a responsible and valuable contributor to society.
For
per
sona
l use
onl
y

SUNCORP GROUP LIMITED DIRECTORS’ REPORT 8
4. COMPANY SECRETARY
Details of the Company Secretaries during the financial year to 30 June 2016 and as at the date of this report are set out below.
Ms Anna Lenahan BA (Hons), MA (Psych) (Hons), LLB (Hons) was appointed Chief Risk and Legal Officer in March 2016, and has been Company Secretary since joining Suncorp in March 2011 as Executive General Manager Group General Counsel and Company Secretary.
Mr Darren Solomon LLB was appointed Company Secretary in 2010. Mr Solomon commenced with the Group in 1989 as a senior lawyer in the Group’s legal department before moving to the Company Secretariat team in 2006. Mr Solomon’s Group role is Head of Company Secretariat.
Ms Kristy Huxtable FGIA, MAICD, MBA, Grad Dip (GIA), Grad Dip (HR) was appointed Company Secretary on 1 August 2016 and has been with the Company since January 2014 in the Company Secretariat team. Ms Huxtable has extensive corporate governance and secretarial experience within financial services.
The Company Secretaries are directly accountable to the Board, through the Board Chairman, for all governance matters that relate to the Board’s proper functioning.
5. REMUNERATION REPORT
The Remuneration Report is set out on pages 21 to 46 and forms part of the Directors’ Report for the financial year ended 30 June 2016.
6. PRINCIPAL ACTIVITIES
The principal activities of the Suncorp Group during the course of the financial year were the provision of general insurance, banking, life insurance, superannuation products and related services to the retail, corporate and commercial sectors in Australia and New Zealand.
There were no significant changes in the nature of Suncorp Group’s activities during the financial year.
6.1 SUNCORP GROUP’S OBJECTIVES
Suncorp Group’s revised business model takes the ‘One Company, Many Brands’ model a step further by integrating the businesses in Australia and New Zealand via a new operating structure with one view of the customer. This refreshed ‘One Suncorp’ business model, which will treat all customers as Group customers, will deliver more value to customers and shareholders than operating as independent businesses.
The Group has articulated its strategic vision and outlook to 2019. It is focused on building a business that creates value through an intense focus on increasing Connected Customers – that is customers who have more of their needs met through Suncorp.
One way in which the customer experience will be improved is by integrating all offerings into a platform known as the ‘marketplace’. The marketplace will deliver a unique combination of enhanced technology and solutions created by Suncorp and third parties, allowing customers to interact and move seamlessly through digital and physical channels, to find solutions that better meet their individual needs. Suncorp will benefit from improved retention of existing and established customers, providing the Group continued future earnings growth.
Suncorp Group thus aspires to be an agile, resilient financial services company that:
creates a better today for all its stakeholders
curates solutions from both Suncorp and third parties that better meet and anticipate customers’ needs
delivers sustainable shareholder returns through higher customer retention, sustaining margins and rebasing costs to drive earnings growth
is a responsible and valuable contributor to society.
SUNCORP GROUP LIMITED DIRECTORS’ REPORT 9
In addition to elevating the customer, the strategy also leverages the Group’s strategic assets of Cost, Capital and Culture:
Cost – recalibrating costs by pooling resources and leveraging Suncorp’s scale, buying power and supplier relationships
Capital – leveraging the diversity and capital return of each of our businesses for the benefit of the Group
Culture – operating as ‘One Suncorp’ in Australia and New Zealand.
Suncorp Group’s strategic priority is to build resilience and focus on the following three areas:
Maintain momentum and stability – through continued execution of the strategy to deliver on market commitments
Elevate the customer – by improving the focus on customer experience and building the customer marketplace
Recalibrate costs – by realigning the cost base to create a leaner, more effective and competitive organisation to reflect the realities of the current low growth operating environment.
7. DIVIDENDS
A fully franked 2015 final dividend of $489 million (38 cents per share) and a fully franked 2015 special dividend of $154 million (12 cents per share) were paid on 22 September 2015. A fully franked 2016 interim ordinary dividend of $386 million (30 cents per share) was paid on 1 April 2016. A fully franked 2016 final dividend of $489 million (38 cents per share) has been declared by the directors.
Further details of dividends on ordinary shares provided for or paid are set out in note 4 to the consolidated financial statements.
8. OPERATING AND FINANCIAL REVIEW
8.1 OVERVIEW OF SUNCORP GROUP
For the financial year ended 30 June 2016, Suncorp Group delivered a net profit after tax of $1,038 million (2015: $1,133 million).
The strength of the Group's balance sheet has enabled the Board to declare a final dividend of 38 cents per share in addition to the interim dividend. The total 2016 dividends declared equate to 83.8% of the Group’s net profit after tax. After accounting for the dividend payment, the Group will remain well capitalised with $346 million in Common Equity Tier 1 (CET1) capital held above its operating targets.
General Insurance achieved a net profit after tax of $624 million for the financial year ended 30 June 2016 (2015: $756 million).
The insurance trading result (ITR) was $782 million (2015: $894 million), representing an ITR ratio of 9.9% (2015: 11.4%). General Insurance has focused on delivering lower working claims costs over the second half of the financial year, which together with other initiatives, have driven a higher ITR for the second half. The result compared to the prior year was negatively impacted by working claims costs in Personal Insurance, large Commercial claims, an increase in the natural hazard allowance and lower investment yields.
Gross Written Premium (GWP) increased 1.8% to $9,031 million (2015: $8,872 million).
The Personal Insurance business GWP increased 1.6% to $4,787 million (2015: $4,713 million) as a result of targeted price increases. Retention rates have been maintained as Suncorp continues to focus on improving product offerings and service standards.
Commercial Insurance has maintained its strong position in a competitive market due to its diverse portfolio, commitment to underwriting discipline and long-tail claims management.
For
per
sona
l use
onl
y
SUNCORP GROUP LIMITED DIRECTORS’ REPORT 10
Compulsory Third Party (CTP) GWP grew 9.2%, successfully leveraging the Group’s national CTP model. The success of this model is further demonstrated by the Group’s entry into the South Australian privatised CTP scheme from 1 July 2016.
Net incurred claims were $5,661 million (2015: $5,587 million) with natural hazard claims of $730 million (2015: $1,068 million), $60 million over the allowance for the year.
Reserve releases of $347 million continue to be above expectations of 1.5% of net earned premium. This was primarily attributable to the proactive management of long-tail claims and a benign wage and super-imposed inflation environment.
Total operating expenses decreased 1.9% to $1,749 million (2015: $1,783 million), with the operating expense ratio improving to 22.0% (2015: 22.6%) as a result of a continued focus on expense management.
Overall investment income has decreased. Income on Insurance Funds was $254 million (2015: $399 million), with losses from widening credit spreads and the relative underperformance of inflation-linked bonds, partially offset by mark-to-market gains from a reduction in risk-free rates. Investment income on Shareholders’ Funds of $101 million (2015: $163 million) was impacted by the widening of credit spread yields and lower than expected returns from equities.
Suncorp Bank delivered a strong net profit after tax of $393 million (2015: $354 million), up 11.0% compared with the prior corresponding period. The Bank has established a solid platform through a continued focus on high quality lending supported by a resilient balance sheet and a robust capital position. During the year the Bank won the 2016 MFAA Non Major Lender Award and Money Magazine’s 2016 Business Bank of the Year, while the Bank’s standalone credit profile from Standard & Poor’s was upgraded from ‘bbb+’ to ‘a-‘.
A focus on high quality profitable growth resulted in total lending assets growing by 4.6% or $2,399 million to $54,134 million (2015: $51,735 million), with home loan growth of 5.9% broadly in line with system growth and management aspirations. The business lending portfolio grew $255 million in the second half as the Bank pursued growth in target market segments whilst achieving managed reduction in others.
The net interest income increased 2.4% to $1,129 million (2015: $1,103 million). The net interest margin (NIM) increased in the financial year ending at 1.86%. Challenging market conditions prevailed through much of the year and are continuing as a result of reductions to the Reserve Bank of Australia’s cash rate, competition, and emerging wholesale and retail funding cost pressures.
Disciplined cost management resulted in reduced operating expenses from the prior period. A cost-to-income ratio of 52.5% was achieved after absorbing ongoing investment into key strategic initiatives.
Through maintaining a strong focus on credit quality and risk management, the Bank benefited from a further reduction in gross impaired assets. Impairment losses of $16 million (2015: $58 million), or 0.03% of gross loans and advances, were historically low and significantly favourable to the Bank’s through-the-cycle expected operating range of 0.10% to 0.20%.
The Bank has taken a cautious approach to investment lending and large scale property development, and has limited exposure to inner city apartment markets. In agribusiness, conditions stabilised as relieving rains were received by many districts, which together with commodity prices and a lower exchange rate led to improved operating conditions. The Bank continues to support its agribusiness customers and communities affected by drought.
Domestic and offshore long-term funding markets were successfully accessed during the period. The Bank’s strong long-term issuer ratings of ‘A+/A1/A+’ and a well-diversified wholesale funding position creates a genuine competitive advantage. Periods of heightened volatility highlight the benefit of access to a range of funding instruments in both domestic and offshore markets.
The CET1 ratio increased to 9.21% and remains above the target range of 8.5%–9.0%. The total risk weighted capital ratio reduced to 13.53%.
SUNCORP GROUP LIMITED DIRECTORS’ REPORT 11
The Bank has continued on its transformational journey during the period and is responding to changes in the competitive landscape with continued investment in its core banking system, digital and channel capabilities, products, risk management, and people. The core banking platform is now in place and supports the Bank across lending, broker channel, customer, collateral and collections. The decommissioning of the Bank’s legacy collections and personal lending systems is complete, with the collateral system to follow in the first quarter of the 2017 financial year.
The detailed review process with the Australian Prudential Regulation Authority (APRA) regarding Basel II Advanced Accreditation is continuing. The Bank is operating as an Advanced Bank, with strong risk management and advanced models in use across the business.
Life delivered a net profit after tax for the financial year of $142 million (2015: $125 million).
Life continues to drive sustainable growth across the portfolio with a focus on value over volume.
Total in-force premium increased to $1,032 million (2015: $970 million), an increase of 6.4%.
Direct in-force premiums for products sold through General Insurance continue to show strong growth increasing by 14.3%. New business sales outperformed system.
Independent financial adviser (IFA) risk in-force growth was impacted by new business sales volumes trending below prior periods as a result of industry reform and increases in Suncorp pricing. Better than expected retention has benefited in-force premium levels.
The New Zealand business has continued to grow its in-force portfolio to $219 million through its continued investment in value-adding and sustainable intermediary relationships and a market-leading customer retention strategy.
Superannuation funds under administration of $8,163 million (2015: $8,076 million) reflected new business growth from WealthSmart and Suncorp Everyday Super. Super volumes are down compared to the prior year where there were strong pension sales ahead of regulatory change. Volumes were also impacted by the changes to the aligned distribution channel.
During the year, Life revised a number of assumptions, reflecting an updated view of future expected experience in lapses and claims. This includes the implementation of the new industry claims tables for income protection in Australia and a net reduction in lapse assumptions. In aggregate, the assumption changes have had a minimal impact on profit and capital.
The recent volatility in financial markets have impacted the financials. While profit and loss, value of one year’s sales and embedded value have benefited from the lower interest rates, capital has been negatively impacted.
8.2 REVIEW OF FINANCIAL POSITION
Total assets increased by $97 mil l ion or 0.1% to $95,748 mil l ion compared with June 2015
Cash and cash equivalents increased by $582 million due to the increased usage of reverse repo instruments for liquidity management purposes.
Trading securities increased $113 million with increases in the holdings of high-quality Government and Semi-Government instruments.
Investment securities decreased $2,746 million due to the implementation of a simplified superannuation holdings structure and Bank balance sheet optimization.
Loans and advances increased $2,399 million primarily due to growth in home lending. Business lending was flat during the year reflecting a selective focus on higher quality customers.
Reinsurance and other recoveries decreased $513 million due to the ongoing settlements from natural hazards claims in prior years.
Goodwill and other intangible assets increased by $95 million due to continued investment into software projects.
For
per
sona
l use
onl
y
SUNCORP GROUP LIMITED DIRECTORS’ REPORT 12
Total l iabil it ies increased by $45 mil l ion or 0.1% to $82,178 mil l ion compared with June 2015
Deposits and short-term borrowings increased $990 million driven by strong volumes of retail transaction and term deposit accounts during the year.
Derivatives increased by $92 million as a result of volatility in the Australian dollar impacting the holdings of forward foreign exchange contracts and cross currency swaps.
Payables and other liabilities increased $244 million due to higher usage of repurchase agreements for liquidity management.
Current tax liabilities decreased by $213 million reflecting the lower reported profit for the year.
Outstanding claims liabilities decreased by $264 million due to the ongoing settlement of Canterbury earthquake claims.
Gross policy liabilities decreased by $3,012 million due to the implementation of a simplified superannuation holdings structure.
Managed funds units on issue increased by $1,101 million also due to the implementation of a simplified superannuation holdings structure.
Securitisation liabilities reduced $1,104 million due to the continued amortisation of issued securitisation trusts.
Debt issues increased $1,972 million to replace the run-off of securitisation funding and to fund the growth of lending assets.
Total equity increased by $52 mil l ion or 0.4% to $13,570 mill ion compared with June 2015
Reserves increased by $31 million due to the impacts of volatility in the Australian dollar that were somewhat offset by reductions in reserves held for credit losses.
Retained profits increased by $52 million driven by transfers from reserves held for credit losses.
Non-controlling interests decreased by $26 million due to transactions performed during the year that increased holdings in subsidiaries.
8.3 REVIEW OF CAPITAL STRUCTURE
Suncorp Group’s capital management strategy is to optimise shareholder value by managing the level, mix and use of capital resources. The primary objective is to ensure there are sufficient capital resources to maintain and grow the business, in accordance with risk appetite.
The Group is subject to, and complies with, external capital requirements set and monitored by APRA and the Reserve Bank of New Zealand.
The Group’s Internal Capital Adequacy Assessment Process (ICAAP) provides the framework to ensure that the Group as a whole, and each regulated entity, is capitalised to meet both internal and external requirements. The ICAAP is reviewed regularly and, where appropriate, adjustments are made to reflect changes in the Group’s capital requirements.
A range of instruments and methodologies are used to effectively manage capital including share issues, reinsurance, dividend policies and Tier 1 and Tier 2 instruments. Capital targets are structured according to risk appetite, the business line regulatory framework and APRA’s Non-Operating Holding Company conditions.
For regulatory purposes, capital is classified as follows:
• CET1 comprising accounting equity with adjustments for intangible assets and regulatory reserves
SUNCORP GROUP LIMITED DIRECTORS’ REPORT 13
• Tier 1 Capital comprising CET1 plus Additional Tier 1 Capital such as hybrid securities with ‘equity-like’ qualities
• Tier 2 Capital comprising certain securities recognised as Tier 2 Capital, together with specific Bank reserves eligible as regulatory capital; and
• Total Capital is the sum of Tier 1 Capital and Tier 2 Capital.
CET1 has the greatest capacity to absorb potential losses, followed by Additional Tier 1 Capital and then Tier 2 Capital.
The Group aims to pay annual dividends based on a target payout ratio of 60% to 80% of cash earnings. The Board also remains committed to returning to shareholders capital that is surplus to the needs of the business.
The Group’s profit result over the year has led to a fully franked final dividend of 38 cents per share, maintaining the same payout as the 2015 financial year final dividend (38 cents per share). This brings total ordinary dividends to 68 cents per share, down 8 cents per share (10.5%). Given the Group’s robust earnings outlook and strong capital position, the Board is comfortable adopting a payout ratio of 91.2% of cash earnings for the second half. This brings the full year cash earnings payout ratio to 80%, the upper end of the target payout ratio.
Capital posit ion as at 30 June 2016
The CET1 capital positions (pre dividend) as at 30 June 2016 are:
• the General Insurance business’s CET1 position was 1.21 times the Prescribed Capital Amount (PCA), above its target operating range of 0.95–1.15 times PCA
• the Bank’s CET1 ratio was 9.21%, above its target operating range of 8.5%–9.0%
• Life’s excess CET1 to target was $110 million; and
• an additional $151 million of excess CET1 was held at the Group and Corporate Services level.
The Group maintains a strong capital position with all three businesses holding CET1 in excess of targets. The Group’s excess to CET1 target is $346 million after adjusting for the final dividend.
9. SIGNIFICANT CHANGES IN SUNCORP GROUP’S STATE OF AFFAIRS
The Group has refined its strategy to drive growth and increase resilience to volatility. The key priorities in the execution of this strategy are to maintain stability and momentum, elevate the customer and recalibrate costs. This has been reflected through the organisational restructure which became effective 1 July 2016, with operating structures confirmed across all functions: Insurance, Banking and Wealth, New Zealand, Customer Experience, Customer Platforms, Finance and Advice, People Experience, and Technology, Data and Labs.
There have been no significant changes in the state of affairs of the Group during the financial year, other than as disclosed in this Directors’ Report and Financial Statements.
10. EVENTS SUBSEQUENT TO REPORTING DATE
There has not arisen in the interval between the end of the financial year and the date of this report any item, transaction or event of a material and unusual nature likely, in the opinion of the directors of the Company, to affect significantly the operations of the Suncorp Group, the results of those operations, or the state of affairs of the Suncorp Group in future financial years. F
or p
erso
nal u
se o
nly
SUNCORP GROUP LIMITED DIRECTORS’ REPORT 14
11. LIKELY DEVELOPMENTS
Australian economic growth is expected to remain subdued as the economy transitions from mining-led growth to a more broad-based expansion. The low yield environment persists, with interest rates at historical lows creating challenges for product pricing and investment management. Competition, regulatory and political reform are ongoing headwinds to the financial services sector, while emerging fintech companies are driving change and disruption to traditional business models.
In this context, the Group has refined its strategy to drive growth and increase resilience to volatility. The Group is well capitalised and has a diversified earnings base that provides a strong foundation to create value for customers, shareholders, employees and communities with the ‘One Suncorp’ business model. By maximising its strategic assets of cost, capital and culture, the Group will create greater value for customers, leading to higher customer retention and revenues.
Key priorities are to maintain stability and momentum, elevate the customer, and recalibrate costs.
Maintaining stability and momentum in the Group’s traditional business will be achieved through execution of key programs such as working claims remediation, the core banking system, Super Simplification and Optimisation. In addition, progress is well underway to recalibrate costs to create a leaner and more resilient organisation.
The Group’s priority to elevate the customer is focused on broadening relationships with existing customers. The Group will deliver greater value for customers by meeting customers’ needs more consistently and by providing access to the marketplace. The marketplace will help customers navigate complexity, make better choices and allow them to interact with the Group in any way they choose, through both digital and physical channels.
In the medium term, the Group’s key targets are:
• broadening of customer relationships
• flat cost base in the 2017 and 2018 financial years
• improving underlying net profit after tax
• sustainable return on equity of at least 10%
• maintaining a dividend payout ratio of 60% to 80% of cash earnings; and
• returning excess capital.
General Insurance is focused on rectifying claims costs in the Personal Insurance business, which together with other initiatives, will drive ongoing improvement in underlying insurance margins.
Personal Insurance expects to achieve low single digit GWP growth, reflective of input costs increasing across the industry. New business is likely to remain challenging; however, retention levels should remain stable as claims processing improvements translate to improving customer satisfaction. Continued focus on expense management, improved working claims costs and additional benefits from vertical supply chain initiatives will support further improvement to results.
Commercial Insurance continues to target profitable growth through targeted repricing and entry into new markets. Entry into the South Australian CTP market from 1 July 2016 represents an opportunity for the Group to further cement its position as Australia’s largest personal injury insurer. Low investment yields create an ongoing challenge for margins; however, ongoing benefits from improved long-tail claims processes and the low inflation environment should see reserve releases continue above long-run expectations in the short to medium term.
The New Zealand business remains well positioned to deliver profitable growth in both personal and commercial classes. The business will continue to replicate the success of the Australian simplification program and vertical integration to drive greater efficiency.
Suncorp Bank is well positioned to continue growing at 1 to 1.3 times system supported by its diversified funding base, ‘A+/A1’ credit ratings, and strong capital position, as well as leveraging its significant investment in technology and capability.
For
per
sona
l use
onl
y
SUNCORP GROUP LIMITED DIRECTORS’ REPORT 14
11. LIKELY DEVELOPMENTS
Australian economic growth is expected to remain subdued as the economy transitions from mining-led growth to a more broad-based expansion. The low yield environment persists, with interest rates at historical lows creating challenges for product pricing and investment management. Competition, regulatory and political reform are ongoing headwinds to the financial services sector, while emerging fintech companies are driving change and disruption to traditional business models.
In this context, the Group has refined its strategy to drive growth and increase resilience to volatility. The Group is well capitalised and has a diversified earnings base that provides a strong foundation to create value for customers, shareholders, employees and communities with the ‘One Suncorp’ business model. By maximising its strategic assets of cost, capital and culture, the Group will create greater value for customers, leading to higher customer retention and revenues.
Key priorities are to maintain stability and momentum, elevate the customer, and recalibrate costs.
Maintaining stability and momentum in the Group’s traditional business will be achieved through execution of key programs such as working claims remediation, the core banking system, Super Simplification and Optimisation. In addition, progress is well underway to recalibrate costs to create a leaner and more resilient organisation.
The Group’s priority to elevate the customer is focused on broadening relationships with existing customers. The Group will deliver greater value for customers by meeting customers’ needs more consistently and by providing access to the marketplace. The marketplace will help customers navigate complexity, make better choices and allow them to interact with the Group in any way they choose, through both digital and physical channels.
In the medium term, the Group’s key targets are:
• broadening of customer relationships
• flat cost base in the 2017 and 2018 financial years
• improving underlying net profit after tax
• sustainable return on equity of at least 10%
• maintaining a dividend payout ratio of 60% to 80% of cash earnings; and
• returning excess capital.
General Insurance is focused on rectifying claims costs in the Personal Insurance business, which together with other initiatives, will drive ongoing improvement in underlying insurance margins.
Personal Insurance expects to achieve low single digit GWP growth, reflective of input costs increasing across the industry. New business is likely to remain challenging; however, retention levels should remain stable as claims processing improvements translate to improving customer satisfaction. Continued focus on expense management, improved working claims costs and additional benefits from vertical supply chain initiatives will support further improvement to results.
Commercial Insurance continues to target profitable growth through targeted repricing and entry into new markets. Entry into the South Australian CTP market from 1 July 2016 represents an opportunity for the Group to further cement its position as Australia’s largest personal injury insurer. Low investment yields create an ongoing challenge for margins; however, ongoing benefits from improved long-tail claims processes and the low inflation environment should see reserve releases continue above long-run expectations in the short to medium term.
The New Zealand business remains well positioned to deliver profitable growth in both personal and commercial classes. The business will continue to replicate the success of the Australian simplification program and vertical integration to drive greater efficiency.
Suncorp Bank is well positioned to continue growing at 1 to 1.3 times system supported by its diversified funding base, ‘A+/A1’ credit ratings, and strong capital position, as well as leveraging its significant investment in technology and capability.
SUNCORP GROUP LIMITED DIRECTORS’ REPORT 15
Completion of the core banking platform has delivered a simplified and resilient core banking infrastructure that provides agility and reduced time-to-market for new products and offerings. The decommissioning of legacy systems throughout the 2017 financial year will drive the Bank’s cost to income ratio towards 50%.
The Bank also continues to engage with APRA on the Basel II Advanced Accreditation program. The Bank is currently operating as an advanced bank and has implemented advanced risk practices, supporting sustainable, profitable growth.
Life is well placed to deliver stable growth through both IFA and direct distribution channels. The Suncorp marketplace presents an exciting opportunity for Direct Life, as the Group begins to offer more comprehensive propositions to its almost nine million customers.
The IFA channel remains an important segment for Life. Despite regulatory reform being postponed, the market appears to have stabilised, positioning Life well to deliver stable planned margins based on conservative experience assumptions which anticipate elevated lapses and claims through to the end of the 2018 financial year.
12. KEY INTERNAL AND EXTERNAL RISKS
The risks Suncorp Group manages include strategic, insurance, counterparty, market, asset and liability, liquidity, operational, and compliance-related risks. Specific detail on Suncorp’s approach to Corporate Responsibility including the identification of non-financial risks and opportunities is contained in the Suncorp Group 2015/16 Annual Review available from suncorpgroup.com.au/investors/reports.
Policies, procedures, limits and other controls are in place at either the Suncorp Group or functional level to manage these risks and align to the Board’s risk appetite.
The key business risks that may impact business strategies and financial prospects include:
shifts in competitor dynamics and markets, including new sources of competition from non-traditional sources, associated technological advancement and disruptive business models. This is being mitigated by the Group’s strategic planning processes, innovation programs, continual market and competitor monitoring and leveraging the Group’s scale, brands and pricing capability to build a competitive advantage.
loss, compromise or unavailability of Suncorp-wide data due to failure to maintain a secure technology environment. Suncorp’s Technology, Data and Labs function has oversight of key cyber-security threats, and is continually investing in the systems, processes and controls to manage this risk and respond to emerging threats. The importance of and accountability for security is reinforced to all staff through policy, procedures and education.
the challenges in attracting and retaining the right capability to meet the ongoing requirements of Suncorp, within a global marketplace competing for talent. The People Experience agenda aims to build and sustain an effective workforce by balancing Suncorp’s needs, for today and tomorrow, with the changing expectations of a global workforce. Suncorp focuses its activities on having the right culture, work environments, capability, and leadership to deliver the business strategy.
impacts of climate change, significant weather events and natural hazards that exceed expectations. Advanced natural hazard catastrophe modelling and a reinsurance program are designed and managed to maintain earnings volatility within the Board’s risk appetite.
risks relating to the delivery of strategic initiatives, including Suncorp’s new operating model. Transformation initiatives are appropriately resourced, leveraging the Group’s agile way of working and have established change management programs.
the affordability of insurance. Suncorp is an active participant in this industry-wide issue and is proactively working to identify new products and services that are accessible to all members of the community.
For
per
sona
l use
onl
y
SUNCORP GROUP LIMITED DIRECTORS’ REPORT 16
risks relating to the failure to meet government or regulatory expectations. The business has dedicated and well-established programs in place to lead the development and implementation of regulatory change. The Group actively participates in industry-wide focus areas and is committed to ensuring a strong organisational culture, focused on doing the right thing for all key stakeholders. The Group also engages with the government and regulators on a regular and proactive basis.
ongoing economic instability and a continued low yield environment. Suncorp consistently monitors these risks by examining market conditions and adopts appropriate strategies to help protect the Group.
More complete information on risk management and the overall Suncorp Group governance framework is in the Company’s detailed Corporate Governance Statement available at suncorpgroup.com.au/about-us/governance.
13. IMPACT OF LEGISLATION AND OTHER EXTERNAL REQUIREMENTS
The Suncorp Group operates across a number of heavily regulated industry sectors.
There continues to be significant domestic and global legislative and regulatory reforms and proposals, and government and regulator consultations, reviews and inquiries which may result in changes or proposals that could or may impact the Suncorp Group and its operations in Australia and New Zealand now and in the future.
Some of the various matters that could or may impact the Suncorp Group include:
the Australian Consumer Law (ACL) review
financial benchmark regulatory reform relating to the administration of significant benchmarks, submissions to significant benchmarks and offences applying to benchmark misconduct
the Northern Australia Insurance Premiums Taskforce report which explores the feasibility of options to lower insurance premiums in Northern Australia
the Federal Parliamentary Joint Committee on Corporations and Financial Services inquiry into the impairment of customer loans
the Federal Government’s proposed approach to Fintech developments such as crowdfunding and blockchain
the Federal Parliamentary Senate Committee Scrutiny of Financial Advice and Life Insurance inquiry
Australian banks’ response to implement comprehensive new measures to protect consumer interests, increase transparency and accountability under the Australian Bankers’ Association ‘six point plan’
the Federal Government’s proposal to amend the misuse of market power provisions of the ACL
the Productivity Commission inquiry into the efficiency and competitiveness of Australia’s superannuation system
the Australian Securities and Investments Commission (ASIC) review of the claims management practices of life insurance companies and its review of add-on insurance products
the Federal Government’s proposals to lift the professional, ethical and education standards of the financial services industry
the abolition by the New South Wales Government of the current scheme for funding State fire and emergency services expenditure where the expenditure is funded through contributions required to be paid by insurance companies under various New South Wales acts; and
the Federal Budget 2016/17 measures and announcements that impact personal income tax, company tax, superannuation and other areas.
The results of the latest Federal election may impact on some of the matters referred to in this section, but at this stage it is too early to tell if there will be any impact and if so, the extent of that impact.
There continue to be significant proposals and changes from global regulatory advisory and standard setting bodies such as the International Association of Insurance Supervisors, the Basel Committee on Banking Supervision (BCBS), the International Organisation of Securities Commissions and the Financial Stability Board which if adopted, or followed, by domestic regulators may increase operational and capital costs or requirements.
SUNCORP GROUP LIMITED DIRECTORS’ REPORT 17
13.1 AUSTRALIA
Financial System Inquiry
The Final Report (Report) of the Financial System Inquiry (Inquiry) was released on 7 December 2014. The Report made 44 recommendations including advising on the level of capital banks should hold and minimum standards of education for financial advisers. The Federal Government has accepted all but one of the recommendations. The Federal Government is progressively implementing the recommendations it has agreed to and as such it is difficult at this stage to judge the full impact of the Report’s recommendations on the Suncorp Group and its operations.
Austral ian Prudential Regulat ion Authori ty Level 3 f ramework
APRA released further clarification to the proposed framework for the supervision of Level 3 conglomerate groups (the Level 3 framework) in March 2016. The Level 3 framework will apply to the Suncorp Group and imposes group-wide requirements in relation to governance, exposure management, risk management and capital adequacy. The new draft prudential standards for the Level 3 framework commence on 1 July 2017; however, in respect of the timetable for implementation of the Level 3 framework it is not expected the capital requirements will come into force until 2019.
The Suncorp Group remains well placed to implement the proposed requirements.
Financial advice reforms
The Federal Government has finalised the future of financial advice (FOFA) reforms. It is anticipated that some of the FOFA reforms will lessen the impact of some of the regulatory requirements imposed on the Suncorp Group.
There have also been numerous inquiries (both completed and ongoing) into, and reports on, the financial adviser and life insurance industries including those by the Inquiry, various Federal Parliamentary Committees, and ASIC. The Federal Government has commenced consultation on its proposal to lift the professional, ethical and education standards in the financial services industry. It is likely that there will be changes to the distribution requirements and models for financial advisers and life insurance as a result of the proposed changes.
Basel I I I Capital and Liquidity reforms
APRA has continued to implement the prudential framework applicable to Australian banks under the Basel III capital and liquidity reforms established by the BCBS. Commencing from 1 January 2015, Suncorp Bank has been required to meet the liquidity coverage ratio (LCR) imposed under APS 210 Liquidity. The LCR is intended to ensure that banks hold sufficient liquid assets to meet a defined acute stress scenario. In October 2014, the BCBS released its final standard on the net stable funding ratio (NSFR) which is intended to encourage longer term funding resilience. APRA is currently consulting on the NSFR requirements in Australia and it is expected that APRA will require Suncorp Bank and some other Australian authorised deposit-taking institutions to meet the NSFR by 1 January 2018.
The Basel III reforms impose higher regulatory capital requirements for Suncorp Bank than existed under previous regulatory regimes.
Over-the-counter Derivatives reform
APRA is presently consulting on the establishment of margins for over-the-counter (OTC) derivatives that are not cleared by a central counterparty.
For
per
sona
l use
onl
y
SUNCORP GROUP LIMITED DIRECTORS’ REPORT 18
Northern Australia Insurance Premiums Taskforce
The Northern Australia Insurance Premiums Taskforce was asked by the Federal Government if the government could ‘provide support to a reinsurance pool or a mutual insurer that provides cyclone-specific cover’ and other policy options to reduce insurance premiums in Northern Australia. The taskforce provided its final report to the Federal Government in November 2015 which was released to the public in March 2016. The final report addresses the feasibility of a mutual cyclone insurer and a cyclone reinsurance pool and recommends mitigation as the way forward. The Federal Government is yet to deliver its response to the final report. AAI Limited is a significant insurer in Northern Queensland.
South Australian CTP Insurance Scheme Reform
South Australia has opened its CTP scheme for competitive underwriting from 1 July 2016. For the first three years CTP insurance will be provided by a set of eligible insurers with premium prices fixed and governed by a CTP regulator. From the fourth year the market will be fully contestable.
AAI Limited will provide CTP insurance from 1 July 2016 as part of the transition to a fully competitive CTP market.
New South Wales Government proposes reforming the NSW CTP Scheme
The New South Wales Government is proposing to reform the State’s CTP motor accident insurance scheme (Scheme) by adopting a hybrid model (Hybrid Scheme).
The Hybrid Scheme will provide for defined benefits available to all people injured in a motor vehicle accident, regardless of fault and modified common law damages (which are fault based) for the more seriously injured.
An expert reference panel along with technical working groups will be established that include relevant stakeholders and service providers to assist the New South Wales State Insurance Regulatory Authority to design the new scheme and its processes in detail, and to provide advice to Government for the formulation of a Bill that will be tabled in Parliament.
Subject to Parliament’s approval, the Hybrid Scheme could come into effect from July 2017.
Queensland Government Review of Queensland CTP Scheme
The Queensland Government intends to review the current Queensland CTP scheme by 2017, principally it seems, in relation to costs.
Federal Government Life Insurance Industry Remunerat ion reforms
The Federal Government is intending to reform life insurance industry remuneration practices and had introduced legislation to do so into Federal Parliament earlier this year, which lapsed when the Federal Parliament was prorogued in April 2016. The broad effect of the reforms is to place a cap on commissions and ban volume based payments in respect of life risk insurance products, with ASIC having the power to exempt some products from the ban.
13.2 NEW ZEALAND
Revised Fair Insurance Code
The Insurance Council of New Zealand (ICNZ) has published a revised Fair Insurance Code which came into force from 1 January 2016. The Code will expand upon the existing obligations of ICNZ members with key changes including strict timing requirements for claims handling decisions, breach reporting processes and changes to dispute resolution processes. Members of the ICNZ include AA Insurance Limited and Vero Insurance New Zealand Limited.
SUNCORP GROUP LIMITED DIRECTORS’ REPORT 19
New Zealand Reserve Bank Review of the Insurance (Prudential Supervision) Act
The New Zealand Reserve Bank will review the Insurance (Prudential Supervision) Act 2010 (Act) over the next two years. The review seeks to ensure that the Act provides for a supervisory regime that is cost effective, risk-based and that promotes the soundness and efficiency of the insurance sector. It is not expected that any changes would be made before 2018 at the earliest.
14. ENVIRONMENTAL REGULATION
The National Greenhouse and Energy Reporting Act 2007 (NGER) provides a national framework for corporations to report greenhouse gas emissions and energy consumption and production. The Group has reported annual reductions in emissions under the NGER scheme since 2010/11.
The Group’s operations are not currently subject to any other particular and significant environmental regulation under any law of the Commonwealth of Australia or any of its states or territories. The Group may, however, become subject to state environmental regulation when enforcing securities over land for the recovery of loans. The Group has not incurred any liability (including for rectification costs) under any environmental legislation.
15. INDEMNIFICATION AND INSURANCE OF OFFICERS
Under the Company’s Constitution, the Company indemnifies each person who is or has been a director or officer of the Company. The indemnity relates to all liabilities to another party (other than the Company or a related body corporate) that may arise in connection with the performance of their duties to the Company and its subsidiaries, except where the liability arises out of conduct involving a lack of good faith. The Constitution stipulates that the Company will meet the full amount of such liabilities, including costs and expenses incurred in successfully defending civil or criminal proceedings or in connection with an application, in relation to such proceedings, in which relief is granted under the Corporations Act 2001.
The Company has also executed deeds of access, indemnity and insurance with directors and secretaries of the Company and its subsidiaries, and deeds of indemnity and insurance with directors of related bodies corporate and joint venture companies. Those deeds, which are subject to certain conditions and limitations, provide an indemnity to the full extent permitted by law for liabilities incurred by that person as an officer, including reasonable legal costs incurred in respect of certain legal proceedings and an entitlement to directors’ and officers’ liability insurance. The deeds containing access rights provide access to company books following the cessation of the officer’s position with the relevant company.
During the financial year ended 30 June 2016, the Company paid insurance premiums in respect of a directors’ and officers’ liability insurance contract. The contract insures each person who is or has been a director or officer (as defined in the Corporations Act 2001) of the Company against certain liabilities arising in the course of their duties to the Company and its subsidiaries. The directors have not included details of the nature of the liabilities covered or the amount of the total premium paid in respect of the insurance contract as such disclosure is prohibited under the terms of the contract.
16. CORPORATE GOVERNANCE STATEMENT IS ONLINE
During the 2015/16 financial year, Suncorp Group complied with the ASX Corporate Governance Council’s Corporate Governance Principles and Recommendations (3rd edition). The 2015/16 Corporate Governance Statement (and Appendix 4G) lodged with the ASX, and a range of documents referred to in it, are available on the Suncorp Group website at suncorpgroup.com.au/about-us/governance. F
or p
erso
nal u
se o
nly

SUNCORP GROUP LIMITED DIRECTORS’ REPORT 20
17. NON-AUDIT SERVICES
During the year, KPMG, the Company’s auditor, performed certain services in addition to the audit and review of the financial statements.
The Board has considered the non-audit services provided during the financial year by the auditor and, having received the appropriate confirmations from the Audit Committee, is satisfied that the auditor’s provision of those non-audit services is compatible with, and did not compromise, the auditor independence requirements of the Corporations Act 2001 for the following reasons:
• all non-audit services were subject to the corporate governance procedures adopted by the Company and have been reviewed by the Audit Committee to ensure they do not impact the integrity and objectivity of the auditor; and
• the non-audit services provided do not undermine the general principles relating to auditor independence as set out in APES 110 Code of Ethics for Professional Accountants, as they did not involve reviewing or auditing the auditor’s own work, acting in a management or decision-making capacity for the Company, acting as an advocate for the Company or jointly sharing risks and rewards.
Details of the amounts paid or due and payable to the auditor of the Company, KPMG, and its related practices for non-audit services provided during the financial year are set out below:
SERVICES OTHER THAN STATUTORY AUDIT
2016 $000
2015 $000
Audit-related fees (regulatory)
APRA reporting 860 755
Australian financial services licences 162 134
Other regulatory compliance services 336 386
1,358 1,275
Audit-related fees (non-regulatory)
Other assurance services 2,228 3,553
2,228 3,553
Other services
Tax compliance 12 12
Other non-audit related services 27 42
39 54
3,625 4,882
18. LEAD AUDITOR’S INDEPENDENCE DECLARATION
The lead auditor’s independence declaration is set out on page 47 and forms part of the Directors’ Report for the financial year ended 30 June 2016.
19. ROUNDING OF AMOUNTS
The Company is of a kind referred to in ASIC Corporations (Rounding in Financial/Directors’ Reports) Instrument 2016/191 dated 24 March 2016 and in accordance with that Class Order, amounts in the Directors’ Report and the consolidated financial report have been rounded to the nearest one million dollars unless otherwise stated.
For
per
sona
l use
onl
y
SUNCORP GROUP LIMITED DIRECTORS’ REPORT 20
17. NON-AUDIT SERVICES
During the year, KPMG, the Company’s auditor, performed certain services in addition to the audit and review of the financial statements.
The Board has considered the non-audit services provided during the financial year by the auditor and, having received the appropriate confirmations from the Audit Committee, is satisfied that the auditor’s provision of those non-audit services is compatible with, and did not compromise, the auditor independence requirements of the Corporations Act 2001 for the following reasons:
• all non-audit services were subject to the corporate governance procedures adopted by the Company and have been reviewed by the Audit Committee to ensure they do not impact the integrity and objectivity of the auditor; and
• the non-audit services provided do not undermine the general principles relating to auditor independence as set out in APES 110 Code of Ethics for Professional Accountants, as they did not involve reviewing or auditing the auditor’s own work, acting in a management or decision-making capacity for the Company, acting as an advocate for the Company or jointly sharing risks and rewards.
Details of the amounts paid or due and payable to the auditor of the Company, KPMG, and its related practices for non-audit services provided during the financial year are set out below:
SERVICES OTHER THAN STATUTORY AUDIT
2016 $000
2015 $000
Audit-related fees (regulatory)
APRA reporting 860 755
Australian financial services licences 162 134
Other regulatory compliance services 336 386
1,358 1,275
Audit-related fees (non-regulatory)
Other assurance services 2,228 3,553
2,228 3,553
Other services
Tax compliance 12 12
Other non-audit related services 27 42
39 54
3,625 4,882
18. LEAD AUDITOR’S INDEPENDENCE DECLARATION
The lead auditor’s independence declaration is set out on page 47 and forms part of the Directors’ Report for the financial year ended 30 June 2016.
19. ROUNDING OF AMOUNTS
The Company is of a kind referred to in ASIC Corporations (Rounding in Financial/Directors’ Reports) Instrument 2016/191 dated 24 March 2016 and in accordance with that Class Order, amounts in the Directors’ Report and the consolidated financial report have been rounded to the nearest one million dollars unless otherwise stated.
SUNCORP GROUP LIMITED REMUNERATION REPORT 21
REMUNERATION REPORT
Dear Shareholder
The Board is pleased to present Suncorp Group’s Remuneration Report for the financial year ended 30 June 2016.
The Remuneration Policy and practices foster a ‘pay for performance’ culture, linking executive remuneration to the achievement of the Group’s strategic objectives. A significant portion of executives’ remuneration is ‘at-risk’, with outcomes linked to the financial and non-financial performance achievements aimed at generating superior and sustainable returns for shareholders.
During 2016, we have introduced appropriate changes in the Senior Executive remuneration structure to enhance the alignment with our shareholders and ensure an appropriate competitive pay position. This will be continued into the 2017 financial year, as Suncorp introduces an equity based deferral vehicle for short-term incentives. This enhances the alignment to shareholder value. The equity based deferral will apply to the short-term incentive award relating to the 2017 year for the CEO & Managing Director and Senior Executives. As we continue to evaluate the effectiveness of our reward structures, we are considering the merits of introducing a second performance hurdle in the long-term incentive plan that is aligned to our ongoing strategy.
The Board is committed to a fair and responsible executive remuneration framework in this increasingly dynamic and competitive environment. Feedback from regulators, shareholders and our stakeholders is actively encouraged and used in the development of our remuneration practices to ensure we continue to provide the appropriate balance between performance and executive reward. The Board and the Remuneration Committee hope you find the information provided in the report informative.
DR ZIGGY SWITKOWSKI AO
Chairman of the Board
CHRISTINE MCLOUGHLIN
Chairman of the Remuneration Committee
4 August 2016
For
per
sona
l use
onl
y
SUNCORP GROUP LIMITED REMUNERATION REPORT 22
INTRODUCTION
This Remuneration Report explains how Suncorp Group’s performance for the financial year ended 30 June 2016 (2016) has driven remuneration outcomes for the executives who are Suncorp Group’s key management personnel (KMP). KMP are the people who have authority and responsibility for planning, directing and controlling the activities of Suncorp Group, as listed in the following table.
Name Position Changes during 2016
Non-executive directors Dr Zygmunt Switkowski AO Chairman
Mr William Bartlett Director
Ms Audette Exel AO Director
Ms Sally Herman Director Appointed 22 October 2015
Mr Ewoud Kulk Director
Ms Christine McLoughlin Director
Dr Douglas McTaggart Director
Mr Geoffrey Ricketts CNZM Director
Former non-executive director Mr Michael Cameron Director Retired 30 September 2015
Executive director Mr Michael Cameron CEO and Managing Director Appointed 1 October 2015
Former executive director Mr Patrick Snowball Group CEO and Managing Director Retired 30 September 2015
Senior Executives Mr Anthony Day Chief Executive Officer Insurance
Mr Gary Dransfield Chief Executive Officer Customer Platforms
Mr Clayton Herbert Chief Transformation Officer
Mr Steve Johnston Chief Financial Officer
Ms Anna Lenahan Chief Risk and Legal Officer
Mr John Nesbitt Chief Executive Officer Banking & Wealth
Mr Mark Reinke Chief Customer Experience Officer
Ms Amanda Revis Chief People Experience Officer
Mr Paul Smeaton Chief Executive Officer New Zealand Appointed 14 September 2015
Former Senior Executives Mr Mark Milliner Chief Executive Officer Personal Insurance Employment ceased 27 January 2016
Mr Matt Pancino Chief Information Officer Employment ceased 29 April 2016
Mr Geoff Summerhayes Chief Executive Officer Suncorp Life Employment ceased 2 January 2016 This Remuneration Report – which forms part of the Directors’ Report – has four sections:
1. an overview of Suncorp Group’s performance in 2016
2. the remuneration for the CEO and Managing Director (CEO & Managing Director) and Senior Executives (defined as the executives reporting to the CEO & Managing Director who are KMP)
3. the remuneration for the non-executive directors
4. information regarding loans and equity instrument movements in relation to KMP, their close family members, or entities they control or over which they have significant influence.
For
per
sona
l use
onl
y

SUNCORP GROUP LIMITED REMUNERATION REPORT 22
INTRODUCTION
This Remuneration Report explains how Suncorp Group’s performance for the financial year ended 30 June 2016 (2016) has driven remuneration outcomes for the executives who are Suncorp Group’s key management personnel (KMP). KMP are the people who have authority and responsibility for planning, directing and controlling the activities of Suncorp Group, as listed in the following table.
Name Position Changes during 2016
Non-executive directors Dr Zygmunt Switkowski AO Chairman
Mr William Bartlett Director
Ms Audette Exel AO Director
Ms Sally Herman Director Appointed 22 October 2015
Mr Ewoud Kulk Director
Ms Christine McLoughlin Director
Dr Douglas McTaggart Director
Mr Geoffrey Ricketts CNZM Director
Former non-executive director Mr Michael Cameron Director Retired 30 September 2015
Executive director Mr Michael Cameron CEO and Managing Director Appointed 1 October 2015
Former executive director Mr Patrick Snowball Group CEO and Managing Director Retired 30 September 2015
Senior Executives Mr Anthony Day Chief Executive Officer Insurance
Mr Gary Dransfield Chief Executive Officer Customer Platforms
Mr Clayton Herbert Chief Transformation Officer
Mr Steve Johnston Chief Financial Officer
Ms Anna Lenahan Chief Risk and Legal Officer
Mr John Nesbitt Chief Executive Officer Banking & Wealth
Mr Mark Reinke Chief Customer Experience Officer
Ms Amanda Revis Chief People Experience Officer
Mr Paul Smeaton Chief Executive Officer New Zealand Appointed 14 September 2015
Former Senior Executives Mr Mark Milliner Chief Executive Officer Personal Insurance Employment ceased 27 January 2016
Mr Matt Pancino Chief Information Officer Employment ceased 29 April 2016
Mr Geoff Summerhayes Chief Executive Officer Suncorp Life Employment ceased 2 January 2016 This Remuneration Report – which forms part of the Directors’ Report – has four sections:
1. an overview of Suncorp Group’s performance in 2016
2. the remuneration for the CEO and Managing Director (CEO & Managing Director) and Senior Executives (defined as the executives reporting to the CEO & Managing Director who are KMP)
3. the remuneration for the non-executive directors
4. information regarding loans and equity instrument movements in relation to KMP, their close family members, or entities they control or over which they have significant influence.
SUNCORP GROUP LIMITED REMUNERATION REPORT 23
In accordance with Section 308(3C) of the Corporations Act 2001, the external auditors, KPMG, have audited sections 2, 3 and 4. For the purposes of this report, ‘executive’ means any of the CEO & Managing Director and the Senior Executives.
1. SUMMARY OF 2016 PERFORMANCE AND REMUNERATION
1.1 2016 PERFORMANCE SUMMARY
Focus Description Further information
Key financial outcomes Suncorp delivered Total Shareholder Returns (TSR) of negative 0.9% for the year ended 30 June 2016. Whilst this is short of our aspirations, and what we have delivered in recent periods, it compares to our peer group who delivered a total return of negative 6.5% for the year.
Suncorp’s TSR for the five year period ending 30 June 2016 is 104%, more than double the ASX 200 Accumulation Index return of 43% for the comparable period.
Profit after tax from the Group’s core businesses of General Insurance, Bank and Life is $1,159 million. The Group’s reported net profit after tax, before non-controlling interests is $1,038 million.
Total declared dividends for 2016 will be 68 cents per share, consisting of a 30 cent per share interim dividend, and a 38 cent per share final dividend.
Return on Equity for the year ended 30 June 2016 is 7.8%.
Section 2.5 and the Financial Statements
Appropriate risk management
An effective risk culture is vital in the determination of performance and remuneration outcomes. Suncorp ensures the alignment between remuneration and risk is managed through: deferral of a significant portion of executives’ short-term
incentives (STI) potential clawback of executives’ deferred STI and unvested
long-term incentives (LTI) separate performance and remuneration review processes for risk
and financial control personnel; and a hedging prohibition on Suncorp securities (including any unvested
performance rights).
Section 2.7
Safety and Wellbeing The Group’s Safety and Wellbeing plan continues to deliver benefits with lost time injuries down to 40 incidents, compared to an average of 56 for the prior five financial years.
Section 2.5
Customer satisfaction Customer performance, as assessed through customer Net Promoter scores, has remained strong.
Section 2.5
Strengthening the alignment of executives’ and directors’ interests with those of shareholders
A minimum shareholding requirement for the CEO & Managing Director, Senior Executives and non-executive directors was introduced in 2014. All executives and directors who were in office when this requirement was introduced are on track to hold sufficient shares to meet the minimum holding requirement by October 2017.
Sections 2.7 and 3.1
Appropriate fixed remuneration for executives and fees for non-executive directors
To ensure continued market competitiveness the remuneration mix for Senior Executives was realigned in 2016. Non-executive directors’ fees were also reviewed and realigned to the market.
Sections 2.3, 2.4 and 3.1
For
per
sona
l use
onl
y

SUNCORP GROUP LIMITED REMUNERATION REPORT 24
The graph below shows the value over time of a $100 investment made on 1 July 2011, with the Suncorp Group Limited ordinary shares return index outperforming the S&P/ASX 50 total return (accumulation) index by 42.2% over the five years to 30 June 2016.
1.2 REMUNERATION SUMMARY
Remuneration component Description Changes in 2016
Further information
Fixed remuneration
Comprised of base salary and superannuation.
Fixed remuneration increased for all Senior Executives to balance the reduction in at-risk remuneration and better alignment to the market.
Section 2.4
Short-term incentives (STI)
Determined by a scorecard of financial and non-financial measures. A portion is deferred as cash for two years.
Target STI reduced from 125% of fixed remuneration to 100%.
Section 2.5
Long-term incentives (LTI)
Performance rights with a Total Shareholder Return (TSR) hurdle measured relative to a peer comparator group.
Target LTI remains at 100% of fixed remuneration.
Section 2.6
For
per
sona
l use
onl
y
SUNCORP GROUP LIMITED REMUNERATION REPORT 24
The graph below shows the value over time of a $100 investment made on 1 July 2011, with the Suncorp Group Limited ordinary shares return index outperforming the S&P/ASX 50 total return (accumulation) index by 42.2% over the five years to 30 June 2016.
1.2 REMUNERATION SUMMARY
Remuneration component Description Changes in 2016
Further information
Fixed remuneration
Comprised of base salary and superannuation.
Fixed remuneration increased for all Senior Executives to balance the reduction in at-risk remuneration and better alignment to the market.
Section 2.4
Short-term incentives (STI)
Determined by a scorecard of financial and non-financial measures. A portion is deferred as cash for two years.
Target STI reduced from 125% of fixed remuneration to 100%.
Section 2.5
Long-term incentives (LTI)
Performance rights with a Total Shareholder Return (TSR) hurdle measured relative to a peer comparator group.
Target LTI remains at 100% of fixed remuneration.
Section 2.6
SUNCORP GROUP LIMITED REMUNERATION REPORT 25
2. EXECUTIVE REMUNERATION
2.1 REMUNERATION GOVERNANCE FRAMEWORK
Remunerat ion Committee
The Remuneration Committee facilitates remuneration matters at Suncorp on behalf of the Board. The Committee, which operates under its own charter and reports to the Board, is chaired by Ms Christine McLoughlin who has extensive experience in both business and governance. The other members of the Remuneration Committee are all accomplished and experienced independent non-executive directors of Suncorp Group with backgrounds in business and accounting, their full biographies are set out in the Directors’ Report.
REMUNER ATION COMMITTEE MEMBERSHIP AS AT 30 JUNE 2016 1
Chairman Ms Christine McLoughlin
Members Mr William Bartlett
Mr Ewoud Kulk
Dr Douglas McTaggart
Ex officio member Dr Zygmunt Switkowski AO While the Board has overall responsibility for the executive remuneration structure and outcomes, the Remuneration Committee:
• supports the Board to fulfil its responsibility to shareholders with regard to prudent remuneration management and compliance with the requirements of APRA’s Prudential Standards
• considers strong remuneration governance as an ongoing, continual improvement activity
• closely monitors the remuneration framework to ensure it meets the key goal that sustainable, risk-adjusted, long-term performance forms the basis of reward outcomes, and employees’ and shareholders’ interests are aligned
• takes account of advice from the CEO & Managing Director, other members of management and, where relevant, independent external advisers; and
• oversees the preparation of this Remuneration Report.
The Remuneration Committee met six times during 2016 and fully discharged its responsibilities in accordance with the Remuneration Committee Charter.
The Charter, which the Board reviews regularly for appropriateness, was confirmed in June 2015 and is available at suncorpgroup.com.au/about-us/governance.
While the Remuneration Committee believes Suncorp Group’s Remuneration Policy and strategy serves the Group’s needs, it will proactively continue to ensure these evolve in response to emerging regulatory developments and capital requirements.
More information on the responsibilities of the Remuneration Committee can be found in the Corporate Governance Statement at suncorpgroup.com.au/about-us/governance.
Suncorp Group’s remuneration governance framework, which meets the standards expected by the ASX Corporate Governance Principles and Recommendations (3rd edition), is summarised below.
1 Ms Christine McLoughlin was appointed Chairman of the Remuneration Committee effective 1 January 2016. Mr William Bartlett ceased to be Chairman of the Remuneration Committee effective 31 December 2015. Dr Douglas McTaggart was appointed as a member of the Remuneration Committee effective 1 January 2016.
For
per
sona
l use
onl
y
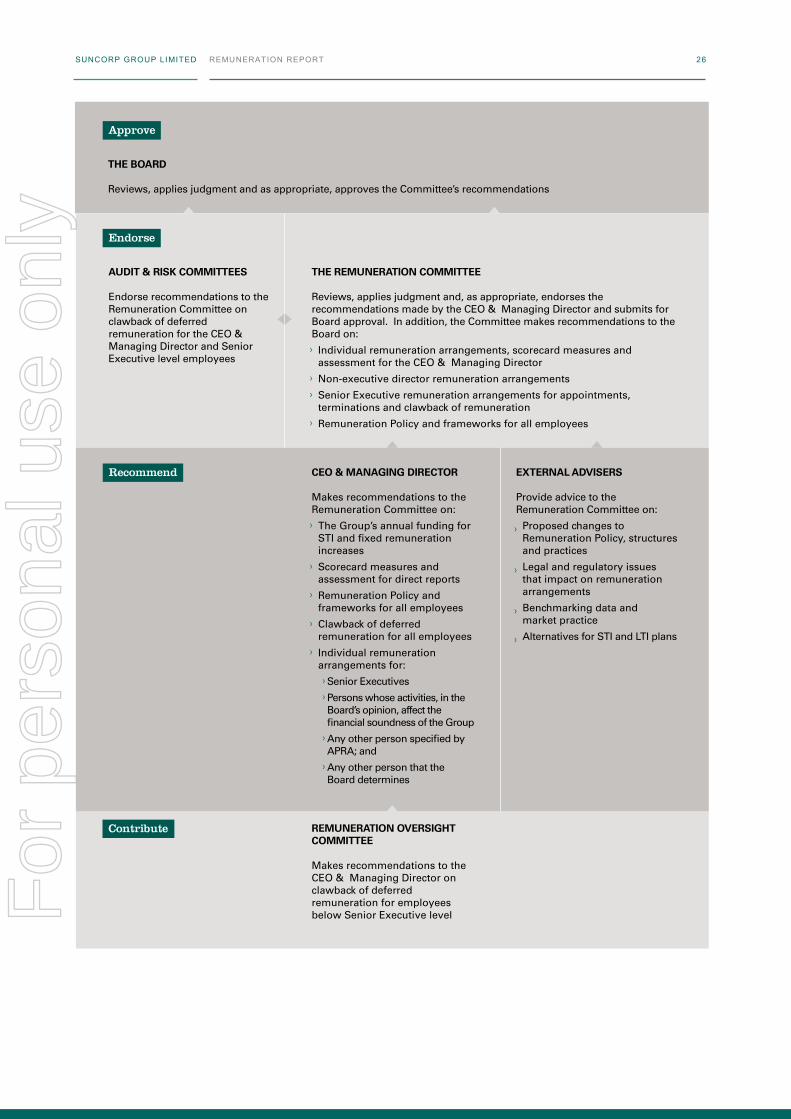
SUNCORP GROUP LIMITED REMUNERATION REPORT 26
For
per
sona
l use
onl
y
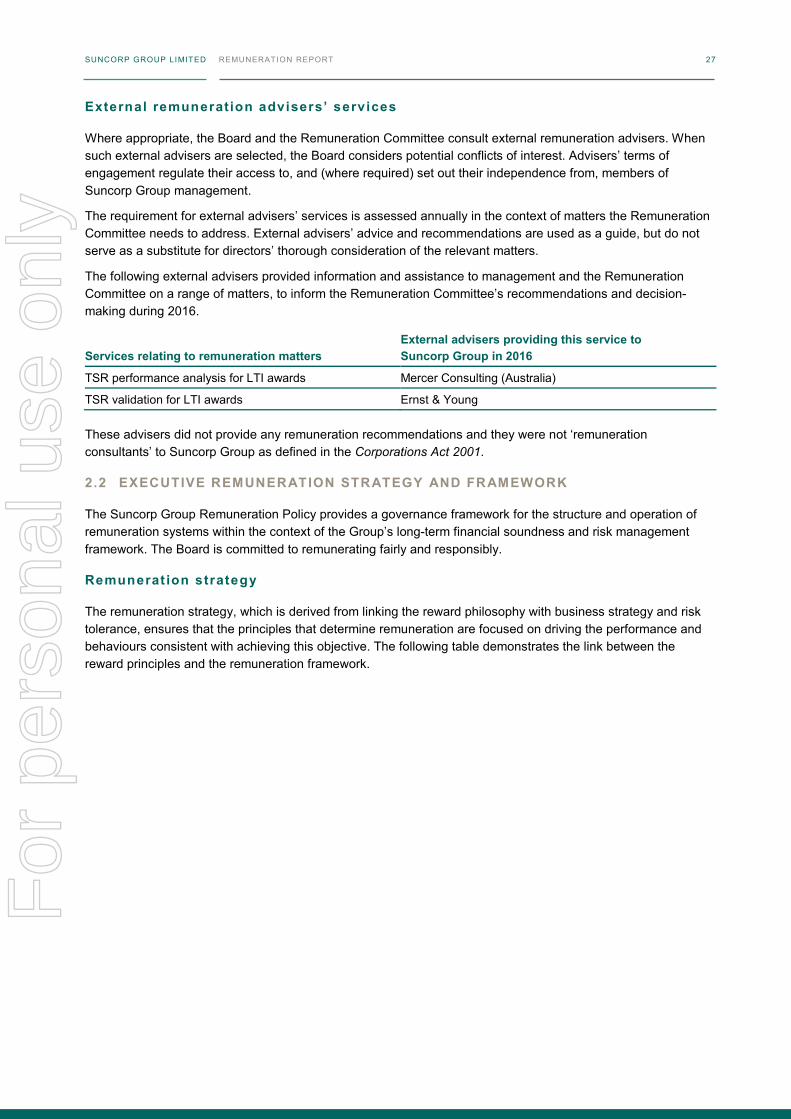
SUNCORP GROUP LIMITED REMUNERATION REPORT 26
SUNCORP GROUP LIMITED REMUNERATION REPORT 27
External remuneration advisers’ services
Where appropriate, the Board and the Remuneration Committee consult external remuneration advisers. When such external advisers are selected, the Board considers potential conflicts of interest. Advisers’ terms of engagement regulate their access to, and (where required) set out their independence from, members of Suncorp Group management.
The requirement for external advisers’ services is assessed annually in the context of matters the Remuneration Committee needs to address. External advisers’ advice and recommendations are used as a guide, but do not serve as a substitute for directors’ thorough consideration of the relevant matters.
The following external advisers provided information and assistance to management and the Remuneration Committee on a range of matters, to inform the Remuneration Committee’s recommendations and decision-making during 2016.
Services relating to remuneration matters External advisers providing this service to Suncorp Group in 2016
TSR performance analysis for LTI awards Mercer Consulting (Australia)
TSR validation for LTI awards Ernst & Young These advisers did not provide any remuneration recommendations and they were not ‘remuneration consultants’ to Suncorp Group as defined in the Corporations Act 2001.
2.2 EXECUTIVE REMUNERATION STRATEGY AND FRAMEWORK
The Suncorp Group Remuneration Policy provides a governance framework for the structure and operation of remuneration systems within the context of the Group’s long-term financial soundness and risk management framework. The Board is committed to remunerating fairly and responsibly.
Remunerat ion strategy
The remuneration strategy, which is derived from linking the reward philosophy with business strategy and risk tolerance, ensures that the principles that determine remuneration are focused on driving the performance and behaviours consistent with achieving this objective. The following table demonstrates the link between the reward principles and the remuneration framework.
For
per
sona
l use
onl
y
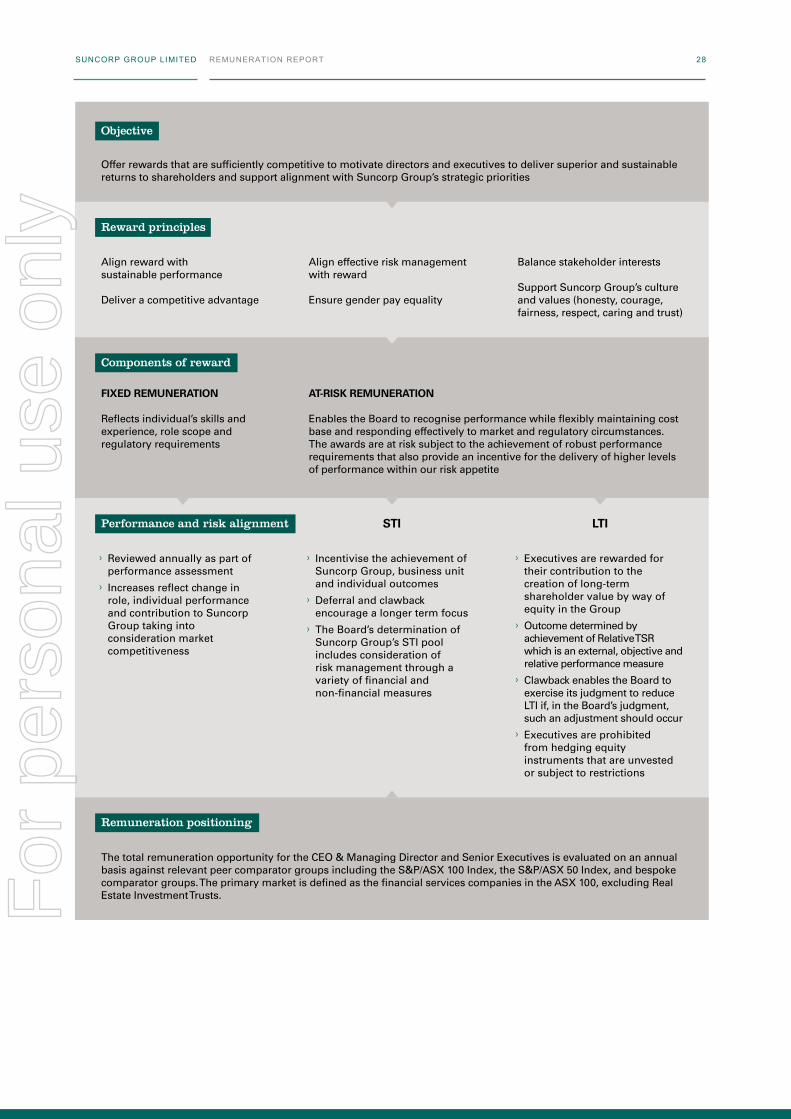
SUNCORP GROUP LIMITED REMUNERATION REPORT 28
For
per
sona
l use
onl
y
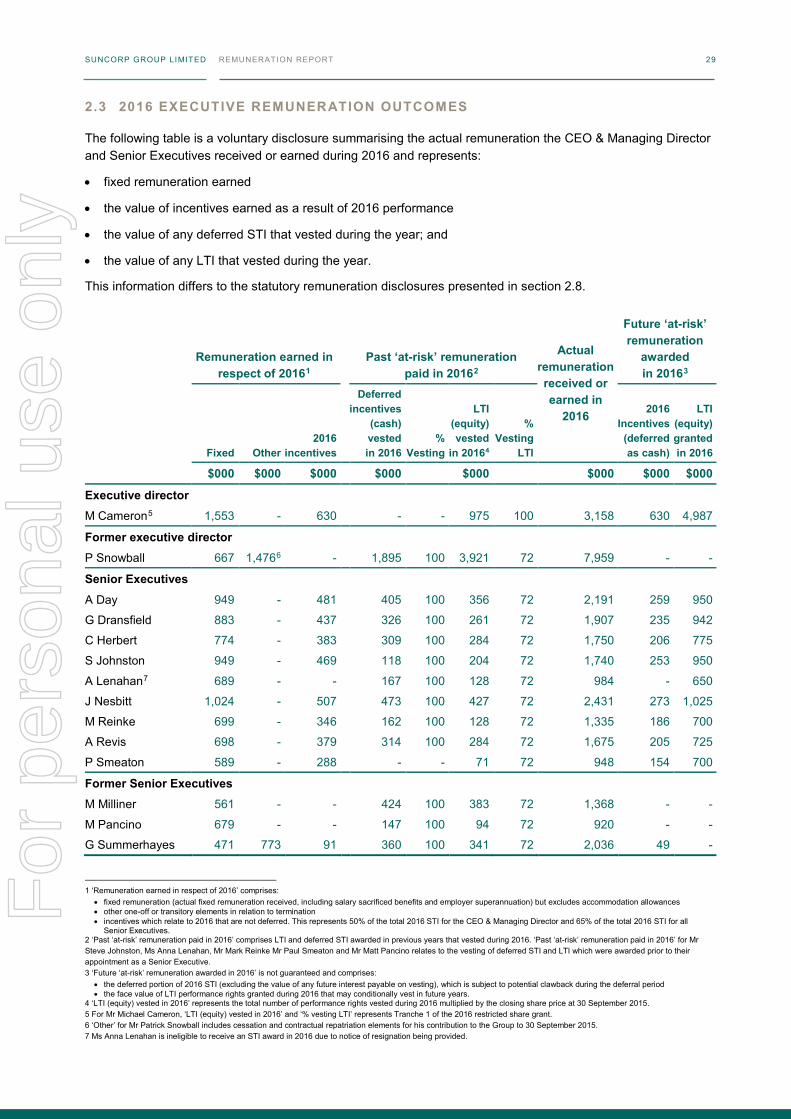
SUNCORP GROUP LIMITED REMUNERATION REPORT 28
SUNCORP GROUP LIMITED REMUNERATION REPORT 29
2.3 2016 EXECUTIVE REMUNERATION OUTCOMES
The following table is a voluntary disclosure summarising the actual remuneration the CEO & Managing Director and Senior Executives received or earned during 2016 and represents:
• fixed remuneration earned
• the value of incentives earned as a result of 2016 performance
• the value of any deferred STI that vested during the year; and
• the value of any LTI that vested during the year.
This information differs to the statutory remuneration disclosures presented in section 2.8.
Remuneration earned in
respect of 20161
Past ‘at-risk’ remuneration
paid in 20162
Actual remuneration received or earned in
2016
Future ‘at-risk’ remuneration
awarded in 20163
Fixed Other 2016
incentives
Deferred incentives
(cash) vested in 2016
% Vesting
LTI (equity) vested
in 20164
% Vesting
LTI
2016 Incentives (deferred as cash)
LTI (equity) granted in 2016
$000 $000 $000 $000 $000 $000 $000 $000
Executive director M Cameron5 1,553 - 630 - - 975 100 3,158 630 4,987
Former executive director P Snowball 667 1,4766 - 1,895 100 3,921 72 7,959 - -
Senior Executives A Day 949 - 481 405 100 356 72 2,191 259 950
G Dransfield 883 - 437 326 100 261 72 1,907 235 942
C Herbert 774 - 383 309 100 284 72 1,750 206 775
S Johnston 949 - 469 118 100 204 72 1,740 253 950
A Lenahan7 689 - - 167 100 128 72 984 - 650
J Nesbitt 1,024 - 507 473 100 427 72 2,431 273 1,025
M Reinke 699 - 346 162 100 128 72 1,335 186 700
A Revis 698 - 379 314 100 284 72 1,675 205 725
P Smeaton 589 - 288 - - 71 72 948 154 700
Former Senior Executives M Milliner 561 - - 424 100 383 72 1,368 - -
M Pancino 679 - - 147 100 94 72 920 - -
G Summerhayes 471 773 91 360 100 341 72 2,036 49 -
1 ‘Remuneration earned in respect of 2016’ comprises:
• fixed remuneration (actual fixed remuneration received, including salary sacrificed benefits and employer superannuation) but excludes accommodation allowances • other one-off or transitory elements in relation to termination • incentives which relate to 2016 that are not deferred. This represents 50% of the total 2016 STI for the CEO & Managing Director and 65% of the total 2016 STI for all
Senior Executives. 2 ‘Past ‘at-risk’ remuneration paid in 2016’ comprises LTI and deferred STI awarded in previous years that vested during 2016. ‘Past ‘at-risk’ remuneration paid in 2016’ for Mr Steve Johnston, Ms Anna Lenahan, Mr Mark Reinke Mr Paul Smeaton and Mr Matt Pancino relates to the vesting of deferred STI and LTI which were awarded prior to their appointment as a Senior Executive. 3 ‘Future ‘at-risk’ remuneration awarded in 2016’ is not guaranteed and comprises:
• the deferred portion of 2016 STI (excluding the value of any future interest payable on vesting), which is subject to potential clawback during the deferral period • the face value of LTI performance rights granted during 2016 that may conditionally vest in future years.
4 ‘LTI (equity) vested in 2016’ represents the total number of performance rights vested during 2016 multiplied by the closing share price at 30 September 2015. 5 For Mr Michael Cameron, ‘LTI (equity) vested in 2016’ and ‘% vesting LTI’ represents Tranche 1 of the 2016 restricted share grant. 6 ‘Other’ for Mr Patrick Snowball includes cessation and contractual repatriation elements for his contribution to the Group to 30 September 2015. 7 Ms Anna Lenahan is ineligible to receive an STI award in 2016 due to notice of resignation being provided.
For
per
sona
l use
onl
y
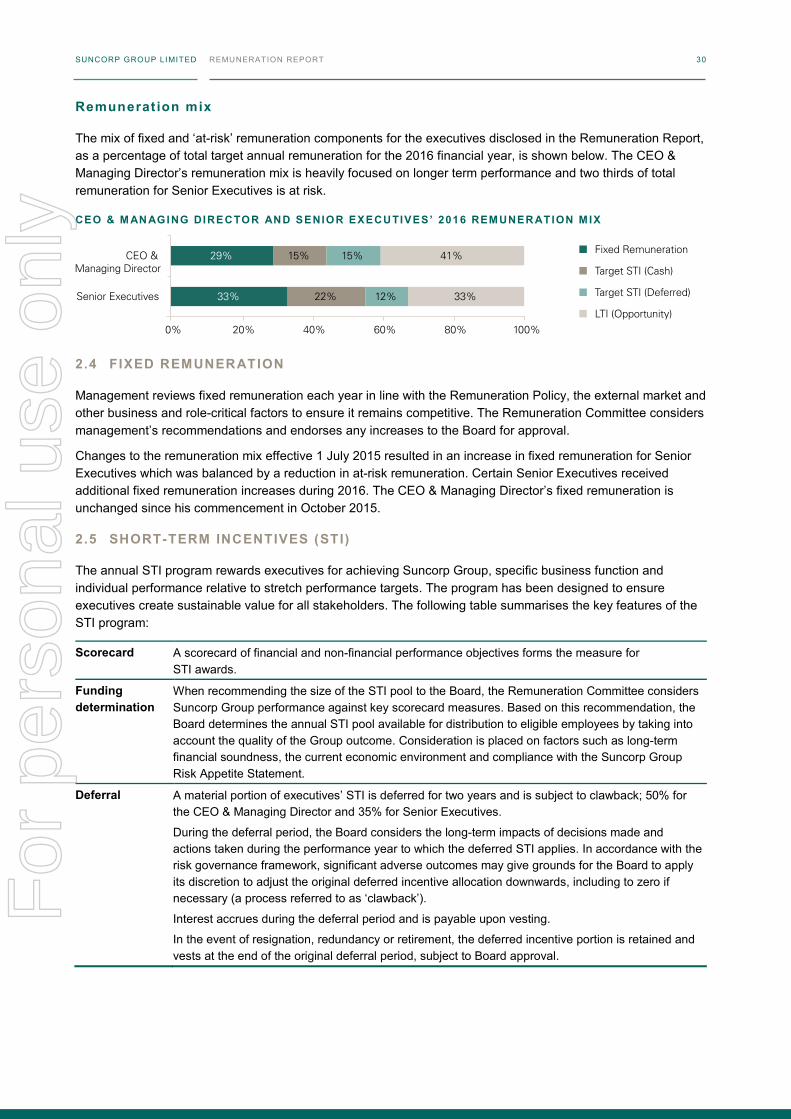
SUNCORP GROUP LIMITED REMUNERATION REPORT 30
Remunerat ion mix
The mix of fixed and ‘at-risk’ remuneration components for the executives disclosed in the Remuneration Report, as a percentage of total target annual remuneration for the 2016 financial year, is shown below. The CEO & Managing Director’s remuneration mix is heavily focused on longer term performance and two thirds of total remuneration for Senior Executives is at risk.
CEO & M AN AGI NG DIRECTOR AND SENIOR EXECUTIVES’ 2016 REMUNER ATION MIX
2.4 FIXED REMUNERATION
Management reviews fixed remuneration each year in line with the Remuneration Policy, the external market and other business and role-critical factors to ensure it remains competitive. The Remuneration Committee considers management’s recommendations and endorses any increases to the Board for approval.
Changes to the remuneration mix effective 1 July 2015 resulted in an increase in fixed remuneration for Senior Executives which was balanced by a reduction in at-risk remuneration. Certain Senior Executives received additional fixed remuneration increases during 2016. The CEO & Managing Director’s fixed remuneration is unchanged since his commencement in October 2015.
2.5 SHORT-TERM INCENTIVES (STI)
The annual STI program rewards executives for achieving Suncorp Group, specific business function and individual performance relative to stretch performance targets. The program has been designed to ensure executives create sustainable value for all stakeholders. The following table summarises the key features of the STI program:
Scorecard A scorecard of financial and non-financial performance objectives forms the measure for STI awards.
Funding determination
When recommending the size of the STI pool to the Board, the Remuneration Committee considers Suncorp Group performance against key scorecard measures. Based on this recommendation, the Board determines the annual STI pool available for distribution to eligible employees by taking into account the quality of the Group outcome. Consideration is placed on factors such as long-term financial soundness, the current economic environment and compliance with the Suncorp Group Risk Appetite Statement.
Deferral A material portion of executives’ STI is deferred for two years and is subject to clawback; 50% for the CEO & Managing Director and 35% for Senior Executives.
During the deferral period, the Board considers the long-term impacts of decisions made and actions taken during the performance year to which the deferred STI applies. In accordance with the risk governance framework, significant adverse outcomes may give grounds for the Board to apply its discretion to adjust the original deferred incentive allocation downwards, including to zero if necessary (a process referred to as ‘clawback’).
Interest accrues during the deferral period and is payable upon vesting.
In the event of resignation, redundancy or retirement, the deferred incentive portion is retained and vests at the end of the original deferral period, subject to Board approval.
SUNCORP GROUP LIMITED REMUNERATION REPORT 31
Underlying profit after tax
The Board considers underlying profit after tax to be an appropriate reflection of the Company’s performance relative to its targets and an effective measure for STI as it is considered that individual executive performance is a key driver of underlying profit outcomes.
In determining underlying profit after tax, a number of adjustments to net profit after tax are made because these are deemed to be outside normal operating activities and beyond executives’ control, including but not limited to:
• volatility within investment markets above or below expectations • prior year reserve strengthening or releases that are above or below expectations • natural hazards claims above or below expected allowances • profits or losses on material divestments; and • material non-cash transactions.
Underlying profit after tax is not audited by the external auditors, KPMG. Underlying profit after tax has been determined on a consistent basis since the year ended 30 June 2012.
Performance assessment
The following table sets out the structure of the 2016 Group scorecard measures, their link to strategy and the 2016 Group Scorecard outcome used to determine the STI outcome for the CEO & Managing Director:
For
per
sona
l use
onl
y
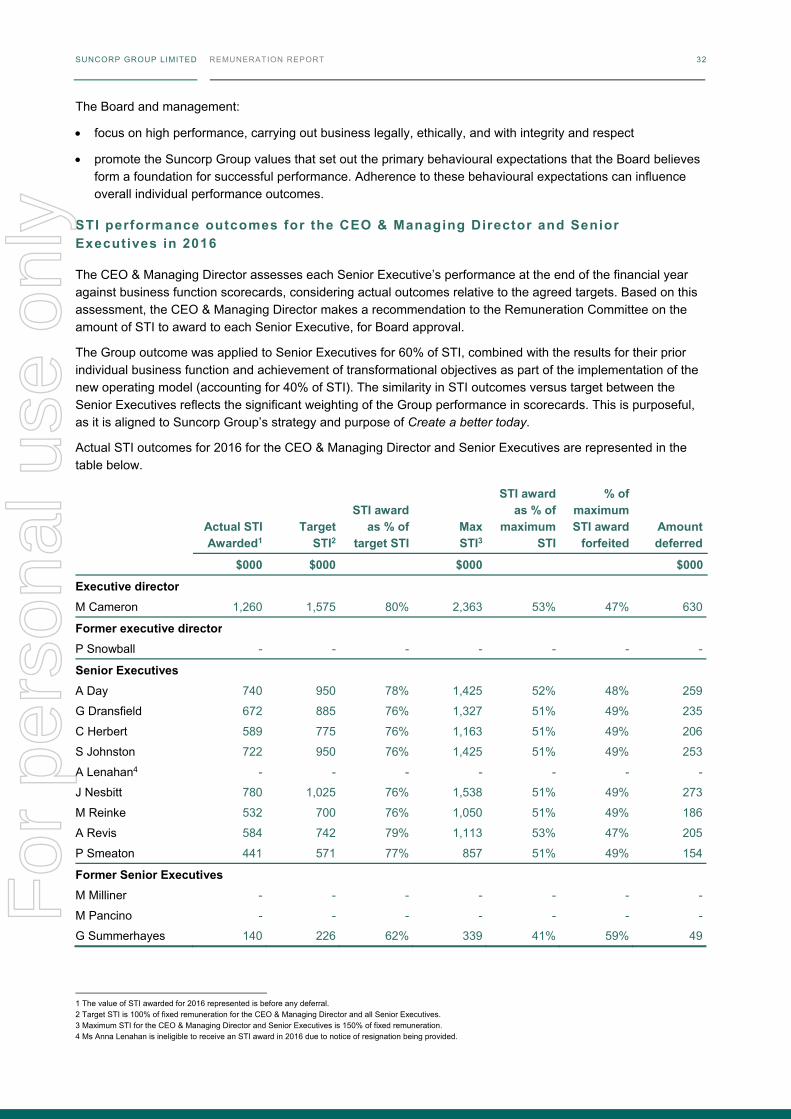
SUNCORP GROUP LIMITED REMUNERATION REPORT 32
The Board and management:
focus on high performance, carrying out business legally, ethically, and with integrity and respect
promote the Suncorp Group values that set out the primary behavioural expectations that the Board believes form a foundation for successful performance. Adherence to these behavioural expectations can influence overall individual performance outcomes.
STI performance outcomes for the CEO & Managing Director and Senior Executives in 2016
The CEO & Managing Director assesses each Senior Executive’s performance at the end of the financial year against business function scorecards, considering actual outcomes relative to the agreed targets. Based on this assessment, the CEO & Managing Director makes a recommendation to the Remuneration Committee on the amount of STI to award to each Senior Executive, for Board approval.
The Group outcome was applied to Senior Executives for 60% of STI, combined with the results for their prior individual business function and achievement of transformational objectives as part of the implementation of the new operating model (accounting for 40% of STI). The similarity in STI outcomes versus target between the Senior Executives reflects the significant weighting of the Group performance in scorecards. This is purposeful, as it is aligned to Suncorp Group’s strategy and purpose of Create a better today.
Actual STI outcomes for 2016 for the CEO & Managing Director and Senior Executives are represented in the table below.
Actual STI Awarded1
Target STI2
STI award as % of
target STI Max STI3
STI award as % of
maximum STI
% of maximum STI award
forfeited Amount deferred
$000 $000 $000 $000
Executive director M Cameron 1,260 1,575 80% 2,363 53% 47% 630
Former executive director P Snowball - - - - - - -
Senior Executives A Day 740 950 78% 1,425 52% 48% 259
G Dransfield 672 885 76% 1,327 51% 49% 235
C Herbert 589 775 76% 1,163 51% 49% 206
S Johnston 722 950 76% 1,425 51% 49% 253
A Lenahan4 - - - - - - -
J Nesbitt 780 1,025 76% 1,538 51% 49% 273
M Reinke 532 700 76% 1,050 51% 49% 186
A Revis 584 742 79% 1,113 53% 47% 205
P Smeaton 441 571 77% 857 51% 49% 154
Former Senior Executives M Milliner - - - - - - -
M Pancino - - - - - - -
G Summerhayes 140 226 62% 339 41% 59% 49
1 The value of STI awarded for 2016 represented is before any deferral. 2 Target STI is 100% of fixed remuneration for the CEO & Managing Director and all Senior Executives. 3 Maximum STI for the CEO & Managing Director and Senior Executives is 150% of fixed remuneration. 4 Ms Anna Lenahan is ineligible to receive an STI award in 2016 due to notice of resignation being provided.
For
per
sona
l use
onl
y
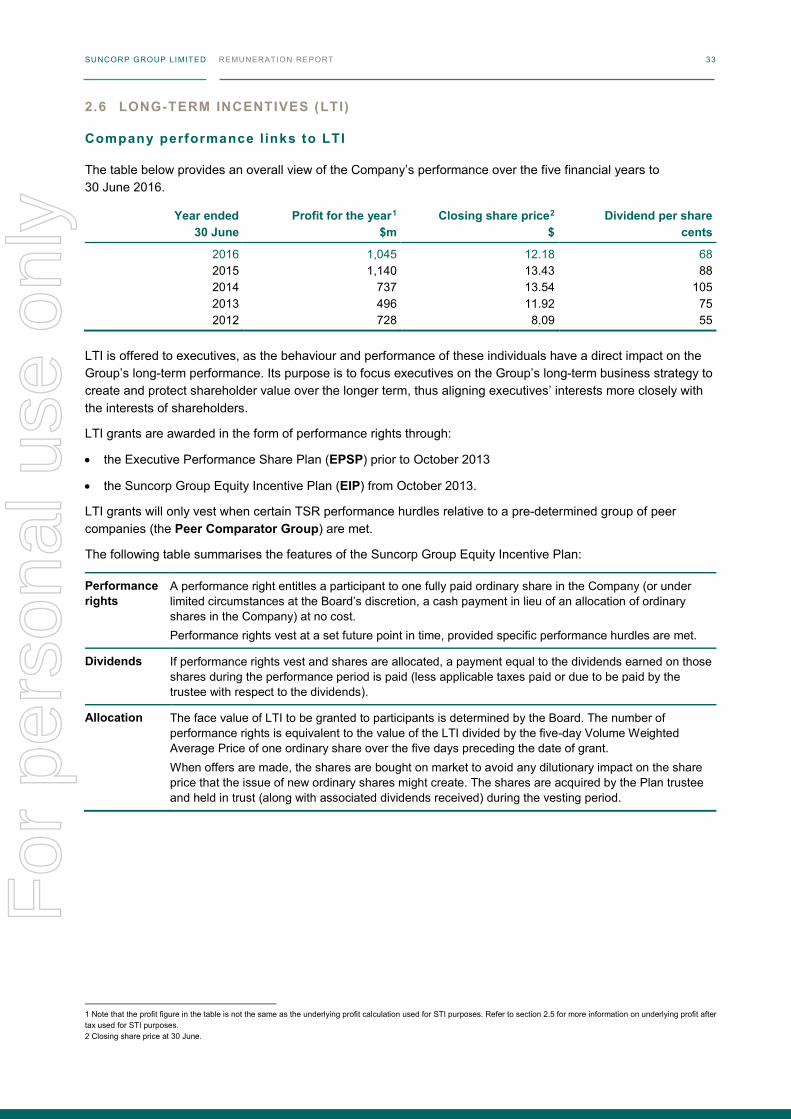
SUNCORP GROUP LIMITED REMUNERATION REPORT 32
The Board and management:
focus on high performance, carrying out business legally, ethically, and with integrity and respect
promote the Suncorp Group values that set out the primary behavioural expectations that the Board believes form a foundation for successful performance. Adherence to these behavioural expectations can influence overall individual performance outcomes.
STI performance outcomes for the CEO & Managing Director and Senior Executives in 2016
The CEO & Managing Director assesses each Senior Executive’s performance at the end of the financial year against business function scorecards, considering actual outcomes relative to the agreed targets. Based on this assessment, the CEO & Managing Director makes a recommendation to the Remuneration Committee on the amount of STI to award to each Senior Executive, for Board approval.
The Group outcome was applied to Senior Executives for 60% of STI, combined with the results for their prior individual business function and achievement of transformational objectives as part of the implementation of the new operating model (accounting for 40% of STI). The similarity in STI outcomes versus target between the Senior Executives reflects the significant weighting of the Group performance in scorecards. This is purposeful, as it is aligned to Suncorp Group’s strategy and purpose of Create a better today.
Actual STI outcomes for 2016 for the CEO & Managing Director and Senior Executives are represented in the table below.
Actual STI Awarded1
Target STI2
STI award as % of
target STI Max STI3
STI award as % of
maximum STI
% of maximum STI award
forfeited Amount deferred
$000 $000 $000 $000
Executive director M Cameron 1,260 1,575 80% 2,363 53% 47% 630
Former executive director P Snowball - - - - - - -
Senior Executives A Day 740 950 78% 1,425 52% 48% 259
G Dransfield 672 885 76% 1,327 51% 49% 235
C Herbert 589 775 76% 1,163 51% 49% 206
S Johnston 722 950 76% 1,425 51% 49% 253
A Lenahan4 - - - - - - -
J Nesbitt 780 1,025 76% 1,538 51% 49% 273
M Reinke 532 700 76% 1,050 51% 49% 186
A Revis 584 742 79% 1,113 53% 47% 205
P Smeaton 441 571 77% 857 51% 49% 154
Former Senior Executives M Milliner - - - - - - -
M Pancino - - - - - - -
G Summerhayes 140 226 62% 339 41% 59% 49
1 The value of STI awarded for 2016 represented is before any deferral. 2 Target STI is 100% of fixed remuneration for the CEO & Managing Director and all Senior Executives. 3 Maximum STI for the CEO & Managing Director and Senior Executives is 150% of fixed remuneration. 4 Ms Anna Lenahan is ineligible to receive an STI award in 2016 due to notice of resignation being provided.
SUNCORP GROUP LIMITED REMUNERATION REPORT 33
2.6 LONG-TERM INCENTIVES (LTI)
Company performance l inks to LTI
The table below provides an overall view of the Company’s performance over the five financial years to 30 June 2016.
Year ended 30 June
Profit for the year1 $m
Closing share price2 $
Dividend per share cents
2016 2015 2014 2013 2012
1,045 1,140
737 496 728
12.18 13.43 13.54 11.92
8.09
68 88
105 75 55
LTI is offered to executives, as the behaviour and performance of these individuals have a direct impact on the Group’s long-term performance. Its purpose is to focus executives on the Group’s long-term business strategy to create and protect shareholder value over the longer term, thus aligning executives’ interests more closely with the interests of shareholders.
LTI grants are awarded in the form of performance rights through:
• the Executive Performance Share Plan (EPSP) prior to October 2013
• the Suncorp Group Equity Incentive Plan (EIP) from October 2013.
LTI grants will only vest when certain TSR performance hurdles relative to a pre-determined group of peer companies (the Peer Comparator Group) are met.
The following table summarises the features of the Suncorp Group Equity Incentive Plan:
Performance rights
A performance right entitles a participant to one fully paid ordinary share in the Company (or under limited circumstances at the Board’s discretion, a cash payment in lieu of an allocation of ordinary shares in the Company) at no cost. Performance rights vest at a set future point in time, provided specific performance hurdles are met.
Dividends If performance rights vest and shares are allocated, a payment equal to the dividends earned on those shares during the performance period is paid (less applicable taxes paid or due to be paid by the trustee with respect to the dividends).
Allocation The face value of LTI to be granted to participants is determined by the Board. The number of performance rights is equivalent to the value of the LTI divided by the five-day Volume Weighted Average Price of one ordinary share over the five days preceding the date of grant. When offers are made, the shares are bought on market to avoid any dilutionary impact on the share price that the issue of new ordinary shares might create. The shares are acquired by the Plan trustee and held in trust (along with associated dividends received) during the vesting period.
1 Note that the profit figure in the table is not the same as the underlying profit calculation used for STI purposes. Refer to section 2.5 for more information on underlying profit after tax used for STI purposes. 2 Closing share price at 30 June.
For
per
sona
l use
onl
y
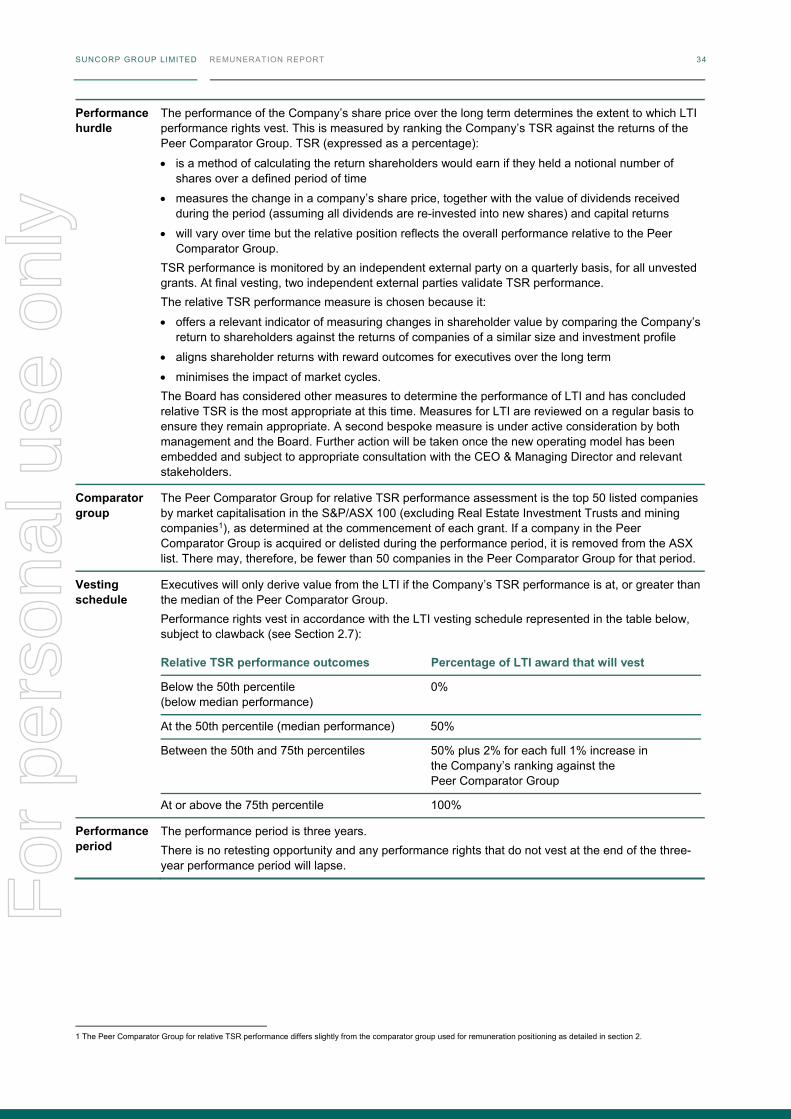
SUNCORP GROUP LIMITED REMUNERATION REPORT 34
Performance hurdle
The performance of the Company’s share price over the long term determines the extent to which LTI performance rights vest. This is measured by ranking the Company’s TSR against the returns of the Peer Comparator Group. TSR (expressed as a percentage):
is a method of calculating the return shareholders would earn if they held a notional number of shares over a defined period of time
measures the change in a company’s share price, together with the value of dividends received during the period (assuming all dividends are re-invested into new shares) and capital returns
will vary over time but the relative position reflects the overall performance relative to the Peer Comparator Group.
TSR performance is monitored by an independent external party on a quarterly basis, for all unvested grants. At final vesting, two independent external parties validate TSR performance. The relative TSR performance measure is chosen because it:
offers a relevant indicator of measuring changes in shareholder value by comparing the Company’s return to shareholders against the returns of companies of a similar size and investment profile
aligns shareholder returns with reward outcomes for executives over the long term
minimises the impact of market cycles. The Board has considered other measures to determine the performance of LTI and has concluded relative TSR is the most appropriate at this time. Measures for LTI are reviewed on a regular basis to ensure they remain appropriate. A second bespoke measure is under active consideration by both management and the Board. Further action will be taken once the new operating model has been embedded and subject to appropriate consultation with the CEO & Managing Director and relevant stakeholders.
Comparator group
The Peer Comparator Group for relative TSR performance assessment is the top 50 listed companies by market capitalisation in the S&P/ASX 100 (excluding Real Estate Investment Trusts and mining companies1), as determined at the commencement of each grant. If a company in the Peer Comparator Group is acquired or delisted during the performance period, it is removed from the ASX list. There may, therefore, be fewer than 50 companies in the Peer Comparator Group for that period.
Vesting schedule
Executives will only derive value from the LTI if the Company’s TSR performance is at, or greater than the median of the Peer Comparator Group. Performance rights vest in accordance with the LTI vesting schedule represented in the table below, subject to clawback (see Section 2.7):
Relative TSR performance outcomes Percentage of LTI award that will vest
Below the 50th percentile (below median performance)
0%
At the 50th percentile (median performance) 50%
Between the 50th and 75th percentiles 50% plus 2% for each full 1% increase in the Company’s ranking against the Peer Comparator Group
At or above the 75th percentile 100%
Performance period
The performance period is three years. There is no retesting opportunity and any performance rights that do not vest at the end of the three-year performance period will lapse.
1 The Peer Comparator Group for relative TSR performance differs slightly from the comparator group used for remuneration positioning as detailed in section 2.
SUNCORP GROUP LIMITED REMUNERATION REPORT 35
Senior Execut ives’ 2012 grant
The LTI performance hurdle for the Senior Executives’ October 2012 Grant, with a vesting date in 2016, achieved a successful vesting result at 72%.
PEER COMPAR ATOR GROUP TSR OUTCOMES, RANKED FROM HIGHEST TO LOW EST
For
per
sona
l use
onl
y
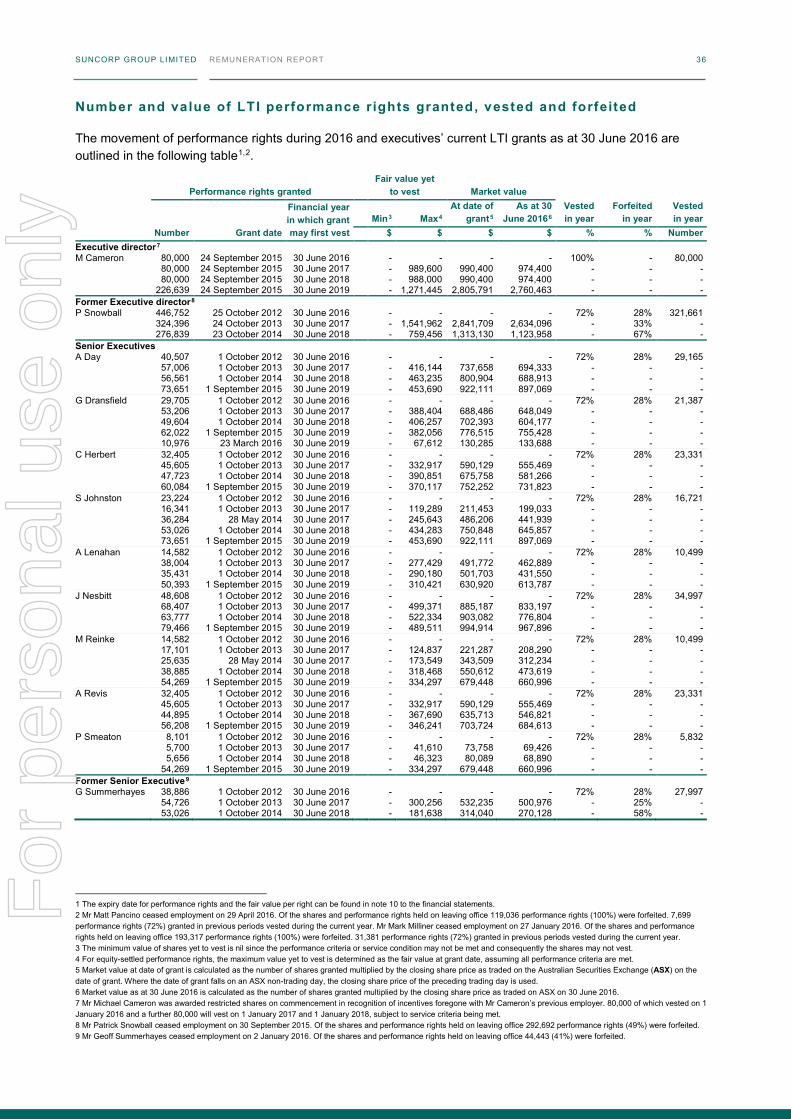
SUNCORP GROUP LIMITED REMUNERATION REPORT 36
Number and value of LTI performance r ights granted, vested and forfeited
The movement of performance rights during 2016 and executives’ current LTI grants as at 30 June 2016 are outlined in the following table1,2.
Performance rights granted Fair value yet
to vest Market value
Number Grant date
Financial year in which grant may first vest
Min3 Max4 At date of
grant5 As at 30
June 20166 Vested in year
Forfeited in year
Vested in year
$ $ $ $ % % Number Executive director7 M Cameron 80,000 24 September 2015 30 June 2016 - - - - 100% - 80,000 80,000 24 September 2015 30 June 2017 - 989,600 990,400 974,400 - - - 80,000 24 September 2015 30 June 2018 - 988,000 990,400 974,400 - - - 226,639 24 September 2015 30 June 2019 - 1,271,445 2,805,791 2,760,463 - - - Former Executive director8 P Snowball 446,752 25 October 2012 30 June 2016 - - - - 72% 28% 321,661 324,396 24 October 2013 30 June 2017 - 1,541,962 2,841,709 2,634,096 - 33% - 276,839 23 October 2014 30 June 2018 - 759,456 1,313,130 1,123,958 - 67% - Senior Executives A Day 40,507 1 October 2012 30 June 2016 - - - - 72% 28% 29,165 57,006 1 October 2013 30 June 2017 - 416,144 737,658 694,333 - - - 56,561 1 October 2014 30 June 2018 - 463,235 800,904 688,913 - - - 73,651 1 September 2015 30 June 2019 - 453,690 922,111 897,069 - - - G Dransfield 29,705 1 October 2012 30 June 2016 - - - - 72% 28% 21,387 53,206 1 October 2013 30 June 2017 - 388,404 688,486 648,049 - - - 49,604 1 October 2014 30 June 2018 - 406,257 702,393 604,177 - - - 62,022 1 September 2015 30 June 2019 - 382,056 776,515 755,428 - - - 10,976 23 March 2016 30 June 2019 - 67,612 130,285 133,688 - - - C Herbert 32,405 1 October 2012 30 June 2016 - - - - 72% 28% 23,331 45,605 1 October 2013 30 June 2017 - 332,917 590,129 555,469 - - - 47,723 1 October 2014 30 June 2018 - 390,851 675,758 581,266 - - - 60,084 1 September 2015 30 June 2019 - 370,117 752,252 731,823 - - - S Johnston 23,224 1 October 2012 30 June 2016 - - - - 72% 28% 16,721 16,341 1 October 2013 30 June 2017 - 119,289 211,453 199,033 - - - 36,284 28 May 2014 30 June 2017 - 245,643 486,206 441,939 - - - 53,026 1 October 2014 30 June 2018 - 434,283 750,848 645,857 - - - 73,651 1 September 2015 30 June 2019 - 453,690 922,111 897,069 - - - A Lenahan 14,582 1 October 2012 30 June 2016 - - - - 72% 28% 10,499 38,004 1 October 2013 30 June 2017 - 277,429 491,772 462,889 - - - 35,431 1 October 2014 30 June 2018 - 290,180 501,703 431,550 - - - 50,393 1 September 2015 30 June 2019 - 310,421 630,920 613,787 - - - J Nesbitt 48,608 1 October 2012 30 June 2016 - - - - 72% 28% 34,997 68,407 1 October 2013 30 June 2017 - 499,371 885,187 833,197 - - - 63,777 1 October 2014 30 June 2018 - 522,334 903,082 776,804 - - - 79,466 1 September 2015 30 June 2019 - 489,511 994,914 967,896 - - - M Reinke 14,582 1 October 2012 30 June 2016 - - - - 72% 28% 10,499 17,101 1 October 2013 30 June 2017 - 124,837 221,287 208,290 - - - 25,635 28 May 2014 30 June 2017 - 173,549 343,509 312,234 - - - 38,885 1 October 2014 30 June 2018 - 318,468 550,612 473,619 - - - 54,269 1 September 2015 30 June 2019 - 334,297 679,448 660,996 - - - A Revis 32,405 1 October 2012 30 June 2016 - - - - 72% 28% 23,331 45,605 1 October 2013 30 June 2017 - 332,917 590,129 555,469 - - - 44,895 1 October 2014 30 June 2018 - 367,690 635,713 546,821 - - - 56,208 1 September 2015 30 June 2019 - 346,241 703,724 684,613 - - - P Smeaton 8,101 1 October 2012 30 June 2016 - - - - 72% 28% 5,832 5,700 1 October 2013 30 June 2017 - 41,610 73,758 69,426 - - - 5,656 1 October 2014 30 June 2018 - 46,323 80,089 68,890 - - - 54,269 1 September 2015 30 June 2019 - 334,297 679,448 660,996 - - - Former Senior Executive9 G Summerhayes 38,886 1 October 2012 30 June 2016 - - - - 72% 28% 27,997 54,726 1 October 2013 30 June 2017 - 300,256 532,235 500,976 - 25% - 53,026 1 October 2014 30 June 2018 - 181,638 314,040 270,128 - 58% -
1 The expiry date for performance rights and the fair value per right can be found in note 10 to the financial statements. 2 Mr Matt Pancino ceased employment on 29 April 2016. Of the shares and performance rights held on leaving office 119,036 performance rights (100%) were forfeited. 7,699 performance rights (72%) granted in previous periods vested during the current year. Mr Mark Milliner ceased employment on 27 January 2016. Of the shares and performance rights held on leaving office 193,317 performance rights (100%) were forfeited. 31,381 performance rights (72%) granted in previous periods vested during the current year. 3 The minimum value of shares yet to vest is nil since the performance criteria or service condition may not be met and consequently the shares may not vest. 4 For equity-settled performance rights, the maximum value yet to vest is determined as the fair value at grant date, assuming all performance criteria are met. 5 Market value at date of grant is calculated as the number of shares granted multiplied by the closing share price as traded on the Australian Securities Exchange (ASX) on the date of grant. Where the date of grant falls on an ASX non-trading day, the closing share price of the preceding trading day is used. 6 Market value as at 30 June 2016 is calculated as the number of shares granted multiplied by the closing share price as traded on ASX on 30 June 2016. 7 Mr Michael Cameron was awarded restricted shares on commencement in recognition of incentives foregone with Mr Cameron’s previous employer. 80,000 of which vested on 1 January 2016 and a further 80,000 will vest on 1 January 2017 and 1 January 2018, subject to service criteria being met. 8 Mr Patrick Snowball ceased employment on 30 September 2015. Of the shares and performance rights held on leaving office 292,692 performance rights (49%) were forfeited. 9 Mr Geoff Summerhayes ceased employment on 2 January 2016. Of the shares and performance rights held on leaving office 44,443 (41%) were forfeited.
For
per
sona
l use
onl
y
SUNCORP GROUP LIMITED REMUNERATION REPORT 36
Number and value of LTI performance r ights granted, vested and forfeited
The movement of performance rights during 2016 and executives’ current LTI grants as at 30 June 2016 are outlined in the following table1,2.
Performance rights granted Fair value yet
to vest Market value
Number Grant date
Financial year in which grant may first vest
Min3 Max4 At date of
grant5 As at 30
June 20166 Vested in year
Forfeited in year
Vested in year
$ $ $ $ % % Number Executive director7 M Cameron 80,000 24 September 2015 30 June 2016 - - - - 100% - 80,000 80,000 24 September 2015 30 June 2017 - 989,600 990,400 974,400 - - - 80,000 24 September 2015 30 June 2018 - 988,000 990,400 974,400 - - - 226,639 24 September 2015 30 June 2019 - 1,271,445 2,805,791 2,760,463 - - - Former Executive director8 P Snowball 446,752 25 October 2012 30 June 2016 - - - - 72% 28% 321,661 324,396 24 October 2013 30 June 2017 - 1,541,962 2,841,709 2,634,096 - 33% - 276,839 23 October 2014 30 June 2018 - 759,456 1,313,130 1,123,958 - 67% - Senior Executives A Day 40,507 1 October 2012 30 June 2016 - - - - 72% 28% 29,165 57,006 1 October 2013 30 June 2017 - 416,144 737,658 694,333 - - - 56,561 1 October 2014 30 June 2018 - 463,235 800,904 688,913 - - - 73,651 1 September 2015 30 June 2019 - 453,690 922,111 897,069 - - - G Dransfield 29,705 1 October 2012 30 June 2016 - - - - 72% 28% 21,387 53,206 1 October 2013 30 June 2017 - 388,404 688,486 648,049 - - - 49,604 1 October 2014 30 June 2018 - 406,257 702,393 604,177 - - - 62,022 1 September 2015 30 June 2019 - 382,056 776,515 755,428 - - - 10,976 23 March 2016 30 June 2019 - 67,612 130,285 133,688 - - - C Herbert 32,405 1 October 2012 30 June 2016 - - - - 72% 28% 23,331 45,605 1 October 2013 30 June 2017 - 332,917 590,129 555,469 - - - 47,723 1 October 2014 30 June 2018 - 390,851 675,758 581,266 - - - 60,084 1 September 2015 30 June 2019 - 370,117 752,252 731,823 - - - S Johnston 23,224 1 October 2012 30 June 2016 - - - - 72% 28% 16,721 16,341 1 October 2013 30 June 2017 - 119,289 211,453 199,033 - - - 36,284 28 May 2014 30 June 2017 - 245,643 486,206 441,939 - - - 53,026 1 October 2014 30 June 2018 - 434,283 750,848 645,857 - - - 73,651 1 September 2015 30 June 2019 - 453,690 922,111 897,069 - - - A Lenahan 14,582 1 October 2012 30 June 2016 - - - - 72% 28% 10,499 38,004 1 October 2013 30 June 2017 - 277,429 491,772 462,889 - - - 35,431 1 October 2014 30 June 2018 - 290,180 501,703 431,550 - - - 50,393 1 September 2015 30 June 2019 - 310,421 630,920 613,787 - - - J Nesbitt 48,608 1 October 2012 30 June 2016 - - - - 72% 28% 34,997 68,407 1 October 2013 30 June 2017 - 499,371 885,187 833,197 - - - 63,777 1 October 2014 30 June 2018 - 522,334 903,082 776,804 - - - 79,466 1 September 2015 30 June 2019 - 489,511 994,914 967,896 - - - M Reinke 14,582 1 October 2012 30 June 2016 - - - - 72% 28% 10,499 17,101 1 October 2013 30 June 2017 - 124,837 221,287 208,290 - - - 25,635 28 May 2014 30 June 2017 - 173,549 343,509 312,234 - - - 38,885 1 October 2014 30 June 2018 - 318,468 550,612 473,619 - - - 54,269 1 September 2015 30 June 2019 - 334,297 679,448 660,996 - - - A Revis 32,405 1 October 2012 30 June 2016 - - - - 72% 28% 23,331 45,605 1 October 2013 30 June 2017 - 332,917 590,129 555,469 - - - 44,895 1 October 2014 30 June 2018 - 367,690 635,713 546,821 - - - 56,208 1 September 2015 30 June 2019 - 346,241 703,724 684,613 - - - P Smeaton 8,101 1 October 2012 30 June 2016 - - - - 72% 28% 5,832 5,700 1 October 2013 30 June 2017 - 41,610 73,758 69,426 - - - 5,656 1 October 2014 30 June 2018 - 46,323 80,089 68,890 - - - 54,269 1 September 2015 30 June 2019 - 334,297 679,448 660,996 - - - Former Senior Executive9 G Summerhayes 38,886 1 October 2012 30 June 2016 - - - - 72% 28% 27,997 54,726 1 October 2013 30 June 2017 - 300,256 532,235 500,976 - 25% - 53,026 1 October 2014 30 June 2018 - 181,638 314,040 270,128 - 58% -
1 The expiry date for performance rights and the fair value per right can be found in note 10 to the financial statements. 2 Mr Matt Pancino ceased employment on 29 April 2016. Of the shares and performance rights held on leaving office 119,036 performance rights (100%) were forfeited. 7,699 performance rights (72%) granted in previous periods vested during the current year. Mr Mark Milliner ceased employment on 27 January 2016. Of the shares and performance rights held on leaving office 193,317 performance rights (100%) were forfeited. 31,381 performance rights (72%) granted in previous periods vested during the current year. 3 The minimum value of shares yet to vest is nil since the performance criteria or service condition may not be met and consequently the shares may not vest. 4 For equity-settled performance rights, the maximum value yet to vest is determined as the fair value at grant date, assuming all performance criteria are met. 5 Market value at date of grant is calculated as the number of shares granted multiplied by the closing share price as traded on the Australian Securities Exchange (ASX) on the date of grant. Where the date of grant falls on an ASX non-trading day, the closing share price of the preceding trading day is used. 6 Market value as at 30 June 2016 is calculated as the number of shares granted multiplied by the closing share price as traded on ASX on 30 June 2016. 7 Mr Michael Cameron was awarded restricted shares on commencement in recognition of incentives foregone with Mr Cameron’s previous employer. 80,000 of which vested on 1 January 2016 and a further 80,000 will vest on 1 January 2017 and 1 January 2018, subject to service criteria being met. 8 Mr Patrick Snowball ceased employment on 30 September 2015. Of the shares and performance rights held on leaving office 292,692 performance rights (49%) were forfeited. 9 Mr Geoff Summerhayes ceased employment on 2 January 2016. Of the shares and performance rights held on leaving office 44,443 (41%) were forfeited.
SUNCORP GROUP LIMITED REMUNERATION REPORT 37
2.7 REMUNERATION ALIGNS WITH RISK MANAGEMENT
A rigorous approach to effective risk management is embedded throughout the Group.
The Enterprise Risk Management Framework (ERMF) lays the foundation for all risk management processes across the Group. The ERMF helps ensure the integration of effective risk management across the organisation and incorporates Suncorp’s policies (which include risk management policies and the Remuneration Policy).
The Board sets the Risk Appetite for the Group, and has ultimate responsibility for the effectiveness of the Group’s risk management practices.
In addition, the Chairman of the Remuneration Committee is a member of the Risk Committee and similarly the Chairman of the Risk Committee is a member of the Remuneration Committee.
The Group’s shared values and leader profiles make it clear to all employees the importance of embedding risk into decision-making processes, and risk management into the Group’s operations. Business function leaders develop their business strategy and risk tolerance with an understanding of the Group’s risk appetite and also what is happening in the market in which the Group operates. Financial returns delivered to the Group are commensurate with the risks the Group is willing to take in pursuit of the achievement of business objectives. Additionally, risk is embedded in the way performance is measured for all employees across Suncorp.
In determining ‘at-risk’ remuneration, the Board ensures risk management is considered through:
• a separately weighted risk measure in the Group scorecard where the performance of the Group, business function and individuals are assessed by the Risk Committee and measured with reference to how risk is managed
• individual adherence to risk management policies is assessed to ensure all executives and employees adhere to the ERMF, demonstrating performance that is aligned to expected ethical standards
• an assessment based on behavioural and cultural measures, which considers compliance with the Suncorp Group Risk Appetite Statement. This is a significant consideration of overall performance to deliver an organisation-wide focus on prudent management of the risks the Group faces
• the application of Remuneration Committee discretion to consider additional factors in the determination of performance outcomes.
In determining performance and remuneration outcomes, the Remuneration Committee considers all factors to demonstrate alignment with the Group’s Risk Appetite and adherence to effective risk management practices to ensure the long-term financial soundness of outcomes is determined, before the Board makes its final determination of the overall STI pool.
For
per
sona
l use
onl
y
SUNCORP GROUP LIMITED REMUNERATION REPORT 38
Clawback
Deferred STI and unvested LTI are both subject to potential clawback based on the Board’s judgment, as summarised below:
Purpose Clawback enables the Board to adjust performance based remuneration (including deferred STI and unvested LTI) downwards (including to zero) to protect the Group’s financial soundness and ability to respond to unforeseen significant issues.
Criteria1 The following criteria are considered when determining if clawback should be applied during the deferral period: Clawback will be applied if prior to the date of payment, it is determined that: • there was, during the performance year in respect of which the incentive was awarded, a failure to
comply with Suncorp’s risk management policies and practices • the employee was aware of the above mentioned failure, or should reasonably have been aware
of that failure, when the incentive was awarded; and • the matters referred to above, if known at the time, would have resulted in materially different
assumptions being applied when determining the incentive to be awarded to the employee.
Approval process
The Chief Risk and Legal Officer and Chief Financial Officer (CFO) produce a report on relevant matters to be considered for clawback and release of deferred incentives and unvested LTI awards for Senior Executives and the CEO & Managing Director. The Chairmen of the Remuneration, Risk and Audit Committees verify the report information and confirm that all relevant matters have been considered. Based on this report: • the CEO & Managing Director makes a recommendation to the Board via the Remuneration
Committee, for approval of the release (and/or clawback where appropriate) of deferred incentives and unvested LTI awards for the Senior Executives; and
• the Chairmen of the Remuneration, Risk and Audit Committees make a recommendation to the Board, for approval of the release (and/or clawback where appropriate) of deferred incentives and unvested LTI awards for the CEO & Managing Director.
Minimum shareholding requirement
To further align the CEO & Managing Director and Senior Executives’ interests with those of shareholders, in the 2014 financial year the Board introduced a minimum shareholding requirement which requires Senior Executives to have a shareholding in the Company of a value that is equal to at least 100% of one year’s pre-tax (gross) fixed remuneration.
Senior Executives who were in office at October 2013 are required to achieve the full amount by October 2017. The CEO & Managing Director or any Senior Executives appointed after October 2013 will have four years from the October following their appointment to achieve the 100% shareholding, with 50% to be achieved after two years.
The value of the shares for the purposes of this requirement is the market value of the underlying shares.
Unvested performance rights within the LTI plan for executives do not qualify toward meeting this requirement.
Based on their shareholding as at 30 June 2016, all Senior Executives are on track to hold sufficient shares to meet the October 2017 requirement. Detailed share ownership information for Senior Executives is shown in section 4.2.
1 The criteria were reviewed, updated and approved by the Board in November 2014 (effective January 2015) to ensure consistent and appropriate application of clawback for all executives.
For
per
sona
l use
onl
y

SUNCORP GROUP LIMITED REMUNERATION REPORT 38
Clawback
Deferred STI and unvested LTI are both subject to potential clawback based on the Board’s judgment, as summarised below:
Purpose Clawback enables the Board to adjust performance based remuneration (including deferred STI and unvested LTI) downwards (including to zero) to protect the Group’s financial soundness and ability to respond to unforeseen significant issues.
Criteria1 The following criteria are considered when determining if clawback should be applied during the deferral period: Clawback will be applied if prior to the date of payment, it is determined that: • there was, during the performance year in respect of which the incentive was awarded, a failure to
comply with Suncorp’s risk management policies and practices • the employee was aware of the above mentioned failure, or should reasonably have been aware
of that failure, when the incentive was awarded; and • the matters referred to above, if known at the time, would have resulted in materially different
assumptions being applied when determining the incentive to be awarded to the employee.
Approval process
The Chief Risk and Legal Officer and Chief Financial Officer (CFO) produce a report on relevant matters to be considered for clawback and release of deferred incentives and unvested LTI awards for Senior Executives and the CEO & Managing Director. The Chairmen of the Remuneration, Risk and Audit Committees verify the report information and confirm that all relevant matters have been considered. Based on this report: • the CEO & Managing Director makes a recommendation to the Board via the Remuneration
Committee, for approval of the release (and/or clawback where appropriate) of deferred incentives and unvested LTI awards for the Senior Executives; and
• the Chairmen of the Remuneration, Risk and Audit Committees make a recommendation to the Board, for approval of the release (and/or clawback where appropriate) of deferred incentives and unvested LTI awards for the CEO & Managing Director.
Minimum shareholding requirement
To further align the CEO & Managing Director and Senior Executives’ interests with those of shareholders, in the 2014 financial year the Board introduced a minimum shareholding requirement which requires Senior Executives to have a shareholding in the Company of a value that is equal to at least 100% of one year’s pre-tax (gross) fixed remuneration.
Senior Executives who were in office at October 2013 are required to achieve the full amount by October 2017. The CEO & Managing Director or any Senior Executives appointed after October 2013 will have four years from the October following their appointment to achieve the 100% shareholding, with 50% to be achieved after two years.
The value of the shares for the purposes of this requirement is the market value of the underlying shares.
Unvested performance rights within the LTI plan for executives do not qualify toward meeting this requirement.
Based on their shareholding as at 30 June 2016, all Senior Executives are on track to hold sufficient shares to meet the October 2017 requirement. Detailed share ownership information for Senior Executives is shown in section 4.2.
1 The criteria were reviewed, updated and approved by the Board in November 2014 (effective January 2015) to ensure consistent and appropriate application of clawback for all executives.
SUNCORP GROUP LIMITED REMUNERATION REPORT 39
Risk and f inancial control personnel
Separate performance and remuneration review processes govern remuneration decisions concerning employees working in the areas of risk and financial control.
In these roles, performance measures are set and assessment occurs independently of their business function, the Chief Risk and Legal Officer or CFO oversees the process as appropriate.
In addition, employees working in risk roles typically have a comparatively higher percentage of risk-based measures in their scorecard.
Hedging prohibit ion
The Suncorp Group Securities Trading Policy prohibits directors, employees and contractors from dealing in a financial product which operates to limit the economic risk of a holding in the Company’s securities (i.e. hedging), including unvested LTI performance rights.
All KMP are reminded of this policy at least twice per year, usually in the month prior to the release of Suncorp Group’s annual and half-yearly financial results.
While performance rights remain unvested, executives do not have an entitlement to the underlying shares held in the name of the trustee, nor may they access the underlying shares.
Any subsequent dealing in those shares is subject to the terms of the Securities Trading Policy. More detail can be found in the 2016 Corporate Governance Statement at suncorpgroup.com.au/about-us/governance.
For
per
sona
l use
onl
y
SUNCORP GROUP LIMITED REMUNERATION REPORT 40
2.8 EXECUTIVE REMUNERATION – STATUTORY DISCLOSURES
This section provides full details of total remuneration for executives for 2016 and 2015, as required under the Corporations Act 2001.
The following table includes LTI amounts during 2016 and 2015 which are ‘share-based payment’ amounts that reflect the amount required to be expensed in accordance with the Australian Accounting Standards (AASBs).
The fair value of equity-settled performance rights is determined at grant date and amortised over the vesting period. The fair value of cash-settled performance rights is remeasured at year end, with changes in fair value recognised as an expense. The values realised by executives in subsequent years may differ to the accounting expense reported below, depending on the extent to which the performance hurdles are met.
Short-term benefits
Post-employment
benefits Long-term benefits
Salary and fees
Cash incentives
Non-monetary benefits1 Other2
Superannuation benefits
Deferred incentives3 Other4
Termination benefits5
Share-based payments6
Total remuneration
Performance related
$000 $000 $000 $000 $000 $000 $000 $000 $000 $000 % Executive director M Cameron 2016 1,537 630 29 118 16 630 26 - 2,315 5,301 67.4 Former executive director P Snowball 2016 667 - 114 (111) - 110 9 1,434 621 2,844 25.7 2015 2,550 1,434 88 49 - 1,569 39 - 2,396 8,125 66.5 Senior Executives A Day 2016 930 481 14 16 19 284 34 - 439 2,217 54.3 2015 783 581 13 31 19 342 13 - 355 2,137 59.8 G Dransfield 2016 864 437 46 8 19 256 21 - 393 2,044 53.1 2015 684 496 108 35 19 290 - - 304 1,936 56.3 C Herbert 2016 755 383 15 30 19 226 38 - 360 1,826 53.1 2015 658 491 14 (12) 19 285 11 - 278 1,744 60.4 S Johnston 2016 930 469 1 27 19 269 39 - 427 2,181 53.4 2015 760 567 - (11) 19 317 13 - 309 1,974 60.5 A Lenahan7 2016 670 - 18 13 19 15 32 - 283 1,050 28.3 2015 484 396 17 (8) 19 229 8 - 199 1,344 61.3 J Nesbitt 2016 1,005 507 6 189 19 301 27 - 501 2,555 51.2 2015 885 655 8 192 19 386 14 - 416 2,575 56.6 M Reinke 2016 680 346 9 29 19 200 38 - 322 1,643 52.8 2015 532 392 9 (6) 19 223 9 - 228 1,406 60.0 A Revis 2016 679 379 13 45 19 224 24 - 346 1,729 54.9 2015 618 471 15 1 19 275 10 - 282 1,691 60.8 P Smeaton 2016 571 288 108 18 18 159 31 - 100 1,293 42.3 Former Senior Executives M Milliner 2016 547 - 17 46 14 25 44 - (359) 334 - 2015 808 583 27 (9) 19 344 13 - 376 2,161 60.3 M Pancino 2016 660 - 6 (4) 19 13 18 - (128) 584 - 2015 683 519 7 8 19 289 11 - 146 1,682 56.7 G Summerhayes 2016 457 91 8 22 14 71 16 773 159 1,611 20.0 2015 768 555 22 (2) 19 324 13 - 338 2,037 59.7
1 Non-monetary benefits represents costs met by Suncorp Group for airfares and insurances. Non-monetary benefits costs for Mr Gary Dransfield include accommodation benefits and PAYE paid by the Suncorp Group in respect of 2015 and 2016. 2 Other short-term benefits represent annual leave accrued during the year and Mr John Nesbitt’s accommodation allowance. The annual leave balance for Mr Geoff Summerhayes, Mr Mark Milliner, Mr Patrick Snowball and Mr Matt Pancino’s were paid out on termination. 3 The amount of deferred incentives awarded to the CEO & Managing Director and Senior Executives are recognised in full as there are no performance or service conditions required. 4 Other long-term benefits represent long service leave accrued during the year. Mr Mark Milliner and Mr Geoff Summerhayes’ long service leave balance was paid out on termination. 5 Termination benefits are paid in accordance with contractual commitments. For Mr Patrick Snowball this includes cessation and contractual repatriation elements for his contribution to the Group to 30 September 2015. 6 Equity-settled performance rights issued as LTI are expensed to the profit or loss based on their fair value at grant date over the period from grant date to vesting date. The assumptions underpinning these valuations are set out in note 10 to the financial statements. 7 Ms Anna Lenahan is ineligible to receive an STI award in 2016 due to notice of resignation being provided.
For
per
sona
l use
onl
y

SUNCORP GROUP LIMITED REMUNERATION REPORT 40
2.8 EXECUTIVE REMUNERATION – STATUTORY DISCLOSURES
This section provides full details of total remuneration for executives for 2016 and 2015, as required under the Corporations Act 2001.
The following table includes LTI amounts during 2016 and 2015 which are ‘share-based payment’ amounts that reflect the amount required to be expensed in accordance with the Australian Accounting Standards (AASBs).
The fair value of equity-settled performance rights is determined at grant date and amortised over the vesting period. The fair value of cash-settled performance rights is remeasured at year end, with changes in fair value recognised as an expense. The values realised by executives in subsequent years may differ to the accounting expense reported below, depending on the extent to which the performance hurdles are met.
Short-term benefits
Post-employment
benefits Long-term benefits
Salary and fees
Cash incentives
Non-monetary benefits1 Other2
Superannuation benefits
Deferred incentives3 Other4
Termination benefits5
Share-based payments6
Total remuneration
Performance related
$000 $000 $000 $000 $000 $000 $000 $000 $000 $000 % Executive director M Cameron 2016 1,537 630 29 118 16 630 26 - 2,315 5,301 67.4 Former executive director P Snowball 2016 667 - 114 (111) - 110 9 1,434 621 2,844 25.7 2015 2,550 1,434 88 49 - 1,569 39 - 2,396 8,125 66.5 Senior Executives A Day 2016 930 481 14 16 19 284 34 - 439 2,217 54.3 2015 783 581 13 31 19 342 13 - 355 2,137 59.8 G Dransfield 2016 864 437 46 8 19 256 21 - 393 2,044 53.1 2015 684 496 108 35 19 290 - - 304 1,936 56.3 C Herbert 2016 755 383 15 30 19 226 38 - 360 1,826 53.1 2015 658 491 14 (12) 19 285 11 - 278 1,744 60.4 S Johnston 2016 930 469 1 27 19 269 39 - 427 2,181 53.4 2015 760 567 - (11) 19 317 13 - 309 1,974 60.5 A Lenahan7 2016 670 - 18 13 19 15 32 - 283 1,050 28.3 2015 484 396 17 (8) 19 229 8 - 199 1,344 61.3 J Nesbitt 2016 1,005 507 6 189 19 301 27 - 501 2,555 51.2 2015 885 655 8 192 19 386 14 - 416 2,575 56.6 M Reinke 2016 680 346 9 29 19 200 38 - 322 1,643 52.8 2015 532 392 9 (6) 19 223 9 - 228 1,406 60.0 A Revis 2016 679 379 13 45 19 224 24 - 346 1,729 54.9 2015 618 471 15 1 19 275 10 - 282 1,691 60.8 P Smeaton 2016 571 288 108 18 18 159 31 - 100 1,293 42.3 Former Senior Executives M Milliner 2016 547 - 17 46 14 25 44 - (359) 334 - 2015 808 583 27 (9) 19 344 13 - 376 2,161 60.3 M Pancino 2016 660 - 6 (4) 19 13 18 - (128) 584 - 2015 683 519 7 8 19 289 11 - 146 1,682 56.7 G Summerhayes 2016 457 91 8 22 14 71 16 773 159 1,611 20.0 2015 768 555 22 (2) 19 324 13 - 338 2,037 59.7
1 Non-monetary benefits represents costs met by Suncorp Group for airfares and insurances. Non-monetary benefits costs for Mr Gary Dransfield include accommodation benefits and PAYE paid by the Suncorp Group in respect of 2015 and 2016. 2 Other short-term benefits represent annual leave accrued during the year and Mr John Nesbitt’s accommodation allowance. The annual leave balance for Mr Geoff Summerhayes, Mr Mark Milliner, Mr Patrick Snowball and Mr Matt Pancino’s were paid out on termination. 3 The amount of deferred incentives awarded to the CEO & Managing Director and Senior Executives are recognised in full as there are no performance or service conditions required. 4 Other long-term benefits represent long service leave accrued during the year. Mr Mark Milliner and Mr Geoff Summerhayes’ long service leave balance was paid out on termination. 5 Termination benefits are paid in accordance with contractual commitments. For Mr Patrick Snowball this includes cessation and contractual repatriation elements for his contribution to the Group to 30 September 2015. 6 Equity-settled performance rights issued as LTI are expensed to the profit or loss based on their fair value at grant date over the period from grant date to vesting date. The assumptions underpinning these valuations are set out in note 10 to the financial statements. 7 Ms Anna Lenahan is ineligible to receive an STI award in 2016 due to notice of resignation being provided.
SUNCORP GROUP LIMITED REMUNERATION REPORT 41
2.9 EMPLOYMENT AGREEMENTS – SUMMARY
The CEO & Managing Director and Senior Executives are employed by Suncorp Staff Pty Limited (SSPL), a wholly-owned subsidiary of the Company, under a standard employment agreement with no fixed term. The agreements may be terminated at any time provided the relevant notice period is given. In the event of misconduct, the Group may terminate the agreement immediately, without notice (or any payment in lieu).
A payment in lieu of notice may be made for all or part of any notice period, calculated based on an individual’s fixed remuneration less superannuation contributions (subject to it not being prohibited by law from making such a payment). Payment on termination will include payment of accrued annual leave and, where appropriate, long service leave. Where a change of control of Suncorp Group Limited occurs, for the CEO & Managing Director deferred STI and a pro-rata award of current year STI may be awarded, and unvested LTI may vest pro-rata (subject to the satisfaction of applicable performance measures). For Senior Executives, the impact of a change of control on remuneration is at Board discretion. A summary is shown in the table below.
CEO & Managing Director, Mr Michael Cameron Senior Executives
Notice period/ termination payments
Employer-initiated termination Incapacity: 9 months Misconduct: none All other cases: 12 months Employee-initiated termination: 6 months
Employer-initiated termination Incapacity: 3 months Misconduct: none All other cases: 12 months Employee-initiated termination: 3 months
Treatment of STI on termination
Employer-initiated and employee-initiated termination Resignation or redundancy: • any cash STI award may be received, subject to performance, at Board discretion • any deferred STI award will generally vest after the termination date at the end of the original
deferral period and will be subject to potential clawback at such time, unless the Board exercises its discretion otherwise.
Misconduct: No cash STI will be awarded and all unvested deferral is forfeited. All other cases: Board discretion.
Treatment of LTI on termination
Qualifying reason1 The Board has the discretion to determine that any unvested LTI performance rights will continue until the relevant vesting dates and remain subject to the performance measures, unless otherwise determined by the Board. Non-qualifying reason All unvested awards are forfeited.
Treatment of restricted shares on termination
Qualifying reason1 The Board has the discretion to determine that any unvested restricted shares will be pro-rated for the time worked in the vesting period and those reduced number of restricted shares will vest at the termination date, unless otherwise determined by the Board. Non-qualifying reason All unvested awards are forfeited.
Not applicable.
1 Qualifying reasons include death, total and permanent disablement, retirement, redundancy as a result of a Suncorp Group restructure, or any other reason determined by the Board.
For
per
sona
l use
onl
y

SUNCORP GROUP LIMITED REMUNERATION REPORT 42
3. NON-EXECUTIVE DIRECTOR ARRANGEMENTS
3.1 REMUNERATION STRUCTURE
Remunerat ion Pol icy
The remuneration arrangements for non-executive directors are designed to ensure Suncorp Group attracts and retains suitably qualified and experienced directors. Arrangements are based on a number of factors, including the requirements of the role, the size and complexity of Suncorp Group and market practices.
Fee structure
Non-executive directors receive fixed remuneration only, paid as directors’ fees, and they do not participate in performance-based incentive plans.
Shareholders have approved a maximum aggregate total remuneration limit of $3,500,000 for all non-executive directors (including Superannuation Guarantee Contributions (SGC)).
Suncorp Group Limited pays compulsory SGC of 9.5% of the director’s base fee on behalf of all eligible non-executive directors. If a non-executive director ceases to be eligible for SGC payments, the equivalent amount is paid in fees.
To support alignment with the market the Board approved changes to the non-executive directors’ fees for the Board, Audit Committee and Risk Committee effective 1 July 2015. This was the first change in non-executive directors’ fees since 1 July 2011.
The approved non-executive director fee structure for 2016 is set out in the table below.1
2016 FEE P.A.2 $000
Committee Board Audit Risk Remuneration Other3 Other4
Chairman fees (C) 6005 60 60 40 100 70
Member fees () 220 30 30 20
Dr Zygmunt Switkowski AO Mr William Bartlett6 Ms Audette Exel AO Ms Sally Herman7 Mr Ewoud Kulk Ms Christine McLoughlin8 Dr Douglas McTaggart9 Mr Geoffrey Ricketts CNZM
C
Ex Officio10
C
Ex Officio10
C
Ex Officio10 C
C
C
The Group’s minimum shareholding requirement introduced in October 2013 (refer to section 2.7) requires non-executive directors in office at 31 October 2013 to hold a minimum number of ordinary shares in the Company with a value at least equal to 50% after two years and 100% after four years of one year’s pre-tax (gross) base fees11.
Any non-executive directors appointed after October 2013 will have four years from the October following their appointment to achieve the 100% shareholding, with a 50% shareholding to be achieved at two years.
1 Mr Michael Cameron retired from the Board and Risk Committee effective 30 September 2015 due to his appointment as CEO & Managing Director effective 1 October 2015. 2 Fees exclude SGC. 3 An additional fee is payable to Mr Geoffrey Ricketts CNZM for the Chairmanship of Vero Insurance New Zealand Limited and other New Zealand insurance companies. 4 An additional fee is payable to Mr Ewoud Kulk for the Chairmanship of AA Insurance Limited. 5 Includes base fee. 6 Mr William Bartlett retired as Chairman of the Remuneration Committee effective 31 December 2015, but remains a member. 7 Ms Sally Herman was appointed to the Board effective 22 October 2015 and the Audit Committee effective 1 January 2016. 8 Ms Christine McLoughlin was appointed Chairman of the Remuneration Committee effective 1 January 2016. 9 Dr Douglas McTaggart was appointed to the Remuneration Committee effective 1 January 2016. 10 Dr Ziggy Switkowski AO does not receive fees for attending Audit, Risk and Remuneration Committee meetings as an ex officio member. 11 Board member fee or Board Chairman fee only (excluding SGC), does not include Committee membership fees or Committee Chairmanship fees.
For
per
sona
l use
onl
y
SUNCORP GROUP LIMITED REMUNERATION REPORT 42
3. NON-EXECUTIVE DIRECTOR ARRANGEMENTS
3.1 REMUNERATION STRUCTURE
Remunerat ion Pol icy
The remuneration arrangements for non-executive directors are designed to ensure Suncorp Group attracts and retains suitably qualified and experienced directors. Arrangements are based on a number of factors, including the requirements of the role, the size and complexity of Suncorp Group and market practices.
Fee structure
Non-executive directors receive fixed remuneration only, paid as directors’ fees, and they do not participate in performance-based incentive plans.
Shareholders have approved a maximum aggregate total remuneration limit of $3,500,000 for all non-executive directors (including Superannuation Guarantee Contributions (SGC)).
Suncorp Group Limited pays compulsory SGC of 9.5% of the director’s base fee on behalf of all eligible non-executive directors. If a non-executive director ceases to be eligible for SGC payments, the equivalent amount is paid in fees.
To support alignment with the market the Board approved changes to the non-executive directors’ fees for the Board, Audit Committee and Risk Committee effective 1 July 2015. This was the first change in non-executive directors’ fees since 1 July 2011.
The approved non-executive director fee structure for 2016 is set out in the table below.1
2016 FEE P.A.2 $000
Committee Board Audit Risk Remuneration Other3 Other4
Chairman fees (C) 6005 60 60 40 100 70
Member fees () 220 30 30 20
Dr Zygmunt Switkowski AO Mr William Bartlett6 Ms Audette Exel AO Ms Sally Herman7 Mr Ewoud Kulk Ms Christine McLoughlin8 Dr Douglas McTaggart9 Mr Geoffrey Ricketts CNZM
C
Ex Officio10
C
Ex Officio10
C
Ex Officio10 C
C
C
The Group’s minimum shareholding requirement introduced in October 2013 (refer to section 2.7) requires non-executive directors in office at 31 October 2013 to hold a minimum number of ordinary shares in the Company with a value at least equal to 50% after two years and 100% after four years of one year’s pre-tax (gross) base fees11.
Any non-executive directors appointed after October 2013 will have four years from the October following their appointment to achieve the 100% shareholding, with a 50% shareholding to be achieved at two years.
1 Mr Michael Cameron retired from the Board and Risk Committee effective 30 September 2015 due to his appointment as CEO & Managing Director effective 1 October 2015. 2 Fees exclude SGC. 3 An additional fee is payable to Mr Geoffrey Ricketts CNZM for the Chairmanship of Vero Insurance New Zealand Limited and other New Zealand insurance companies. 4 An additional fee is payable to Mr Ewoud Kulk for the Chairmanship of AA Insurance Limited. 5 Includes base fee. 6 Mr William Bartlett retired as Chairman of the Remuneration Committee effective 31 December 2015, but remains a member. 7 Ms Sally Herman was appointed to the Board effective 22 October 2015 and the Audit Committee effective 1 January 2016. 8 Ms Christine McLoughlin was appointed Chairman of the Remuneration Committee effective 1 January 2016. 9 Dr Douglas McTaggart was appointed to the Remuneration Committee effective 1 January 2016. 10 Dr Ziggy Switkowski AO does not receive fees for attending Audit, Risk and Remuneration Committee meetings as an ex officio member. 11 Board member fee or Board Chairman fee only (excluding SGC), does not include Committee membership fees or Committee Chairmanship fees.
SUNCORP GROUP LIMITED REMUNERATION REPORT 43
All non-executive directors are currently on track to hold sufficient shares to meet the shareholding requirement. Detailed share ownership information for the non-executive directors is shown in section 4.2.
3.2 NON-EXECUTIVE DIRECTORS’ SHARE PLAN
The Non-Executive Directors’ Share Plan, established in November 2001 following shareholder approval, facilitates the purchase of shares by non-executive directors by nominating, on a voluntary basis, a percentage of their pre-tax remuneration to be used to purchase the Company’s shares on-market at pre-determined dates. The purpose of the plan is to provide Suncorp Group equity exposure for non-executive directors.
The shares are fully vested and if acquired prior to 1 July 2009 can be held in the plan for up to ten years from the date of purchase or until retirement, whichever occurs first. Shares acquired after 1 July 2009 can be held for up to seven years.
3.3 NON-EXECUTIVE DIRECTORS’ REMUNERATION DISCLOSURES
Details of non-executive directors’ remuneration for 2016 and 2015 are set out in the table below. None of the remuneration paid to non-executive directors is performance-based.
Year Short-term benefits Post-employment
benefits Total
Salary and fees
Non-monetary benefits1
Superannuation benefits
$000 $000 $000 $000
Non-executive directors in office as at 30 June 2016 Dr Z Switkowski AO 2016 600 1 58 659
2015 570 1 54 625
W Bartlett 2016 310 1 29 340
2015 292 1 28 321
A Exel AO 2016 250 1 24 275
2015 232 1 22 255
S Herman2 2016 164 - 16 180
E Kulk 2016 370 1 36 406
2015 344 1 33 378
C McLoughlin 2016 280 1 28 309
2015 95 - 9 104
Dr D McTaggart 2016 290 1 28 319
2015 257 1 24 282
G Ricketts CNZM 2016 350 1 34 385
2015 323 1 31 355
Former non-executive director M Cameron3 2016 57 - 5 62
2015 223 1 21 245
1 The non-executive directors receive a non-monetary benefit in relation to a proportion of the directors’ and officers’ insurance policy premium pro-rated for time in office. The amounts for both the current and prior year are below $1,000 per individual. 2 Ms Sally Herman was appointed to the Board effective 22 October 2015. 3 Mr Michael Cameron retired from the Board on 30 September 2015. From 25 August 2012 onwards, Mr Cameron’s fees (exclusive of superannuation) were paid directly to GPT Management Holdings Limited.
For
per
sona
l use
onl
y

SUNCORP GROUP LIMITED REMUNERATION REPORT 44
4. RELATED PARTY TRANSACTIONS
4.1 LOANS TO KEY MANAGEMENT PERSONNEL AND THEIR RELATED PARTIES
Loans to KMP and their related parties are secured housing loans and asset lines provided in the ordinary course of the Banking business. All loans have normal commercial terms, which may include staff discounts at the same terms available to all employees of Suncorp Group. No amounts have been written down or recorded as provisions, as the balances are considered fully collectable.
Details regarding loans outstanding at the reporting date to KMP and their related parties, where the individual’s aggregate loan balance exceeded $100,000 at any time during the reporting period, are as follows:
2016
Balance
1 July 2015 Balance
30 June 2016 Interest charged during the year1 Highest balance
$000 $000 $000 $000
Senior Executives
S Johnston - 1,200 - 1,200
A Lenahan 130 - 1 130
M Reinke 228 183 10 228
A Revis 3,960 4,125 188 4,240
P Smeaton 321 298 16 359 Details regarding the aggregate of loans made, guaranteed or secured by any entity in Suncorp Group to KMP and their related parties, and the number of individuals in each group, are as follows:
2016
Key management
personnel Other related
parties Total
$000 $000 $000
Opening balance 4,111 528 4,639
Closing balance 5,138 668 5,806
Interest charged 196 19 215
Number Number Number
Number of individuals at 30 June 4 2 6
1 The loans may have offset facilities, in which case the interest charged is after the offset.
For
per
sona
l use
onl
y
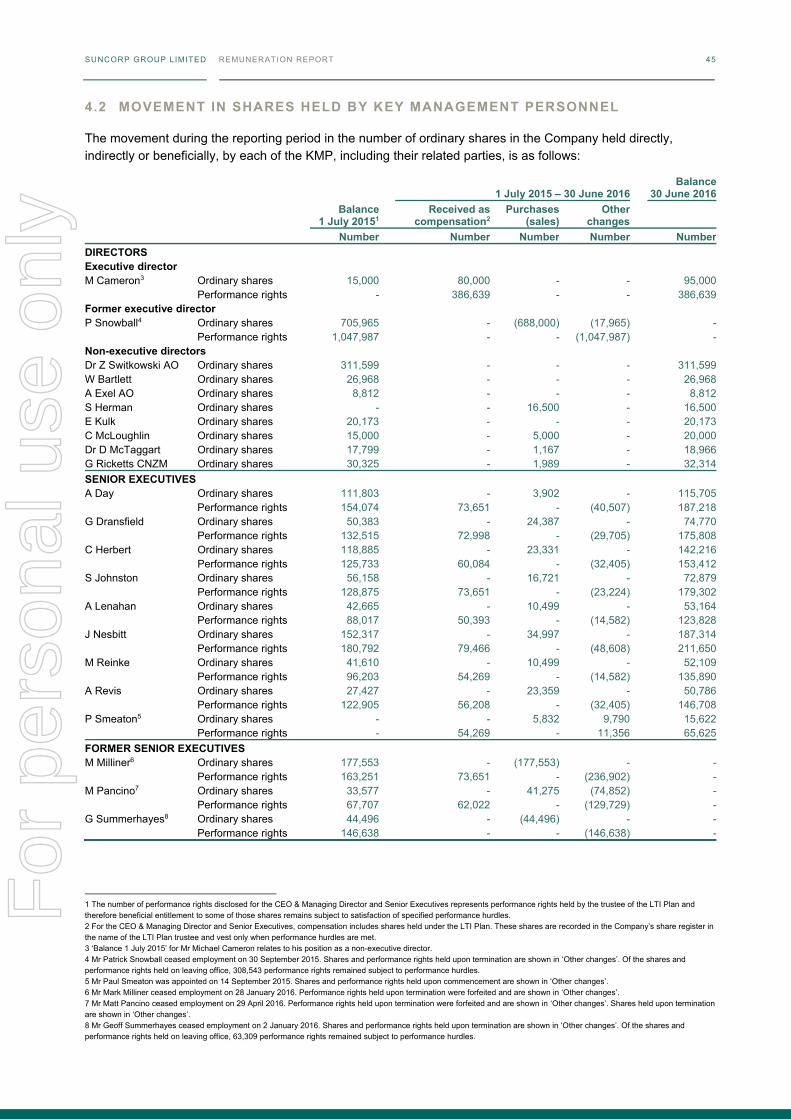
SUNCORP GROUP LIMITED REMUNERATION REPORT 44
4. RELATED PARTY TRANSACTIONS
4.1 LOANS TO KEY MANAGEMENT PERSONNEL AND THEIR RELATED PARTIES
Loans to KMP and their related parties are secured housing loans and asset lines provided in the ordinary course of the Banking business. All loans have normal commercial terms, which may include staff discounts at the same terms available to all employees of Suncorp Group. No amounts have been written down or recorded as provisions, as the balances are considered fully collectable.
Details regarding loans outstanding at the reporting date to KMP and their related parties, where the individual’s aggregate loan balance exceeded $100,000 at any time during the reporting period, are as follows:
2016
Balance
1 July 2015 Balance
30 June 2016 Interest charged during the year1 Highest balance
$000 $000 $000 $000
Senior Executives
S Johnston - 1,200 - 1,200
A Lenahan 130 - 1 130
M Reinke 228 183 10 228
A Revis 3,960 4,125 188 4,240
P Smeaton 321 298 16 359 Details regarding the aggregate of loans made, guaranteed or secured by any entity in Suncorp Group to KMP and their related parties, and the number of individuals in each group, are as follows:
2016
Key management
personnel Other related
parties Total
$000 $000 $000
Opening balance 4,111 528 4,639
Closing balance 5,138 668 5,806
Interest charged 196 19 215
Number Number Number
Number of individuals at 30 June 4 2 6
1 The loans may have offset facilities, in which case the interest charged is after the offset.
SUNCORP GROUP LIMITED REMUNERATION REPORT 45
4.2 MOVEMENT IN SHARES HELD BY KEY MANAGEMENT PERSONNEL
The movement during the reporting period in the number of ordinary shares in the Company held directly, indirectly or beneficially, by each of the KMP, including their related parties, is as follows:
Balance1 July 20151
1 July 2015 – 30 June 2016Balance
30 June 2016Received as
compensation2Purchases
(sales)Other
changesNumber Number Number Number Number
DIRECTORS Executive director M Cameron3 Ordinary shares 15,000 80,000 - - 95,000 Performance rights - 386,639 - - 386,639Former executive director P Snowball4 Ordinary shares 705,965 - (688,000) (17,965) - Performance rights 1,047,987 - - (1,047,987) -Non-executive directors Dr Z Switkowski AO Ordinary shares 311,599 - - - 311,599W Bartlett Ordinary shares 26,968 - - - 26,968A Exel AO Ordinary shares 8,812 - - - 8,812S Herman Ordinary shares - - 16,500 - 16,500E Kulk Ordinary shares 20,173 - - - 20,173C McLoughlin Ordinary shares 15,000 - 5,000 - 20,000Dr D McTaggart Ordinary shares 17,799 - 1,167 - 18,966G Ricketts CNZM Ordinary shares 30,325 - 1,989 - 32,314SENIOR EXECUTIVES A Day Ordinary shares 111,803 - 3,902 - 115,705 Performance rights 154,074 73,651 - (40,507) 187,218G Dransfield Ordinary shares 50,383 - 24,387 - 74,770 Performance rights 132,515 72,998 - (29,705) 175,808C Herbert Ordinary shares 118,885 - 23,331 - 142,216 Performance rights 125,733 60,084 - (32,405) 153,412S Johnston Ordinary shares 56,158 - 16,721 - 72,879 Performance rights 128,875 73,651 - (23,224) 179,302A Lenahan Ordinary shares 42,665 - 10,499 - 53,164 Performance rights 88,017 50,393 - (14,582) 123,828J Nesbitt Ordinary shares 152,317 - 34,997 - 187,314 Performance rights 180,792 79,466 - (48,608) 211,650M Reinke Ordinary shares 41,610 - 10,499 - 52,109 Performance rights 96,203 54,269 - (14,582) 135,890A Revis Ordinary shares 27,427 - 23,359 - 50,786 Performance rights 122,905 56,208 - (32,405) 146,708P Smeaton5 Ordinary shares - - 5,832 9,790 15,622 Performance rights - 54,269 - 11,356 65,625FORMER SENIOR EXECUTIVES M Milliner6 Ordinary shares 177,553 - (177,553) - - Performance rights 163,251 73,651 - (236,902) -M Pancino7 Ordinary shares 33,577 - 41,275 (74,852) - Performance rights 67,707 62,022 - (129,729) -G Summerhayes8 Ordinary shares 44,496 - (44,496) - - Performance rights 146,638 - - (146,638) -
1 The number of performance rights disclosed for the CEO & Managing Director and Senior Executives represents performance rights held by the trustee of the LTI Plan and therefore beneficial entitlement to some of those shares remains subject to satisfaction of specified performance hurdles. 2 For the CEO & Managing Director and Senior Executives, compensation includes shares held under the LTI Plan. These shares are recorded in the Company’s share register in the name of the LTI Plan trustee and vest only when performance hurdles are met. 3 ‘Balance 1 July 2015’ for Mr Michael Cameron relates to his position as a non-executive director. 4 Mr Patrick Snowball ceased employment on 30 September 2015. Shares and performance rights held upon termination are shown in ‘Other changes’. Of the shares and performance rights held on leaving office, 308,543 performance rights remained subject to performance hurdles. 5 Mr Paul Smeaton was appointed on 14 September 2015. Shares and performance rights held upon commencement are shown in ‘Other changes’. 6 Mr Mark Milliner ceased employment on 28 January 2016. Performance rights held upon termination were forfeited and are shown in ‘Other changes’. 7 Mr Matt Pancino ceased employment on 29 April 2016. Performance rights held upon termination were forfeited and are shown in ‘Other changes’. Shares held upon termination are shown in ‘Other changes’. 8 Mr Geoff Summerhayes ceased employment on 2 January 2016. Shares and performance rights held upon termination are shown in ‘Other changes’. Of the shares and performance rights held on leaving office, 63,309 performance rights remained subject to performance hurdles.
For
per
sona
l use
onl
y
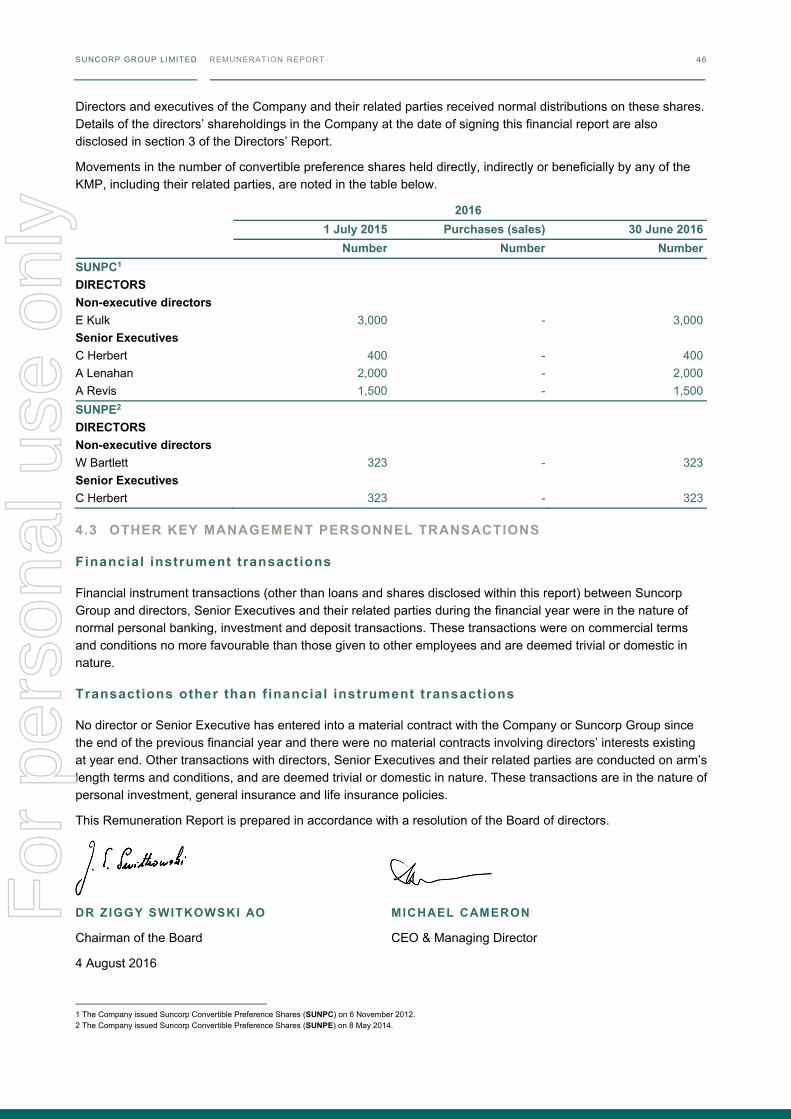
SUNCORP GROUP LIMITED REMUNERATION REPORT 46
Directors and executives of the Company and their related parties received normal distributions on these shares. Details of the directors’ shareholdings in the Company at the date of signing this financial report are also disclosed in section 3 of the Directors’ Report.
Movements in the number of convertible preference shares held directly, indirectly or beneficially by any of the KMP, including their related parties, are noted in the table below.
2016 1 July 2015 Purchases (sales) 30 June 2016 Number Number Number
SUNPC1 DIRECTORS Non-executive directors E Kulk 3,000 - 3,000 Senior Executives C Herbert 400 - 400 A Lenahan 2,000 - 2,000 A Revis 1,500 - 1,500 SUNPE2 DIRECTORS Non-executive directors W Bartlett 323 - 323 Senior Executives C Herbert 323 - 323
4.3 OTHER KEY MANAGEMENT PERSONNEL TRANSACTIONS
Financial instrument transactions
Financial instrument transactions (other than loans and shares disclosed within this report) between Suncorp Group and directors, Senior Executives and their related parties during the financial year were in the nature of normal personal banking, investment and deposit transactions. These transactions were on commercial terms and conditions no more favourable than those given to other employees and are deemed trivial or domestic in nature.
Transactions other than f inancial instrument transactions
No director or Senior Executive has entered into a material contract with the Company or Suncorp Group since the end of the previous financial year and there were no material contracts involving directors’ interests existing at year end. Other transactions with directors, Senior Executives and their related parties are conducted on arm’s length terms and conditions, and are deemed trivial or domestic in nature. These transactions are in the nature of personal investment, general insurance and life insurance policies.
This Remuneration Report is prepared in accordance with a resolution of the Board of directors.
DR ZIGGY SWITKOWSKI AO
Chairman of the Board
MICHAEL CAMERON
CEO & Managing Director
4 August 2016
1 The Company issued Suncorp Convertible Preference Shares (SUNPC) on 6 November 2012. 2 The Company issued Suncorp Convertible Preference Shares (SUNPE) on 8 May 2014.
SUNCORP GROUP LIMITED LEAD AUDITOR’S INDEPENDENCE DECLARATION 47
LEAD AUDITOR’S INDEPENDENCE DECLARATION
LEAD AUDITOR’S INDEPENDENCE DECLARATION UNDER SECTION 307C OF THE CORPORATIONS ACT 2001 TO THE DIRECTORS OF SUNCORP GROUP LIMITED
I declare that, to the best of my knowledge and belief, in relation to the audit for the financial year ended 30 June 2016 there have been:
1. no contraventions of the auditor independence requirements as set out in the Corporations Act 2001 in relation to the audit; and
2. no contraventions of any applicable code of professional conduct in relation to the audit.
KPMG
CHRIS HALL
Partner Sydney
4 August 2016
KPMG, an Australian partnership and a member firm of the KPMG network of independent member firms affiliated with KPMG International Cooperative (“KPMG International”), a Swiss entity.
Liability limited by a scheme approved under Professional Standards Legislation. F
or p
erso
nal u
se o
nly
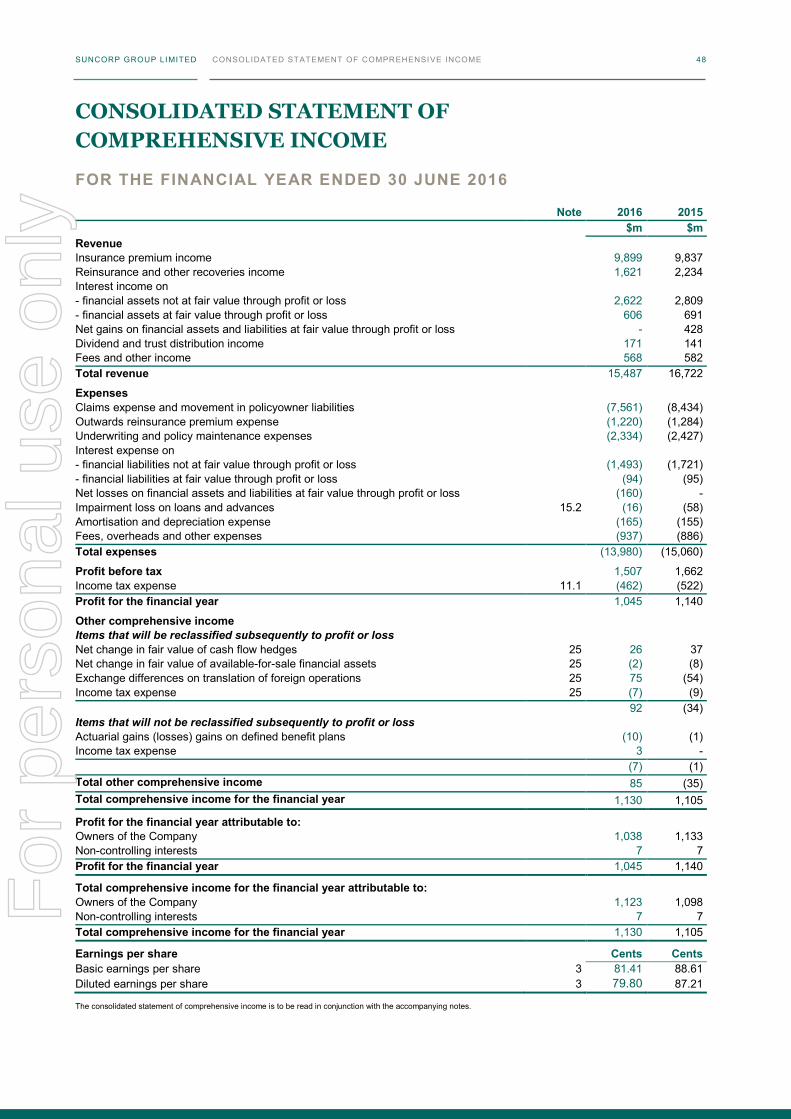
SUNCORP GROUP LIMITED CONSOLIDATED STATEMENT OF COMPREHENSIVE INCOME 48
CONSOLIDATED STATEMENT OF COMPREHENSIVE INCOME
FOR THE FINANCIAL YEAR ENDED 30 JUNE 2016
Note 2016 2015 $m $m
Revenue Insurance premium income 9,899 9,837 Reinsurance and other recoveries income 1,621 2,234 Interest income on - financial assets not at fair value through profit or loss 2,622 2,809 - financial assets at fair value through profit or loss 606 691 Net gains on financial assets and liabilities at fair value through profit or loss - 428 Dividend and trust distribution income 171 141 Fees and other income 568 582 Total revenue 15,487 16,722
Expenses Claims expense and movement in policyowner liabilities (7,561) (8,434) Outwards reinsurance premium expense (1,220) (1,284) Underwriting and policy maintenance expenses (2,334) (2,427) Interest expense on - financial liabilities not at fair value through profit or loss (1,493) (1,721) - financial liabilities at fair value through profit or loss (94) (95) Net losses on financial assets and liabilities at fair value through profit or loss (160) - Impairment loss on loans and advances 15.2 (16) (58) Amortisation and depreciation expense (165) (155) Fees, overheads and other expenses (937) (886) Total expenses (13,980) (15,060)
Profit before tax 1,507 1,662 Income tax expense 11.1 (462) (522) Profit for the financial year 1,045 1,140
Other comprehensive income Items that will be reclassified subsequently to profit or loss Net change in fair value of cash flow hedges 25 26 37 Net change in fair value of available-for-sale financial assets 25 (2) (8) Exchange differences on translation of foreign operations 25 75 (54) Income tax expense 25 (7) (9) 92 (34) Items that will not be reclassified subsequently to profit or loss Actuarial gains (losses) gains on defined benefit plans (10) (1) Income tax expense 3 - (7) (1) Total other comprehensive income 85 (35) Total comprehensive income for the financial year 1,130 1,105
Profit for the financial year attributable to: Owners of the Company 1,038 1,133 Non-controlling interests 7 7 Profit for the financial year 1,045 1,140
Total comprehensive income for the financial year attributable to: Owners of the Company 1,123 1,098 Non-controlling interests 7 7 Total comprehensive income for the financial year 1,130 1,105
Earnings per share Cents Cents Basic earnings per share 3 81.41 88.61 Diluted earnings per share 3 79.80 87.21
The consolidated statement of comprehensive income is to be read in conjunction with the accompanying notes.
For
per
sona
l use
onl
y
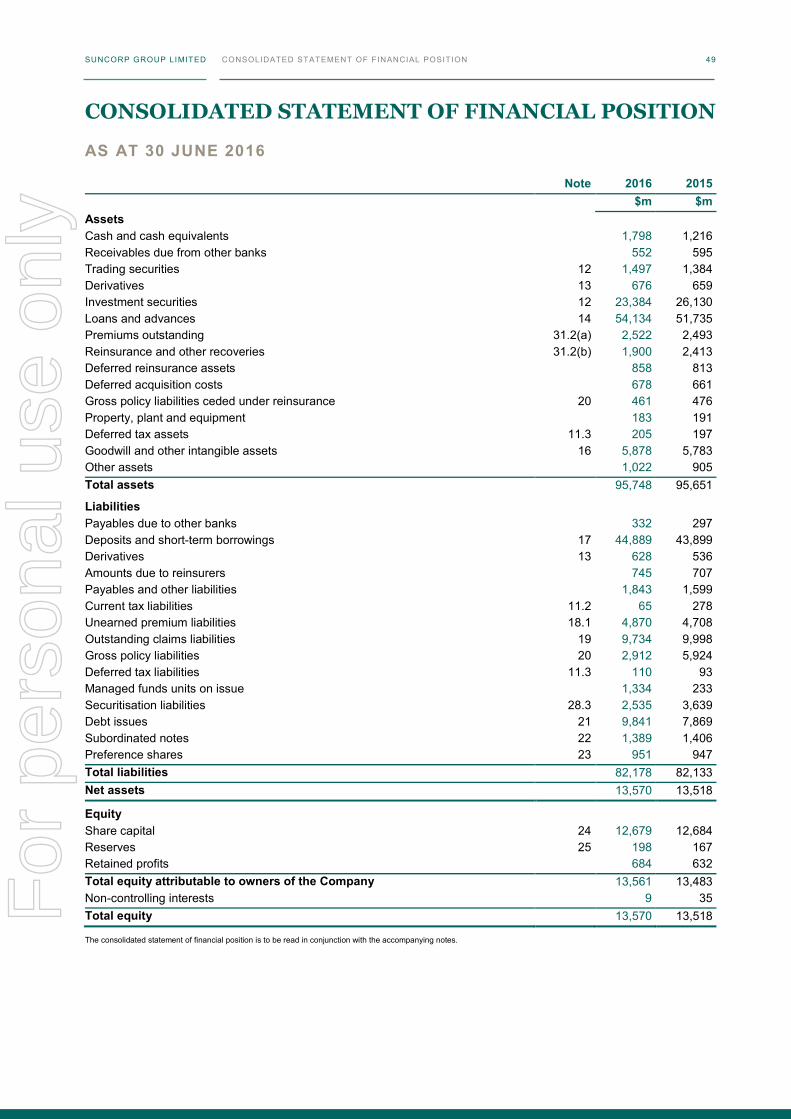
SUNCORP GROUP LIMITED CONSOLIDATED STATEMENT OF COMPREHENSIVE INCOME 48
CONSOLIDATED STATEMENT OF COMPREHENSIVE INCOME
FOR THE FINANCIAL YEAR ENDED 30 JUNE 2016
Note 2016 2015 $m $m
Revenue Insurance premium income 9,899 9,837 Reinsurance and other recoveries income 1,621 2,234 Interest income on - financial assets not at fair value through profit or loss 2,622 2,809 - financial assets at fair value through profit or loss 606 691 Net gains on financial assets and liabilities at fair value through profit or loss - 428 Dividend and trust distribution income 171 141 Fees and other income 568 582 Total revenue 15,487 16,722
Expenses Claims expense and movement in policyowner liabilities (7,561) (8,434) Outwards reinsurance premium expense (1,220) (1,284) Underwriting and policy maintenance expenses (2,334) (2,427) Interest expense on - financial liabilities not at fair value through profit or loss (1,493) (1,721) - financial liabilities at fair value through profit or loss (94) (95) Net losses on financial assets and liabilities at fair value through profit or loss (160) - Impairment loss on loans and advances 15.2 (16) (58) Amortisation and depreciation expense (165) (155) Fees, overheads and other expenses (937) (886) Total expenses (13,980) (15,060)
Profit before tax 1,507 1,662 Income tax expense 11.1 (462) (522) Profit for the financial year 1,045 1,140
Other comprehensive income Items that will be reclassified subsequently to profit or loss Net change in fair value of cash flow hedges 25 26 37 Net change in fair value of available-for-sale financial assets 25 (2) (8) Exchange differences on translation of foreign operations 25 75 (54) Income tax expense 25 (7) (9) 92 (34) Items that will not be reclassified subsequently to profit or loss Actuarial gains (losses) gains on defined benefit plans (10) (1) Income tax expense 3 - (7) (1) Total other comprehensive income 85 (35) Total comprehensive income for the financial year 1,130 1,105
Profit for the financial year attributable to: Owners of the Company 1,038 1,133 Non-controlling interests 7 7 Profit for the financial year 1,045 1,140
Total comprehensive income for the financial year attributable to: Owners of the Company 1,123 1,098 Non-controlling interests 7 7 Total comprehensive income for the financial year 1,130 1,105
Earnings per share Cents Cents Basic earnings per share 3 81.41 88.61 Diluted earnings per share 3 79.80 87.21
The consolidated statement of comprehensive income is to be read in conjunction with the accompanying notes.
SUNCORP GROUP LIMITED CONSOLIDATED STATEMENT OF FINANCIAL POSITION 49
CONSOLIDATED STATEMENT OF FINANCIAL POSITION
AS AT 30 JUNE 2016
Note 2016 2015 $m $m Assets Cash and cash equivalents 1,798 1,216 Receivables due from other banks 552 595 Trading securities 12 1,497 1,384 Derivatives 13 676 659 Investment securities 12 23,384 26,130 Loans and advances 14 54,134 51,735 Premiums outstanding 31.2(a) 2,522 2,493 Reinsurance and other recoveries 31.2(b) 1,900 2,413 Deferred reinsurance assets 858 813 Deferred acquisition costs 678 661 Gross policy liabilities ceded under reinsurance 20 461 476 Property, plant and equipment 183 191 Deferred tax assets 11.3 205 197 Goodwill and other intangible assets 16 5,878 5,783 Other assets 1,022 905 Total assets 95,748 95,651
Liabilities Payables due to other banks 332 297 Deposits and short-term borrowings 17 44,889 43,899 Derivatives 13 628 536 Amounts due to reinsurers 745 707 Payables and other liabilities 1,843 1,599 Current tax liabilities 11.2 65 278 Unearned premium liabilities 18.1 4,870 4,708 Outstanding claims liabilities 19 9,734 9,998 Gross policy liabilities 20 2,912 5,924 Deferred tax liabilities 11.3 110 93 Managed funds units on issue 1,334 233 Securitisation liabilities 28.3 2,535 3,639 Debt issues 21 9,841 7,869 Subordinated notes 22 1,389 1,406 Preference shares 23 951 947 Total liabilities 82,178 82,133 Net assets 13,570 13,518
Equity Share capital 24 12,679 12,684 Reserves 25 198 167 Retained profits 684 632 Total equity attributable to owners of the Company 13,561 13,483 Non-controlling interests 9 35 Total equity 13,570 13,518
The consolidated statement of financial position is to be read in conjunction with the accompanying notes.
For
per
sona
l use
onl
y
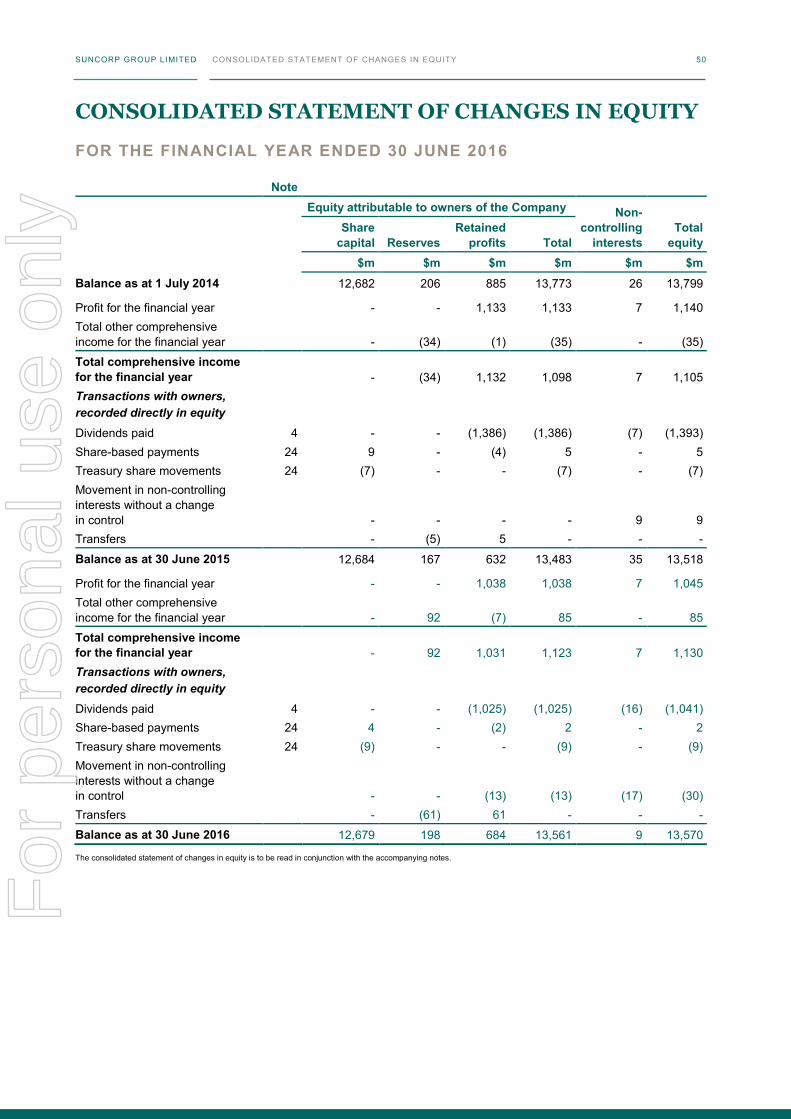
SUNCORP GROUP LIMITED CONSOLIDATED STATEMENT OF CHANGES IN EQUITY 50
CONSOLIDATED STATEMENT OF CHANGES IN EQUITY
FOR THE FINANCIAL YEAR ENDED 30 JUNE 2016
Note Equity attributable to owners of the Company Non-
controlling interests
Share
capital Reserves Retained
profits Total Total
equity $m $m $m $m $m $m
Balance as at 1 July 2014 12,682 206 885 13,773 26 13,799
Profit for the financial year - - 1,133 1,133 7 1,140 Total other comprehensive income for the financial year - (34) (1) (35) - (35)
Total comprehensive income for the financial year - (34) 1,132 1,098 7 1,105 Transactions with owners, recorded directly in equity Dividends paid 4 - - (1,386) (1,386) (7) (1,393) Share-based payments 24 9 - (4) 5 - 5 Treasury share movements 24 (7) - - (7) - (7) Movement in non-controlling interests without a change in control - - - - 9 9 Transfers - (5) 5 - - -
Balance as at 30 June 2015 12,684 167 632 13,483 35 13,518
Profit for the financial year - - 1,038 1,038 7 1,045 Total other comprehensive income for the financial year - 92 (7) 85 - 85
Total comprehensive income for the financial year - 92 1,031 1,123 7 1,130 Transactions with owners, recorded directly in equity Dividends paid 4 - - (1,025) (1,025) (16) (1,041) Share-based payments 24 4 - (2) 2 - 2 Treasury share movements 24 (9) - - (9) - (9) Movement in non-controlling interests without a change in control - - (13) (13) (17) (30) Transfers - (61) 61 - - -
Balance as at 30 June 2016 12,679 198 684 13,561 9 13,570
The consolidated statement of changes in equity is to be read in conjunction with the accompanying notes.
For
per
sona
l use
onl
y
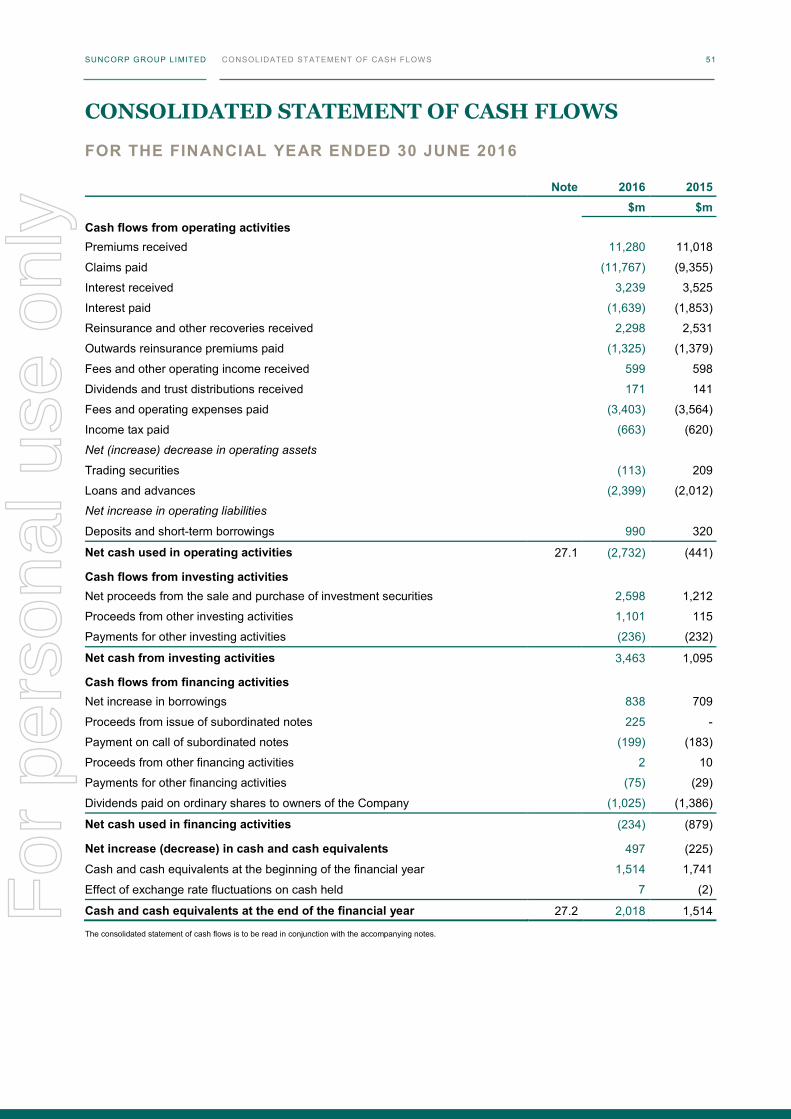
SUNCORP GROUP LIMITED CONSOLIDATED STATEMENT OF CHANGES IN EQUITY 50
CONSOLIDATED STATEMENT OF CHANGES IN EQUITY
FOR THE FINANCIAL YEAR ENDED 30 JUNE 2016
Note Equity attributable to owners of the Company Non-
controlling interests
Share
capital Reserves Retained
profits Total Total
equity $m $m $m $m $m $m
Balance as at 1 July 2014 12,682 206 885 13,773 26 13,799
Profit for the financial year - - 1,133 1,133 7 1,140 Total other comprehensive income for the financial year - (34) (1) (35) - (35)
Total comprehensive income for the financial year - (34) 1,132 1,098 7 1,105 Transactions with owners, recorded directly in equity Dividends paid 4 - - (1,386) (1,386) (7) (1,393) Share-based payments 24 9 - (4) 5 - 5 Treasury share movements 24 (7) - - (7) - (7) Movement in non-controlling interests without a change in control - - - - 9 9 Transfers - (5) 5 - - -
Balance as at 30 June 2015 12,684 167 632 13,483 35 13,518
Profit for the financial year - - 1,038 1,038 7 1,045 Total other comprehensive income for the financial year - 92 (7) 85 - 85
Total comprehensive income for the financial year - 92 1,031 1,123 7 1,130 Transactions with owners, recorded directly in equity Dividends paid 4 - - (1,025) (1,025) (16) (1,041) Share-based payments 24 4 - (2) 2 - 2 Treasury share movements 24 (9) - - (9) - (9) Movement in non-controlling interests without a change in control - - (13) (13) (17) (30) Transfers - (61) 61 - - -
Balance as at 30 June 2016 12,679 198 684 13,561 9 13,570
The consolidated statement of changes in equity is to be read in conjunction with the accompanying notes.
SUNCORP GROUP LIMITED CONSOLIDATED STATEMENT OF CASH FLOWS 51
CONSOLIDATED STATEMENT OF CASH FLOWS
FOR THE FINANCIAL YEAR ENDED 30 JUNE 2016
Note 2016 2015 $m $m
Cash flows from operating activities Premiums received 11,280 11,018
Claims paid (11,767) (9,355)
Interest received 3,239 3,525
Interest paid (1,639) (1,853)
Reinsurance and other recoveries received 2,298 2,531
Outwards reinsurance premiums paid (1,325) (1,379)
Fees and other operating income received 599 598
Dividends and trust distributions received 171 141
Fees and operating expenses paid (3,403) (3,564)
Income tax paid (663) (620)
Net (increase) decrease in operating assets
Trading securities (113) 209
Loans and advances (2,399) (2,012)
Net increase in operating liabilities
Deposits and short-term borrowings 990 320
Net cash used in operating activities 27.1 (2,732) (441)
Cash flows from investing activities Net proceeds from the sale and purchase of investment securities 2,598 1,212
Proceeds from other investing activities 1,101 115
Payments for other investing activities (236) (232)
Net cash from investing activities 3,463 1,095
Cash flows from financing activities Net increase in borrowings 838 709
Proceeds from issue of subordinated notes 225 -
Payment on call of subordinated notes (199) (183)
Proceeds from other financing activities 2 10
Payments for other financing activities (75) (29)
Dividends paid on ordinary shares to owners of the Company (1,025) (1,386)
Net cash used in financing activities (234) (879)
Net increase (decrease) in cash and cash equivalents 497 (225)
Cash and cash equivalents at the beginning of the financial year 1,514 1,741
Effect of exchange rate fluctuations on cash held 7 (2)
Cash and cash equivalents at the end of the financial year 27.2 2,018 1,514
The consolidated statement of cash flows is to be read in conjunction with the accompanying notes.
For
per
sona
l use
onl
y
SUNCORP GROUP LIMITED NOTES TO THE CONSOLIDATED FINANCIAL STATEMENTS 52
NOTES TO THE CONSOLIDATED FINANCIAL STATEMENTS
FOR THE FINANCIAL YEAR ENDED 30 JUNE 2016
1. REPORTING ENTITY
Suncorp Group Limited (the Company) is a public company domiciled in Australia. Its registered office is at Level 28, 266 George Street, Brisbane, Qld, 4000.
The consolidated financial statements for the financial year ended 30 June 2016 comprise the Company and its subsidiaries (the Suncorp Group or the Group) and were authorised for issue by the Board of Directors on 4 August 2016.
The Group’s principal activities during the course of the financial year were the provision of general insurance, banking, life insurance, superannuation products and related services to the retail, corporate and commercial sectors in Australia and New Zealand.
2. BASIS OF PREPARATION
The Suncorp Group is a for-profit entity and its consolidated financial statements have been prepared on the historical cost basis unless the application of fair value measurements are required by the relevant accounting standards.
These consolidated financial statements are presented in Australian dollars which is the Company’s functional and presentation currency and the functional currency of the majority of its subsidiaries.
As the Company is of a kind referred to in ASIC Corporations (Rounding in Financial/Directors’ Reports) Instrument 2016/191 dated 24 March 2016, all financial information presented has been rounded to the nearest one million dollars unless otherwise stated.
The consolidated statement of financial position is prepared in a liquidity format. Amounts expected to be recovered or settled no more than twelve months after the reporting period, are classified as ‘current’ otherwise they are classified as ‘non-current’.
Significant accounting policies applied in the preparation of these consolidated financial statements are set out in note 37.
Where necessary, comparatives have been restated to conform to changes in presentation in the current year.
2.1 STATEMENT OF COMPLIANCE
The consolidated financial statements are general purpose financial statements which have been prepared in accordance with Australian Accounting Standards (including Australian Interpretations) adopted by the Australian Accounting Standards Board (AASB) and the Corporations Act 2001. The consolidated financial statements comply with International Financial Reporting Standards and Interpretations issued by the International Accounting Standards Board.
2.2 USE OF ESTIMATES AND JUDGMENTS
The preparation of consolidated financial statements requires management to make judgments, estimates and assumptions that affect the application of accounting policies and the amounts reported in the financial statements. The estimates and associated assumptions are based on historical experience and various other factors that are believed to be reasonable under the circumstances. Estimates and underlying assumptions are reviewed on an ongoing basis. Where revisions are made to accounting estimates, any financial impact is recognised in the period in which the estimate is revised.
For
per
sona
l use
onl
y

SUNCORP GROUP LIMITED NOTES TO THE CONSOLIDATED FINANCIAL STATEMENTS 52
NOTES TO THE CONSOLIDATED FINANCIAL STATEMENTS
FOR THE FINANCIAL YEAR ENDED 30 JUNE 2016
1. REPORTING ENTITY
Suncorp Group Limited (the Company) is a public company domiciled in Australia. Its registered office is at Level 28, 266 George Street, Brisbane, Qld, 4000.
The consolidated financial statements for the financial year ended 30 June 2016 comprise the Company and its subsidiaries (the Suncorp Group or the Group) and were authorised for issue by the Board of Directors on 4 August 2016.
The Group’s principal activities during the course of the financial year were the provision of general insurance, banking, life insurance, superannuation products and related services to the retail, corporate and commercial sectors in Australia and New Zealand.
2. BASIS OF PREPARATION
The Suncorp Group is a for-profit entity and its consolidated financial statements have been prepared on the historical cost basis unless the application of fair value measurements are required by the relevant accounting standards.
These consolidated financial statements are presented in Australian dollars which is the Company’s functional and presentation currency and the functional currency of the majority of its subsidiaries.
As the Company is of a kind referred to in ASIC Corporations (Rounding in Financial/Directors’ Reports) Instrument 2016/191 dated 24 March 2016, all financial information presented has been rounded to the nearest one million dollars unless otherwise stated.
The consolidated statement of financial position is prepared in a liquidity format. Amounts expected to be recovered or settled no more than twelve months after the reporting period, are classified as ‘current’ otherwise they are classified as ‘non-current’.
Significant accounting policies applied in the preparation of these consolidated financial statements are set out in note 37.
Where necessary, comparatives have been restated to conform to changes in presentation in the current year.
2.1 STATEMENT OF COMPLIANCE
The consolidated financial statements are general purpose financial statements which have been prepared in accordance with Australian Accounting Standards (including Australian Interpretations) adopted by the Australian Accounting Standards Board (AASB) and the Corporations Act 2001. The consolidated financial statements comply with International Financial Reporting Standards and Interpretations issued by the International Accounting Standards Board.
2.2 USE OF ESTIMATES AND JUDGMENTS
The preparation of consolidated financial statements requires management to make judgments, estimates and assumptions that affect the application of accounting policies and the amounts reported in the financial statements. The estimates and associated assumptions are based on historical experience and various other factors that are believed to be reasonable under the circumstances. Estimates and underlying assumptions are reviewed on an ongoing basis. Where revisions are made to accounting estimates, any financial impact is recognised in the period in which the estimate is revised.
SUNCORP GROUP LIMITED NOTES TO THE CONSOLIDATED FINANCIAL STATEMENTS 53
Significant estimates, judgments and assumptions are discussed in the following notes:
• liability adequacy test relating to general insurance contracts (refer note 18.2)
• general insurance outstanding claims liabilities and assets arising from reinsurance contracts (refer note 19.3)
• specific and collective provisions for impairment (refer note 31.1(e) and 37.12)
• life insurance contract liabilities (refer note 20.2)
• impairment of goodwill and other intangible assets (refer note 16)
• valuation of financial instruments and fair value hierarchy disclosures (refer note 28).
3. EARNINGS PER SHARE (EPS) 2016 2015
$m $m
Profit attributable to ordinary equity holders of the Company (basic) 1,038 1,133
Interest expense on convertible preference shares 43 45
Profit attributable to ordinary equity holders of the Company (diluted) 1,081 1,178
No of shares No of shares
Weighted average number of ordinary shares (basic) 1,275,048,695 1,278,680,915
Effect of conversion of convertible preference shares 79,666,795 72,147,105
Weighted average number of ordinary shares (diluted) 1,354,715,490 1,350,828,020
4. DIVIDENDS 2016 2015
Cents per
share $m Cents per
share $m
Dividend payments on ordinary shares
2015 final dividend (2015: 2014 final dividend) 38 489 40 515
2015 special dividend (2015: 2014 special dividend) 12 154 30 386
2016 interim dividend (2015: 2015 interim dividend) 30 386 38 489
Dividends paid on treasury shares (4) (4)
Total dividends on ordinary shares paid to owners of the Company 80 1,025 108 1,386
Dividends not recognised in the consolidated statement of financial position1
Dividends determined since reporting date
2016 final dividend (2015: 2015 final dividend) 38 489 38 489
2016 special dividend (2015: 2015 special dividend) - - 12 154
38 489 50 643
Dividend franking account2
Amount of franking credit available for use in subsequent financial years excluding the effects of dividends determined since reporting date 355 428
1 The total 2016 final and special dividends determined but not recognised in the consolidated statement of financial position are estimated based on the total number of ordinary shares on issue without taking into account treasury shares as at 30 June 2016. The actual amount recognised in the consolidated financial statements for the year ending 30 June 2017 will be based on the actual number of ordinary shares on issue net of treasury shares on the record date.
2 The final and special dividends determined are expected to reduce the dividend franking accounting balance by $209 million (2015: $276 million).
For
per
sona
l use
onl
y

SUNCORP GROUP LIMITED NOTES TO THE CONSOLIDATED FINANCIAL STATEMENTS 54
5. SEGMENT REPORTING
Operating segments are identified based on separate financial information which is regularly reviewed by the CEO & Managing Director and his immediate executive team, representing the Suncorp Group’s Chief Operating Decision Maker (CODM), in assessing performance and determining the allocation of resources. The Suncorp Group’s operating segments are determined based on their business activities as described in note 5.1.
On 16 February 2016, the Suncorp Group announced the implementation of a revised operating model and organisational structure for its Australian and New Zealand operations. Up until 30 June 2016 the accounting and financial performance continued to be reported on the basis of the existing structure. Reporting under the new operating model will commence from 1 July 2016.
5.1 OPERATING SEGMENTS
The Suncorp Group comprises the following operating segments.
Segment Business area Business activities
Personal Insurance (Personal)
General Insurance Provision of personal insurance products to customers in Australia including home and contents insurance, motor insurance, boat insurance and travel insurance.
Commercial Insurance (Commercial)
General Insurance Provision of commercial insurance products to customers in Australia including commercial motor insurance, commercial property insurance, marine insurance, industrial special risks insurance, public liability and professional indemnity insurance, workers’ compensation insurance, compulsory third party insurance, loan protection insurance and equity and cash benefit insurance.
General Insurance – New Zealand (GI NZ)
General Insurance Provision of general insurance products to customers in New Zealand including home and contents insurance, motor insurance, marine insurance, business insurance, rural insurance, construction and engineering insurance, travel insurance, public liability and professional indemnity, and directors’ and officers’ liability insurance.
Bank Bank Provision of personal and commercial banking, agribusiness, property and equipment finance, home, personal and small business loans, savings and transaction accounts and foreign exchange and treasury products and services in Australia.
Life Life Provision of life insurance products, superannuation administration services, financial planning and funds administration services in Australia and New Zealand.
Corporate Corporate Investment of the Suncorp Group’s capital, Suncorp Group business strategy activities (including business combinations and divestments) and Suncorp Group shared services.
While profit or loss information is reviewed by the CODM at an operating segment level, assets and liabilities information are reviewed by the CODM at a business area level. Business areas are equivalent to operating segments except for the Personal Insurance, Commercial Insurance and General Insurance New Zealand operating segments which are aggregated as the General Insurance business area.
Segment results presented below are measured on a consistent basis to how they are reported to the CODM:
• Revenues and expenses occurring between segments are subject to contractual agreements between the legal entities comprising each segment.
• Inter-segment transactions, which are eliminated on consolidation, are reported on a gross basis. An exception exists for operating expenses incurred by one segment on behalf of another, which are recharged on a cost-recovery basis, and are presented on a net basis (post allocation basis).
• Intra-group dividends are presented net of eliminations.
For
per
sona
l use
onl
y
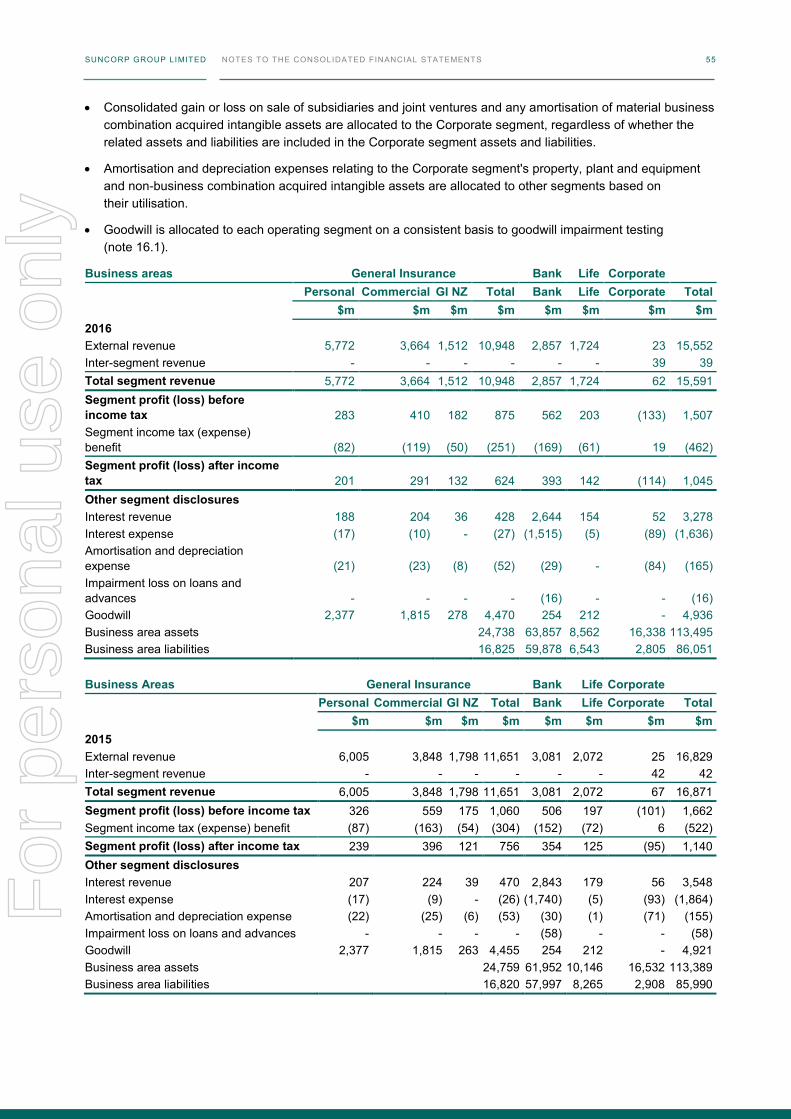
SUNCORP GROUP LIMITED NOTES TO THE CONSOLIDATED FINANCIAL STATEMENTS 54
5. SEGMENT REPORTING
Operating segments are identified based on separate financial information which is regularly reviewed by the CEO & Managing Director and his immediate executive team, representing the Suncorp Group’s Chief Operating Decision Maker (CODM), in assessing performance and determining the allocation of resources. The Suncorp Group’s operating segments are determined based on their business activities as described in note 5.1.
On 16 February 2016, the Suncorp Group announced the implementation of a revised operating model and organisational structure for its Australian and New Zealand operations. Up until 30 June 2016 the accounting and financial performance continued to be reported on the basis of the existing structure. Reporting under the new operating model will commence from 1 July 2016.
5.1 OPERATING SEGMENTS
The Suncorp Group comprises the following operating segments.
Segment Business area Business activities
Personal Insurance (Personal)
General Insurance Provision of personal insurance products to customers in Australia including home and contents insurance, motor insurance, boat insurance and travel insurance.
Commercial Insurance (Commercial)
General Insurance Provision of commercial insurance products to customers in Australia including commercial motor insurance, commercial property insurance, marine insurance, industrial special risks insurance, public liability and professional indemnity insurance, workers’ compensation insurance, compulsory third party insurance, loan protection insurance and equity and cash benefit insurance.
General Insurance – New Zealand (GI NZ)
General Insurance Provision of general insurance products to customers in New Zealand including home and contents insurance, motor insurance, marine insurance, business insurance, rural insurance, construction and engineering insurance, travel insurance, public liability and professional indemnity, and directors’ and officers’ liability insurance.
Bank Bank Provision of personal and commercial banking, agribusiness, property and equipment finance, home, personal and small business loans, savings and transaction accounts and foreign exchange and treasury products and services in Australia.
Life Life Provision of life insurance products, superannuation administration services, financial planning and funds administration services in Australia and New Zealand.
Corporate Corporate Investment of the Suncorp Group’s capital, Suncorp Group business strategy activities (including business combinations and divestments) and Suncorp Group shared services.
While profit or loss information is reviewed by the CODM at an operating segment level, assets and liabilities information are reviewed by the CODM at a business area level. Business areas are equivalent to operating segments except for the Personal Insurance, Commercial Insurance and General Insurance New Zealand operating segments which are aggregated as the General Insurance business area.
Segment results presented below are measured on a consistent basis to how they are reported to the CODM:
• Revenues and expenses occurring between segments are subject to contractual agreements between the legal entities comprising each segment.
• Inter-segment transactions, which are eliminated on consolidation, are reported on a gross basis. An exception exists for operating expenses incurred by one segment on behalf of another, which are recharged on a cost-recovery basis, and are presented on a net basis (post allocation basis).
• Intra-group dividends are presented net of eliminations.
SUNCORP GROUP LIMITED NOTES TO THE CONSOLIDATED FINANCIAL STATEMENTS 55
• Consolidated gain or loss on sale of subsidiaries and joint ventures and any amortisation of material business combination acquired intangible assets are allocated to the Corporate segment, regardless of whether the related assets and liabilities are included in the Corporate segment assets and liabilities.
• Amortisation and depreciation expenses relating to the Corporate segment's property, plant and equipment and non-business combination acquired intangible assets are allocated to other segments based on their utilisation.
• Goodwill is allocated to each operating segment on a consistent basis to goodwill impairment testing (note 16.1).
Business areas General Insurance Bank Life Corporate Personal Commercial GI NZ Total Bank Life Corporate Total $m $m $m $m $m $m $m $m
2016 External revenue 5,772 3,664 1,512 10,948 2,857 1,724 23 15,552 Inter-segment revenue - - - - - - 39 39 Total segment revenue 5,772 3,664 1,512 10,948 2,857 1,724 62 15,591 Segment profit (loss) before income tax 283 410 182 875 562 203 (133) 1,507 Segment income tax (expense) benefit (82) (119) (50) (251) (169) (61) 19 (462) Segment profit (loss) after income tax 201 291 132 624 393 142 (114) 1,045 Other segment disclosures Interest revenue 188 204 36 428 2,644 154 52 3,278 Interest expense (17) (10) - (27) (1,515) (5) (89) (1,636) Amortisation and depreciation expense (21) (23) (8) (52) (29) - (84) (165) Impairment loss on loans and advances - - - - (16) - - (16) Goodwill 2,377 1,815 278 4,470 254 212 - 4,936 Business area assets 24,738 63,857 8,562 16,338 113,495 Business area liabilities 16,825 59,878 6,543 2,805 86,051 Business Areas General Insurance Bank Life Corporate Personal Commercial GI NZ Total Bank Life Corporate Total
$m $m $m $m $m $m $m $m 2015 External revenue 6,005 3,848 1,798 11,651 3,081 2,072 25 16,829 Inter-segment revenue - - - - - - 42 42 Total segment revenue 6,005 3,848 1,798 11,651 3,081 2,072 67 16,871 Segment profit (loss) before income tax 326 559 175 1,060 506 197 (101) 1,662 Segment income tax (expense) benefit (87) (163) (54) (304) (152) (72) 6 (522) Segment profit (loss) after income tax 239 396 121 756 354 125 (95) 1,140 Other segment disclosures Interest revenue 207 224 39 470 2,843 179 56 3,548 Interest expense (17) (9) - (26) (1,740) (5) (93) (1,864) Amortisation and depreciation expense (22) (25) (6) (53) (30) (1) (71) (155) Impairment loss on loans and advances - - - - (58) - - (58) Goodwill 2,377 1,815 263 4,455 254 212 - 4,921 Business area assets 24,759 61,952 10,146 16,532 113,389 Business area liabilities 16,820 57,997 8,265 2,908 85,990
For
per
sona
l use
onl
y
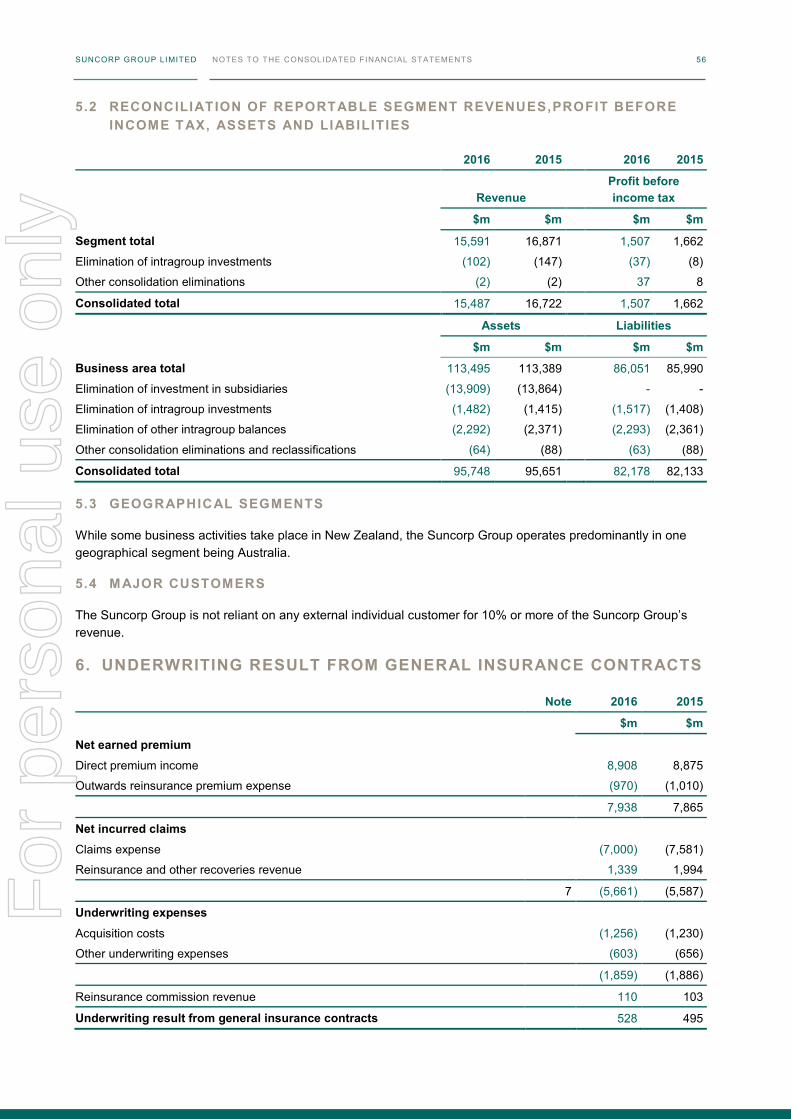
SUNCORP GROUP LIMITED NOTES TO THE CONSOLIDATED FINANCIAL STATEMENTS 56
5.2 RECONCILIATION OF REPORTABLE SEGMENT REVENUES,PROFIT BEFORE INCOME TAX, ASSETS AND LIABILITIES
2016 2015 2016 2015
Revenue Profit before income tax
$m $m $m $m
Segment total 15,591 16,871 1,507 1,662
Elimination of intragroup investments (102) (147) (37) (8)
Other consolidation eliminations (2) (2) 37 8
Consolidated total 15,487 16,722 1,507 1,662
Assets Liabilities
$m $m $m $m
Business area total 113,495 113,389 86,051 85,990
Elimination of investment in subsidiaries (13,909) (13,864) - -
Elimination of intragroup investments (1,482) (1,415) (1,517) (1,408)
Elimination of other intragroup balances (2,292) (2,371) (2,293) (2,361)
Other consolidation eliminations and reclassifications (64) (88) (63) (88)
Consolidated total 95,748 95,651 82,178 82,133
5.3 GEOGRAPHICAL SEGMENTS
While some business activities take place in New Zealand, the Suncorp Group operates predominantly in one geographical segment being Australia.
5.4 MAJOR CUSTOMERS
The Suncorp Group is not reliant on any external individual customer for 10% or more of the Suncorp Group’s revenue.
6. UNDERWRITING RESULT FROM GENERAL INSURANCE CONTRACTS
Note 2016 2015
$m $m
Net earned premium
Direct premium income 8,908 8,875
Outwards reinsurance premium expense (970) (1,010)
7,938 7,865
Net incurred claims
Claims expense (7,000) (7,581)
Reinsurance and other recoveries revenue 1,339 1,994
7 (5,661) (5,587)
Underwriting expenses
Acquisition costs (1,256) (1,230)
Other underwriting expenses (603) (656)
(1,859) (1,886)
Reinsurance commission revenue 110 103
Underwriting result from general insurance contracts 528 495
SUNCORP GROUP LIMITED NOTES TO THE CONSOLIDATED FINANCIAL STATEMENTS 57
7. NET INCURRED CLAIMS FROM GENERAL INSURANCE CONTRACTS
2016 2015
Current
year Prior year Total
Current year
Prior year Total
$m $m $m $m $m $m Gross claims incurred and related expenses Undiscounted 7,575 (763) 6,812 8,036 (662) 7,374 Discount and discount movement (132) 320 188 (175) 382 207 Gross claims incurred discounted 7,443 (443) 7,000 7,861 (280) 7,581 Reinsurance and other recoveries Undiscounted (1,366) 80 (1,286) (1,789) (142) (1,931) Discount and discount movement 31 (84) (53) 33 (96) (63) Reinsurance and other recoveries (1,335) (4) (1,339) (1,756) (238) (1,994) Net incurred claims 6,108 (447) 5,661 6,105 (518) 5,587
The $447 million decrease in prior year net provisions is primarily due to valuation releases arising from favourable claims experience. The sensitivity of net profit to changes in claims assumptions, experience and risk margins is set out in note 19.5.
8. SOURCES OF OPERATING PROFIT FROM LIFE INSURANCE AND OTHER CONTRACTS
2016 2015
Life insurance contracts
Other contracts
Total statutory
funds
Life insurance contracts
Other contracts
Total statutory
funds $m $m $m $m $m $m
Shareholders’ operating profit after tax in the statutory funds Represented by: Investment earnings on shareholders' retained profits and capital 56 2 58 56 1 57 Emergence of shareholders’ planned profits 58 2 60 66 - 66 Experience profit (loss) 25 - 25 11 - 11 Losses capitalised (2) - (2) (6) - (6) Management services profit - 11 11 - 11 11 137 15 152 127 12 139 Policyowners' operating profit after tax in the statutory funds Represented by: Investment earnings on retained profits 11 - 11 16 - 16 Emergence of policyowner planned profits 54 - 54 62 - 62 Experience (loss) profit (12) - (12) (5) - (5) Revaluation of capitalised loss (6) - (6) - - - 47 - 47 73 - 73
Total cumulative capitalised losses carried forward at 30 June 2016 was $168 million (30 June 2015: $179 million).
For
per
sona
l use
onl
y
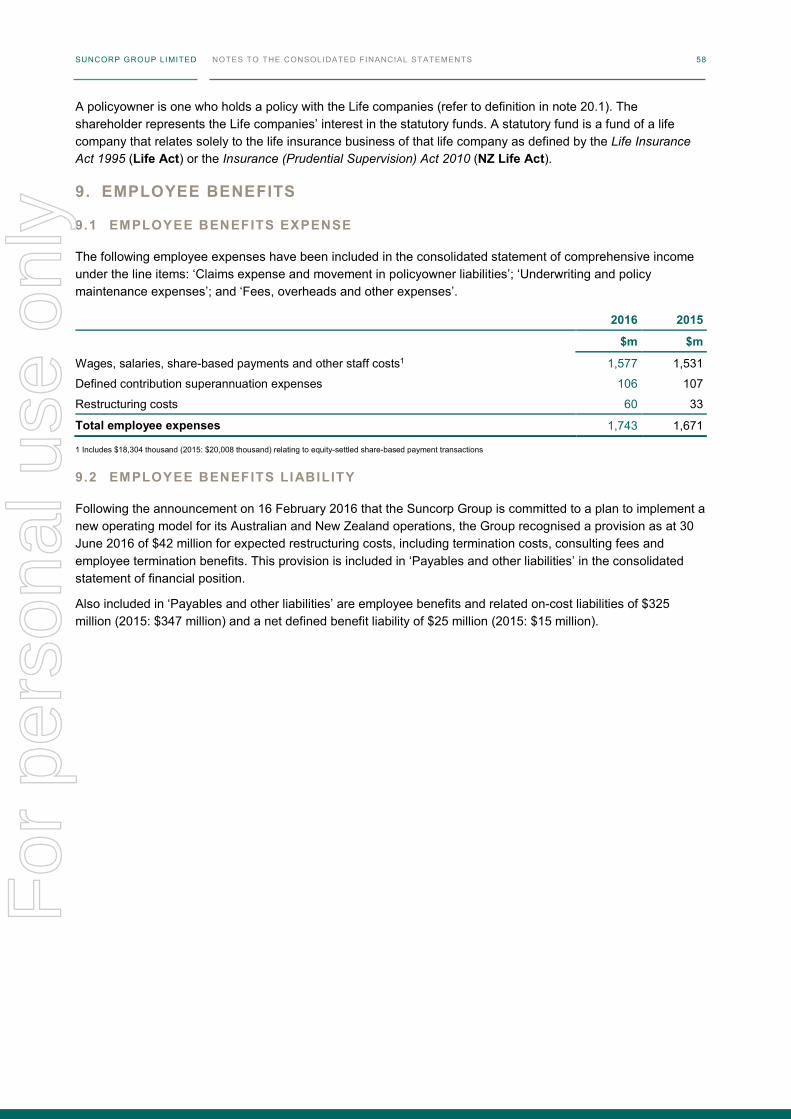
SUNCORP GROUP LIMITED NOTES TO THE CONSOLIDATED FINANCIAL STATEMENTS 58
A policyowner is one who holds a policy with the Life companies (refer to definition in note 20.1). The shareholder represents the Life companies’ interest in the statutory funds. A statutory fund is a fund of a life company that relates solely to the life insurance business of that life company as defined by the Life Insurance Act 1995 (Life Act) or the Insurance (Prudential Supervision) Act 2010 (NZ Life Act).
9. EMPLOYEE BENEFITS
9.1 EMPLOYEE BENEFITS EXPENSE
The following employee expenses have been included in the consolidated statement of comprehensive income under the line items: ‘Claims expense and movement in policyowner liabilities’; ‘Underwriting and policy maintenance expenses’; and ‘Fees, overheads and other expenses’.
2016 2015
$m $m
Wages, salaries, share-based payments and other staff costs1 1,577 1,531
Defined contribution superannuation expenses 106 107
Restructuring costs 60 33
Total employee expenses 1,743 1,671
1 Includes $18,304 thousand (2015: $20,008 thousand) relating to equity-settled share-based payment transactions
9.2 EMPLOYEE BENEFITS LIABILITY
Following the announcement on 16 February 2016 that the Suncorp Group is committed to a plan to implement a new operating model for its Australian and New Zealand operations, the Group recognised a provision as at 30 June 2016 of $42 million for expected restructuring costs, including termination costs, consulting fees and employee termination benefits. This provision is included in ‘Payables and other liabilities’ in the consolidated statement of financial position.
Also included in ‘Payables and other liabilities’ are employee benefits and related on-cost liabilities of $325 million (2015: $347 million) and a net defined benefit liability of $25 million (2015: $15 million).
For
per
sona
l use
onl
y
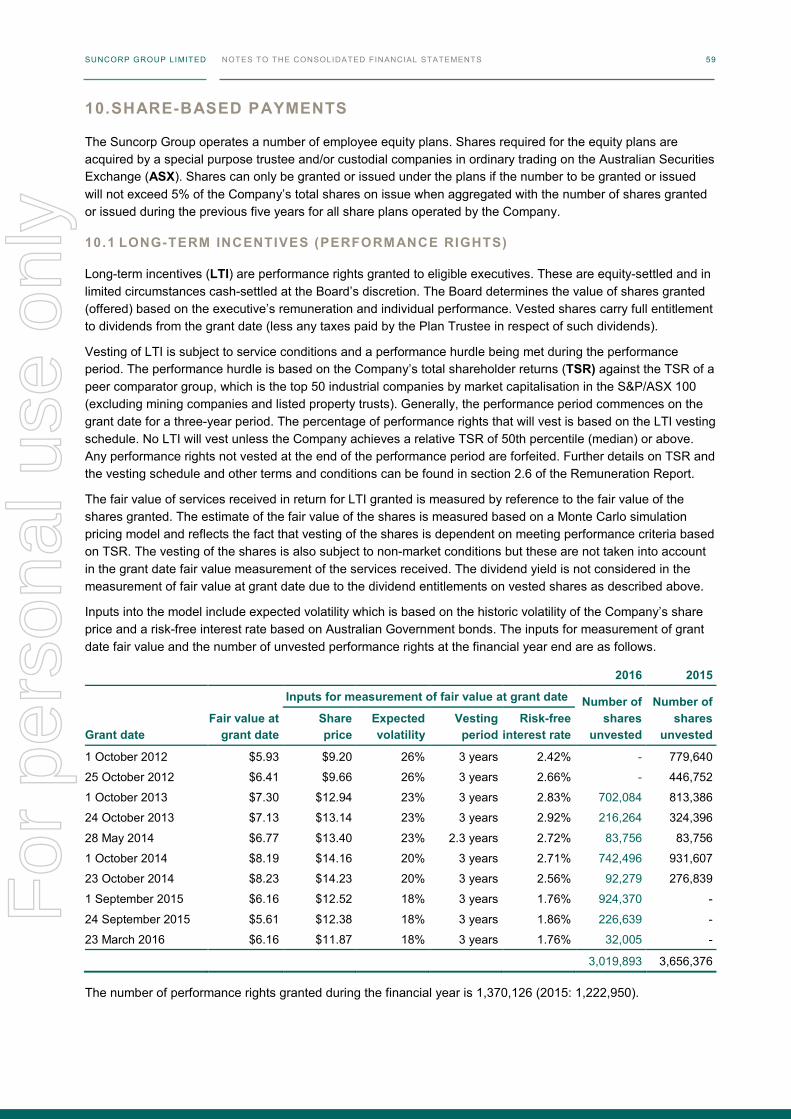
SUNCORP GROUP LIMITED NOTES TO THE CONSOLIDATED FINANCIAL STATEMENTS 58
A policyowner is one who holds a policy with the Life companies (refer to definition in note 20.1). The shareholder represents the Life companies’ interest in the statutory funds. A statutory fund is a fund of a life company that relates solely to the life insurance business of that life company as defined by the Life Insurance Act 1995 (Life Act) or the Insurance (Prudential Supervision) Act 2010 (NZ Life Act).
9. EMPLOYEE BENEFITS
9.1 EMPLOYEE BENEFITS EXPENSE
The following employee expenses have been included in the consolidated statement of comprehensive income under the line items: ‘Claims expense and movement in policyowner liabilities’; ‘Underwriting and policy maintenance expenses’; and ‘Fees, overheads and other expenses’.
2016 2015
$m $m
Wages, salaries, share-based payments and other staff costs1 1,577 1,531
Defined contribution superannuation expenses 106 107
Restructuring costs 60 33
Total employee expenses 1,743 1,671
1 Includes $18,304 thousand (2015: $20,008 thousand) relating to equity-settled share-based payment transactions
9.2 EMPLOYEE BENEFITS LIABILITY
Following the announcement on 16 February 2016 that the Suncorp Group is committed to a plan to implement a new operating model for its Australian and New Zealand operations, the Group recognised a provision as at 30 June 2016 of $42 million for expected restructuring costs, including termination costs, consulting fees and employee termination benefits. This provision is included in ‘Payables and other liabilities’ in the consolidated statement of financial position.
Also included in ‘Payables and other liabilities’ are employee benefits and related on-cost liabilities of $325 million (2015: $347 million) and a net defined benefit liability of $25 million (2015: $15 million).
SUNCORP GROUP LIMITED NOTES TO THE CONSOLIDATED FINANCIAL STATEMENTS 59
10. SHARE-BASED PAYMENTS
The Suncorp Group operates a number of employee equity plans. Shares required for the equity plans are acquired by a special purpose trustee and/or custodial companies in ordinary trading on the Australian Securities Exchange (ASX). Shares can only be granted or issued under the plans if the number to be granted or issued will not exceed 5% of the Company’s total shares on issue when aggregated with the number of shares granted or issued during the previous five years for all share plans operated by the Company.
10.1 LONG-TERM INCENTIVES (PERFORMANCE RIGHTS)
Long-term incentives (LTI) are performance rights granted to eligible executives. These are equity-settled and in limited circumstances cash-settled at the Board’s discretion. The Board determines the value of shares granted (offered) based on the executive’s remuneration and individual performance. Vested shares carry full entitlement to dividends from the grant date (less any taxes paid by the Plan Trustee in respect of such dividends).
Vesting of LTI is subject to service conditions and a performance hurdle being met during the performance period. The performance hurdle is based on the Company’s total shareholder returns (TSR) against the TSR of a peer comparator group, which is the top 50 industrial companies by market capitalisation in the S&P/ASX 100 (excluding mining companies and listed property trusts). Generally, the performance period commences on the grant date for a three-year period. The percentage of performance rights that will vest is based on the LTI vesting schedule. No LTI will vest unless the Company achieves a relative TSR of 50th percentile (median) or above. Any performance rights not vested at the end of the performance period are forfeited. Further details on TSR and the vesting schedule and other terms and conditions can be found in section 2.6 of the Remuneration Report.
The fair value of services received in return for LTI granted is measured by reference to the fair value of the shares granted. The estimate of the fair value of the shares is measured based on a Monte Carlo simulation pricing model and reflects the fact that vesting of the shares is dependent on meeting performance criteria based on TSR. The vesting of the shares is also subject to non-market conditions but these are not taken into account in the grant date fair value measurement of the services received. The dividend yield is not considered in the measurement of fair value at grant date due to the dividend entitlements on vested shares as described above.
Inputs into the model include expected volatility which is based on the historic volatility of the Company’s share price and a risk-free interest rate based on Australian Government bonds. The inputs for measurement of grant date fair value and the number of unvested performance rights at the financial year end are as follows.
2016 2015
Inputs for measurement of fair value at grant date Number of shares
unvested
Number of shares
unvested Grant date Fair value at
grant date Share price
Expected volatility
Vesting period
Risk-free interest rate
1 October 2012 $5.93 $9.20 26% 3 years 2.42% - 779,640
25 October 2012 $6.41 $9.66 26% 3 years 2.66% - 446,752
1 October 2013 $7.30 $12.94 23% 3 years 2.83% 702,084 813,386
24 October 2013 $7.13 $13.14 23% 3 years 2.92% 216,264 324,396
28 May 2014 $6.77 $13.40 23% 2.3 years 2.72% 83,756 83,756
1 October 2014 $8.19 $14.16 20% 3 years 2.71% 742,496 931,607
23 October 2014 $8.23 $14.23 20% 3 years 2.56% 92,279 276,839
1 September 2015 $6.16 $12.52 18% 3 years 1.76% 924,370 -
24 September 2015 $5.61 $12.38 18% 3 years 1.86% 226,639 -
23 March 2016 $6.16 $11.87 18% 3 years 1.76% 32,005 -
3,019,893 3,656,376
The number of performance rights granted during the financial year is 1,370,126 (2015: 1,222,950).
For
per
sona
l use
onl
y
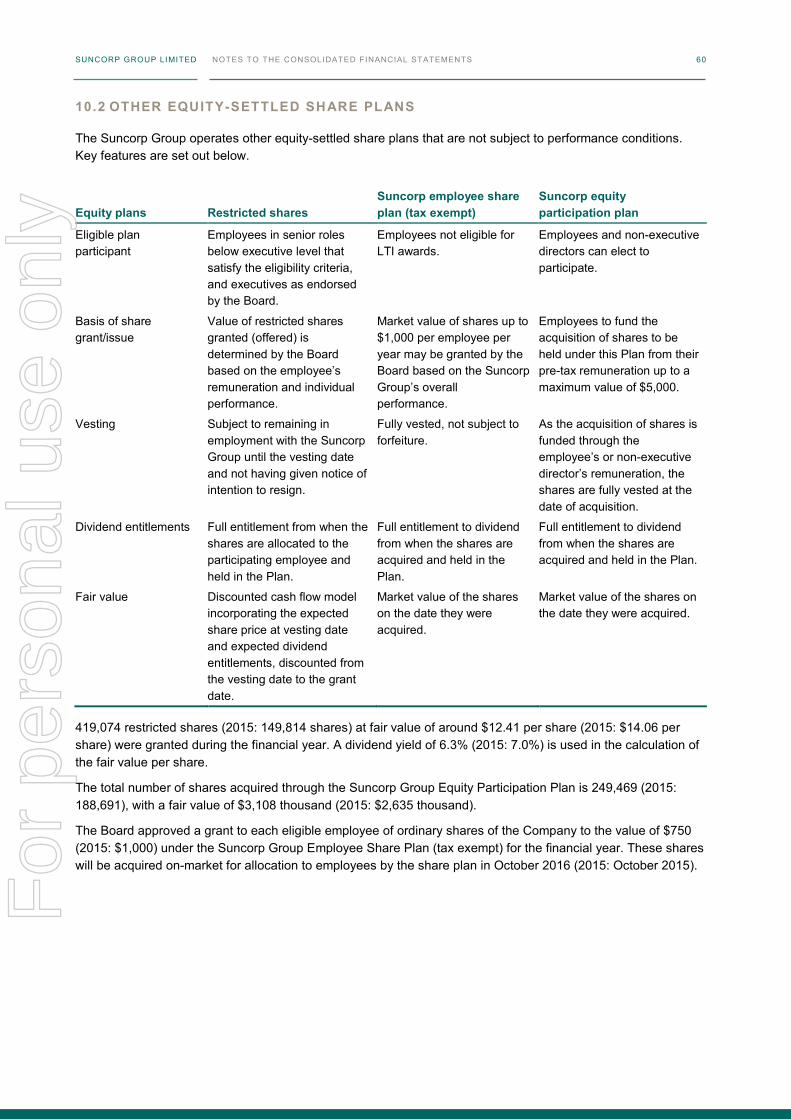
SUNCORP GROUP LIMITED NOTES TO THE CONSOLIDATED FINANCIAL STATEMENTS 60
10.2 OTHER EQUITY-SETTLED SHARE PLANS
The Suncorp Group operates other equity-settled share plans that are not subject to performance conditions. Key features are set out below.
Equity plans Restricted shares Suncorp employee share plan (tax exempt)
Suncorp equity participation plan
Eligible plan participant
Employees in senior roles below executive level that satisfy the eligibility criteria, and executives as endorsed by the Board.
Employees not eligible for LTI awards.
Employees and non-executive directors can elect to participate.
Basis of share grant/issue
Value of restricted shares granted (offered) is determined by the Board based on the employee’s remuneration and individual performance.
Market value of shares up to $1,000 per employee per year may be granted by the Board based on the Suncorp Group’s overall performance.
Employees to fund the acquisition of shares to be held under this Plan from their pre-tax remuneration up to a maximum value of $5,000.
Vesting Subject to remaining in employment with the Suncorp Group until the vesting date and not having given notice of intention to resign.
Fully vested, not subject to forfeiture.
As the acquisition of shares is funded through the employee’s or non-executive director’s remuneration, the shares are fully vested at the date of acquisition.
Dividend entitlements Full entitlement from when the shares are allocated to the participating employee and held in the Plan.
Full entitlement to dividend from when the shares are acquired and held in the Plan.
Full entitlement to dividend from when the shares are acquired and held in the Plan.
Fair value Discounted cash flow model incorporating the expected share price at vesting date and expected dividend entitlements, discounted from the vesting date to the grant date.
Market value of the shares on the date they were acquired.
Market value of the shares on the date they were acquired.
419,074 restricted shares (2015: 149,814 shares) at fair value of around $12.41 per share (2015: $14.06 per share) were granted during the financial year. A dividend yield of 6.3% (2015: 7.0%) is used in the calculation of the fair value per share.
The total number of shares acquired through the Suncorp Group Equity Participation Plan is 249,469 (2015: 188,691), with a fair value of $3,108 thousand (2015: $2,635 thousand).
The Board approved a grant to each eligible employee of ordinary shares of the Company to the value of $750 (2015: $1,000) under the Suncorp Group Employee Share Plan (tax exempt) for the financial year. These shares will be acquired on-market for allocation to employees by the share plan in October 2016 (2015: October 2015).
For
per
sona
l use
onl
y
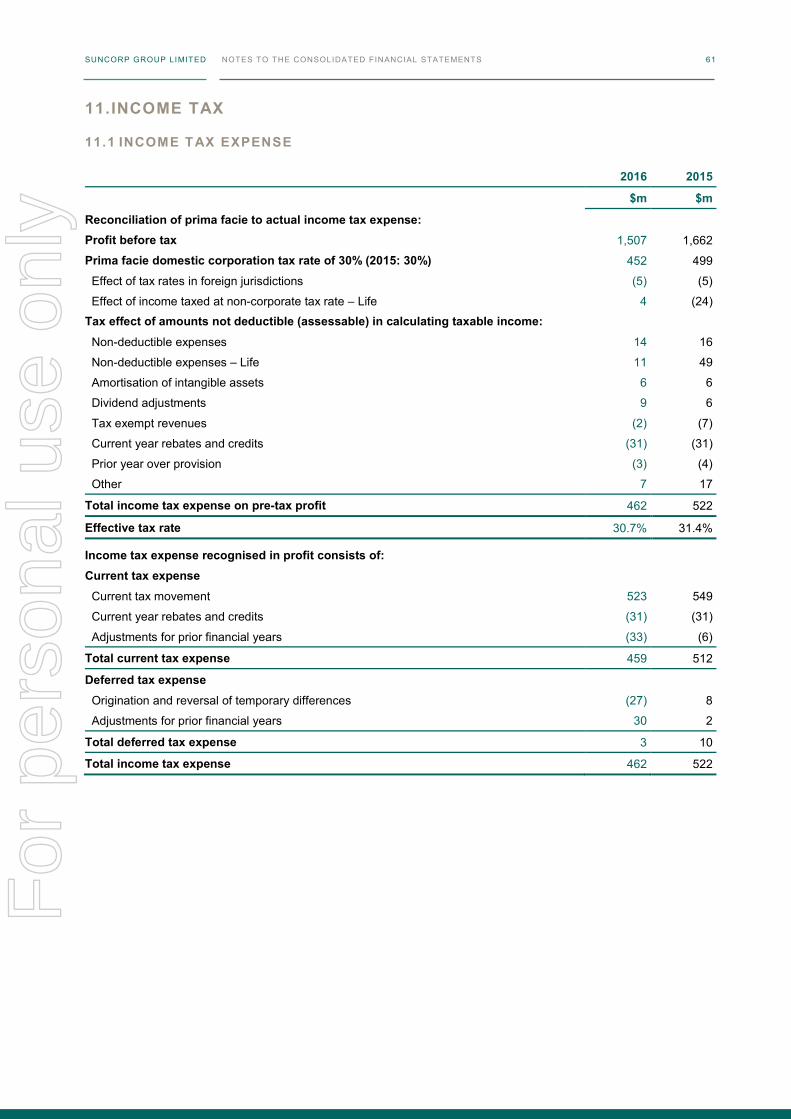
SUNCORP GROUP LIMITED NOTES TO THE CONSOLIDATED FINANCIAL STATEMENTS 60
10.2 OTHER EQUITY-SETTLED SHARE PLANS
The Suncorp Group operates other equity-settled share plans that are not subject to performance conditions. Key features are set out below.
Equity plans Restricted shares Suncorp employee share plan (tax exempt)
Suncorp equity participation plan
Eligible plan participant
Employees in senior roles below executive level that satisfy the eligibility criteria, and executives as endorsed by the Board.
Employees not eligible for LTI awards.
Employees and non-executive directors can elect to participate.
Basis of share grant/issue
Value of restricted shares granted (offered) is determined by the Board based on the employee’s remuneration and individual performance.
Market value of shares up to $1,000 per employee per year may be granted by the Board based on the Suncorp Group’s overall performance.
Employees to fund the acquisition of shares to be held under this Plan from their pre-tax remuneration up to a maximum value of $5,000.
Vesting Subject to remaining in employment with the Suncorp Group until the vesting date and not having given notice of intention to resign.
Fully vested, not subject to forfeiture.
As the acquisition of shares is funded through the employee’s or non-executive director’s remuneration, the shares are fully vested at the date of acquisition.
Dividend entitlements Full entitlement from when the shares are allocated to the participating employee and held in the Plan.
Full entitlement to dividend from when the shares are acquired and held in the Plan.
Full entitlement to dividend from when the shares are acquired and held in the Plan.
Fair value Discounted cash flow model incorporating the expected share price at vesting date and expected dividend entitlements, discounted from the vesting date to the grant date.
Market value of the shares on the date they were acquired.
Market value of the shares on the date they were acquired.
419,074 restricted shares (2015: 149,814 shares) at fair value of around $12.41 per share (2015: $14.06 per share) were granted during the financial year. A dividend yield of 6.3% (2015: 7.0%) is used in the calculation of the fair value per share.
The total number of shares acquired through the Suncorp Group Equity Participation Plan is 249,469 (2015: 188,691), with a fair value of $3,108 thousand (2015: $2,635 thousand).
The Board approved a grant to each eligible employee of ordinary shares of the Company to the value of $750 (2015: $1,000) under the Suncorp Group Employee Share Plan (tax exempt) for the financial year. These shares will be acquired on-market for allocation to employees by the share plan in October 2016 (2015: October 2015).
SUNCORP GROUP LIMITED NOTES TO THE CONSOLIDATED FINANCIAL STATEMENTS 61
11. INCOME TAX
11.1 INCOME TAX EXPENSE
2016 2015
$m $m
Reconciliation of prima facie to actual income tax expense:
Profit before tax 1,507 1,662
Prima facie domestic corporation tax rate of 30% (2015: 30%) 452 499
Effect of tax rates in foreign jurisdictions (5) (5)
Effect of income taxed at non-corporate tax rate – Life 4 (24)
Tax effect of amounts not deductible (assessable) in calculating taxable income:
Non-deductible expenses 14 16
Non-deductible expenses – Life 11 49
Amortisation of intangible assets 6 6
Dividend adjustments 9 6
Tax exempt revenues (2) (7)
Current year rebates and credits (31) (31)
Prior year over provision (3) (4)
Other 7 17
Total income tax expense on pre-tax profit 462 522
Effective tax rate 30.7% 31.4%
Income tax expense recognised in profit consists of:
Current tax expense
Current tax movement 523 549
Current year rebates and credits (31) (31)
Adjustments for prior financial years (33) (6)
Total current tax expense 459 512
Deferred tax expense
Origination and reversal of temporary differences (27) 8
Adjustments for prior financial years 30 2
Total deferred tax expense 3 10
Total income tax expense 462 522
For
per
sona
l use
onl
y
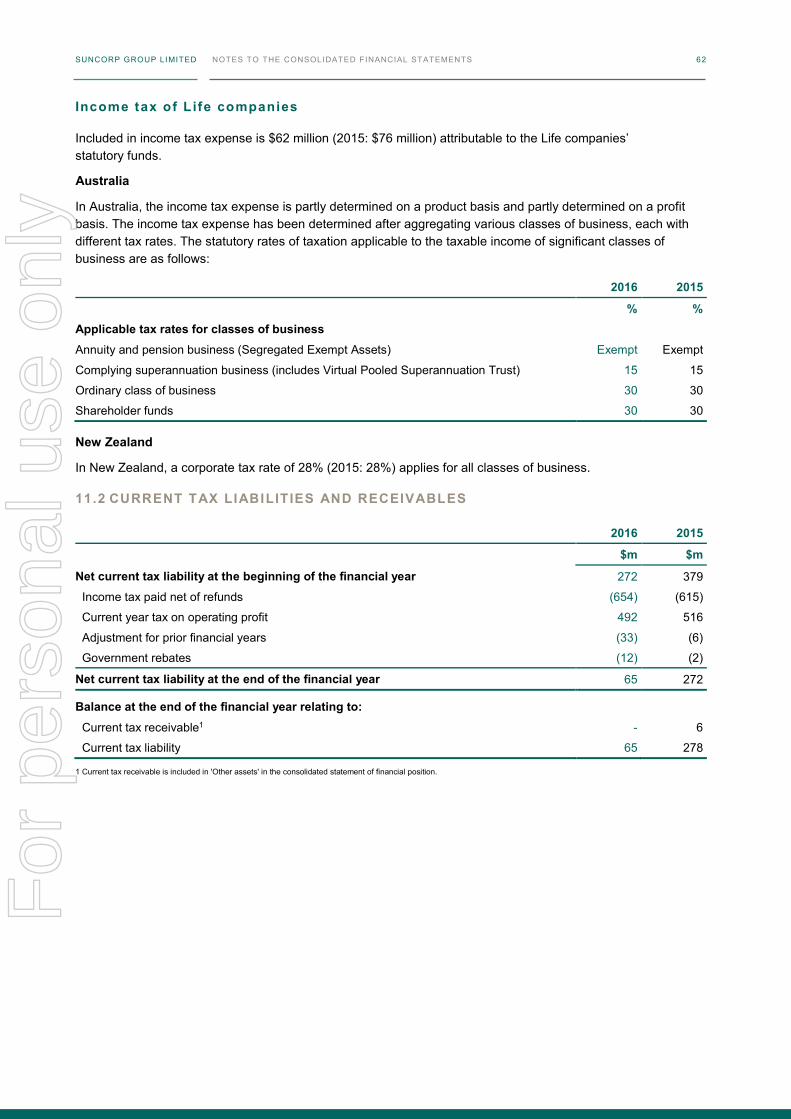
SUNCORP GROUP LIMITED NOTES TO THE CONSOLIDATED FINANCIAL STATEMENTS 62
Income tax of Life companies
Included in income tax expense is $62 million (2015: $76 million) attributable to the Life companies’ statutory funds.
Australia
In Australia, the income tax expense is partly determined on a product basis and partly determined on a profit basis. The income tax expense has been determined after aggregating various classes of business, each with different tax rates. The statutory rates of taxation applicable to the taxable income of significant classes of business are as follows:
2016 2015
% % Applicable tax rates for classes of business
Annuity and pension business (Segregated Exempt Assets) Exempt Exempt
Complying superannuation business (includes Virtual Pooled Superannuation Trust) 15 15
Ordinary class of business 30 30
Shareholder funds 30 30
New Zealand
In New Zealand, a corporate tax rate of 28% (2015: 28%) applies for all classes of business.
11.2 CURRENT TAX LIABILITIES AND RECEIVABLES
2016 2015
$m $m
Net current tax liability at the beginning of the financial year 272 379
Income tax paid net of refunds (654) (615)
Current year tax on operating profit 492 516
Adjustment for prior financial years (33) (6)
Government rebates (12) (2)
Net current tax liability at the end of the financial year 65 272
Balance at the end of the financial year relating to:
Current tax receivable1 - 6
Current tax liability 65 278
1 Current tax receivable is included in 'Other assets' in the consolidated statement of financial position.
For
per
sona
l use
onl
y
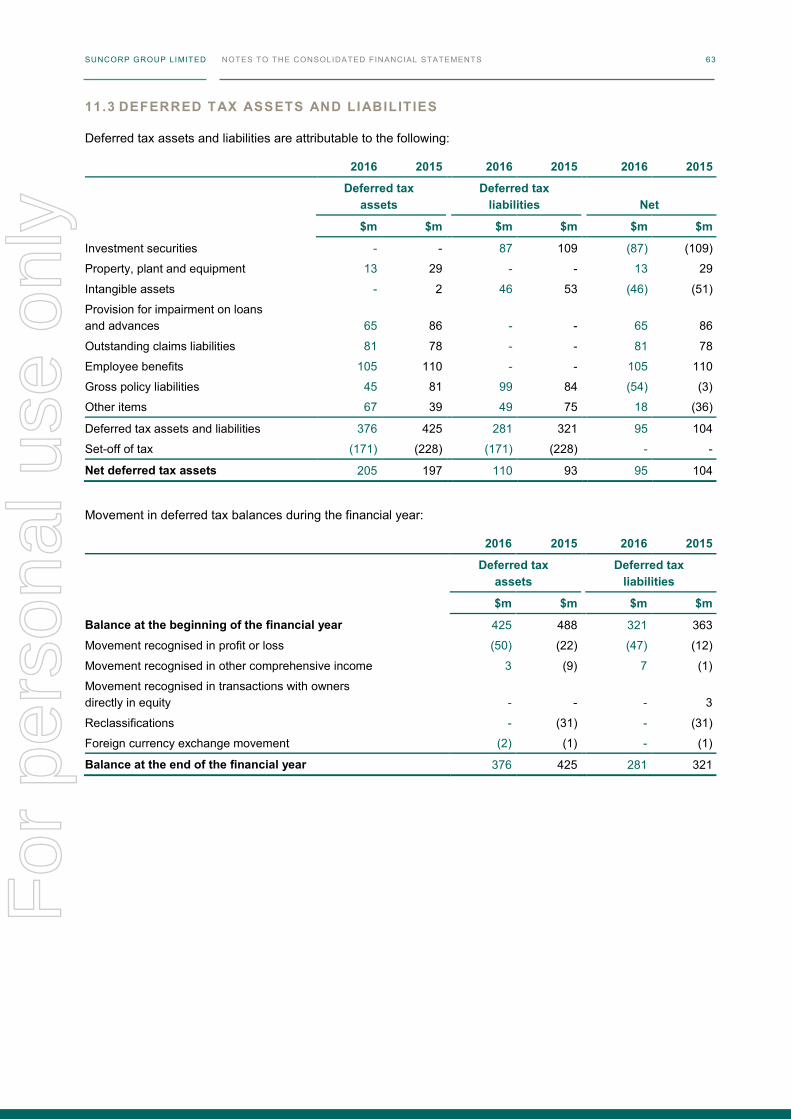
SUNCORP GROUP LIMITED NOTES TO THE CONSOLIDATED FINANCIAL STATEMENTS 62
Income tax of Life companies
Included in income tax expense is $62 million (2015: $76 million) attributable to the Life companies’ statutory funds.
Australia
In Australia, the income tax expense is partly determined on a product basis and partly determined on a profit basis. The income tax expense has been determined after aggregating various classes of business, each with different tax rates. The statutory rates of taxation applicable to the taxable income of significant classes of business are as follows:
2016 2015
% % Applicable tax rates for classes of business
Annuity and pension business (Segregated Exempt Assets) Exempt Exempt
Complying superannuation business (includes Virtual Pooled Superannuation Trust) 15 15
Ordinary class of business 30 30
Shareholder funds 30 30
New Zealand
In New Zealand, a corporate tax rate of 28% (2015: 28%) applies for all classes of business.
11.2 CURRENT TAX LIABILITIES AND RECEIVABLES
2016 2015
$m $m
Net current tax liability at the beginning of the financial year 272 379
Income tax paid net of refunds (654) (615)
Current year tax on operating profit 492 516
Adjustment for prior financial years (33) (6)
Government rebates (12) (2)
Net current tax liability at the end of the financial year 65 272
Balance at the end of the financial year relating to:
Current tax receivable1 - 6
Current tax liability 65 278
1 Current tax receivable is included in 'Other assets' in the consolidated statement of financial position.
SUNCORP GROUP LIMITED NOTES TO THE CONSOLIDATED FINANCIAL STATEMENTS 63
11.3 DEFERRED TAX ASSETS AND LIABILITIES
Deferred tax assets and liabilities are attributable to the following:
2016 2015 2016 2015 2016 2015
Deferred tax
assets Deferred tax
liabilities Net
$m $m $m $m $m $m
Investment securities - - 87 109 (87) (109)
Property, plant and equipment 13 29 - - 13 29
Intangible assets - 2 46 53 (46) (51)
Provision for impairment on loans and advances 65 86 - - 65 86
Outstanding claims liabilities 81 78 - - 81 78
Employee benefits 105 110 - - 105 110
Gross policy liabilities 45 81 99 84 (54) (3)
Other items 67 39 49 75 18 (36)
Deferred tax assets and liabilities 376 425 281 321 95 104
Set-off of tax (171) (228) (171) (228) - -
Net deferred tax assets 205 197 110 93 95 104
Movement in deferred tax balances during the financial year:
2016 2015 2016 2015
Deferred tax
assets Deferred tax
liabilities
$m $m $m $m
Balance at the beginning of the financial year 425 488 321 363
Movement recognised in profit or loss (50) (22) (47) (12)
Movement recognised in other comprehensive income 3 (9) 7 (1)
Movement recognised in transactions with owners directly in equity - - - 3
Reclassifications - (31) - (31)
Foreign currency exchange movement (2) (1) - (1)
Balance at the end of the financial year 376 425 281 321
For
per
sona
l use
onl
y
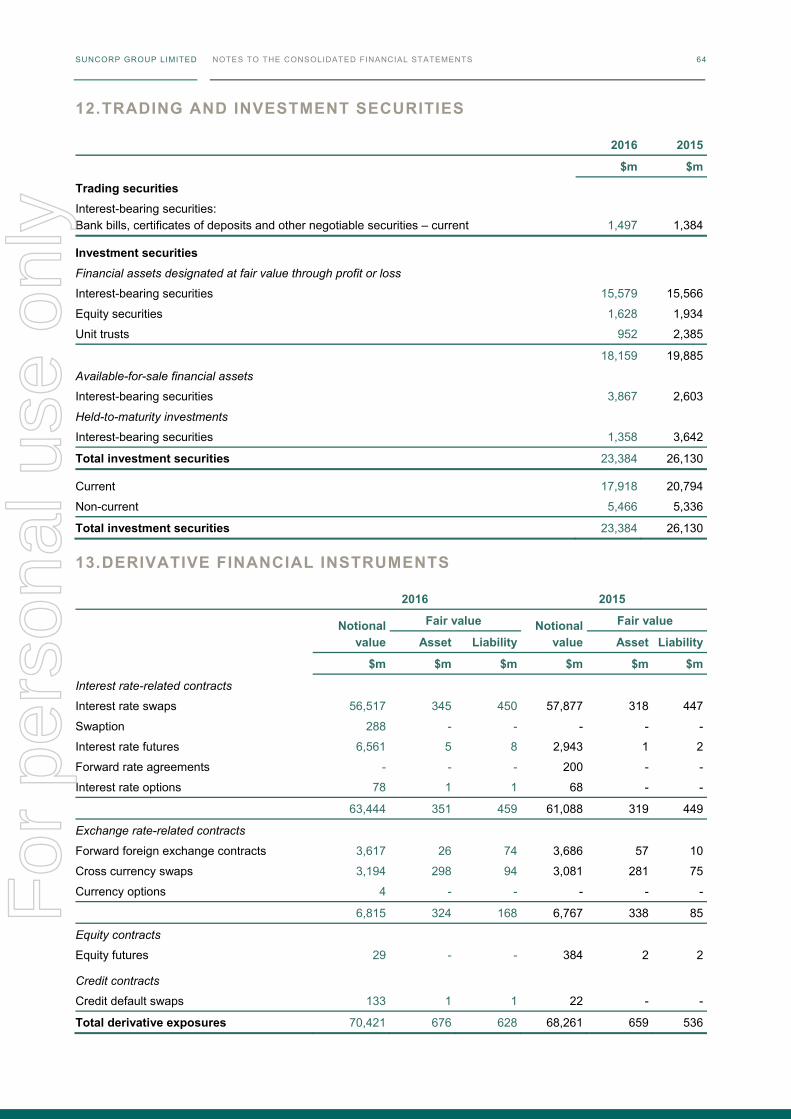
SUNCORP GROUP LIMITED NOTES TO THE CONSOLIDATED FINANCIAL STATEMENTS 64
12. TRADING AND INVESTMENT SECURITIES
2016 2015
$m $m
Trading securities
Interest-bearing securities: Bank bills, certificates of deposits and other negotiable securities – current 1,497 1,384
Investment securities
Financial assets designated at fair value through profit or loss
Interest-bearing securities 15,579 15,566
Equity securities 1,628 1,934
Unit trusts 952 2,385
18,159 19,885
Available-for-sale financial assets
Interest-bearing securities 3,867 2,603
Held-to-maturity investments
Interest-bearing securities 1,358 3,642
Total investment securities 23,384 26,130
Current 17,918 20,794
Non-current 5,466 5,336
Total investment securities 23,384 26,130
13. DERIVATIVE FINANCIAL INSTRUMENTS
2016 2015
Notional value
Fair value Notional value
Fair value
Asset Liability Asset Liability
$m $m $m $m $m $m
Interest rate-related contracts
Interest rate swaps 56,517 345 450 57,877 318 447
Swaption 288 - - - - -
Interest rate futures 6,561 5 8 2,943 1 2
Forward rate agreements - - - 200 - -
Interest rate options 78 1 1 68 - -
63,444 351 459 61,088 319 449
Exchange rate-related contracts
Forward foreign exchange contracts 3,617 26 74 3,686 57 10
Cross currency swaps 3,194 298 94 3,081 281 75
Currency options 4 - - - - -
6,815 324 168 6,767 338 85
Equity contracts
Equity futures 29 - - 384 2 2
Credit contracts
Credit default swaps 133 1 1 22 - -
Total derivative exposures 70,421 676 628 68,261 659 536
For
per
sona
l use
onl
y
SUNCORP GROUP LIMITED NOTES TO THE CONSOLIDATED FINANCIAL STATEMENTS 64
12. TRADING AND INVESTMENT SECURITIES
2016 2015
$m $m
Trading securities
Interest-bearing securities: Bank bills, certificates of deposits and other negotiable securities – current 1,497 1,384
Investment securities
Financial assets designated at fair value through profit or loss
Interest-bearing securities 15,579 15,566
Equity securities 1,628 1,934
Unit trusts 952 2,385
18,159 19,885
Available-for-sale financial assets
Interest-bearing securities 3,867 2,603
Held-to-maturity investments
Interest-bearing securities 1,358 3,642
Total investment securities 23,384 26,130
Current 17,918 20,794
Non-current 5,466 5,336
Total investment securities 23,384 26,130
13. DERIVATIVE FINANCIAL INSTRUMENTS
2016 2015
Notional value
Fair value Notional value
Fair value
Asset Liability Asset Liability
$m $m $m $m $m $m
Interest rate-related contracts
Interest rate swaps 56,517 345 450 57,877 318 447
Swaption 288 - - - - -
Interest rate futures 6,561 5 8 2,943 1 2
Forward rate agreements - - - 200 - -
Interest rate options 78 1 1 68 - -
63,444 351 459 61,088 319 449
Exchange rate-related contracts
Forward foreign exchange contracts 3,617 26 74 3,686 57 10
Cross currency swaps 3,194 298 94 3,081 281 75
Currency options 4 - - - - -
6,815 324 168 6,767 338 85
Equity contracts
Equity futures 29 - - 384 2 2
Credit contracts
Credit default swaps 133 1 1 22 - -
Total derivative exposures 70,421 676 628 68,261 659 536
SUNCORP GROUP LIMITED NOTES TO THE CONSOLIDATED FINANCIAL STATEMENTS 65
Derivatives are used in investments as well as hedging of fluctuations in interest rate and foreign exchange rates. To prevent derivatives being used as a source of gearing, all derivatives have to be wholly or partly cash covered depending on the type of risk undertaken. The investment mandates specifically prohibit the use of derivatives for leveraged trading. ‘Leverage’ here is defined as creating a portfolio which would have sensitivity to an underlying economic or financial variable which is greater than could be achieved using only physical securities.
13.1 INVESTMENTS
Derivatives are used within the investment portfolios where it is more efficient to use derivatives rather than physical securities. The use of derivatives is consistent with the objectives of the overall investment strategies and is one of the means by which these strategies are implemented.
13.2 HEDGING OF FLUCTUATIONS IN INTEREST RATES
The Suncorp Group seeks to minimise volatility in net interest income through the use of interest rate derivatives, primarily vanilla interest rate swaps. The aggregate earnings exposure to interest rates is managed within the Board-approved risk limits. At reporting date, there are 23 (2015: 21) swaps designated as fair value hedges of fixed rate bonds held. All other interest rate swaps designated as hedges are cash flow hedges. The swaps designated as cash flow hedges are hedges of either variable rate mortgages or variable rate short-term debt issues.
13.3 HEDGING OF FLUCTUATIONS IN FOREIGN EXCHANGE RATES
The Suncorp Group ensures that the net exposures are kept to an acceptable level through participation in the spot and forward markets. Cross currency interest rate swaps entered into by the Suncorp Group are designated as hedges using the split approach. Under this approach the benchmark rate component of the swap is accounted for as a fair value hedge and the other components as a cash flow hedge.
The Group has elected to recognise its US Commercial Paper portfolio at fair value through the profit or loss on the basis that it is economically hedged by forward foreign exchange contracts. Both the changes in the fair value of the forward foreign exchange contracts and the debt are recognised in profit or loss. The fair value of forward foreign exchange contracts used as economic hedges of monetary liabilities in foreign currencies where hedge accounting is not applied as at 30 June 2016 is $41 million (2015: $47 million).
During the financial year, the Group deferred to equity $nil (2015: $6 million), and released $nil (2015: $2 million) of foreign currency losses previously deferred to equity to profit or loss on derivatives held in qualifying cash flow hedging relationships.
Consolidated gains of $18 million (2015: losses of $13 million) on derivatives held in qualifying fair value hedging relationships, and losses of $19 million (2015: gains of $13 million) representing changes in the fair value of the hedged items attributable to the hedged risk are recognised in profit or loss.
For
per
sona
l use
onl
y
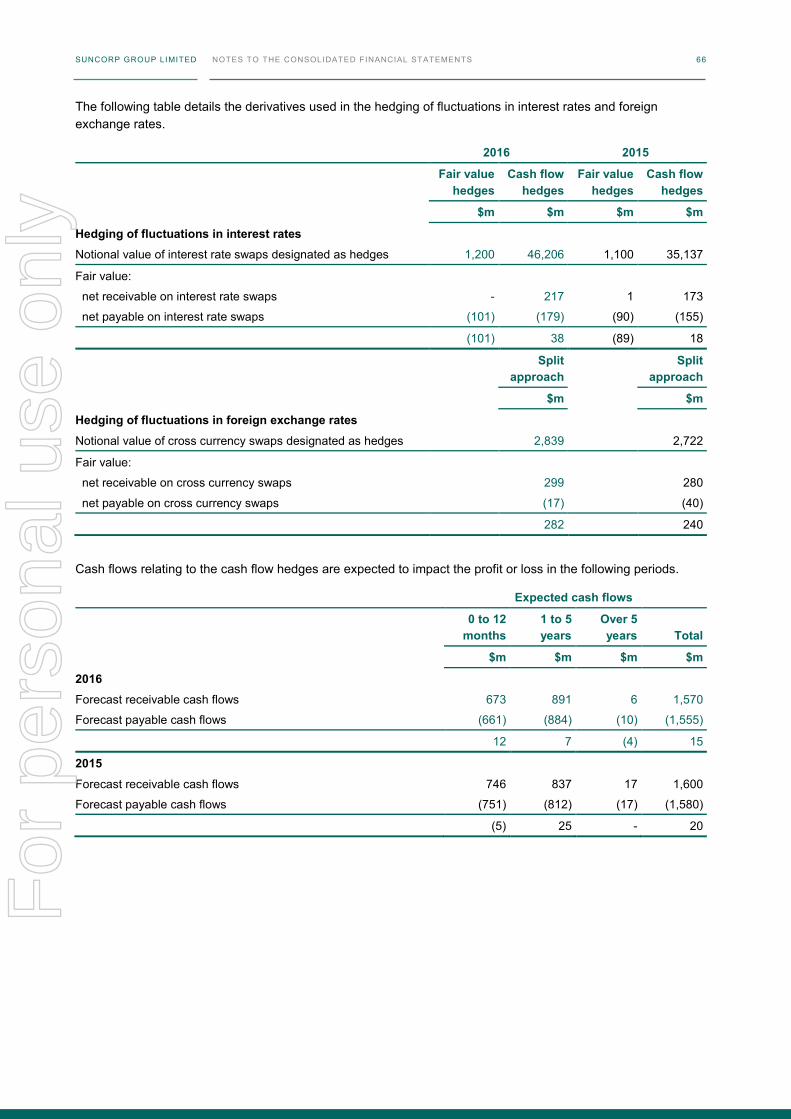
SUNCORP GROUP LIMITED NOTES TO THE CONSOLIDATED FINANCIAL STATEMENTS 66
The following table details the derivatives used in the hedging of fluctuations in interest rates and foreign exchange rates.
2016 2015
Fair value
hedges Cash flow
hedges Fair value
hedges Cash flow
hedges
$m $m $m $m
Hedging of fluctuations in interest rates
Notional value of interest rate swaps designated as hedges 1,200 46,206 1,100 35,137
Fair value:
net receivable on interest rate swaps - 217 1 173
net payable on interest rate swaps (101) (179) (90) (155)
(101) 38 (89) 18
Split
approach Split
approach
$m $m
Hedging of fluctuations in foreign exchange rates
Notional value of cross currency swaps designated as hedges 2,839 2,722
Fair value:
net receivable on cross currency swaps 299 280
net payable on cross currency swaps (17) (40)
282 240
Cash flows relating to the cash flow hedges are expected to impact the profit or loss in the following periods.
Expected cash flows
0 to 12
months 1 to 5 years
Over 5 years Total
$m $m $m $m
2016
Forecast receivable cash flows 673 891 6 1,570
Forecast payable cash flows (661) (884) (10) (1,555)
12 7 (4) 15
2015
Forecast receivable cash flows 746 837 17 1,600
Forecast payable cash flows (751) (812) (17) (1,580)
(5) 25 - 20
For
per
sona
l use
onl
y
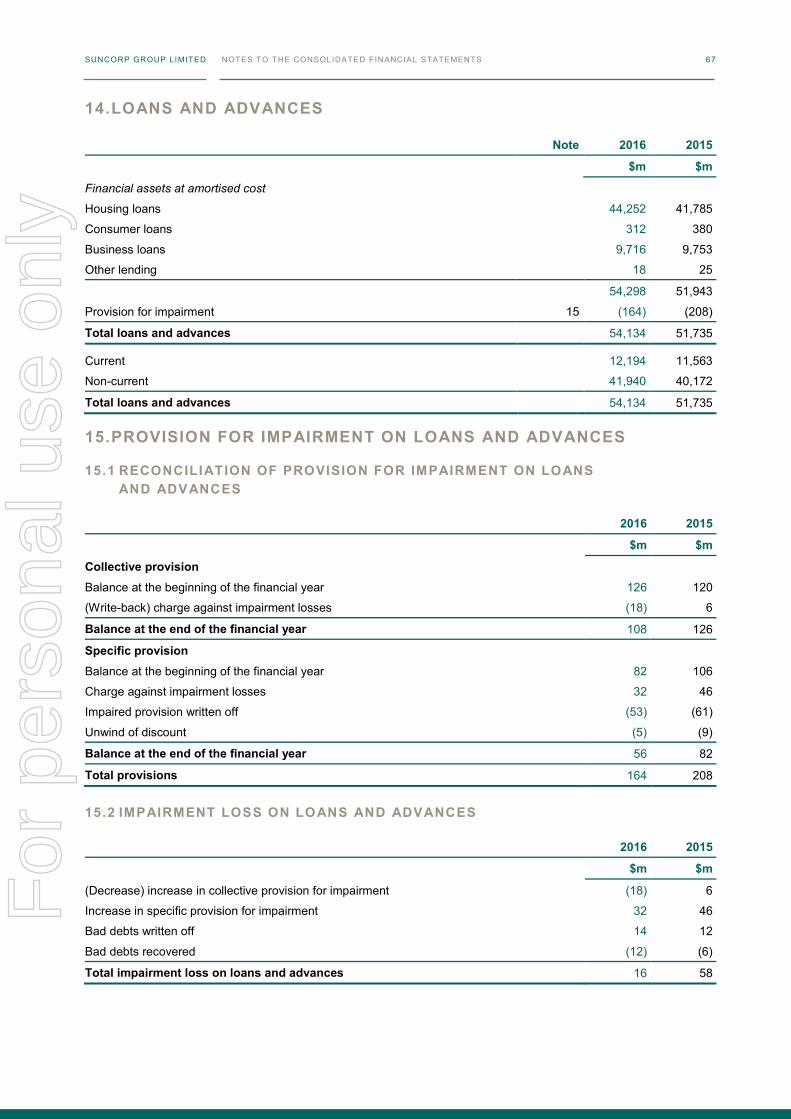
SUNCORP GROUP LIMITED NOTES TO THE CONSOLIDATED FINANCIAL STATEMENTS 66
The following table details the derivatives used in the hedging of fluctuations in interest rates and foreign exchange rates.
2016 2015
Fair value
hedges Cash flow
hedges Fair value
hedges Cash flow
hedges
$m $m $m $m
Hedging of fluctuations in interest rates
Notional value of interest rate swaps designated as hedges 1,200 46,206 1,100 35,137
Fair value:
net receivable on interest rate swaps - 217 1 173
net payable on interest rate swaps (101) (179) (90) (155)
(101) 38 (89) 18
Split
approach Split
approach
$m $m
Hedging of fluctuations in foreign exchange rates
Notional value of cross currency swaps designated as hedges 2,839 2,722
Fair value:
net receivable on cross currency swaps 299 280
net payable on cross currency swaps (17) (40)
282 240
Cash flows relating to the cash flow hedges are expected to impact the profit or loss in the following periods.
Expected cash flows
0 to 12
months 1 to 5 years
Over 5 years Total
$m $m $m $m
2016
Forecast receivable cash flows 673 891 6 1,570
Forecast payable cash flows (661) (884) (10) (1,555)
12 7 (4) 15
2015
Forecast receivable cash flows 746 837 17 1,600
Forecast payable cash flows (751) (812) (17) (1,580)
(5) 25 - 20
SUNCORP GROUP LIMITED NOTES TO THE CONSOLIDATED FINANCIAL STATEMENTS 67
14. LOANS AND ADVANCES
Note 2016 2015
$m $m
Financial assets at amortised cost
Housing loans 44,252 41,785
Consumer loans 312 380
Business loans 9,716 9,753
Other lending 18 25
54,298 51,943
Provision for impairment 15 (164) (208)
Total loans and advances 54,134 51,735
Current 12,194 11,563
Non-current 41,940 40,172
Total loans and advances 54,134 51,735
15. PROVISION FOR IMPAIRMENT ON LOANS AND ADVANCES
15.1 RECONCILIATION OF PROVISION FOR IMPAIRMENT ON LOANS AND ADVANCES
2016 2015
$m $m
Collective provision
Balance at the beginning of the financial year 126 120
(Write-back) charge against impairment losses (18) 6
Balance at the end of the financial year 108 126
Specific provision
Balance at the beginning of the financial year 82 106
Charge against impairment losses 32 46
Impaired provision written off (53) (61)
Unwind of discount (5) (9)
Balance at the end of the financial year 56 82
Total provisions 164 208
15.2 IMPAIRMENT LOSS ON LOANS AND ADVANCES
2016 2015
$m $m
(Decrease) increase in collective provision for impairment (18) 6
Increase in specific provision for impairment 32 46
Bad debts written off 14 12
Bad debts recovered (12) (6)
Total impairment loss on loans and advances 16 58
For
per
sona
l use
onl
y

SUNCORP GROUP LIMITED NOTES TO THE CONSOLIDATED FINANCIAL STATEMENTS 68
16. GOODWILL AND OTHER INTANGIBLE ASSETS
Goodwill Brands
Customer contracts &
other relationships
Outstanding claims
liability intangible Software Total
$m $m $m $m $m $m
2016
Gross carrying amount 5,360 655 1,281 187 725 8,208
Accumulated amortisation and impairment losses (424) (244) (1,153) (159) (350) (2,330)
Balance at the end of the financial year 4,936 411 128 28 375 5,878
Movements in intangible assets1
Balance at the beginning of the financial year 4,921 431 145 32 254 5,783
Acquisitions - - 24 - 144 168
Amortisation - (20) (41) (4) (23) (88)
Foreign currency exchange 15 - - - - 15
Balance at the end of the financial year 4,936 411 128 28 375 5,878
Maximum remaining useful life Indefinite 41 years 11 years 11 years 9 years
2015
Gross carrying amount 5,345 655 1,257 187 591 8,035
Accumulated amortisation and impairment losses (424) (224) (1,112) (155) (337) (2,252)
Balance at the end of the financial year 4,921 431 145 32 254 5,783
Movements in intangible assets
Balance at the beginning of the financial year 4,906 454 180 37 143 5,720
Acquired from business combinations 25 - 9 - 2 36
Acquisitions - - - - 129 129
Disposal - - - - (2) (2)
Amortisation - (23) (44) (5) (18) (90)
Foreign currency exchange (10) - - - - (10)
Balance at the end of the financial year 4,921 431 145 32 254 5,783
Maximum remaining useful life Indefinite 42 years 12 years 12 years 10 years
1 Software with gross carrying amount of $10 million and accumulated amortisation of $10 million was disposed of during the financial year.
For
per
sona
l use
onl
y
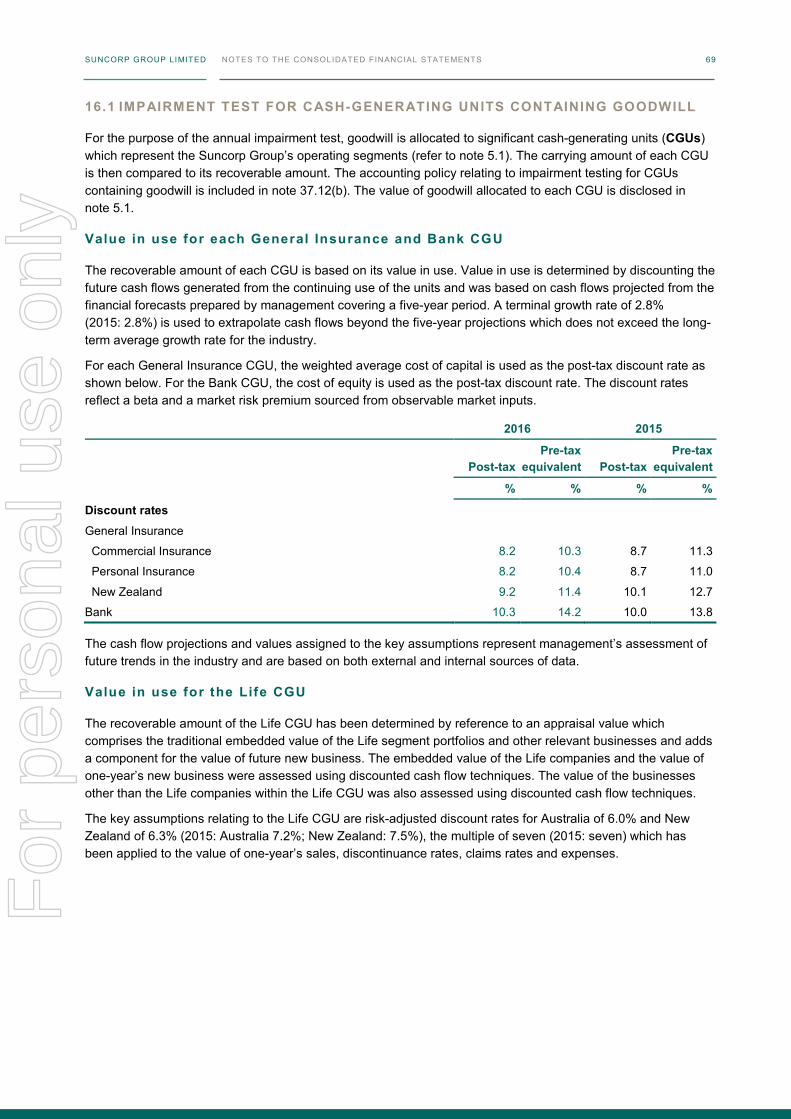
SUNCORP GROUP LIMITED NOTES TO THE CONSOLIDATED FINANCIAL STATEMENTS 68
16. GOODWILL AND OTHER INTANGIBLE ASSETS
Goodwill Brands
Customer contracts &
other relationships
Outstanding claims
liability intangible Software Total
$m $m $m $m $m $m
2016
Gross carrying amount 5,360 655 1,281 187 725 8,208
Accumulated amortisation and impairment losses (424) (244) (1,153) (159) (350) (2,330)
Balance at the end of the financial year 4,936 411 128 28 375 5,878
Movements in intangible assets1
Balance at the beginning of the financial year 4,921 431 145 32 254 5,783
Acquisitions - - 24 - 144 168
Amortisation - (20) (41) (4) (23) (88)
Foreign currency exchange 15 - - - - 15
Balance at the end of the financial year 4,936 411 128 28 375 5,878
Maximum remaining useful life Indefinite 41 years 11 years 11 years 9 years
2015
Gross carrying amount 5,345 655 1,257 187 591 8,035
Accumulated amortisation and impairment losses (424) (224) (1,112) (155) (337) (2,252)
Balance at the end of the financial year 4,921 431 145 32 254 5,783
Movements in intangible assets
Balance at the beginning of the financial year 4,906 454 180 37 143 5,720
Acquired from business combinations 25 - 9 - 2 36
Acquisitions - - - - 129 129
Disposal - - - - (2) (2)
Amortisation - (23) (44) (5) (18) (90)
Foreign currency exchange (10) - - - - (10)
Balance at the end of the financial year 4,921 431 145 32 254 5,783
Maximum remaining useful life Indefinite 42 years 12 years 12 years 10 years
1 Software with gross carrying amount of $10 million and accumulated amortisation of $10 million was disposed of during the financial year.
SUNCORP GROUP LIMITED NOTES TO THE CONSOLIDATED FINANCIAL STATEMENTS 69
16.1 IMPAIRMENT TEST FOR CASH-GENERATING UNITS CONTAINING GOODWILL
For the purpose of the annual impairment test, goodwill is allocated to significant cash-generating units (CGUs) which represent the Suncorp Group’s operating segments (refer to note 5.1). The carrying amount of each CGU is then compared to its recoverable amount. The accounting policy relating to impairment testing for CGUs containing goodwill is included in note 37.12(b). The value of goodwill allocated to each CGU is disclosed in note 5.1.
Value in use for each General Insurance and Bank CGU
The recoverable amount of each CGU is based on its value in use. Value in use is determined by discounting the future cash flows generated from the continuing use of the units and was based on cash flows projected from the financial forecasts prepared by management covering a five-year period. A terminal growth rate of 2.8% (2015: 2.8%) is used to extrapolate cash flows beyond the five-year projections which does not exceed the long-term average growth rate for the industry.
For each General Insurance CGU, the weighted average cost of capital is used as the post-tax discount rate as shown below. For the Bank CGU, the cost of equity is used as the post-tax discount rate. The discount rates reflect a beta and a market risk premium sourced from observable market inputs.
2016 2015
Post-tax Pre-tax
equivalent Post-tax Pre-tax
equivalent
% % % %
Discount rates
General Insurance
Commercial Insurance 8.2 10.3 8.7 11.3
Personal Insurance 8.2 10.4 8.7 11.0
New Zealand 9.2 11.4 10.1 12.7
Bank 10.3 14.2 10.0 13.8
The cash flow projections and values assigned to the key assumptions represent management’s assessment of future trends in the industry and are based on both external and internal sources of data.
Value in use for the Life CGU
The recoverable amount of the Life CGU has been determined by reference to an appraisal value which comprises the traditional embedded value of the Life segment portfolios and other relevant businesses and adds a component for the value of future new business. The embedded value of the Life companies and the value of one-year’s new business were assessed using discounted cash flow techniques. The value of the businesses other than the Life companies within the Life CGU was also assessed using discounted cash flow techniques.
The key assumptions relating to the Life CGU are risk-adjusted discount rates for Australia of 6.0% and New Zealand of 6.3% (2015: Australia 7.2%; New Zealand: 7.5%), the multiple of seven (2015: seven) which has been applied to the value of one-year’s sales, discontinuance rates, claims rates and expenses.
For
per
sona
l use
onl
y
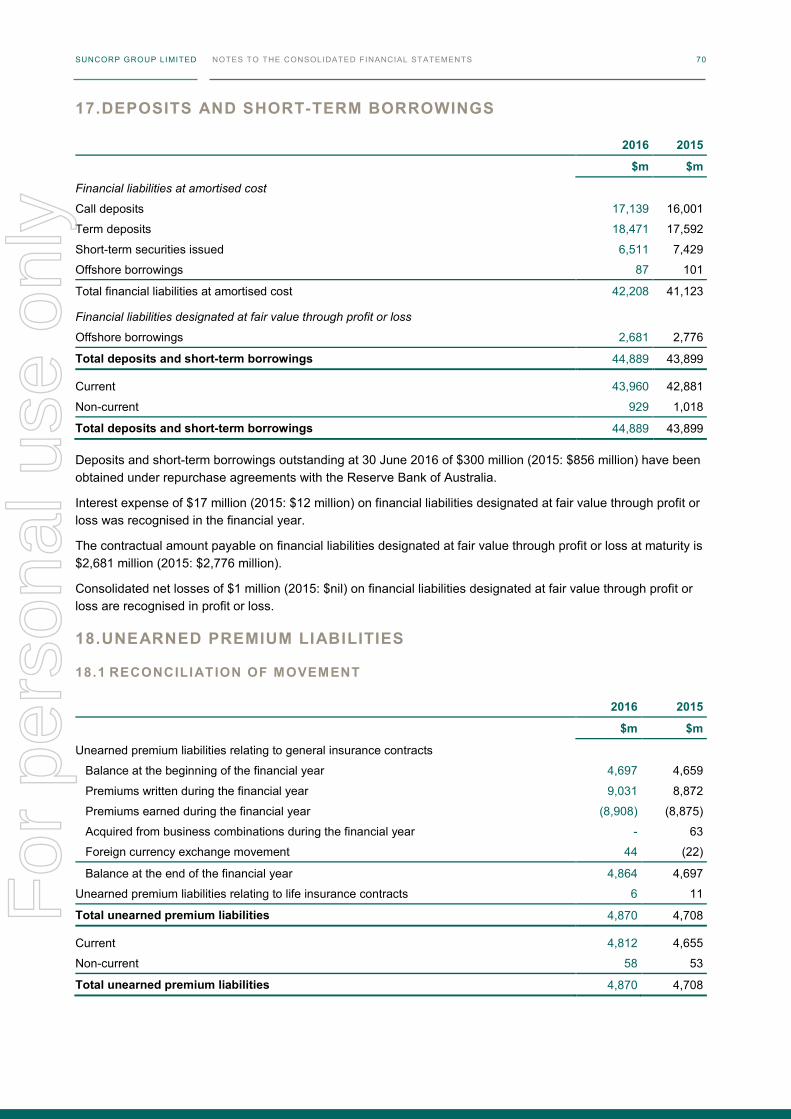
SUNCORP GROUP LIMITED NOTES TO THE CONSOLIDATED FINANCIAL STATEMENTS 70
17. DEPOSITS AND SHORT-TERM BORROWINGS
2016 2015
$m $m
Financial liabilities at amortised cost
Call deposits 17,139 16,001
Term deposits 18,471 17,592
Short-term securities issued 6,511 7,429
Offshore borrowings 87 101
Total financial liabilities at amortised cost 42,208 41,123
Financial liabilities designated at fair value through profit or loss
Offshore borrowings 2,681 2,776
Total deposits and short-term borrowings 44,889 43,899
Current 43,960 42,881
Non-current 929 1,018
Total deposits and short-term borrowings 44,889 43,899
Deposits and short-term borrowings outstanding at 30 June 2016 of $300 million (2015: $856 million) have been obtained under repurchase agreements with the Reserve Bank of Australia.
Interest expense of $17 million (2015: $12 million) on financial liabilities designated at fair value through profit or loss was recognised in the financial year.
The contractual amount payable on financial liabilities designated at fair value through profit or loss at maturity is $2,681 million (2015: $2,776 million).
Consolidated net losses of $1 million (2015: $nil) on financial liabilities designated at fair value through profit or loss are recognised in profit or loss.
18. UNEARNED PREMIUM LIABILITIES
18.1 RECONCILIATION OF MOVEMENT
2016 2015
$m $m
Unearned premium liabilities relating to general insurance contracts
Balance at the beginning of the financial year 4,697 4,659
Premiums written during the financial year 9,031 8,872
Premiums earned during the financial year (8,908) (8,875)
Acquired from business combinations during the financial year - 63
Foreign currency exchange movement 44 (22)
Balance at the end of the financial year 4,864 4,697
Unearned premium liabilities relating to life insurance contracts 6 11
Total unearned premium liabilities 4,870 4,708
Current 4,812 4,655
Non-current 58 53
Total unearned premium liabilities 4,870 4,708
SUNCORP GROUP LIMITED NOTES TO THE CONSOLIDATED FINANCIAL STATEMENTS 71
18.2 LIABILITY ADEQUACY TEST RELATING TO GENERAL INSURANCE CONTRACTS
2016 2015
$m $m
Central estimate of present value of expected future cash flows arising from future claims 3,733 3,410
Risk margin 83 74
Present value of expected future cash inflows arising from reinsurance recoveries on future claims (161) (184)
Expected present value of future cash flows for future claims including risk margin 3,655 3,300
% %
Risk margin 2.7 2.6
Probability of adequacy 57 – 64 57 – 64
The probability of adequacy adopted for the general insurance liability adequacy test (LAT) differs from the 90% probability of adequacy adopted in determining the outstanding claims liabilities (refer note 19.4). The reason for this difference is that the former is in effect an impairment test used only to test the sufficiency of net premium liabilities whereas the latter is a measurement accounting policy used in determining the carrying value of the outstanding claims liabilities.
The process used to determine the risk margin is discussed in note 19.4.
As at 30 June 2016 and 30 June 2015, the LAT resulted in surpluses for all general insurance portfolios.
19. OUTSTANDING CLAIMS LIABILITIES
2016 2015
$m $m
General insurance contracts
Gross central estimate – undiscounted 8,599 9,080
Risk margin 1,200 1,215
Claims handling expenses 319 322
10,118 10,617
Discount to present value (693) (882)
Gross outstanding claims liabilities relating to general insurance contracts – discounted 9,425 9,735
Gross outstanding claims liabilities relating to life insurance contracts – discounted 309 263
Total gross outstanding claims liabilities – discounted 9,734 9,998
% %
General insurance contracts
Overall net risk margin applied 15.8 16.2
Probability of adequacy of the risk margin (approximately) 90 90
For
per
sona
l use
onl
y
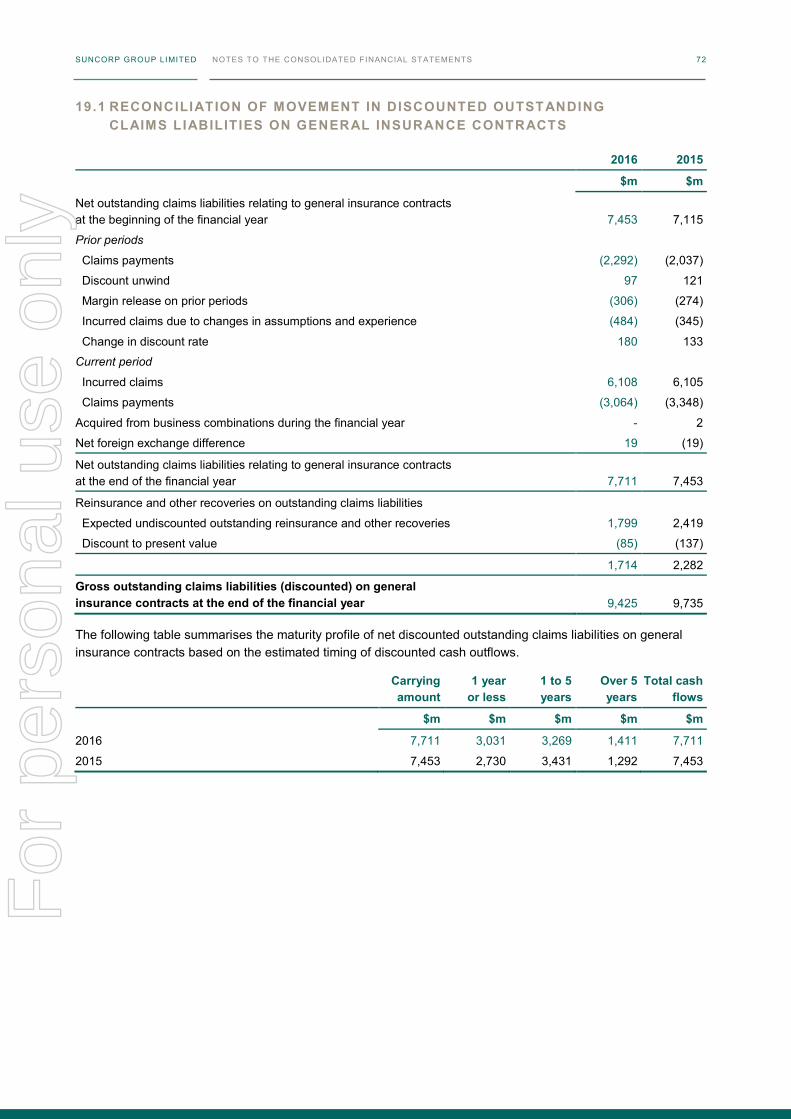
SUNCORP GROUP LIMITED NOTES TO THE CONSOLIDATED FINANCIAL STATEMENTS 72
19.1 RECONCILIATION OF MOVEMENT IN DISCOUNTED OUTSTANDING CLAIMS LIABILITIES ON GENERAL INSURANCE CONTRACTS
2016 2015
$m $m
Net outstanding claims liabilities relating to general insurance contracts at the beginning of the financial year 7,453 7,115
Prior periods
Claims payments (2,292) (2,037)
Discount unwind 97 121
Margin release on prior periods (306) (274)
Incurred claims due to changes in assumptions and experience (484) (345)
Change in discount rate 180 133
Current period
Incurred claims 6,108 6,105
Claims payments (3,064) (3,348)
Acquired from business combinations during the financial year - 2
Net foreign exchange difference 19 (19)
Net outstanding claims liabilities relating to general insurance contracts at the end of the financial year 7,711 7,453
Reinsurance and other recoveries on outstanding claims liabilities
Expected undiscounted outstanding reinsurance and other recoveries 1,799 2,419
Discount to present value (85) (137)
1,714 2,282
Gross outstanding claims liabilities (discounted) on general insurance contracts at the end of the financial year 9,425 9,735
The following table summarises the maturity profile of net discounted outstanding claims liabilities on general insurance contracts based on the estimated timing of discounted cash outflows.
Carrying amount
1 year or less
1 to 5 years
Over 5 years
Total cash flows
$m $m $m $m $m
2016 7,711 3,031 3,269 1,411 7,711
2015 7,453 2,730 3,431 1,292 7,453
For
per
sona
l use
onl
y
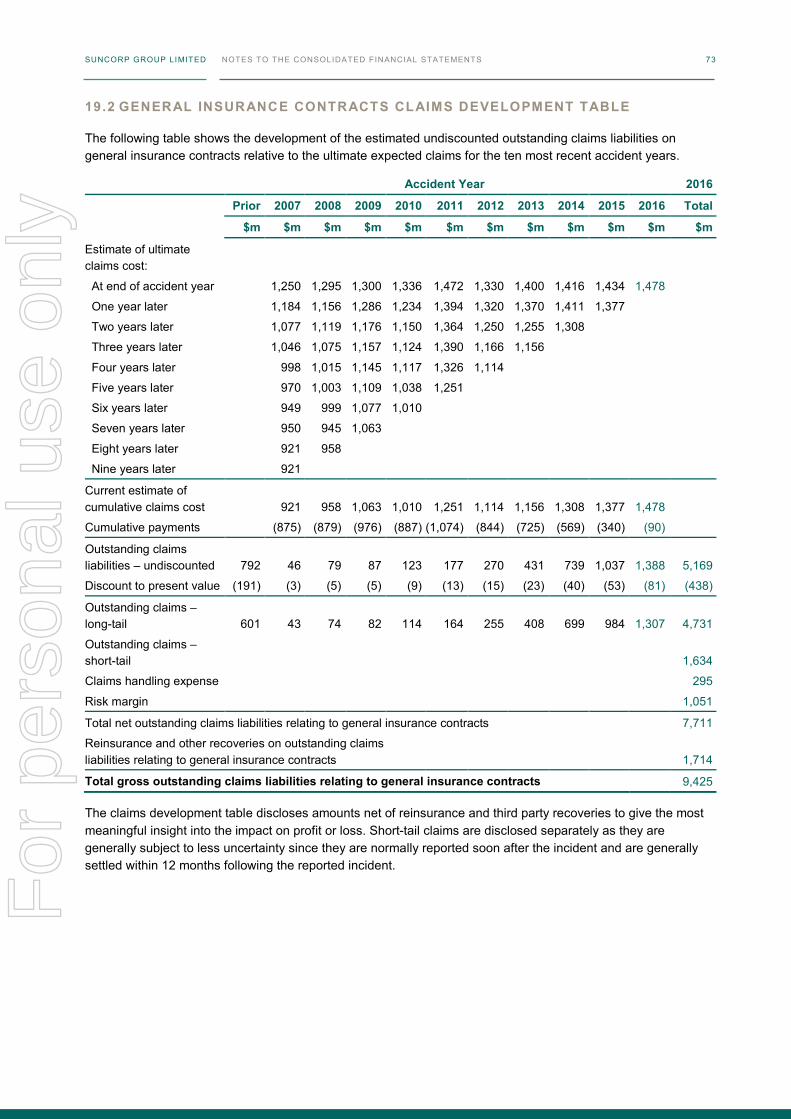
SUNCORP GROUP LIMITED NOTES TO THE CONSOLIDATED FINANCIAL STATEMENTS 72
19.1 RECONCILIATION OF MOVEMENT IN DISCOUNTED OUTSTANDING CLAIMS LIABILITIES ON GENERAL INSURANCE CONTRACTS
2016 2015
$m $m
Net outstanding claims liabilities relating to general insurance contracts at the beginning of the financial year 7,453 7,115
Prior periods
Claims payments (2,292) (2,037)
Discount unwind 97 121
Margin release on prior periods (306) (274)
Incurred claims due to changes in assumptions and experience (484) (345)
Change in discount rate 180 133
Current period
Incurred claims 6,108 6,105
Claims payments (3,064) (3,348)
Acquired from business combinations during the financial year - 2
Net foreign exchange difference 19 (19)
Net outstanding claims liabilities relating to general insurance contracts at the end of the financial year 7,711 7,453
Reinsurance and other recoveries on outstanding claims liabilities
Expected undiscounted outstanding reinsurance and other recoveries 1,799 2,419
Discount to present value (85) (137)
1,714 2,282
Gross outstanding claims liabilities (discounted) on general insurance contracts at the end of the financial year 9,425 9,735
The following table summarises the maturity profile of net discounted outstanding claims liabilities on general insurance contracts based on the estimated timing of discounted cash outflows.
Carrying amount
1 year or less
1 to 5 years
Over 5 years
Total cash flows
$m $m $m $m $m
2016 7,711 3,031 3,269 1,411 7,711
2015 7,453 2,730 3,431 1,292 7,453
SUNCORP GROUP LIMITED NOTES TO THE CONSOLIDATED FINANCIAL STATEMENTS 73
19.2 GENERAL INSURANCE CONTRACTS CLAIMS DEVELOPMENT TABLE
The following table shows the development of the estimated undiscounted outstanding claims liabilities on general insurance contracts relative to the ultimate expected claims for the ten most recent accident years.
Accident Year 2016
Prior 2007 2008 2009 2010 2011 2012 2013 2014 2015 2016 Total
$m $m $m $m $m $m $m $m $m $m $m $m
Estimate of ultimate claims cost:
At end of accident year 1,250 1,295 1,300 1,336 1,472 1,330 1,400 1,416 1,434 1,478
One year later 1,184 1,156 1,286 1,234 1,394 1,320 1,370 1,411 1,377
Two years later 1,077 1,119 1,176 1,150 1,364 1,250 1,255 1,308
Three years later 1,046 1,075 1,157 1,124 1,390 1,166 1,156
Four years later 998 1,015 1,145 1,117 1,326 1,114
Five years later 970 1,003 1,109 1,038 1,251
Six years later 949 999 1,077 1,010
Seven years later 950 945 1,063
Eight years later 921 958
Nine years later 921
Current estimate of cumulative claims cost 921 958 1,063 1,010 1,251 1,114 1,156 1,308 1,377 1,478
Cumulative payments (875) (879) (976) (887) (1,074) (844) (725) (569) (340) (90)
Outstanding claims liabilities – undiscounted 792 46 79 87 123 177 270 431 739 1,037 1,388 5,169
Discount to present value (191) (3) (5) (5) (9) (13) (15) (23) (40) (53) (81) (438)
Outstanding claims – long-tail 601 43 74 82 114 164 255 408 699 984 1,307 4,731
Outstanding claims – short-tail 1,634
Claims handling expense 295
Risk margin 1,051
Total net outstanding claims liabilities relating to general insurance contracts 7,711
Reinsurance and other recoveries on outstanding claims liabilities relating to general insurance contracts 1,714
Total gross outstanding claims liabilities relating to general insurance contracts 9,425
The claims development table discloses amounts net of reinsurance and third party recoveries to give the most meaningful insight into the impact on profit or loss. Short-tail claims are disclosed separately as they are generally subject to less uncertainty since they are normally reported soon after the incident and are generally settled within 12 months following the reported incident.
For
per
sona
l use
onl
y
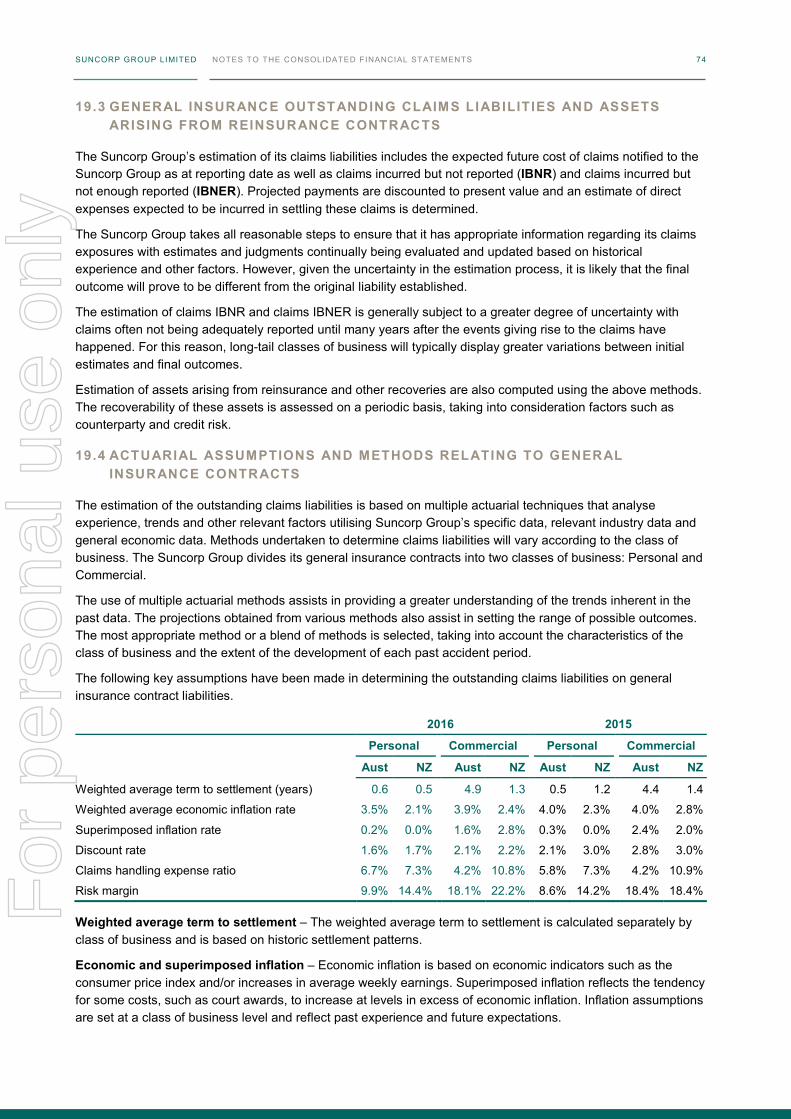
SUNCORP GROUP LIMITED NOTES TO THE CONSOLIDATED FINANCIAL STATEMENTS 74
19.3 GENERAL INSURANCE OUTSTANDING CLAIMS LIABILITIES AND ASSETS ARISING FROM REINSURANCE CONTRACTS
The Suncorp Group’s estimation of its claims liabilities includes the expected future cost of claims notified to the Suncorp Group as at reporting date as well as claims incurred but not reported (IBNR) and claims incurred but not enough reported (IBNER). Projected payments are discounted to present value and an estimate of direct expenses expected to be incurred in settling these claims is determined.
The Suncorp Group takes all reasonable steps to ensure that it has appropriate information regarding its claims exposures with estimates and judgments continually being evaluated and updated based on historical experience and other factors. However, given the uncertainty in the estimation process, it is likely that the final outcome will prove to be different from the original liability established.
The estimation of claims IBNR and claims IBNER is generally subject to a greater degree of uncertainty with claims often not being adequately reported until many years after the events giving rise to the claims have happened. For this reason, long-tail classes of business will typically display greater variations between initial estimates and final outcomes.
Estimation of assets arising from reinsurance and other recoveries are also computed using the above methods. The recoverability of these assets is assessed on a periodic basis, taking into consideration factors such as counterparty and credit risk.
19.4 ACTUARIAL ASSUMPTIONS AND METHODS RELATING TO GENERAL INSURANCE CONTRACTS
The estimation of the outstanding claims liabilities is based on multiple actuarial techniques that analyse experience, trends and other relevant factors utilising Suncorp Group’s specific data, relevant industry data and general economic data. Methods undertaken to determine claims liabilities will vary according to the class of business. The Suncorp Group divides its general insurance contracts into two classes of business: Personal and Commercial.
The use of multiple actuarial methods assists in providing a greater understanding of the trends inherent in the past data. The projections obtained from various methods also assist in setting the range of possible outcomes. The most appropriate method or a blend of methods is selected, taking into account the characteristics of the class of business and the extent of the development of each past accident period.
The following key assumptions have been made in determining the outstanding claims liabilities on general insurance contract liabilities.
2016 2015
Personal Commercial Personal Commercial
Aust NZ Aust NZ Aust NZ Aust NZ
Weighted average term to settlement (years) 0.6 0.5 4.9 1.3 0.5 1.2 4.4 1.4
Weighted average economic inflation rate 3.5% 2.1% 3.9% 2.4% 4.0% 2.3% 4.0% 2.8%
Superimposed inflation rate 0.2% 0.0% 1.6% 2.8% 0.3% 0.0% 2.4% 2.0%
Discount rate 1.6% 1.7% 2.1% 2.2% 2.1% 3.0% 2.8% 3.0%
Claims handling expense ratio 6.7% 7.3% 4.2% 10.8% 5.8% 7.3% 4.2% 10.9%
Risk margin 9.9% 14.4% 18.1% 22.2% 8.6% 14.2% 18.4% 18.4%
Weighted average term to settlement – The weighted average term to settlement is calculated separately by class of business and is based on historic settlement patterns.
Economic and superimposed inflation – Economic inflation is based on economic indicators such as the consumer price index and/or increases in average weekly earnings. Superimposed inflation reflects the tendency for some costs, such as court awards, to increase at levels in excess of economic inflation. Inflation assumptions are set at a class of business level and reflect past experience and future expectations.
For
per
sona
l use
onl
y
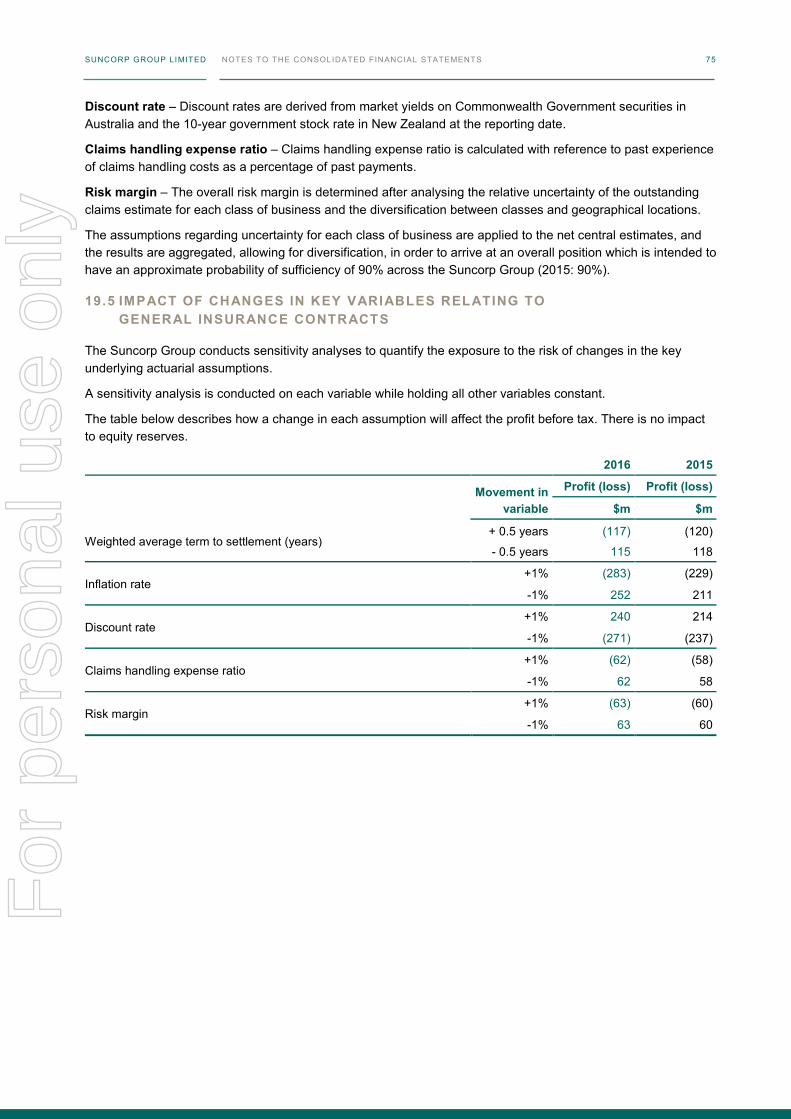
SUNCORP GROUP LIMITED NOTES TO THE CONSOLIDATED FINANCIAL STATEMENTS 74
19.3 GENERAL INSURANCE OUTSTANDING CLAIMS LIABILITIES AND ASSETS ARISING FROM REINSURANCE CONTRACTS
The Suncorp Group’s estimation of its claims liabilities includes the expected future cost of claims notified to the Suncorp Group as at reporting date as well as claims incurred but not reported (IBNR) and claims incurred but not enough reported (IBNER). Projected payments are discounted to present value and an estimate of direct expenses expected to be incurred in settling these claims is determined.
The Suncorp Group takes all reasonable steps to ensure that it has appropriate information regarding its claims exposures with estimates and judgments continually being evaluated and updated based on historical experience and other factors. However, given the uncertainty in the estimation process, it is likely that the final outcome will prove to be different from the original liability established.
The estimation of claims IBNR and claims IBNER is generally subject to a greater degree of uncertainty with claims often not being adequately reported until many years after the events giving rise to the claims have happened. For this reason, long-tail classes of business will typically display greater variations between initial estimates and final outcomes.
Estimation of assets arising from reinsurance and other recoveries are also computed using the above methods. The recoverability of these assets is assessed on a periodic basis, taking into consideration factors such as counterparty and credit risk.
19.4 ACTUARIAL ASSUMPTIONS AND METHODS RELATING TO GENERAL INSURANCE CONTRACTS
The estimation of the outstanding claims liabilities is based on multiple actuarial techniques that analyse experience, trends and other relevant factors utilising Suncorp Group’s specific data, relevant industry data and general economic data. Methods undertaken to determine claims liabilities will vary according to the class of business. The Suncorp Group divides its general insurance contracts into two classes of business: Personal and Commercial.
The use of multiple actuarial methods assists in providing a greater understanding of the trends inherent in the past data. The projections obtained from various methods also assist in setting the range of possible outcomes. The most appropriate method or a blend of methods is selected, taking into account the characteristics of the class of business and the extent of the development of each past accident period.
The following key assumptions have been made in determining the outstanding claims liabilities on general insurance contract liabilities.
2016 2015
Personal Commercial Personal Commercial
Aust NZ Aust NZ Aust NZ Aust NZ
Weighted average term to settlement (years) 0.6 0.5 4.9 1.3 0.5 1.2 4.4 1.4
Weighted average economic inflation rate 3.5% 2.1% 3.9% 2.4% 4.0% 2.3% 4.0% 2.8%
Superimposed inflation rate 0.2% 0.0% 1.6% 2.8% 0.3% 0.0% 2.4% 2.0%
Discount rate 1.6% 1.7% 2.1% 2.2% 2.1% 3.0% 2.8% 3.0%
Claims handling expense ratio 6.7% 7.3% 4.2% 10.8% 5.8% 7.3% 4.2% 10.9%
Risk margin 9.9% 14.4% 18.1% 22.2% 8.6% 14.2% 18.4% 18.4%
Weighted average term to settlement – The weighted average term to settlement is calculated separately by class of business and is based on historic settlement patterns.
Economic and superimposed inflation – Economic inflation is based on economic indicators such as the consumer price index and/or increases in average weekly earnings. Superimposed inflation reflects the tendency for some costs, such as court awards, to increase at levels in excess of economic inflation. Inflation assumptions are set at a class of business level and reflect past experience and future expectations.
SUNCORP GROUP LIMITED NOTES TO THE CONSOLIDATED FINANCIAL STATEMENTS 75
Discount rate – Discount rates are derived from market yields on Commonwealth Government securities in Australia and the 10-year government stock rate in New Zealand at the reporting date.
Claims handling expense ratio – Claims handling expense ratio is calculated with reference to past experience of claims handling costs as a percentage of past payments.
Risk margin – The overall risk margin is determined after analysing the relative uncertainty of the outstanding claims estimate for each class of business and the diversification between classes and geographical locations.
The assumptions regarding uncertainty for each class of business are applied to the net central estimates, and the results are aggregated, allowing for diversification, in order to arrive at an overall position which is intended to have an approximate probability of sufficiency of 90% across the Suncorp Group (2015: 90%).
19.5 IMPACT OF CHANGES IN KEY VARIABLES RELATING TO GENERAL INSURANCE CONTRACTS
The Suncorp Group conducts sensitivity analyses to quantify the exposure to the risk of changes in the key underlying actuarial assumptions.
A sensitivity analysis is conducted on each variable while holding all other variables constant.
The table below describes how a change in each assumption will affect the profit before tax. There is no impact to equity reserves.
2016 2015
Movement in variable
Profit (loss) Profit (loss)
$m $m
Weighted average term to settlement (years) + 0.5 years (117) (120)
- 0.5 years 115 118
Inflation rate +1% (283) (229)
-1% 252 211
Discount rate +1% 240 214
-1% (271) (237)
Claims handling expense ratio +1% (62) (58)
-1% 62 58
Risk margin +1% (63) (60)
-1% 63 60
For
per
sona
l use
onl
y
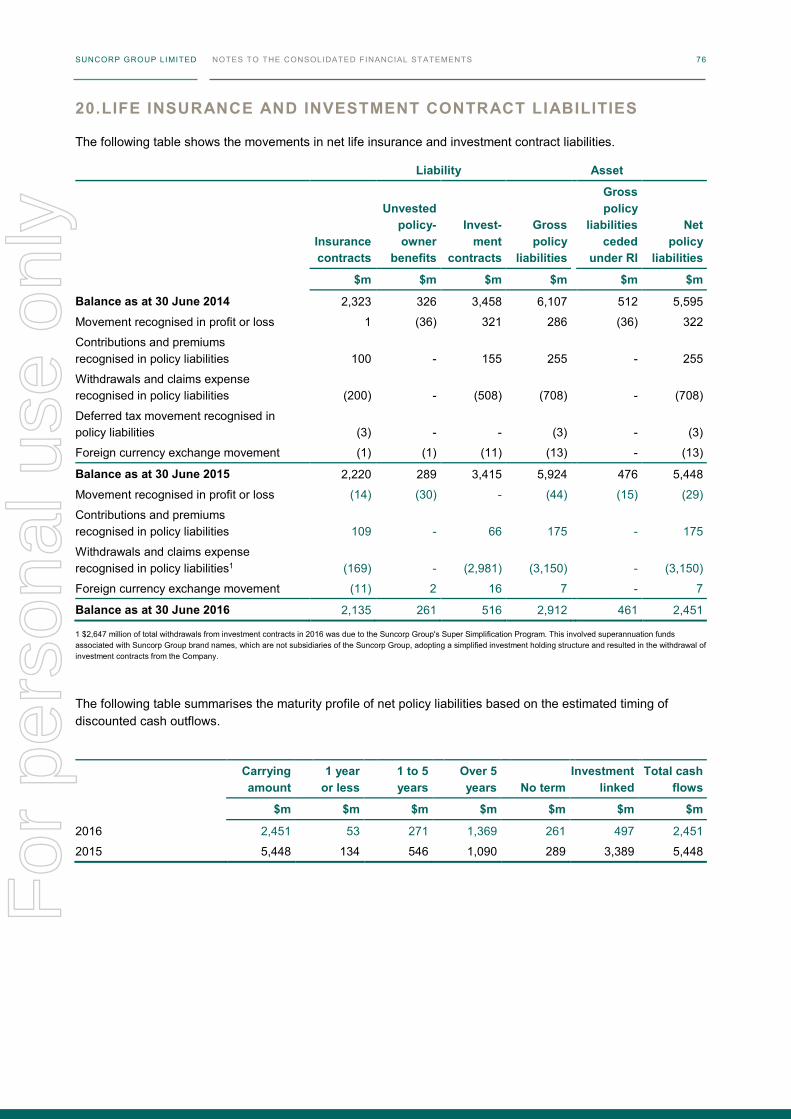
SUNCORP GROUP LIMITED NOTES TO THE CONSOLIDATED FINANCIAL STATEMENTS 76
20. LIFE INSURANCE AND INVESTMENT CONTRACT LIABILITIES
The following table shows the movements in net life insurance and investment contract liabilities.
Liability Asset
Insurance contracts
Unvested policy-owner
benefits
Invest-ment
contracts
Gross policy
liabilities
Gross policy
liabilities ceded
under RI
Net policy
liabilities
$m $m $m $m $m $m
Balance as at 30 June 2014 2,323 326 3,458 6,107 512 5,595
Movement recognised in profit or loss 1 (36) 321 286 (36) 322
Contributions and premiums recognised in policy liabilities 100 - 155 255 - 255
Withdrawals and claims expense recognised in policy liabilities (200) - (508) (708) - (708)
Deferred tax movement recognised in policy liabilities (3) - - (3) - (3)
Foreign currency exchange movement (1) (1) (11) (13) - (13)
Balance as at 30 June 2015 2,220 289 3,415 5,924 476 5,448
Movement recognised in profit or loss (14) (30) - (44) (15) (29)
Contributions and premiums recognised in policy liabilities 109 - 66 175 - 175
Withdrawals and claims expense recognised in policy liabilities1 (169) - (2,981) (3,150) - (3,150)
Foreign currency exchange movement (11) 2 16 7 - 7
Balance as at 30 June 2016 2,135 261 516 2,912 461 2,451
1 $2,647 million of total withdrawals from investment contracts in 2016 was due to the Suncorp Group's Super Simplification Program. This involved superannuation funds associated with Suncorp Group brand names, which are not subsidiaries of the Suncorp Group, adopting a simplified investment holding structure and resulted in the withdrawal of investment contracts from the Company.
The following table summarises the maturity profile of net policy liabilities based on the estimated timing of discounted cash outflows.
Carrying amount
1 year or less
1 to 5 years
Over 5 years No term
Investment linked
Total cash flows
$m $m $m $m $m $m $m
2016 2,451 53 271 1,369 261 497 2,451
2015 5,448 134 546 1,090 289 3,389 5,448
For
per
sona
l use
onl
y
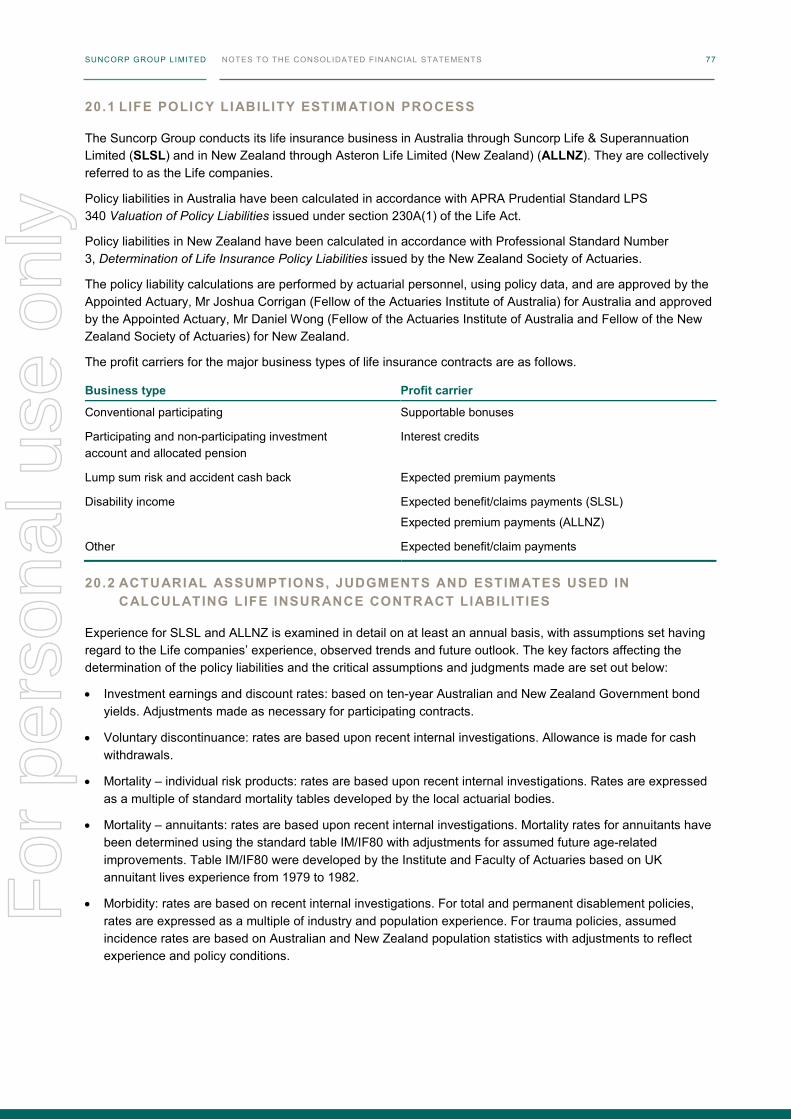
SUNCORP GROUP LIMITED NOTES TO THE CONSOLIDATED FINANCIAL STATEMENTS 76
20. LIFE INSURANCE AND INVESTMENT CONTRACT LIABILITIES
The following table shows the movements in net life insurance and investment contract liabilities.
Liability Asset
Insurance contracts
Unvested policy-owner
benefits
Invest-ment
contracts
Gross policy
liabilities
Gross policy
liabilities ceded
under RI
Net policy
liabilities
$m $m $m $m $m $m
Balance as at 30 June 2014 2,323 326 3,458 6,107 512 5,595
Movement recognised in profit or loss 1 (36) 321 286 (36) 322
Contributions and premiums recognised in policy liabilities 100 - 155 255 - 255
Withdrawals and claims expense recognised in policy liabilities (200) - (508) (708) - (708)
Deferred tax movement recognised in policy liabilities (3) - - (3) - (3)
Foreign currency exchange movement (1) (1) (11) (13) - (13)
Balance as at 30 June 2015 2,220 289 3,415 5,924 476 5,448
Movement recognised in profit or loss (14) (30) - (44) (15) (29)
Contributions and premiums recognised in policy liabilities 109 - 66 175 - 175
Withdrawals and claims expense recognised in policy liabilities1 (169) - (2,981) (3,150) - (3,150)
Foreign currency exchange movement (11) 2 16 7 - 7
Balance as at 30 June 2016 2,135 261 516 2,912 461 2,451
1 $2,647 million of total withdrawals from investment contracts in 2016 was due to the Suncorp Group's Super Simplification Program. This involved superannuation funds associated with Suncorp Group brand names, which are not subsidiaries of the Suncorp Group, adopting a simplified investment holding structure and resulted in the withdrawal of investment contracts from the Company.
The following table summarises the maturity profile of net policy liabilities based on the estimated timing of discounted cash outflows.
Carrying amount
1 year or less
1 to 5 years
Over 5 years No term
Investment linked
Total cash flows
$m $m $m $m $m $m $m
2016 2,451 53 271 1,369 261 497 2,451
2015 5,448 134 546 1,090 289 3,389 5,448
SUNCORP GROUP LIMITED NOTES TO THE CONSOLIDATED FINANCIAL STATEMENTS 77
20.1 LIFE POLICY LIABILITY ESTIMATION PROCESS
The Suncorp Group conducts its life insurance business in Australia through Suncorp Life & Superannuation Limited (SLSL) and in New Zealand through Asteron Life Limited (New Zealand) (ALLNZ). They are collectively referred to as the Life companies.
Policy liabilities in Australia have been calculated in accordance with APRA Prudential Standard LPS 340 Valuation of Policy Liabilities issued under section 230A(1) of the Life Act.
Policy liabilities in New Zealand have been calculated in accordance with Professional Standard Number 3, Determination of Life Insurance Policy Liabilities issued by the New Zealand Society of Actuaries.
The policy liability calculations are performed by actuarial personnel, using policy data, and are approved by the Appointed Actuary, Mr Joshua Corrigan (Fellow of the Actuaries Institute of Australia) for Australia and approved by the Appointed Actuary, Mr Daniel Wong (Fellow of the Actuaries Institute of Australia and Fellow of the New Zealand Society of Actuaries) for New Zealand.
The profit carriers for the major business types of life insurance contracts are as follows.
Business type Profit carrier
Conventional participating Supportable bonuses
Participating and non-participating investment account and allocated pension
Interest credits
Lump sum risk and accident cash back Expected premium payments
Disability income Expected benefit/claims payments (SLSL)
Expected premium payments (ALLNZ)
Other Expected benefit/claim payments
20.2 ACTUARIAL ASSUMPTIONS, JUDGMENTS AND ESTIMATES USED IN CALCULATING LIFE INSURANCE CONTRACT LIABILITIES
Experience for SLSL and ALLNZ is examined in detail on at least an annual basis, with assumptions set having regard to the Life companies’ experience, observed trends and future outlook. The key factors affecting the determination of the policy liabilities and the critical assumptions and judgments made are set out below:
• Investment earnings and discount rates: based on ten-year Australian and New Zealand Government bond yields. Adjustments made as necessary for participating contracts.
• Voluntary discontinuance: rates are based upon recent internal investigations. Allowance is made for cash withdrawals.
• Mortality – individual risk products: rates are based upon recent internal investigations. Rates are expressed as a multiple of standard mortality tables developed by the local actuarial bodies.
• Mortality – annuitants: rates are based upon recent internal investigations. Mortality rates for annuitants have been determined using the standard table IM/IF80 with adjustments for assumed future age-related improvements. Table IM/IF80 were developed by the Institute and Faculty of Actuaries based on UK annuitant lives experience from 1979 to 1982.
• Morbidity: rates are based on recent internal investigations. For total and permanent disablement policies, rates are expressed as a multiple of industry and population experience. For trauma policies, assumed incidence rates are based on Australian and New Zealand population statistics with adjustments to reflect experience and policy conditions.
For
per
sona
l use
onl
y

SUNCORP GROUP LIMITED NOTES TO THE CONSOLIDATED FINANCIAL STATEMENTS 78
The following table shows the ranges of the adjustments to the base industry tables, ranges of investment earnings and actual annual lapse rates for 2016 and 2015.
SLSL ALLNZ
2016 2015 2016 2015
% % % %
Investment earnings pre-tax for participating business 2.9 - 3.6 4.0 - 4.7 3.1 4.3
Risk free pre-tax discount rates for non-participating business 1.5 - 2.3 2.0 - 3.8 2.0 - 3.4 3.0 - 5.5
Annual lapse rate (voluntary discontinuance) 4 - 40 4 - 40 3 - 30 3 - 30
Mortality – individual risk products adjustment 50 - 121 50 - 121 60 - 120 65 - 120
Mortality – annuitants adjustment 60 60 73 66
Future improvements in mortality – annuitants adjustment 97.3 97.3 97.5 97.5
20.3 LIFE INSURANCE CONTRACT POLICY LIABILITIES
Note 2016 2015
$m $m
Best estimate liability
Value of future policy benefits1 6,188 5,310
Value of future expenses 2,544 2,183
Value of unrecouped acquisition expenses (1,001) (1,197)
Balance of future premiums (7,061) (5,567)
670 729
Value of future profits
Policyowner bonuses2 395 417
Shareholder profit margins 531 490
926 907
Total value of declared bonuses3 78 108
Total net life insurance policy liabilities 1,674 1,744
Gross policy liabilities ceded under reinsurance 20 461 476
Gross life insurance contract liabilities 20 2,135 2,220
Policy liabilities subject to capital guarantee 1,635 1,599
1 Future policy benefits include bonuses credited to policyowners in prior periods but exclude current period bonuses and future bonuses. Where business is valued by other than projection techniques, future policy benefits include the account balance.
2 Future bonuses exclude current period bonuses.
3 Declared bonuses are valued in accordance with APRA Prudential Standard LPS 340 Valuation of Policy Liabilities issued under Section 230A(1) of the Life Act
For
per
sona
l use
onl
y
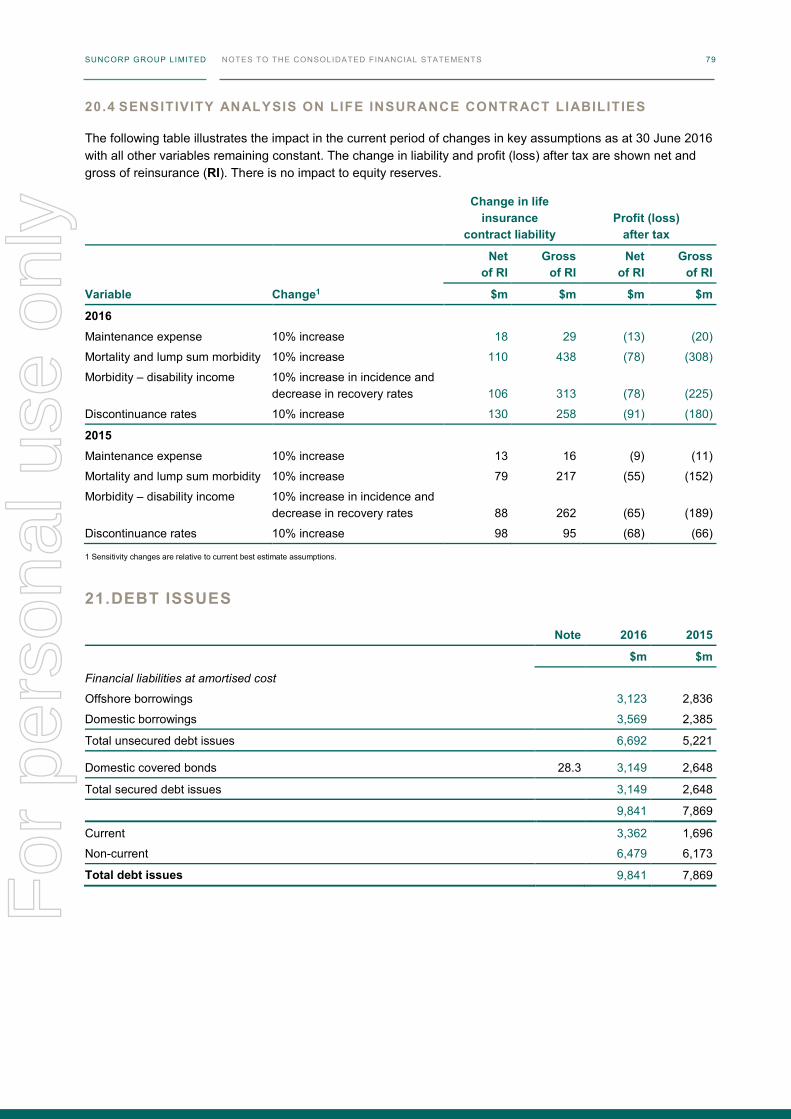
SUNCORP GROUP LIMITED NOTES TO THE CONSOLIDATED FINANCIAL STATEMENTS 78
The following table shows the ranges of the adjustments to the base industry tables, ranges of investment earnings and actual annual lapse rates for 2016 and 2015.
SLSL ALLNZ
2016 2015 2016 2015
% % % %
Investment earnings pre-tax for participating business 2.9 - 3.6 4.0 - 4.7 3.1 4.3
Risk free pre-tax discount rates for non-participating business 1.5 - 2.3 2.0 - 3.8 2.0 - 3.4 3.0 - 5.5
Annual lapse rate (voluntary discontinuance) 4 - 40 4 - 40 3 - 30 3 - 30
Mortality – individual risk products adjustment 50 - 121 50 - 121 60 - 120 65 - 120
Mortality – annuitants adjustment 60 60 73 66
Future improvements in mortality – annuitants adjustment 97.3 97.3 97.5 97.5
20.3 LIFE INSURANCE CONTRACT POLICY LIABILITIES
Note 2016 2015
$m $m
Best estimate liability
Value of future policy benefits1 6,188 5,310
Value of future expenses 2,544 2,183
Value of unrecouped acquisition expenses (1,001) (1,197)
Balance of future premiums (7,061) (5,567)
670 729
Value of future profits
Policyowner bonuses2 395 417
Shareholder profit margins 531 490
926 907
Total value of declared bonuses3 78 108
Total net life insurance policy liabilities 1,674 1,744
Gross policy liabilities ceded under reinsurance 20 461 476
Gross life insurance contract liabilities 20 2,135 2,220
Policy liabilities subject to capital guarantee 1,635 1,599
1 Future policy benefits include bonuses credited to policyowners in prior periods but exclude current period bonuses and future bonuses. Where business is valued by other than projection techniques, future policy benefits include the account balance.
2 Future bonuses exclude current period bonuses.
3 Declared bonuses are valued in accordance with APRA Prudential Standard LPS 340 Valuation of Policy Liabilities issued under Section 230A(1) of the Life Act
SUNCORP GROUP LIMITED NOTES TO THE CONSOLIDATED FINANCIAL STATEMENTS 79
20.4 SENSITIVITY ANALYSIS ON LIFE INSURANCE CONTRACT LIABILITIES
The following table illustrates the impact in the current period of changes in key assumptions as at 30 June 2016 with all other variables remaining constant. The change in liability and profit (loss) after tax are shown net and gross of reinsurance (RI). There is no impact to equity reserves.
Change in life insurance
contract liability Profit (loss)
after tax
Net
of RI Gross
of RI Net
of RI Gross
of RI
Variable Change1 $m $m $m $m
2016
Maintenance expense 10% increase 18 29 (13) (20)
Mortality and lump sum morbidity 10% increase 110 438 (78) (308)
Morbidity – disability income 10% increase in incidence and decrease in recovery rates 106 313 (78) (225)
Discontinuance rates 10% increase 130 258 (91) (180)
2015
Maintenance expense 10% increase 13 16 (9) (11)
Mortality and lump sum morbidity 10% increase 79 217 (55) (152)
Morbidity – disability income 10% increase in incidence and decrease in recovery rates 88 262 (65) (189)
Discontinuance rates 10% increase 98 95 (68) (66)
1 Sensitivity changes are relative to current best estimate assumptions.
21. DEBT ISSUES
Note 2016 2015
$m $m
Financial liabilities at amortised cost
Offshore borrowings 3,123 2,836
Domestic borrowings 3,569 2,385
Total unsecured debt issues 6,692 5,221
Domestic covered bonds 28.3 3,149 2,648
Total secured debt issues 3,149 2,648
9,841 7,869
Current 3,362 1,696
Non-current 6,479 6,173
Total debt issues 9,841 7,869
For
per
sona
l use
onl
y
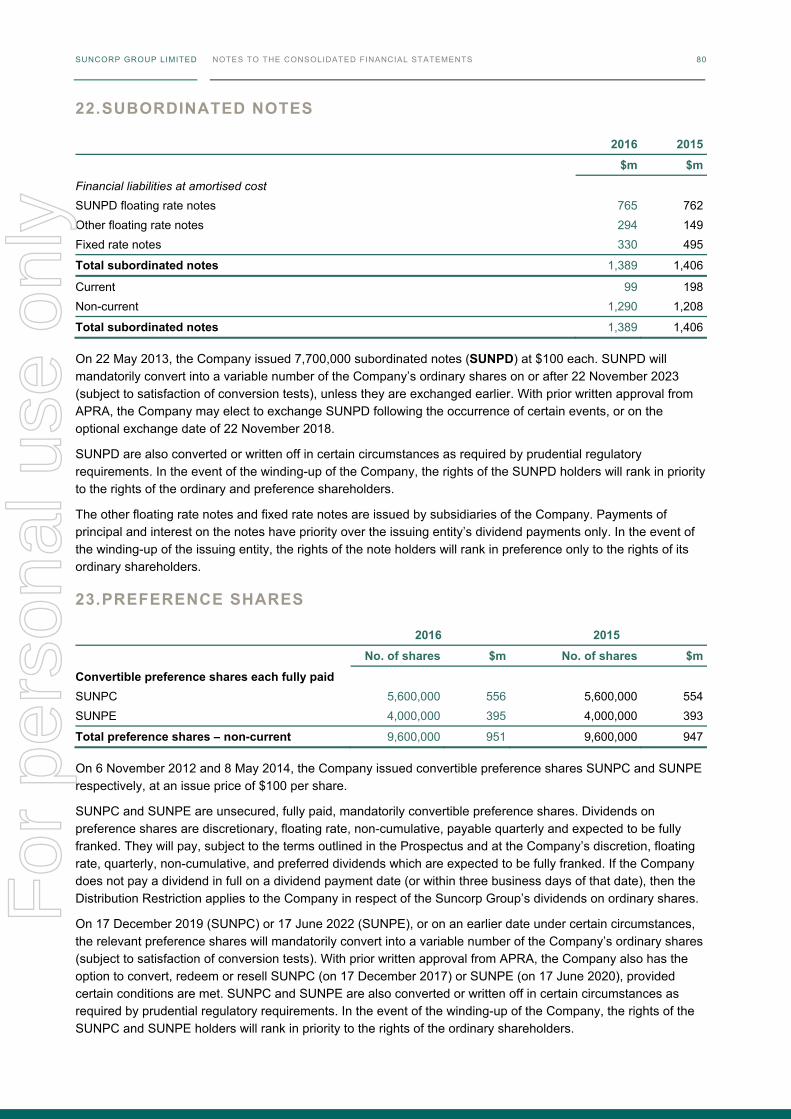
SUNCORP GROUP LIMITED NOTES TO THE CONSOLIDATED FINANCIAL STATEMENTS 80
22. SUBORDINATED NOTES
2016 2015
$m $m
Financial liabilities at amortised cost SUNPD floating rate notes 765 762 Other floating rate notes 294 149 Fixed rate notes 330 495
Total subordinated notes 1,389 1,406
Current 99 198 Non-current 1,290 1,208
Total subordinated notes 1,389 1,406
On 22 May 2013, the Company issued 7,700,000 subordinated notes (SUNPD) at $100 each. SUNPD will mandatorily convert into a variable number of the Company’s ordinary shares on or after 22 November 2023 (subject to satisfaction of conversion tests), unless they are exchanged earlier. With prior written approval from APRA, the Company may elect to exchange SUNPD following the occurrence of certain events, or on the optional exchange date of 22 November 2018.
SUNPD are also converted or written off in certain circumstances as required by prudential regulatory requirements. In the event of the winding-up of the Company, the rights of the SUNPD holders will rank in priority to the rights of the ordinary and preference shareholders.
The other floating rate notes and fixed rate notes are issued by subsidiaries of the Company. Payments of principal and interest on the notes have priority over the issuing entity’s dividend payments only. In the event of the winding-up of the issuing entity, the rights of the note holders will rank in preference only to the rights of its ordinary shareholders.
23. PREFERENCE SHARES
2016 2015 No. of shares $m No. of shares $m
Convertible preference shares each fully paid SUNPC 5,600,000 556 5,600,000 554 SUNPE 4,000,000 395 4,000,000 393
Total preference shares – non-current 9,600,000 951 9,600,000 947
On 6 November 2012 and 8 May 2014, the Company issued convertible preference shares SUNPC and SUNPE respectively, at an issue price of $100 per share.
SUNPC and SUNPE are unsecured, fully paid, mandatorily convertible preference shares. Dividends on preference shares are discretionary, floating rate, non-cumulative, payable quarterly and expected to be fully franked. They will pay, subject to the terms outlined in the Prospectus and at the Company’s discretion, floating rate, quarterly, non-cumulative, and preferred dividends which are expected to be fully franked. If the Company does not pay a dividend in full on a dividend payment date (or within three business days of that date), then the Distribution Restriction applies to the Company in respect of the Suncorp Group’s dividends on ordinary shares.
On 17 December 2019 (SUNPC) or 17 June 2022 (SUNPE), or on an earlier date under certain circumstances, the relevant preference shares will mandatorily convert into a variable number of the Company’s ordinary shares (subject to satisfaction of conversion tests). With prior written approval from APRA, the Company also has the option to convert, redeem or resell SUNPC (on 17 December 2017) or SUNPE (on 17 June 2020), provided certain conditions are met. SUNPC and SUNPE are also converted or written off in certain circumstances as required by prudential regulatory requirements. In the event of the winding-up of the Company, the rights of the SUNPC and SUNPE holders will rank in priority to the rights of the ordinary shareholders.
For
per
sona
l use
onl
y
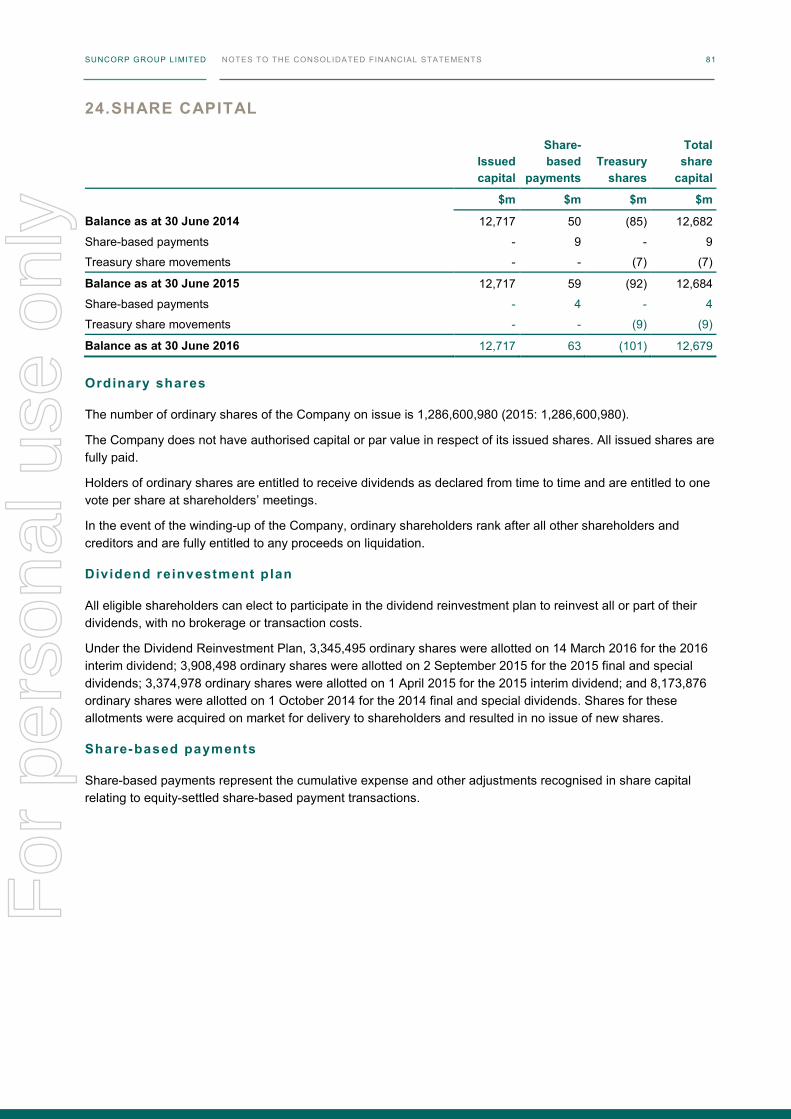
SUNCORP GROUP LIMITED NOTES TO THE CONSOLIDATED FINANCIAL STATEMENTS 80
22. SUBORDINATED NOTES
2016 2015
$m $m
Financial liabilities at amortised cost SUNPD floating rate notes 765 762 Other floating rate notes 294 149 Fixed rate notes 330 495
Total subordinated notes 1,389 1,406
Current 99 198 Non-current 1,290 1,208
Total subordinated notes 1,389 1,406
On 22 May 2013, the Company issued 7,700,000 subordinated notes (SUNPD) at $100 each. SUNPD will mandatorily convert into a variable number of the Company’s ordinary shares on or after 22 November 2023 (subject to satisfaction of conversion tests), unless they are exchanged earlier. With prior written approval from APRA, the Company may elect to exchange SUNPD following the occurrence of certain events, or on the optional exchange date of 22 November 2018.
SUNPD are also converted or written off in certain circumstances as required by prudential regulatory requirements. In the event of the winding-up of the Company, the rights of the SUNPD holders will rank in priority to the rights of the ordinary and preference shareholders.
The other floating rate notes and fixed rate notes are issued by subsidiaries of the Company. Payments of principal and interest on the notes have priority over the issuing entity’s dividend payments only. In the event of the winding-up of the issuing entity, the rights of the note holders will rank in preference only to the rights of its ordinary shareholders.
23. PREFERENCE SHARES
2016 2015 No. of shares $m No. of shares $m
Convertible preference shares each fully paid SUNPC 5,600,000 556 5,600,000 554 SUNPE 4,000,000 395 4,000,000 393
Total preference shares – non-current 9,600,000 951 9,600,000 947
On 6 November 2012 and 8 May 2014, the Company issued convertible preference shares SUNPC and SUNPE respectively, at an issue price of $100 per share.
SUNPC and SUNPE are unsecured, fully paid, mandatorily convertible preference shares. Dividends on preference shares are discretionary, floating rate, non-cumulative, payable quarterly and expected to be fully franked. They will pay, subject to the terms outlined in the Prospectus and at the Company’s discretion, floating rate, quarterly, non-cumulative, and preferred dividends which are expected to be fully franked. If the Company does not pay a dividend in full on a dividend payment date (or within three business days of that date), then the Distribution Restriction applies to the Company in respect of the Suncorp Group’s dividends on ordinary shares.
On 17 December 2019 (SUNPC) or 17 June 2022 (SUNPE), or on an earlier date under certain circumstances, the relevant preference shares will mandatorily convert into a variable number of the Company’s ordinary shares (subject to satisfaction of conversion tests). With prior written approval from APRA, the Company also has the option to convert, redeem or resell SUNPC (on 17 December 2017) or SUNPE (on 17 June 2020), provided certain conditions are met. SUNPC and SUNPE are also converted or written off in certain circumstances as required by prudential regulatory requirements. In the event of the winding-up of the Company, the rights of the SUNPC and SUNPE holders will rank in priority to the rights of the ordinary shareholders.
SUNCORP GROUP LIMITED NOTES TO THE CONSOLIDATED FINANCIAL STATEMENTS 81
24. SHARE CAPITAL
Issued capital
Share- based
payments Treasury
shares
Total share
capital
$m $m $m $m
Balance as at 30 June 2014 12,717 50 (85) 12,682
Share-based payments - 9 - 9
Treasury share movements - - (7) (7)
Balance as at 30 June 2015 12,717 59 (92) 12,684
Share-based payments - 4 - 4
Treasury share movements - - (9) (9)
Balance as at 30 June 2016 12,717 63 (101) 12,679
Ordinary shares
The number of ordinary shares of the Company on issue is 1,286,600,980 (2015: 1,286,600,980).
The Company does not have authorised capital or par value in respect of its issued shares. All issued shares are fully paid.
Holders of ordinary shares are entitled to receive dividends as declared from time to time and are entitled to one vote per share at shareholders’ meetings.
In the event of the winding-up of the Company, ordinary shareholders rank after all other shareholders and creditors and are fully entitled to any proceeds on liquidation.
Dividend reinvestment plan
All eligible shareholders can elect to participate in the dividend reinvestment plan to reinvest all or part of their dividends, with no brokerage or transaction costs.
Under the Dividend Reinvestment Plan, 3,345,495 ordinary shares were allotted on 14 March 2016 for the 2016 interim dividend; 3,908,498 ordinary shares were allotted on 2 September 2015 for the 2015 final and special dividends; 3,374,978 ordinary shares were allotted on 1 April 2015 for the 2015 interim dividend; and 8,173,876 ordinary shares were allotted on 1 October 2014 for the 2014 final and special dividends. Shares for these allotments were acquired on market for delivery to shareholders and resulted in no issue of new shares.
Share-based payments
Share-based payments represent the cumulative expense and other adjustments recognised in share capital relating to equity-settled share-based payment transactions.
For
per
sona
l use
onl
y
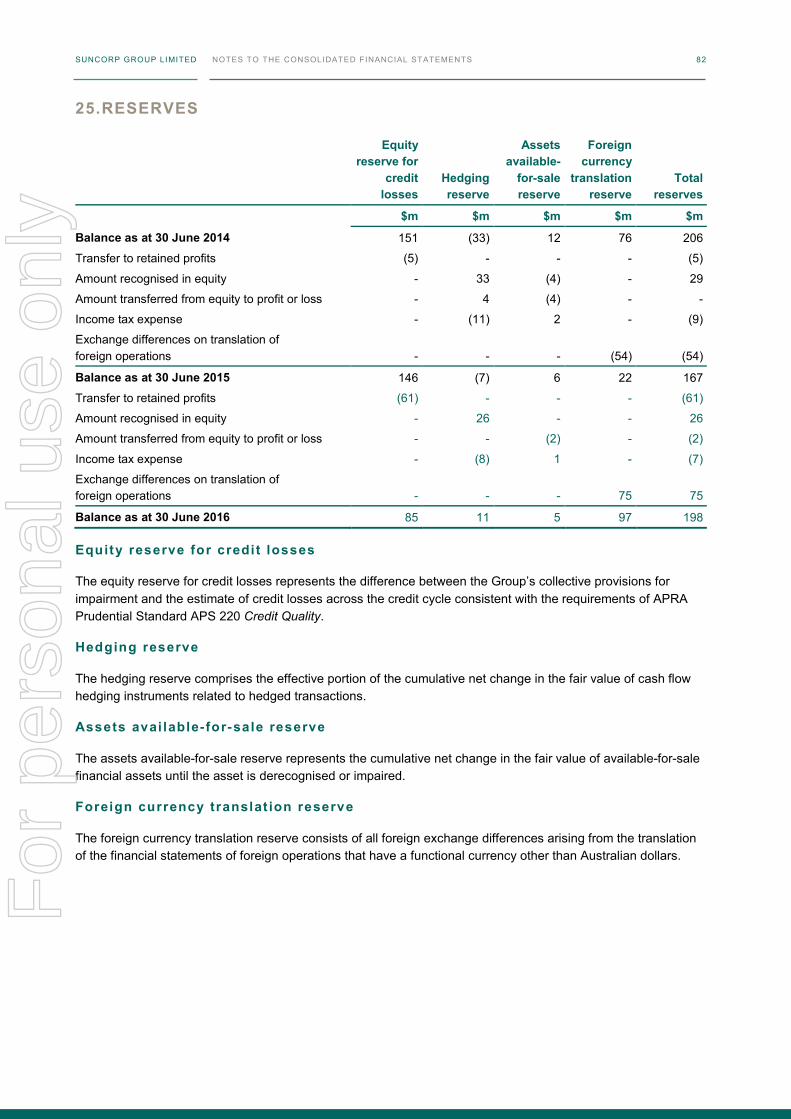
SUNCORP GROUP LIMITED NOTES TO THE CONSOLIDATED FINANCIAL STATEMENTS 82
25. RESERVES
Equity reserve for
credit losses
Hedging reserve
Assets available-
for-sale reserve
Foreign currency
translation reserve
Total reserves
$m $m $m $m $m
Balance as at 30 June 2014 151 (33) 12 76 206
Transfer to retained profits (5) - - - (5)
Amount recognised in equity - 33 (4) - 29
Amount transferred from equity to profit or loss - 4 (4) - -
Income tax expense - (11) 2 - (9)
Exchange differences on translation of foreign operations - - - (54) (54)
Balance as at 30 June 2015 146 (7) 6 22 167
Transfer to retained profits (61) - - - (61)
Amount recognised in equity - 26 - - 26
Amount transferred from equity to profit or loss - - (2) - (2)
Income tax expense - (8) 1 - (7)
Exchange differences on translation of foreign operations - - - 75 75
Balance as at 30 June 2016 85 11 5 97 198
Equity reserve for credit losses
The equity reserve for credit losses represents the difference between the Group’s collective provisions for impairment and the estimate of credit losses across the credit cycle consistent with the requirements of APRA Prudential Standard APS 220 Credit Quality.
Hedging reserve
The hedging reserve comprises the effective portion of the cumulative net change in the fair value of cash flow hedging instruments related to hedged transactions.
Assets avai lable-for-sale reserve
The assets available-for-sale reserve represents the cumulative net change in the fair value of available-for-sale financial assets until the asset is derecognised or impaired.
Foreign currency translat ion reserve
The foreign currency translation reserve consists of all foreign exchange differences arising from the translation of the financial statements of foreign operations that have a functional currency other than Australian dollars.
SUNCORP GROUP LIMITED NOTES TO THE CONSOLIDATED FINANCIAL STATEMENTS 83
26. GROUP CAPITAL MANAGEMENT
The capital management strategy of the Suncorp Group is to optimise shareholder value by managing the level, mix and use of capital resources. The primary objective is to ensure there are sufficient capital resources to maintain and grow the business, in accordance with risk appetite. The Suncorp Group’s Internal Capital Adequacy Assessment Process (ICAAP) provides the framework to ensure that the Suncorp Group as a whole, and each regulated entity, is capitalised to meet internal and external requirements. The Suncorp Group is subject to, and in compliance with, externally imposed capital requirements set and monitored by the APRA and the Reserve Bank of New Zealand.
The ICAAP is reviewed regularly and, where appropriate, adjustments are made to reflect changes in the capital needs and risk profile of the Suncorp Group. Capital targets are structured according to risk appetite, the business area regulatory framework and APRA’s non-operating holding company (NOHC) conditions. Details relating to classification of capital for regulatory purposes and the capital positions of key regulated entities at the reporting date are provided in section 8.3 of the Directors' Report.
APRA has released its standards for the supervision of conglomerate groups, although has not yet set an implementation date. The Suncorp Group has been operating under a NOHC structure since 2011, with associated NOHC Conditions from APRA having much in common with the proposed Level 3 conglomerate standards. The Suncorp Group is well placed to implement the requirements and does not expect material changes to the ICAAP as a result. As the NOHC, the Company holds capital in respect of the corporate service companies and a portion of the Suncorp Group’s target capital above that held within the insurance and banking businesses.
The NOHC Conditions include the following:
• the Suncorp Group is required to meet, at all times, the Level 3 Prudential Capital Requirement for Eligible Capital (and the Eligible Capital must satisfy certain requirements around the proportion of 'high quality' capital such as share capital and retained earnings)
• reductions in the Suncorp Group's capital base require APRA's written approval (for example, planned payment of dividends that exceed the prior 12 months earnings)
• the NOHC activities of the Company, the Bank NOHC, and Life group NOHC are limited and defined in scope
• compliance with certain APRA Prudential Standards; and
• the Company must ensure that where capital or funds are transferred within the Suncorp Group the original nature and quality of the capital or funds is maintained.
The Suncorp Group has established comprehensive policies and procedures to ensure compliance with the NOHC conditions.
The following table summarises the capital position as at the reporting date.
2016 2015
$m $m
Common Equity Tier 1 Capital 6,338 6,629
Additional Tier 1 Capital 960 960
Tier 1 Capital 7,298 7,589
Tier 2 Capital 1,562 1,587
Total Capital 8,860 9,176
Excess to Common Equity Tier 1 Capital Target (ex dividend) 346 570
Excess Total Capital to target (ex dividend) 677 978
For
per
sona
l use
onl
y
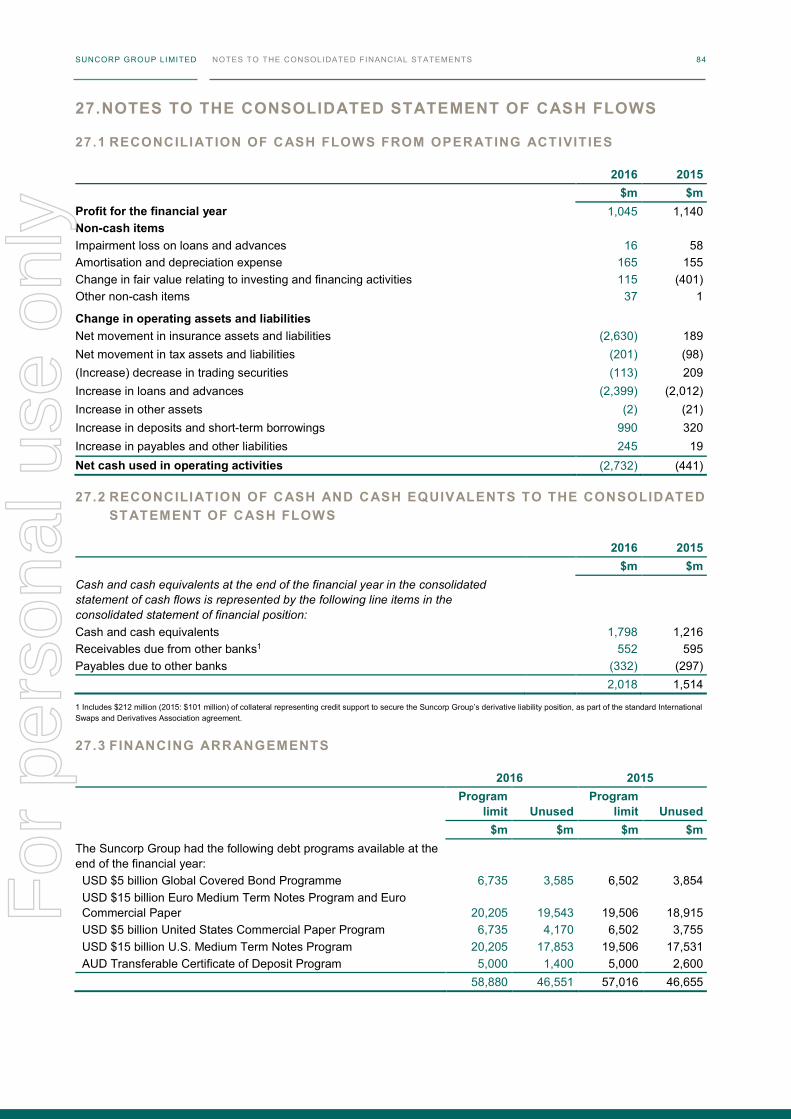
SUNCORP GROUP LIMITED NOTES TO THE CONSOLIDATED FINANCIAL STATEMENTS 84
27. NOTES TO THE CONSOLIDATED STATEMENT OF CASH FLOWS
27.1 RECONCILIATION OF CASH FLOWS FROM OPERATING ACTIVITIES
2016 2015 $m $m
Profit for the financial year 1,045 1,140 Non-cash items Impairment loss on loans and advances 16 58 Amortisation and depreciation expense 165 155 Change in fair value relating to investing and financing activities 115 (401) Other non-cash items 37 1
Change in operating assets and liabilities Net movement in insurance assets and liabilities (2,630) 189 Net movement in tax assets and liabilities (201) (98) (Increase) decrease in trading securities (113) 209 Increase in loans and advances (2,399) (2,012) Increase in other assets (2) (21) Increase in deposits and short-term borrowings 990 320 Increase in payables and other liabilities 245 19 Net cash used in operating activities (2,732) (441)
27.2 RECONCILIATION OF CASH AND CASH EQUIVALENTS TO THE CONSOLIDATED STATEMENT OF CASH FLOWS
2016 2015 $m $m
Cash and cash equivalents at the end of the financial year in the consolidated statement of cash flows is represented by the following line items in the consolidated statement of financial position: Cash and cash equivalents 1,798 1,216 Receivables due from other banks1 552 595 Payables due to other banks (332) (297) 2,018 1,514
1 Includes $212 million (2015: $101 million) of collateral representing credit support to secure the Suncorp Group’s derivative liability position, as part of the standard International Swaps and Derivatives Association agreement.
27.3 FINANCING ARRANGEMENTS
2016 2015
Program
limit Unused Program
limit Unused $m $m $m $m
The Suncorp Group had the following debt programs available at the end of the financial year: USD $5 billion Global Covered Bond Programme 6,735 3,585 6,502 3,854 USD $15 billion Euro Medium Term Notes Program and Euro Commercial Paper 20,205 19,543 19,506 18,915 USD $5 billion United States Commercial Paper Program 6,735 4,170 6,502 3,755 USD $15 billion U.S. Medium Term Notes Program 20,205 17,853 19,506 17,531 AUD Transferable Certificate of Deposit Program 5,000 1,400 5,000 2,600 58,880 46,551 57,016 46,655
For
per
sona
l use
onl
y
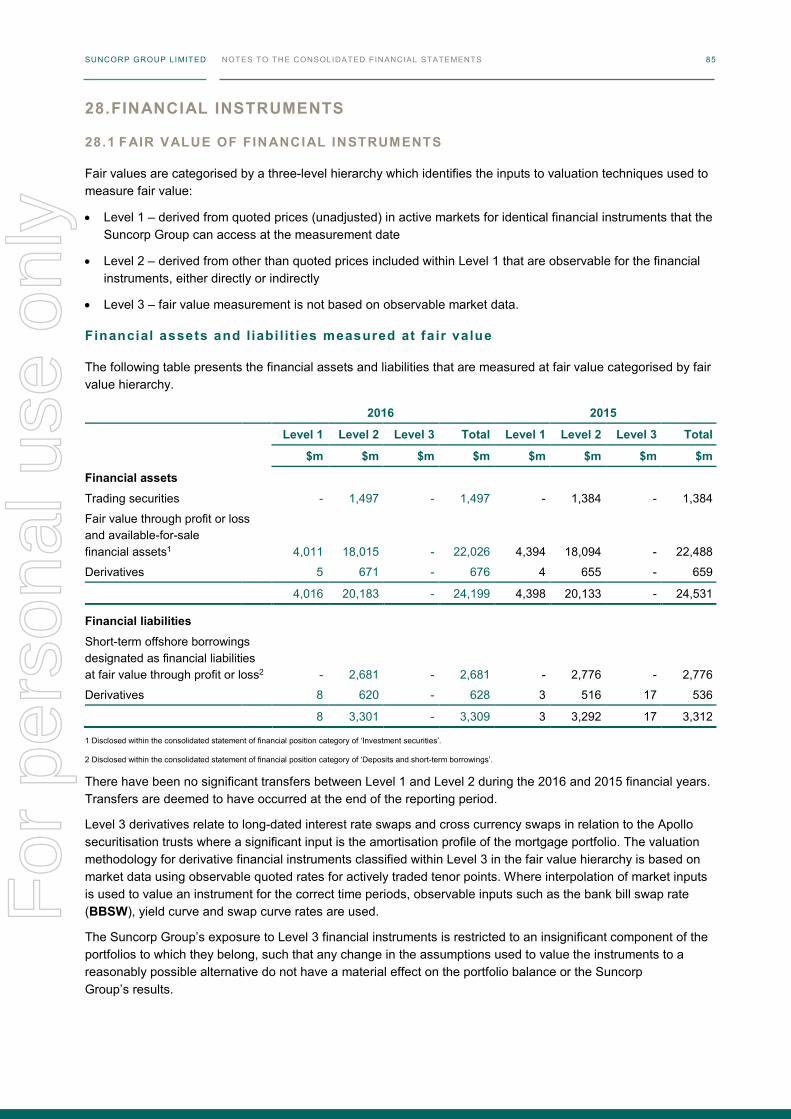
SUNCORP GROUP LIMITED NOTES TO THE CONSOLIDATED FINANCIAL STATEMENTS 84
27. NOTES TO THE CONSOLIDATED STATEMENT OF CASH FLOWS
27.1 RECONCILIATION OF CASH FLOWS FROM OPERATING ACTIVITIES
2016 2015 $m $m
Profit for the financial year 1,045 1,140 Non-cash items Impairment loss on loans and advances 16 58 Amortisation and depreciation expense 165 155 Change in fair value relating to investing and financing activities 115 (401) Other non-cash items 37 1
Change in operating assets and liabilities Net movement in insurance assets and liabilities (2,630) 189 Net movement in tax assets and liabilities (201) (98) (Increase) decrease in trading securities (113) 209 Increase in loans and advances (2,399) (2,012) Increase in other assets (2) (21) Increase in deposits and short-term borrowings 990 320 Increase in payables and other liabilities 245 19 Net cash used in operating activities (2,732) (441)
27.2 RECONCILIATION OF CASH AND CASH EQUIVALENTS TO THE CONSOLIDATED STATEMENT OF CASH FLOWS
2016 2015 $m $m
Cash and cash equivalents at the end of the financial year in the consolidated statement of cash flows is represented by the following line items in the consolidated statement of financial position: Cash and cash equivalents 1,798 1,216 Receivables due from other banks1 552 595 Payables due to other banks (332) (297) 2,018 1,514
1 Includes $212 million (2015: $101 million) of collateral representing credit support to secure the Suncorp Group’s derivative liability position, as part of the standard International Swaps and Derivatives Association agreement.
27.3 FINANCING ARRANGEMENTS
2016 2015
Program
limit Unused Program
limit Unused $m $m $m $m
The Suncorp Group had the following debt programs available at the end of the financial year: USD $5 billion Global Covered Bond Programme 6,735 3,585 6,502 3,854 USD $15 billion Euro Medium Term Notes Program and Euro Commercial Paper 20,205 19,543 19,506 18,915 USD $5 billion United States Commercial Paper Program 6,735 4,170 6,502 3,755 USD $15 billion U.S. Medium Term Notes Program 20,205 17,853 19,506 17,531 AUD Transferable Certificate of Deposit Program 5,000 1,400 5,000 2,600 58,880 46,551 57,016 46,655
SUNCORP GROUP LIMITED NOTES TO THE CONSOLIDATED FINANCIAL STATEMENTS 85
28. FINANCIAL INSTRUMENTS
28.1 FAIR VALUE OF FINANCIAL INSTRUMENTS
Fair values are categorised by a three-level hierarchy which identifies the inputs to valuation techniques used to measure fair value:
• Level 1 – derived from quoted prices (unadjusted) in active markets for identical financial instruments that the Suncorp Group can access at the measurement date
• Level 2 – derived from other than quoted prices included within Level 1 that are observable for the financial instruments, either directly or indirectly
• Level 3 – fair value measurement is not based on observable market data.
Financial assets and l iabi l it ies measured at fair value
The following table presents the financial assets and liabilities that are measured at fair value categorised by fair value hierarchy.
2016 2015
Level 1 Level 2 Level 3 Total Level 1 Level 2 Level 3 Total
$m $m $m $m $m $m $m $m
Financial assets
Trading securities - 1,497 - 1,497 - 1,384 - 1,384
Fair value through profit or loss and available-for-sale financial assets1 4,011 18,015 - 22,026 4,394 18,094 - 22,488
Derivatives 5 671 - 676 4 655 - 659
4,016 20,183 - 24,199 4,398 20,133 - 24,531
Financial liabilities
Short-term offshore borrowings designated as financial liabilities at fair value through profit or loss2 - 2,681 - 2,681 - 2,776 - 2,776
Derivatives 8 620 - 628 3 516 17 536
8 3,301 - 3,309 3 3,292 17 3,312
1 Disclosed within the consolidated statement of financial position category of ‘Investment securities’.
2 Disclosed within the consolidated statement of financial position category of ‘Deposits and short-term borrowings’.
There have been no significant transfers between Level 1 and Level 2 during the 2016 and 2015 financial years. Transfers are deemed to have occurred at the end of the reporting period.
Level 3 derivatives relate to long-dated interest rate swaps and cross currency swaps in relation to the Apollo securitisation trusts where a significant input is the amortisation profile of the mortgage portfolio. The valuation methodology for derivative financial instruments classified within Level 3 in the fair value hierarchy is based on market data using observable quoted rates for actively traded tenor points. Where interpolation of market inputs is used to value an instrument for the correct time periods, observable inputs such as the bank bill swap rate (BBSW), yield curve and swap curve rates are used.
The Suncorp Group’s exposure to Level 3 financial instruments is restricted to an insignificant component of the portfolios to which they belong, such that any change in the assumptions used to value the instruments to a reasonably possible alternative do not have a material effect on the portfolio balance or the Suncorp Group’s results.
For
per
sona
l use
onl
y
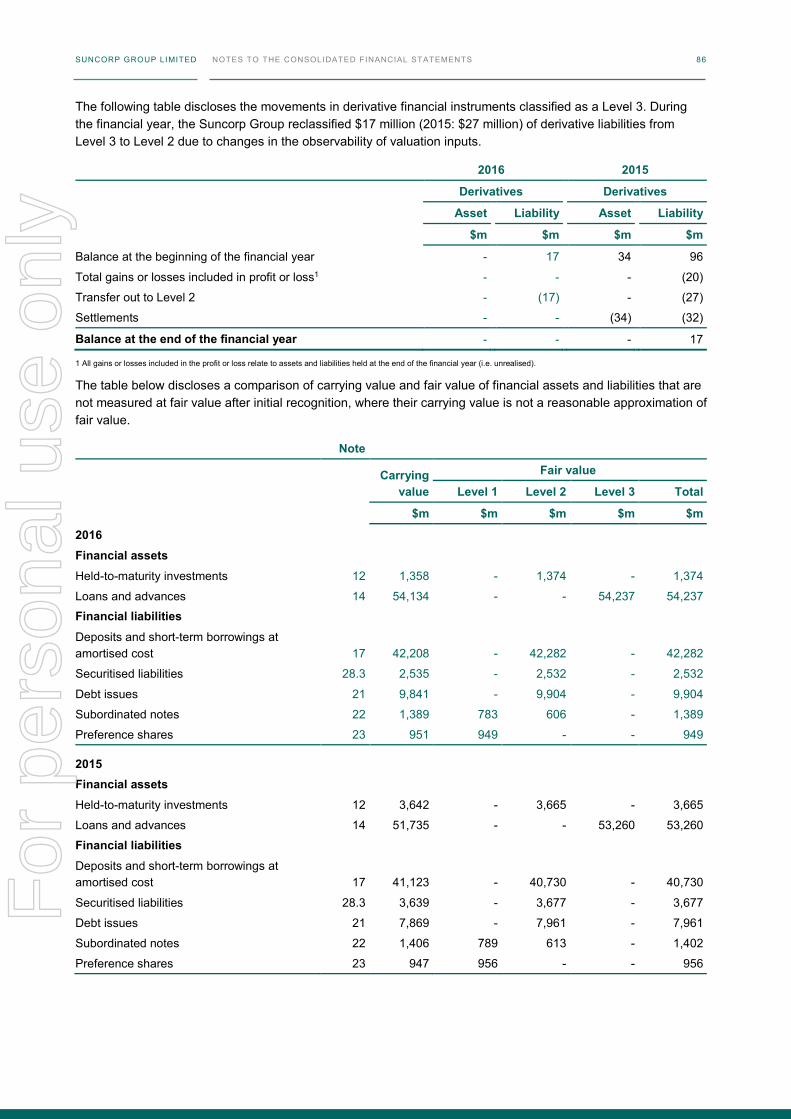
SUNCORP GROUP LIMITED NOTES TO THE CONSOLIDATED FINANCIAL STATEMENTS 86
The following table discloses the movements in derivative financial instruments classified as a Level 3. During the financial year, the Suncorp Group reclassified $17 million (2015: $27 million) of derivative liabilities from Level 3 to Level 2 due to changes in the observability of valuation inputs.
2016 2015
Derivatives Derivatives
Asset Liability Asset Liability
$m $m $m $m
Balance at the beginning of the financial year - 17 34 96
Total gains or losses included in profit or loss1 - - - (20)
Transfer out to Level 2 - (17) - (27)
Settlements - - (34) (32)
Balance at the end of the financial year - - - 17
1 All gains or losses included in the profit or loss relate to assets and liabilities held at the end of the financial year (i.e. unrealised).
The table below discloses a comparison of carrying value and fair value of financial assets and liabilities that are not measured at fair value after initial recognition, where their carrying value is not a reasonable approximation of fair value.
Note
Carrying value
Fair value
Level 1 Level 2 Level 3 Total
$m $m $m $m $m
2016
Financial assets
Held-to-maturity investments 12 1,358 - 1,374 - 1,374
Loans and advances 14 54,134 - - 54,237 54,237
Financial liabilities
Deposits and short-term borrowings at amortised cost 17 42,208 - 42,282 - 42,282
Securitised liabilities 28.3 2,535 - 2,532 - 2,532
Debt issues 21 9,841 - 9,904 - 9,904
Subordinated notes 22 1,389 783 606 - 1,389
Preference shares 23 951 949 - - 949
2015
Financial assets
Held-to-maturity investments 12 3,642 - 3,665 - 3,665
Loans and advances 14 51,735 - - 53,260 53,260
Financial liabilities
Deposits and short-term borrowings at amortised cost 17 41,123 - 40,730 - 40,730
Securitised liabilities 28.3 3,639 - 3,677 - 3,677
Debt issues 21 7,869 - 7,961 - 7,961
Subordinated notes 22 1,406 789 613 - 1,402
Preference shares 23 947 956 - - 956
For
per
sona
l use
onl
y
SUNCORP GROUP LIMITED NOTES TO THE CONSOLIDATED FINANCIAL STATEMENTS 86
The following table discloses the movements in derivative financial instruments classified as a Level 3. During the financial year, the Suncorp Group reclassified $17 million (2015: $27 million) of derivative liabilities from Level 3 to Level 2 due to changes in the observability of valuation inputs.
2016 2015
Derivatives Derivatives
Asset Liability Asset Liability
$m $m $m $m
Balance at the beginning of the financial year - 17 34 96
Total gains or losses included in profit or loss1 - - - (20)
Transfer out to Level 2 - (17) - (27)
Settlements - - (34) (32)
Balance at the end of the financial year - - - 17
1 All gains or losses included in the profit or loss relate to assets and liabilities held at the end of the financial year (i.e. unrealised).
The table below discloses a comparison of carrying value and fair value of financial assets and liabilities that are not measured at fair value after initial recognition, where their carrying value is not a reasonable approximation of fair value.
Note
Carrying value
Fair value
Level 1 Level 2 Level 3 Total
$m $m $m $m $m
2016
Financial assets
Held-to-maturity investments 12 1,358 - 1,374 - 1,374
Loans and advances 14 54,134 - - 54,237 54,237
Financial liabilities
Deposits and short-term borrowings at amortised cost 17 42,208 - 42,282 - 42,282
Securitised liabilities 28.3 2,535 - 2,532 - 2,532
Debt issues 21 9,841 - 9,904 - 9,904
Subordinated notes 22 1,389 783 606 - 1,389
Preference shares 23 951 949 - - 949
2015
Financial assets
Held-to-maturity investments 12 3,642 - 3,665 - 3,665
Loans and advances 14 51,735 - - 53,260 53,260
Financial liabilities
Deposits and short-term borrowings at amortised cost 17 41,123 - 40,730 - 40,730
Securitised liabilities 28.3 3,639 - 3,677 - 3,677
Debt issues 21 7,869 - 7,961 - 7,961
Subordinated notes 22 1,406 789 613 - 1,402
Preference shares 23 947 956 - - 956
SUNCORP GROUP LIMITED NOTES TO THE CONSOLIDATED FINANCIAL STATEMENTS 87
Significant assumptions and estimates used to determine the fair values are described below.
Financial assets
Fair value of held-to-maturity investment securities are determined based on the quoted market price where available. Where quoted prices are not available, alternative valuation techniques are used. Valuation techniques employed include discounted cash flow analysis using expected future cash flows and a market-related discount rate.
The carrying value of loans and advances is net of specific and collective provisions for impairment. For variable rate loans, excluding impaired loans, the carrying amount is considered a reasonable estimate of fair value. The fair value for fixed rate loans is calculated by utilising discounted cash flow models to determine the net present value of the portfolio future principal and interest cash flows, based on the interest rate repricing of the loans. The discount rates applied are based on the rates offered by the Suncorp Group on current products with similar maturity dates.
Financial liabilities
The carrying value for non-interest-bearing, call and variable rate deposits, and fixed rate deposits repricing within six months included in deposits and short-term borrowings is considered a reasonable estimate of their fair value. Discounted cash flow models are used to calculate the fair value of other term deposits included in deposits and short-term borrowings based upon deposit type and related maturities.
The fair value of securitised liabilities, debt issues, subordinated notes and preference shares are calculated based on either the quoted market prices at reporting date or, where quoted market prices are not available, a discounted cash flow model using a yield curve appropriate to the remaining maturity of the instrument.
28.2 MASTER NETTING OR SIMILAR ARRANGEMENTS
The Group has in place the following master netting or similar arrangements at reporting date.
Derivative assets and l iabi l it ies
• Offsetting has been applied to derivatives in the consolidated statement of financial position where the Suncorp Group has a legally enforceable right to set-off and there is an intention to settle on a net basis.
• Certain derivatives are subject to the International Swaps and Derivatives Association (ISDA) Master Agreement and other similar master netting arrangements. These arrangements contractually bind the Suncorp Group and the counterparty to apply close out netting across all outstanding transactions only if either party defaults or other pre-agreed termination events occur. As such, they do not meet the criteria for offsetting in the consolidated statement of financial position.
• The cash collateral pledged or received is subject to ISDA Credit Support Annex and other standard industry terms.
Amounts due from and to reinsurers
• Some reinsurance treaties of the Suncorp Group require netting arrangements whereby the receivables from and payable to reinsurers are settled on a net basis. As such, the Suncorp Group has applied offsetting in the consolidated statement of financial position.
• The collateral received is subject to terms and conditions of the respective reinsurance treaties and provides regulatory capital relief on the Suncorp Group's credit exposures to reinsurers. F
or p
erso
nal u
se o
nly
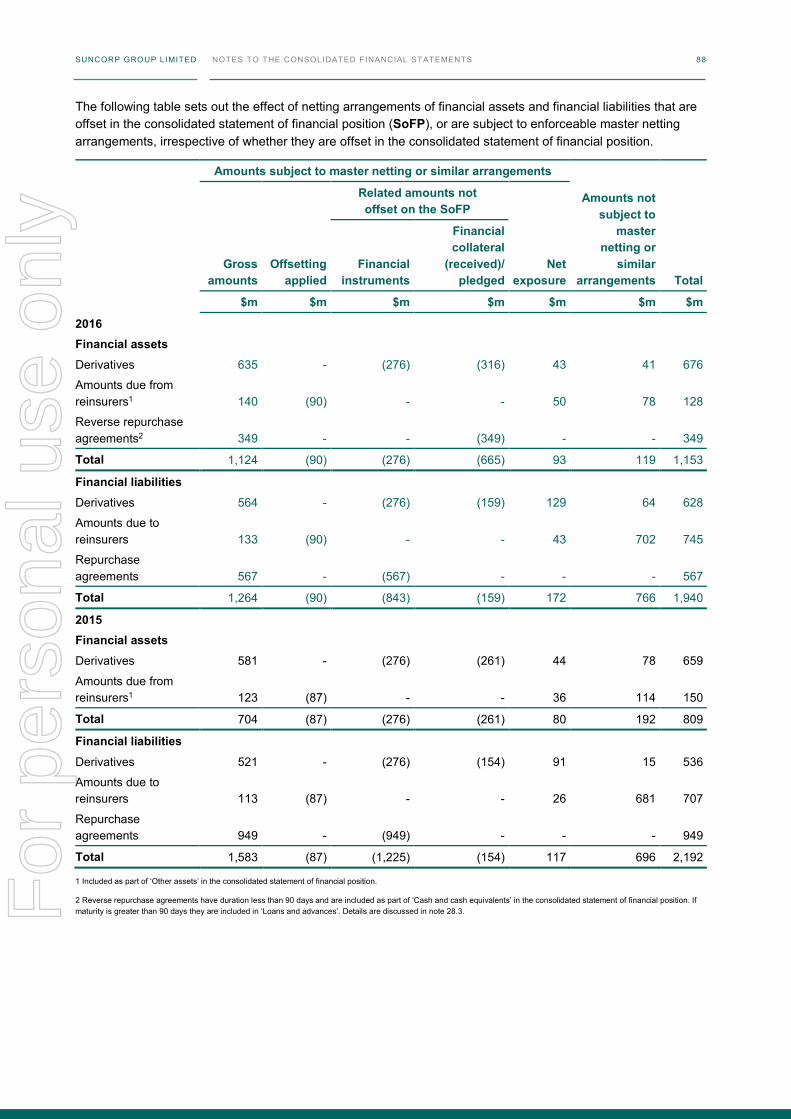
SUNCORP GROUP LIMITED NOTES TO THE CONSOLIDATED FINANCIAL STATEMENTS 88
The following table sets out the effect of netting arrangements of financial assets and financial liabilities that are offset in the consolidated statement of financial position (SoFP), or are subject to enforceable master netting arrangements, irrespective of whether they are offset in the consolidated statement of financial position.
Amounts subject to master netting or similar arrangements
Amounts not subject to
master netting or
similar arrangements Total
Gross amounts
Offsetting applied
Related amounts not offset on the SoFP
Net exposure
Financial instruments
Financial collateral
(received)/ pledged
$m $m $m $m $m $m $m
2016
Financial assets
Derivatives 635 - (276) (316) 43 41 676
Amounts due from reinsurers1 140 (90) - - 50 78 128
Reverse repurchase agreements2 349 - - (349) - - 349
Total 1,124 (90) (276) (665) 93 119 1,153
Financial liabilities
Derivatives 564 - (276) (159) 129 64 628
Amounts due to reinsurers 133 (90) - - 43 702 745
Repurchase agreements 567 - (567) - - - 567
Total 1,264 (90) (843) (159) 172 766 1,940
2015
Financial assets
Derivatives 581 - (276) (261) 44 78 659
Amounts due from reinsurers1 123 (87) - - 36 114 150
Total 704 (87) (276) (261) 80 192 809
Financial liabilities
Derivatives 521 - (276) (154) 91 15 536
Amounts due to reinsurers 113 (87) - - 26 681 707
Repurchase agreements 949 - (949) - - - 949
Total 1,583 (87) (1,225) (154) 117 696 2,192
1 Included as part of ‘Other assets’ in the consolidated statement of financial position.
2 Reverse repurchase agreements have duration less than 90 days and are included as part of ‘Cash and cash equivalents’ in the consolidated statement of financial position. If maturity is greater than 90 days they are included in ‘Loans and advances’. Details are discussed in note 28.3.
For
per
sona
l use
onl
y
SUNCORP GROUP LIMITED NOTES TO THE CONSOLIDATED FINANCIAL STATEMENTS 88
The following table sets out the effect of netting arrangements of financial assets and financial liabilities that are offset in the consolidated statement of financial position (SoFP), or are subject to enforceable master netting arrangements, irrespective of whether they are offset in the consolidated statement of financial position.
Amounts subject to master netting or similar arrangements
Amounts not subject to
master netting or
similar arrangements Total
Gross amounts
Offsetting applied
Related amounts not offset on the SoFP
Net exposure
Financial instruments
Financial collateral
(received)/ pledged
$m $m $m $m $m $m $m
2016
Financial assets
Derivatives 635 - (276) (316) 43 41 676
Amounts due from reinsurers1 140 (90) - - 50 78 128
Reverse repurchase agreements2 349 - - (349) - - 349
Total 1,124 (90) (276) (665) 93 119 1,153
Financial liabilities
Derivatives 564 - (276) (159) 129 64 628
Amounts due to reinsurers 133 (90) - - 43 702 745
Repurchase agreements 567 - (567) - - - 567
Total 1,264 (90) (843) (159) 172 766 1,940
2015
Financial assets
Derivatives 581 - (276) (261) 44 78 659
Amounts due from reinsurers1 123 (87) - - 36 114 150
Total 704 (87) (276) (261) 80 192 809
Financial liabilities
Derivatives 521 - (276) (154) 91 15 536
Amounts due to reinsurers 113 (87) - - 26 681 707
Repurchase agreements 949 - (949) - - - 949
Total 1,583 (87) (1,225) (154) 117 696 2,192
1 Included as part of ‘Other assets’ in the consolidated statement of financial position.
2 Reverse repurchase agreements have duration less than 90 days and are included as part of ‘Cash and cash equivalents’ in the consolidated statement of financial position. If maturity is greater than 90 days they are included in ‘Loans and advances’. Details are discussed in note 28.3.
SUNCORP GROUP LIMITED NOTES TO THE CONSOLIDATED FINANCIAL STATEMENTS 89
28.3 TRANSFERS OF FINANCIAL ASSETS AND COLLATERAL ACCEPTED AS SECURITY FOR ASSETS
Transferred financial assets continue to be recognised in the consolidated statement of financial position if the Group is deemed to have retained substantially all of the risks and rewards associated with the financial assets transferred. This arises when the Suncorp Group enters into repurchase agreements and conducts covered bond and securitisation programs.
Repurchase agreements
The Group enters into repurchase agreements involving the sale of interest-bearing securities in exchange for cash and simultaneously agreeing to buy back the interest-bearing securities at a pre-agreed price on a future date. In the consolidated statement of financial position, the interest-bearing securities transferred are included in ‘Trading securities’ and ‘Investment securities' and the obligation to repurchase is included in ‘Deposits and short-term borrowings' or 'Payables and other liabilities'.
Reverse repurchase agreements
Collateral has been accepted in relation to reverse repurchase agreements. The fair value of collateral accepted as security for assets is $353 million (2015: $nil) against carrying amount of $349 million (2015: $nil). These transactions are governed by standard industry agreements.
Covered bonds
Suncorp-Metway Limited (SML) conducts a covered bond program whereby it issues covered bonds guaranteed by the Covered Bond Guarantor and are secured over a covered pool which consists of loans and advances. This cover pool of eligible loans and advances (covered pool assets) is sold by SML to a special purpose trust, which guarantees the covered bonds. The Covered Bond Guarantor can take possession of the cover pool under certain events. In the event of default by SML, the covered bond holders have claim against both the cover pool and SML. SML receives the residual income of the special purpose trust after all payments due to covered bond holders have been met. In the consolidated statement of financial position, the covered pool assets transferred are included in ‘Loans and advances’ and the covered bonds issued are included in ‘Debt issues’.
Securit isation programs
The Suncorp Group conducts a loan securitisation program whereby housing mortgage loans are packaged and sold to special purpose securitisation trusts known as the Apollo Trusts (Trusts). The Trusts fund their purchase of the loans by issuing floating-rate pass-through debt securities. The Suncorp Group receives residual income from the Trusts after all payments to security holders and costs of the program have been met. The Suncorp Group does not stand behind the capital value or the performance of the securities or the assets of the Trusts, and it does not guarantee the payment of interest or the repayment of principal due on the securities. The loans subject to the securitisation program have been pledged as security for the securities issued by the Trusts, and as such, the Suncorp Group cannot use these assets to settle the liabilities of the Suncorp Group. The Suncorp Group is not obliged to support any losses that may be suffered by investors and does not intend to provide such support. In the consolidated statement of financial position, the loans transferred are included in ‘Loans and advances’ and the securitisation securities issued are included in ‘Securitisation liabilities’.
For
per
sona
l use
onl
y

SUNCORP GROUP LIMITED NOTES TO THE CONSOLIDATED FINANCIAL STATEMENTS 90
The following table sets out the carrying amount of the transferred financial assets and the associated liability at the reporting date.
2016 2015
Repurchase agreements
Covered bonds
Securiti-sation
Repurchase agreements
Covered bonds
Securiti-sation
$m $m $m $m $m $m Carrying amount of transferred financial assets 570 3,836 2,712 951 3,008 3,800 Carrying amount of associated financial liabilities 567 3,149 2,535 949 2,648 3,639 For those liabilities that have recourse only to the transferred assets: Fair value of transferred financial assets 570 n/a 2,713 951 n/a 3,818 Fair value of associated financial liabilities 567 n/a 2,532 949 n/a 3,677 Net position 3 181 2 141
Note: n/a = not applicable
29. RISK MANAGEMENT OBJECTIVES AND STRUCTURE
The Board and management recognise that effective risk management is critical to the achievement of the Suncorp Group’s objectives. The Board Risk Committee (Risk Committee) has delegated authority from the Board to oversee the adequacy and effectiveness of the risk management frameworks and processes within the Suncorp Group.
An Enterprise Risk Management Framework (ERMF) is in place for the Suncorp Group. It is subject to an annual review, updated for material changes as they occur and is approved by the Board. The ERMF comprises:
• the Suncorp Group's risk appetite framework and its link to strategic business and capital plans
• accountabilities and governance arrangements for the management of risk within the Three Lines of Defence model; and
• the risk management process.
The Three Lines of Defence model of accountability involves:
Line of defence Responsibility of Accountable for First – Manage risk and comply with Suncorp Group frameworks, policies and risk appetite
All business areas (and staff)
• Identify and manage the risks inherent in their operations • Ensure compliance with all legal and regulatory
requirements and Suncorp Group policies • Promptly escalate any significant actual and emerging
risks for management attention. Second – Independent functions own and monitor the application of risk frameworks, and measure and report on risk performance and compliance
All risk functions (Suncorp Group and business units)
• Design, implement and manage the ongoing maintenance of Suncorp Group risk frameworks and related policies
• Advise and partner with the business in the design and execution of risk frameworks and practices
• Develop, apply and execute business units' risk frameworks that are consistent with the Suncorp Group for the respective business areas
• Facilitate the reporting of the appropriateness and quality of risk management.
Third – Independent assurance over internal controls and risk management practices
Internal auditors • Decides the level and extent of independent testing required to verify the efficacy of internal controls
• Validates the overall risk framework • Provides assurance that the risk management practices
are functioning as intended.
SUNCORP GROUP LIMITED NOTES TO THE CONSOLIDATED FINANCIAL STATEMENTS 91
The Board has delegated authorities and limits to the CEO & Managing Director to manage the business. Management recommends to the Board, and the Board has approved, various frameworks, policies and limits relating to the key categories of risk faced by the Suncorp Group within the CEO & Managing Director’s authorities and limits.
The Senior Leadership Team, comprising the CEO & Managing Director, Line of Business CEOs and all Senior Executives, provides executive oversight and direction-setting across the Suncorp Group, taking risk considerations into account. The Chief Risk and Legal Officer, a member of the Senior Leadership Team, is charged with the overall accountability for both the ERMF and risk management capability.
The Suncorp Group has in place a number of Management Committees, each with its own charter, to execute specific responsibilities within the risk framework. Management asset and liability committees are in place to provide effective governance over aspects of the risk framework designed to optimise the long-term returns achieved by asset portfolios within the risk appetite or parameters established by the Board.
APRA-regulated entities prepare Risk Management Strategies (RMS) approved by the Risk Committee and submit these to APRA annually. The RMS describe the strategy adopted by the Board and management for managing risk within these entities, including risk appetite, policies, procedures, management responsibilities and controls.
The key risks addressed by the ERMF are defined below.
Key risks Definition Counterparty risk (Credit risk)
The risk to each party to a contract that a counterparty will not meet its financial obligations in accordance with agreed terms.
Liquidity risk The risk that the Suncorp Group will be unable to service its cash flow obligations today or in the future.
Market risk The risk of unfavourable changes in foreign exchange rates, interest rates, equity prices, credit spreads, commodity prices, and market volatilities.
Asset and liability risk The risk to earnings and capital from mismatches between assets and liabilities with varying maturity and repricing profiles and from mismatches in term.
Insurance risk The risk of financial loss and the inability to meet liabilities due to inadequate or inappropriate insurance product design, pricing, underwriting, concentration risk, reserving, claims management or reinsurance management.
Operational risks The risk of financial loss resulting from inadequate or failed internal processes, people and systems or from external events. This includes legal risk but excludes strategic and reputational risks.
Compliance risks The risk of legal or regulatory sanctions, financial loss, or loss to reputation which the Suncorp Group may suffer as a result of its failure to comply with all applicable regulations, codes of conduct and good practice standards.
Strategic risks The risk that the Suncorp Group’s business model or strategy is not viable due to adverse changes in the business environment.
The Suncorp Group is exposed to the following categories of market risk.
Categories of market risk Definition Foreign exchange (FX) risk The risk of an asset or liability’s value changing unfavourably due to changes in
currency exchange rates. Interest rate risk The risk of loss of current and future earnings and unfavourable movements in the
value of interest-bearing assets and liabilities from changes in interest rates. Equity risk The risk of loss of current and future earnings and unfavourable movement in the
value of investment in equity instruments from adverse movements in equity prices. Credit spread risk Credit spread is the difference in yield due to difference in credit quality. This is the
risk of loss of current and future earnings and unfavourable movement in the value of investments from changes in the credit spread as determined by capital market sentiment or factors affecting all issuers in the market and not necessarily due to factors specific to an individual issuer.
For
per
sona
l use
onl
y

SUNCORP GROUP LIMITED NOTES TO THE CONSOLIDATED FINANCIAL STATEMENTS 92
Further discussions on the application of the Suncorp Group’s risk management practices are presented in the following sections:
• note 30 insurance risk management
• note 31 risk management for financial instruments: credit, liquidity and market risks; and
• note 13 derivative financial instruments.
30. INSURANCE RISK MANAGEMENT
30.1 POLICIES AND PRACTICES FOR MITIGATING INSURANCE RISK
Risk appetite statements are in place and controls are implemented to manage the following components of insurance risk:
• pricing, including pricing strategies, technical pricing and pricing adequacy reviews
• roles and responsibilities for pricing, the development and approval of new products and changes to existing products
• processes that identify and respond to changes in the internal and external environment impacting insurance products
• underwriting, including processes to consider aggregate exposures from a portfolio perspective to determine the actual exposure to particular risks or an event, monitoring of significant accumulation and concentration of risk, and guidelines around the utilisation of reinsurance in pricing and underwriting
• delegated authorities for the acceptance, assessment and settlement of claims including operational and ex-gratia authority limits
• procedures relating to the notification, assessment, evaluation, settlement and closure of claims, and processes to detect and reduce loss associated with claims risk; and
• reserving practices and procedures at individual claim and portfolio level.
The Board receives Australian General Insurance and Life Insurance Financial Condition Reports from the Appointed Actuaries who also provide advice in relation to premium, issuing of new policies and reinsurance arrangements in accordance with APRA Prudential Standards. The boards for the New Zealand general insurer and life company receive equivalent reports and advice in respect of obligations imposed by the Reserve Bank of New Zealand.
For both general insurance and life insurance contracts, concentration of insurance risk is mitigated through diversification over classes of insurance business, industry segments, geographical segments (Australia and New Zealand), the use of reinsurer coverage and ensuring there is an appropriate mix of business.
For general insurance contracts, catastrophe and facultative reinsurance contracts are purchased to ensure that any accumulation of losses from a single event is mitigated. For life insurance, concentration of insurance risk is managed by ensuring there is an appropriate mixture of individual and group insurance business split between mortality, morbidity and annuity benefit payments. Concentrations of risk by product type are managed through monitoring of the in-force life insurance business and the mix of new business written each year. Exposure to risk of large claims for individual lives is managed through the use of reinsurance arrangements whereby the maximum exposure to any individual life is capped. F
or p
erso
nal u
se o
nly
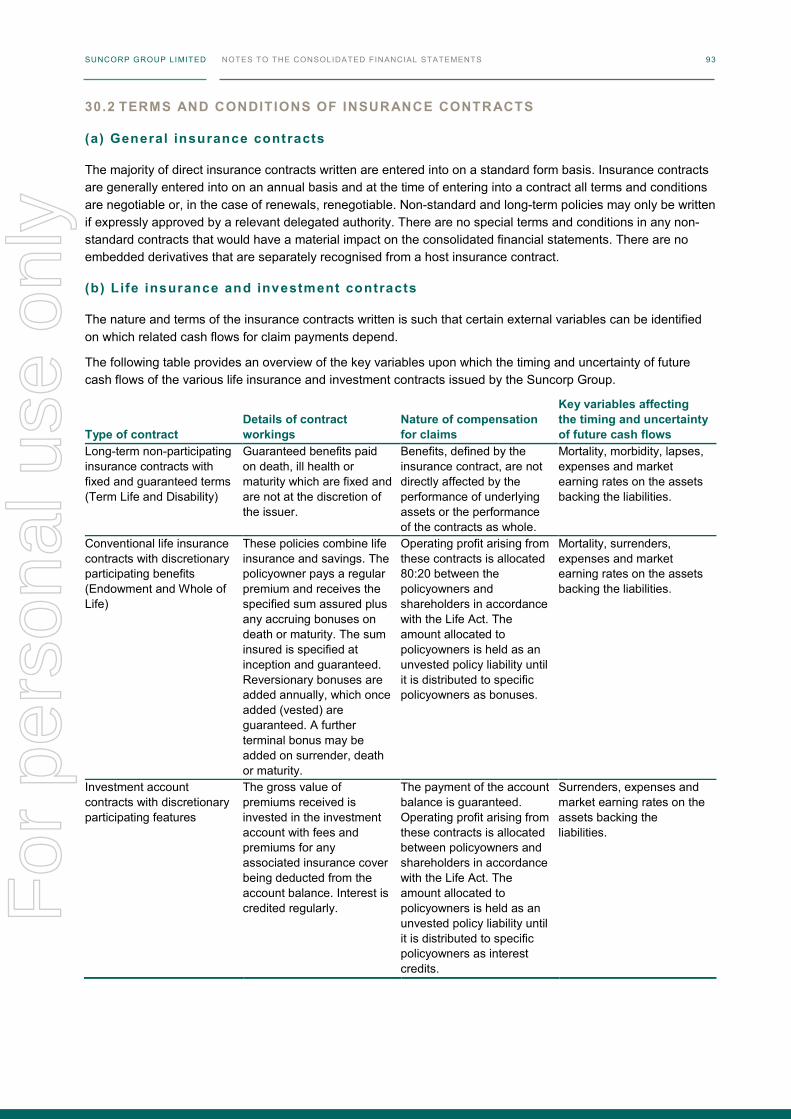
SUNCORP GROUP LIMITED NOTES TO THE CONSOLIDATED FINANCIAL STATEMENTS 92
Further discussions on the application of the Suncorp Group’s risk management practices are presented in the following sections:
• note 30 insurance risk management
• note 31 risk management for financial instruments: credit, liquidity and market risks; and
• note 13 derivative financial instruments.
30. INSURANCE RISK MANAGEMENT
30.1 POLICIES AND PRACTICES FOR MITIGATING INSURANCE RISK
Risk appetite statements are in place and controls are implemented to manage the following components of insurance risk:
• pricing, including pricing strategies, technical pricing and pricing adequacy reviews
• roles and responsibilities for pricing, the development and approval of new products and changes to existing products
• processes that identify and respond to changes in the internal and external environment impacting insurance products
• underwriting, including processes to consider aggregate exposures from a portfolio perspective to determine the actual exposure to particular risks or an event, monitoring of significant accumulation and concentration of risk, and guidelines around the utilisation of reinsurance in pricing and underwriting
• delegated authorities for the acceptance, assessment and settlement of claims including operational and ex-gratia authority limits
• procedures relating to the notification, assessment, evaluation, settlement and closure of claims, and processes to detect and reduce loss associated with claims risk; and
• reserving practices and procedures at individual claim and portfolio level.
The Board receives Australian General Insurance and Life Insurance Financial Condition Reports from the Appointed Actuaries who also provide advice in relation to premium, issuing of new policies and reinsurance arrangements in accordance with APRA Prudential Standards. The boards for the New Zealand general insurer and life company receive equivalent reports and advice in respect of obligations imposed by the Reserve Bank of New Zealand.
For both general insurance and life insurance contracts, concentration of insurance risk is mitigated through diversification over classes of insurance business, industry segments, geographical segments (Australia and New Zealand), the use of reinsurer coverage and ensuring there is an appropriate mix of business.
For general insurance contracts, catastrophe and facultative reinsurance contracts are purchased to ensure that any accumulation of losses from a single event is mitigated. For life insurance, concentration of insurance risk is managed by ensuring there is an appropriate mixture of individual and group insurance business split between mortality, morbidity and annuity benefit payments. Concentrations of risk by product type are managed through monitoring of the in-force life insurance business and the mix of new business written each year. Exposure to risk of large claims for individual lives is managed through the use of reinsurance arrangements whereby the maximum exposure to any individual life is capped.
SUNCORP GROUP LIMITED NOTES TO THE CONSOLIDATED FINANCIAL STATEMENTS 93
30.2 TERMS AND CONDITIONS OF INSURANCE CONTRACTS
(a) General insurance contracts
The majority of direct insurance contracts written are entered into on a standard form basis. Insurance contracts are generally entered into on an annual basis and at the time of entering into a contract all terms and conditions are negotiable or, in the case of renewals, renegotiable. Non-standard and long-term policies may only be written if expressly approved by a relevant delegated authority. There are no special terms and conditions in any non-standard contracts that would have a material impact on the consolidated financial statements. There are no embedded derivatives that are separately recognised from a host insurance contract.
(b) Life insurance and investment contracts
The nature and terms of the insurance contracts written is such that certain external variables can be identified on which related cash flows for claim payments depend.
The following table provides an overview of the key variables upon which the timing and uncertainty of future cash flows of the various life insurance and investment contracts issued by the Suncorp Group.
Type of contract Details of contract workings
Nature of compensation for claims
Key variables affecting the timing and uncertainty of future cash flows
Long-term non-participating insurance contracts with fixed and guaranteed terms (Term Life and Disability)
Guaranteed benefits paid on death, ill health or maturity which are fixed and are not at the discretion of the issuer.
Benefits, defined by the insurance contract, are not directly affected by the performance of underlying assets or the performance of the contracts as whole.
Mortality, morbidity, lapses, expenses and market earning rates on the assets backing the liabilities.
Conventional life insurance contracts with discretionary participating benefits (Endowment and Whole of Life)
These policies combine life insurance and savings. The policyowner pays a regular premium and receives the specified sum assured plus any accruing bonuses on death or maturity. The sum insured is specified at inception and guaranteed. Reversionary bonuses are added annually, which once added (vested) are guaranteed. A further terminal bonus may be added on surrender, death or maturity.
Operating profit arising from these contracts is allocated 80:20 between the policyowners and shareholders in accordance with the Life Act. The amount allocated to policyowners is held as an unvested policy liability until it is distributed to specific policyowners as bonuses.
Mortality, surrenders, expenses and market earning rates on the assets backing the liabilities.
Investment account contracts with discretionary participating features
The gross value of premiums received is invested in the investment account with fees and premiums for any associated insurance cover being deducted from the account balance. Interest is credited regularly.
The payment of the account balance is guaranteed. Operating profit arising from these contracts is allocated between policyowners and shareholders in accordance with the Life Act. The amount allocated to policyowners is held as an unvested policy liability until it is distributed to specific policyowners as interest credits.
Surrenders, expenses and market earning rates on the assets backing the liabilities.
For
per
sona
l use
onl
y

SUNCORP GROUP LIMITED NOTES TO THE CONSOLIDATED FINANCIAL STATEMENTS 94
31. RISK MANAGEMENT FOR FINANCIAL INSTRUMENTS
31.1 CREDIT RISK FOR BANK-RELATED FINANCIAL INSTRUMENTS
Due to the nature of the Bank’s business, credit risk exposure arising from the Bank’s financial assets is managed separately to other business areas of the Suncorp Group.
(a) Credit r isk exposures
The Bank is exposed to credit risk from traditional lending to customers and receivables from inter-bank, treasury, international trade and capital market activities.
Credit risk is managed on a structured basis with approval decisions being taken within credit approval authorities delegated by the Board. The acceptance and management of credit risk is performed independently as is the setting and maintaining of detailed credit policies and standards. The Bank Credit Risk Committee and the Bank Chief Risk Officer have responsibility for the independent management of credit functions to monitor trends impacting the credit quality of lending portfolios, develop and maintain risk grading and automated risk assessment systems and manage troublesome and impaired assets.
Credit risk involves a wide spectrum of customers ranging from individuals to large institutions and as such credit risk management is divided into two distinct categories: a statistically managed portfolio and a risk-graded portfolio.
The statistically managed portfolio covers consumer business (personal loans and housing loans) and automated credit scoring is widely used to determine customer creditworthiness. Credit scoring is embedded within the Bank’s end-to-end automated workflow system that also enforces credit policies and certain business rules. These exposures are generally not reviewed individually unless arrears occur when all collections and recovery actions are managed by a centralised team.
The risk-graded portfolio includes business and agribusiness exposures. Within this portfolio, exposures are individually assessed and an internal risk grade is assigned depending on the discrete analysis of each customer or group of related customers’ risk profile. Exposures within this portfolio are generally subject to annual (or more frequent) review, including a reassessment of the assigned internal risk grade. In the event of default, collections and recovery activity is managed within a well-defined structure. This process involves initial follow-up by the client manager including regular performance monitoring, reporting and if required, transfer to the Banking Recovery Unit.
A credit inspection process is in place to review the acceptance and management of credit risk in accordance with the approved risk management framework.
The Bank manages its exposure to credit losses on derivative contracts by entering into master netting arrangements with counterparties with which it undertakes a significant volume of transactions. The ISDA Master Agreement and Credit Support Annex provides a contractual framework for derivatives dealing across a full range of over-the-counter products. This agreement contractually binds both parties to apply close out netting across all outstanding transactions covered by an agreement if either party defaults or other pre-agreed termination events occur. The carrying amount of the relevant asset classes in the consolidated statement of financial position represents the maximum amount of credit exposures as at reporting date, except for derivatives and off-balance sheet commitments.
The fair value of derivatives recognised in the consolidated statement of financial position represents the current risk exposure, but not the maximum risk exposure. The notional value and fair value of derivatives are illustrated in note 13. F
or p
erso
nal u
se o
nly
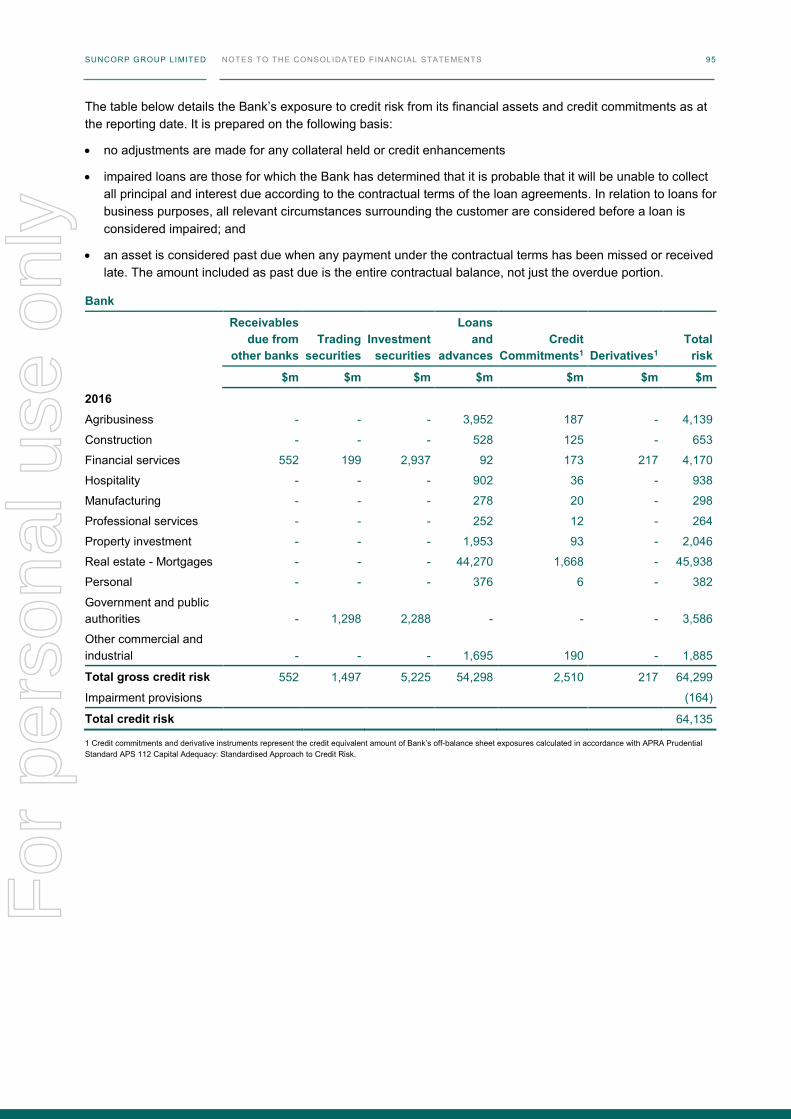
SUNCORP GROUP LIMITED NOTES TO THE CONSOLIDATED FINANCIAL STATEMENTS 94
31. RISK MANAGEMENT FOR FINANCIAL INSTRUMENTS
31.1 CREDIT RISK FOR BANK-RELATED FINANCIAL INSTRUMENTS
Due to the nature of the Bank’s business, credit risk exposure arising from the Bank’s financial assets is managed separately to other business areas of the Suncorp Group.
(a) Credit r isk exposures
The Bank is exposed to credit risk from traditional lending to customers and receivables from inter-bank, treasury, international trade and capital market activities.
Credit risk is managed on a structured basis with approval decisions being taken within credit approval authorities delegated by the Board. The acceptance and management of credit risk is performed independently as is the setting and maintaining of detailed credit policies and standards. The Bank Credit Risk Committee and the Bank Chief Risk Officer have responsibility for the independent management of credit functions to monitor trends impacting the credit quality of lending portfolios, develop and maintain risk grading and automated risk assessment systems and manage troublesome and impaired assets.
Credit risk involves a wide spectrum of customers ranging from individuals to large institutions and as such credit risk management is divided into two distinct categories: a statistically managed portfolio and a risk-graded portfolio.
The statistically managed portfolio covers consumer business (personal loans and housing loans) and automated credit scoring is widely used to determine customer creditworthiness. Credit scoring is embedded within the Bank’s end-to-end automated workflow system that also enforces credit policies and certain business rules. These exposures are generally not reviewed individually unless arrears occur when all collections and recovery actions are managed by a centralised team.
The risk-graded portfolio includes business and agribusiness exposures. Within this portfolio, exposures are individually assessed and an internal risk grade is assigned depending on the discrete analysis of each customer or group of related customers’ risk profile. Exposures within this portfolio are generally subject to annual (or more frequent) review, including a reassessment of the assigned internal risk grade. In the event of default, collections and recovery activity is managed within a well-defined structure. This process involves initial follow-up by the client manager including regular performance monitoring, reporting and if required, transfer to the Banking Recovery Unit.
A credit inspection process is in place to review the acceptance and management of credit risk in accordance with the approved risk management framework.
The Bank manages its exposure to credit losses on derivative contracts by entering into master netting arrangements with counterparties with which it undertakes a significant volume of transactions. The ISDA Master Agreement and Credit Support Annex provides a contractual framework for derivatives dealing across a full range of over-the-counter products. This agreement contractually binds both parties to apply close out netting across all outstanding transactions covered by an agreement if either party defaults or other pre-agreed termination events occur. The carrying amount of the relevant asset classes in the consolidated statement of financial position represents the maximum amount of credit exposures as at reporting date, except for derivatives and off-balance sheet commitments.
The fair value of derivatives recognised in the consolidated statement of financial position represents the current risk exposure, but not the maximum risk exposure. The notional value and fair value of derivatives are illustrated in note 13.
SUNCORP GROUP LIMITED NOTES TO THE CONSOLIDATED FINANCIAL STATEMENTS 95
The table below details the Bank’s exposure to credit risk from its financial assets and credit commitments as at the reporting date. It is prepared on the following basis:
• no adjustments are made for any collateral held or credit enhancements
• impaired loans are those for which the Bank has determined that it is probable that it will be unable to collect all principal and interest due according to the contractual terms of the loan agreements. In relation to loans for business purposes, all relevant circumstances surrounding the customer are considered before a loan is considered impaired; and
• an asset is considered past due when any payment under the contractual terms has been missed or received late. The amount included as past due is the entire contractual balance, not just the overdue portion.
Bank
Receivables due from
other banks Trading
securities Investment
securities
Loans and
advances Credit
Commitments1
Derivatives1 Total
risk
$m $m $m $m $m $m $m
2016
Agribusiness - - - 3,952 187 - 4,139
Construction - - - 528 125 - 653
Financial services 552 199 2,937 92 173 217 4,170
Hospitality - - - 902 36 - 938
Manufacturing - - - 278 20 - 298
Professional services - - - 252 12 - 264
Property investment - - - 1,953 93 - 2,046
Real estate - Mortgages - - - 44,270 1,668 - 45,938
Personal - - - 376 6 - 382
Government and public authorities - 1,298 2,288 - - - 3,586
Other commercial and industrial - - - 1,695 190 - 1,885
Total gross credit risk 552 1,497 5,225 54,298 2,510 217 64,299
Impairment provisions (164)
Total credit risk 64,135
1 Credit commitments and derivative instruments represent the credit equivalent amount of Bank’s off-balance sheet exposures calculated in accordance with APRA Prudential Standard APS 112 Capital Adequacy: Standardised Approach to Credit Risk.
For
per
sona
l use
onl
y
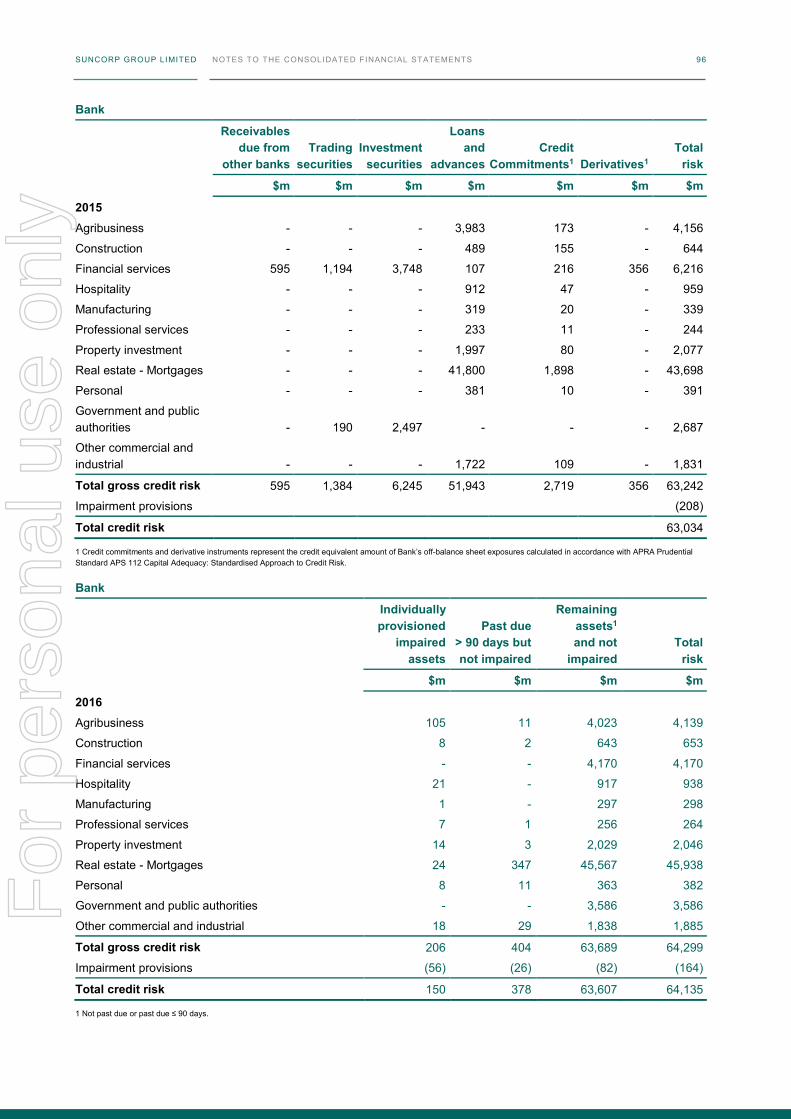
SUNCORP GROUP LIMITED NOTES TO THE CONSOLIDATED FINANCIAL STATEMENTS 96
Bank
Receivables due from
other banks Trading
securities Investment
securities
Loans and
advances Credit
Commitments1
Derivatives1 Total
risk
$m $m $m $m $m $m $m
2015
Agribusiness - - - 3,983 173 - 4,156
Construction - - - 489 155 - 644
Financial services 595 1,194 3,748 107 216 356 6,216
Hospitality - - - 912 47 - 959
Manufacturing - - - 319 20 - 339
Professional services - - - 233 11 - 244
Property investment - - - 1,997 80 - 2,077
Real estate - Mortgages - - - 41,800 1,898 - 43,698
Personal - - - 381 10 - 391
Government and public authorities - 190 2,497 - - - 2,687
Other commercial and industrial - - - 1,722 109 - 1,831
Total gross credit risk 595 1,384 6,245 51,943 2,719 356 63,242
Impairment provisions (208)
Total credit risk 63,034
1 Credit commitments and derivative instruments represent the credit equivalent amount of Bank’s off-balance sheet exposures calculated in accordance with APRA Prudential Standard APS 112 Capital Adequacy: Standardised Approach to Credit Risk.
Bank
Individually provisioned
impaired assets
Past due > 90 days but not impaired
Remaining assets1 and not
impaired Total
risk
$m $m $m $m
2016
Agribusiness 105 11 4,023 4,139
Construction 8 2 643 653
Financial services - - 4,170 4,170
Hospitality 21 - 917 938
Manufacturing 1 - 297 298
Professional services 7 1 256 264
Property investment 14 3 2,029 2,046
Real estate - Mortgages 24 347 45,567 45,938
Personal 8 11 363 382
Government and public authorities - - 3,586 3,586
Other commercial and industrial 18 29 1,838 1,885
Total gross credit risk 206 404 63,689 64,299
Impairment provisions (56) (26) (82) (164)
Total credit risk 150 378 63,607 64,135
1 Not past due or past due ≤ 90 days.
For
per
sona
l use
onl
y
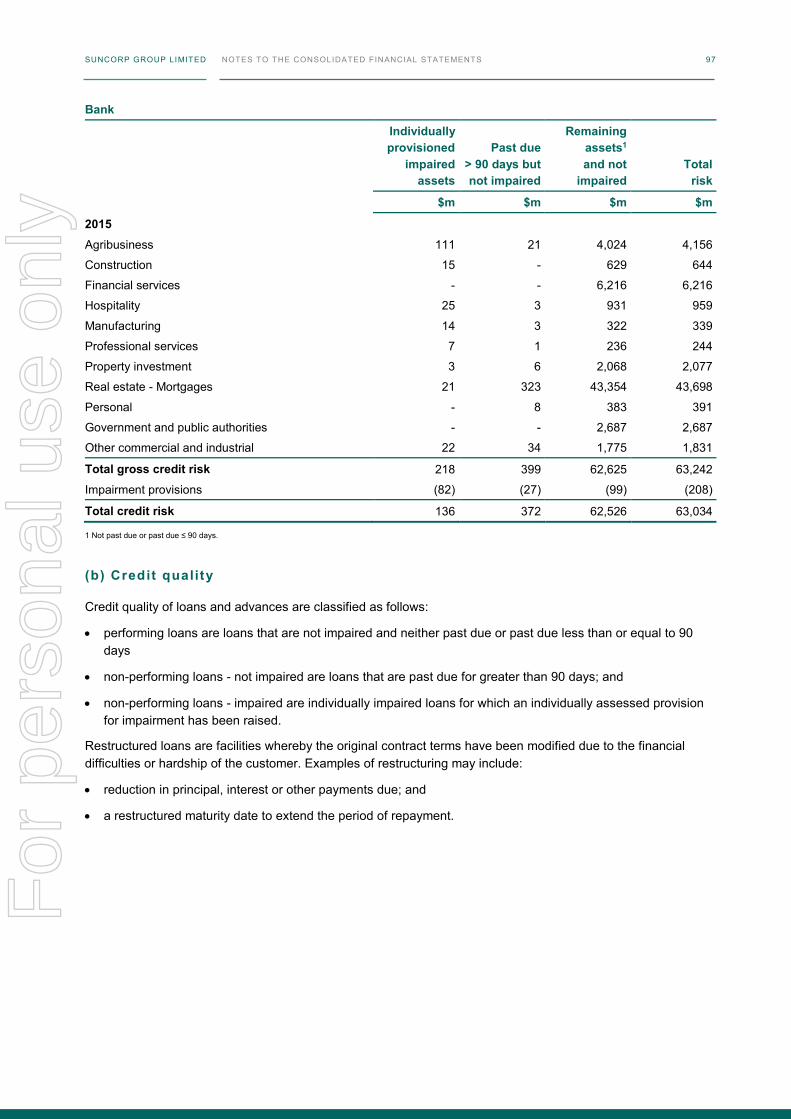
SUNCORP GROUP LIMITED NOTES TO THE CONSOLIDATED FINANCIAL STATEMENTS 96
Bank
Receivables due from
other banks Trading
securities Investment
securities
Loans and
advances Credit
Commitments1
Derivatives1 Total
risk
$m $m $m $m $m $m $m
2015
Agribusiness - - - 3,983 173 - 4,156
Construction - - - 489 155 - 644
Financial services 595 1,194 3,748 107 216 356 6,216
Hospitality - - - 912 47 - 959
Manufacturing - - - 319 20 - 339
Professional services - - - 233 11 - 244
Property investment - - - 1,997 80 - 2,077
Real estate - Mortgages - - - 41,800 1,898 - 43,698
Personal - - - 381 10 - 391
Government and public authorities - 190 2,497 - - - 2,687
Other commercial and industrial - - - 1,722 109 - 1,831
Total gross credit risk 595 1,384 6,245 51,943 2,719 356 63,242
Impairment provisions (208)
Total credit risk 63,034
1 Credit commitments and derivative instruments represent the credit equivalent amount of Bank’s off-balance sheet exposures calculated in accordance with APRA Prudential Standard APS 112 Capital Adequacy: Standardised Approach to Credit Risk.
Bank
Individually provisioned
impaired assets
Past due > 90 days but not impaired
Remaining assets1 and not
impaired Total
risk
$m $m $m $m
2016
Agribusiness 105 11 4,023 4,139
Construction 8 2 643 653
Financial services - - 4,170 4,170
Hospitality 21 - 917 938
Manufacturing 1 - 297 298
Professional services 7 1 256 264
Property investment 14 3 2,029 2,046
Real estate - Mortgages 24 347 45,567 45,938
Personal 8 11 363 382
Government and public authorities - - 3,586 3,586
Other commercial and industrial 18 29 1,838 1,885
Total gross credit risk 206 404 63,689 64,299
Impairment provisions (56) (26) (82) (164)
Total credit risk 150 378 63,607 64,135
1 Not past due or past due ≤ 90 days.
SUNCORP GROUP LIMITED NOTES TO THE CONSOLIDATED FINANCIAL STATEMENTS 97
Bank
Individually provisioned
impaired assets
Past due > 90 days but not impaired
Remaining assets1 and not
impaired Total
risk
$m $m $m $m
2015 Agribusiness 111 21 4,024 4,156
Construction 15 - 629 644
Financial services - - 6,216 6,216
Hospitality 25 3 931 959
Manufacturing 14 3 322 339
Professional services 7 1 236 244
Property investment 3 6 2,068 2,077
Real estate - Mortgages 21 323 43,354 43,698
Personal - 8 383 391
Government and public authorities - - 2,687 2,687
Other commercial and industrial 22 34 1,775 1,831
Total gross credit risk 218 399 62,625 63,242
Impairment provisions (82) (27) (99) (208)
Total credit risk 136 372 62,526 63,034
1 Not past due or past due ≤ 90 days.
(b) Credit quality
Credit quality of loans and advances are classified as follows:
• performing loans are loans that are not impaired and neither past due or past due less than or equal to 90 days
• non-performing loans - not impaired are loans that are past due for greater than 90 days; and
• non-performing loans - impaired are individually impaired loans for which an individually assessed provision for impairment has been raised.
Restructured loans are facilities whereby the original contract terms have been modified due to the financial difficulties or hardship of the customer. Examples of restructuring may include:
• reduction in principal, interest or other payments due; and
• a restructured maturity date to extend the period of repayment.
For
per
sona
l use
onl
y
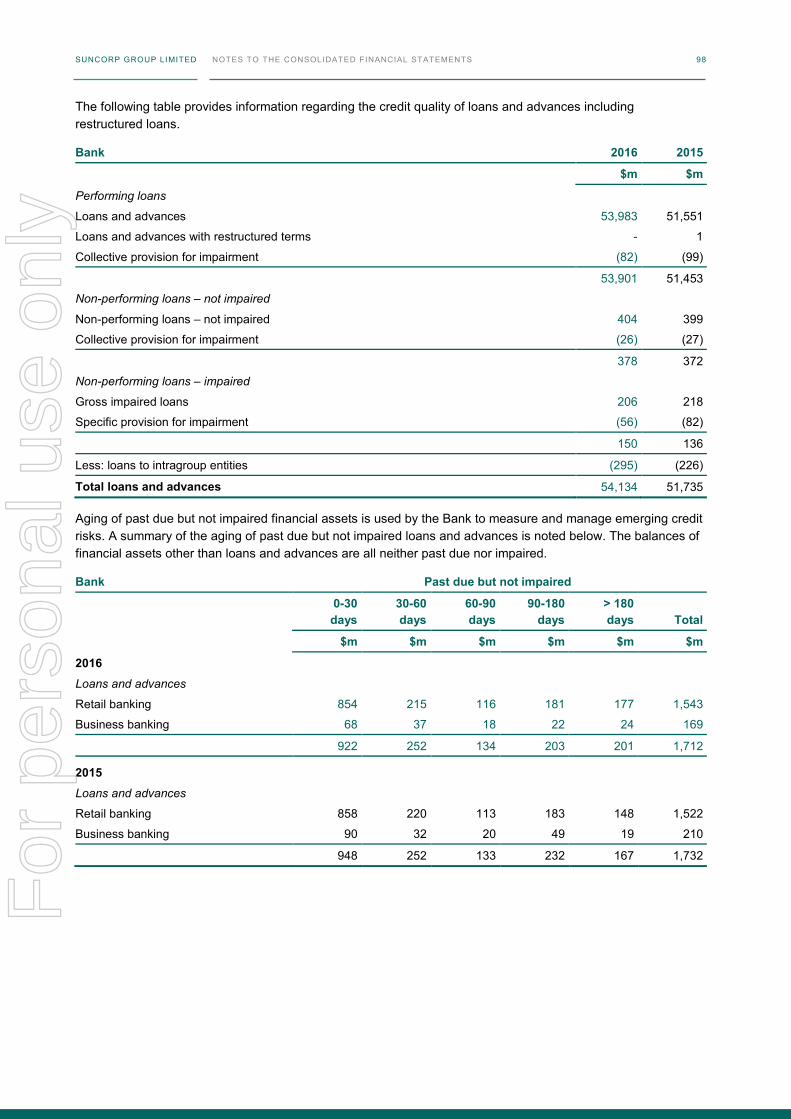
SUNCORP GROUP LIMITED NOTES TO THE CONSOLIDATED FINANCIAL STATEMENTS 98
The following table provides information regarding the credit quality of loans and advances including restructured loans.
Bank 2016 2015
$m $m
Performing loans
Loans and advances 53,983 51,551
Loans and advances with restructured terms - 1
Collective provision for impairment (82) (99)
53,901 51,453
Non-performing loans – not impaired
Non-performing loans – not impaired 404 399
Collective provision for impairment (26) (27)
378 372
Non-performing loans – impaired
Gross impaired loans 206 218
Specific provision for impairment (56) (82)
150 136
Less: loans to intragroup entities (295) (226)
Total loans and advances 54,134 51,735
Aging of past due but not impaired financial assets is used by the Bank to measure and manage emerging credit risks. A summary of the aging of past due but not impaired loans and advances is noted below. The balances of financial assets other than loans and advances are all neither past due nor impaired.
Bank Past due but not impaired
0-30 days
30-60 days
60-90 days
90-180 days
> 180 days Total
$m $m $m $m $m $m
2016
Loans and advances
Retail banking 854 215 116 181 177 1,543
Business banking 68 37 18 22 24 169
922 252 134 203 201 1,712
2015
Loans and advances
Retail banking 858 220 113 183 148 1,522
Business banking 90 32 20 49 19 210
948 252 133 232 167 1,732
For
per
sona
l use
onl
y
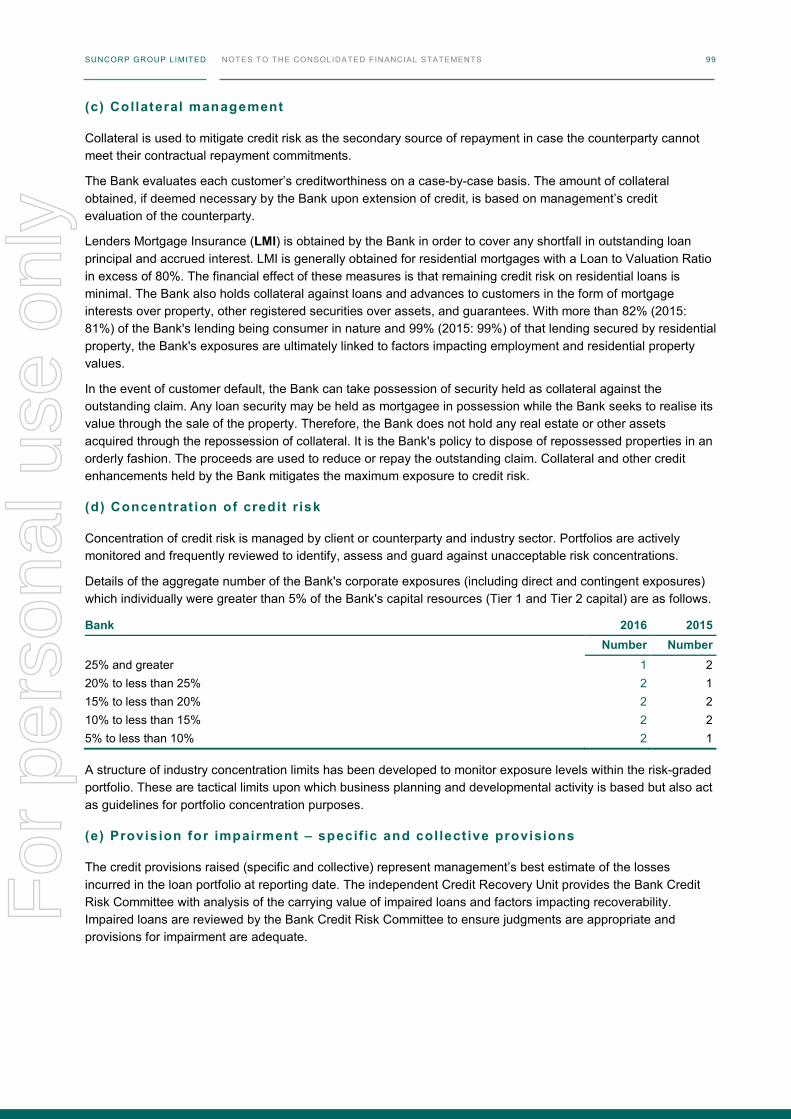
SUNCORP GROUP LIMITED NOTES TO THE CONSOLIDATED FINANCIAL STATEMENTS 98
The following table provides information regarding the credit quality of loans and advances including restructured loans.
Bank 2016 2015
$m $m
Performing loans
Loans and advances 53,983 51,551
Loans and advances with restructured terms - 1
Collective provision for impairment (82) (99)
53,901 51,453
Non-performing loans – not impaired
Non-performing loans – not impaired 404 399
Collective provision for impairment (26) (27)
378 372
Non-performing loans – impaired
Gross impaired loans 206 218
Specific provision for impairment (56) (82)
150 136
Less: loans to intragroup entities (295) (226)
Total loans and advances 54,134 51,735
Aging of past due but not impaired financial assets is used by the Bank to measure and manage emerging credit risks. A summary of the aging of past due but not impaired loans and advances is noted below. The balances of financial assets other than loans and advances are all neither past due nor impaired.
Bank Past due but not impaired
0-30 days
30-60 days
60-90 days
90-180 days
> 180 days Total
$m $m $m $m $m $m
2016
Loans and advances
Retail banking 854 215 116 181 177 1,543
Business banking 68 37 18 22 24 169
922 252 134 203 201 1,712
2015
Loans and advances
Retail banking 858 220 113 183 148 1,522
Business banking 90 32 20 49 19 210
948 252 133 232 167 1,732
SUNCORP GROUP LIMITED NOTES TO THE CONSOLIDATED FINANCIAL STATEMENTS 99
(c) Collateral management
Collateral is used to mitigate credit risk as the secondary source of repayment in case the counterparty cannot meet their contractual repayment commitments.
The Bank evaluates each customer’s creditworthiness on a case-by-case basis. The amount of collateral obtained, if deemed necessary by the Bank upon extension of credit, is based on management’s credit evaluation of the counterparty.
Lenders Mortgage Insurance (LMI) is obtained by the Bank in order to cover any shortfall in outstanding loan principal and accrued interest. LMI is generally obtained for residential mortgages with a Loan to Valuation Ratio in excess of 80%. The financial effect of these measures is that remaining credit risk on residential loans is minimal. The Bank also holds collateral against loans and advances to customers in the form of mortgage interests over property, other registered securities over assets, and guarantees. With more than 82% (2015: 81%) of the Bank's lending being consumer in nature and 99% (2015: 99%) of that lending secured by residential property, the Bank's exposures are ultimately linked to factors impacting employment and residential property values.
In the event of customer default, the Bank can take possession of security held as collateral against the outstanding claim. Any loan security may be held as mortgagee in possession while the Bank seeks to realise its value through the sale of the property. Therefore, the Bank does not hold any real estate or other assets acquired through the repossession of collateral. It is the Bank's policy to dispose of repossessed properties in an orderly fashion. The proceeds are used to reduce or repay the outstanding claim. Collateral and other credit enhancements held by the Bank mitigates the maximum exposure to credit risk.
(d) Concentrat ion of credit r isk
Concentration of credit risk is managed by client or counterparty and industry sector. Portfolios are actively monitored and frequently reviewed to identify, assess and guard against unacceptable risk concentrations.
Details of the aggregate number of the Bank's corporate exposures (including direct and contingent exposures) which individually were greater than 5% of the Bank's capital resources (Tier 1 and Tier 2 capital) are as follows.
Bank 2016 2015 Number Number
25% and greater 1 2 20% to less than 25% 2 1 15% to less than 20% 2 2 10% to less than 15% 2 2 5% to less than 10% 2 1
A structure of industry concentration limits has been developed to monitor exposure levels within the risk-graded portfolio. These are tactical limits upon which business planning and developmental activity is based but also act as guidelines for portfolio concentration purposes.
(e) Provision for impairment – specif ic and col lect ive provisions
The credit provisions raised (specific and collective) represent management’s best estimate of the losses incurred in the loan portfolio at reporting date. The independent Credit Recovery Unit provides the Bank Credit Risk Committee with analysis of the carrying value of impaired loans and factors impacting recoverability. Impaired loans are reviewed by the Bank Credit Risk Committee to ensure judgments are appropriate and provisions for impairment are adequate.
For
per
sona
l use
onl
y
SUNCORP GROUP LIMITED NOTES TO THE CONSOLIDATED FINANCIAL STATEMENTS 100
A specific provision for impairment is recognised where there is objective evidence of impairment and full recovery of the principal is considered doubtful. The present value of the expected future cash flows is compared to the carrying amounts of the loan. All factors that have a bearing on the expected future cash flows are taken into account, including the business prospects for the customer, the realisable value of collateral, the Suncorp Group’s position relative to other claimants, the reliability of customer information and the likely cost and duration of the work-out process. These judgments can change as new information becomes available and work-out strategies evolve.
Suncorp Group's policy requires the level of impairment allowances on individual facilities that are above internal thresholds to be reviewed at least half yearly, and more regularly as circumstances require.
A collective provision is established for loan portfolios which are not specifically provisioned. Collective provisions are held for potential credit losses which have been incurred but not yet specifically identified, and can be in the performing or non-performing portfolios. For business banking exposures, a ratings-based approach is applied using estimates of probability of default and loss given default, at a customer level. For portfolio managed exposures, the portfolios are split into pools with homogenous risk profiles and pool estimates of probability of default and loss given default are used to calculate the collective provision.
A collective provision for impairment is established against loan portfolios when events have occurred that have historically resulted in loan losses, but for which at reporting date individual loans have not yet become impaired requiring individual (specific) provisioning. The collective provision is determined by identifying groups of loans with similar credit risk characteristics and loss events, and estimating the adverse impact of these events on future cash flows on the loans and subsequent potential losses that could arise.
Loans with similar credit risk characteristics are grouped as follows:
• retail loans, small business and non-credit risk-rated business loans are grouped by product
• credit risk-rated business loans are grouped by the industry types, being agribusiness, commercial, development finance and property investment.
The key loss event identified for retail, small business and non-credit risk-rated business loans is borrower in monetary default. The key loss events for credit risk-rated business loans substantially align with existing credit review and management procedures to identify loans where deterioration has occurred in the underlying credit quality but which are currently not individually provisioned.
The Suncorp Group has developed models to estimate the adverse impact on future cash flows for each group of loans with similar credit risk characteristics. These models estimate impairment losses by applying probability of default and loss given default statistical factors derived from prior experience.
Each model determines an impairment loss based on the Suncorp Group’s historical experience, with adjustments made for current economic conditions as deemed necessary by the Board Risk Committee. It is possible that the estimated impairment loss will differ from the actual losses to be incurred from the groups of identified impaired loans.
31.2 CREDIT RISK FOR NON-BANK-RELATED FINANCIAL INSTRUMENTS
Exposure to credit risk from other business areas of the Suncorp Group arises primarily from:
• premiums outstanding
• reinsurance recoveries and receivables; and
• investments in interest-bearing securities and derivatives.
The carrying amount of the relevant asset classes in the consolidated statement of financial position represents the maximum amount of credit exposures as at reporting date.
For
per
sona
l use
onl
y
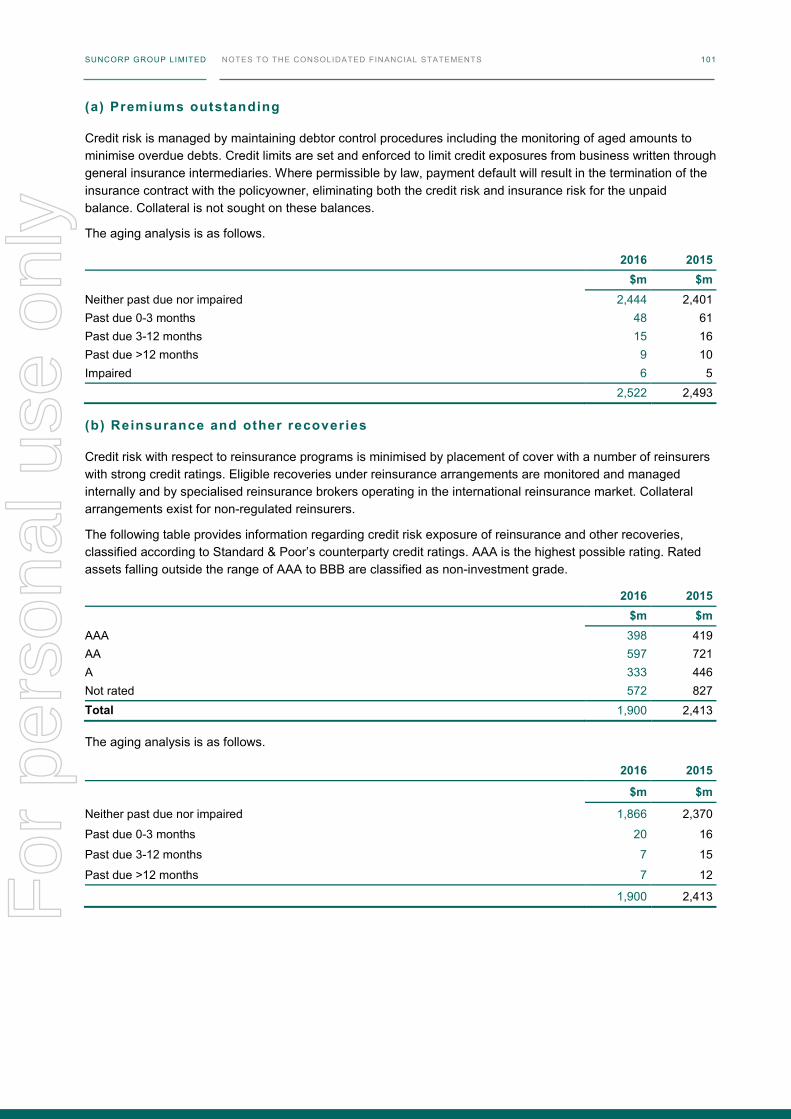
SUNCORP GROUP LIMITED NOTES TO THE CONSOLIDATED FINANCIAL STATEMENTS 100
A specific provision for impairment is recognised where there is objective evidence of impairment and full recovery of the principal is considered doubtful. The present value of the expected future cash flows is compared to the carrying amounts of the loan. All factors that have a bearing on the expected future cash flows are taken into account, including the business prospects for the customer, the realisable value of collateral, the Suncorp Group’s position relative to other claimants, the reliability of customer information and the likely cost and duration of the work-out process. These judgments can change as new information becomes available and work-out strategies evolve.
Suncorp Group's policy requires the level of impairment allowances on individual facilities that are above internal thresholds to be reviewed at least half yearly, and more regularly as circumstances require.
A collective provision is established for loan portfolios which are not specifically provisioned. Collective provisions are held for potential credit losses which have been incurred but not yet specifically identified, and can be in the performing or non-performing portfolios. For business banking exposures, a ratings-based approach is applied using estimates of probability of default and loss given default, at a customer level. For portfolio managed exposures, the portfolios are split into pools with homogenous risk profiles and pool estimates of probability of default and loss given default are used to calculate the collective provision.
A collective provision for impairment is established against loan portfolios when events have occurred that have historically resulted in loan losses, but for which at reporting date individual loans have not yet become impaired requiring individual (specific) provisioning. The collective provision is determined by identifying groups of loans with similar credit risk characteristics and loss events, and estimating the adverse impact of these events on future cash flows on the loans and subsequent potential losses that could arise.
Loans with similar credit risk characteristics are grouped as follows:
• retail loans, small business and non-credit risk-rated business loans are grouped by product
• credit risk-rated business loans are grouped by the industry types, being agribusiness, commercial, development finance and property investment.
The key loss event identified for retail, small business and non-credit risk-rated business loans is borrower in monetary default. The key loss events for credit risk-rated business loans substantially align with existing credit review and management procedures to identify loans where deterioration has occurred in the underlying credit quality but which are currently not individually provisioned.
The Suncorp Group has developed models to estimate the adverse impact on future cash flows for each group of loans with similar credit risk characteristics. These models estimate impairment losses by applying probability of default and loss given default statistical factors derived from prior experience.
Each model determines an impairment loss based on the Suncorp Group’s historical experience, with adjustments made for current economic conditions as deemed necessary by the Board Risk Committee. It is possible that the estimated impairment loss will differ from the actual losses to be incurred from the groups of identified impaired loans.
31.2 CREDIT RISK FOR NON-BANK-RELATED FINANCIAL INSTRUMENTS
Exposure to credit risk from other business areas of the Suncorp Group arises primarily from:
• premiums outstanding
• reinsurance recoveries and receivables; and
• investments in interest-bearing securities and derivatives.
The carrying amount of the relevant asset classes in the consolidated statement of financial position represents the maximum amount of credit exposures as at reporting date.
SUNCORP GROUP LIMITED NOTES TO THE CONSOLIDATED FINANCIAL STATEMENTS 101
(a) Premiums outstanding
Credit risk is managed by maintaining debtor control procedures including the monitoring of aged amounts to minimise overdue debts. Credit limits are set and enforced to limit credit exposures from business written through general insurance intermediaries. Where permissible by law, payment default will result in the termination of the insurance contract with the policyowner, eliminating both the credit risk and insurance risk for the unpaid balance. Collateral is not sought on these balances.
The aging analysis is as follows.
2016 2015 $m $m
Neither past due nor impaired 2,444 2,401 Past due 0-3 months 48 61 Past due 3-12 months 15 16 Past due >12 months 9 10 Impaired 6 5 2,522 2,493
(b) Reinsurance and other recoveries
Credit risk with respect to reinsurance programs is minimised by placement of cover with a number of reinsurers with strong credit ratings. Eligible recoveries under reinsurance arrangements are monitored and managed internally and by specialised reinsurance brokers operating in the international reinsurance market. Collateral arrangements exist for non-regulated reinsurers.
The following table provides information regarding credit risk exposure of reinsurance and other recoveries, classified according to Standard & Poor’s counterparty credit ratings. AAA is the highest possible rating. Rated assets falling outside the range of AAA to BBB are classified as non-investment grade.
2016 2015 $m $m
AAA 398 419 AA 597 721 A 333 446 Not rated 572 827 Total 1,900 2,413
The aging analysis is as follows.
2016 2015
$m $m
Neither past due nor impaired 1,866 2,370
Past due 0-3 months 20 16
Past due 3-12 months 7 15
Past due >12 months 7 12
1,900 2,413 For
per
sona
l use
onl
y
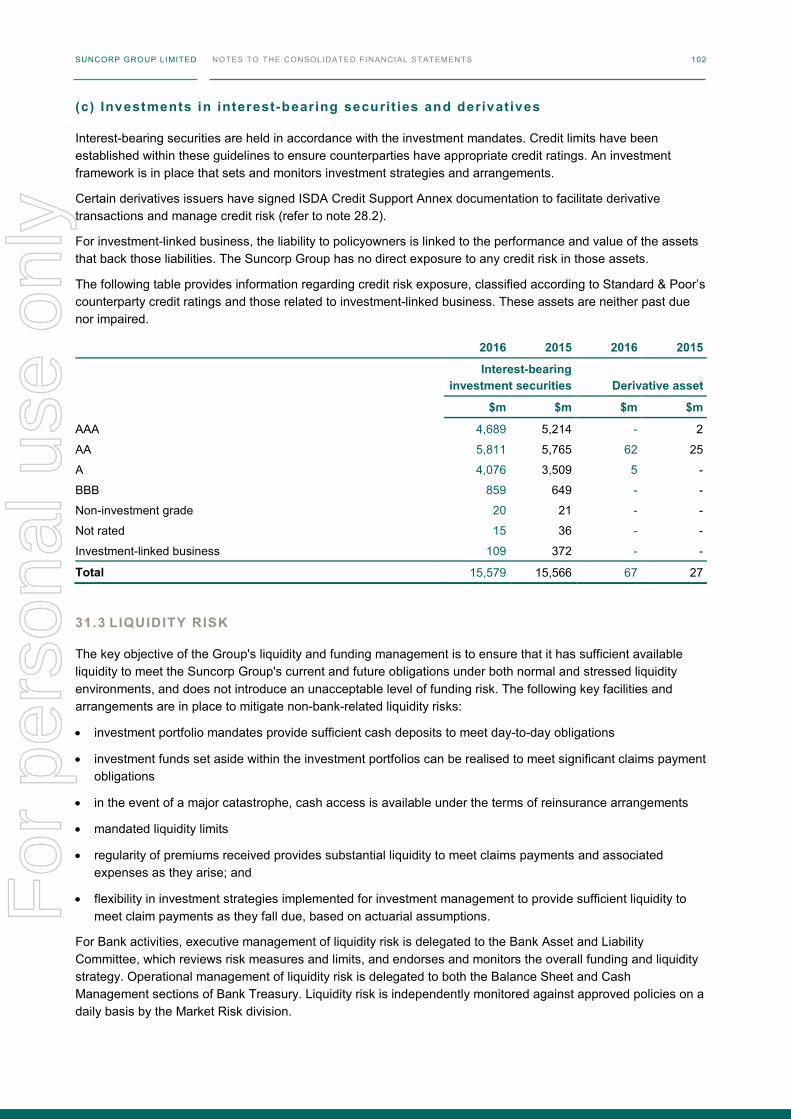
SUNCORP GROUP LIMITED NOTES TO THE CONSOLIDATED FINANCIAL STATEMENTS 102
(c) Investments in interest-bearing securit ies and derivatives
Interest-bearing securities are held in accordance with the investment mandates. Credit limits have been established within these guidelines to ensure counterparties have appropriate credit ratings. An investment framework is in place that sets and monitors investment strategies and arrangements.
Certain derivatives issuers have signed ISDA Credit Support Annex documentation to facilitate derivative transactions and manage credit risk (refer to note 28.2).
For investment-linked business, the liability to policyowners is linked to the performance and value of the assets that back those liabilities. The Suncorp Group has no direct exposure to any credit risk in those assets.
The following table provides information regarding credit risk exposure, classified according to Standard & Poor’s counterparty credit ratings and those related to investment-linked business. These assets are neither past due nor impaired.
2016 2015 2016 2015
Interest-bearing
investment securities Derivative asset
$m $m $m $m
AAA 4,689 5,214 - 2
AA 5,811 5,765 62 25
A 4,076 3,509 5 -
BBB 859 649 - -
Non-investment grade 20 21 - -
Not rated 15 36 - -
Investment-linked business 109 372 - -
Total 15,579 15,566 67 27
31.3 LIQUIDITY RISK
The key objective of the Group's liquidity and funding management is to ensure that it has sufficient available liquidity to meet the Suncorp Group's current and future obligations under both normal and stressed liquidity environments, and does not introduce an unacceptable level of funding risk. The following key facilities and arrangements are in place to mitigate non-bank-related liquidity risks:
• investment portfolio mandates provide sufficient cash deposits to meet day-to-day obligations
• investment funds set aside within the investment portfolios can be realised to meet significant claims payment obligations
• in the event of a major catastrophe, cash access is available under the terms of reinsurance arrangements
• mandated liquidity limits
• regularity of premiums received provides substantial liquidity to meet claims payments and associated expenses as they arise; and
• flexibility in investment strategies implemented for investment management to provide sufficient liquidity to meet claim payments as they fall due, based on actuarial assumptions.
For Bank activities, executive management of liquidity risk is delegated to the Bank Asset and Liability Committee, which reviews risk measures and limits, and endorses and monitors the overall funding and liquidity strategy. Operational management of liquidity risk is delegated to both the Balance Sheet and Cash Management sections of Bank Treasury. Liquidity risk is independently monitored against approved policies on a daily basis by the Market Risk division.
For
per
sona
l use
onl
y
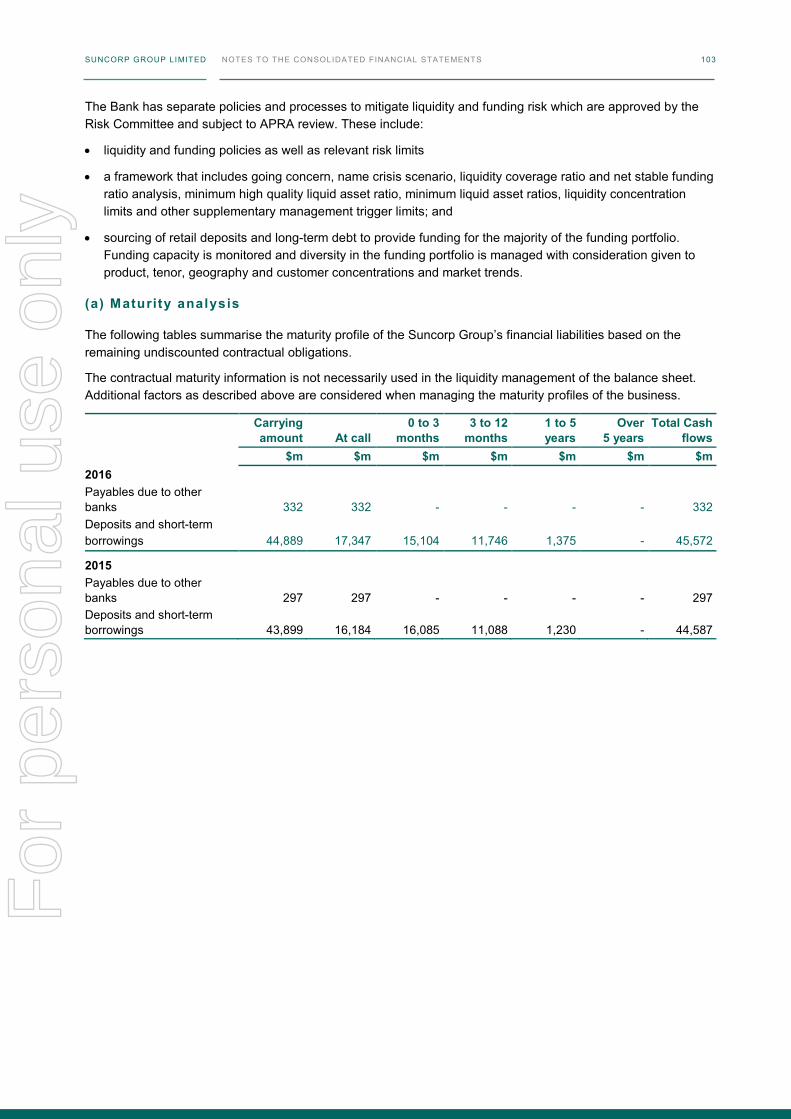
SUNCORP GROUP LIMITED NOTES TO THE CONSOLIDATED FINANCIAL STATEMENTS 102
(c) Investments in interest-bearing securit ies and derivatives
Interest-bearing securities are held in accordance with the investment mandates. Credit limits have been established within these guidelines to ensure counterparties have appropriate credit ratings. An investment framework is in place that sets and monitors investment strategies and arrangements.
Certain derivatives issuers have signed ISDA Credit Support Annex documentation to facilitate derivative transactions and manage credit risk (refer to note 28.2).
For investment-linked business, the liability to policyowners is linked to the performance and value of the assets that back those liabilities. The Suncorp Group has no direct exposure to any credit risk in those assets.
The following table provides information regarding credit risk exposure, classified according to Standard & Poor’s counterparty credit ratings and those related to investment-linked business. These assets are neither past due nor impaired.
2016 2015 2016 2015
Interest-bearing
investment securities Derivative asset
$m $m $m $m
AAA 4,689 5,214 - 2
AA 5,811 5,765 62 25
A 4,076 3,509 5 -
BBB 859 649 - -
Non-investment grade 20 21 - -
Not rated 15 36 - -
Investment-linked business 109 372 - -
Total 15,579 15,566 67 27
31.3 LIQUIDITY RISK
The key objective of the Group's liquidity and funding management is to ensure that it has sufficient available liquidity to meet the Suncorp Group's current and future obligations under both normal and stressed liquidity environments, and does not introduce an unacceptable level of funding risk. The following key facilities and arrangements are in place to mitigate non-bank-related liquidity risks:
• investment portfolio mandates provide sufficient cash deposits to meet day-to-day obligations
• investment funds set aside within the investment portfolios can be realised to meet significant claims payment obligations
• in the event of a major catastrophe, cash access is available under the terms of reinsurance arrangements
• mandated liquidity limits
• regularity of premiums received provides substantial liquidity to meet claims payments and associated expenses as they arise; and
• flexibility in investment strategies implemented for investment management to provide sufficient liquidity to meet claim payments as they fall due, based on actuarial assumptions.
For Bank activities, executive management of liquidity risk is delegated to the Bank Asset and Liability Committee, which reviews risk measures and limits, and endorses and monitors the overall funding and liquidity strategy. Operational management of liquidity risk is delegated to both the Balance Sheet and Cash Management sections of Bank Treasury. Liquidity risk is independently monitored against approved policies on a daily basis by the Market Risk division.
SUNCORP GROUP LIMITED NOTES TO THE CONSOLIDATED FINANCIAL STATEMENTS 103
The Bank has separate policies and processes to mitigate liquidity and funding risk which are approved by the Risk Committee and subject to APRA review. These include:
• liquidity and funding policies as well as relevant risk limits
• a framework that includes going concern, name crisis scenario, liquidity coverage ratio and net stable funding ratio analysis, minimum high quality liquid asset ratio, minimum liquid asset ratios, liquidity concentration limits and other supplementary management trigger limits; and
• sourcing of retail deposits and long-term debt to provide funding for the majority of the funding portfolio. Funding capacity is monitored and diversity in the funding portfolio is managed with consideration given to product, tenor, geography and customer concentrations and market trends.
(a) Maturity analysis
The following tables summarise the maturity profile of the Suncorp Group’s financial liabilities based on the remaining undiscounted contractual obligations.
The contractual maturity information is not necessarily used in the liquidity management of the balance sheet. Additional factors as described above are considered when managing the maturity profiles of the business.
Carrying amount At call
0 to 3 months
3 to 12 months
1 to 5 years
Over 5 years
Total Cash flows
$m $m $m $m $m $m $m 2016 Payables due to other banks 332 332 - - - - 332 Deposits and short-term borrowings 44,889 17,347 15,104 11,746 1,375 - 45,572
2015 Payables due to other banks 297 297 - - - - 297 Deposits and short-term borrowings 43,899 16,184 16,085 11,088 1,230 - 44,587
For
per
sona
l use
onl
y
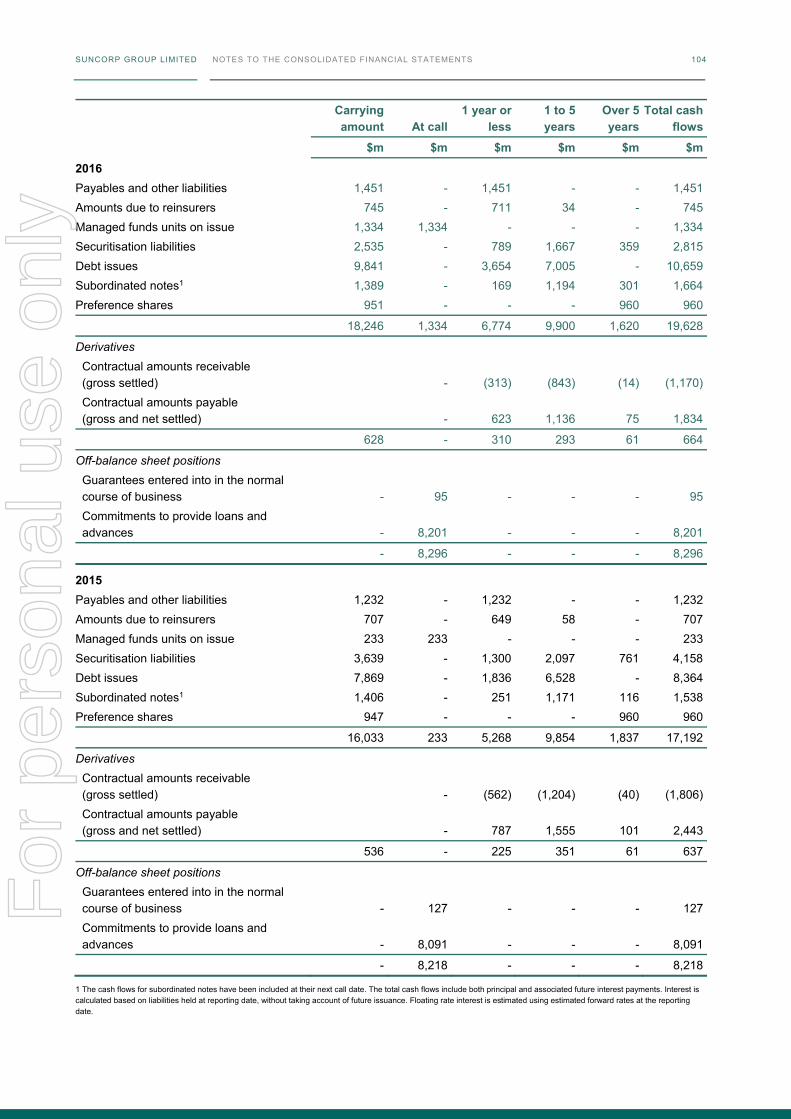
SUNCORP GROUP LIMITED NOTES TO THE CONSOLIDATED FINANCIAL STATEMENTS 104
Carrying amount At call
1 year or less
1 to 5 years
Over 5 years
Total cash flows
$m $m $m $m $m $m
2016 Payables and other liabilities 1,451 - 1,451 - - 1,451 Amounts due to reinsurers 745 - 711 34 - 745 Managed funds units on issue 1,334 1,334 - - - 1,334 Securitisation liabilities 2,535 - 789 1,667 359 2,815 Debt issues 9,841 - 3,654 7,005 - 10,659 Subordinated notes1 1,389 - 169 1,194 301 1,664 Preference shares 951 - - - 960 960
18,246 1,334 6,774 9,900 1,620 19,628
Derivatives Contractual amounts receivable (gross settled) - (313) (843) (14) (1,170) Contractual amounts payable (gross and net settled) - 623 1,136 75 1,834
628 - 310 293 61 664
Off-balance sheet positions Guarantees entered into in the normal course of business - 95 - - - 95 Commitments to provide loans and advances - 8,201 - - - 8,201
- 8,296 - - - 8,296
2015 Payables and other liabilities 1,232 - 1,232 - - 1,232 Amounts due to reinsurers 707 - 649 58 - 707 Managed funds units on issue 233 233 - - - 233 Securitisation liabilities 3,639 - 1,300 2,097 761 4,158 Debt issues 7,869 - 1,836 6,528 - 8,364 Subordinated notes1 1,406 - 251 1,171 116 1,538 Preference shares 947 - - - 960 960
16,033 233 5,268 9,854 1,837 17,192
Derivatives Contractual amounts receivable (gross settled) - (562) (1,204) (40) (1,806) Contractual amounts payable (gross and net settled) - 787 1,555 101 2,443
536 - 225 351 61 637
Off-balance sheet positions Guarantees entered into in the normal course of business - 127 - - - 127 Commitments to provide loans and advances - 8,091 - - - 8,091
- 8,218 - - - 8,218
1 The cash flows for subordinated notes have been included at their next call date. The total cash flows include both principal and associated future interest payments. Interest is calculated based on liabilities held at reporting date, without taking account of future issuance. Floating rate interest is estimated using estimated forward rates at the reporting date.
For
per
sona
l use
onl
y
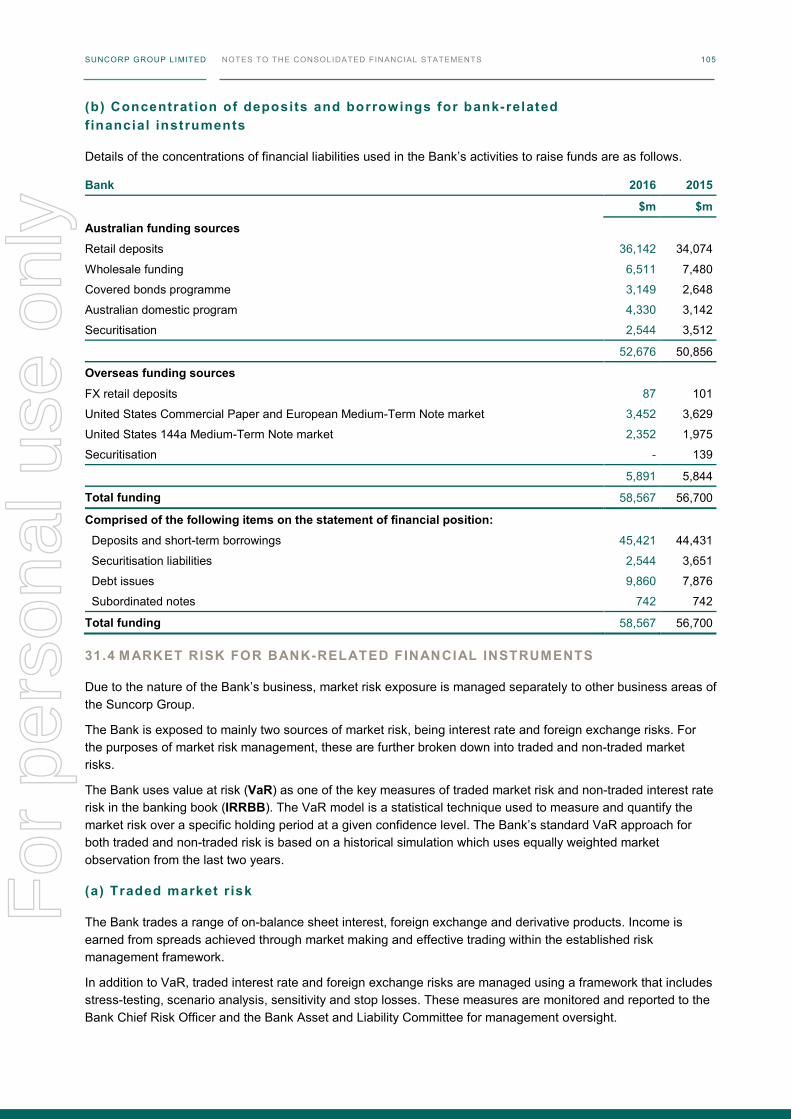
SUNCORP GROUP LIMITED NOTES TO THE CONSOLIDATED FINANCIAL STATEMENTS 104
Carrying amount At call
1 year or less
1 to 5 years
Over 5 years
Total cash flows
$m $m $m $m $m $m
2016 Payables and other liabilities 1,451 - 1,451 - - 1,451 Amounts due to reinsurers 745 - 711 34 - 745 Managed funds units on issue 1,334 1,334 - - - 1,334 Securitisation liabilities 2,535 - 789 1,667 359 2,815 Debt issues 9,841 - 3,654 7,005 - 10,659 Subordinated notes1 1,389 - 169 1,194 301 1,664 Preference shares 951 - - - 960 960
18,246 1,334 6,774 9,900 1,620 19,628
Derivatives Contractual amounts receivable (gross settled) - (313) (843) (14) (1,170) Contractual amounts payable (gross and net settled) - 623 1,136 75 1,834
628 - 310 293 61 664
Off-balance sheet positions Guarantees entered into in the normal course of business - 95 - - - 95 Commitments to provide loans and advances - 8,201 - - - 8,201
- 8,296 - - - 8,296
2015 Payables and other liabilities 1,232 - 1,232 - - 1,232 Amounts due to reinsurers 707 - 649 58 - 707 Managed funds units on issue 233 233 - - - 233 Securitisation liabilities 3,639 - 1,300 2,097 761 4,158 Debt issues 7,869 - 1,836 6,528 - 8,364 Subordinated notes1 1,406 - 251 1,171 116 1,538 Preference shares 947 - - - 960 960
16,033 233 5,268 9,854 1,837 17,192
Derivatives Contractual amounts receivable (gross settled) - (562) (1,204) (40) (1,806) Contractual amounts payable (gross and net settled) - 787 1,555 101 2,443
536 - 225 351 61 637
Off-balance sheet positions Guarantees entered into in the normal course of business - 127 - - - 127 Commitments to provide loans and advances - 8,091 - - - 8,091
- 8,218 - - - 8,218
1 The cash flows for subordinated notes have been included at their next call date. The total cash flows include both principal and associated future interest payments. Interest is calculated based on liabilities held at reporting date, without taking account of future issuance. Floating rate interest is estimated using estimated forward rates at the reporting date.
SUNCORP GROUP LIMITED NOTES TO THE CONSOLIDATED FINANCIAL STATEMENTS 105
(b) Concentrat ion of deposits and borrowings for bank-related f inancial instruments
Details of the concentrations of financial liabilities used in the Bank’s activities to raise funds are as follows.
Bank 2016 2015
$m $m
Australian funding sources
Retail deposits 36,142 34,074
Wholesale funding 6,511 7,480
Covered bonds programme 3,149 2,648
Australian domestic program 4,330 3,142
Securitisation 2,544 3,512
52,676 50,856
Overseas funding sources
FX retail deposits 87 101
United States Commercial Paper and European Medium-Term Note market 3,452 3,629
United States 144a Medium-Term Note market 2,352 1,975
Securitisation - 139
5,891 5,844
Total funding 58,567 56,700
Comprised of the following items on the statement of financial position:
Deposits and short-term borrowings 45,421 44,431
Securitisation liabilities 2,544 3,651
Debt issues 9,860 7,876
Subordinated notes 742 742
Total funding 58,567 56,700
31.4 MARKET RISK FOR BANK-RELATED FINANCIAL INSTRUMENTS
Due to the nature of the Bank’s business, market risk exposure is managed separately to other business areas of the Suncorp Group.
The Bank is exposed to mainly two sources of market risk, being interest rate and foreign exchange risks. For the purposes of market risk management, these are further broken down into traded and non-traded market risks.
The Bank uses value at risk (VaR) as one of the key measures of traded market risk and non-traded interest rate risk in the banking book (IRRBB). The VaR model is a statistical technique used to measure and quantify the market risk over a specific holding period at a given confidence level. The Bank’s standard VaR approach for both traded and non-traded risk is based on a historical simulation which uses equally weighted market observation from the last two years.
(a) Traded market r isk
The Bank trades a range of on-balance sheet interest, foreign exchange and derivative products. Income is earned from spreads achieved through market making and effective trading within the established risk management framework.
In addition to VaR, traded interest rate and foreign exchange risks are managed using a framework that includes stress-testing, scenario analysis, sensitivity and stop losses. These measures are monitored and reported to the Bank Chief Risk Officer and the Bank Asset and Liability Committee for management oversight.
For
per
sona
l use
onl
y
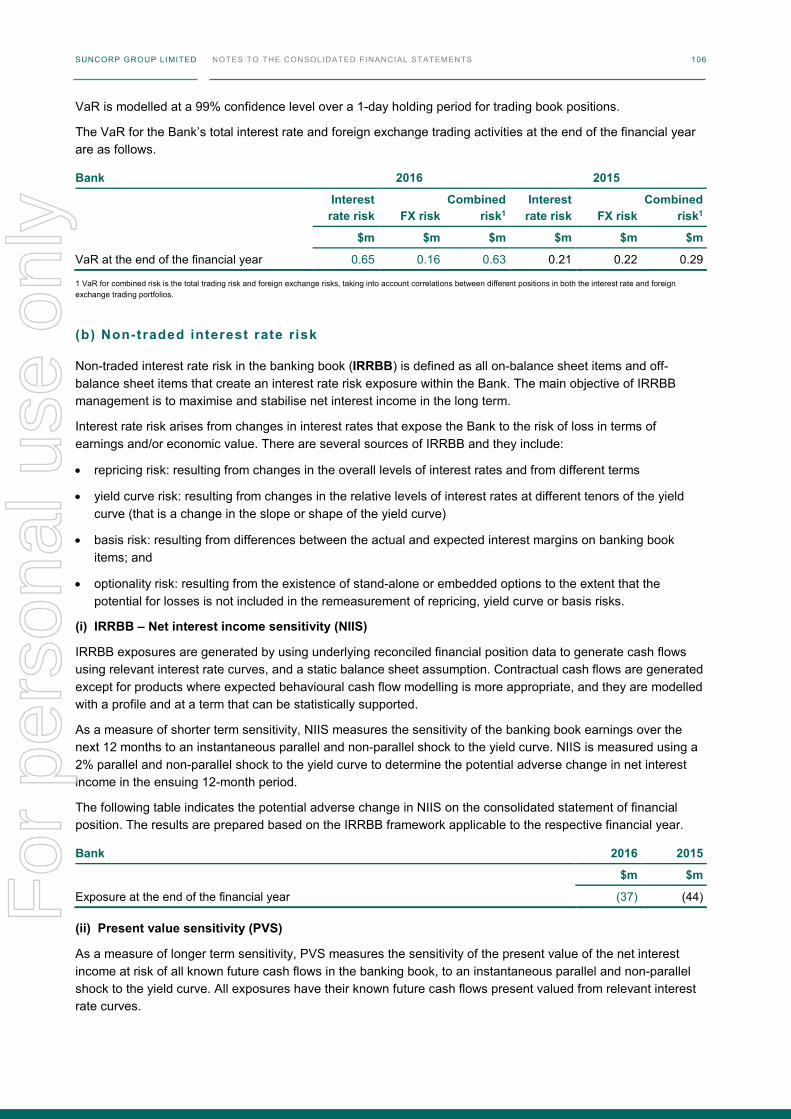
SUNCORP GROUP LIMITED NOTES TO THE CONSOLIDATED FINANCIAL STATEMENTS 106
VaR is modelled at a 99% confidence level over a 1-day holding period for trading book positions.
The VaR for the Bank’s total interest rate and foreign exchange trading activities at the end of the financial year are as follows.
Bank 2016 2015
Interest rate risk FX risk
Combined risk1
Interest rate risk FX risk
Combined risk1
$m $m $m $m $m $m
VaR at the end of the financial year 0.65 0.16 0.63 0.21 0.22 0.29
1 VaR for combined risk is the total trading risk and foreign exchange risks, taking into account correlations between different positions in both the interest rate and foreign exchange trading portfolios.
(b) Non-traded interest rate risk
Non-traded interest rate risk in the banking book (IRRBB) is defined as all on-balance sheet items and off-balance sheet items that create an interest rate risk exposure within the Bank. The main objective of IRRBB management is to maximise and stabilise net interest income in the long term.
Interest rate risk arises from changes in interest rates that expose the Bank to the risk of loss in terms of earnings and/or economic value. There are several sources of IRRBB and they include:
• repricing risk: resulting from changes in the overall levels of interest rates and from different terms
• yield curve risk: resulting from changes in the relative levels of interest rates at different tenors of the yield curve (that is a change in the slope or shape of the yield curve)
• basis risk: resulting from differences between the actual and expected interest margins on banking book items; and
• optionality risk: resulting from the existence of stand-alone or embedded options to the extent that the potential for losses is not included in the remeasurement of repricing, yield curve or basis risks.
(i) IRRBB – Net interest income sensitivity (NIIS)
IRRBB exposures are generated by using underlying reconciled financial position data to generate cash flows using relevant interest rate curves, and a static balance sheet assumption. Contractual cash flows are generated except for products where expected behavioural cash flow modelling is more appropriate, and they are modelled with a profile and at a term that can be statistically supported.
As a measure of shorter term sensitivity, NIIS measures the sensitivity of the banking book earnings over the next 12 months to an instantaneous parallel and non-parallel shock to the yield curve. NIIS is measured using a 2% parallel and non-parallel shock to the yield curve to determine the potential adverse change in net interest income in the ensuing 12-month period.
The following table indicates the potential adverse change in NIIS on the consolidated statement of financial position. The results are prepared based on the IRRBB framework applicable to the respective financial year.
Bank 2016 2015
$m $m
Exposure at the end of the financial year (37) (44)
(ii) Present value sensitivity (PVS)
As a measure of longer term sensitivity, PVS measures the sensitivity of the present value of the net interest income at risk of all known future cash flows in the banking book, to an instantaneous parallel and non-parallel shock to the yield curve. All exposures have their known future cash flows present valued from relevant interest rate curves.
For
per
sona
l use
onl
y
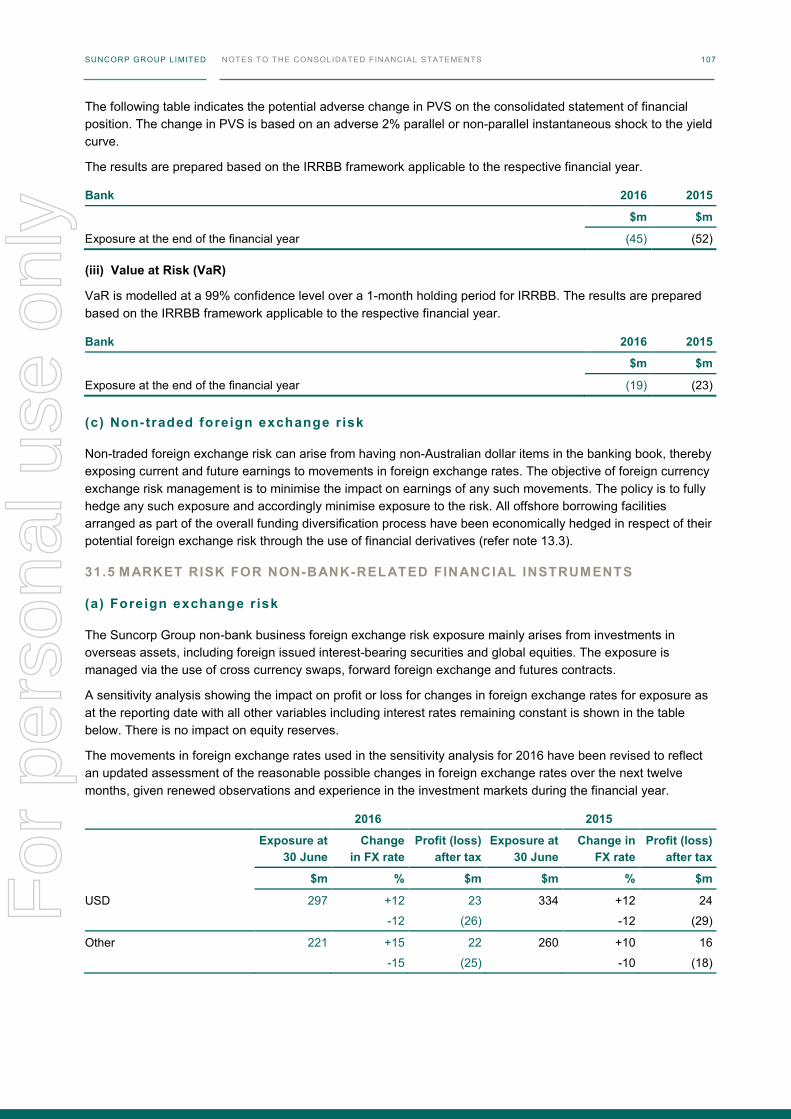
SUNCORP GROUP LIMITED NOTES TO THE CONSOLIDATED FINANCIAL STATEMENTS 106
VaR is modelled at a 99% confidence level over a 1-day holding period for trading book positions.
The VaR for the Bank’s total interest rate and foreign exchange trading activities at the end of the financial year are as follows.
Bank 2016 2015
Interest rate risk FX risk
Combined risk1
Interest rate risk FX risk
Combined risk1
$m $m $m $m $m $m
VaR at the end of the financial year 0.65 0.16 0.63 0.21 0.22 0.29
1 VaR for combined risk is the total trading risk and foreign exchange risks, taking into account correlations between different positions in both the interest rate and foreign exchange trading portfolios.
(b) Non-traded interest rate risk
Non-traded interest rate risk in the banking book (IRRBB) is defined as all on-balance sheet items and off-balance sheet items that create an interest rate risk exposure within the Bank. The main objective of IRRBB management is to maximise and stabilise net interest income in the long term.
Interest rate risk arises from changes in interest rates that expose the Bank to the risk of loss in terms of earnings and/or economic value. There are several sources of IRRBB and they include:
• repricing risk: resulting from changes in the overall levels of interest rates and from different terms
• yield curve risk: resulting from changes in the relative levels of interest rates at different tenors of the yield curve (that is a change in the slope or shape of the yield curve)
• basis risk: resulting from differences between the actual and expected interest margins on banking book items; and
• optionality risk: resulting from the existence of stand-alone or embedded options to the extent that the potential for losses is not included in the remeasurement of repricing, yield curve or basis risks.
(i) IRRBB – Net interest income sensitivity (NIIS)
IRRBB exposures are generated by using underlying reconciled financial position data to generate cash flows using relevant interest rate curves, and a static balance sheet assumption. Contractual cash flows are generated except for products where expected behavioural cash flow modelling is more appropriate, and they are modelled with a profile and at a term that can be statistically supported.
As a measure of shorter term sensitivity, NIIS measures the sensitivity of the banking book earnings over the next 12 months to an instantaneous parallel and non-parallel shock to the yield curve. NIIS is measured using a 2% parallel and non-parallel shock to the yield curve to determine the potential adverse change in net interest income in the ensuing 12-month period.
The following table indicates the potential adverse change in NIIS on the consolidated statement of financial position. The results are prepared based on the IRRBB framework applicable to the respective financial year.
Bank 2016 2015
$m $m
Exposure at the end of the financial year (37) (44)
(ii) Present value sensitivity (PVS)
As a measure of longer term sensitivity, PVS measures the sensitivity of the present value of the net interest income at risk of all known future cash flows in the banking book, to an instantaneous parallel and non-parallel shock to the yield curve. All exposures have their known future cash flows present valued from relevant interest rate curves.
SUNCORP GROUP LIMITED NOTES TO THE CONSOLIDATED FINANCIAL STATEMENTS 107
The following table indicates the potential adverse change in PVS on the consolidated statement of financial position. The change in PVS is based on an adverse 2% parallel or non-parallel instantaneous shock to the yield curve.
The results are prepared based on the IRRBB framework applicable to the respective financial year.
Bank 2016 2015
$m $m
Exposure at the end of the financial year (45) (52)
(iii) Value at Risk (VaR)
VaR is modelled at a 99% confidence level over a 1-month holding period for IRRBB. The results are prepared based on the IRRBB framework applicable to the respective financial year.
Bank 2016 2015
$m $m
Exposure at the end of the financial year (19) (23)
(c) Non-traded foreign exchange r isk
Non-traded foreign exchange risk can arise from having non-Australian dollar items in the banking book, thereby exposing current and future earnings to movements in foreign exchange rates. The objective of foreign currency exchange risk management is to minimise the impact on earnings of any such movements. The policy is to fully hedge any such exposure and accordingly minimise exposure to the risk. All offshore borrowing facilities arranged as part of the overall funding diversification process have been economically hedged in respect of their potential foreign exchange risk through the use of financial derivatives (refer note 13.3).
31.5 MARKET RISK FOR NON-BANK-RELATED FINANCIAL INSTRUMENTS
(a) Foreign exchange r isk
The Suncorp Group non-bank business foreign exchange risk exposure mainly arises from investments in overseas assets, including foreign issued interest-bearing securities and global equities. The exposure is managed via the use of cross currency swaps, forward foreign exchange and futures contracts.
A sensitivity analysis showing the impact on profit or loss for changes in foreign exchange rates for exposure as at the reporting date with all other variables including interest rates remaining constant is shown in the table below. There is no impact on equity reserves.
The movements in foreign exchange rates used in the sensitivity analysis for 2016 have been revised to reflect an updated assessment of the reasonable possible changes in foreign exchange rates over the next twelve months, given renewed observations and experience in the investment markets during the financial year.
2016 2015
Exposure at
30 June Change
in FX rate Profit (loss)
after tax Exposure at
30 June Change in
FX rate Profit (loss)
after tax
$m % $m $m % $m
USD 297 +12 23 334 +12 24
-12 (26) -12 (29)
Other 221 +15 22 260 +10 16
-15 (25) -10 (18)
For
per
sona
l use
onl
y

SUNCORP GROUP LIMITED NOTES TO THE CONSOLIDATED FINANCIAL STATEMENTS 108
(b) Interest rate risk
Interest rate risk exposure arises mainly from investment in interest-bearing securities and from ongoing valuation of insurance liabilities.
The investment portfolios which hold significant interest-bearing securities in support of corresponding outstanding insurance liabilities are invested in a manner consistent with the expected duration of claims payments. Interest rate risk is also managed by maintaining a diversified portfolio of investment securities and the controlled use of interest rate derivative instruments.
The sensitivity of profit and loss after tax to movements in interest rates in relation to interest-bearing financial assets held at the reporting date is shown in the table below. There is no impact on equity reserves. It is assumed that all residual exposures for the shareholder after tax are included in the sensitivity analysis, that the percentage point change occurs at the reporting date and that there are concurrent movements in interest rates and parallel shifts in the yield curves.
Investment-linked business is excluded from the analysis as there is no residual interest rate exposure to the shareholder. The movements in interest rate used in the sensitivity analysis for 2016 have been revised to reflect an updated assessment of the reasonable possible changes in interest rates over the next twelve months, given renewed observations and experience in the investment markets during the financial year.
2016 2015
Exposure
at 30 June
Change in interest
rate
Profit (loss)
after tax Exposure
at 30 June
Change in interest
rate
Profit (loss)
after tax $m bp $m $m bp $m
Interest-bearing investment securities (including derivative financial instruments)
15,743 +100 (254) 15,884 +100 (252) – 50 127 – 50 132
Subordinated notes 995 +100 (7) 847 +100 (5) – 50 2 – 50 2
Preference shares 960 +100 (10) 960 +100 (10) – 50 5 – 50 5
(c) Equity r isk
The Suncorp Group has exposure to equity risk through its investments in international and domestic equity trusts. Equity risk is managed by incorporating a diverse holding of Australian and overseas equities (whether direct or through unitised trusts) and through the controlled use of derivative financial instruments.
The table below presents a sensitivity analysis showing the impact on profit or loss for price movements for exposures as at the reporting date with all other variables remaining constant. There is no impact on equity reserves.
The movements in equity prices used in the sensitivity analysis for 2016 have been revised to reflect an updated assessment of the reasonable possible changes in equity prices over the next twelve months, given renewed observations and experience in the investment markets during the financial year.
2016 2015
Exposure
at 30 June
Change in equity prices
Profit (loss)
after tax Exposure
at 30 June
Change in equity prices
Profit (loss)
after tax $m % $m $m % $m
Listed Australian equities and unit trusts
1,293 +15 136 1,534 + 15 161 -15 (136) – 20 (215)
Listed international equities and unit trusts
864 +15 91 1,041 + 15 110 -15 (91) – 20 (147)
For
per
sona
l use
onl
y
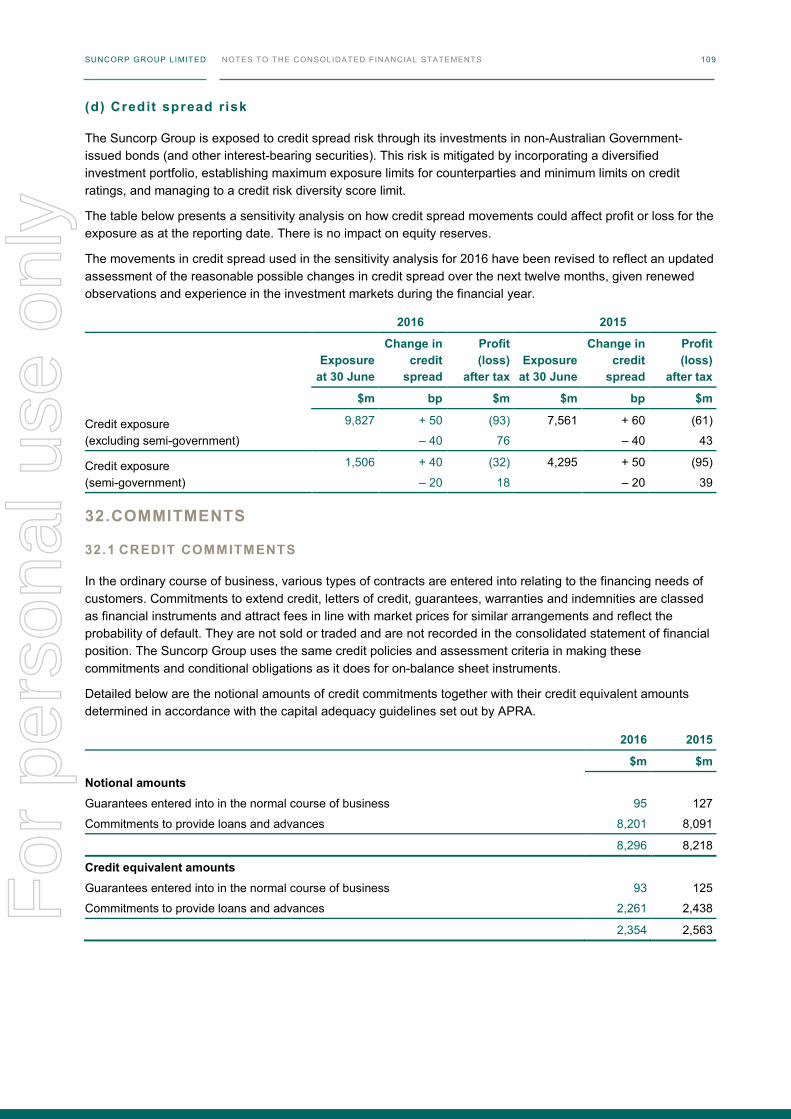
SUNCORP GROUP LIMITED NOTES TO THE CONSOLIDATED FINANCIAL STATEMENTS 108
(b) Interest rate risk
Interest rate risk exposure arises mainly from investment in interest-bearing securities and from ongoing valuation of insurance liabilities.
The investment portfolios which hold significant interest-bearing securities in support of corresponding outstanding insurance liabilities are invested in a manner consistent with the expected duration of claims payments. Interest rate risk is also managed by maintaining a diversified portfolio of investment securities and the controlled use of interest rate derivative instruments.
The sensitivity of profit and loss after tax to movements in interest rates in relation to interest-bearing financial assets held at the reporting date is shown in the table below. There is no impact on equity reserves. It is assumed that all residual exposures for the shareholder after tax are included in the sensitivity analysis, that the percentage point change occurs at the reporting date and that there are concurrent movements in interest rates and parallel shifts in the yield curves.
Investment-linked business is excluded from the analysis as there is no residual interest rate exposure to the shareholder. The movements in interest rate used in the sensitivity analysis for 2016 have been revised to reflect an updated assessment of the reasonable possible changes in interest rates over the next twelve months, given renewed observations and experience in the investment markets during the financial year.
2016 2015
Exposure
at 30 June
Change in interest
rate
Profit (loss)
after tax Exposure
at 30 June
Change in interest
rate
Profit (loss)
after tax $m bp $m $m bp $m
Interest-bearing investment securities (including derivative financial instruments)
15,743 +100 (254) 15,884 +100 (252) – 50 127 – 50 132
Subordinated notes 995 +100 (7) 847 +100 (5) – 50 2 – 50 2
Preference shares 960 +100 (10) 960 +100 (10) – 50 5 – 50 5
(c) Equity r isk
The Suncorp Group has exposure to equity risk through its investments in international and domestic equity trusts. Equity risk is managed by incorporating a diverse holding of Australian and overseas equities (whether direct or through unitised trusts) and through the controlled use of derivative financial instruments.
The table below presents a sensitivity analysis showing the impact on profit or loss for price movements for exposures as at the reporting date with all other variables remaining constant. There is no impact on equity reserves.
The movements in equity prices used in the sensitivity analysis for 2016 have been revised to reflect an updated assessment of the reasonable possible changes in equity prices over the next twelve months, given renewed observations and experience in the investment markets during the financial year.
2016 2015
Exposure
at 30 June
Change in equity prices
Profit (loss)
after tax Exposure
at 30 June
Change in equity prices
Profit (loss)
after tax $m % $m $m % $m
Listed Australian equities and unit trusts
1,293 +15 136 1,534 + 15 161 -15 (136) – 20 (215)
Listed international equities and unit trusts
864 +15 91 1,041 + 15 110 -15 (91) – 20 (147)
SUNCORP GROUP LIMITED NOTES TO THE CONSOLIDATED FINANCIAL STATEMENTS 109
(d) Credit spread risk
The Suncorp Group is exposed to credit spread risk through its investments in non-Australian Government-issued bonds (and other interest-bearing securities). This risk is mitigated by incorporating a diversified investment portfolio, establishing maximum exposure limits for counterparties and minimum limits on credit ratings, and managing to a credit risk diversity score limit.
The table below presents a sensitivity analysis on how credit spread movements could affect profit or loss for the exposure as at the reporting date. There is no impact on equity reserves.
The movements in credit spread used in the sensitivity analysis for 2016 have been revised to reflect an updated assessment of the reasonable possible changes in credit spread over the next twelve months, given renewed observations and experience in the investment markets during the financial year.
2016 2015
Exposure
at 30 June
Change in credit
spread
Profit (loss)
after tax Exposure
at 30 June
Change in credit
spread
Profit (loss)
after tax
$m bp $m $m bp $m
Credit exposure (excluding semi-government)
9,827 + 50 (93) 7,561 + 60 (61)
– 40 76 – 40 43
Credit exposure (semi-government)
1,506 + 40 (32) 4,295 + 50 (95)
– 20 18 – 20 39
32. COMMITMENTS
32.1 CREDIT COMMITMENTS
In the ordinary course of business, various types of contracts are entered into relating to the financing needs of customers. Commitments to extend credit, letters of credit, guarantees, warranties and indemnities are classed as financial instruments and attract fees in line with market prices for similar arrangements and reflect the probability of default. They are not sold or traded and are not recorded in the consolidated statement of financial position. The Suncorp Group uses the same credit policies and assessment criteria in making these commitments and conditional obligations as it does for on-balance sheet instruments.
Detailed below are the notional amounts of credit commitments together with their credit equivalent amounts determined in accordance with the capital adequacy guidelines set out by APRA.
2016 2015
$m $m
Notional amounts
Guarantees entered into in the normal course of business 95 127
Commitments to provide loans and advances 8,201 8,091
8,296 8,218
Credit equivalent amounts
Guarantees entered into in the normal course of business 93 125
Commitments to provide loans and advances 2,261 2,438
2,354 2,563
For
per
sona
l use
onl
y
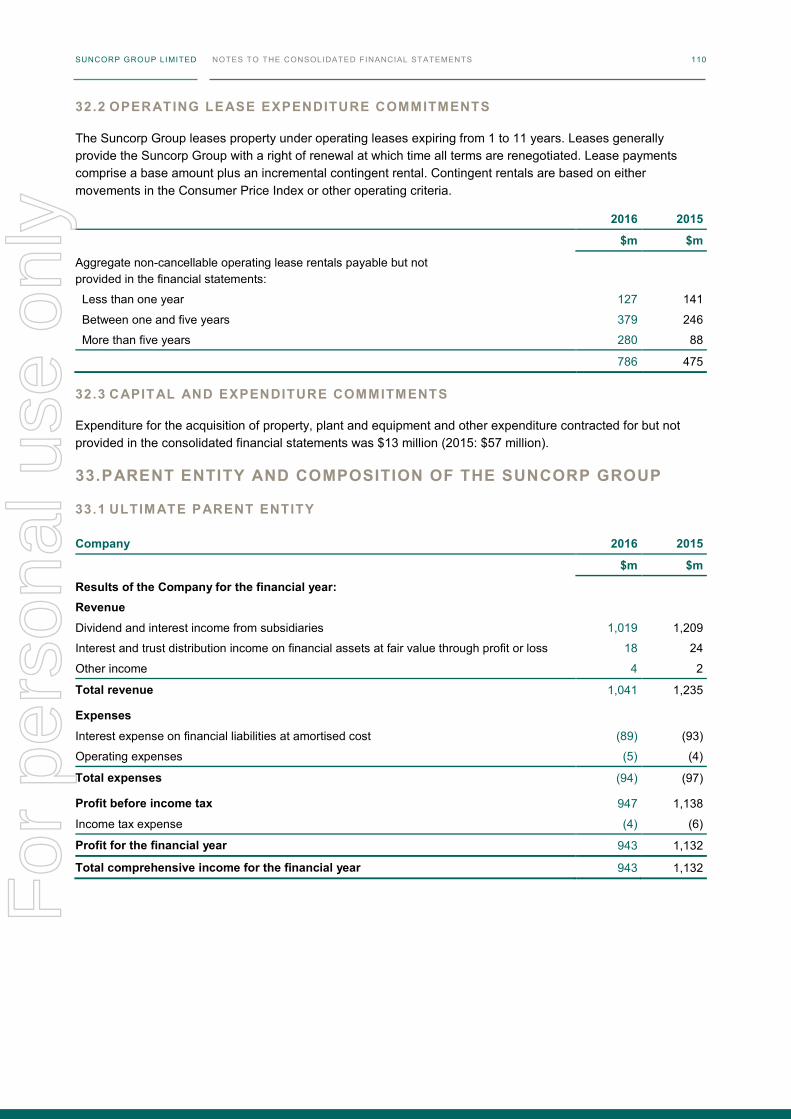
SUNCORP GROUP LIMITED NOTES TO THE CONSOLIDATED FINANCIAL STATEMENTS 110
32.2 OPERATING LEASE EXPENDITURE COMMITMENTS
The Suncorp Group leases property under operating leases expiring from 1 to 11 years. Leases generally provide the Suncorp Group with a right of renewal at which time all terms are renegotiated. Lease payments comprise a base amount plus an incremental contingent rental. Contingent rentals are based on either movements in the Consumer Price Index or other operating criteria.
2016 2015
$m $m
Aggregate non-cancellable operating lease rentals payable but not provided in the financial statements:
Less than one year 127 141
Between one and five years 379 246
More than five years 280 88
786 475
32.3 CAPITAL AND EXPENDITURE COMMITMENTS
Expenditure for the acquisition of property, plant and equipment and other expenditure contracted for but not provided in the consolidated financial statements was $13 million (2015: $57 million).
33. PARENT ENTITY AND COMPOSITION OF THE SUNCORP GROUP
33.1 ULTIMATE PARENT ENTITY
Company 2016 2015
$m $m
Results of the Company for the financial year:
Revenue
Dividend and interest income from subsidiaries 1,019 1,209
Interest and trust distribution income on financial assets at fair value through profit or loss 18 24
Other income 4 2
Total revenue 1,041 1,235
Expenses
Interest expense on financial liabilities at amortised cost (89) (93)
Operating expenses (5) (4)
Total expenses (94) (97)
Profit before income tax 947 1,138
Income tax expense (4) (6)
Profit for the financial year 943 1,132
Total comprehensive income for the financial year 943 1,132
For
per
sona
l use
onl
y
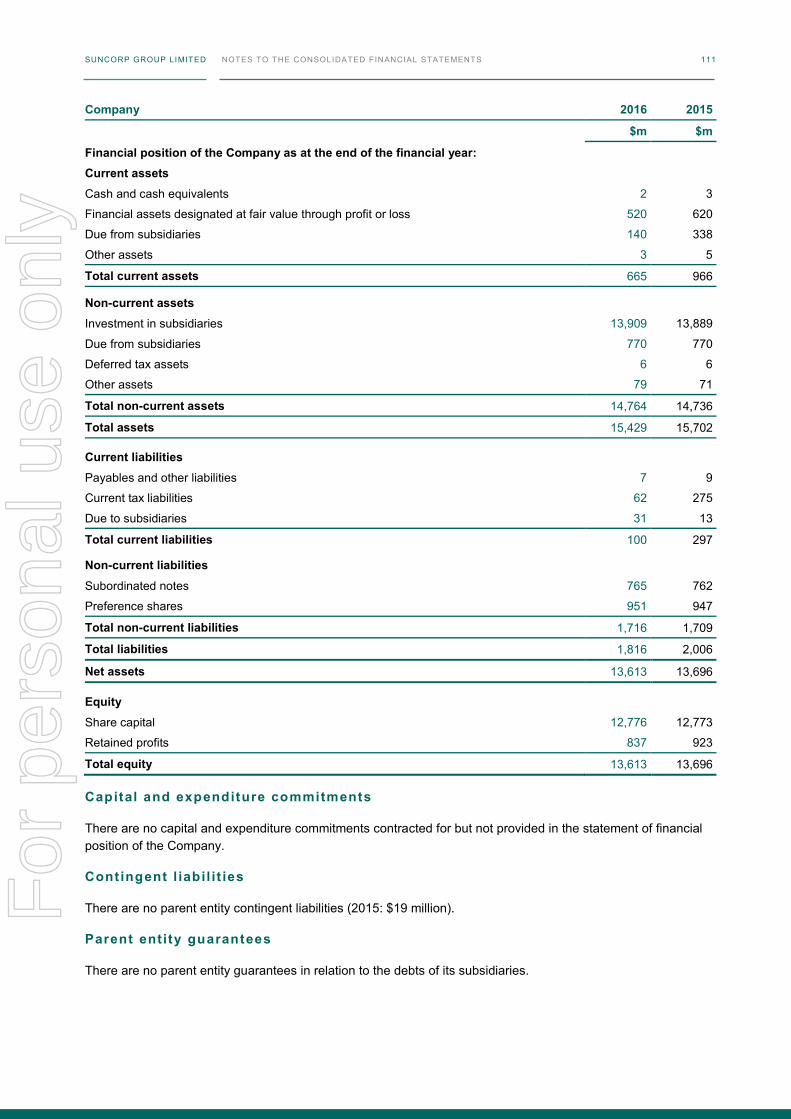
SUNCORP GROUP LIMITED NOTES TO THE CONSOLIDATED FINANCIAL STATEMENTS 110
32.2 OPERATING LEASE EXPENDITURE COMMITMENTS
The Suncorp Group leases property under operating leases expiring from 1 to 11 years. Leases generally provide the Suncorp Group with a right of renewal at which time all terms are renegotiated. Lease payments comprise a base amount plus an incremental contingent rental. Contingent rentals are based on either movements in the Consumer Price Index or other operating criteria.
2016 2015
$m $m
Aggregate non-cancellable operating lease rentals payable but not provided in the financial statements:
Less than one year 127 141
Between one and five years 379 246
More than five years 280 88
786 475
32.3 CAPITAL AND EXPENDITURE COMMITMENTS
Expenditure for the acquisition of property, plant and equipment and other expenditure contracted for but not provided in the consolidated financial statements was $13 million (2015: $57 million).
33. PARENT ENTITY AND COMPOSITION OF THE SUNCORP GROUP
33.1 ULTIMATE PARENT ENTITY
Company 2016 2015
$m $m
Results of the Company for the financial year:
Revenue
Dividend and interest income from subsidiaries 1,019 1,209
Interest and trust distribution income on financial assets at fair value through profit or loss 18 24
Other income 4 2
Total revenue 1,041 1,235
Expenses
Interest expense on financial liabilities at amortised cost (89) (93)
Operating expenses (5) (4)
Total expenses (94) (97)
Profit before income tax 947 1,138
Income tax expense (4) (6)
Profit for the financial year 943 1,132
Total comprehensive income for the financial year 943 1,132
SUNCORP GROUP LIMITED NOTES TO THE CONSOLIDATED FINANCIAL STATEMENTS 111
Company 2016 2015
$m $m
Financial position of the Company as at the end of the financial year:
Current assets
Cash and cash equivalents 2 3
Financial assets designated at fair value through profit or loss 520 620
Due from subsidiaries 140 338
Other assets 3 5
Total current assets 665 966
Non-current assets
Investment in subsidiaries 13,909 13,889
Due from subsidiaries 770 770
Deferred tax assets 6 6
Other assets 79 71
Total non-current assets 14,764 14,736
Total assets 15,429 15,702
Current liabilities
Payables and other liabilities 7 9
Current tax liabilities 62 275
Due to subsidiaries 31 13
Total current liabilities 100 297
Non-current liabilities
Subordinated notes 765 762
Preference shares 951 947
Total non-current liabilities 1,716 1,709
Total liabilities 1,816 2,006
Net assets 13,613 13,696
Equity
Share capital 12,776 12,773
Retained profits 837 923
Total equity 13,613 13,696
Capital and expenditure commitments
There are no capital and expenditure commitments contracted for but not provided in the statement of financial position of the Company.
Contingent l iabil it ies
There are no parent entity contingent liabilities (2015: $19 million).
Parent entity guarantees
There are no parent entity guarantees in relation to the debts of its subsidiaries.
For
per
sona
l use
onl
y
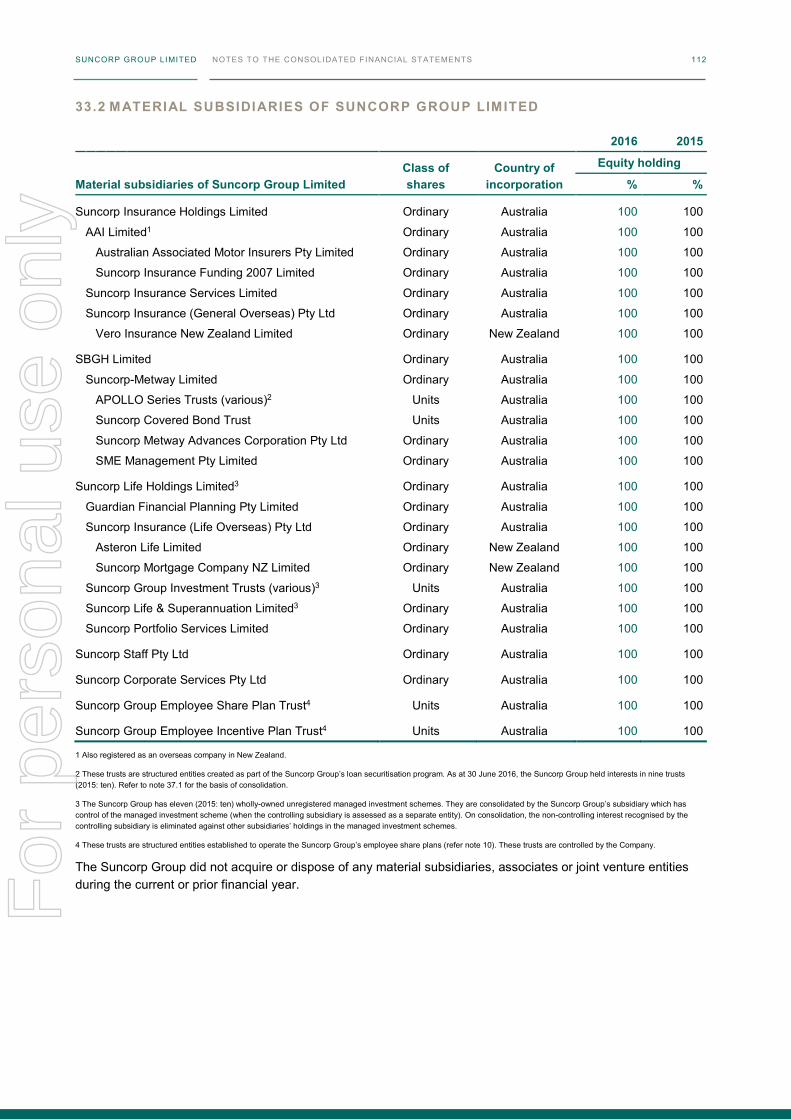
SUNCORP GROUP LIMITED NOTES TO THE CONSOLIDATED FINANCIAL STATEMENTS 112
33.2 MATERIAL SUBSIDIARIES OF SUNCORP GROUP LIMITED
2016 2015
Class of shares
Country of incorporation
Equity holding
Material subsidiaries of Suncorp Group Limited % %
Suncorp Insurance Holdings Limited Ordinary Australia 100 100
AAI Limited1 Ordinary Australia 100 100
Australian Associated Motor Insurers Pty Limited Ordinary Australia 100 100
Suncorp Insurance Funding 2007 Limited Ordinary Australia 100 100
Suncorp Insurance Services Limited Ordinary Australia 100 100
Suncorp Insurance (General Overseas) Pty Ltd Ordinary Australia 100 100
Vero Insurance New Zealand Limited Ordinary New Zealand 100 100
SBGH Limited Ordinary Australia 100 100
Suncorp-Metway Limited Ordinary Australia 100 100
APOLLO Series Trusts (various)2 Units Australia 100 100
Suncorp Covered Bond Trust Units Australia 100 100
Suncorp Metway Advances Corporation Pty Ltd Ordinary Australia 100 100
SME Management Pty Limited Ordinary Australia 100 100
Suncorp Life Holdings Limited3 Ordinary Australia 100 100
Guardian Financial Planning Pty Limited Ordinary Australia 100 100
Suncorp Insurance (Life Overseas) Pty Ltd Ordinary Australia 100 100
Asteron Life Limited Ordinary New Zealand 100 100
Suncorp Mortgage Company NZ Limited Ordinary New Zealand 100 100
Suncorp Group Investment Trusts (various)3 Units Australia 100 100
Suncorp Life & Superannuation Limited3 Ordinary Australia 100 100
Suncorp Portfolio Services Limited Ordinary Australia 100 100
Suncorp Staff Pty Ltd Ordinary Australia 100 100
Suncorp Corporate Services Pty Ltd Ordinary Australia 100 100
Suncorp Group Employee Share Plan Trust4 Units Australia 100 100
Suncorp Group Employee Incentive Plan Trust4 Units Australia 100 100
1 Also registered as an overseas company in New Zealand.
2 These trusts are structured entities created as part of the Suncorp Group’s loan securitisation program. As at 30 June 2016, the Suncorp Group held interests in nine trusts (2015: ten). Refer to note 37.1 for the basis of consolidation.
3 The Suncorp Group has eleven (2015: ten) wholly-owned unregistered managed investment schemes. They are consolidated by the Suncorp Group’s subsidiary which has control of the managed investment scheme (when the controlling subsidiary is assessed as a separate entity). On consolidation, the non-controlling interest recognised by the controlling subsidiary is eliminated against other subsidiaries’ holdings in the managed investment schemes.
4 These trusts are structured entities established to operate the Suncorp Group’s employee share plans (refer note 10). These trusts are controlled by the Company.
The Suncorp Group did not acquire or dispose of any material subsidiaries, associates or joint venture entities during the current or prior financial year. F
or p
erso
nal u
se o
nly

SUNCORP GROUP LIMITED NOTES TO THE CONSOLIDATED FINANCIAL STATEMENTS 112
33.2 MATERIAL SUBSIDIARIES OF SUNCORP GROUP LIMITED
2016 2015
Class of shares
Country of incorporation
Equity holding
Material subsidiaries of Suncorp Group Limited % %
Suncorp Insurance Holdings Limited Ordinary Australia 100 100
AAI Limited1 Ordinary Australia 100 100
Australian Associated Motor Insurers Pty Limited Ordinary Australia 100 100
Suncorp Insurance Funding 2007 Limited Ordinary Australia 100 100
Suncorp Insurance Services Limited Ordinary Australia 100 100
Suncorp Insurance (General Overseas) Pty Ltd Ordinary Australia 100 100
Vero Insurance New Zealand Limited Ordinary New Zealand 100 100
SBGH Limited Ordinary Australia 100 100
Suncorp-Metway Limited Ordinary Australia 100 100
APOLLO Series Trusts (various)2 Units Australia 100 100
Suncorp Covered Bond Trust Units Australia 100 100
Suncorp Metway Advances Corporation Pty Ltd Ordinary Australia 100 100
SME Management Pty Limited Ordinary Australia 100 100
Suncorp Life Holdings Limited3 Ordinary Australia 100 100
Guardian Financial Planning Pty Limited Ordinary Australia 100 100
Suncorp Insurance (Life Overseas) Pty Ltd Ordinary Australia 100 100
Asteron Life Limited Ordinary New Zealand 100 100
Suncorp Mortgage Company NZ Limited Ordinary New Zealand 100 100
Suncorp Group Investment Trusts (various)3 Units Australia 100 100
Suncorp Life & Superannuation Limited3 Ordinary Australia 100 100
Suncorp Portfolio Services Limited Ordinary Australia 100 100
Suncorp Staff Pty Ltd Ordinary Australia 100 100
Suncorp Corporate Services Pty Ltd Ordinary Australia 100 100
Suncorp Group Employee Share Plan Trust4 Units Australia 100 100
Suncorp Group Employee Incentive Plan Trust4 Units Australia 100 100
1 Also registered as an overseas company in New Zealand.
2 These trusts are structured entities created as part of the Suncorp Group’s loan securitisation program. As at 30 June 2016, the Suncorp Group held interests in nine trusts (2015: ten). Refer to note 37.1 for the basis of consolidation.
3 The Suncorp Group has eleven (2015: ten) wholly-owned unregistered managed investment schemes. They are consolidated by the Suncorp Group’s subsidiary which has control of the managed investment scheme (when the controlling subsidiary is assessed as a separate entity). On consolidation, the non-controlling interest recognised by the controlling subsidiary is eliminated against other subsidiaries’ holdings in the managed investment schemes.
4 These trusts are structured entities established to operate the Suncorp Group’s employee share plans (refer note 10). These trusts are controlled by the Company.
The Suncorp Group did not acquire or dispose of any material subsidiaries, associates or joint venture entities during the current or prior financial year.
SUNCORP GROUP LIMITED NOTES TO THE CONSOLIDATED FINANCIAL STATEMENTS 113
33.3 UNCONSOLIDATED STRUCTURED ENTITIES
The Suncorp Group conducts fiduciary activities as trustee or custodian for various investment funds and trusts, approved deposit funds, superannuation funds, and wholesale and retail unit trusts.
The trusts are governed by the terms under which they were created, as set out in their trust deeds. Suncorp Group is deemed a sponsor of these entities through normal terms and conditions and by the association of its brand names. Compensation received by the Suncorp Group from sponsored entities for the financial year ended 30 June 2016 related to fees from trust fiduciary activities of $56 million (2015: $62 million).
Suncorp Group does not have any other interests in these entities. Arrangements are in place to ensure activities relating to asset management and trusteeship and mortgage investments are managed separately from the operations of the Suncorp Group. The assets and liabilities of these trusts are not the property of the Suncorp Group and are not included in the consolidated financial statements as the Suncorp Group does not control these entities.
The funds under administration by trustee companies are listed in the table below.
Trustee/Fund Manager 2016 2015
$m $m
Asteron Life Limited (New Zealand), Asteron Retirement Investment Limited & Asteron Trust Services Limited1 320 299
Suncorp Funds Pty Ltd2 1,275 762
Suncorp Portfolio Services Limited3 6,806 7,173
1 Trustee and manager for a number of wholesale, superannuation and investment funds. The assets and liabilities of these trusts and funds are not consolidated in the financial statements as the Suncorp Group does not control these entities.
2 Trustee for various investment unit trusts.
3 Trustee for various internal and external superannuation funds.
Where Suncorp Group acting either as responsible entities or trustees, incur liabilities in respect of these activities, a right of indemnity exists against the assets of the applicable trusts. As these assets are sufficient to cover liabilities, and it is not probable that the subsidiaries will be required to settle them, the liabilities are not included in the consolidated financial statements.
34. KEY MANAGEMENT PERSONNEL (KMP) AND RELATED PARTY DISCLOSURES
34.1 KMP DISCLOSURES
Information regarding KMP remuneration, loans and equity instruments disclosures are included in the Remuneration Report section of the Directors’ Report.
The KMP compensation included in ‘Employee benefits expense’ (refer note 9.1) is as follows.
2016 2015
$000 $000
Short-term employee benefits 18,485 20,499
Long-term employee benefits 3,181 5,025
Post-employment benefits 495 435
Share-based payments 5,779 5,628
Termination benefits 2,207 -
30,147 31,587
For
per
sona
l use
onl
y
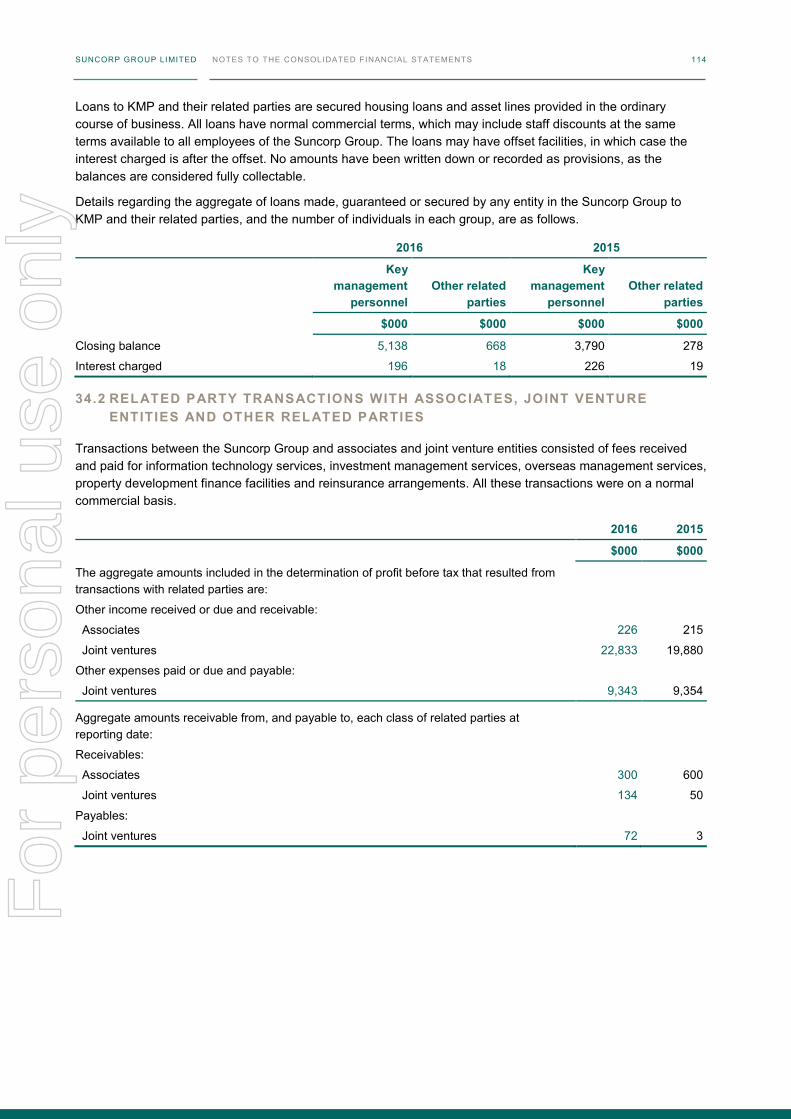
SUNCORP GROUP LIMITED NOTES TO THE CONSOLIDATED FINANCIAL STATEMENTS 114
Loans to KMP and their related parties are secured housing loans and asset lines provided in the ordinary course of business. All loans have normal commercial terms, which may include staff discounts at the same terms available to all employees of the Suncorp Group. The loans may have offset facilities, in which case the interest charged is after the offset. No amounts have been written down or recorded as provisions, as the balances are considered fully collectable.
Details regarding the aggregate of loans made, guaranteed or secured by any entity in the Suncorp Group to KMP and their related parties, and the number of individuals in each group, are as follows.
2016 2015
Key management
personnel Other related
parties
Key management
personnel Other related
parties
$000 $000 $000 $000
Closing balance 5,138 668 3,790 278
Interest charged 196 18 226 19
34.2 RELATED PARTY TRANSACTIONS WITH ASSOCIATES, JOINT VENTURE ENTITIES AND OTHER RELATED PARTIES
Transactions between the Suncorp Group and associates and joint venture entities consisted of fees received and paid for information technology services, investment management services, overseas management services, property development finance facilities and reinsurance arrangements. All these transactions were on a normal commercial basis.
2016 2015
$000 $000
The aggregate amounts included in the determination of profit before tax that resulted from transactions with related parties are:
Other income received or due and receivable:
Associates 226 215
Joint ventures 22,833 19,880
Other expenses paid or due and payable:
Joint ventures 9,343 9,354
Aggregate amounts receivable from, and payable to, each class of related parties at reporting date:
Receivables:
Associates 300 600
Joint ventures 134 50
Payables:
Joint ventures 72 3
For
per
sona
l use
onl
y
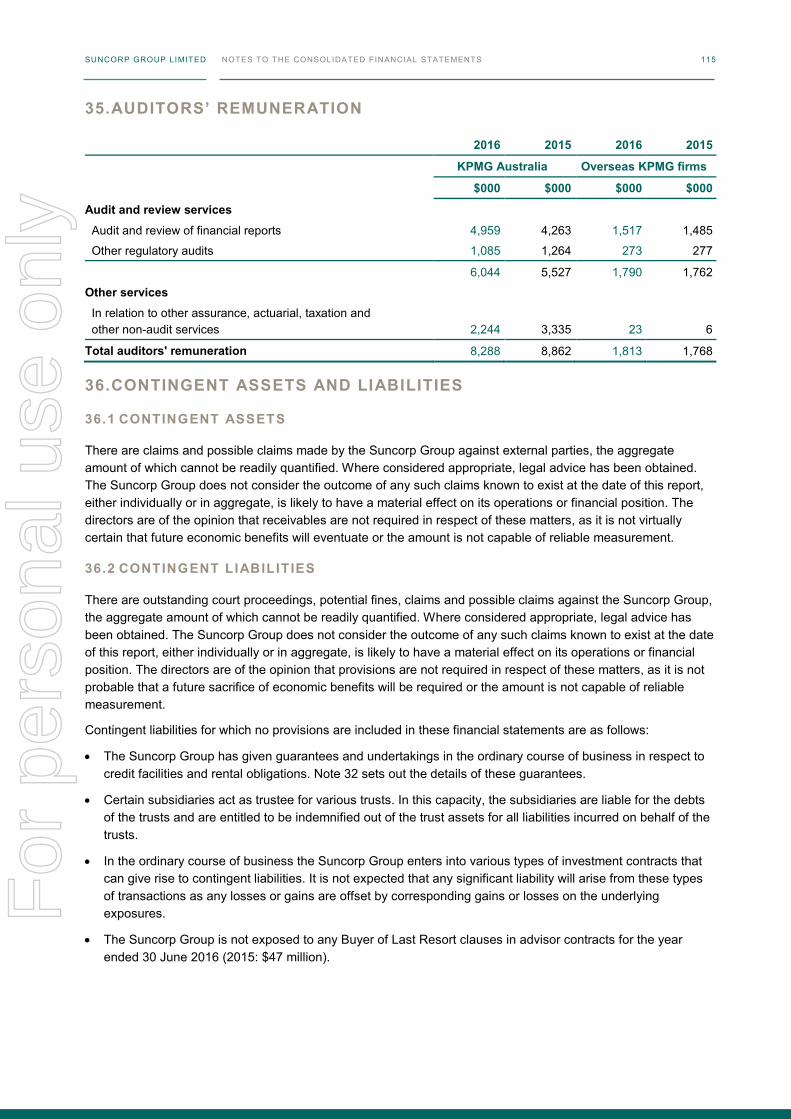
SUNCORP GROUP LIMITED NOTES TO THE CONSOLIDATED FINANCIAL STATEMENTS 114
Loans to KMP and their related parties are secured housing loans and asset lines provided in the ordinary course of business. All loans have normal commercial terms, which may include staff discounts at the same terms available to all employees of the Suncorp Group. The loans may have offset facilities, in which case the interest charged is after the offset. No amounts have been written down or recorded as provisions, as the balances are considered fully collectable.
Details regarding the aggregate of loans made, guaranteed or secured by any entity in the Suncorp Group to KMP and their related parties, and the number of individuals in each group, are as follows.
2016 2015
Key management
personnel Other related
parties
Key management
personnel Other related
parties
$000 $000 $000 $000
Closing balance 5,138 668 3,790 278
Interest charged 196 18 226 19
34.2 RELATED PARTY TRANSACTIONS WITH ASSOCIATES, JOINT VENTURE ENTITIES AND OTHER RELATED PARTIES
Transactions between the Suncorp Group and associates and joint venture entities consisted of fees received and paid for information technology services, investment management services, overseas management services, property development finance facilities and reinsurance arrangements. All these transactions were on a normal commercial basis.
2016 2015
$000 $000
The aggregate amounts included in the determination of profit before tax that resulted from transactions with related parties are:
Other income received or due and receivable:
Associates 226 215
Joint ventures 22,833 19,880
Other expenses paid or due and payable:
Joint ventures 9,343 9,354
Aggregate amounts receivable from, and payable to, each class of related parties at reporting date:
Receivables:
Associates 300 600
Joint ventures 134 50
Payables:
Joint ventures 72 3
SUNCORP GROUP LIMITED NOTES TO THE CONSOLIDATED FINANCIAL STATEMENTS 115
35. AUDITORS’ REMUNERATION
2016 2015 2016 2015
KPMG Australia Overseas KPMG firms
$000 $000 $000 $000
Audit and review services
Audit and review of financial reports 4,959 4,263 1,517 1,485
Other regulatory audits 1,085 1,264 273 277
6,044 5,527 1,790 1,762
Other services
In relation to other assurance, actuarial, taxation and other non-audit services 2,244 3,335 23 6
Total auditors' remuneration 8,288 8,862 1,813 1,768
36. CONTINGENT ASSETS AND LIABILITIES
36.1 CONTINGENT ASSETS
There are claims and possible claims made by the Suncorp Group against external parties, the aggregate amount of which cannot be readily quantified. Where considered appropriate, legal advice has been obtained. The Suncorp Group does not consider the outcome of any such claims known to exist at the date of this report, either individually or in aggregate, is likely to have a material effect on its operations or financial position. The directors are of the opinion that receivables are not required in respect of these matters, as it is not virtually certain that future economic benefits will eventuate or the amount is not capable of reliable measurement.
36.2 CONTINGENT LIABILITIES
There are outstanding court proceedings, potential fines, claims and possible claims against the Suncorp Group, the aggregate amount of which cannot be readily quantified. Where considered appropriate, legal advice has been obtained. The Suncorp Group does not consider the outcome of any such claims known to exist at the date of this report, either individually or in aggregate, is likely to have a material effect on its operations or financial position. The directors are of the opinion that provisions are not required in respect of these matters, as it is not probable that a future sacrifice of economic benefits will be required or the amount is not capable of reliable measurement.
Contingent liabilities for which no provisions are included in these financial statements are as follows:
• The Suncorp Group has given guarantees and undertakings in the ordinary course of business in respect to credit facilities and rental obligations. Note 32 sets out the details of these guarantees.
• Certain subsidiaries act as trustee for various trusts. In this capacity, the subsidiaries are liable for the debts of the trusts and are entitled to be indemnified out of the trust assets for all liabilities incurred on behalf of the trusts.
• In the ordinary course of business the Suncorp Group enters into various types of investment contracts that can give rise to contingent liabilities. It is not expected that any significant liability will arise from these types of transactions as any losses or gains are offset by corresponding gains or losses on the underlying exposures.
• The Suncorp Group is not exposed to any Buyer of Last Resort clauses in advisor contracts for the year ended 30 June 2016 (2015: $47 million).
For
per
sona
l use
onl
y
SUNCORP GROUP LIMITED NOTES TO THE CONSOLIDATED FINANCIAL STATEMENTS 116
37. SIGNIFICANT ACCOUNTING POLICIES
The Suncorp Group’s significant accounting policies set out below have been consistently applied by all Suncorp Group entities to all periods presented in these consolidated financial statements.
37.1 BASIS OF CONSOLIDATION
The Suncorp Group’s consolidated financial statements are the financial statements of the Company and all its subsidiaries, presented as those of a single economic entity. Intra-group transactions and balances are eliminated on consolidation.
(a) Subsidiaries
Subsidiaries are entities controlled by the Suncorp Group which includes companies, managed funds and trusts. The Suncorp Group controls an entity when it is exposed to, or has rights to, variable returns from its involvement with the entity and has the ability to affect those returns through its power over the entity. Subsidiaries are consolidated from the date when control commences until the date on which control ceases.
Non-controlling interests recognised as equity and managed funds units recognised as a liability arise when the Suncorp Group does not hold 100% of the shares or units in a subsidiary. They represent the external equity or liability interests in non-wholly owned subsidiaries of the Suncorp Group.
Structured entities (SE) are entities created to accomplish a narrow and well-defined objective such as the securitisation of particular assets or the execution of a specific borrowing or lending transaction. Critical judgments are applied in determining whether a SE is controlled and consolidated by the Suncorp Group. A SE is consolidated if the Suncorp Group is exposed to, or has rights to, variable returns from its involvement with the SE and has the ability to affect those returns through its power over the SE.
The main types of SE established by the Suncorp Group are securitisation trusts and covered bond trusts. The securitisation trusts and the covered bond trusts are controlled by the Suncorp Group and are consolidated in the consolidated financial statements.
(b) Business combination of ent it ies under common control
In a business combination arising from transfers of interests in entities that are under the control of the ultimate parent entity, the assets and liabilities are acquired at the carrying amounts recognised previously in the Suncorp Group's consolidated financial statements.
37.2 FOREIGN CURRENCY
(a) Foreign currency transactions
Transactions denominated in foreign currencies are translated into the functional currency of the operation using the spot exchange rates at the date of the transaction. Foreign currency monetary assets and liabilities at reporting date are translated into the functional currency using the spot exchange rates current on that date. The resulting differences on monetary items are recognised as exchange gains or losses in the financial year in which the exchange rates difference arises. Foreign currency non-monetary assets and liabilities that are measured in terms of historical cost are translated using the exchange rates at the date of the transaction.
Foreign currency non-monetary assets and liabilities that are stated at fair value are translated using exchange rates at the dates the fair value was determined. Where a non-monetary asset is classified as an available-for-sale financial asset, the gain or loss is recognised in other comprehensive income.
Where a foreign currency transaction is part of a hedge relationship, it is accounted for as above, subject to the hedge accounting rules set out in note 37.8.
SUNCORP GROUP LIMITED NOTES TO THE CONSOLIDATED FINANCIAL STATEMENTS 117
(b) Foreign operations
The assets and liabilities of foreign operations are translated to Australian dollars at exchange rates at the reporting date. The income and expenses of foreign operations are translated at rates approximating the foreign exchange rates ruling at the dates of the transactions. Foreign exchange differences arising on translation are recognised in other comprehensive income and presented in the foreign currency translation reserve.
37.3 REVENUE AND EXPENSE RECOGNITION
(a) Premium revenue
General insurance contracts
Premium revenue comprises amounts charged to policyowners and includes applicable levies and charges such as fire service levies but excludes stamp duty and taxes collected on behalf of third parties such as GST. Premiums are recognised as revenue in accordance with the pattern of the underlying risk exposure from the date of attachment over the period of the insurance policy, which is usually one year.
Premiums on unclosed business are brought to account by reference to the prior years' experience and information that has become available between the reporting date and the date of completing the consolidated financial statements.
Life insurance and investment contracts
Premium recorded as revenue relates to risk-bearing life insurance contracts. The components of premium that relate to life investment contracts are in the nature of deposits and are recognised as a movement in policy liabilities.
Life insurance premiums with no due date are recognised as revenue on a cash received basis. Premiums with a regular due date are recognised on an accruals basis.
(b) Claims expenses and movements in policy l iabi l it ies
General insurance contracts
Claims expense represents payments for claims and the movement in outstanding claims liabilities. Claims represent the benefits paid or payable to the policyowner on the occurrence of an event giving rise to a loss or accident according to the terms of the policy. Claims expenses are recognised in profit or loss as losses are incurred, which is usually the point in time when the event giving rise to the claim occurs.
Life insurance and investment contracts
Insurance claims are recognised in profit or loss when the liability to the policyowner under the policy contract has been established or upon notification of the insured event, depending on the type of claim.
The component of a life insurance contract claim that relates to the bearing of risks is treated as a claim expense. Other life insurance claims amounts and all life investment contract amounts paid to policyowners are in the nature of withdrawals and are recognised as a decrease in policy liabilities.
The change in policy liabilities is recognised in profit or loss and incorporated in claims expenses and movements in policy liabilities.
(c) Outward reinsurance expense
Premiums ceded to reinsurers are recognised as an expense from the attachment date over the period of indemnity of the reinsurance contract in accordance with the expected pattern of the incidence of risk.
Reinsurance premiums are deferred and recognised as an asset where there are future economic benefits to be received from reinsurance premiums.
For
per
sona
l use
onl
y
SUNCORP GROUP LIMITED NOTES TO THE CONSOLIDATED FINANCIAL STATEMENTS 118
(d) Interest income and expense
Interest income and expense are recognised in profit or loss using the effective interest method. This includes fees and commission income and expense (e.g. lending fees) that are integral to the effective interest rate on a financial asset or liability.
(e) Div idends and distribution income
Dividends and distribution income are recognised when the right to receive income is established.
( f ) Other income
Non-yield related application and activation lending fee revenue is recognised when the loan is disbursed or the commitment to lend expires.
Service fees that represent the recoupment of the costs of providing services, for example maintaining and administering existing facilities, insurance portfolio fund management services income, and asset management services, are recognised on an accrual basis when the service is provided.
37.4 INCOME TAX
Income tax expense comprises current and deferred tax and is recognised in the profit or loss except to the extent it relates to items recognised in equity or in other comprehensive income.
Current tax consists of the expected tax payable on the taxable income for the year, after any adjustments in respect of previous years.
Deferred tax is recognised in respect of temporary differences between the carrying amounts of assets and liabilities for financial reporting purposes and the amounts used for taxation purposes.
Deferred tax assets are recognised when it is probable that future taxable profits will be available against which the temporary differences can be utilised. Provisions for taxation require the Suncorp Group to take into account the impact of uncertain tax positions. For such uncertainties, the Suncorp Group relies on estimates and assumptions about future events.
AASB 1038 Life Insurance Contracts requires shareholder and policyowner tax to be included in income tax expense in the profit or loss. The majority of life insurance tax is allocated to policy liabilities and does not affect profit attributable to owners of the Company.
Tax consolidat ion
The Company is the head entity in the tax-consolidated group comprising all the Australian wholly-owned subsidiaries. Consequently, all members of the tax-consolidated group are taxed as a single entity.
The members recognise the current and deferred tax amounts applicable to the transactions undertaken by it, reasonably adjusted for certain intra group transactions, as if it continued to be a separate tax payer. The Company also recognises the entire tax-consolidated group’s current tax liability. Any differences between the current tax liability and any tax funding arrangement amounts (see below) are recognised by the Company as an equity contribution to, or distribution from, the subsidiary.
The members of the tax-consolidated group have entered into a tax sharing agreement and a tax funding agreement. Under the tax funding agreement, the wholly-owned entities fully compensate the Company for any current tax payable assumed. The assets and liabilities arising under the tax funding agreement are recognised as intercompany assets and liabilities, at call.
Taxat ion of f inancial arrangements
The Company has accepted the default method of accruals or realisation and has not made any elections regarding transitional financial arrangements or other elective timing methods.
SUNCORP GROUP LIMITED NOTES TO THE CONSOLIDATED FINANCIAL STATEMENTS 119
37.5 CASH AND CASH EQUIVALENTS
Cash and cash equivalents include cash on hand, cash at branches, cash on deposit, balances with the Reserve Bank of Australia, highly liquid short-term investments, money at short call, and securities held under reverse repurchase agreements with an original maturity of three months or less. Receivables due from and payables due to other banks are classified as cash equivalents for cash flow purposes. Bank overdrafts are shown within financial liabilities unless there is a right of offset.
Receivables due from and payables due to other banks include collateral posted or received on derivative positions, nostro balances and settlement account balances. They are carried at the gross value of the outstanding balance.
37.6 NON-DERIVATIVE FINANCIAL ASSETS
(a) Financial assets at fair value through prof it or loss
Financial assets at fair value through profit or loss are classified as either held for trading or are designated as such upon initial recognition as a result of the following:
• if the Suncorp Group manages such investments, evaluates the performance and makes purchase and sale decisions based on their fair value in accordance with the Suncorp Group's documented risk management or investment strategy; or
• it eliminates or significantly reduces a measurement or recognition inconsistency.
They are initially recognised on trade date at fair value. Transaction costs are recognised in the profit or loss as incurred. Subsequently, the assets are measured at fair value on each reporting date and any gains or losses are taken immediately to the profit or loss.
The Suncorp Group's financial assets at fair value through profit or loss include trading securities and investment securities (including those investment securities backing general insurance, life insurance and life investment policy liabilities).
The Suncorp Group has designated financial assets held in portfolios that match the average duration of a corresponding insurance liability as assets backing General insurance liabilities.
(b) Held-to-maturity investments
Held-to-maturity investments are non-derivative financial assets with fixed or determinable payments and fixed maturity that the Suncorp Group has the positive intention and ability to hold to maturity. They are initially recognised on trade date at fair value plus any directly attributable transaction costs and subsequently are measured at amortised cost using the effective interest rate method at each reporting date.
(c) Loans and other receivables
Loans and other receivables are financial assets with fixed or determinable payments that are not quoted in an active market. These include all forms of lending and direct finance provided to banking customers including finance leases, premiums outstanding and other insurance receivables. They are initially recognised on the date they originated.
They are initially measured at fair value plus any directly attributable transaction costs and subsequently measured at amortised cost less any impairment losses.
(d) Avai lable-for-sale f inancial assets
Available-for-sale financial assets consist of debt and equity securities which are intended to be held for an indefinite period of time, but which may be sold in response to a need for liquidity or changes in interest rates or exchange rates. They are initially recognised on trade date at fair value plus any directly attributable transaction costs and are measured at fair value at each reporting date.
For
per
sona
l use
onl
y
SUNCORP GROUP LIMITED NOTES TO THE CONSOLIDATED FINANCIAL STATEMENTS 120
Fair value gains and losses, other than foreign exchange gains and losses on debt securities, are recognised in other comprehensive income until impaired or derecognised, whereupon the cumulative gains and losses previously recognised in other comprehensive income are transferred to profit or loss. Foreign exchange gains and losses on debt securities are recognised in profit or loss.
(e) Derecognit ion of f inancial assets
Financial assets are derecognised when the rights to receive future cash flows from the assets have expired, or have been transferred, and the Suncorp Group has transferred substantially all risk and rewards of ownership.
( f ) Repurchase agreements and reverse repurchase agreements
When the Suncorp Group sells a financial asset and simultaneously enters into an agreement to repurchase the asset at a fixed price on a future date (repurchase agreement), the financial assets sold under such agreements continue to be recognised as a financial asset and the obligation to repurchase recognised as a liability.
Securities purchased under agreements to resell, where the Group does not acquire the risks and rewards of ownership, are recorded as receivables in cash or net loans and advances if the original maturity is greater than 90 days. The security is not included in the balance sheet. Interest income is accrued on the underlying loan amount.
37.7 DERIVATIVE FINANCIAL INSTRUMENTS
The Suncorp Group holds derivative financial instruments to hedge the Suncorp Group's assets and liabilities or as part of the Suncorp Group's trading and investment activities.
All derivatives are initially recognised at fair value on trade date and transaction costs are recognised in profit or loss as incurred. Derivatives are classified and accounted for as held for trading financial assets at fair value through profit or loss (note 37.6) unless they qualify as a hedging instrument in an effective hedge relationship under hedge accounting (note 37.8).
Embedded derivatives
Where a derivative is embedded in another financial instrument, the economic characteristics and risks of the derivative are not closely related to those of the host contract and the host contract is not carried at fair value, the embedded derivative is separated from the host contract and carried at fair value through profit or loss. Otherwise, the embedded derivative is accounted for on the same basis as the host contract.
37.8 HEDGE ACCOUNTING
The Suncorp Group applies hedge accounting to offset the effects on profit or loss of changes in the fair values of the hedging instrument and the hedged item.
(a) Cash f low hedges
Changes in the fair value associated with the effective portion of a hedging instrument designated as a cash flow hedge are recognised in other comprehensive income and accumulated in the hedging reserve within equity as the lesser of the cumulative fair value gain or loss on the hedging instrument and the cumulative change in fair value on the hedged item from the inception of the hedge. Ineffective portions are immediately recognised in the profit or loss.
If the hedging instrument no longer meets the criteria for hedge accounting, expires or is sold, terminated or exercised or, the hedge relationship is revoked, then hedge accounting is discontinued prospectively. The cumulative gain or loss previously recognised in equity remains there until the forecast transaction affects profit or loss. When a forecast transaction is no longer expected to occur, the amounts accumulated in equity are released to profit or loss immediately. In other cases the cumulative gain or loss previously recognised in equity is transferred to profit or loss in the same period that the hedged item affects profit or loss.
SUNCORP GROUP LIMITED NOTES TO THE CONSOLIDATED FINANCIAL STATEMENTS 121
(b) Fair value hedges
Where an effective hedge relationship is established, fair value gains or losses on the hedging instrument are recognised in profit or loss. The hedged item attributable to the hedged risk is carried at fair value with the gain or loss recognised in profit or loss.
When a hedging relationship no longer meets the criteria for hedge accounting, the hedged item is accounted for under the effective interest method from that point and any accumulated adjustment to the carrying value of the hedged item from when it was effective is released to profit or loss over the period to when the hedged item will mature.
37.9 REINSURANCE AND OTHER RECOVERIES RECEIVABLE
General insurance contracts
Reinsurance and other recoveries are measured as the present value of the expected future receipts, calculated on the same basis as the outstanding claims liabilities relating to general insurance contracts.
Life insurance contracts
Policy claims recoverable from reinsurers recognise the amount for credit risk as appropriate. Given the short-term nature of these receivables, the recoverable amount approximates fair value.
37.10 DEFERRED ACQUISITION COSTS (DAC)
General insurance contracts
Acquisition costs are deferred and recognised as an asset when they can be reliably measured and when it is probable that they will give rise to premium revenue that will be recognised in profit or loss in subsequent reporting periods.
Deferred acquisition costs (DAC) are amortised systematically in accordance with the expected pattern of the incidence of risk under the general insurance contracts to which they relate.
DAC are recognised as assets to the extent that the related unearned premiums exceed the sum of the DAC and the present value of both future expected claims and settlement costs, including an appropriate risk margin. Where there is a shortfall, the DAC asset is written down and if insufficient, an unexpired risk liability is recognised.
The carrying value of unearned premium liabilities is assessed at each reporting date by carrying out a liability adequacy test (LAT). This test assesses whether the net unearned premium liabilities less any DAC is sufficient to cover future claims costs for in-force insurance contracts. Future claims costs are calculated as the present value of the expected cash flows relating to future claims, and include a risk margin to reflect the inherent uncertainty in the central estimate. The assessment is carried out on each portfolio of contracts subject to broadly similar risks and managed together as a single portfolio. If a LAT deficiency occurs, it is recognised in the profit or loss with a corresponding write-down of the related DAC asset. Any remaining balance is recognised as an unexpired risk liability on the consolidated statement of financial position.
Life insurance and investment contracts
DAC related to life insurance contracts represent the fixed and variable costs of acquiring new business and include commissions, certain advertising and underwriting costs. DAC related to life insurance contracts are implicitly deferred through Margin on Services (MoS) methodology (note 37.16(b)). The deferred amounts are recognised in the consolidated statement of financial position as a reduction in life insurance policy liabilities. The amount deferred is subject to an overall limit such that the value of future profits at inception cannot be negative.
DAC related to life investment contracts include the variable costs of acquiring new business and include commission costs. The deferred amounts are recognized as an asset and are amortised in accordance with the expected earning pattern of the associated revenue. All other acquisition costs are expensed as incurred.
For
per
sona
l use
onl
y
SUNCORP GROUP LIMITED NOTES TO THE CONSOLIDATED FINANCIAL STATEMENTS 122
37.11 INTANGIBLE ASSETS
(a) In it ial recognit ion and measurement
Intangible assets are recognised at cost less any accumulated amortisation and any accumulated impairment losses. Where an intangible asset is acquired in a business combination, the cost of that asset is its fair value at acquisition date.
Goodwill is recognised at cost from business combinations and is subsequently measured at cost less accumulated impairment loss.
Internally generated intangible assets
Internally generated intangible assets such as software are recognised at cost, which comprises all directly attributable costs necessary to purchase, create, produce, and prepare the asset to be capable of operating in the manner intended by management.
All other expenditure, including expenditure on software maintenance, research costs and brands is recognised as an expense as incurred.
(b) Amortisation
Intangible assets with finite lives are amortised over the estimated useful lives from the date the asset is available for use. Amortisation is charged to profit or loss in a manner that reflects the pattern in which the asset’s future economic benefits are expected to be consumed using straight-line or diminishing balance methods. All intangible assets except goodwill have finite useful lives. The maximum remaining useful lives as outlined in note 16 are reviewed annually.
Intangible assets deemed to have an indefinite useful life are not amortised but are tested for impairment at least annually.
37.12 IMPAIRMENT
(a) Financial assets
Financial assets, other than those measured at fair value through profit and loss, are assessed each reporting date to determine whether there is any objective evidence of impairment. If impairment has occurred, the carrying amount of the asset is written down to its estimated recoverable amount.
Loans and receivables
An impairment loss is recognised in respect of financial assets measured at amortised cost when the carrying amount of the asset exceeds the present value of estimated future cash flows discounted at the asset's original effective interest rate. When impairment losses are recognised, the carrying amount of the relevant asset or group of assets is reduced by the balance of the provision for impairment. If a subsequent event causes the amount of the impairment loss to decrease, the impairment loss is reversed through profit or loss.
The amount necessary to bring the impairment provisions to their assessed levels, after write-offs, is charged to profit or loss. All known bad debts are written off in the period in which they are identified. Where not previously provided for, they are written off directly to profit or loss.
The unwinding of the discount from initial recognition of impairment through to recovery of the written down amount is recognised through interest income. F
or p
erso
nal u
se o
nly
SUNCORP GROUP LIMITED NOTES TO THE CONSOLIDATED FINANCIAL STATEMENTS 122
37.11 INTANGIBLE ASSETS
(a) In it ial recognit ion and measurement
Intangible assets are recognised at cost less any accumulated amortisation and any accumulated impairment losses. Where an intangible asset is acquired in a business combination, the cost of that asset is its fair value at acquisition date.
Goodwill is recognised at cost from business combinations and is subsequently measured at cost less accumulated impairment loss.
Internally generated intangible assets
Internally generated intangible assets such as software are recognised at cost, which comprises all directly attributable costs necessary to purchase, create, produce, and prepare the asset to be capable of operating in the manner intended by management.
All other expenditure, including expenditure on software maintenance, research costs and brands is recognised as an expense as incurred.
(b) Amortisation
Intangible assets with finite lives are amortised over the estimated useful lives from the date the asset is available for use. Amortisation is charged to profit or loss in a manner that reflects the pattern in which the asset’s future economic benefits are expected to be consumed using straight-line or diminishing balance methods. All intangible assets except goodwill have finite useful lives. The maximum remaining useful lives as outlined in note 16 are reviewed annually.
Intangible assets deemed to have an indefinite useful life are not amortised but are tested for impairment at least annually.
37.12 IMPAIRMENT
(a) Financial assets
Financial assets, other than those measured at fair value through profit and loss, are assessed each reporting date to determine whether there is any objective evidence of impairment. If impairment has occurred, the carrying amount of the asset is written down to its estimated recoverable amount.
Loans and receivables
An impairment loss is recognised in respect of financial assets measured at amortised cost when the carrying amount of the asset exceeds the present value of estimated future cash flows discounted at the asset's original effective interest rate. When impairment losses are recognised, the carrying amount of the relevant asset or group of assets is reduced by the balance of the provision for impairment. If a subsequent event causes the amount of the impairment loss to decrease, the impairment loss is reversed through profit or loss.
The amount necessary to bring the impairment provisions to their assessed levels, after write-offs, is charged to profit or loss. All known bad debts are written off in the period in which they are identified. Where not previously provided for, they are written off directly to profit or loss.
The unwinding of the discount from initial recognition of impairment through to recovery of the written down amount is recognised through interest income.
SUNCORP GROUP LIMITED NOTES TO THE CONSOLIDATED FINANCIAL STATEMENTS 123
(b) Non-f inancial assets
Non-financial assets are assessed for indicators of impairment at each reporting date. If any such indication exists, the asset's recoverable amount is estimated in order to determine the extent of the impairment loss (if any).
For the purposes of assessing impairment, assets are grouped at the lowest levels for which there are separately identifiable cash flows (cash generating unit (CGU)) which may be an individual asset or a group of assets. The recoverable amount is the greater of fair value less costs to sell and value in use. In assessing value in use, the estimated future cash flows are discounted to their present value using a pre-tax discount rate that reflects current market assessments of the time value of money and the risks specific to the asset or CGU.
Impairment losses are recognised in profit or loss if the carrying amount of an asset or CGU exceeds its recoverable amount. Impairment losses, if any, recognised in respect of the CGU are allocated first to reduce the carrying amount of any goodwill allocated to the CGU and then to reduce the carrying amount of the other assets in the unit on a pro-rata basis.
An impairment loss recognised for goodwill is not reversed.
37.13 NON-DERIVATIVE FINANCIAL LIABILITIES
(a) Financial l iabi l i t ies at fair value through prof it or loss
These liabilities are classified as either held for trading or those that are designated upon initial recognition. Liabilities are initially recognised on trade date at fair value with any directly attributable transaction costs recognised in profit or loss as incurred. Fair value is determined using the offer price where available. Movements in the fair value are recognised in the profit or loss. The Suncorp Group designates certain short-term offshore borrowings at fair value through profit or loss when they are managed on a fair value basis.
(b) Financial l iabi l it ies at amort ised cost
Financial liabilities at amortised cost are initially measured at fair value plus any directly attributable transaction costs. They are subsequently measured at amortised cost using the effective interest method. The Suncorp Group's financial liabilities at amortised cost includes deposits and short-term borrowings, debt issues, subordinated notes and preference shares.
(c) Hybrid instruments
Hybrid instruments are those that have an embedded derivative that should be separated, and has both financial liability and equity characteristics.
The embedded derivative component is accounted for separately from the host contract and is recognised at fair value on initial recognition. At the date of issue, the fair value of the liability component is estimated using the prevailing market interest rate for a similar non-convertible instrument. The amount allocated to the equity component is the residual.
Issue costs are apportioned between the liability and equity components of the instruments on their relative carrying amounts at the date of issue.
(d) Derecognit ion of f inancial l iabil it ies
Non-derivative financial liabilities are derecognised when the contractual obligations are discharged, cancelled or expired.
For
per
sona
l use
onl
y

SUNCORP GROUP LIMITED NOTES TO THE CONSOLIDATED FINANCIAL STATEMENTS 124
37.14 EMPLOYEE ENTITLEMENTS
(a) Short-term employee benef its
Liabilities for short-term employee benefits are those expected to be settled wholly before twelve months after the end of the reporting period in which the employees render the related services. They are measured at the amounts expected to be paid when the liabilities are settled. Related on-costs such as superannuation, workers' compensation and payroll tax are also included in the liability.
(b) Long serv ice leave and annual leave
The liability for long service leave and annual leave are those not expected to be settled wholly before twelve months after the end of the reporting period. They are measured as the present value of expected future payments to be made in respect of services provided by employees up to the reporting date. Consideration is given to expected future wage and salary levels, experience of employee departures and periods of service. Expected future payments are discounted using Australian corporate bond rates and New Zealand Government bond rates with terms to maturity that match, as closely as possible, the estimated future cash outflows. Related on-costs such as superannuation, workers' compensation and payroll tax are also included in the liability.
(c) Share-based payments
The fair value of share-based payments is recognised as an expense on a straight line basis over the vesting period, with a corresponding increase in equity. The fair value is calculated on grant date as the fair value of each share granted multiplied by the number of shares expected to eventually vest. The fair value of the share-based payments is based on the market price of the shares, dividend entitlements, and market vesting conditions (e.g. share price-related performance criteria) upon which the shares were granted. Non-market vesting conditions (e.g. service conditions) are taken into account by adjusting the number of shares which will eventually vest and are not taken into account in the determination of the grant date fair value. On a cumulative basis, no expense is recognised for shares granted that do not vest due to a non-market vesting condition not being satisfied.
(d) Termination benefits
Termination benefits are recognised as an expense when the Group can no longer withdraw the offer of those benefits and when the Group recognises costs for a restructuring. Termination benefits for voluntary redundancies are recognised as an expense if the Group can no longer withdraw the offer as an employee has accepted the offer or when a restriction on the Group’s ability to withdraw the offer takes effect.
37.15 UNEARNED PREMIUM LIABILITIES
Premium revenue received and receivable but not earned is recognised as unearned premium liabilities.
37.16 INSURANCE LIABILITIES
(a) General insurance contracts
The outstanding claims liability is measured as the central estimate of the present value of expected future payments relating to claims incurred at the reporting date with an additional risk margin to allow for the inherent uncertainty of the central estimate. Standard actuarial methods are applied to determine the net central estimate of outstanding claims liabilities. The details of actuarial assumptions and the process for determining the risk margins are set out in note 19.4.
(b) Life insurance contracts
Life insurance contract liabilities are calculated using the MoS methodology. Under MoS, the excess of premium received over expected claims and expenses is recognised over the life of the contract in a manner that reflects the pattern of risk accepted from the policyowner. The profit release is controlled by a profit carrier.
For
per
sona
l use
onl
y
SUNCORP GROUP LIMITED NOTES TO THE CONSOLIDATED FINANCIAL STATEMENTS 124
37.14 EMPLOYEE ENTITLEMENTS
(a) Short-term employee benef its
Liabilities for short-term employee benefits are those expected to be settled wholly before twelve months after the end of the reporting period in which the employees render the related services. They are measured at the amounts expected to be paid when the liabilities are settled. Related on-costs such as superannuation, workers' compensation and payroll tax are also included in the liability.
(b) Long serv ice leave and annual leave
The liability for long service leave and annual leave are those not expected to be settled wholly before twelve months after the end of the reporting period. They are measured as the present value of expected future payments to be made in respect of services provided by employees up to the reporting date. Consideration is given to expected future wage and salary levels, experience of employee departures and periods of service. Expected future payments are discounted using Australian corporate bond rates and New Zealand Government bond rates with terms to maturity that match, as closely as possible, the estimated future cash outflows. Related on-costs such as superannuation, workers' compensation and payroll tax are also included in the liability.
(c) Share-based payments
The fair value of share-based payments is recognised as an expense on a straight line basis over the vesting period, with a corresponding increase in equity. The fair value is calculated on grant date as the fair value of each share granted multiplied by the number of shares expected to eventually vest. The fair value of the share-based payments is based on the market price of the shares, dividend entitlements, and market vesting conditions (e.g. share price-related performance criteria) upon which the shares were granted. Non-market vesting conditions (e.g. service conditions) are taken into account by adjusting the number of shares which will eventually vest and are not taken into account in the determination of the grant date fair value. On a cumulative basis, no expense is recognised for shares granted that do not vest due to a non-market vesting condition not being satisfied.
(d) Termination benefits
Termination benefits are recognised as an expense when the Group can no longer withdraw the offer of those benefits and when the Group recognises costs for a restructuring. Termination benefits for voluntary redundancies are recognised as an expense if the Group can no longer withdraw the offer as an employee has accepted the offer or when a restriction on the Group’s ability to withdraw the offer takes effect.
37.15 UNEARNED PREMIUM LIABILITIES
Premium revenue received and receivable but not earned is recognised as unearned premium liabilities.
37.16 INSURANCE LIABILITIES
(a) General insurance contracts
The outstanding claims liability is measured as the central estimate of the present value of expected future payments relating to claims incurred at the reporting date with an additional risk margin to allow for the inherent uncertainty of the central estimate. Standard actuarial methods are applied to determine the net central estimate of outstanding claims liabilities. The details of actuarial assumptions and the process for determining the risk margins are set out in note 19.4.
(b) Life insurance contracts
Life insurance contract liabilities are calculated using the MoS methodology. Under MoS, the excess of premium received over expected claims and expenses is recognised over the life of the contract in a manner that reflects the pattern of risk accepted from the policyowner. The profit release is controlled by a profit carrier.
SUNCORP GROUP LIMITED NOTES TO THE CONSOLIDATED FINANCIAL STATEMENTS 125
The projection method is generally used to determine life insurance contract liabilities. The net present value of projected cash flows is calculated using best estimate assumptions about the future. When the benefits under the life insurance contract are linked to the assets backing it, the discount rate applied is based on the expected future earnings rate of those assets. Otherwise, a risk-free discount rate is used.
An accumulation method has been used for some risk business, where the liability is based on an unearned premium reserve, less an explicit allowance for DAC, and a reserve for incurred but not reported claims.
Participating policies are entitled to share in the profits that arise from participating business. This profit-sharing is governed by the Life Act and the Life companies' constitutions. The participating policyowner profit-sharing entitlement is treated as an expense in the profit or loss.
The operating profit arising from discretionary participating contracts is allocated between shareholders and participating policyowners by applying the MoS principles in accordance with the Life Act and the New Zealand Society of Actuaries Professional Standard Number 3 Determination of Life Insurance Policy Liabilities.
Profit allocated to participating policyowners is recognised as an increase in policy liabilities. Both the element of this profit that has not yet been allocated to specific policyowners (i.e. unvested) and that which has been allocated to specific policyowners by way of bonus distributions (i.e. vested) are included within life insurance contract liabilities.
(c) Life investment contracts
A life investment contract involves both the origination of a financial instrument and the provision of investment management services. Policy liabilities are measured at the fair value of the financial instrument component of the contract (designated as fair value through profit or loss) plus the liability in respect of the management services element. The management services element, including the associated acquisition costs, is recognised as revenue as services are performed.
For investment-linked products, the life investment contract liability is directly linked to the performance and value of the assets that back them and is determined as the fair value of those assets after tax. For fixed income products, the liability is determined as the net present value of expected cash flows, subject to a minimum of the current surrender value.
37.17 OTHER SIGNIFICANT ACCOUNTING POLICIES SPECIFICALLY APPLICABLE TO LIFE INSURANCE CONTRACTS
Under the Life Act, the business activities of the Australian Life company is conducted within one or more separate statutory funds, which are distinguished from each other and from the shareholder funds. The financial report of the Australian Life company, which is lodged with the relevant Australian regulators, is prepared in accordance with AASB 1038 Life Insurance Contracts. It shows all major components of the financial statements disaggregated between the various life insurance statutory funds and its shareholder funds, as well as between investment-linked business and non-investment-linked business.
The assets of Life companies are allocated between the policyowners and shareholder funds with all assets, liabilities, revenues and expenses recognised in the financial statements, irrespective of whether they are policyowner or shareholder owned.
The shareholder's entitlement to monies held in the statutory funds is subject to the distribution and transfer restrictions and other requirements of the Life Act and the relevant Life company’s constitution. The main restrictions are that the assets in a fund can only be used to meet the liabilities and expenses of that fund, to acquire investments to further the business of the fund, or as distributions.
Basis of expense apport ionment
Life insurance expenditure has been apportioned to the different classes of business in accordance with Division 2 of Part 6 of the Life Act. The expense apportionment basis is in line with the principles set out in APRA Prudential Standard LPS 340 Valuation of Policy Liabilities and the New Zealand Society of Actuaries Professional Standard Number 3 Determination of Life Insurance Policy Liabilities.
For
per
sona
l use
onl
y
SUNCORP GROUP LIMITED NOTES TO THE CONSOLIDATED FINANCIAL STATEMENTS 126
Expenses excluding investment management fees, which are directly identifiable, have been apportioned between policy acquisition and policy maintenance on the basis of the objective when incurring each expense, and the outcome achieved. Where allocation is not feasible between the disclosure categories, expenses have been allocated as maintenance expenses.
Expenses directly attributable to an individual policy or product are allocated directly to the statutory fund within the class of business of that policy or product. All indirect expenses charged to profit or loss are equitably apportioned to each class of business.
Statistics such as policy counts, annual premiums, funds under management and claims payments are used to apportion the expenses to individual life insurance and life investment products.
37.18 TREASURY SHARES
Treasury shares are deducted from consolidated equity at the amount of the consideration paid. No gain or loss on treasury shares is recognised.
37.19 LEASES
A distinction is made between finance leases (which effectively transfer substantially all the risks and benefits incidental to ownership of leased non-current assets from the lessor to the lessee) and operating leases (under which the lessor effectively retains substantially all such risks and benefits).
Payments made under operating leases are expensed on a straight-line basis over the term of the lease.
37.20 CONTINGENT LIABILITIES AND CONTINGENT ASSETS
Contingent liabilities are not recognised but are disclosed in the consolidated financial statements, unless the possibility of settlement is remote, in which case no disclosure is made. If settlement becomes probable and the amount can be reliably estimated, a provision is recognised.
Contingent assets are not recognised but are disclosed in the consolidated financial statements when inflows are probable. If inflows become virtually certain, an asset is recognised.
The amount disclosed as a contingent liability or contingent asset is the best estimate of the settlement or inflow.
37.21 NEW ACCOUNTING STANDARDS AND INTERPRETATIONS NOT YET ADOPTED
AASB 9 Financial Instruments was issued and introduces changes in the classification and measurement of financial assets and financial liabilities, impairment of financial assets and new rules for hedge accounting. This standard becomes mandatory for the Suncorp Group’s 30 June 2019 financial statements. The potential effects on adoption of the standard are currently being assessed.
AASB 16 Leases was issued and introduced changes to lessee accounting. It requires recognition of lease liabilities and assets other than short-term leases or leases of low-value assets on statement of financial position. This will replace the operating / finance lease distinction and accounting requirements prescribed in AASB 117 Leases. This standard will become mandatory for the Suncorp Group’s 30 June 2020 financial statements. The potential effects on adoption of the standard are currently being assessed.
AASB 9 and AASB 16 are available for early adoption but have not been applied by the Suncorp Group in this financial report.
38. SUBSEQUENT EVENTS
There has not arisen in the interval between the end of the financial year and the date of this report any item, transaction or event of a material and unusual nature likely, in the opinion of the directors of the Company, to affect significantly the operations of the Suncorp Group, the results of those operations, or the state of affairs of the Suncorp Group in future financial years.
SUNCORP GROUP LIMITED DIRECTORS’ DECLARATION 127
DIRECTORS’ DECLARATION
1. In the opinion of the directors of Suncorp Group Limited (the Company):
a. the consolidated financial statements and notes, and the Remuneration Report in the Directors’ Report, set out on pages 21 to 46, are in accordance with the Corporations Act 2001, including:
i. giving a true and fair view of the Suncorp Group's financial position as at 30 June 2016 and of its performance for the financial year ended on that date; and
ii. complying with Australian Accounting Standards (including the Australian Accounting Interpretations) and the Corporations Regulations 2001
b. there are reasonable grounds to believe that the Company will be able to pay its debts as and when they become due and payable.
2. The directors have been given the declarations required by section 295A of the Corporations Act 2001 from the Chief Executive Officer and the Chief Financial Officer for the financial year ended 30 June 2016.
3. The directors draw attention to note 2.1 to the consolidated financial statements, which includes a statement of compliance with International Financial Reporting Standards.
Signed in accordance with a resolution of the directors:
DR ZIGGY SWITKOWSKI AO
Chairman
MICHAEL CAMERON
CEO and Managing Director
4 August 2016
For
per
sona
l use
onl
y

SUNCORP GROUP LIMITED INDEPENDENT AUDITOR’S REPORT TO THE MEMBERS OF SUNCORP GROUP LIMITED 128
INDEPENDENT AUDITOR’S REPORT TO THE MEMBERS OF SUNCORP GROUP LIMITED
REPORT ON THE FINANCIAL REPORT
Opinion
We have audited the accompanying financial report of Suncorp Group Limited (the Company), which comprises the Consolidated statement of financial position as at 30 June 2016, the Consolidated statement of comprehensive income, the Consolidated statement of changes in equity and the Consolidated statement of cash flows for the year then ended, notes 1 to 38, comprising a summary of significant accounting policies and other explanatory information, and the directors’ declaration of the Group comprising the Company and the entities it controlled at the year’s end or from time to time during the financial year.
In our opinion:
a. the accompanying financial report of the Group is in accordance with the Corporations Act 2001, including:
i. giving a true and fair view of the Group’s financial position as at 30 June 2016 and of its performance for the year ended on that date; and
ii. complying with Australian Accounting Standards and the Corporations Regulations 2001
b. the financial report also complies with International Financial Reporting Standards as disclosed in Note 2.1.
Basis for Opinion
We conducted our audit in accordance with Australian Auditing Standards. Those standards require that we comply with relevant ethical requirements relating to audit engagements and plan and perform the audit to obtain reasonable assurance about whether the financial report is free from material misstatement. Our responsibilities under those standards are further described in the Auditor’s Responsibility section of our report. We are independent of the Group in accordance with the Corporations Act 2001 and the ethical requirements of the Accounting Professional and Ethical Standards Board’s APES 110 Code of Ethics for Professional Accountants (the Code) that are relevant to our audit of the financial report in Australia. We have also fulfilled our other ethical responsibilities in accordance with the Code.
We believe that the audit evidence we have obtained is sufficient and appropriate to provide a basis for our opinion.
Key Audit Matters
Key audit matters are those matters that, in our professional judgment, were of most significance in our audit of the financial report of the current period. These matters were addressed in the context of our audit of the financial report as a whole, and in forming our opinion thereon, and we do not provide a separate opinion on these matters.
KPMG, an Australian partnership and a member firm of the KPMG network of independent member firms affiliated with KPMG International Cooperative (“KPMG International”), a Swiss entity.
Liability limited by a scheme approved under Professional Standards Legislation.
For
per
sona
l use
onl
y
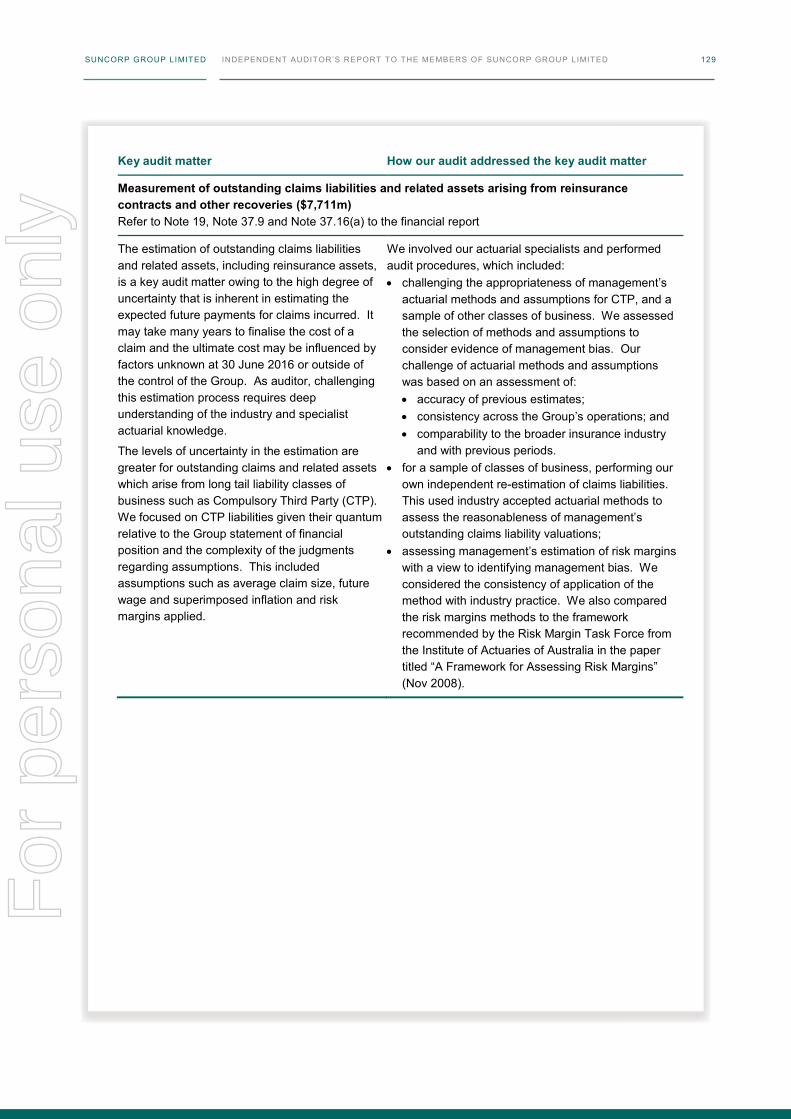
SUNCORP GROUP LIMITED INDEPENDENT AUDITOR’S REPORT TO THE MEMBERS OF SUNCORP GROUP LIMITED 128
INDEPENDENT AUDITOR’S REPORT TO THE MEMBERS OF SUNCORP GROUP LIMITED
REPORT ON THE FINANCIAL REPORT
Opinion
We have audited the accompanying financial report of Suncorp Group Limited (the Company), which comprises the Consolidated statement of financial position as at 30 June 2016, the Consolidated statement of comprehensive income, the Consolidated statement of changes in equity and the Consolidated statement of cash flows for the year then ended, notes 1 to 38, comprising a summary of significant accounting policies and other explanatory information, and the directors’ declaration of the Group comprising the Company and the entities it controlled at the year’s end or from time to time during the financial year.
In our opinion:
a. the accompanying financial report of the Group is in accordance with the Corporations Act 2001, including:
i. giving a true and fair view of the Group’s financial position as at 30 June 2016 and of its performance for the year ended on that date; and
ii. complying with Australian Accounting Standards and the Corporations Regulations 2001
b. the financial report also complies with International Financial Reporting Standards as disclosed in Note 2.1.
Basis for Opinion
We conducted our audit in accordance with Australian Auditing Standards. Those standards require that we comply with relevant ethical requirements relating to audit engagements and plan and perform the audit to obtain reasonable assurance about whether the financial report is free from material misstatement. Our responsibilities under those standards are further described in the Auditor’s Responsibility section of our report. We are independent of the Group in accordance with the Corporations Act 2001 and the ethical requirements of the Accounting Professional and Ethical Standards Board’s APES 110 Code of Ethics for Professional Accountants (the Code) that are relevant to our audit of the financial report in Australia. We have also fulfilled our other ethical responsibilities in accordance with the Code.
We believe that the audit evidence we have obtained is sufficient and appropriate to provide a basis for our opinion.
Key Audit Matters
Key audit matters are those matters that, in our professional judgment, were of most significance in our audit of the financial report of the current period. These matters were addressed in the context of our audit of the financial report as a whole, and in forming our opinion thereon, and we do not provide a separate opinion on these matters.
KPMG, an Australian partnership and a member firm of the KPMG network of independent member firms affiliated with KPMG International Cooperative (“KPMG International”), a Swiss entity.
Liability limited by a scheme approved under Professional Standards Legislation.
SUNCORP GROUP LIMITED INDEPENDENT AUDITOR’S REPORT TO THE MEMBERS OF SUNCORP GROUP LIMITED 129
Key audit matter
How our audit addressed the key audit matter
Measurement of outstanding claims liabilities and related assets arising from reinsurance contracts and other recoveries ($7,711m) Refer to Note 19, Note 37.9 and Note 37.16(a) to the financial report
The estimation of outstanding claims liabilities and related assets, including reinsurance assets, is a key audit matter owing to the high degree of uncertainty that is inherent in estimating the expected future payments for claims incurred. It may take many years to finalise the cost of a claim and the ultimate cost may be influenced by factors unknown at 30 June 2016 or outside of the control of the Group. As auditor, challenging this estimation process requires deep understanding of the industry and specialist actuarial knowledge.
The levels of uncertainty in the estimation are greater for outstanding claims and related assets which arise from long tail liability classes of business such as Compulsory Third Party (CTP). We focused on CTP liabilities given their quantum relative to the Group statement of financial position and the complexity of the judgments regarding assumptions. This included assumptions such as average claim size, future wage and superimposed inflation and risk margins applied.
We involved our actuarial specialists and performed audit procedures, which included: • challenging the appropriateness of management’s
actuarial methods and assumptions for CTP, and a sample of other classes of business. We assessed the selection of methods and assumptions to consider evidence of management bias. Our challenge of actuarial methods and assumptions was based on an assessment of: • accuracy of previous estimates; • consistency across the Group’s operations; and • comparability to the broader insurance industry
and with previous periods. • for a sample of classes of business, performing our
own independent re-estimation of claims liabilities. This used industry accepted actuarial methods to assess the reasonableness of management’s outstanding claims liability valuations;
• assessing management’s estimation of risk margins with a view to identifying management bias. We considered the consistency of application of the method with industry practice. We also compared the risk margins methods to the framework recommended by the Risk Margin Task Force from the Institute of Actuaries of Australia in the paper titled “A Framework for Assessing Risk Margins” (Nov 2008).
For
per
sona
l use
onl
y

SUNCORP GROUP LIMITED INDEPENDENT AUDITOR’S REPORT TO THE MEMBERS OF SUNCORP GROUP LIMITED 130
Key audit matter
How our audit addressed the key audit matter
Specific and collective impairment provisions for loan and advances ($164m) Refer to Note 15, Note 31.1 and Note 37.12(a) to the financial report
Impairment provisions are considered to be a key audit matter owing to the significance of loans and advances, and the high degree of complexity and judgment applied by management in determining the provisions.
Specific impairment provisions are based on management’s judgment in estimating when an impairment event has occurred and the present value of expected future cash flows which are inherently uncertain. This is challenging from an audit perspective in relation to business and agribusiness loans as the forecast cash flows include estimated timing and proceeds from the future sale of assets securing the debt.
Collective impairment provisions are determined either on a ratings based approach at a customer level for business and agribusiness business loans, or segmenting the portfolio into pools with homogenous risk profiles for retail loans. Based on the assigned rating or pool, an estimate of the likelihood of default and the potential loss given default will be applied to determine the collective provision. This is challenging from an audit perspective due to the use of complex models to predict probability of default and loss given default estimates and the application of management judgment to the determination of model overlays.
Our audit procedures included: • testing key controls over arrears calculations,
customer loan ratings, annual loan reviews, credit risk reviews and model validations.
• performing credit assessments for a sample of business and agribusiness loans on the watch list and with a specific impairment provision. This included inspection of the latest correspondence with the borrower, provision estimates prepared by credit risk officers and consideration of the resolution period estimated for the impaired loan. We challenged assumptions based on our experience and industry knowledge. We assessed collateral values with reference to valuations performed by approved valuers. We also re-performed key calculations.
• testing key inputs used in the collective impairment provision calculation for significant portfolios. This included the customer loan rating for business and agribusiness loans and arrears profile for mortgage loans.
• working with our credit risk specialists to test the collective provision models for compliance with the Group’s model governance policies and reperforming the collective provision calculations for the business, agribusiness and mortgage loan portfolios.
• independently assessing management’s judgment in the application of overlays by applying sensitivities to assumptions underlying the overlays, and evaluating current economic and climatic conditions linked to the overlays, such as agribusiness loans impacted by drought conditions or commodity prices.
For
per
sona
l use
onl
y
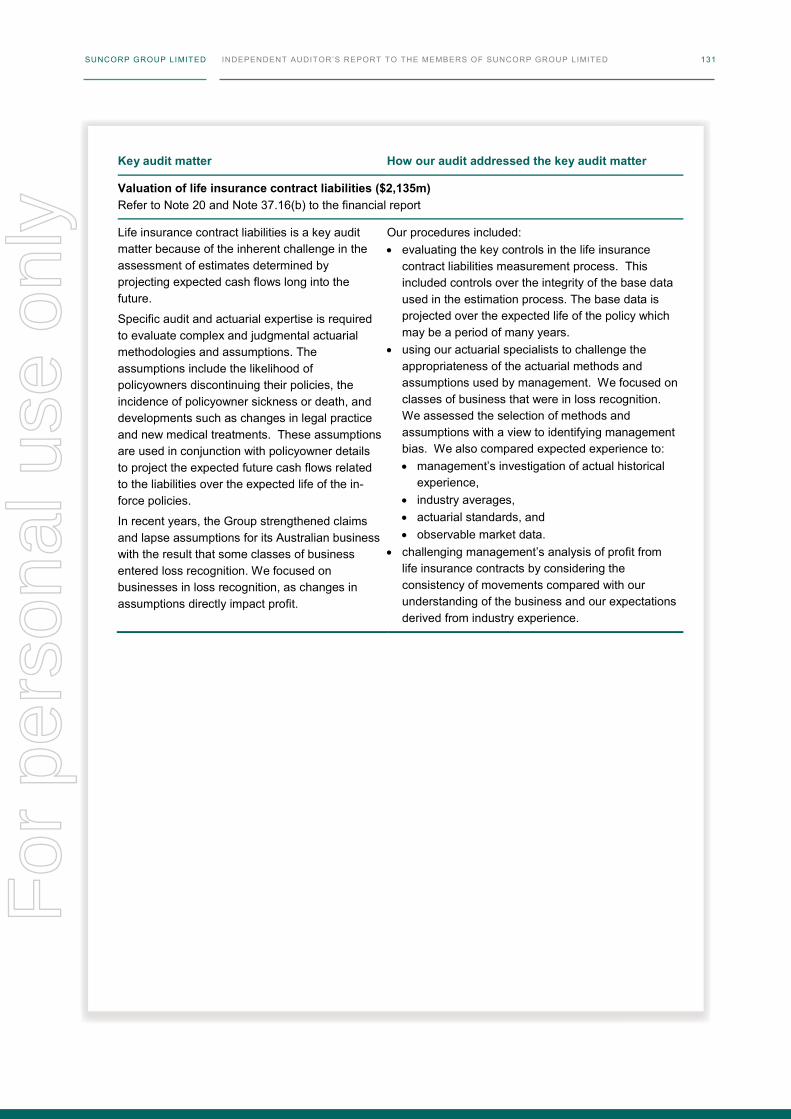
SUNCORP GROUP LIMITED INDEPENDENT AUDITOR’S REPORT TO THE MEMBERS OF SUNCORP GROUP LIMITED 130
Key audit matter
How our audit addressed the key audit matter
Specific and collective impairment provisions for loan and advances ($164m) Refer to Note 15, Note 31.1 and Note 37.12(a) to the financial report
Impairment provisions are considered to be a key audit matter owing to the significance of loans and advances, and the high degree of complexity and judgment applied by management in determining the provisions.
Specific impairment provisions are based on management’s judgment in estimating when an impairment event has occurred and the present value of expected future cash flows which are inherently uncertain. This is challenging from an audit perspective in relation to business and agribusiness loans as the forecast cash flows include estimated timing and proceeds from the future sale of assets securing the debt.
Collective impairment provisions are determined either on a ratings based approach at a customer level for business and agribusiness business loans, or segmenting the portfolio into pools with homogenous risk profiles for retail loans. Based on the assigned rating or pool, an estimate of the likelihood of default and the potential loss given default will be applied to determine the collective provision. This is challenging from an audit perspective due to the use of complex models to predict probability of default and loss given default estimates and the application of management judgment to the determination of model overlays.
Our audit procedures included: • testing key controls over arrears calculations,
customer loan ratings, annual loan reviews, credit risk reviews and model validations.
• performing credit assessments for a sample of business and agribusiness loans on the watch list and with a specific impairment provision. This included inspection of the latest correspondence with the borrower, provision estimates prepared by credit risk officers and consideration of the resolution period estimated for the impaired loan. We challenged assumptions based on our experience and industry knowledge. We assessed collateral values with reference to valuations performed by approved valuers. We also re-performed key calculations.
• testing key inputs used in the collective impairment provision calculation for significant portfolios. This included the customer loan rating for business and agribusiness loans and arrears profile for mortgage loans.
• working with our credit risk specialists to test the collective provision models for compliance with the Group’s model governance policies and reperforming the collective provision calculations for the business, agribusiness and mortgage loan portfolios.
• independently assessing management’s judgment in the application of overlays by applying sensitivities to assumptions underlying the overlays, and evaluating current economic and climatic conditions linked to the overlays, such as agribusiness loans impacted by drought conditions or commodity prices.
SUNCORP GROUP LIMITED INDEPENDENT AUDITOR’S REPORT TO THE MEMBERS OF SUNCORP GROUP LIMITED 131
Key audit matter
How our audit addressed the key audit matter
Valuation of life insurance contract liabilities ($2,135m) Refer to Note 20 and Note 37.16(b) to the financial report
Life insurance contract liabilities is a key audit matter because of the inherent challenge in the assessment of estimates determined by projecting expected cash flows long into the future.
Specific audit and actuarial expertise is required to evaluate complex and judgmental actuarial methodologies and assumptions. The assumptions include the likelihood of policyowners discontinuing their policies, the incidence of policyowner sickness or death, and developments such as changes in legal practice and new medical treatments. These assumptions are used in conjunction with policyowner details to project the expected future cash flows related to the liabilities over the expected life of the in-force policies.
In recent years, the Group strengthened claims and lapse assumptions for its Australian business with the result that some classes of business entered loss recognition. We focused on businesses in loss recognition, as changes in assumptions directly impact profit.
Our procedures included: • evaluating the key controls in the life insurance
contract liabilities measurement process. This included controls over the integrity of the base data used in the estimation process. The base data is projected over the expected life of the policy which may be a period of many years.
• using our actuarial specialists to challenge the appropriateness of the actuarial methods and assumptions used by management. We focused on classes of business that were in loss recognition. We assessed the selection of methods and assumptions with a view to identifying management bias. We also compared expected experience to: • management’s investigation of actual historical
experience, • industry averages, • actuarial standards, and • observable market data.
• challenging management’s analysis of profit from life insurance contracts by considering the consistency of movements compared with our understanding of the business and our expectations derived from industry experience.
For
per
sona
l use
onl
y
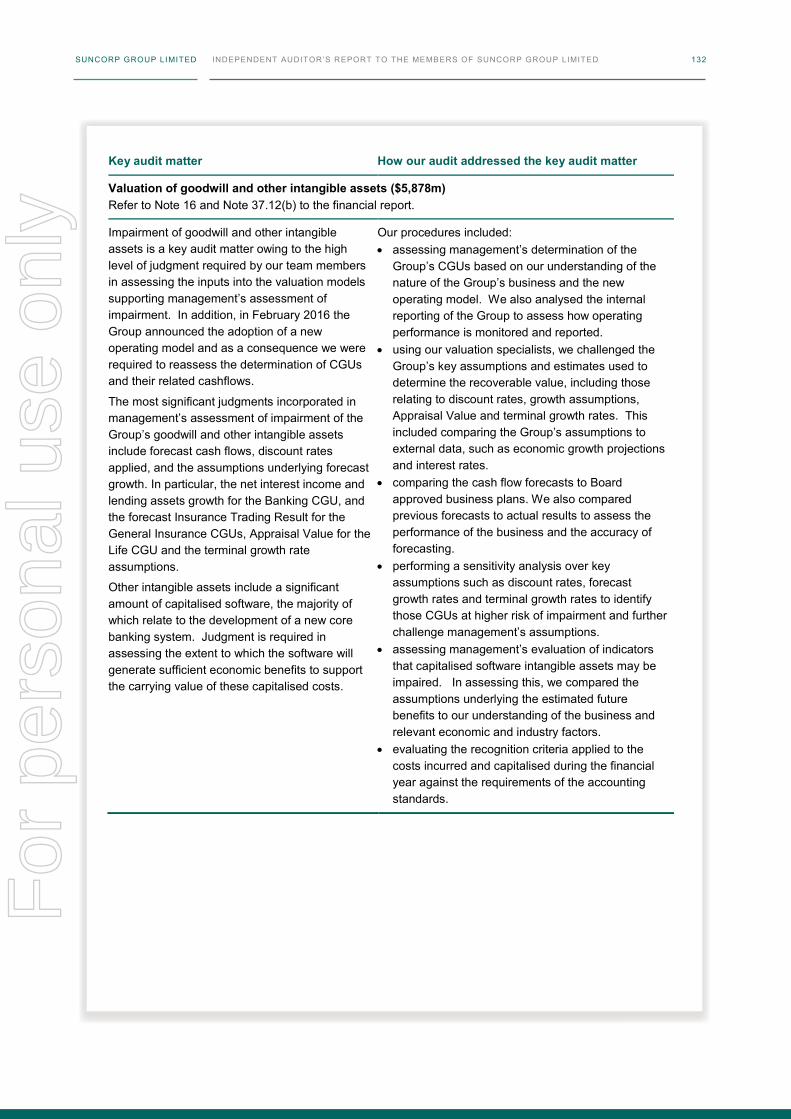
SUNCORP GROUP LIMITED INDEPENDENT AUDITOR’S REPORT TO THE MEMBERS OF SUNCORP GROUP LIMITED 132
Key audit matter
How our audit addressed the key audit matter
Valuation of goodwill and other intangible assets ($5,878m) Refer to Note 16 and Note 37.12(b) to the financial report.
Impairment of goodwill and other intangible assets is a key audit matter owing to the high level of judgment required by our team members in assessing the inputs into the valuation models supporting management’s assessment of impairment. In addition, in February 2016 the Group announced the adoption of a new operating model and as a consequence we were required to reassess the determination of CGUs and their related cashflows.
The most significant judgments incorporated in management’s assessment of impairment of the Group’s goodwill and other intangible assets include forecast cash flows, discount rates applied, and the assumptions underlying forecast growth. In particular, the net interest income and lending assets growth for the Banking CGU, and the forecast Insurance Trading Result for the General Insurance CGUs, Appraisal Value for the Life CGU and the terminal growth rate assumptions.
Other intangible assets include a significant amount of capitalised software, the majority of which relate to the development of a new core banking system. Judgment is required in assessing the extent to which the software will generate sufficient economic benefits to support the carrying value of these capitalised costs.
Our procedures included: • assessing management’s determination of the
Group’s CGUs based on our understanding of the nature of the Group’s business and the new operating model. We also analysed the internal reporting of the Group to assess how operating performance is monitored and reported.
• using our valuation specialists, we challenged the Group’s key assumptions and estimates used to determine the recoverable value, including those relating to discount rates, growth assumptions, Appraisal Value and terminal growth rates. This included comparing the Group’s assumptions to external data, such as economic growth projections and interest rates.
• comparing the cash flow forecasts to Board approved business plans. We also compared previous forecasts to actual results to assess the performance of the business and the accuracy of forecasting.
• performing a sensitivity analysis over key assumptions such as discount rates, forecast growth rates and terminal growth rates to identify those CGUs at higher risk of impairment and further challenge management’s assumptions.
• assessing management’s evaluation of indicators that capitalised software intangible assets may be impaired. In assessing this, we compared the assumptions underlying the estimated future benefits to our understanding of the business and relevant economic and industry factors.
• evaluating the recognition criteria applied to the costs incurred and capitalised during the financial year against the requirements of the accounting standards.
For
per
sona
l use
onl
y
SUNCORP GROUP LIMITED INDEPENDENT AUDITOR’S REPORT TO THE MEMBERS OF SUNCORP GROUP LIMITED 132
Key audit matter
How our audit addressed the key audit matter
Valuation of goodwill and other intangible assets ($5,878m) Refer to Note 16 and Note 37.12(b) to the financial report.
Impairment of goodwill and other intangible assets is a key audit matter owing to the high level of judgment required by our team members in assessing the inputs into the valuation models supporting management’s assessment of impairment. In addition, in February 2016 the Group announced the adoption of a new operating model and as a consequence we were required to reassess the determination of CGUs and their related cashflows.
The most significant judgments incorporated in management’s assessment of impairment of the Group’s goodwill and other intangible assets include forecast cash flows, discount rates applied, and the assumptions underlying forecast growth. In particular, the net interest income and lending assets growth for the Banking CGU, and the forecast Insurance Trading Result for the General Insurance CGUs, Appraisal Value for the Life CGU and the terminal growth rate assumptions.
Other intangible assets include a significant amount of capitalised software, the majority of which relate to the development of a new core banking system. Judgment is required in assessing the extent to which the software will generate sufficient economic benefits to support the carrying value of these capitalised costs.
Our procedures included: • assessing management’s determination of the
Group’s CGUs based on our understanding of the nature of the Group’s business and the new operating model. We also analysed the internal reporting of the Group to assess how operating performance is monitored and reported.
• using our valuation specialists, we challenged the Group’s key assumptions and estimates used to determine the recoverable value, including those relating to discount rates, growth assumptions, Appraisal Value and terminal growth rates. This included comparing the Group’s assumptions to external data, such as economic growth projections and interest rates.
• comparing the cash flow forecasts to Board approved business plans. We also compared previous forecasts to actual results to assess the performance of the business and the accuracy of forecasting.
• performing a sensitivity analysis over key assumptions such as discount rates, forecast growth rates and terminal growth rates to identify those CGUs at higher risk of impairment and further challenge management’s assumptions.
• assessing management’s evaluation of indicators that capitalised software intangible assets may be impaired. In assessing this, we compared the assumptions underlying the estimated future benefits to our understanding of the business and relevant economic and industry factors.
• evaluating the recognition criteria applied to the costs incurred and capitalised during the financial year against the requirements of the accounting standards.
SUNCORP GROUP LIMITED INDEPENDENT AUDITOR’S REPORT TO THE MEMBERS OF SUNCORP GROUP LIMITED 133
Directors’ Responsibil i ty for the Financial Report
The directors of the Company are responsible for the preparation of the financial report that gives a true and fair view in accordance with Australian Accounting Standards and the Corporations Act 2001 and for such internal control as the directors determine is necessary to enable the preparation of the financial report that gives a true and fair view and is free from material misstatement, whether due to fraud or error. In note 2.1, the directors also state, in accordance with Australian Accounting Standard AASB 101 Presentation of Financial Statements, that the financial report complies with International Financial Reporting Standards.
In preparing the financial report, the directors are responsible for assessing the Group’s ability to continue as a going concern, disclosing, as applicable, matters related to going concern and using the going concern basis of accounting unless the directors either intend to liquidate the Group or to cease operations, or have no realistic alternative but to do so.
Auditor’s Responsibi l ity
Our responsibility is to express an opinion on the financial report based on our audit. Our objectives are to obtain reasonable assurance about whether the financial report as a whole is free from material misstatement, whether due to fraud or error, and to issue an auditor’s report that includes our opinion. Reasonable assurance is a high level of assurance, but is not a guarantee that an audit conducted in accordance with Australian Auditing Standards will always detect a material misstatement when it exists. Misstatements can arise from fraud or error and are considered material if, individually or in the aggregate, they could reasonably be expected to influence the economic decisions of users taken on the basis of this financial report.
As part of an audit in accordance with Australian Auditing Standards, we exercise professional judgment and maintain professional scepticism throughout the audit.
An audit involves performing procedures to obtain audit evidence about the amounts and disclosures in the financial report.
The procedures selected depend on the auditor’s judgment, including the assessment of the risks of material misstatement of the financial report, whether due to fraud or error. In making those risk assessments, the auditor considers internal control relevant to the entity’s preparation of the financial report that gives a true and fair view in order to design audit procedures that are appropriate in the circumstances, but not for the purpose of expressing an opinion on the effectiveness of the entity’s internal control.
The risk of not detecting a material misstatement resulting from fraud is higher than for one resulting from error, as fraud may involve collusion, forgery, intentional omissions, misrepresentations, or the override of internal control.
For
per
sona
l use
onl
y
SUNCORP GROUP LIMITED INDEPENDENT AUDITOR’S REPORT TO THE MEMBERS OF SUNCORP GROUP LIMITED 134
An audit also includes evaluating the appropriateness of accounting policies used and the reasonableness of accounting estimates made by the directors, as well as evaluating the overall presentation of the financial report.
We conclude on the appropriateness of the directors’ use of the going concern basis of accounting and, based on the audit evidence obtained, whether a material uncertainty exists related to events or conditions that may cast significant doubt on the Group’s ability to continue as a going concern. If we conclude that a material uncertainty exists, we are required to draw attention in our auditor’s report to the related disclosures in the financial report or, if such disclosures are inadequate, to modify our opinion. Our conclusions are based on the audit evidence obtained up to the date of our auditor’s report. However, future events or conditions may cause the Group to cease to continue as a going concern.
We evaluate the overall presentation, structure and content of the financial report, including the disclosures, and whether the financial report represents the underlying transactions and events in a manner that achieves fair presentation.
We obtain sufficient appropriate audit evidence regarding the financial information of the entities or business activities within the Group to express an opinion on the financial report. We are responsible for the direction, supervision and performance of the Group audit. We remain solely responsible for our audit opinion.
We communicate with the directors regarding, among other matters, the planned scope and timing of the audit and significant audit findings, including any significant deficiencies in internal control that we identify during our audit.
The Auditing Standards require that we comply with relevant ethical requirements relating to audit engagements. We also provide the directors with a statement that we have complied with relevant ethical requirements regarding independence, and to communicate with them all relationships and other matters that may reasonably be thought to bear on our independence, and where applicable, related safeguards.
From the matters communicated with the directors, we determine those matters that were of most significance in the audit of the consolidated financial report of the current period and are therefore key audit matters. We describe these matters in our auditor’s report unless law or regulation precludes public disclosure about the matter or when, in extremely rare circumstances, we determine that a matter should not be communicated in our report because the adverse consequences of doing so would reasonably be expected to outweigh the public interest benefits of such communication.
SUNCORP GROUP LIMITED INDEPENDENT AUDITOR’S REPORT TO THE MEMBERS OF SUNCORP GROUP LIMITED 135
REPORT ON THE REMUNERATION REPORT
We have audited Sections 2, 3 and 4 of the Remuneration Report included in pages 25 to 46 of the Directors’ Report for the year ended 30 June 2016. The directors of the Company are responsible for the preparation and presentation of the Remuneration Report in accordance with Section 300A of the Corporations Act 2001. Our responsibility is to express an opinion on the Remuneration Report, based on our audit conducted in accordance with Australian Auditing Standards.
Opinion on the remunerat ion report
In our opinion, the remuneration report of Suncorp Group Limited for the year ended 30 June 2016, complies with Section 300A of the Corporations Act 2001.
KPMG
CHRIS HALL
Partner Sydney
4 August 2016
For
per
sona
l use
onl
y

SUNCORP GROUP LIMITED SHAREHOLDER INFORMATION AND FINANCIAL CALENDAR 136
SHAREHOLDER INFORMATION AND FINANCIAL CALENDAR
Suncorp Group Limited is a publicly listed company limited by shares and incorporated in Australia. Suncorp Group Limited shares are listed on the Australian Securities Exchange (ASX). The securities of Suncorp Group Limited, and its subsidiary Suncorp-Metway Limited, listed on the ASX as at 30 June 2016 (and their respective ASX codes) are:
1. LISTED SECURITIES
Suncorp Group Limited Suncorp-Metway Limited
1,286,600,980 ordinary shares (SUN) 5,600,000 Convertible Preference Shares 2 (SUNPC) 4,000,000 Convertible Preference Shares 3 (SUNPE) 7,700,000 Subordinated Notes (SUNPD)
715,383 Floating Rate Capital Notes (SBKHB)
2. VOTING RIGHTS
Fully paid ordinary shareholders are entitled to vote at any meeting of members of the Company and their voting rights are:
• on a show of hands – one vote per shareholder
• on a poll – one vote per fully paid ordinary share.
3. SHARE REGISTRY CONTACT DETAILS
Link Market Services Limited (Link) PO Box A50 Sydney South, NSW 1235 Australia
[email protected] linkmarketservices.com.au
1300 882 012 +61 2 8767 1219 (outside Australia)
4. CHANGING SHAREHOLDER DETAILS 1
Shareholders can go to Link’s website (or the Suncorp Group website at suncorpgroup.com.au/investors/ manage-my-shareholding) to:
• update their personal details
• view details of their security holdings
• view notices of shareholder meetings, financial reports and other communications
• register an email address for dividend advices
• obtain and complete forms to have dividends paid directly to their bank, building society or credit union account.
1 Shareholders will need their securityholder reference number or holder identification number to update their details. Issuer-sponsored holders can change their address via Link’s website (some conditions apply), or by notifying Link. Shareholders who are sponsored by a broker (CHESS) should advise their broker of their change of address.
SUNCORP GROUP LIMITED SHAREHOLDER INFORMATION AND FINANCIAL CALENDAR 137
5. DIVIDEND REINVESTMENT PLAN
The Company encourages shareholders to have cash dividends credited directly to their bank/building society/credit union account. This is more cost effective, convenient and secure.
The Company’s dividend reinvestment plan allows eligible shareholders to reinvest all or part of their dividends in the Company’s shares, with no brokerage or transaction costs. Shareholders who have already elected to join this plan will automatically have their dividends paid to them in this form. Shareholders wishing to join the dividend reinvestment plan for future dividends should advise Link by no later than 5pm on the business day following the record date for each dividend payment. Shareholders may vary their participation or withdraw from the dividend reinvestment plan at any time. Further information is available on the Suncorp Group website or by contacting Link.
6. SUBSTANTIAL SHAREHOLDERS
A person has a ‘substantial holding’ of a company’s shares within the meaning of the Corporations Act 2001 if the total votes attached to their voting shares (in which they or their associates have relevant interests) is 5% or more of any class of voting shares. As at 30 June 2016 the following substantial shareholdings were recorded in the Company’s register of substantial shareholdings:
Substantial Shareholder Number of Securities
(ordinary shares) % Issued Capital
FIL Limited and associates 77,365,902 6.01
Blackrock Group 64,455,984 5.01
For
per
sona
l use
onl
y
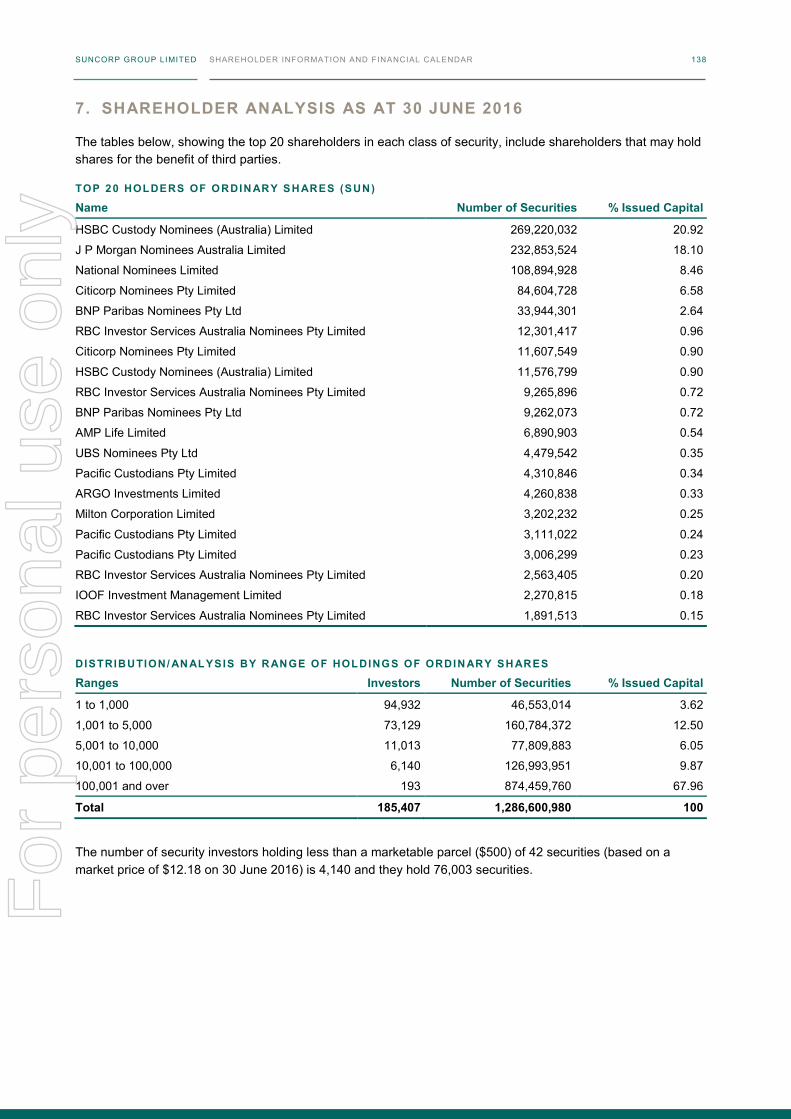
SUNCORP GROUP LIMITED SHAREHOLDER INFORMATION AND FINANCIAL CALENDAR 138
7. SHAREHOLDER ANALYSIS AS AT 30 JUNE 2016
The tables below, showing the top 20 shareholders in each class of security, include shareholders that may hold shares for the benefit of third parties.
TOP 20 HOLDERS OF ORDIN ARY S H ARES (SUN)
Name Number of Securities % Issued Capital
HSBC Custody Nominees (Australia) Limited 269,220,032 20.92
J P Morgan Nominees Australia Limited 232,853,524 18.10
National Nominees Limited 108,894,928 8.46
Citicorp Nominees Pty Limited 84,604,728 6.58
BNP Paribas Nominees Pty Ltd 33,944,301 2.64
RBC Investor Services Australia Nominees Pty Limited 12,301,417 0.96
Citicorp Nominees Pty Limited 11,607,549 0.90
HSBC Custody Nominees (Australia) Limited 11,576,799 0.90
RBC Investor Services Australia Nominees Pty Limited 9,265,896 0.72
BNP Paribas Nominees Pty Ltd 9,262,073 0.72
AMP Life Limited 6,890,903 0.54
UBS Nominees Pty Ltd 4,479,542 0.35
Pacific Custodians Pty Limited 4,310,846 0.34
ARGO Investments Limited 4,260,838 0.33
Milton Corporation Limited 3,202,232 0.25
Pacific Custodians Pty Limited 3,111,022 0.24
Pacific Custodians Pty Limited 3,006,299 0.23
RBC Investor Services Australia Nominees Pty Limited 2,563,405 0.20
IOOF Investment Management Limited 2,270,815 0.18
RBC Investor Services Australia Nominees Pty Limited 1,891,513 0.15
DISTRIBUTION/ AN ALYSIS BY R ANGE OF HOLDINGS OF ORDIN ARY SH ARES
Ranges Investors Number of Securities % Issued Capital
1 to 1,000 94,932 46,553,014 3.62
1,001 to 5,000 73,129 160,784,372 12.50
5,001 to 10,000 11,013 77,809,883 6.05
10,001 to 100,000 6,140 126,993,951 9.87
100,001 and over 193 874,459,760 67.96
Total 185,407 1,286,600,980 100
The number of security investors holding less than a marketable parcel ($500) of 42 securities (based on a market price of $12.18 on 30 June 2016) is 4,140 and they hold 76,003 securities.
For
per
sona
l use
onl
y
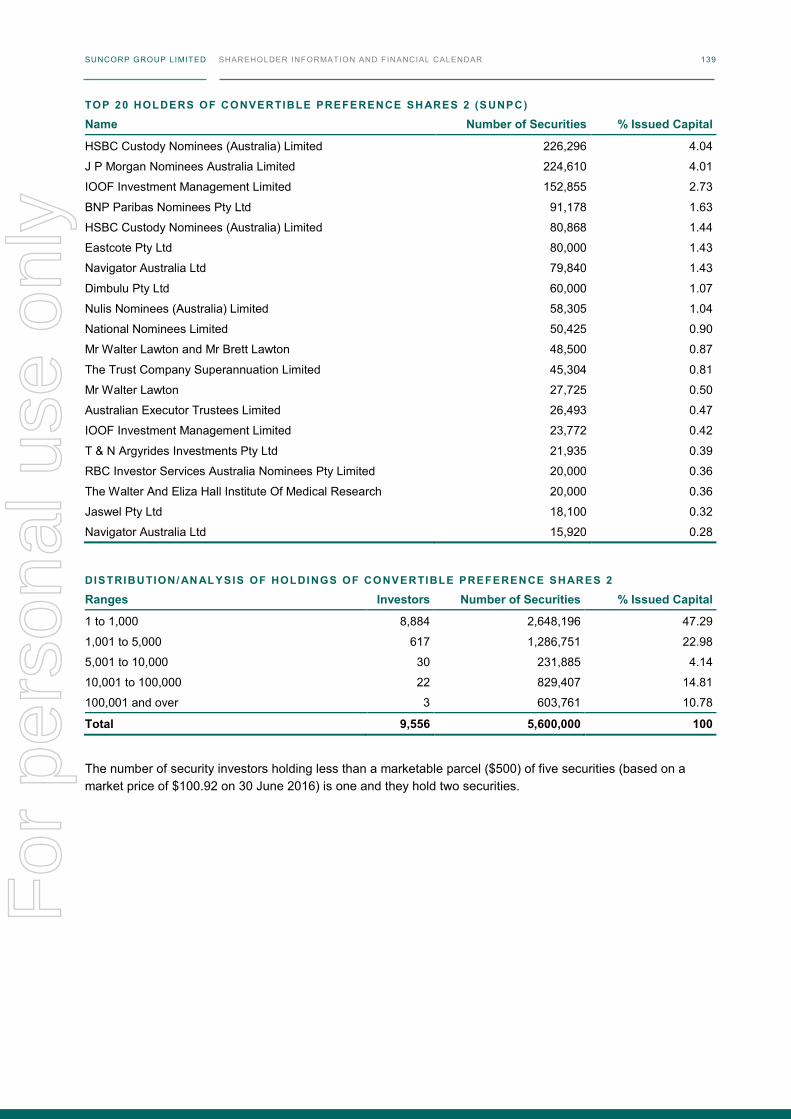
SUNCORP GROUP LIMITED SHAREHOLDER INFORMATION AND FINANCIAL CALENDAR 138
7. SHAREHOLDER ANALYSIS AS AT 30 JUNE 2016
The tables below, showing the top 20 shareholders in each class of security, include shareholders that may hold shares for the benefit of third parties.
TOP 20 HOLDERS OF ORDIN ARY S H ARES (SUN)
Name Number of Securities % Issued Capital
HSBC Custody Nominees (Australia) Limited 269,220,032 20.92
J P Morgan Nominees Australia Limited 232,853,524 18.10
National Nominees Limited 108,894,928 8.46
Citicorp Nominees Pty Limited 84,604,728 6.58
BNP Paribas Nominees Pty Ltd 33,944,301 2.64
RBC Investor Services Australia Nominees Pty Limited 12,301,417 0.96
Citicorp Nominees Pty Limited 11,607,549 0.90
HSBC Custody Nominees (Australia) Limited 11,576,799 0.90
RBC Investor Services Australia Nominees Pty Limited 9,265,896 0.72
BNP Paribas Nominees Pty Ltd 9,262,073 0.72
AMP Life Limited 6,890,903 0.54
UBS Nominees Pty Ltd 4,479,542 0.35
Pacific Custodians Pty Limited 4,310,846 0.34
ARGO Investments Limited 4,260,838 0.33
Milton Corporation Limited 3,202,232 0.25
Pacific Custodians Pty Limited 3,111,022 0.24
Pacific Custodians Pty Limited 3,006,299 0.23
RBC Investor Services Australia Nominees Pty Limited 2,563,405 0.20
IOOF Investment Management Limited 2,270,815 0.18
RBC Investor Services Australia Nominees Pty Limited 1,891,513 0.15
DISTRIBUTION/ AN ALYSIS BY R ANGE OF HOLDINGS OF ORDIN ARY SH ARES
Ranges Investors Number of Securities % Issued Capital
1 to 1,000 94,932 46,553,014 3.62
1,001 to 5,000 73,129 160,784,372 12.50
5,001 to 10,000 11,013 77,809,883 6.05
10,001 to 100,000 6,140 126,993,951 9.87
100,001 and over 193 874,459,760 67.96
Total 185,407 1,286,600,980 100
The number of security investors holding less than a marketable parcel ($500) of 42 securities (based on a market price of $12.18 on 30 June 2016) is 4,140 and they hold 76,003 securities.
SUNCORP GROUP LIMITED SHAREHOLDER INFORMATION AND FINANCIAL CALENDAR 139
TOP 20 HOLDERS OF CONVERTIBLE PREFERENCE SH ARES 2 (S UNPC)
Name Number of Securities % Issued Capital
HSBC Custody Nominees (Australia) Limited 226,296 4.04
J P Morgan Nominees Australia Limited 224,610 4.01
IOOF Investment Management Limited 152,855 2.73
BNP Paribas Nominees Pty Ltd 91,178 1.63
HSBC Custody Nominees (Australia) Limited 80,868 1.44
Eastcote Pty Ltd 80,000 1.43
Navigator Australia Ltd 79,840 1.43
Dimbulu Pty Ltd 60,000 1.07
Nulis Nominees (Australia) Limited 58,305 1.04
National Nominees Limited 50,425 0.90
Mr Walter Lawton and Mr Brett Lawton 48,500 0.87
The Trust Company Superannuation Limited 45,304 0.81
Mr Walter Lawton 27,725 0.50
Australian Executor Trustees Limited 26,493 0.47
IOOF Investment Management Limited 23,772 0.42
T & N Argyrides Investments Pty Ltd 21,935 0.39
RBC Investor Services Australia Nominees Pty Limited 20,000 0.36
The Walter And Eliza Hall Institute Of Medical Research 20,000 0.36
Jaswel Pty Ltd 18,100 0.32
Navigator Australia Ltd 15,920 0.28
DISTRIBUTION/ AN ALYSIS OF HOLDI NGS OF CONVERTIBLE PREFERENCE SHARES 2
Ranges Investors Number of Securities % Issued Capital
1 to 1,000 8,884 2,648,196 47.29
1,001 to 5,000 617 1,286,751 22.98
5,001 to 10,000 30 231,885 4.14
10,001 to 100,000 22 829,407 14.81
100,001 and over 3 603,761 10.78
Total 9,556 5,600,000 100
The number of security investors holding less than a marketable parcel ($500) of five securities (based on a market price of $100.92 on 30 June 2016) is one and they hold two securities.
For
per
sona
l use
onl
y
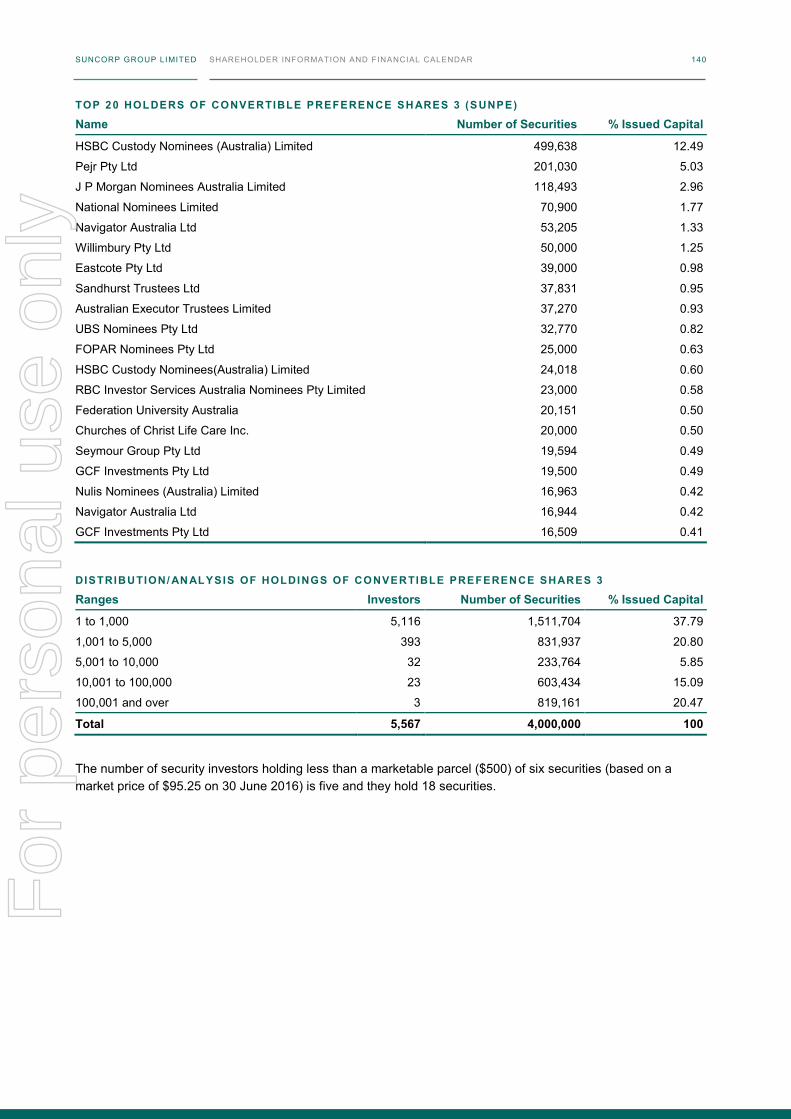
SUNCORP GROUP LIMITED SHAREHOLDER INFORMATION AND FINANCIAL CALENDAR 140
TOP 20 HOLDERS OF CONVERTIBLE PREFERENCE SH ARES 3 (S UNPE)
Name Number of Securities % Issued Capital
HSBC Custody Nominees (Australia) Limited 499,638 12.49
Pejr Pty Ltd 201,030 5.03
J P Morgan Nominees Australia Limited 118,493 2.96
National Nominees Limited 70,900 1.77
Navigator Australia Ltd 53,205 1.33
Willimbury Pty Ltd 50,000 1.25
Eastcote Pty Ltd 39,000 0.98
Sandhurst Trustees Ltd 37,831 0.95
Australian Executor Trustees Limited 37,270 0.93
UBS Nominees Pty Ltd 32,770 0.82
FOPAR Nominees Pty Ltd 25,000 0.63
HSBC Custody Nominees(Australia) Limited 24,018 0.60
RBC Investor Services Australia Nominees Pty Limited 23,000 0.58
Federation University Australia 20,151 0.50
Churches of Christ Life Care Inc. 20,000 0.50
Seymour Group Pty Ltd 19,594 0.49
GCF Investments Pty Ltd 19,500 0.49
Nulis Nominees (Australia) Limited 16,963 0.42
Navigator Australia Ltd 16,944 0.42
GCF Investments Pty Ltd 16,509 0.41
DISTRIBUTION/ AN ALYSIS OF HOLDI NGS OF CONVERTIBLE PREFERENCE SHARES 3
Ranges Investors Number of Securities % Issued Capital
1 to 1,000 5,116 1,511,704 37.79
1,001 to 5,000 393 831,937 20.80
5,001 to 10,000 32 233,764 5.85
10,001 to 100,000 23 603,434 15.09
100,001 and over 3 819,161 20.47
Total 5,567 4,000,000 100
The number of security investors holding less than a marketable parcel ($500) of six securities (based on a market price of $95.25 on 30 June 2016) is five and they hold 18 securities.
For
per
sona
l use
onl
y
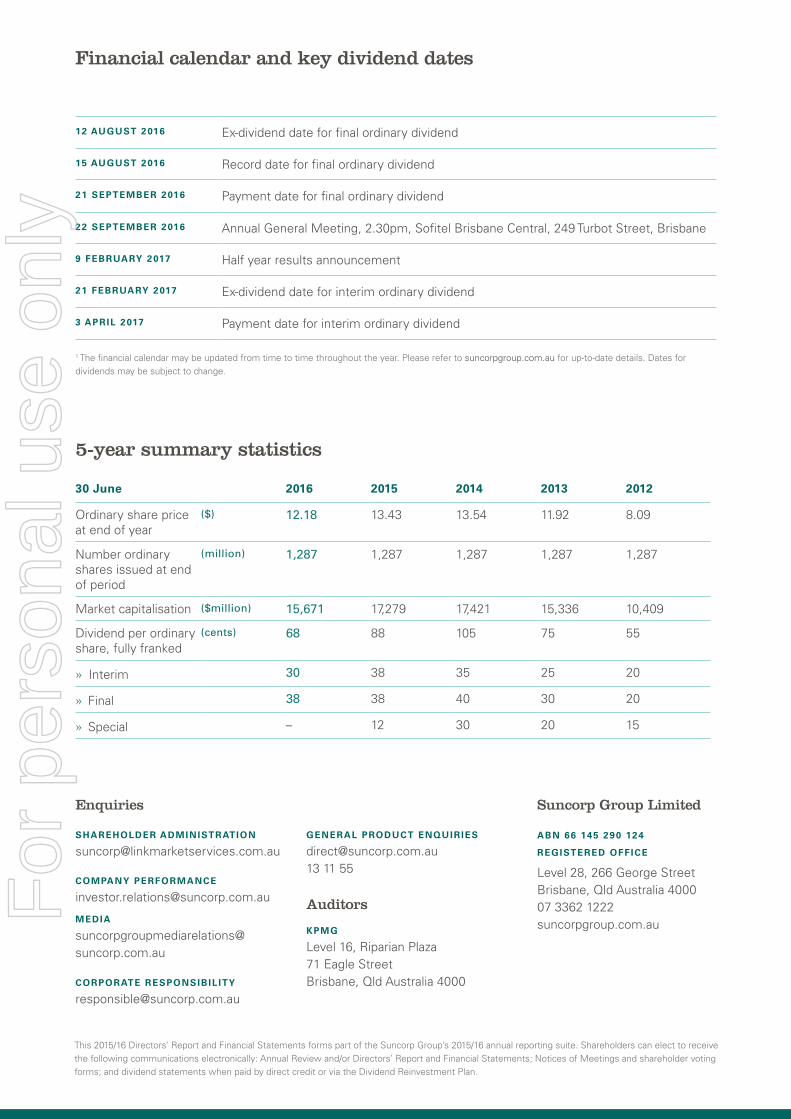
SUNCORP GROUP LIMITED SHAREHOLDER INFORMATION AND FINANCIAL CALENDAR 140
TOP 20 HOLDERS OF CONVERTIBLE PREFERENCE SH ARES 3 (SUNPE)
Name Number of Securities % Issued Capital
HSBC Custody Nominees (Australia) Limited 499,638 12.49
Pejr Pty Ltd 201,030 5.03
J P Morgan Nominees Australia Limited 118,493 2.96
National Nominees Limited 70,900 1.77
Navigator Australia Ltd 53,205 1.33
Willimbury Pty Ltd 50,000 1.25
Eastcote Pty Ltd 39,000 0.98
Sandhurst Trustees Ltd 37,831 0.95
Australian Executor Trustees Limited 37,270 0.93
UBS Nominees Pty Ltd 32,770 0.82
FOPAR Nominees Pty Ltd 25,000 0.63
HSBC Custody Nominees(Australia) Limited 24,018 0.60
RBC Investor Services Australia Nominees Pty Limited 23,000 0.58
Federation University Australia 20,151 0.50
Churches of Christ Life Care Inc. 20,000 0.50
Seymour Group Pty Ltd 19,594 0.49
GCF Investments Pty Ltd 19,500 0.49
Nulis Nominees (Australia) Limited 16,963 0.42
Navigator Australia Ltd 16,944 0.42
GCF Investments Pty Ltd 16,509 0.41
DISTRIBUTION/ AN ALYSIS OF HOLDI NGS OF CONVERTIBLE PREFERENCE SHARES 3
Ranges Investors Number of Securities % Issued Capital
1 to 1,000 5,116 1,511,704 37.79
1,001 to 5,000 393 831,937 20.80
5,001 to 10,000 32 233,764 5.85
10,001 to 100,000 23 603,434 15.09
100,001 and over 3 819,161 20.47
Total 5,567 4,000,000 100
The number of security investors holding less than a marketable parcel ($500) of six securities (based on a market price of $95.25 on 30 June 2016) is five and they hold 18 securities.
Financial calendar and key dividend dates
5-year summary statistics
30 June 2016 2015 2014 2013 2012
Ordinary share price at end of year
($) 12.18 13.43 13.54 11.92 8.09
Number ordinary shares issued at end of period
(million) 1,287 1,287 1,287 1,287 1,287
Market capitalisation ($million) 15,671 17,279 17,421 15,336 10,409
Dividend per ordinary share, fully franked
(cents) 68 88 105 75 55
» Interim 30 38 35 25 20
» Final 38 38 40 30 20
» Special – 12 30 20 15
Enquiries
SHAREHOLDER ADMINISTRATION
COMPANY PERFORMANCE
MEDIA [email protected]
CORPORATE RESPONSIBIL ITY
GENERAL PRODUCT ENQUIRIES
[email protected] 13 11 55
Auditors
KPMG
Level 16, Riparian Plaza71 Eagle StreetBrisbane, Qld Australia 4000
Suncorp Group Limited
ABN 66 145 290 124
REGISTERED OFFICE
Level 28, 266 George StreetBrisbane, Qld Australia 4000 07 3362 1222suncorpgroup.com.au
This 2015/16 Directors’ Report and Financial Statements forms part of the Suncorp Group’s 2015/16 annual reporting suite. Shareholders can elect to receive the following communications electronically: Annual Review and/or Directors’ Report and Financial Statements; Notices of Meetings and shareholder voting forms; and dividend statements when paid by direct credit or via the Dividend Reinvestment Plan.
12 AUGUST 2016 Ex-dividend date for final ordinary dividend
15 AUGUST 2016 Record date for final ordinary dividend
21 SEPTEMBER 2016 Payment date for final ordinary dividend
22 SEPTEMBER 2016 Annual General Meeting, 2.30pm, Sofitel Brisbane Central, 249 Turbot Street, Brisbane
9 FEBRUARY 2017 Half year results announcement
21 FEBRUARY 2017 Ex-dividend date for interim ordinary dividend
3 APRIL 2017 Payment date for interim ordinary dividend
1 The financial calendar may be updated from time to time throughout the year. Please refer to suncorpgroup.com.au for up-to-date details. Dates for dividends may be subject to change.
For
per
sona
l use
onl
y

08376: 05/08/16A
REGISTERED OFFICE
Level 28, 266 George Street Brisbane, Qld Australia 4000 +61 7 3362 1222
SHAREHOLDER ENQUIRIES
[email protected]+61 7 3135 3555
CONNECT
suncorpgroup.com.au @SuncorpGroup
suncorpgroup.com.au
Search 'Suncorp IR' or scan the code for Suncorp Group news, updates and share price movements.
For
per
sona
l use
onl
y