Embed Size (px)
Citation preview

ABN: 33 006 243 750
ANNUAL FINANCIAL REPORT
for the year ended 30 June 2016
For
per
sona
l use
onl
y

Troy Resources Limited Annual Financial Report
For the Financial Year Ended 30 June 2016
Table of contents
Table of contents
DIRECTORS’ REPORT 2
AUDITOR’S INDEPENDENCE DECLARATION 16
CONSOLIDATED STATEMENT OF PROFIT OR LOSS 17
CONSOLIDATED STATEMENT OF PROFIT OR LOSS AND OTHER COMPREHENSIVE INCOME 18
CONSOLIDATED STATEMENT OF FINANCIAL POSITION 19
CONSOLIDATED STATEMENT OF CHANGES IN EQUITY 20
CONSOLIDATED STATEMENT OF CASH FLOWS 21
NOTES TO THE CONSOLIDATED FINANCIAL STATEMENTS 22
DIRECTORS’ DECLARATION 77
INDEPENDENT AUDITOR’S REPORT 78
For
per
sona
l use
onl
y

Troy Resources Limited Annual Financial Report
For the Financial Year Ended 30 June 2016
Directors’ report
2
Directors’ report The Directors of Troy Resources Limited (“Company”, “Troy” or “Group”) present their annual financial report for the financial year ended 30 June 2016. In order to comply with the provisions of the Corporations Act 2001, the Directors report as follows:
DIRECTORS The names and particulars of the Directors of the Company in office during or since the end of the financial year are:
Mr Fred S Grimwade, Independent Non-Executive Chairman, Chairman of the Audit Committee and Member of the Nomination and Remuneration Committee B. Com, LLB (Hons), MBA (Columbia), FAICD, SF Fin, FCIS (age 58) - appointed 25 November 2010, appointed Acting Chairman on 14 July 2015 and confirmed as Chairman 1 March 2016.
Mr Grimwade is a Principal and Executive Director of Fawkner Capital, a specialist corporate advisory and investment firm. He has been a Director of AWB Limited and has held general management positions at Colonial Agricultural Company, the Colonial Group, Western Mining Corporation and Goldman, Sachs & Co. He has a broad range of experience in strategic management, mining, finance, corporate governance and law.
Mr Grimwade’s directorships of other listed companies held in the three years immediately before the end of the financial year are as follows:
Position Company Period of Directorship
Non-Executive Director Select Harvests Limited Since July 2010
Non-Executive Chairman CPT Global Limited Since October 2002
Non-Executive Director XRF Scientific Limited Since May 2012
Non-Executive Director Australian United Investment Company Limited Since March 2014
Non-Executive Director Newsat Limited Since August 2014
Mr Martin D Purvis, Chief Executive Officer and Managing Director B.Eng in Mining, GAICD (aged 55) – appointed Chief Executive Officer and Managing Director on 1 September 2014.
Mr Purvis is a mining engineer with over 30 years’ experience in the resource sector. His career started in the deep-level gold mines of South Africa and since that time he has worked in a wide range of corporate and operational roles at Executive and Board level. He has worked in a number of multi-national mining houses in a broad range of commodities and been the CEO of both listed and private companies in Australia and Singapore.
Mr Ken K Nilsson, Executive Director - B.Eng, Cert of Eng (aged 75) - appointed 8 May 1998.
Mr Nilsson joined Troy in 1997 and is currently an Executive Director. Mr Nilsson is a mining engineer with over 35 years international mine construction and production experience covering gold, base metals and coal. He has been responsible for the development of Troy's Western Australian operations at Sandstone, construction of the Sertão Mine in Goias state, Brazil, led the team responsible for relocating the Sertão plant and development of the Andorinhas Mine in Para state, Brazil, managed the development and construction of Troy's Casposo operation in Argentina and most recently has been responsible for development of the Karouni gold project in Guyana.
Mr John L C Jones, Non-Executive Director, Chairman of the Nomination and Remuneration Committee and Member of the Audit Committee AusIMM, AICD (aged 72) - appointed 27 July 1988.
Mr Jones has over 40 years’ experience as a director of public companies. Past roles include as founder and Chairman of Jones Mining Ltd and Chairman of North Kalgurli Mines NL. He is a director of private company Hampton Transport Services Pty Ltd, a service company to the mining industry in Australia.
For
per
sona
l use
onl
y
Troy Resources Limited Annual Financial Report
For the Financial Year Ended 30 June 2016
Directors’ report
3
Mr Jones’ directorships of other listed companies held in the three years immediately before the end of the financial year are as follows:
Position Company Period of Directorship
Non-Executive Chairman Anglo Australian Resources NL Since February 1990
Founder and Chairman Altan Rio Minerals Limited Since November 2007
Founder and Chairman Altan Nevada Minerals Limited Since May 2010
Chairman Tanga Resources Limited (formerly Argentina Mining Limited)
Since June 2014
Non-Executive Chairman Image Resources Limited June 2014 to May 2016
Mr David Southam, Non-Executive Director, Member of the Audit Committee and Nomination and Remuneration Committee B.Com CPA (aged 44) - appointed 29 July 2016.
Mr Southam is a Certified Practicing Accountant with over 20 years’ experience primarily in the resources sector across accounting, banking and finance. He is currently an Executive Director of ASX listed Western Areas Limited where his role encompasses financial and capital management, corporate development and operational activities.
Mr Southam has previously acted as a Non-Executive Director of Sundance Resources Limited and prior to his appointment with Western Areas in 2010, held Chief Financial Officer and executive management roles in both mining and industrials companies including Gindalbie Metals Limited, Brambles Industries Limited, Australian Railroad Group, ANZ Investment Bank and WMC Resources Limited.
Position Company Period of Directorship
Executive Director Western Areas Limited Since November 2010
Non-Executive Director Sundance Resources Limited September 2013 to January 2016
Mr David R Dix, Independent Non-Executive Director B.Ec, LLB, Grad Dip (Tax Law) (aged 62) – appointed 28 January 2010 and was Non-Executive Chairman until taking a medical leave of absence in July 2015 and passed away 1 February 2016.
Mr Richard Monti, Non-Executive Director, Member of the Nomination and Remuneration Committee and the Audit Committee B.Sc (Hons), Grad Dip Applied Finance and Investment, MAusIMM (aged 52) – appointed 29 August 2013 and resigned 27 June 2016.
COMPANY SECRETARY Ms Stacey Apostolou, Company Secretary, B.Bus, CPA (aged 50).
Ms Apostolou was appointed as Company Secretary on 5 February 2013. Ms Apostolou is a finance executive with significant experience acting as Company Secretary and corporate Executive/Director for a number of ASX listed mining companies over the past 30 years. Ms Apostolou has been responsible for the corporate, treasury, finance, accounting and administration functions for these companies.
For
per
sona
l use
onl
y

Troy Resources Limited Annual Financial Report
For the Financial Year Ended 30 June 2016
Directors’ report
4
DIRECTORS' SHAREHOLDINGS The following table sets out each Director's relevant interest in shares and share appreciation rights in the Company as at the date of this report:
Directors
Troy Resources Limited
Fully paid shares Number
Share Appreciation Rights
Number Mr F S Grimwade 1,262,000 - Mr M D Purvis 437,500 240,000 Mr J L C Jones 10,581,024 - Mr K K Nilsson 832,694 120,000 Mr D Southam - -
CORPORATE INFORMATION Troy is a limited liability public company which was incorporated in Victoria in 1984 and is domiciled in Australia with its registered office in Perth, Western Australia. The Company listed on the Australian Securities Exchange in 1987 and its ordinary shares trade under the code “TRY”.
Additional Company information can be found in Note 35 to the Financial Statements.
Information on subsidiaries and Group structure can be found in Note 30 to the Financial Statements.
PRINCIPAL ACTIVITIES The principal activities of the Group during the first half of the year were gold and silver production through its operations at Andorinhas in Brazil and Casposo in Argentina. During the year, Troy completed development of the Karouni gold project (Karouni) in Guyana and commenced commercial production from 1 January 2016. In the second half of the year, Casposo was moved to care and maintenance before a majority stake was sold in March 2016 and operations at Andorinhas ceased in May 2016. Exploration activities, principally for gold, continued during the year at Karouni.
REVIEW OF OPERATIONS Financial Results
Total revenue for the year from continuing and discontinued operations decreased by 19% to $145,377,000 (2015: $180,789,000) (refer Note 7 to the financial statements).
The consolidated loss from continuing operations after tax for the year was $13,428,000 (2015: loss $8,674,000). The net loss after tax including discontinued operations was $93,660,000 (2015: loss $100,353,000).
The annual loss is reflected after bringing to account the following items:
Continuing Operations
($’000)
Discontinued Operations
($’000)
FY16
($’000)
FY15
($’000)
(Loss) after tax (13,428) (80,232) (93,660) (100,353)(3) Exploration expenditure gross 6,079 10 6,089 10,309(3) Exploration (capitalised) - - - (3,154)(1)
Government royalty expenses 5,039 3,579 8,618 8,077(2) Export tax expense - 3,167 3,167 8,183(2) Depreciation and amortisation 29,749 3,483 33,232 37,700(2) Profit on sale of Andorinhas plant
- 6,027 6,027 - FCTR losses recycled to P&L - 87,373 87,373 - Impairment loss Casposo - - - 97,319(2)
(1) Continuing operations. (2) Discontinued operations. (3) Both continuing and discontinued operations.
For
per
sona
l use
onl
y

Troy Resources Limited Annual Financial Report
For the Financial Year Ended 30 June 2016
Directors’ report
5
The loss per share on a fully diluted basis from continuing and discontinued operations is 29.6 cents, compared with loss of 49.4 cents in 2015.
Operating Review
The Group’s total production for the year was 82,826 gold equivalent ounces (2015: 121,835 gold equivalent ounces) or 60,743 ounces of gold and 1,668,604 ounces of silver (2015: 78,001 ounces of gold and 3,111,182 ounces of silver).
Group sales for the year totalled 87,153 gold equivalent ounces (2015: 122,184 gold equivalent ounces).
Karouni achieved commercial production in January 2016 and produced 34,740 ounces of gold for the six months to 30 June 2016 from processing 356,772 tonnes of ore at an average gold grade of 3.37 grams per tonne (g/t). Sales for Karouni totalled 32,732 ounces.
Karouni cash costs were US$515 per ounce produced and All-in Sustaining costs (AISC) were US$816 per ounce produced. The proceeds received from the sale of 4,984 ounces produced prior to commercial production were credited against the project’s capitalised mine development costs.
Casposo underwent a labour restructuring programme before the mine was placed on care and maintenance in late January. Processing activities continued until February when the plant was also placed on care and maintenance. The Company reached agreement with Austral Gold Limited on 4 March to divest a 51% controlling interest in Casposo. Consequently, Casposo is reported as a discontinued operation during the period to 4 March 2016, with Troy’s 49% minority interest after that time being equity accounted.
During the period to 4 March 2016 Casposo produced 17,214 ounces of gold (2015: 55,859) and 1,668,604 ounces of silver (2015: 3,111,182) from the processing of 271,977 tonnes (2015: 509,489) of ore at an average gold grade of 2.16g/t (2015: 3.73g/t) and silver grade of 230.23g/t (2015: 235.72g/t).
Casposo cash costs on a co-product basis were US$984 per gold equivalent ounce (2015: US$668). Total gold equivalent ounces produced at Casposo were 39,297 (2015: 99,963).
Andorinhas ceased operations in May 2016. The plant was sold to Anfield Gold Corp. with handover occurring during June 2016. Andorinhas is also reported as a discontinued operation in the current year.
Andorinhas produced 8,789 ounces of gold for the year (2015: 22,142 ounces) at an average cash cost of US$976 per ounce (2015: US$889). AISC were US$1,110 per gold ounce (2015: US$1,137).
The Group’s available cash at 30 June 2016 was $3.1 million (2015: $59.8 million) which, together with Karouni gold inventories at market value, resulted in liquid assets of $12.5 million.
Gold equivalent ounces
Gold equivalent ounces produced are the result of converting silver ounces produced to an equivalent value of gold ounces using actual prices achieved and adding that to actual gold ounces produced.
Financial Review
At 30 June 2016, the Group held cash and cash equivalents of $3.4 million, of which $0.3 million is held as restricted cash deposits for bank guarantees and unpresented dividend cheques. Pursuant to the Investec Debt Facility, the Company is required to maintain minimum liquidity of $10 million inclusive of gold inventories at market value.
Troy held gold inventories at a market value of $9.4 million, therefore providing total liquidity in accordance with the debt facility of $12.5 million.
Cash decreased by $57.5 million over the year with investing activities utilising $39.9 million, of which $29.1 million related to the purchase of property plant and equipment for the construction of Karouni and $7.7 million for Karouni mine development. Troy’s disposal of Casposo consumed $8.2 million
For
per
sona
l use
onl
y

Troy Resources Limited Annual Financial Report
For the Financial Year Ended 30 June 2016
Directors’ report
6
while the sale of the Andorinhas’ plant and inventories realised $4.8m in cash receipts. Troy received $0.3 million from bank interest.
Financing activities consumed $45.9 million, comprising $55.2 million in debt repayments (including principal, interest and fees) less $9.3 million raised from equity issues (net of share issue costs).
Operating activities generated net cash inflows of $28.3 million with commercial production at Karouni commencing 1 January 2016.
The consolidated loss from continuing operations after tax for the year was $13.4 million (2015: loss $8.7 million). The net loss after tax including discontinued operations was $93.7 million (2015: loss $100.4 million), inclusive of non-cash expenses totalling $120.8 million (including $87.4m in foreign currency translation reserve losses recycled to the profit & loss statement and $33.2 in depreciation and amortisation).
At year end, the Company had in place commodity hedge contracts for delivery over a 16 month period for 66,000 ounces of gold at an average US$1,103.50/ounce.
DIVIDENDS No dividend has been declared for the financial year ended 30 June 2016.
CHANGES IN STATE OF AFFAIRS There were no other significant changes in the state of affairs of the Group other than those referred to in the financial statements and notes thereto.
SUBSEQUENT EVENTS There has not been any matter or circumstance, except for those matters referred to in Note 34 (including the equity raising announced on 6 September 2016) to the financial statements or noted above, that have arisen since the end of the financial year, that has significantly affected or may significantly affect, the operations of the Group, the results of the operations, or the state of the affairs of the Group in the future financial years.
FUTURE DEVELOPMENTS Troy is committed to pursuing growth through exploration, acquisition of new projects and/or corporate merger activity.
SHARE ISSUES During the year:
• 50,000,000 fully paid ordinary shares were issued pursuant to a share placement; and • 702,371 fully paid ordinary shares were issued pursuant to the terms of a landowner agreement
at Karouni.
OTHER EQUITY INSTRUMENTS During the financial year:
• 590,000 options lapsed in accordance with their terms; • 12,000 performance rights lapsed in accordance with their terms; and • 797,000 share appreciation rights lapsed or expired in accordance with their terms.
Details of share options, performance rights and share appreciation rights granted to Directors and Senior Management are included within the Remuneration Report.
There have been no grants of equity instruments under the LTIP since the end of the financial year.
At the date of this report, there are 10,000,000 unlisted options on issue to Investec Bank Plc. with an exercise price of $0.80 and expiry of 15 January 2018, and 963,000 employee share appreciation rights at issue prices of between $0.88 and $1.63 and subject to vesting hurdles.
For
per
sona
l use
onl
y

Troy Resources Limited Annual Financial Report
For the Financial Year Ended 30 June 2016
Directors’ report
7
No person or entity entitled to exercise any of these share options, performance rights and share appreciation rights had or have any rights by virtue of the options or rights to participate in any share issue of any related corporation. For further information refer to Note 27.
INDEMNIFICATION AND INSURANCE OF OFFICERS During the financial year, the Company paid premiums in respect of insurance policies covering the Directors and Officers of the Company and its controlled entities. Details of the premium are subject to a confidentiality clause under the contract of insurance. The liabilities insured are costs and expenses that may be incurred in defending civil or criminal proceedings that may be brought against the Directors and Officers in their capacity as Officers of entities in the Group.
MEETINGS OF DIRECTORS The numbers of meetings of the Company’s Board of Directors and of each Board Committee held during the year ended 30 June 2016, and the numbers of meetings attended by each Director were:
Board Meetings Audit Committee Meetings
Nomination & Remuneration
Committee Meetings Director Held Attended Held Attended Held Attended Mr F S Grimwade 18 18 4 4 2 2 Mr M D Purvis 18 18 - - - - Mr K K Nilsson 18 16 - - - - Mr J L C Jones 18 18 4 4 2 2 Mr D R Dix (1) 12 - - - - - Mr R Monti (2) 17 17 4 4 2 2
(1) Passed away 1 February 2016, after a medical leave of absence from 14 July 2015. (2) Resigned 27 June 2016.
ENVIRONMENTAL REGULATIONS The Group is committed to a high standard of environmental performance and during the year has not received any fines or prosecutions under any environmental laws or regulations. The Group did not have any reportable environmental incidents during the year.
REMUNERATION REPORT (AUDITED) A. Introduction
This report outlines the remuneration structure which is in place for Executive Directors, Non-Executive Directors and other Key Management Personnel of the Company.
The Board is cognisant of the response from shareholders to the Company’s 2015 Remuneration Report which resulted in a vote against Resolution 1 (Approval of the Remuneration Report). A vote against the Approval of the 2016 Remuneration Report will result in a second strike against the Company.
After the 2015 Annual General Meeting, the Board initiated a number of discussions and meetings with key shareholders in the Company as well as the main proxy advisors that cover Troy. A number of concerns were raised and noted during these meetings most of which related to the composition and transformation of the Board rather than towards the underlying remuneration policies of the Company. A number of changes have already taken place to remedy these concerns and further changes to complete the process are already in the pipeline and have been announced to the market. To this end the Board is conscious of making progressive improvements in a timely fashion that will not disrupt the efficient functioning of the Board.
The 2016 financial year has been one of significant transition for Troy and the Board took the decision that it would not be prudent or appropriate to operate a short term incentive plan within the Company. This position will also be extended for the 2017 Financial Year. During 2017 the Board will re-evaluate
For
per
sona
l use
onl
y

Troy Resources Limited Annual Financial Report
For the Financial Year Ended 30 June 2016
Directors’ report
8
the proposed remuneration framework of the Company, including latest trends in incentive scheme structures, to ensure that the Company's remuneration policies and practices are fair, competitive and responsible and that we communicate these remuneration arrangements to our shareholders with full transparency and clarity.
Supported by the Remuneration Committee, the objective of the Board is to ensure that the practices and processes are sound and appropriate for the Company's particular operating circumstances and driven by our guiding principle to deliver value for the benefit of all our stakeholders.
Key Management Personnel during or since the end of the year included:
Non-Executive Directors
F S Grimwade Non-Executive Chairman
J L C Jones Non-Executive Director
D Southam Non-Executive Director (appointed 29 July 2016)
D R Dix Non-Executive Director (passed away 1 February 2016 after a medical leave of absence)
R Monti Non-Executive Director (resigned 27 June 2016)
Executives
M Purvis Managing Director and CEO
K Nilsson Executive Director
S Apostolou Company Secretary
P Doyle Vice President Exploration and Business Development
D Sadgrove Chief Financial Officer
A Storrie Chief Operating Officer (resigned 30 June 2016)
Subsequent to year end, the Company announced the appointment of Mr David Southam as an Independent Non-Executive Director. Mr Southam will become Chair of the Audit Committee after the 2016 Annual Financial Report is approved by the Board. Mr Grimwade (current Chair of the Audit Committee) will then become Chair of the Remuneration Committee. As part of the Board renewal process, the Company has also confirmed that Mr Nilsson will not be seeking to stand for re-election as a Director at the 2017 Annual General Meeting when he is next required to retire by rotation. The Company is currently conducting a search for a further independent non-executive director, concentrating on an experienced geological skillset.
B. Remuneration Governance
The Board is responsible for ensuring that the Company's remuneration structures are aligned with the long term interests of the Company and its shareholders. Accordingly the Board has established a Nomination and Remuneration Committee (Remuneration Committee) which is responsible for determining and reviewing remuneration for Key Management Personnel.
The responsibilities and functions of the Remuneration Committee include reviewing and recommending to the Board:
• The Company's remuneration policy and structure, including determining short term incentives, key performance indicators and long term incentive performance hurdles;
• The level of remuneration and incentives for Executives; and
• Appropriate Non-Executive Director remuneration and the aggregate pool for approval by shareholders (as necessary).
Executive remuneration is reviewed annually having regard to individual and business performance, relevant comparative information and internal and independent external information.
For
per
sona
l use
onl
y

Troy Resources Limited Annual Financial Report
For the Financial Year Ended 30 June 2016
Directors’ report
9
C. Principles Used to Determine the Nature and Amount of Remuneration
Summary of Approach to Remuneration
As indicated in Section A, the Remuneration Committee undertook a review of the Company's remuneration framework during the year and elected that no short term or long term incentive structure would apply or be made available to employees.Non-Executive Director Remuneration
Fees and payments to Non-Executive Directors’ reflect the responsibilities and demands made on them. They are set at a level that provides the Company with the ability to attract and retain Directors of the highest calibre, whilst incurring a cost that is acceptable to shareholders.
Non-Executive Directors' fees are paid within an aggregate limit (currently $800,000 per annum approved at the 2011 Annual General Meeting) approved from time to time by the Company's shareholders. Retirement payments, if any, are determined in accordance with the rules set out in the Corporations Act as at the time of the Director's retirement or termination. Non-Executive Directors do not receive performance based pay.
With the significant changes made to the Board composition over the past two years, Non-Executive Director Fees in 2016 have reduced by ~38% from $618,825 to $380,937.
Executive Director and Senior Executive Remuneration
Executive Directors and Senior Executives are not currently entitled to any performance based pay.
In relation to the financial year ended 30 June 2016, the Remuneration Committee and Board resolved that it would not be appropriate for a variable component to be considered and that Executives would be entitled to their fixed remuneration only.
With Karouni now at steady state operation, the Remuneration Committee will revisit the structure of Executive Remuneration and more specifically the composition of any future variable component. However, there well be no variable component payable in relation to Executive remuneration during the 2017 financial year.
D. Company Performance
The following table shows the performance of the Group over the past five years based on several key indicators:
Financial Years Ended 30 June 2016 2015 2014 2013 2012 Basic Earnings/(Loss) per Share (cents) (29.6) (49.4) (34.0) 20.5 35.5
Diluted Earnings/(Loss) per Share (cents) (29.6) (49.4) (34.0) 20.4 35.0
Shareholders’ Funds ($m) 153.8 172.3 196.3 145.9 132.3
Dividends per Share (cents) - - - - 10.0
Net Profit/(Loss) Before Tax ($m) – Continuing operations (15.7) (99.3) (94.0) 31.6 55.5
– Discontinued operations (82.6) - - - -
Net Profit/(Loss) After Tax & Non-Controlling Interests ($m) (93.7) (100.4) (59.1) 18.6 31.4
Operating Revenue ($m) 145.4 180.8 178.0 202.7 208.6
Gold Equivalent Production (ozs) 82,826 121,835 132,939 127,060 137,457
Share Price at beginning of the year ($/share) $0.37 $1.07 $1.53 $3.90 $3.48
Share Price at end of the year ($/share) $0.54 $0.37 $1.07 $1.53 $3.90
Market Capitalisation ($m) 184 107 208 140 349
For
per
sona
l use
onl
y

Troy Resources Limited Annual Financial Report
For the Financial Year Ended 30 June 2016
Directors’ report
10
E. Non-Executive Director Remuneration
In 2013, the Board elected to take a 10% reduction in the Director and Committee fees that were payable at that time and fees have continued at this reduced level. The following annual fees applied during the 2016 financial year:
Chairman: $132,300 (plus superannuation contributions) Non- Executive Directors: $72,000 (plus superannuation contributions or in lieu of) Committee chairman: $7,200 (no superannuation contributions) Committee member: $4,500 (no superannuation contributions)
Total remuneration paid or payable to Non-Executive Directors for the 2016 financial year was:
Name Year Base Fee
$
Audit Committee
$
Remuneration Committee
$
Super-annuation
$
Total $
F Grimwade 2016 130,192 7,200 4,500 12,368 154,260 2015 72,000 7,200 - 6,840 86,040
D R Dix (1) 2016 44,107 - - 4,190 48,297 2015 132,300 - 7,200 12,569 152,069
J L C Jones 2016 72,000 4,500 7,200 6,840 90,540 2015 72,000 - 4,500 6,840 83,340
R Monti (2) 2016 72,000 4,500 4,500 6,840 87,840 2015 72,000 - 4,500 6,840 83,340
S Harvey (3) 2016 - - - - - 2015 103,180 3,375 - - 106,555
R Parish (4) 2016 - - - - - 2015 104,106 3,375 - - 107,481
Total 2016 318,299 16,200 16,200 30,238 380,937 2015 555,586 13,950 16,200 33,089 618,825
(1) Passed away 1 February 2016 after a medical leave of absence. (2) Resigned 27 June 2016. (3) Resigned 20 April 2015 - Base Fee includes an amount of $39,420 paid at the time of resignation. (4) Resigned 24 April 2015 - Base Fee includes an amount of $39,420 paid at the time of resignation.
F. Elements of Remuneration of Executives
As no incentive scheme was in place during the year, remuneration paid consisted primarily of fixed remuneration only as:
a) Any equity share based payment allocations, relate to previous year allocations;
b) No bonuses have been awarded or are payable in relation to performance;
c) There were no grants of share-based payment arrangements affecting remuneration of key management personnel in the current financial year or future financial years.
For
per
sona
l use
onl
y

Troy Resources Limited Annual Financial Report
For the Financial Year Ended 30 June 2016
Directors’ report
11
Fixed Remuneration Individual Executives' base salaries for the 2016 financial year were:
Name Position Base Salary
Martin Purvis Managing Director and CEO $570,000
Ken Nilsson Executive Director $481,480
Stacey Apostolou Company Secretary (full time equivalent) $275,000
Peter Doyle Vice President - Exploration and Business Development C$353,500
David Sadgrove Chief Financial Officer $310,000
Andrew Storrie (1) Chief Operating Officer US$300,000 (1) Resigned 30 June 2016.
Following a review by the Remuneration Committee subsequent to the end of the 2016 financial year, the Board determined to maintain base salary levels for Executives in line with FY2016 taking into consideration general market conditions at that time.
There has been no general increase in the base salary levels for Executives since FY2013.
Remuneration components available to Executives at 1 July 2016 are as follows:
Name Base Salary Superannuation Other Total Fixed Remuneration Insurance
Martin Purvis $570,000 $54,150 - $624,150 Salary continuance and medical
Ken Nilsson $481,800 n/a $95,391 $577,191 Salary continuance and medical
Stacey Apostolou (based on 80% of full time equivalent)
$220,000 $20,900 - $240,900 Salary continuance
Peter Doyle C$353,500 n/a C$6,912 C$358,526 Salary continuance and medical
David Sadgrove $310,000 $29,450 $11,737 $351,187 Salary continuance
Following completion of the construction and commissioning of Karouni and the downscaling of activities in Brazil and Argentina, the Company is currently in the process of re-structuring the Operations team and skills base of the Group.
For
per
sona
l use
onl
y

Troy Resources Limited Annual Financial Report
For the Financial Year Ended 30 June 2016
Directors’ report
12
Total Remuneration - Executives The following table details the remuneration expense recognised for the Group's Executives for the current and previous financial year measured in accordance with the requirements of the accounting standards.
Name Year
Fixed Remuneration
Long Service Leave
$
Termination Benefits
$
Variable Remuneration
Total $
Cash Salary & Fees
$
Other Benefits(1)
$
Post-Employment
Benefits $
Cash Bonus
$
Equity Share Based
Payments $
Executive Directors M D Purvis (2) 2016 570,000 - 54,150 6,521 - - 16,424 647,095 2015 475,000 - 45,125 4,559 - - 17,461 542,145 K K Nilsson 2016 492,121 95,391 - 13,445 - - 39,747 640,704 2015 479,125 67,931 - 8,417 - 100,000 95,368 750,841 P Benson (3) 2016 - - - - - - - - 2015 181,524 10,798 4,285 - - 120,000 - 316,607 Senior Management A D B Storrie (4) 2016 415,720 68,560 - - 353,574 - (2,164) 835,690 2015 330,000 46,008 - 204 - - 104,520 480,732 P J Doyle 2016 366,286 7,133 5,135 8,191 - - 3,529 390,274 2015 361,821 6,017 2,544 7,922 - - 55,475 433,779 D R Sadgrove 2016 310,000 11,737 29,450 11,330 - - 2,941 365,458 2015 310,000 3,060 29,450 10,108 - - 6,840 359,458 S Apostolou 2016 243,899 - 23,170 6,623 - - 2,353 276,045 2015 249,220 - 23,676 4,289 - - 25,472 302,657 Total Exec Directors & Senior Mgmt
2016 2,398,026 182,821 111,905 46,110 353,574 - 62,830 3,155,266
2015 2,386,690 133,814 105,080 35,499 - 220,000 305,136 3,186,219
Total NED Remuneration
2016 350,699 - 30,238 - - - - 380,937 2015 585,736 - 33,089 - - - - 618,825
Total KMP 2016 2,748,725 182,821 142,143 46,110 353,574 - 62,830 3,536,203 2015 2,972,426 133,814 138,169 35,499 - 220,000 305,136 3,805,044
(1) Other Benefits include - the provision of motor vehicle, airfares, housing accommodation and insurance. (2) Mr Purvis was appointed Chief Executive Officer and Managing Director on 1 September 2014. (3) Mr Benson resigned as Chief Executive Officer and Managing Director on 31 July 2014. Mr Benson received a cash bonus
of $120,000 prior to his resignation which related to his performance for the 2014 financial year. Included in Cash salary & Fees is an amount of $136,417 that represents Mr Benson's accrued annual leave entitlement at the date of his resignation. Mr Benson also received an amount of $92,357 in accrued Long Service Leave. This payment has not been reflected in Mr Benson's remuneration for FY2015 as Long service leave is reflected in the remuneration tables on an annual basis.
(4) Mr Storrie resigned as Chief Operating Officer on 30 June 2016. In full and final satisfaction of amounts due to Mr Storrie pursuant to his contract, the Company agreed to pay US$300,000 (A$403,134) which included US$75,000 of accrued leave entitlements (A$100,784 ~ of which A$49,560 represents accrued Long Service Leave that has previously been brought to account). This amount is being paid to Mr Storrie in twelve equal monthly instalments of US$25,000. Subsequent to year end, the Company has paid $17,936 to relocate Mr Storrie and his family which is not included in the remuneration amounts disclosed above. Mr Storrie’s other benefits for housing in 2015 have been restated to aid in comparison.
For
per
sona
l use
onl
y

Troy Resources Limited Annual Financial Report
For the Financial Year Ended 30 June 2016
Directors’ report
13
G. Employment Contracts Executive Term of Agreement Termination Notice Termination Benefit
Executive Directors
M Purvis Commencing 1 September 2014 The Company may terminate Mr Purvis's employment by providing six months' notice. Mr Purvis may terminate by providing the Company three months' notice or such other period agreed.
None
K Nilsson Commencing April 1997 Three months' notice None
Other Executives
P Doyle Commencing 15 January 2012 One month's notice A lump sum payment equivalent to the greater of: (a) an amount equivalent to two weeks' pay for each year of service to a maximum of 20 weeks; or (b) the amount as required by the provincial employment standards legislation in force in Ontario at the time of termination.
A Storrie Commencing 17 August 2009 Resigned with effect from 30 June 2016
Three months' notice Three months' salary plus one month's salary for each completed year of service.
D Sadgrove Commencing 17 November 2008 One month's notice None
S Apostolou Commencing 5 February 2013 One month's notice None
H. Equity Holdings Ordinary Shareholdings
2016 Balance at 1.7.15
Granted as Remuneration
Received on Exercise of
Options
Net Other Change
Balance at 30.6.16
Balance Held Nominally
Directors
F S Grimwade 262,000 - - 1,000,000 1,262,000 -
M D Purvis 187,500 - - 250,000 437,500 -
K K Nilsson 582,694 - - 250,000 832,694 -
J L C Jones 10,531,024 - - 50,000 10,581,024 9,059,963
D R Dix (1) 1,114,013 - - (1,114,013) - -
R Monti (2) 1,712,326 - - (1,712,326) - -
Other Key Management Personnel
P J Doyle 94,779 - - - 94,779 3,500
D R Sadgrove 10,000 - - - 10,000 -
S Apostolou 43,251 - - - 43,251 -
A D B Storrie (3) 194,630 - - (194,630) - -
TOTAL 14,732,217 - - (1,470,969) 13,261,248 9,063,463 (1) Passed away 1 February 2016 after a medical leave of absence. (2) Resigned 27 June 2016. (3) Resigned 30 June 2016.
For
per
sona
l use
onl
y

Troy Resources Limited Annual Financial Report
For the Financial Year Ended 30 June 2016
Directors’ report
14
Share Appreciation Rights
There were no share appreciation rights granted as equity compensation benefits to KMP during the year ended 30 June 2016.
2016 Balance
at 1.7.15
Granted as
Remun-eration
Exercised Grant Price Lapsed
Balance at
30.6.16
Balance Vested
at 30.6.16
Vested but not Exercis-
able
Vested and
Exercis-able
Vested during Year
Directors
M D Purvis 240,000 - - $0.88 - $1.04 - 240,000 80,000 - - 80,000
K K Nilsson 620,000 - - $1.10 - $1.43 (500,000) 120,000 80,000 - - 40,000
Other Key Management Personnel
P J Doyle 90,000 - - $1.21 - $1.43 - 90,000 60,000 - - 30,000
D R Sadgrove 75,000 - - $1.21 - $1.43 - 75,000 50,000 - - 25,000
S Apostolou 60,000 - - $1.21 - $1.43 - 60,000 40,000 - - 20,000
A D B Storrie(1) 120,000 - - $1.21 - $1.43 (120,000) - - - - -
TOTAL 1,205,000 - - $1.10 - $1.43 (620,000) 585,000 310,000 - - 195,000
(1) Resigned 30 June 2016.
Option Holdings
There were no options granted as equity compensation benefits to KMP during the year ended 30 June 2016.
2016 Balance
at 1.7.15
Granted as
Remun-eration
Exercised Exercise Price Lapsed
Balance at
30.6.16
Other Key Management Personnel
P J Doyle 250,000 - - - (250,000) -
A D B Storrie(1) 50,000 - - - (50,000) -
TOTAL 300,000 - - - (300,000) - (1) Resigned 30 June 2016.
Performance Rights
There were no performance rights granted as equity compensation benefits to KMP during the year ended 30 June 2016.
2016 Balance at 1.7.15
Granted as Remun-eration
Converted to shares
Hurdle Price
Range Lapsed Balance at
30.6.16
Other Key Management Personnel
D R Sadgrove 5,000 - - $5.50 (5,000) -
End of audited Remuneration Report.
For
per
sona
l use
onl
y

Troy Resources Limited Annual Financial Report
For the Financial Year Ended 30 June 2016
Directors’ report
15
NON-AUDIT SERVICES The auditor of the Company and its subsidiaries is Deloitte Touche Tohmatsu. The Company has a policy in accordance with Corporate Governance best practice that the tax services and other general accounting advice and services, should not be performed by the Company’s auditor. However, the Company may employ the auditor on assignments additional to their statutory audit duties where the auditor’s expertise and experience with the Company and/or the Consolidated Entity are important and closely related to their work as auditor of the Company.
The Audit Committee and the Board of Directors of the Company are satisfied that the provision of non-audit services by the auditor is compatible with the general standard of independence for auditors imposed by the Corporations Act 2001. The nature and scope of non-audit services provided do not compromise the independence of the auditor.
A copy of the auditor’s Independence Declaration as required under Section 307C of the Corporations Act 2001 is set out on page 16.
Details of amounts paid or payable to the auditor for audit and non-audit services provided during the financial year are outlined in Note 25 to the Financial Statements.
Rounding of Amounts The Company is a company of the kind referred to in ASIC Class Order 98/0100, dated 10 July 1998, and in accordance with that Class Order amounts in the Directors' Report and the Financial Report are rounded off to the nearest thousand dollars, unless otherwise indicated.
Signed at West Perth, Western Australia, this 29th day of September 2016 in accordance with a resolution of Directors made pursuant to s.298(2) of the Corporations Act 2001. On behalf of the Directors of Troy Resources Limited F S Grimwade Non-Executive Chairman
For
per
sona
l use
onl
y

Liability limited by a scheme approved under Professional Standards Legislation.
Member of Deloitte Touche Tohmatsu Limited
The Board of Directors Troy Resources Limited Suite 2, Level 1 254 Rokeby Road Subiaco WA 6008 29 September 2016
Dear Board Members
Troy Resources Limited In accordance with section 307C of the Corporations Act 2001, I am pleased to provide the following declaration of independence to the directors of Troy Resources Limited. As lead audit partner for the audit of the financial statements of Troy Resources Limited for the financial year ended 30 June 2016, I declare that to the best of my knowledge and belief, there have been no contraventions of:
(i) the auditor independence requirements of the Corporations Act 2001 in relation to
the audit; and
(ii) any applicable code of professional conduct in relation to the audit. Yours sincerely
DELOITTE TOUCHE TOHMATSU David Newman
Partner Chartered Accountant
Deloitte Touche Tohmatsu
ABN 74 490 121 060
Brookfield Place, Tower 2
123 St Georges Terrace
Perth WA 6000
GPO Box A46
Perth WA 6837 Australia
Tel: +61 8 9365 7000
Fax: +61 8 9365 7001
www.deloitte.com.au
For
per
sona
l use
onl
y

Troy Resources Limited Annual Financial Report
For the Financial Year Ended 30 June 2016
Consolidated statement of profit or loss
17
Consolidated statement of profit or loss
Continuing Operations Notes 2016
$’000 2015 $’000
Revenue 3 60,360 - Cost of sales 4 (57,301) - Gross Profit 3,059 - Other income 3 344 688 Net foreign exchange gains 132 3,624 Share of (losses) from associate 4 (2,950) - Exploration expenses (net) 4 (6,079) (3,850) Administration expenses 4 (6,354) (6,689) Other expenses 4 (755) (279) Finance costs 4 (3,131) (4,424) Impairment loss - (547) Loss before income tax (15,734) (11,477) Income tax benefit 6 2,306 2,803 Loss for the Year – Continuing Operation (13,428) (8,674) Loss for the Year – Discontinued Operations 5 (80,232) (91,679)
LOSS FOR THE YEAR (93,660) (100,353)
Loss attributable to: Owners of the parent (93,660) (100,666) Non-controlling interests - 313 (93,660) (100,353)
Loss per share (EPS) From continuing and discontinued operations Basic EPS (cents) 22 (29.6) (49.4) Diluted EPS (cents) 22 (29.6) (49.4) From continuing operations Basic EPS (cents) 22 (4.2) (49.4) Diluted EPS (cents) 22 (4.2) (49.4)
Notes to the consolidated financial statements are included on pages 22 to 76.
For
per
sona
l use
onl
y

Troy Resources Limited Annual Financial Report
For the Financial Year Ended 30 June 2016
Consolidated statement of profit or loss and other comprehensive income
18
Consolidated statement of profit or loss and other comprehensive income
Notes 2016
$’000 2015 $’000
Loss for the year (93,660) (100,353)
Other comprehensive income
Items that may be reclassified to profit or loss Changes in value of cash flow hedge reserve net of deferred tax 20 (20,304) 9,051
Exchange differences on translation of foreign operations - continuing 20 (1,180) 28,515
- reclassified to profit and loss on disposal/closure 5 87,373 -
Other comprehensive income 65,889 37,566
Total comprehensive income for the year (27,771) (62,787)
Total comprehensive income attributable to: Owners of the parent (27,771) (63,100) Non-controlling Interests - 313 (27,771) (62,787)
Notes to the consolidated financial statements are included on pages 22 to 76.
For
per
sona
l use
onl
y

Troy Resources Limited Annual Financial Report
For the Financial Year Ended 30 June 2016
Consolidated statement of financial position
19
Consolidated statement of financial position
Notes
2016 $’000
2015 $’000
CURRENT ASSETS Cash and cash equivalents 8 3,436 60,556 Trade and other receivables 9 12,915 12,669 Inventories 10 8,403 16,615 Current tax assets 6 - 398 Hedge asset 11 - 5,938
TOTAL CURRENT ASSETS 24,754 96,176
NON-CURRENT ASSETS Property, plant and equipment 12 87,288 131,418 Mining properties 13 148,721 - Development property 14 - 95,756 Investments in associate 15 1,074 - Deferred tax assets 6 1,775 -
TOTAL NON-CURRENT ASSETS 238,858 227,174
TOTAL ASSETS 263,612 323,350
CURRENT LIABILITIES Trade and other payables 16 21,395 21,514 Provisions 17 4,095 8,247 Hedge liability 11 14,351 - Borrowings 18 23,817 40,700
TOTAL CURRENT LIABILITIES 63,658 70,461
NON-CURRENT LIABILITIES Other payables 16 - 1,494 Deferred tax liabilities 6 12,006 13,656 Provisions 17 3,177 7,643 Hedge Liability 11 5,527 - Borrowings 18 25,418 57,841
TOTAL NON-CURRENT LIABILITIES 46,128 80,634
TOTAL LIABILITIES 109,786 151,095
NET ASSETS 153,826 172,255
EQUITY Issued capital 19 314,576 305,311 Reserves 20 14,874 (51,092) Retained earnings 21 (175,624) (81,964)
TOTAL EQUITY 153,826 172,255
Notes to the consolidated financial statements are included on pages 22 to 76.
For
per
sona
l use
onl
y

Troy Resources Limited Annual Financial Report
For the Financial Year Ended 30 June 2016
Consolidated statement of changes in equity
20
Consolidated statement of changes in equity
Issued Capital
$’000
Available for Sale
Reserve
$’000
Share Based Payments Reserve
$’000
Cash Flow Hedge
Reserve
$’000
Foreign Currency
Translation Reserve
$’000
Retained Earnings
$’000
Attributable to
Equity Holder of Parent
$’000
Non-controlling
interest
$’000
TOTAL EQUITY
$’000 Balance at 1 July 2014 269,689 - 5,696 (3,735) (93,724) 18,702 196,628 (313) 196,315 Loss for the year - - - - - (100,666) (100,666) 313 (100,353) Changes in fair value of hedging instrument net of deferred tax - - - 9,051 - - 9,051 - 9,051 Exchange rate differences on translation of foreign operations - - - - 28,515 - 28,515 - 28,515 Total comprehensive income for the year - - - 9,051 28,515 (100,666) (63,100) 313 (62,787) Issue of fully paid shares - capital raising 37,933 - - - - - 37,933 - 37,933 Share issue costs (2,584) - - - - - (2,584) - (2,584) Issue of fully paid shares on exercise of options 138 - (103) - - - 35 - 35 Issue of fully paid shares under employee bonus plan 135 - - - - - 135 - 135 Share-based borrowing costs - - 3,053 - - - 3,053 - 3,053 Share-based payments - - 155 - - - 155 - 155 Balance at 30 June 2015 305,311 - 8,801 5,316 (65,209) (81,963) 172,255 - 172,255 Balance at 1 July 2015 305,311 - 8,801 5,316 (65,209) (81,964) 172,255 - 172,255 Loss for the year - - - - - (93,660) (93,660) - (93,660) Changes in fair value of hedging instrument net of deferred tax - - - (20,304) - - (20,304) - (20,304) Exchange rate differences on translation of foreign operations - - - - 86,193 - 86,193 - 86,193 Total comprehensive income for the year - - - (20,304) 86,193 (93,660) (27,771) - (27,771) Issue of fully paid shares - capital raising 10,000 - - - - - 10,000 - 10,000 Share issue costs (735) - - - - - (735) - (735) Share-based payments - - 77 - - - 77 - 77 Balance at 30 June 2016 314,576 - 8,878 (14,988) 20,984 (175,624) 153,826 - 153,826
Notes to the consolidated financial statements are included on pages 22 to 76. F
or p
erso
nal u
se o
nly

Troy Resources Limited Annual Financial Report
For the Financial Year Ended 30 June 2016
Consolidated statement of cash flows
21
Consolidated statement of cash flows
Notes 2016
$’000 2015 $’000
CASH FLOWS FROM OPERATING ACTIVITIES Receipts from customers 138,374 180,164 Payments to suppliers and employees (111,896) (120,814) Export tax and government royalties paid (8,768) (15,406) Net proceeds from commodity hedging 11,893 - Proceeds from sundry income 97 68 Income taxes paid (1,359) (2,558) NET CASH PROVIDED BY OPERATING ACTIVITIES 32 28,341 41,454
CASH FLOWS FROM INVESTING ACTIVITIES Payments for property, plant and equipment (29,132) (73,562) Payments for mine and development properties (7,735) (4,294) Payments for underground development and capital equipment at Casposo - (31,513)
Payments for exploration properties capitalised - (3,154) Payments for power line commitments - (862) Proceeds on sale of property, plant and equipment 4,756 599 Net cash disposed on sale of Troy Resources Argentina Ltd. 5 (8,148) -
Net cash disposed on sale of Sertao Mineração Ltda - (12) Interest received 334 607 NET CASH USED IN INVESTING ACTIVITIES (39,925) (112,191)
CASH FLOWS FROM FINANCING ACTIVITIES Proceeds from borrowings 18 - 60,000 Repayments of borrowings 18 (45,006) (739) Payment of financing costs (10,197) (7,301) Net proceeds from the issue of equity securities 9,265 35,384 NET CASH (USED) / PROVIDED BY FINANCING ACTIVITIES (45,938) 87,344
Net (decrease) / increase in cash and cash equivalents (57,522) 16,607
Cash and cash equivalents at the beginning of the financial year 60,556 43,409
Effects of exchange rate changes on balances held in foreign currencies 402 540
Cash and cash equivalents at end of the financial year 8 3,436 60,556
Notes to the consolidated financial statements are included on pages 22 to 76.
Refer to Note 5 for information relating to cash flows associated with discontinued operations.
For
per
sona
l use
onl
y

Troy Resources Limited Annual Financial Report
For the Financial Year Ended 30 June 2016
Notes to the consolidated financial statements
22
Notes to the consolidated financial statements
1. SUMMARY OF ACCOUNTING POLICIES
Statement of compliance These financial statements are general purpose financial statements which have been prepared in accordance with the Corporations Act 2001, Accounting Standards and Interpretations, and comply with other requirements of the law.
The financial statements comprise the consolidated financial statements of Troy Resources Limited (“Company” or “Group”). For the purposes of preparing the consolidated financial statements, the Company is a for-profit entity. Accounting Standards include Australian Accounting Standards (AASB). Compliance with Australian Accounting Standards ensures that the financial statements and notes of the company and the Group comply with International Financial Reporting Standards (IFRS).
The financial statements were authorised for issue by the Directors at a meeting held on 29th September 2016.
Basis of preparation The consolidated financial statements have been prepared on the basis of historical cost, except for certain financial instruments that are measured at revalued amounts or fair values, as explained in the accounting policies below. Historical cost is generally based on the fair values of the consideration given in exchange for goods and services. All amounts are presented in Australian dollars, unless otherwise noted.
Fair value is the price that would be received to sell an asset or paid to transfer a liability in an orderly transaction between market participants at the measurement date, regardless of whether that price is directly observable or estimated using another valuation technique. In estimating the fair value of an asset or a liability, the Group takes into account the characteristics of the asset or liability if market participants would take those characteristics into account when pricing the asset or liability at the measurement date. Fair value for measurement and/or disclosure purposes in these consolidated financial statements is determined on such a basis, except for share-based payment transactions that are within the scope of AASB 2, leasing transactions that are within the scope of AASB 117, and measurements that have some similarities to fair value but are not fair value, such as net realisable value in AASB 2 or value in use in AASB 136.
In addition, for financial reporting purposes, fair value measurements are categorised into Level 1, 2 or 3 based on the degree to which the inputs to the fair value measurements are observable and the significance of the inputs to the fair value measurement in its entirety, which are described as follows:
• Level 1 inputs are quoted prices (unadjusted) in active markets for identical assets or liabilities that the entity can access at the measurement date;
• Level 2 inputs are inputs, other than quoted prices included within Level 1, that are observable for the asset or liability, either directly or indirectly; and
• Level 3 inputs are unobservable inputs for the asset or liability.
The Company is a company of the kind referred to in ASIC Class Order 98/100, dated 10 July 1998, and in accordance with that Class Order amounts in the financial report are rounded off to the nearest thousand dollars, unless otherwise indicated.
Going Concern Assumption
The consolidated financial statements have been prepared on a going concern basis. The financial statements reflect a deficiency of current assets over current liabilities at 30 June 2016 of $38,904,000 and a loss from continuing operations after tax for 2016 of $13,428,000. Based on forecast positive operating cash flows, net of sustaining capital expenditure, and the equity raising announced on 6 September 2016, to raise in the order of $39,000,000 net of costs, the Directors are satisfied the going concern assumption is appropriate. Proceeds of $26,600,000 after costs were
For
per
sona
l use
onl
y

Troy Resources Limited Annual Financial Report
For the Financial Year Ended 30 June 2016
Notes to the consolidated financial statements
23
received on 19 September 2016 from the first part of the equity raising which included the institutional placement and accelerated portion of the non-renounceable entitlement offer.
Basis of consolidation The consolidated financial statements incorporate the financial statements of the Company and entities controlled by the Company and its subsidiaries. Control is achieved when the Company:
• has power over the investee;
• is exposed, or has rights, to variable returns from its involvement with the investee; and
• has the ability to use its power to affect its returns.
The Company reassesses whether or not it controls an investee if facts and circumstances indicate that there are changes to one or more of the three elements of control listed above.
When the Company has less than a majority of the voting rights of an investee, it has power over the investee when the voting rights are sufficient to give it the practical ability to direct the relevant activities of the investee unilaterally. The Company considers all relevant facts and circumstances in assessing whether or not the Company's voting rights in an investee are sufficient to give it power, including:
• the size of the Company's holding of voting rights relative to the size and dispersion of holdings of the other vote holders;
• potential voting rights held by the Company, other vote holders or other parties;
• rights arising from other contractual arrangements; and
any additional facts and circumstances that indicate that the Company has, or does not have, the current ability to direct the relevant activities at the time that decisions need to be made, including voting patterns at previous shareholders' meetings.
Consolidation of a subsidiary begins when the Company obtains control over the subsidiary and ceases when the Company loses control of the subsidiary. Specifically, income and expenses of a subsidiary acquired or disposed of during the year are included in the consolidated statement of profit or loss and other comprehensive income from the date the Company gains control until the date when the Company ceases to control the subsidiary.
Profit or loss and each component of other comprehensive income are attributed to the owners of the Company and to the non-controlling interests. Total comprehensive income of subsidiaries is attributed to the owners of the Company and to the non-controlling interests even if this results in the non-controlling interests having a deficit balance.
When necessary, adjustments are made to the financial statements of subsidiaries to bring their accounting policies into line with the Group's accounting policies.
All intragroup assets and liabilities, equity, income, expenses and cash flows relating to transactions between members of the Group are eliminated in full on consolidation.
Changes in the Group’s ownership interest in existing subsidiaries
Changes in the Group's ownership interests in subsidiaries that do not result in the Group losing control over the subsidiaries are accounted for as equity transactions. The carrying amounts of the Group's interests and the non-controlling interests are adjusted to reflect the changes in their relative interests in the subsidiaries. Any difference between the amount by which the non-controlling interests
For
per
sona
l use
onl
y

Troy Resources Limited Annual Financial Report
For the Financial Year Ended 30 June 2016
Notes to the consolidated financial statements
24
are adjusted and the fair value of the consideration paid or received is recognised directly in equity and attributed to owners of the Company.
When the Group loses control of a subsidiary, a gain or loss is recognised in profit or loss and is calculated as the difference between (i) the aggregate of the fair value of the consideration received and the fair value of any retained interest and (ii) the previous carrying amount of the assets (including goodwill), and liabilities of the subsidiary and any non-controlling interests. All amounts previously recognised in other comprehensive income in relation to that subsidiary are accounted for as if the Group had directly disposed of the related assets or liabilities of the subsidiary (i.e. reclassified to profit or loss or transferred to another category of equity as specified/permitted by applicable AASBs). The fair value of any investment retained in the former subsidiary at the date when control is lost is regarded as the fair value on initial recognition for subsequent accounting under AASB 139, when applicable, the cost on initial recognition of an investment in an associate or a joint venture.
Critical accounting judgements and key sources of estimation uncertainty In the application of the Group’s accounting policies, the Directors are required to make judgments, estimates and assumptions about the carrying amounts of assets and liabilities that are not readily apparent from other sources. The estimates and associated assumptions are based on historical experience and various other factors that are believed to be reasonable under the circumstance, the results of which form the basis of making the judgments. Actual results may differ from these estimates.
The estimates and underlying assumptions are reviewed on an ongoing basis. Revisions to accounting estimates are recognised in the period in which the estimate is revised if the revision affects only that period or in the period of the revision and future periods if the revision affects both current and future periods.
The following are the key accounting judgements and assumptions, and other key sources of estimation uncertainty at the end of the reporting period, that have the most significant effect on the amounts recognised in the financial statements and/or have a significant risk of causing a material adjustment to the carrying amounts of assets and liabilities within the next financial year:
Ore Reserve Estimates
Estimates of recoverable quantities of ore reserves include assumptions regarding commodity prices, exchange rates, discount rates, and production costs for future cash flows. It also requires interpretation of complex and difficult geological models in order to make an assessment of the size, shape, depth and quality of resources and their anticipated recoveries. The economic, geological and technical factors used to estimate ore reserves may change from period to period. Changes in reported ore reserves can impact mining properties carrying values, property, plant and equipment carrying values, the provision for restoration and the recognition of deferred tax assets, due to changes in expected future cash flows. Ore reserves are integral to the amount of depreciation, depletion and amortisation charged to the income statement and the calculation of inventory.
Rehabilitation obligations
The Group estimates the future removal costs of mine operations disturbances at the time of installation of the assets and commencement of operations. In most instances, removal of assets occurs many years into the future. This requires judgemental assumptions regarding removal date, the extent of reclamation activities required, the engineering methodology for estimating cost, future removal technologies in determining the removal cost, and asset specific discount rates to determine the present value of these cash flows.
For
per
sona
l use
onl
y

Troy Resources Limited Annual Financial Report
For the Financial Year Ended 30 June 2016
Notes to the consolidated financial statements
25
Commercial production achieved at Karouni
Based on the Karouni mill achieving in excess of 75% of nameplate capacity averaged over the full month with production resulting in positive operating cash flows and forecast to continue, the Company assessed the project as achieving commercial production as from 1 Janauary 2016. This was a judgemental assessment with the potential to significantly impact on the level of gross margin for the financial year and, the balance of pre-production capitalised costs to be amortised in future years.
Fair value measurements and valuation processes
Some of the Group’s assets and liabilities are measured at fair value for financial reporting purposes. Valuations are performed by the Chief Financial Officer and reported to the Board for review and approval.
In estimating the fair value of an asset or a liability, the Group uses market-observable data to the extent it is available. Where level 1 inputs are not available, the Group engages the assistance of third parties to establish the appropriate valuation techniques and inputs to the valuation model.
Information about the valuation techniques and inputs used in determining the fair value of various assets and liabilities are disclosed in Notes 11 and 31.
Impairment of Property, Plant and Equipment and Mine Properties and Development Properties
Determining whether mine properties and development properties are impaired requires a fair value estimation under AASB 136. AASB 136 allows the recoverable amount of an asset or cash generating unit to be the higher of its value in use or fair value less cost to sell. The value in use calculation requires the Directors to estimate the future cash flows expected to arise from the cash-generating unit and a suitable discount rate in order to calculate present value. Fair value less costs to sell requires the directors to calculate the price that would be received to sell an asset in an orderly transaction between market participants at the measurement date. Where the recoverable amount is less than the carrying value, an impairment loss is recognised.
No impairment loss was recognised in the current year and an impairment loss of $97.3 million before income tax was recognised in the prior year. Details of the impairment testing and loss calculation are set out in Note 13.
Revenue Recognition
Sale of Goods
Revenue from the sale of mineral production is recognised when all the following conditions are satisfied:
(i) the Group has transferred to the buyer the significant risks and rewards of ownership of the goods;
(ii) the Group retains neither continuing managerial involvement to the degree usually associated with ownership nor effective control over the goods sold;
(iii) the amount of revenue can be measured reliably;
(iv) it is probable that the economic benefits associated with the transaction will flow to the Group; and
(v) the costs incurred or to be incurred in respect of the transaction can be measured reliably.
For
per
sona
l use
onl
y

Troy Resources Limited Annual Financial Report
For the Financial Year Ended 30 June 2016
Notes to the consolidated financial statements
26
Significant Accounting Policies The following significant policies have been adopted in the preparation of the Financial Report:
(a) Cash and Cash Equivalents
Cash includes cash on hand and in banks, and money market investments readily convertible to cash, net of outstanding bank overdrafts. Bank overdrafts are carried at the principal amount. Interest is recognised as income or expense as it accrues.
(b) Inventories
Inventories are stated at the lower of cost and net realisable value. Ore stockpiles, gold in circuit, dore and bullion are valued applying absorption costing. Net realisable value represents the estimated selling price for inventories less all estimated costs of completion and costs necessary to make the sale.
(c) Property, Plant and Equipment
Property, Plant and Equipment
Items of property, plant and equipment are recorded at cost, less accumulated depreciation and impairment.
Items of property, plant and equipment, including buildings and leasehold property are depreciated/amortised using the straight-line or reducing balance method over their estimated useful lives. Assets are depreciated or amortised from the date of acquisition or from the time an asset is completed and held ready for use.
The depreciation and amortisation rates used for each class of asset are based on the following assessment of useful lives:
• Plant and equipment 3-5 years • Motor Vehicle 3-5 years • Buildings 5-7 years
Depreciation is not charged on land. Buildings are recorded at amortised cost.
Mining Assets
Mining Assets represent the accumulation of all exploration, evaluation and development expenditure incurred by or on behalf of the Group and mining properties in relation to areas of interest.
Mining Exploration
Refer to 1(e) below. If it is established that a project has reached a stage that permits reasonable assessment of the existence of economically recoverable reserves, exploration and evaluation costs ceases and the accumulated expenditures are transferred to mining development properties.
Mining Properties and Development Properties
Refer to 1(d) below. Development costs related to an area of interest where right of tenure is current, are carried forward to the extent that they are expected to be recouped through sale or successful exploitation of the area of interest. If an area is subsequently abandoned or the Directors believe that it is not commercial, any accumulated costs in respect of that area are written off in the financial period the decision is made.
For
per
sona
l use
onl
y

Troy Resources Limited Annual Financial Report
For the Financial Year Ended 30 June 2016
Notes to the consolidated financial statements
27
(d) Mining Properties and Development Properties
Where mining of a mineral resource has commenced, the accumulated costs are transferred to mine properties from development properties. Amortisation is first charged on new mining ventures from the date of first commercial production.
Amortisation of mine property costs is provided on the unit of production basis. The unit of production basis results in an amortisation charge proportional to the depletion of the estimated economically recoverable ore reserves. The unit of production basis is generally calculated on an ounce depleted basis.
(e) Mining Exploration Properties
Exploration and evaluation expenditure incurred by or on behalf of the Group is accumulated separately for each prospect area. Such expenditure comprises net direct costs and an appropriate portion of related overhead expenditure, but does not include general overheads or administrative expenditure not having a specific nexus with a particular prospect area. Each area of interest is limited to a size related to a known or probable mineral resource capable of supporting a mining operation.
Exploration and evaluation expenditure for each prospect area is fully written off in the financial year in which it is incurred, unless its recoupment out of revenue is to be derived from the successful development of the prospect, or from sale of that prospect, is reasonably assured.
The recoverable amount of each prospect area is assessed annually by the Directors. Where the carrying value of a prospect is in excess of its estimated recoverable amount, the carrying value is written down to its recoverable amount.
When a prospect area is abandoned, any expenditure carried forward in respect of that area is written off to profit or loss. Expenditure is not carried forward in respect of any prospect area unless the economic entity’s rights of tenure to that area are current.
Once a development decision has been taken, all exploration and evaluation expenditure in respect of the prospect area is transferred to "Development Properties".
(f) Financial Assets
Financial assets are recognised when a Group entity becomes a party to the contractual provisions of the instrument.
Financial assets are initially measured at fair value. Transaction costs that are directly attributable to the acquisition of financial assets (other than financial assets at fair value through profit or loss) are added to or deducted from the fair value of the financial assets, as appropriate, on initial recognition. Transaction costs directly attributable to the acquisition of financial assets at fair value through profit or loss are recognised immediately in profit or loss.
Financial assets are classified into the following specified categories: financial assets ‘at fair value through profit or loss’ (FVTPL), ‘held-to-maturity’ investments, ‘available-for-sale’ (AFS) financial assets and ‘loans and receivables’. The classification depends on the nature and purpose of the financial assets and is determined at the time of initial recognition. All regular way purchases or sales of financial assets are recognised and derecognised on a trade date basis. Regular way purchases or sales are purchases or sales of financial assets that require delivery of assets within the time frame established by regulation or convention in the marketplace.
Effective interest method
The effective interest method is a method of calculating the amortised cost of a debt instrument and of allocating interest income over the relevant period. The effective interest
For
per
sona
l use
onl
y

Troy Resources Limited Annual Financial Report
For the Financial Year Ended 30 June 2016
Notes to the consolidated financial statements
28
rate is the rate that exactly discounts estimated future cash receipts (including all fees on points paid or received that form an integral part of the effective interest rate, transaction costs and other premiums or discounts) through the expected life of the debt instrument, or (where appropriate) a shorter period, to the net carrying amount on initial recognition.
Income is recognised on an effective interest basis for debt instruments other than those financial assets classified as at FVTPL.
Financial Assets at fair value through profit or loss (FVTPL)
Financial assets are classified as at FVTPL when the financial asset is either held for trading or it is designated as at FVTPL. A financial asset is classified as held for trading if:
• it has been acquired principally for the purpose of selling it in the near term; or • on initial recognition it is part of a portfolio of identified financial instruments that the
Group manages together and has a recent actual pattern of short-term profit-taking; or
• it is a derivative that is not designated and effective as a hedging instrument
A financial asset other than a financial asset held for trading may be designated as at FVTPL upon initial recognition if:
• such designation eliminates or significantly reduces a measurement or recognition inconsistency that would otherwise arise; or
• the financial asset forms part of a group of financial assets or financial liabilities or both, which is managed and its performance is evaluated on a fair value basis, in accordance with the Group's documented risk management or investment strategy, and information about the grouping is provided internally on that basis; or
• it forms part of a contract containing one or more embedded derivatives, and AASB 139 ‘Financial Instruments: Recognition and Measurement’ permits the entire combined contract to be designated as at FVTPL.
Financial assets at FVTPL are stated at fair value, with any gains or losses arising on remeasurement recognised in profit or loss. The net gain or loss recognised in profit or loss incorporates any dividend or interest earned on the financial asset. Fair value is determined in the manner described in Note 31.
Held-to-maturity investments
Bills of exchange and debentures with fixed or determinable payments and fixed maturity dates that the Group has the positive intent and ability to hold to maturity are classified as held-to-maturity investments. Held-to-maturity investments are measured at amortised cost using the effective interest method less any impairment.
Available-for-sale financial assets (AFS)
Shares held by the Group that are traded in an active market are classified as AFS and are stated at fair value. Fair value is determined in the manner described in Note 31. Gains and losses arising from changes in fair value are recognised in other comprehensive income and accumulated in the available for sale revaluation reserve, with the exception of impairment losses, interest calculated using the effective interest method, and foreign exchange gains and losses on monetary assets, which are recognised in profit or loss. Where the investment is disposed of or is determined to be impaired, the cumulative gain or loss previously accumulated in the investments revaluation reserve is reclassified to profit or loss.
Dividends on AFS equity instruments are recognised in profit or loss when the Group’s right to receive the dividends is established.
For
per
sona
l use
onl
y
Troy Resources Limited Annual Financial Report
For the Financial Year Ended 30 June 2016
Notes to the consolidated financial statements
29
Loans and receivables
Trade receivables, loans, and other receivables that have fixed or determinable payments that are not quoted in an active market are classified as ‘loans and receivables’. Loans and receivables are measured at amortised cost using the effective interest method, less any impairment. Interest income is recognised by applying the effective interest rate, except for short-term receivables when the effect of discounting is immaterial.
Impairment of financial assets
Financial assets, other than those at FVTPL, are assessed for indicators of impairment at the end of each reporting period. Financial assets are considered to be impaired when there is objective evidence that, as a result of one or more events that occurred after the initial recognition of the financial asset, the estimated future cash flows of the investment have been affected.
The carrying amount of the financial asset is reduced by the impairment loss directly for all financial assets with the exception of trade receivables, where the carrying amount is reduced through the use of an allowance account. When a trade receivable is considered uncollectible, it is written off against the allowance account. Subsequent recoveries of amounts previously written off are credited against the allowance account. Changes in the carrying amount of the allowance account are recognised in profit or loss.
When an AFS financial asset is considered to be impaired, cumulative gains or losses previously recognised in other comprehensive income are reclassified to profit or loss in the period.
In respect of AFS equity securities, impairment losses previously recognised in profit or loss are not reversed through profit or loss. Any increase in fair value subsequent to an impairment loss is recognised in other comprehensive income and accumulated under the heading of investments revaluation reserve.
Derecognition of financial assets
The Group derecognises a financial asset when the contractual rights to the cash flows from the asset expire, or when it transfers the financial asset and substantially all the risks and rewards of ownership of the asset to another party. If the Group neither transfers nor retains substantially all the risks and rewards of ownership and continues to control the transferred asset, the Group recognises its retained interest in the asset and an associated liability for amounts it may have to pay. If the Group retains substantially all the risks and rewards of ownership of a transferred financial asset, the Group continues to recognise the financial asset and also recognises a collateralised borrowing for the proceeds received.
On derecognition of a financial asset in its entirety, the difference between the asset's carrying amount and the sum of the consideration received and receivable and the cumulative gain or loss that had been recognised in other comprehensive income and accumulated in equity is recognised in profit or loss.
On derecognition of a financial asset other than in its entirety (e.g. when the Group retains an option to repurchase part of a transferred asset), the Group allocates the previous carrying amount of the financial asset between the part it continues to recognise under continuing involvement, and the part it no longer recognises on the basis of the relative fair values of those parts on the date of the transfer. The difference between the carrying amount allocated to the part that is no longer recognised and the sum of the consideration received for the part no longer recognised and any cumulative gain or loss allocated to it that had been recognised in other comprehensive income is recognised in profit or loss. A cumulative gain or loss that had been recognised in other comprehensive income is allocated between the part that continues to be recognised and the part that is no longer recognised on the basis of the relative fair values of those parts.
For
per
sona
l use
onl
y

Troy Resources Limited Annual Financial Report
For the Financial Year Ended 30 June 2016
Notes to the consolidated financial statements
30
(g) Provisions
Provisions are recognised when the Group has a present obligation (legal or constructive) as a result of a past event, and it is probable that the Group will be required to settle the obligation, and a reliable estimate can be made of the amount of the obligation.
The amount recognised as a provision is the best estimate of the consideration required to settle the present obligation at the end of the reporting period, taking into account the risks and uncertainties surrounding the obligation. When a provision is measured using the cash flows estimated to settle the present obligation, its carrying amount is the present value of those cash flows (where the effect of the time value of money is material).
When some or all of the economic benefits required to settle a provision are expected to be recovered from a third party, a receivable is recognised as an asset if it is virtually certain that reimbursement will be received and the amount of the receivable can be measured reliably.
Onerous Contracts
Present obligations arising under onerous contracts are recognised and measured as provisions. An onerous contract is considered to exist where the Group has a contract under which the unavoidable costs of meeting the obligations under the contract exceed the economic benefits expected to be received from the contract.
(h) Employee Benefits
Short-term and Long-term employee benefits
A liability is recognised for benefits accruing to employees in respect of wages and salaries, annual leave, long service leave, and sick leave when it is probable that settlement will be required and they are capable of being measured reliably.
Liabilities recognised in respect of short-term employee benefits, are measured at their nominal values using the remuneration rate expected to apply at the time of settlement.
Liabilities recognised in respect of long term employee benefits are measured as the present value of the estimated future cash outflows to be made by the Group in respect of services provided by employees up to reporting date.
Retirement benefits costs
Payments to defined contribution superannuation plans are recognised as an expense when incurred.
Termination benefit
A liability for a termination benefit is recognised at the earlier of when the entity can no longer withdraw the offer of the termination benefit and when the entity recognises any related restructuring costs.
(i) Income Tax
Income tax expense represents the sum of the tax currently payable and deferred tax.
Current Tax
The tax currently payable is based on taxable profit for the year. Taxable profit differs from profit before tax as reported in the consolidated statement of profit or loss because of items of income or expense that are taxable or deductible in other years and items that are never taxable or deductible. The Group’s current tax is calculated using tax rates that have been enacted or substantively enacted by the end of the reporting period.
For
per
sona
l use
onl
y

Troy Resources Limited Annual Financial Report
For the Financial Year Ended 30 June 2016
Notes to the consolidated financial statements
31
Deferred Tax
Deferred tax is recognised on temporary differences between the carrying amounts of assets and liabilities in the consolidated financial statements and the corresponding tax bases used in the computation of taxable profit. Deferred tax liabilities are generally recognised for all taxable temporary differences. Deferred tax assets are generally recognised for all deductible temporary differences to the extent that it is probable that taxable profits will be available against which those deductible temporary differences can be utilised. Such deferred tax assets and liabilities are not recognised if the temporary difference arises from the initial recognition (other than in a business combination) of assets and liabilities in a transaction that affects neither the taxable profit nor the accounting profit. In addition, deferred tax liabilities are not recognised if the temporary difference arises from the initial recognition of goodwill.
Deferred tax liabilities are recognised for taxable temporary differences associated with investments in subsidiaries and associates, and interests in joint ventures, except where the Group is able to control the reversal of the temporary difference and it is probable that the temporary difference will not reverse in the foreseeable future. Deferred tax assets arising from deductible temporary differences associated with such investments and interests are only recognised to the extent that it is probable that there will be sufficient taxable profits against which to utilise the benefits of the temporary differences and they are expected to reverse in the foreseeable future.
The carrying amount of deferred tax assets is reviewed at the end of each reporting period and reduced to the extent that it is no longer probable that sufficient taxable profits will be available to allow all or part of the asset to be recovered.
Deferred tax assets and liabilities are measured at the tax rates that are expected to apply in the period in which the liability is settled or the asset realised, based on tax rates (and tax laws) that have been enacted or substantively enacted by the end of the reporting period. The measurement of deferred tax liabilities and assets reflects the tax consequences that would follow from the manner in which the Group expects, at the end of the reporting period, to recover or settle the carrying amount of its assets and liabilities.
Deferred tax liabilities and assets are offset when there is a legally enforceable right to set off current tax assets against current tax liabilities and when they relate to income taxes levied by the same taxation authority and the Group intends to settle its current tax assets and liabilities on a net basis.
Current and deferred tax for the year
Current and deferred tax are recognised in profit or loss, except when they relate to items that are recognised in other comprehensive income or directly in equity, in which case the current and deferred tax are also recognised in other comprehensive income or directly in equity, respectively. Where current tax or deferred tax arises from the initial accounting for a business combination, the tax effect is included in the accounting for the business combination.
The Company and its wholly-owned Australian resident entities are part of a tax-consolidated group under Australian taxation law. Troy Resources Limited is the head entity in the tax-consolidated group. Tax expense/income, deferred tax liabilities and deferred tax assets arising from temporary differences of the members of the tax-consolidated group are recognised in the separate financial statements of the members of the tax-consolidated group using the ‘separate taxpayer within the group’ approach by reference to the carrying amounts in the separate financial statements of each entity and the tax values applying under tax consolidation. Current tax liabilities and assets and deferred tax assets arising from unused tax losses and relevant tax credits of the members of the tax-consolidated group are recognised by the company (as head entity in the tax-consolidated group).
For
per
sona
l use
onl
y

Troy Resources Limited Annual Financial Report
For the Financial Year Ended 30 June 2016
Notes to the consolidated financial statements
32
(j) Foreign Currencies
The individual financial statements of each Group entity are presented in the currency of the primary economic environment in which the entity operates (its functional currency). For the purpose of the consolidated financial statements, the results and financial position of each Group entity are expressed in Australian dollars (‘$’), which is the functional currency of the Company and the presentation currency for the consolidated financial statements.
In preparing the financial statements of each individual Group entity, transactions in currencies other than the entity’s functional currency (foreign currencies) are recognised at the rates of exchange prevailing at the dates of the transactions. At the end of each reporting period, monetary items denominated in foreign currencies are retranslated at the rates prevailing at that date. Non-monetary items carried at fair value that are denominated in foreign currencies are retranslated at the rates prevailing at the date when the fair value was determined. Non-monetary items that are measured in terms of historical cost in a foreign currency are not retranslated.
Exchange differences on monetary items are recognised in profit or loss in the period in which they arise except for:
• exchange differences on foreign currency borrowings relating to assets under construction for future productive use, which are included in the cost of those assets when they are regarded as an adjustment to interest costs on those foreign currency borrowings;
• exchange differences on transactions entered into in order to hedge certain foreign currency risks; and
• exchange differences on monetary items receivable from or payable to a foreign operation for which settlement is neither planned nor likely to occur (therefore forming part of the net investment in the foreign operation), which are recognised initially in other comprehensive income and reclassified from equity to profit or loss on repayment of the monetary items.
For the purpose of presenting these consolidated financial statements, the assets and liabilities of the Group’s foreign operations are translated into Australian dollars using exchange rates prevailing at the end of the reporting period. Income and expense items are translated at the average exchange rates for the period, unless exchange rates fluctuated significantly during that period, in which case the exchange rates at the dates of the transactions are used. Exchange differences arising, if any, are recognised in other comprehensive income and accumulated in equity (attributed to non-controlling interests as appropriate).
On the disposal of a foreign operation (i.e. a disposal of the Group’s entire interest in a foreign operation, or a disposal involving loss of control over a subsidiary that includes a foreign operation, loss of joint control over a jointly controlled entity that includes a foreign operation, or loss of significant influence over an associate that includes a foreign operation), all of the accumulated exchange differences in respect of that operation attributable to the Group are reclassified to profit or loss.
In addition, in relation to a partial disposal of a subsidiary that does not result in the Group losing control over the subsidiary, the proportionate share of accumulated exchange differences are reattributed to non-controlling interests and are not recognised in profit or loss. For all other partial disposals (i.e. partial disposals of associates or jointly controlled entities that do not result in the Group losing significant influence or joint control), the proportionate share of the accumulated exchange differences is reclassified to profit or loss.
Goodwill and fair value adjustments on identifiable assets and liabilities acquired arising on the acquisition of a foreign operation are treated as assets and liabilities of the foreign
For
per
sona
l use
onl
y

Troy Resources Limited Annual Financial Report
For the Financial Year Ended 30 June 2016
Notes to the consolidated financial statements
33
operation and translated at the rate of exchange prevailing at the end of each reporting period. Exchange differences arising are recognised in other comprehensive income and accumulated in equity.
(k) Dividend and Interest Income
Dividend income from investments is recognised when the shareholder’s right to receive payment has been established (provided that it is probable that the economic benefits will flow to the Group and the amount of income can be measured reliably).
Interest income from a financial asset is recognised when it is probable that the economic benefits will flow to the Group and the amount of revenue can be measured reliably. Interest income is accrued on a time basis, by reference to the principal outstanding and at the effective interest rate applicable, which is the rate that exactly discounts estimated future cash receipts through the expected life of the financial asset to that asset’s net carrying amount on initial recognition.
(l) Goods and Services Tax
Revenues, expenses and assets are recognised net of the amount of goods and services tax (GST) or value added tax (VAT), except:
(i) where the amount of GST/VAT incurred is not recoverable from the taxation authority, it is recognised as part of the cost of acquisition of an asset or as part of an item of expense; or
(ii) for receivables and payables which are recognised inclusive of GST/VAT.
The net amount of GST/VAT recoverable from, or payable to, the taxation authority is included as part of receivables or payables. Cash flows are included in the statement of cash flows on a gross basis. The GST/VAT component of the cash flows arising from investing and financing activities which is recoverable from, or payable to, the taxation office is classified as operating cash flows.
(m) Borrowing Costs
Borrowing costs directly attributable to the acquisition, construction or production of qualifying assets, which are assets that necessarily take a substantial period of time to get ready for their intended use or sale, are added to the cost of those assets, until such time as the assets are substantially ready for their intended use or sale.
Investment income earned on the temporary investment of specific borrowings pending their expenditure on qualifying assets is deducted from the borrowing costs eligible for capitalisation.
All other borrowing costs are recognised in profit or loss in the period in which they are incurred.
(n) Share-based payments
Equity-settled share-based payments to employees and others providing similar services, including share based borrowing costs are measured at the fair value of the equity instruments at the grant date. Details regarding the determination of the fair value of equity-settled share-based transactions are set out in Note 27.
The fair value determined at the grant date of the equity-settled share-based payments is expensed on a straight-line basis over the vesting period, based on the Group’s estimate of equity instruments that will eventually vest, with a corresponding increase in equity. At the end of each reporting period, the Group revises its estimate of the number of equity instruments expected to vest. The impact of the revision of the original estimates, if any, is
For
per
sona
l use
onl
y
Troy Resources Limited Annual Financial Report
For the Financial Year Ended 30 June 2016
Notes to the consolidated financial statements
34
recognised in profit or loss such that the cumulative expense reflects the revised estimate, with a corresponding adjustment to the equity-settled employee benefits reserve.
Equity-settled share-based payment transactions with parties other than employees are measured at the fair value of the goods or services received, except where that fair value cannot be estimated reliably, in which case they are measured at the fair value of the equity instruments granted, measured at the date the entity obtains the goods or the counterparty renders the service.
For cash-settled share-based payments, a liability is recognised for the goods or services acquired, measured initially at the fair value of the liability. At the end of each reporting period until the liability is settled, and at the date of settlement, the fair value of the liability is remeasured, with any changes in fair value recognised in profit or loss for the year.
(o) Financial liabilities and equity instruments issued by the Group
Financial liabilities are recognised when a Group entity becomes a party to the contractual provisions of the instrument.
Financial liabilities are initially measured at fair value. Transaction costs that are directly attributable to the issue of financial liabilities (other than financial liabilities at fair value through profit or loss) are added to or deducted from the fair value of the financial liabilities, as appropriate, on initial recognition. Transaction costs directly attributable to the issue of financial liabilities at fair value through profit or loss are recognised immediately in profit or loss.
Classification as debt or equity
Debt and equity instruments are classified as either financial liabilities or as equity in accordance with the substance of the contractual arrangement.
Equity instruments
An equity instrument is any contract that evidences a residual interest in the assets of an entity after deducting all of its liabilities. Equity instruments issued by the Group are recognised at the proceeds received, net of direct issue costs.
Repurchase of the Company’s own equity instruments is recognised and deducted directly in equity. No gain or loss is recognised in profit or loss on the purchase, sale, issue or cancellation of the Company’s own equity instruments.
Financial liabilities
Financial liabilities are classified as either financial liabilities at ‘fair value through profit or loss’ (FVTPL) or ‘other financial liabilities’.
Financial liabilities at FVTPL
Financial liabilities are classified as at FVTPL when the financial liability is either held for trading or it is designated as at FVTPL.
A financial liability is classified as held for trading if:
• it has been acquired principally for the purpose of repurchasing it in the near term; or
• on initial recognition it is part of a portfolio of identified financial instruments that the Group manages together and has a recent actual pattern of short-term profit-taking; or
• it is a derivative that is not designated and effective as a hedging instrument.
A financial liability other than a financial liability held for trading may be designated as at FVTPL upon initial recognition if:
• such designation eliminates or significantly reduces a measurement or recognition
For
per
sona
l use
onl
y

Troy Resources Limited Annual Financial Report
For the Financial Year Ended 30 June 2016
Notes to the consolidated financial statements
35
inconsistency that would otherwise arise; or
• the financial liability forms part of a group of financial assets or financial liabilities or both, which is managed and its performance is evaluated on a fair value basis, in accordance with the Group's documented risk management or investment strategy, and information about the grouping is provided internally on that basis; or
• it forms part of a contract containing one or more embedded derivatives, and AASB 139 Financial Instruments: Recognition and Measurement’ permits the entire combined contract (asset or liability) to be designated as at FVTPL.
Financial liabilities at FVTPL are stated at fair value, with any gains or losses arising on re-measurement recognised in profit or loss. The net gain or loss recognised in profit or loss incorporates any interest paid on the financial liability. Fair value is determined in the manner described in Note 31.
Other financial liabilities
Other financial liabilities, including borrowings and trade and other payables, are initially measured at fair value, net of transaction costs.
Other financial liabilities are subsequently measured at amortised cost using the effective interest method, with interest expense recognised on an effective yield basis.
The effective interest method is a method of calculating the amortised cost of a financial liability and of allocating interest expense over the relevant period. The effective interest rate is the rate that exactly discounts estimated future cash payments through the expected life of the financial liability, or (where appropriate) a shorter period, to the net carrying amount on initial recognition.
Derecognition of financial liabilities
The Group derecognises financial liabilities when, and only when, the Group’s obligations are discharged, cancelled or they expire. The difference between the carrying amount of the financial liability derecognised and the consideration paid and payable is recognised in profit or loss.
(p) Impairment of tangible and intangible assets other than goodwill
At the end of each reporting date, the Group reviews the carrying amounts of its tangible and intangible assets to determine whether there is any indication that those assets have suffered an impairment loss. If any such indication exists, the recoverable amount of the asset is estimated in order to determine the extent of the impairment loss (if any). Where the asset does not generate cash flows that are independent from other assets, the Group estimates the recoverable amount of the cash-generating unit to which the asset belongs. Where a reasonable and consistent basis of allocation can be identified, corporate assets are also allocated to individual cash-generating units, or otherwise they are allocated to the smallest group of cash-generating units for which a reasonable and consistent allocation basis can be identified.
Intangible assets with indefinite useful lives and intangible assets not yet available for use are tested for impairment at least annually, and whenever there is an indication that the asset may be impaired.
Recoverable amount is the higher of fair value less costs to sell and value in use. In assessing value in use, the estimated future cash flows are discounted to their present value using a pre-tax discount rate that reflects current market assessments of the time value of money and the risks specific to the asset for which the estimates of future cash flows have not been adjusted.
For
per
sona
l use
onl
y

Troy Resources Limited Annual Financial Report
For the Financial Year Ended 30 June 2016
Notes to the consolidated financial statements
36
If the recoverable amount of an asset or cash generating unit (CGU) is estimated to be less than its carrying amount, the carrying amount of the asset (or CGU) is reduced to its recoverable amount. An impairment loss is recognised in profit or loss immediately.
Where an impairment loss subsequently reverses, the carrying amount of the asset (or CGU) is increased to the revised estimate of its recoverable amount, but only to the extent that the increased carrying amount does not exceed the carrying amount that would have been determined had no impairment loss been recognised for the asset (or CGU) in prior years. A reversal of an impairment loss is recognised in profit or loss immediately.
(q) Earnings per Share
Basic Earnings per Share
Basic earnings per share (EPS) is calculated by dividing the net profit attributable to ordinary equity holders of the parent entity for the reporting period, after excluding any costs of servicing equity (other than ordinary shares and converting preference shares treated as ordinary shares for EPS calculation purposes), by the weighted average number of ordinary shares of the Company, adjusted for any bonus issue.
Diluted Earnings per Share
Diluted EPS is calculated by dividing the basic earnings, adjusted by the after tax effect of financing costs associated with dilutive potential ordinary shares and the effect on revenues and expenses of conversion to ordinary shares associated with dilutive potential shares, by the weighted average number of ordinary shares and dilutive potential ordinary shares adjusted for any bonus issue.
(r) Derivative Financial Instruments
The Group is exposed to changes in interest rates, foreign exchange rates and commodity prices from its activities. The Group may use forward foreign exchange contracts, forward commodity exchange contracts and put and call options to hedge its foreign exchange rate and commodity risk. Derivative financial instruments are not held for speculative purposes.
Derivatives are initially recognised at fair value at the date the derivative contract is entered into and are subsequently remeasured to their fair value at the end of each reporting period. The resulting gain or loss is recognised in profit or loss immediately unless the derivative is designated and effective as a hedging instrument, in which event the timing of the recognition in profit or loss depends on the nature of the hedge relationship. For further detail refer to Note 31.
Embedded Derivatives
Derivatives embedded in non-derivative host contracts are treated as separate derivatives when they meet the definition of a derivative, their risks and characteristics are not closely related to those of the host contracts and the host contracts are not measured at fair value through profit or loss.
Hedge Accounting
The Group designates certain hedging instruments, which include derivatives, embedded derivatives and non-derivatives in respect of foreign currency risk, as either fair value hedges, cash flow hedges, or hedges of net investments in foreign operations. Hedges of foreign exchange risk on firm commitments and hedges of commodity risk on gold and silver sales are accounted for as cash flow hedges.
At the inception of the hedge relationship, the entity documents the relationship between the hedging instrument and the hedged item, along with its risk management objectives and its strategy for undertaking various hedge transactions. Furthermore, at the inception of the
For
per
sona
l use
onl
y

Troy Resources Limited Annual Financial Report
For the Financial Year Ended 30 June 2016
Notes to the consolidated financial statements
37
hedge and on an ongoing basis, the Group documents whether the hedging instrument is highly effective in offsetting changes in fair values or cash flows of the hedged item attributable to the hedged risk.
Note 31 disclose details of the fair values of the derivative instruments used for hedging purposes.
Fair Value Hedge
Changes in the fair value of derivatives that are designated and qualify as fair value hedges are recognised in profit or loss immediately, together with any changes in the fair value of the hedged asset or liability that are attributable to the hedged risk. The change in the fair value of the hedging instrument and the change in the hedged item attributable to the hedged risk are recognised in profit or loss in the line item relating to the hedged item.
Hedge accounting is discontinued when the Group revokes the hedging relationship, when the hedging instrument expires or is sold, terminated, or exercised, or when it no longer qualifies for hedge accounting. The fair value adjustment to the carrying amount of the hedged item arising from the hedged risk is amortised to profit or loss from that date.
Cash Flow Hedge
The effective portion of changes in the fair value of derivatives that are designated and qualify as cash flow hedges is recognised in other comprehensive income and accumulated under the heading of cash flow hedging reserve. The gain or loss relating to the ineffective portion is recognised immediately in profit or loss.
Amounts previously recognised in other comprehensive income and accumulated in equity are reclassified to profit or loss in the periods when the hedged item is recognised in profit or loss, in the same line as the recognised hedged item. However, when the hedged forecast transaction that is hedged results in the recognition of a non-financial asset or a non-financial liability, the gains and losses previously recognised in other comprehensive income and accumulated in equity are transferred from equity and included in the initial measurement of the cost of the non-financial asset or non-financial liability.
Hedge accounting is discontinued when the Group revokes the hedging relationship, when the hedging instrument expires or is sold, terminated, or exercised, or when it no longer qualifies for hedge accounting. Any gain or loss recognised in other comprehensive income and accumulated in equity at that time remains in equity and is recognised when the forecast transaction is ultimately recognised in profit or loss. When a forecast transaction is no longer expected to occur, the gain or loss accumulated in equity is recognised immediately in profit or loss.
Hedges of net investments in foreign operations
Hedges of net investments in foreign operations are accounted for similarly to cash flow hedges. Any gain or loss on the hedging instrument relating to the effective portion of the hedge is recognised in other comprehensive income and accumulated under the heading of foreign currency translation reserve. The gain or loss relating to the ineffective portion is recognised immediately in profit or loss, and is included in the ’other gains and losses’ line item.
Gains and losses on the hedging instrument relating to the effective portion of the hedge accumulated in the foreign currency translation reserve are reclassified to profit or loss on the disposal of the foreign operation.
For
per
sona
l use
onl
y
Troy Resources Limited Annual Financial Report
For the Financial Year Ended 30 June 2016
Notes to the consolidated financial statements
38
2. ADOPTION OF NEW AND REVISED ACCOUNTING STANDARDS
Amendment to AASBs and the new Interpretation that are mandatorily effective for the current year
In the current year, the Group has applied the below amendments to AASBs and any new Interpretation issued by the Australian Accounting Standards Board (AASB) that are mandatorily effective for an accounting period that begins on or after 1 July 2015, and therefore relevant for the current year end.
AASB 2015-3 ‘Amendments to Australian Accounting Standards – Arising from the withdrawal of AASB 1031 Materiality’
This amendment completes the withdrawal of references to AASB 1031 in all Australian Accounting Standards and Interpretations, allowing that Standard to effectively be withdrawn. The application of this amendment does not have any material impact on the disclosures or the amounts recognised in the Group’s consolidated financial statements.
Standards and Interpretations issued not yet effective
At the date of this financial report, a number of Standards and Interpretations were on issue, but not yet effective.
STANDARD/INTERPRETATIONS EFFECTIVE FOR
ANNUAL REPORTING PERIODS BEGINNING
ON OR AFTER
EXPECTED TO BE INITIALLY APPLIED IN THE FINANCIAL
YEAR ENDING AASB 9 'Financial Instruments', and the relevant amending standards
1 January 2018
30 June 2019
AASB 15 'Revenue from Contracts with Customers', AASB 2014-5 ‘Amendments to Australian Accounting Standards arising from AASB 15’, AASB 2015-8 'Amendments Australian Accounting Standards - Effective date of AASB 15'
1 January 2018
30 June 2019
AASB 16 'Leases'
1 January 2019
1 January 2020
AASB 2014-3 'Amendments to Australian Accounting Standards – Accounting for Acquisitions Of Interests in Joint Operations'
1 January 2016
30 June 2017
AASB 2014-4 'Amendments to Australian Accounting Standards – Clarification of Acceptable Methods of Depreciation and Amortisation'
1 January 2016
30 June 2017
AASB 2014-9 'Amendments to Australian Accounting Standards – Equity Method in Separate Financial Statements'
1 January 2016
30 June 2017
AASB 2014-10 'Amendments to Australian Accounting Standards – Sale or Contribution of Assets between an Investor and its Associate or Joint Venture', AASB 2015-10 'Amendments to Australian Accounting Standards - Effective Date of Amendments to AASB 10 and AASB 128'.
1 January 2018
30 June 2019
AASB 2015-1 'Amendments to Australian Accounting Standards – Annual Improvements to Australian Accounting Standards 2012-2014 Cycle'
1 January 2016
30 June 2017
AASB 2015-2 'Amendments to Australian Accounting Standards – Disclosure Initiative: Amendments to AASB 101'
1 January 2016
30 June 2017
For
per
sona
l use
onl
y

Troy Resources Limited Annual Financial Report
For the Financial Year Ended 30 June 2016
Notes to the consolidated financial statements
39
STANDARD/INTERPRETATIONS EFFECTIVE FOR
ANNUAL REPORTING PERIODS BEGINNING
ON OR AFTER
EXPECTED TO BE INITIALLY APPLIED IN THE FINANCIAL
YEAR ENDING AASB 2015-5 'Amendments to Australian Accounting Standards – Investment Entities: Applying the Consolidation Exception'
1 January 2016
30 June 2017
AASB 2016-1 'Amendments to Australian Accounting Standards - Recognition of Deferred Tax Assets for Unrealised Losses'
1 January 2017
30 June 2018
AASB 2016-2 'Amendments to Australian Accounting Standards - Disclosure Initiative Amendments to AASB 107'
1 January 2017
30 June 2018
At the date of this financial report, the following IASB Standards or IFRIC Interpretations (for which Australian equivalent Standards and Interpretations have not yet been issued) were in issue, but not yet effective – Nil. Management is currently evaluating the impact that the intial application of these Standards and Interpretations will have on the financial report of the Group.
For
per
sona
l use
onl
y

Troy Resources Limited Annual Financial Report
For the Financial Year Ended 30 June 2016
Notes to the consolidated financial statements
40
3. REVENUE
2016 $’000
2015 $’000
(i) Operating revenue - continuing operations Gold sales 53,327 - Silver sales 30 - Hedge gains (net) 7,003 - 60,360 -
(ii) Other income Interest received - bank 297 620 Other 47 68
344 688
4. LOSS FOR THE YEAR BEFORE INCOME TAX INCLUDES THE FOLLOWING LOSSES AND EXPENSES
(i) Key Operating Expenses Depreciation of property, plant & equipment - Cost of sales – continuing operations 8,904 - - Cost of sales – discontinued operations 3,483 9,796 - Administration expenses 121 149 12,508 9,945 Amortisation of mining properties - Cost of sales – continuing operations 20,724 - - Cost of sales – discontinued operations - 27,755 20,724 27,755 Total Depreciation and Amortisation 33,232 37,700 Government royalties - Cost of sales – continuing operations 5,039 - - Cost of sales – discontinued operations 3,579 8,077 8,618 8,077 Export tax and other taxes - discontinued operations 3,167 8,183
(ii) Share of losses from Associate Minority interest share of losses of Casposo Note 15 2,950 -
(iii) Exploration expenditure Exploration expenditure incurred 6,079 7,004 Exploration capitalised (net of write-offs) - (3,154) Exploration expenditure incurred – discontinued operations 10 3,305 Exploration expenses (net) 6,089 7,155
For
per
sona
l use
onl
y

Troy Resources Limited Annual Financial Report
For the Financial Year Ended 30 June 2016
Notes to the consolidated financial statements
41
4. LOSS FOR THE YEAR BEFORE INCOME TAX INCLUDES THE FOLLOWING LOSSES AND EXPENSES (CONTINUED)
2016 $’000
2015 $’000
(iv) Administration expenses Head office salaries and on-costs 2,484 2,307 Previous Managing Director entitlements - 349 Expatriate salary and termination entitlements 201 - Directors fees and on-costs 397 639 Other Brazil administration 95 129 Depreciation – furniture and equipment 121 149 Canadian office and administration 511 680 Other Head office administration (1) 2,545 2,436 6,354 6,689
(1) Includes listing fees, shareholder costs, audit fees, taxation consultants, office rent, insurance, travel and other head office administration expenditure.
(v) Other expenses Share based payments 77 155 Doubtful VAT receivable 583 - Loss on sale of assets 95 124 755 279
(vi) Finance costs Borrowing costs 4,627 2,719 Rehabilitation provisions unwinding of discount 283 - Hedge finance costs (1,779) 1,705 3,131 4,424
For
per
sona
l use
onl
y

Troy Resources Limited Annual Financial Report
For the Financial Year Ended 30 June 2016
Notes to the consolidated financial statements
42
5. DISCONTINUED OPERATIONS 2016
$’000 2015 $’000
Loss for the year from discontinued operations Casposo Gold Silver Project - Argentina (74,929) (93,802) Andorinhas Gold Project - Brazil (5,303) 2,123 (80,232) (91,679)
A 51% controlling stake in Casposo held via Troy Resources Argentina Ltd was sold on the 4 March 2016. As a result of the disposal, Casposo is reported as a discontinuing operation. The project was deconsolidated from the Group on that date. Troy's 49% interest is equity accounted as an associate (refer Note 15).
Casposo 2016 $’000
2015 $’000
Gold sales 30,243 82,872 Silver sales 39,828 62,854 Hedge gains (net) - 2,612 Total Revenue 70,071 148,338 Cost of Sales (67,849) (135,842) Gross Profit 2,222 12,496 Exploration expenses (net) (10) (3,305) Net foreign exchange (loss) (756) (1,247) Restructuring costs (5,546) - Borrowing costs (192) - Impairment loss – non-cash charge - (97,319) Loss before income tax (4,282) (89,375) Attributable income tax credit (expense)(1) 2,364 (4,427) Loss after income tax, before sale (1,918) (93,802) Proceeds from sale of Casposo (51%) 4,064 - Book value of project sold (5,742) - Foreign currency translation reserve loss, recycled to the profit and loss statement on disposal (71,333) -
Attributable income tax expense on sale - - Loss for the year from discontinued operation (74,929) (93,802)
(1) The income tax credit in 2016 relates primarily to the reversal of an over estimate in the prior year.
Cash flows from discontinued operation: Net cash inflows / (outflows) from operating activities (1,542) Net cash inflows / (outflows) from investing activities (150) Net cash inflows / (outflows) from financing activities 1,636 Net cash outflows (56)
Loss on disposal of subsidiary – Troy Resources Argentina Ltd Cash proceeds on disposal of subsidiary 1,355 Deferred sale proceeds on disposal of subsidiary Refer Note 9 2,709 (Less) Net assets disposed of (5,742) (1,678)
For
per
sona
l use
onl
y

Troy Resources Limited Annual Financial Report
For the Financial Year Ended 30 June 2016
Notes to the consolidated financial statements
43
5. DISCONTINUED OPERATIONS (CONTINUED)
Cash and cash equivalents – disposal of subsidiary 2016 $’000
Consideration received in cash and cash equivalents 1,355 (Less) cash and cash equivalent balances disposed of (9,503) (8,148)
Andorinhas was closed during May 2016 with the plant and remaining inventories being sold and handed over to a third party. As a result, the project has been reported as a discontinued operation. Andorinhas 2016
$’000 2015 $’000
Gold sales 14,946 32,451 Cost of Sales (11,702) (31,912) Gross Profit 3,244 539 Profit on sale of plant and inventories at closure 6,027 - Net foreign exchange gains 2,401 625 Closure costs (995) - Other income / (expenses) 50 360 Profit before income tax 10,727 1,524 Attributable income tax credit 10 599 Profit after income tax at closure of gold operations 10,737 2,123 Foreign currency translation reserve loss, recycled to the profit & loss statement (16,040) -
(Loss) / profit for the year from discontinued operation (5,303) 2,123
Cash flows from discontinued operation: Net cash inflows / (outflows) from operating activities 162 Net cash inflows / (outflows) from investing activities 4,756 Net cash inflows / (outflows) from financing activities (2,283) Net cash flows 2,635
For
per
sona
l use
onl
y

Troy Resources Limited Annual Financial Report
For the Financial Year Ended 30 June 2016
Notes to the consolidated financial statements
44
6. INCOME TAX
a) Income Tax recognised in profit or loss Note
2016 ($’000)
2015 ($’000)
Current tax expense / (benefit) Current year – income tax charge / (income) (209) 6,281 Adjustment - current income tax of previous years (1,912) 63 Adjustment – withholding tax (1,412) - (3,533) 6,344 Deferred income tax Origination and reversal of temporary differences (1,147) 566 Temporary difference arising from impairment loss 14 - (5,885) (1,147) (5,319) Total Income tax expense / (benefit) in the income statement (4,680) 1,025 Continuing operations (2,306) (2,803) Discontinued operations (2,374) 3,828 (4,680) 1,025
Numerical Reconciliation of tax expense / (benefit) to prima facie tax payable
Loss before tax - continuing operations (15,734) (99,328) - discontinued operations (82,606) -
Total loss before tax (98,340) (99,328)
Income tax expense at the Group’s statutory tax rates of Australia: 30%, Guyana 30%, Brazil: 34% and Argentina 35%
(26,716) (34,436) Difference in income tax expense due to: Share based payments 23 47 Non-deductible foreign salaries & exploration 60 43 Non-deductible expenses 3,958 4,669 Non-deductible net disposal of subsidiary 5,771 - Group loans and foreign currency restructuring 6,853 - Impairment losses – potential future benefit not recognised as an asset - 20,091
Non-deductible impairment losses - 8,273 Under / (over) provision for income tax of previous year - 265 Over provision calendar year - 2,255 Other temporary differences not recognised (414) (309) Australian tax losses recognised / not brought to account 5,785 (6,548) Foreign tax losses not recognised - 6,675 Income tax expense / (benefit) on pre-tax net profit (4,680) 1,025 Deferred income tax related to items charged or credited directly to equity Foreign currency translation reserve - Current Tax - (146) Foreign currency reserve and hedging - Deferred Tax (2,278) 2,467 Income tax expense reported in equity (2,278) 2,321
For
per
sona
l use
onl
y

Troy Resources Limited Annual Financial Report
For the Financial Year Ended 30 June 2016
Notes to the consolidated financial statements
45
6. INCOME TAX (CONTINUED)
b) Deferred tax assets / (liabilities) arise from the following:
Opening Balance
Acquired Charged to Income
Charged to Equity
Closing Balance
2016 Capitalised mining costs – Brazil (21) - 21 - - Capitalised mining costs – Guyana(1) (13,635) - 1,629 - (12,006) Plant and equipment – capitalised interest (1,792) - (830) - (2,622) Plant and equipment - Guyana - - 572 - 572 Provisions for employee entitlements and rehabilitation 184 - 123 - 307 Intercompany loan – Guyana (6,360) - 6,360 - - Guyana tax losses - 1,203 - 1,203 Australia tax losses 9,608 - (2,450) - 7,158 Other Australia (267) - (111) 7,712 7,334 Temporary differences not brought to account - - 415 (5,434) (5,019) Tax losses not brought to account as an asset (1,373) - (5,785) - (7,158) (13,656) - 1,147 2,278 (10,231) (1)Re fair value cost base on acquisition.
Deferred tax assets 1,775 Deferred tax liabilities (12,006) (10,231) 2015 Capitalised mining costs – Brazil (69) - 43 5 (21) Capitalised mining costs – Argentina (2,028) - 2,222 (194) - Capitalised mining costs – Guyana (13,635) - - - (13,635) Plant and equipment 25 - (1,817) - (1,792) Provisions for employee entitlements and rehabilitation 191 - (7) - 184 Intercompany loan – Guyana (3,613) - (2,747) - (6,360) Australia Tax Losses 10,124 109 (625) - 9,608 Other Australia 311 - 925 (1,503) (267) Other (net) – Brazil (777) - 777 - - Tax losses not brought to account as an asset (7,037) (109) 6,548 (775) (1,373) (16,508) - 5,319 (2,467) (13,656) Deferred tax assets - Deferred tax liabilities (13,656) (13,656)
For
per
sona
l use
onl
y

Troy Resources Limited Annual Financial Report
For the Financial Year Ended 30 June 2016
Notes to the consolidated financial statements
46
6. INCOME TAX (CONTINUED)
c. Tax balances
2016
($’000) 2015
($’000)
Current tax asset / (payable) - 398 Deferred tax assets 1,775 - Deferred tax liabilities (12,006) (13,656)
Deferred tax assets relate to timing differences and tax losses in Guyana with regards to Karouni and their utilisation is dependent on the generation of future taxable profits to realise as future income tax benefits.
d. Unrecognised deferred tax assets The following deferred tax assets have not been brought to account as assets:
Tax losses – Australia 7,158 1,373 Timing differences – Australia (principally hedge liabilities) 5,019 - Timing differences – Argentina - 20,091 12,177 21,464
Tax consolidation
Relevance of tax consolidation to the Group Troy Resources Limited (Troy) and its wholly-owned Australian resident subsidiaries have formed a tax-consolidated group with effect from 1 July 2003 and are therefore taxed as a single entity from that date. The head entity within the tax consolidated group is Troy. Members of the group have not entered into a tax sharing arrangement in order to allocate income tax expense to the wholly owned subsidiaries on a pro-rata basis. In the absence of such an agreement, the subsidiaries are jointly and severally liable for the income tax liabilities of the head entity should the head entity default on its payment obligations. At balance date the likelihood of default is remote.
Nature of tax funding arrangements and tax sharing agreements Entities within the tax consolidated group have not entered into a tax funding arrangement.
For
per
sona
l use
onl
y

Troy Resources Limited Annual Financial Report
For the Financial Year Ended 30 June 2016
Notes to the consolidated financial statements
47
7. SEGMENT REPORTING
Reportable segments are determined based on the information reported to the Chief Executive Officer and Managing Director for the purposes of resource allocation and are based on geographical countries and split between operations and exploration activities.
The following is an analysis of the Group’s revenue and results by reportable operating segment for the current and prior year:
Segment revenue
Year ended Segment loss
Year ended
Note 2016 $’000
2015 $’000
2016 $’000
2015 $’000
Continuing Operations: Guyana 53,357 - (3,944) - Hedge gains (net) 7,003 - 7,003 - 60,360 - 3,059 - Discontinued Operations: Argentina 70,071 145,726 2,222 9,884 Brazil 14,946 32,451 3,244 539 Hedge gains (net) - 2,612 - 2,612 85,017 180,789 5,466 13,035 Total Operations 145,377 180,789 8,525 13,035 Exploration: Guyana (6,079) (7,004) Capitalised Guyana - 3,154 Argentina – discontinued (10) (3,305) Total Exploration (6,089) (7,155) Total Segments (before impairment loss) 145,377 180,789 2,436 5,880
Other gains (losses) -discontinued operations 5 (88,062) (97,581)
Income tax benefit / (expense) – discontinued operations 5 2,374 (3,828)
Other income 344 688 Share of (losses) from associates (2,950) - Net foreign exchange gains 132 3,624 Corporate administration (6,354) (6,689) Other expenses (755) (279) Finance costs (3,131) (4,424) Impairment loss - (547) Income tax benefit 2,306 2,803 Loss for the year (93,660) (100,353)
The revenue reported above represents revenue generated from external customers. There were no intersegment sales during the year.
Segment profit represents the profit earned by each segment without the allocation of central administration costs, directors’ salaries, interest income, expenses in relation to corporate facilities, and tax expense.
For
per
sona
l use
onl
y

Troy Resources Limited Annual Financial Report
For the Financial Year Ended 30 June 2016
Notes to the consolidated financial statements
48
7. SEGMENT REPORTING (CONTINUED)
This is the measure reported to the chief operating decision maker for the purpose of resource allocation and assessment of segment performance.
The following is an analysis of the consolidated entity’s assets and liabilities by reportable segment:
Total assets 2016 $'000
2015 $'000
Operations: Guyana – continuing operation 251,294 225,327 Argentina – discontinued operation - 27,995 Brazil – discontinued operation - 2,425 Total segment assets: 251,294 255,747 Cash and cash equivalents(1) 3,436 60,556 Tax assets (1) 1,775 398 Receivables and other assets (1) 7,107 711 Hedge asset (1) - 5,938
Total assets 263,612 323,350
(1) Unallocated assets include various assets including cash held at a corporate level that have not been
allocated to the underlying segments. The current year includes receivables due on the sales of discontinued operations.
The following is an analysis of the consolidated entity’s liabilities by reportable segment:
Total liabilities 2016 $'000
2015 $'000
Operations: Guyana – continuing operation 22,989 7,497 Argentina – discontinued operation - 25,229 Brazil – discontinued operation - closure liabilities 2,846 4,755 Total segment liabilities: 25,835 37,481 Income tax liabilities(2) 12,006 13,656 Borrowings(2) 49,235 98,541 Hedge liability(2) 19,878 - Other liabilities(2) 2,832 1,417
Total liabilities 109,786 151,095
(2) Unallocated liabilities include tax liabilities, deferred consideration, corporate level entitlements and consolidated entity borrowings not specifically allocated to any one underlying segment.
For
per
sona
l use
onl
y
Troy Resources Limited Annual Financial Report
For the Financial Year Ended 30 June 2016
Notes to the consolidated financial statements
49
7. SEGMENT REPORTING (CONTINUED)
Other Segment Information 2016
($'000) 2015
($'000)
Continuing and discontinued operations: Depreciation & Amortisation Argentina 3,483 32,489 Brazil - 4,543 Guyana 29,628 518 Total Segment 33,111 37,551 Corporate 121 149 Total Depreciation & Amortisation 33,232 37,700
Additions to non-current assets Argentina 150 31,513 Brazil - 3,002 Guyana 28,951 82,399 Development Properties \ Exploration - 3,154 Total Segment 29,101 120,068 Corporate 31 147 Total additions 29,132 120,215
8. CASH AND CASH EQUIVALENTS
2016
($’000) 2015
($’000) Cash at bank 995 13,516 Cash at bank – Overseas 2,331 16,346 Short term interest bearing deposits – Australia 110 30,694 3,436 60,556
Investments in short term money market instruments are bearing interest at rates of 1.70% to 1.90%p.a. (2015: 2.00% to 2.97%p.a.). For information on restricted cash refer to Note 32(b).
9. TRADE AND OTHER RECEIVABLES
CURRENT 2016
($’000) 2015
($’000) Other debtors and prepayments (1)(2) 12,915 5,740 Value added tax recoverable (3) - 6,929
12,915 12,669
For
per
sona
l use
onl
y

Troy Resources Limited Annual Financial Report
For the Financial Year Ended 30 June 2016
Notes to the consolidated financial statements
50
9. TRADE AND OTHER RECEIVABLES (CONTINUED) (1) Trade debtors include accounts receivable in relation to bullion and doré sales. Other debtors and
prepayments primarily include advance payments to contractors and insurers and recovery of fuel and accommodation expenses incurred on behalf of contractors. At 30 June 2016 other debtors include amounts due on the sale of disposed operations, due no later than 4 March 2017. Where the collection of receivables is doubtful an allowance for doubtful debts is recognised. No allowance has been recognised at 30 June 2016 (2015: Nil). Trade receivables operate on standard 30 to 45 day terms. No interest is charged for the first 45 days from the date of the invoice.
(2) As at 30 June 2016 (2015: Nil) no receivables are past due, or impaired. (3) As at the 30 June 2016 VAT receivables in relation to Guyana of $583,000 have been provided for as
doubtful (2015: Nil).
10. INVENTORIES
2016 ($’000)
2015 ($’000)
At Cost: Bullion on hand - 60 Doré on hand 2,016 2,100 Ore stockpiles and work in progress 4,191 8,355 Stores and raw materials 2,196 6,100 8,403 16,615
11. HEDGE ASSETS & LIABILITIES
2016 ($’000)
2015 ($’000)
Derivatives that are designated as hedging instruments carried at fair value
Hedge Assets - current Gold and silver forward contracts – Effective - 5,938 Gold and silver forward contracts – Ineffective - -
- 5,938
Hedge Liabilities – current Gold forward contracts – Effective 14,351 - Gold forward contracts – Ineffective - -
14,351 - Hedge Liabilities – non-current Gold forward contracts – Effective 5,527 - Gold forward contracts – Ineffective - -
5,527 - Hedge finance costs Hedge finance costs (1,779) 1,705
For a description of the type of hedge, the financial instruments designated as hedging instruments and the nature of the risk being hedged (refer to Note 31).
For
per
sona
l use
onl
y

Troy Resources Limited Annual Financial Report
For the Financial Year Ended 30 June 2016
Notes to the consolidated financial statements
51
12. PROPERTY, PLANT & EQUIPMENT
Note
Land & Buildings
at cost ($’000)
Plant & Equipment
at cost ($’000)
Motor Vehicles
at cost ($’000)
Total
($’000) Gross carrying amount: Balance at 30 June 2014 5,466 87,850 3,329 96,645 Additions - 78,883 - 78,883 Transfer from Development Properties - 28,901 - 28,901 Disposals - (777) (410) (1,187) Impairment 13 - (1,233) - (1,233) Net foreign currency exchange differences 20(d) 549 2,255 (8) 2,796 Balance at 30 June 2015 6,015 195,879 2,911 204,805 Additions 4,342 24,591 199 29,132 Work-in-progress transferred to Development properties
-
(66,240)
- (66,240)
Disposals (12) (19,950) (1,015) (20,977) Assets derecognised on disposal of subsidiary (2,994) (36,809) (784) (40,587) Transfers - (16) 16 - Net foreign currency exchange differences (1,809) (10,032) (560) (12,401) Balance at 30 June 2016 5,542 87,423 767 93,732 Accumulated depreciation and Impairment: Balance at 30 June 2014 (2,164) (38,932) (2,104) (43,200) Depreciation expense (824) (8,886) (235) (9,945) Disposals - 715 338 1,053 Impairment 13 - (23,801) - (23,801) Net foreign currency exchange differences 20(d) (234) 2,750 (10) 2,506 Balance at 30 June 2015 (3,222) (68,154) (2,011) (73,387) Depreciation expense (1,210) (10,953) (345) (12,508) Disposals 12 19,949 1,015 20,976 Assets derecognised on disposal of subsidiary 2,994 36,025 784 39,803 Transfers - (363) 363 - Net foreign currency exchange differences 768 17,853 51 18,672 Balance at 30 June 2016 (658) (5,643) (143) (6,444) Net book value: As at 30 June 2015 2,793 127,725 900 131,418 As at 30 June 2016 4,884 81,780 624 87,288
For
per
sona
l use
onl
y
Troy Resources Limited Annual Financial Report
For the Financial Year Ended 30 June 2016
Notes to the consolidated financial statements
52
13. MINE PROPERTIES
Note 2016
($’000) 2015
($’000) Mine properties Balance at start of financial year - 48,370 Expenditure incurred during the year 880 28,389 Provision for rehabilitation (85) 775 Assets write down (94) - Transfers in from development properties 14 173,467 - Amortisation expensed during year (20,724) (27,755) Net foreign currency exchange differences 20 (d) (4,723) 6,773 Impairment write-downs - (56,552) Balance at 30 June 2016 148,721 -
Impairment of Mine and Development Properties 2016 $’000
2015 $’000
Casposo CGU, Argentina Mining properties - 56,552 Property, plant & equipment - 24,488 Inventories – spares and consumables - 10,194 Receivables – Value added tax recoverable - 6,085 Impairment loss before income tax 5 - 97,319 Deferred income tax benefit - (5,885) Impairment loss net of income tax - 91,434
Results of impairment testing
Property, Plant & Equipment and Mine and Development Properties
Management of the Group identified one cash generating unit (CGU) being: the Karouni Gold Project in Guyana.
Non-financial assets are reviewed at each reporting period to determine whether there is an indication of impairment. Where an indicator of impairment exists, a formal estimate of recoverable amount is made.
An impairment assessment was conducted at balance date following the reduction in forecast gold production at Karouni in the coming financial year which acted as an indicator of potential impairment.
The impairment testing conducted resulted in no impairment charge being recognised for Karouni.
Methodology
The future recoverability of capitalised mining properties, development properties and property, plant and equipment is dependent on a number of key factors, which include: gold price, foreign exchange rates, discount rates used in determining the estimated discounted cashflow of CGU's and the level of reserves and resources. The costs to dispose have been estimated by management based on prevailing market conditions. Impairment is recognised when the carrying amount of the CGU exceeds its recoverable amount.
For
per
sona
l use
onl
y

Troy Resources Limited Annual Financial Report
For the Financial Year Ended 30 June 2016
Notes to the consolidated financial statements
53
13. MINE PROPERTIES (CONTINUED)
The Group has adopted fair value less cost to sell, which is greater than the value in use, and used this as the recoverable amount for impairment testing purposes. Fair value is estimated based on discounted cashflows using market based commodity price and exchange assumptions, estimated quantities of recoverable minerals, production levels, operating costs and future capital expenditure. When Mineral Resources are identified as being reasonably likely to convert to Mineral Reserves, they are included in life-of-mine plans. These Resources, less forecast costs of conversion, are included in the determination of fair value. The Group considers this valuation approach to be consistent with the approach taken by other market participants.
Present values are determined using a risk adjusted discount rate appropriate to the risks inherent in the assets.
Estimates of quantities of recoverable minerals, production levels, operating costs and capital requirements are sourced from the Group's planning process documents, including life-of-mine plans and operational budgets.
Significant judgements and assumptions are required in making estimates of fair value. CGU valuations are subject to variability in key assumptions including, but not limited to, long term gold prices, currency exchange rates, discount rates, resource conversion, production assumptions and operating costs. A change in one or more of the assumptions used to estimate fair value could reduce or increase a CGU's fair value.
Key assumptions
The table below summarises the key assumptions used in the 2016 year end carrying value assessments:
30 June 16
July 16 July 17 July 18 July 19 July 20
Gold price (US$ per ounce) 1,235 1,246 1,200 1,213 1,202
Discount rate per annum (USD, post-tax, Real) 7.5% 7.5% 7.5% 7.5% 7.5%
Foreign exchange rate (A$/US$) 0.72 0.73 0.74 0.75 0.81
Recovered gold ounces are estimated at 450,000 ounces for the remaining life-of-mine.
Commodity prices and exchange rates
These are estimated with reference to external market forecasts prevailing at year end (Bloomberg median consensus bank forecasts).
Discount rate
In determining the fair value of the CGU, the future cashflows are discounted using rates based on the Group's estimated after tax weighted average cost of capital, with an additional premium applied having regard to the geographic location of the CGU.
Operating and capital costs
Life-of-mine operating and capital cost assumptions are based on the Group's latest budget and life-of-mine plans. The projections do not include any provision for cost improvements reflecting the Group's objectives to maximise free cashflow, optimise and reduce activity, improve capital and labour productivity. Any future cost improvements achieved in a future period would therefore impact the future recoverable value.
For
per
sona
l use
onl
y
Troy Resources Limited Annual Financial Report
For the Financial Year Ended 30 June 2016
Notes to the consolidated financial statements
54
13. MINE PROPERTIES (CONTINUED) Mineral Resources
Mineral Resources are only included in a CGU's particular life-of-mine plan when there is a reasonable expectation that they will convert to Mineral Reserves. Mineral Resources may not be included in a CGU's particular life-of-mine plan for a number of reasons, including the need to constantly re-assess the economic returns on and timing of specific production options in the current economic environment.
Sensitivity analysis
By applying the assumptions and methodology set out above for Karouni, the recoverable value was assessed as marginally exceeding the carrying amount as at 30 June 2016.
Any variation in the key assumptions going forward may impact the recoverable value of Karouni. If the variation in an assumption has a negative impact on recoverable value, it could indicate a requirement for an impairment of non-current assets for Karouni.
It is estimated that a 4% (~US$50 per ounce) increase / decrease in the forecast gold price realised would have a positive / negative impact on the carrying value of Karouni by $16.6 million. Similarly a 4% decrease / increase in the foreign exchange rate would have a positive / negative impact on the carrying value of Karouni by $6.7 million. A decrease / increase in the risk adjusted discount rate by 1.5% per annum would have a positive / negative impact on the carrying value of $7.7 million. A 10,000 ounce increase / decrease (2.22%) in recovered gold ounces, over a total of 450,000 recovered ounces averaged over a four year period would have a positive / negative impact on the carrying value of $5.1 million.
It must be noted that each of these sensitivities assumes that the specific assumption moves in isolation, while all other assumptions are held constant. In reality, a change in one of the sensitivities is usually accompanied with a change in another assumption, which may have an offsetting impact. Action is also usually taken to respond to adverse changes in economic assumptions that may mitigate the impact of any such change.
14. DEVELOPMENT PROPERTIES
Development properties Note 2016 ($’000)
2015 ($’000)
Balance at start of financial year 95,755 104,444 Expenditure incurred during the year 6,855 - Capitalised exploration expenditure 4(iii) - 3,154 Capitalised borrowing costs 4,617 6,808 Other write-down - (953) Reversal of acquisition provisions - (3,874) Transfer to mine properties (173,467) - Transfer from property, plant & equipment 66,240 (28,901) Provision for rehabilitation - 2,206 Net foreign currency exchange differences 20(d) - 12,892 Balance at end of the financial year - 95,756
Karouni transitioned from a development project to an operating mine during the year with commercial production achieved from 1 January 2016, accordingly all development property costs have been transferred to either mine properties or property, plant and equipment.
For
per
sona
l use
onl
y

Troy Resources Limited Annual Financial Report
For the Financial Year Ended 30 June 2016
Notes to the consolidated financial statements
55
15. INVESTMENT IN ASSOCIATE
On 4 March 2016 Troy sold a 51% controlling stake in Casposo, thereby deconsolidating its previously held 100% investment and taking up an equity accounted investment for its 49% retained interest. Troy’s equity accounted investment in Casposo since 4 March 2016 is detailed below:
Note 2016 ($’000)
2015 ($’000)
Balance at start of financial year - - Initial equity accounted investment – 49% of Casposo (at fair value) 3,904 -
Share of losses in Casposo 4(ii) (2,950) - Foreign currency translation reserve 120 1,074 -
Details of Assets and Liabilities of associate: 100% Total Assets(1) 74,011 Total Liabilities (70,702) Net Assets 3,309 Goodwill (discount) on acquisition(2) (1,118) 2,191 Troy equity 49% 1,074
(1) Net of provisions for doubtful debts and inventory obsolescence. (2) Includes elimination of inter-company transactions.
16. TRADE AND OTHER PAYABLES
2016 ($’000)
2015 ($’000)
CURRENT Trade payables (1) 12,671 10,384 Accrued expenses 8,428 10,582 Deferred consideration (2) 269 261 Dividends (3) 27 27 Acquisition payable - 260 21,395 21,514 NON CURRENT Withholding tax payable - 1,494
(1) The standard credit period on purchases is 30 days from statement with longer terms typical in Argentina and Guyana. No interest is usually charged on trade payables for the first 45 to 60 days from the date of invoice. Thereafter, interest is typically charged on the outstanding balance. The Group has financial risk management policies in place to ensure that all payables are paid within the credit time frame or based on arrangements agreed with the specific suppliers.
(2) As part of the agreement relating to the initial acquisition by Troy of Troy Resources Argentina Ltd in 2009, US$0.2 million has been retained until satisfactory completion of outstanding items from the purchase agreement.
(3) Represents the aggregate amount of dividends declared, determined or publicly recommended on or before the reporting date, which remain undistributed as at reporting date, regardless of the extent to which they are expected to be paid in cash (also refer to Note 20).
For
per
sona
l use
onl
y

Troy Resources Limited Annual Financial Report
For the Financial Year Ended 30 June 2016
Notes to the consolidated financial statements
56
17. PROVISIONS
2016 ($’000)
2015 ($’000)
CURRENT Rehabilitation(a) 399 858 Employee benefits(b) 2,296 6,397 Other Provisions (refer Note 29) 1,400 992 4,095 8,247
NON CURRENT Rehabilitation(a) 3,131 7,540 Employee benefits(b) 46 103 3,177 7,643
(a) Provision for rehabilitation
A provision for rehabilitation is recognised in relation to the mining activities for costs such as reclamation, waste removal, site closure, plant closure and other costs associated with the rehabilitation of a mining site. Estimates of the Group's rehabilitation obligations are based on legal requirements and future costs, which have been discounted to their present value. In determining the rehabilitation provision, the Group has assumed no significant changes will occur in the relevant legislation which underlies the rehabilitation of such mines in the future.
Rehabilitation Provisions
Current Rehabilitation
Provision ($’000)
Non-current Rehabilitation
Provision ($’000)
Balance at 30 June 2014 689 3,804 Additional provisions recognised 737 2,244 Unwinding of discount 34 563 Reduction arising from payments (418) - Reduction arising from disposal of subsidiary (87) - Net foreign currency exchange differences (97) 929 Balance at 30 June 2015 858 7,540 Additional provisions recognised 329 581 Unwinding of discount - 283 Reduction arising from payments (115) - Reduction arising from disposal of subsidiary (666) (5,115) Net foreign currency exchange differences (7) (158) Balance at 30 June 2016 399 3,131
(b) Employee Provisions 2016
($’000) 2015
($’000)
The aggregate employee entitlement liability recognised and included in the financial statements is as follows:
Current 2,296 6,397 Non-current 46 103 2,342 6,500
No.
No.
Employees at the end of the financial year 408 869
For
per
sona
l use
onl
y

Troy Resources Limited Annual Financial Report
For the Financial Year Ended 30 June 2016
Notes to the consolidated financial statements
57
18. BORROWINGS
Debt facility: Secured – at amortised cost 2016
($’000) 2015
($’000) Investec Bank Plc – Syndicated debt facility (1) (2) 52,665 100,000 Capitalised borrowing costs (3,430) (2,221) Industrial and Commercial Bank of China (Argentina) S.A. – debt facility - 762
49,235 98,541
Current 23,817 40,700 Non-current 25,418 57,841 49,235 98,541
Summary of Borrowing Arrangements
(1) During the financial year the Group repaid $40 million plus US$3.75 million on 30 June 2016, of the $100 million Investec Facility outstanding at the beginning of the financial year.
(2) The Investec Bank Plc facility was restructured during the year with the maturity extended to 30 June 2018 and the facility converted to US$42.94 million at 20 May 2016, with US$39.2 million outstanding as at 30 June 2016.
19. ISSUED CAPITAL
2016
No. (‘000)
2015 No.
(‘000) Issued Capital 340,798,782 (2015: 290,096,411) ordinary shares fully paid 340,799 290,096 340,799 290,096
2016 2015
No. (‘000)
($’000)
No. (‘000) ($’000)
Balance at the beginning of the financial year 290,096 305,311 195,035 269,689 Issue of fully paid shares on exercise of options - - 61 138 Issue of fully paid shares in lieu of cash bonus - - 169 135 Issue of fully paid shares to landowners in Guyana (1) 703 - - - Issue of fully paid shares – capital raising 50,000 9,265 94,831 35,349
340,799 314,576 290,096 305,311
Fully paid ordinary shares carry one vote per share and carry the entitlement to dividends. (1) Issued pursuant to the terms of a landowner agreement for Karouni in Guyana.
For
per
sona
l use
onl
y

Troy Resources Limited Annual Financial Report
For the Financial Year Ended 30 June 2016
Notes to the consolidated financial statements
58
20. RESERVES
2016
($’000) 2015
($’000) (a) Available for Sale Reserve: - -
The Available for Sale Reserve arises on the revaluation of available for sale financial assets. When a revalued financial asset is sold, the portion of the reserve which relates to the financial asset is recognised in profit or loss. Where a revalued financial asset is impaired, that portion of the reserve which relates to that financial asset is recognised in the profit and loss. Valuation gains / (losses) are net of applicable income taxes.
2016
($’000) 2015
($’000) (b) Share Based Payment Reserve:
Balance at beginning of financial year 8,801 5,696 Share based payments(1) 77 155 Transfer to issued capital on conversion of options - (103) Share based borrowing costs - Investec options - 3,053 Balance at the end of the financial year 8,878 8,801
(1) The Share based payments arise due to the grant of share options, performance rights and share appreciation rights under the LTIP and the issue of securities by the Company. The amount in the current year relates to awards in prior years as there were no awards in the current year.
2016
($’000) 2015
($’000) (c) Hedging Cash Flow Reserve:
Balance at beginning of financial year 5,316 (3,735) Gains / (Losses) arising on changes in fair value of hedging instruments entered into for cash flow hedges (net of income tax)
(20,304) 9,051
Balance at the end of the financial year (14,988) 5,316
The cash flow hedging reserve represents the cumulative effective portion of gains / (losses) arising on changes in fair value of hedging instruments entered into for cash flow hedges. The cumulative gains or losses arising on changes in fair value of the hedging instruments that are recognised and accumulated under the heading of cash flow hedging reserve will be reclassified to profit or loss only when the hedged transaction affects the profit or loss, or is included as a basis adjustment to the non-financial hedged item, consistent with the relevant accounting policy.
2016
($’000) 2015
($’000) (d) Foreign Currency Translation Reserve:
Balance at beginning of financial year (65,209) (93,724) Translation of foreign operations (1,180) 28,515 Recycled to profit and loss on disposal 87,373 - Balance at the end of the financial year 20,984 (65,209)
TOTAL RESERVES 14,874 (51,092)
For
per
sona
l use
onl
y
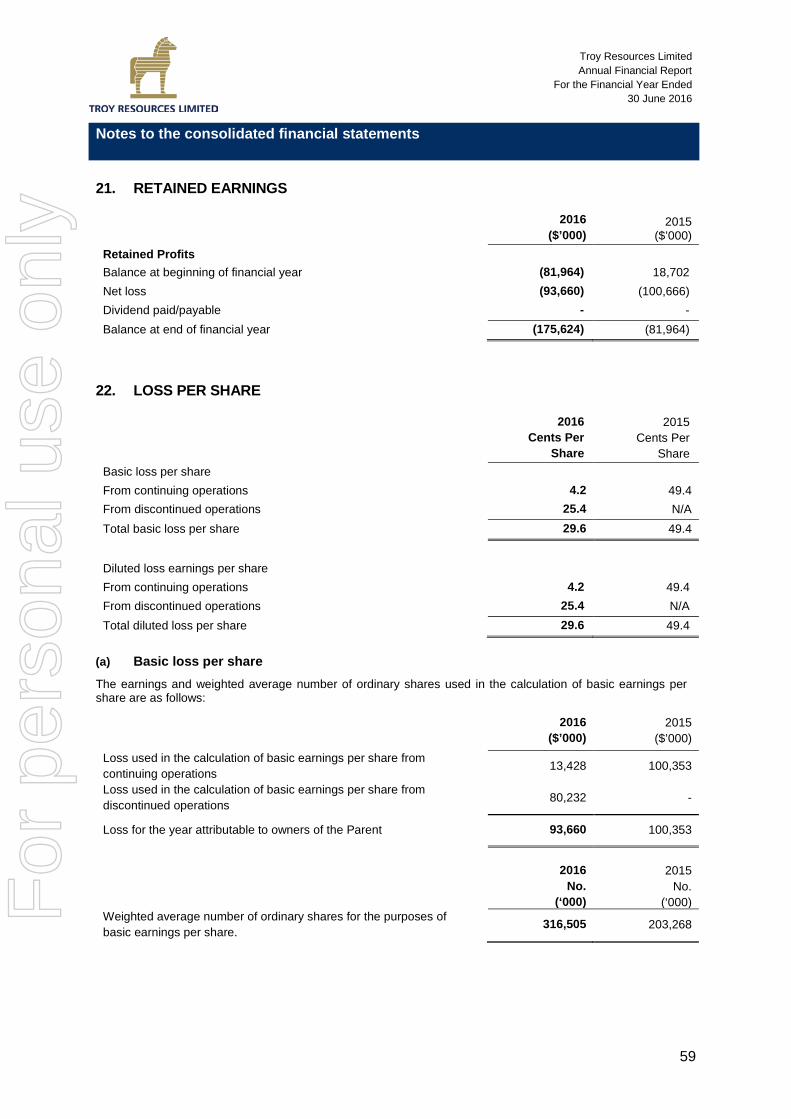
Troy Resources Limited Annual Financial Report
For the Financial Year Ended 30 June 2016
Notes to the consolidated financial statements
59
21. RETAINED EARNINGS
2016
($’000) 2015
($’000) Retained Profits Balance at beginning of financial year (81,964) 18,702 Net loss (93,660) (100,666) Dividend paid/payable - - Balance at end of financial year (175,624) (81,964)
22. LOSS PER SHARE
2016
Cents Per Share
2015 Cents Per
Share Basic loss per share From continuing operations 4.2 49.4 From discontinued operations 25.4 N/A Total basic loss per share 29.6 49.4
Diluted loss earnings per share From continuing operations 4.2 49.4 From discontinued operations 25.4 N/A Total diluted loss per share 29.6 49.4
(a) Basic loss per share The earnings and weighted average number of ordinary shares used in the calculation of basic earnings per share are as follows:
2016 ($’000)
2015 ($’000)
Loss used in the calculation of basic earnings per share from continuing operations
13,428 100,353
Loss used in the calculation of basic earnings per share from discontinued operations 80,232 -
Loss for the year attributable to owners of the Parent 93,660 100,353
2016
No. (‘000)
2015 No.
(‘000) Weighted average number of ordinary shares for the purposes of basic earnings per share.
316,505 203,268
For
per
sona
l use
onl
y
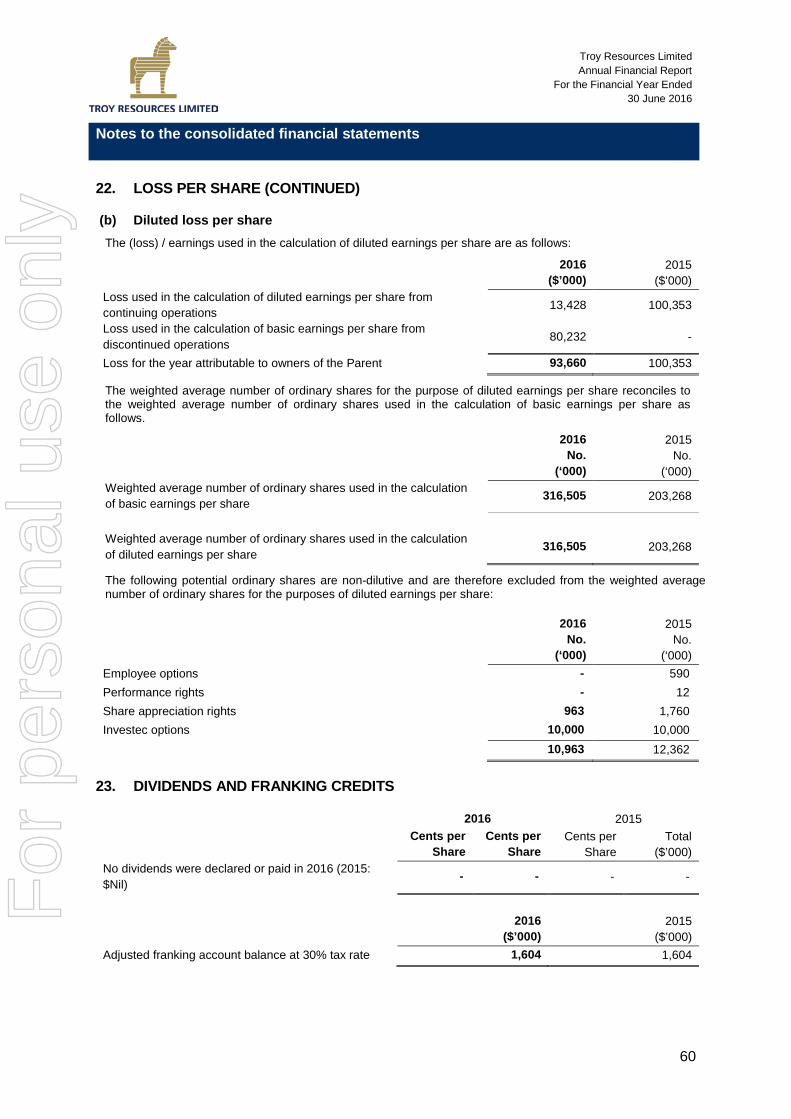
Troy Resources Limited Annual Financial Report
For the Financial Year Ended 30 June 2016
Notes to the consolidated financial statements
60
22. LOSS PER SHARE (CONTINUED)
(b) Diluted loss per share The (loss) / earnings used in the calculation of diluted earnings per share are as follows:
2016
($’000) 2015
($’000) Loss used in the calculation of diluted earnings per share from continuing operations 13,428 100,353
Loss used in the calculation of basic earnings per share from discontinued operations
80,232 -
Loss for the year attributable to owners of the Parent 93,660 100,353
The weighted average number of ordinary shares for the purpose of diluted earnings per share reconciles to the weighted average number of ordinary shares used in the calculation of basic earnings per share as follows.
2016 No.
(‘000)
2015 No.
(‘000) Weighted average number of ordinary shares used in the calculation of basic earnings per share
316,505 203,268
Weighted average number of ordinary shares used in the calculation of diluted earnings per share
316,505 203,268
The following potential ordinary shares are non-dilutive and are therefore excluded from the weighted average number of ordinary shares for the purposes of diluted earnings per share:
2016 No.
(‘000)
2015 No.
(‘000) Employee options - 590 Performance rights - 12 Share appreciation rights 963 1,760 Investec options 10,000 10,000 10,963 12,362
23. DIVIDENDS AND FRANKING CREDITS
2016 2015 Cents per
Share Cents per
Share Cents per
Share Total
($’000) No dividends were declared or paid in 2016 (2015: $Nil)
- - - -
2016
($’000) 2015
($’000) Adjusted franking account balance at 30% tax rate 1,604 1,604
For
per
sona
l use
onl
y

Troy Resources Limited Annual Financial Report
For the Financial Year Ended 30 June 2016
Notes to the consolidated financial statements
61
24. DIRECTOR AND OTHER KEY MANAGEMENT PERSONNEL COMPENSATION
(a) Key Management Personnel Compensation
The aggregate compensation of Directors and Senior Management in the Group is set out below:
2016
($) 2015
($) Short-term employee benefits(1) 2,931,546 3,326,240 Long service leave 46,110 35,499 Post-employment benefits 495,717 138,169 Share-based payments 62,830 305,136 3,536,203 3,805,044
(1) Other short-term benefits in 2015 have been restated by $25,514 to aid in comparisons.
25. AUDITOR’S REMUNERATION
2016 ($)
2015 ($)
(a) Paid or Payable to Deloitte Touche Tohmatsu in Australia: Audit of the financial reports 149,680 144,719 Tax Services 7,875 40,526
157,555 185,245 (b) Paid or Payable to overseas associates of Deloitte Touche
Tohmatsu:
Audit of the financial reports 158,526 134,398 158,526 134,398 316,081 319,643
No other benefits were received by the Auditor.
26. RELATED PARTY TRANSACTIONS
(a) Subsidiaries
The ultimate parent entity of the Group is Troy Resources Limited.
Details of the ownership of ordinary shares held in subsidiaries are disclosed in Note 30 to the Financial Statements.
Balances and transactions between the Company and its subsidiaries, which are related parties of the Company, have been eliminated on consolidation and are not disclosed in the Notes. Details of transactions between the Group and other related parties, if any, are disclosed below.
(b) Key Management Personnel
As required by the Corporations Act 2001, the Company has disclosed information about the compensation of Directors, Executives and Other Key Management Personnel (“Compensation Disclosures”) under the heading “Remuneration Report” on pages 7 to 14 of the Directors’ Report.
For
per
sona
l use
onl
y

Troy Resources Limited Annual Financial Report
For the Financial Year Ended 30 June 2016
Notes to the consolidated financial statements
62
27. EMPLOYEE SHARE EQUITY PLANS
LONG TERM INCENTIVE PLAN
The Troy Resources Limited Long Term Incentive Plan (LTIP), was adopted by the Board on 11 October 2013. The LTIP encompasses the ability to issue options, performance rights and share appreciation rights and was approved at the 2013 Annual General Meeting.
Share Appreciation Rights (SAR’s)
SAR's can be issued under the LTIP pursuant to the following common terms and conditions:
(a) ability to issue to employees or Executive Directors of the Company or any Associated Body Corporate. Non-Executive Directors of the Company are not eligible to participate in the LTIP;
(b) a maximum of 7.5% of total issued Shares are available for issue upon the exercise of Awards under the LTIP;
(c) the number of shares issued under the LTIP in the last five years cannot exceed 5% of issued shares;
(d) issue cost is nil;
(e) SAR’s granted under the LTIP may not have a term exceeding five years from the date on which the Award is granted;
(f) upon vesting, SAR’s must be exercised by the Participant within the relevant exercise period by delivery of notice in accordance with the LTIP. Upon exercise of the SAR, and in accordance with the LTIP, the Board will determine whether to:
i) Make a cash payment, of all or part of the Shares which the Participant is entitled to receive, on exercise equal to the market value of such Shares (being the VWAP of the Shares on the ASX for the five trading days immediately preceding the exercise date) (Cash Settled). The cash payment made to a Participant will be equal to the aggregate market value of the Shares as at the date of exercise of the Share Appreciation Rights which would otherwise have been allotted and issued or transferred to the Participant on the exercise of the Share Appreciation Rights had such rights been Equity Settled; or
ii) Issue or transfer Shares to a Participant on the exercise of the Share Appreciation Rights (Equity Settled). The number of Shares delivered to Participants upon exercise of Share Appreciation Rights will depend on the amount by which the market value of the Shares has increased in value over the Grant Price. All Shares issued or transferred to a Participant under the LTIP will, from the date of issue or transfer, rank equally with all other issued Shares.
(g) unvested SAR’s will lapse when the holder ceases to be employed by the Company unless the Directors determine otherwise; and vested but unexercised share appreciation rights will continue in force and remain exercisable, subject to the satisfaction of any applicable exercise conditions, until the expiry of the Share Appreciation Right.
(h) during the year ended 30 June 2016, Nil SAR’s were issued (2015: 360,000), 321,000 vested (2015: 340,000) and 797,000 lapsed (2015: 201,000).
For
per
sona
l use
onl
y

Troy Resources Limited Annual Financial Report
For the Financial Year Ended 30 June 2016
Notes to the consolidated financial statements
63
27. EMPLOYEE SHARE EQUITY PLANS (CONTINUED)
SHARE APPRECIATION RIGHTS 2016
Month of
issue Balance
at No.
rights issued
Grant Price
No. of rights vested during
the year
Vesting Date
Number Lapsed /
Cancelled during the
year
Balance at
Vested at Vesting Period Expiry Date
1.7.15 30.6.16 30.6.16 Nov-13 250,000 - $1.10 - - (250,000) - - Dec-13 - Mar-16 31-Mar-16
Nov-13 250,000 - $1.10 - - (250,000) - - Dec-13 - Mar-16 31-Mar-16
Nov-13 120,000 - $1.21 - $1.43 40,000 Dec-15 - 120,000 80,000 Dec-14 - Dec-16 20-Dec-17
Dec-13 780,000 - $1.21 - $1.43 181,000 Dec-15 (237,000) 543,000 362,000 Dec-14 - Dec-16 20-Dec-17
Jul-14 30,000 - $1.38 - $1.63 - - (30,000) - - Mar-15 - Mar-17 26-Mar-18
Jul-14 60,000 - $1.38 - $1.63 20,000 - - 60,000 40,000 Apr-15 - Apr-17 27-Apr-18
Jul-14 30,000 - $1.38 - $1.63 - - (30,000) - - May-15 - May-17 31-May-18
Nov-14 240,000 - $0.88 - $1.04 80,000 - - 240,000 80,000 Sep-15 - Sep-18 1-Sep-18
1,760,000 - $0.88 - $1.63 321,000 - (797,000) 963,000 562,000
SHARE APPRECIATION RIGHTS 2015
Month of
issue Balance
at No.
rights issued
Grant Price
No. of rights vested during
the year
Vesting Date
Number Lapsed /
Cancelled during the
year
Balance at
Vested at Vesting Period Expiry Date
1.7.14 30.6.15 30.6.15 Nov-13 250,000 - $1.10 - - - 250,000 - Dec-13 - Mar-16 31-Mar-16
Nov-13 250,000 - $1.10 - - - 250,000 - Dec-13 - Mar-16 31-Mar-16
Nov-13 300,000 - $1.21 - $1.43 40,000 - (180,000) 120,000 40,000 Dec-14 - Dec-16 20-Dec-17
Dec-13 801,000 - $1.21 - $1.43 260,000 Dec-14 (21,000) 780,000 260,000 Dec-14 - Dec-16 20-Dec-17
Jul-14 - 30,000 $1.38 - $1.63 10,000 Mar-15 - 30,000 10,000 Mar-15 - Mar-17 26-Mar-18
Jul-14 - 60,000 $1.38 - $1.63 20,000 April 15 - 60,000 20,000 Apr-15 - Apr-17 27-Apr-18
Jul-14 - 30,000 $1.38 - $1.63 10,000 May-15 - 30,000 10,000 May-15 - May-17 31-May-18
Nov-14 - 240,000 $0.88 - $1.04 - - - 240,000 - Sep-15 - Sep-18 1-Sep-18
1,601,000 360,000 $0.88 - $1.63 340,000 - (201,000) 1,760,000 340,000
Employee Share Option Plan
There has been no grant of options during the year.
For
per
sona
l use
onl
y

Troy Resources Limited Annual Financial Report
For the Financial Year Ended 30 June 2016
Notes to the consolidated financial statements
64
27. EMPLOYEE SHARE EQUITY PLANS (CONTINUED)
Nil options were exercised during the year ended 30 June 2016 (2015: 61,460) and as a result Nil (2015: $34,971) was recognised in contributed equity arising from the exercise of employee options. All 590,000 options lapsed during the year (2015: 110,000).
2016 Month
of issue
Balance at
No. options issued
No. of options
exercised Exercise
Date Ex. Price Proceeds Received
Fair Value
on date of
exercise
Number Lapsed /
Cancelled during
the year
Balance at
Vested at Vesting Period Expiry
Date
1.7.15 ($) ($) 30.6.16 30.6.16 Jan-12 250,000 - - - $4.37 - - (250,000) - - Jan 13 – Jan 15 9-Jan-16
Nov-11 240,000 - - - $4.17 - - (240,000) - - Nov 12 – Nov 14 28-Nov-15
Aug-11 100,000 - - - $4.16 - - (100,000) - - Aug 12 - Aug 14 12-Aug-15
590,000 - - - - (590,000) - -
The weighted average exercise price during the period was Nil.
2015 Month
of issue
Balance at
No. options issued
No. of options
exercised Exercise
Date Ex. Price Proceeds Received
Fair Value
on date of
exercise
Number Lapsed /
Cancelled during
the year
Balance at
Vested at Vesting Period Expiry
Date
1.7.14 ($) ($) 30.6.15 30.6.15 Jul-13 26,340 - (26,340) 28-Jul-14 $0.57 14,987 16,357 - - - Jul-13 13-Aug-14
Jul-13 35,120 - (35,120) 13-Aug-14 $0.57 19,983 9,518 - - - Jul-13 13-Aug-14
Jan-12 250,000 - - - $4.37 - - - 250,000 250,000 Jan 13 – Jan 15 9-Jan-16
Nov-11 240,000 - - - $4.17 - - - 240,000 240,000 Nov 12 – Nov 14 28-Nov-15
Aug-11 100,000 - - - $4.16 - - - 100,000 100,000 Aug 12 - Aug 14 12-Aug-15
Oct-10 30,000 - - - $3.36 - - (30,000) - - Oct 11 – Oct 13 28-Oct-14
Aug-10 80,000 - - - $2.60 - - (80,000) - - Aug 11 – Aug 13 5-Aug-14
761,460 - (61,460) 34,971 25,875 (110,000) 590,000 590,000
The weighted average exercise price during the period was $0.57
Employee Performance Rights Plan
There has been no grant of performance rights during the year (2015: Nil). Nil performance rights vested (2015: Nil) and 12,000 performance rights lapsed in accordance with their terms (2015: 6,000).
2016
Month of issue
Balance at
No. rights issued
Hurdle price range
No. of rights vested
Vesting Date
Number Lapsed /
Cancelled during the
year
Balance at
Vested at Vestment Period Expiry Date
1.7.15 30.6.16 30.6.16 Nov-11 12,000 - $5.50 - - (12,000) - - Nov 12 – Nov 15 28-Nov-15
2015
Month of issue
Balance at
No. rights issued
Hurdle price range
No. of rights vested
Vesting Date
Number Lapsed /
Cancelled during the
year
Balance at
Vested at Vestment Period Expiry Date
1.7.14 30.6.15 30.6.15 Nov-11 12,000 - $5.50 - - - 12,000 - Nov 12 – Nov 15 28-Nov-15
Sep-10 6,000 - $5.00 - - (6,000) - - Sept 11 – Sept 14 9-Sep-14
18,000 - $5.00 - $6.13 - - (6,000) 12,000 -
For
per
sona
l use
onl
y

Troy Resources Limited Annual Financial Report
For the Financial Year Ended 30 June 2016
Notes to the consolidated financial statements
65
27. EMPLOYEE SHARE EQUITY PLANS (CONTINUED)
The following tables reconcile the SAR’s, Employee Share Options and Performance Rights outstanding at the beginning and end of the year.
2016 2015
Share Appreciation Rights: No
Weighted Average
Grant Price $ No
Weighted Average
Grant Price $ Balance at beginning of year 1,760,000 1.22 1,601,000 - Granted during the year - 360,000 1.14 Exercised during the year - - Lapsed during the year (797,000) 1.20 (201,000) 1.32 Balance at end of year 963,000 1.24 1,760,000 1.22
Exercisable at end of year 562,000 1.22 340,000 1.23
Employee Share Options: Balance at beginning of year 590,000 4.25 761,460 3.75 Granted during the year - - - - Exercised during the year - - (61,460) 0.57 Lapsed during the year (590,000) 4.25 (110,000) 2.81 Balance at end of year - - 590,000 4.25
Exercisable at end of year - - 590,000 4.25
Performance Rights: Balance at beginning of year 12,000 5.50 18,000 5.33 Granted during the year - - - - Exercised during the year - - - - Lapsed during the year (12,000) 5.50 (6,000) 5.00 Balance at end of year - - 12,000 5.50
Exercisable at end of year - - - -
For
per
sona
l use
onl
y

Troy Resources Limited Annual Financial Report
For the Financial Year Ended 30 June 2016
Notes to the consolidated financial statements
66
28. COMMITMENTS FOR EXPENDITURE
(a) Exploration Commitments
The Group has minimum statutory commitments as conditions of tenure for certain mining tenements. Whilst these obligations may vary, the following is considered to be a reasonable estimate of the minimum projected payments required at 30 June 2016 if the Group is to retain all of its present interests in mining and exploration properties:
2016
($’000) 2015
($’000) Not longer than 1 year 72 944 Longer than 1 year and not longer than 5 years 108 1,905 Longer than 5 years - -
(b) Capital Commitments Capital expenditure commitments contracted for as at the reporting date:
Not longer than 1 year 214 3,806 Longer than 1 year and not longer than 5 years - - Longer than 5 years - -
(c) Operating Leases Operating lease arrangements as at the reporting date:
Not longer than 1 year 500 3,199 Longer than 1 year and not longer than 5 years 285 566 Longer than 5 years - -
The majority of lease commitments in 2015 were made up of minimum rental payments on trucks and excavators at the Casposo mine site, in Argentina. As a result of the cessation of mining activities at Casposo these commitments no longer remain.
The Group has given securities in the form of general bank guarantees to financial institutions (Refer Note 30).
29. CONTINGENT LIABILITIES
The Group has the following contingent liabilities:
a) Bank guarantees to financial institutions total $396,530 (2015: $210,835), of which $343,050 (2015: $157,359) are cash backed.
b) Potential legal claims submitted by previous employees at the Company's Sertão and Andorinhas operations in Brazil of $5,931,000. Based on past settlement of claims, the current expectation is that only a portion of this may become payable and therefore $1,400,000 has been included in Other Provisions as at 30 June 2016 (2015: $992,000) (Refer Note 17).
For
per
sona
l use
onl
y

Troy Resources Limited Annual Financial Report
For the Financial Year Ended 30 June 2016
Notes to the consolidated financial statements
67
30. SUBSIDIARIES
The consolidated financial statements include the following subsidiaries:
COUNTRY OF INCORPORATION OWNERSHIP INTEREST
2016 % 2015 % Parent Entity: Troy Resources Limited Australia Subsidiaries: Wirraminna Gold Pty Ltd Australia 100 100 Troy Resources Argentina Ltd Canada 49(1) 100 Troy Resources Brasil Participações Ltda Brazil 100 100 Troy Brasil Exploração Mineral Ltda Brazil (2) 100 Troy Resources Holdings BVI British Virgin Islands 100 100
• Reinarda Mineraҫᾶo Ltda Brazil 100 100 Azimuth Resources Limited Australia 100 100
• Takatu Minerals Limited Canada 100 100
• Pharsalus Gold (BVI) Inc British Virgin Islands 100 100
• Pharsalus (BVI) Inc British Virgin Islands 100 100
• Pharsalus Gold Inc Guyana 100 100
• Pharsalus Inc Guyana 100 100 Troy Resources Guyana Inc Guyana 100 100
(1) 100% prior to 4 March 2016. (2) 100%: Merged with Troy Resources Brasil Participações Ltda effective 30 June 2016.
31. FINANCIAL INSTRUMENTS
a) Capital risk management
The Group manages its capital to ensure that each of the entities within the Group will be able to continue as a going concern, whilst maximising the return to stakeholders through optimisation of the debt and equity balance. The Group’s overall strategy remains unchanged in 2016.
The capital structure of the Group consists of debt (borrowings as detailed in Note 18) offset by cash balances and equity of the Group (comprising issued capital, reserves, and retained earnings as detailed in Notes 19, 20, 21).
The Board reviews the capital structure of the Group for any new acquisition or significant projects. As part of the review, the Board considers the cost of capital and the risks associated with each class of capital. The Group’s aim is to minimise the use of debt by utilising it in very specific purposes, such as capital development projects which are supported by strong cashflows. The Group would normally target less than 50% debt on any one project, but may choose to spread that risk across all projects of the Group through the use of a corporate facility. The gearing ratio at 30 June 2016 was 30% (2015: 22%) (refer below).
For
per
sona
l use
onl
y

Troy Resources Limited Annual Financial Report
For the Financial Year Ended 30 June 2016
Notes to the consolidated financial statements
68
31. FINANCIAL INSTRUMENTS (CONTINUED) i. Gearing Ratio
The gearing ratio at end of the reporting period was as follows:
2016 (A$'000)
2015 (A$'000)
Debt (i) 49,235 98,541 Cash and bank balances (excluding restricted cash) (3,053) (60,345) Net Debt/(Cash) 46,182 37,985
Equity (ii) 153,826 172,255 Debt to equity ratio 30% 22%
(i) Debt is defined as long- and short-term borrowings (excluding derivatives and financial guarantee contracts). (ii) Equity includes all issued capital, reserves, and retained earnings as detailed in Notes 19, 20, 21.
Externally imposed capital requirements
The Investec Facility requires the Group to maintain minimum liquidity of $10,000,000, which includes gold inventories at market value. Management monitors its cash and liquid assets balances to ensure compliance with these obligations. The Group was in compliance with the requirement as at reporting date (refer Note 18).
b) Categories of financial instruments
2016
(A$'000) 2015
(A$'000) Financial assets Cash and cash equivalents 3,436 60,556 Other receivables and prepayments 12,915 12,669 Hedge asset - 5,938 Financial liabilities Trade and other payables (21,395) (23,008)
Hedge liability (19,878) -
Borrowings – amortised cost (49,235) (98,541)
c) Financial risk management objective
The Group’s Corporate Treasury function provides services to the business, co-ordinates access to domestic and international financial markets and monitors and manages the financial risks relating to the operations of the Group though internal risk reports which analyses exposures by degree and magnitude of risks. These risks include market risk (including currency risk, fair value interest rate risk and price risk), credit risk, liquidity risk and cash flow interest rate risk.
The Group may seek to minimise the effects of these risks by using derivative financial instruments to hedge commodity and foreign currency exposures.
The use of financial derivatives is governed by the Group’s policies approved by the Board, which provide written principals on foreign exchange risk, interest rate risk, credit risk, the use of financial derivatives and non-derivative financial instruments, and the investment of excess liquidity. The Group does not enter into or trade financial instruments, including derivative financial instruments, for speculative purposes.
The Corporate Treasury function engages on a regular basis with a Treasury Committee that has been established by the Board and reports monthly to the Board on risks and policies implemented to mitigate risk exposures.
d) Objectives of Derivative Financial Instruments
The Group enters into derivative financial instruments from time to time in the normal course of business in order to hedge its exposure to fluctuations in the Australian dollar/United States dollar (USD) exchange rate and the gold price. The Group does not enter into or trade derivative financial instruments for speculative purposes.
For
per
sona
l use
onl
y

Troy Resources Limited Annual Financial Report
For the Financial Year Ended 30 June 2016
Notes to the consolidated financial statements
69
31. FINANCIAL INSTRUMENTS (CONTINUED) e) Commodity (Gold) and Foreign Currency Contracts The Group has a commodity hedging program for gold in place. Foreign currency contracts are entered into when appropriate to mitigate risks of foreign currency fluctuations on specific receivables and payables, no contracts were outstanding at year end (refer Note 31(k)). f) Market risk The Group’s activities expose it primarily to the financial risks of changes in foreign currency exchange rates (refer Note 31 (g)), interest rates (refer to Note 31(h)) and commodity risk (refer to Note 31(k)). During 2016 the Group entered in to both gold and silver forward sale contracts in order to manage exposure to commodity risks (refer Note 31(k)). g) Foreign currency risk management The Group undertakes certain transactions denominated in foreign currencies, hence exposures to exchange rate fluctuations arise. The Group will hedge significant foreign currency transactions where considered necessary to mitigate a portion of the risk. The carrying amount of the Group’s foreign currency denominated monetary assets and monetary liabilities at the reporting date is as follows:
Assets Liabilities
2016 (A$'000)
2015 (A$'000)
2016 (A$'000)
2015 (A$'000)
USD 1,865 19,292 49,504 261
The Group primarily trade in their functional currencies. The balances above exclude amounts denominated in the functional currency of each of the entities within the Group. Certain inter-company loans between entities are denominated in functional currency of the parent entity and loans outside the Group are denominated in USD. The Group is mainly exposed to the Guyanese dollar through its mining operations in Guyana, and the USD through USD denominated debt, purchases of equipment and sales of gold. The Guyanese dollar trades in a reasonably tight range against the USD.
Sensitivity analysis - exchange rates
The following table details the Group’s sensitivity to a 5% increase and decrease in the Australian dollar against the relevant foreign currencies. The sensitivity rate of 5% has been used when reporting foreign currency risk internally to key management personnel and represents management’s assessment of the reasonably possible change in foreign exchange rates. The sensitivity analysis includes only outstanding foreign currency denominated monetary items and adjusts their translation at the period end for a 5% change in foreign currency rates. The sensitivity analysis includes external loans as well as loans to foreign operations within the Group where the denomination of the loan is in a currency other than the currency of the lender or the borrower. A positive number below indicates an increase in profit and other equity where the Australian dollar weakens 5% against the relevant currency. For a 5% strengthening of the Australian dollar against the relevant currency, there would be a comparable impact on the profit and other equity and the balances below would be negative.
Judgements of reasonably possible movements
2016 (A$'000)
2015 (A$'000)
AUD/USD - Profit/(loss) after tax
6,919
8,909
- Equity 4,537 14,282 AUD/GYD - Profit/(loss) after tax
600
-
- Equity 1,334 3,975
For
per
sona
l use
onl
y

Troy Resources Limited Annual Financial Report
For the Financial Year Ended 30 June 2016
Notes to the consolidated financial statements
70
31. FINANCIAL INSTRUMENTS (CONTINUED) h) Interest rate risk management
The Group is exposed to interest rate risk as entities in the Group place funds on deposit at variable rates. The Group’s exposure to interest rates on financial assets and financial liabilities are detailed in the relevant notes.
Sensitivity analysis - interest rates
The sensitivity analysis below has been determined based on the exposure to interest rates at the reporting date and the stipulated change taking place at the beginning of the financial year and held constant throughout the reporting period.
A 100 basis point increase or decrease is used because this represents management’s assessment of the possible change in interest rates.
At reporting date, if interest rates had been 100 basis points higher or lower and all other variables were held constant, the Group’s:
• net profit would increase / decrease by $216,000 (2015: $333,000) in relation to assets. This is attributable to the lower cash balances held in 2016 as compared to 2015.
• net profit would decrease / increase by $790,000 (2015: 738,000) in relation to liabilities. This is attributable to the Group’s exposure to interest rates on its variable rate borrowings.
The Group’s sensitivity to interest rates on assets has decreased during the current year primarily due to the decrease in cash deposits held over the year while on liabilities, borrowings have averaged similar levels across the two years increasing from $40 million to $100 million in FY2015 and then decreasing to $52.7 million in FY2016. i) Credit risk management
Credit risk refers to the risk that a counterparty will default on its contractual obligations resulting in financial loss to the Group. The Group has adopted the policy of only dealing with creditworthy counterparties, as a means of mitigating the risk of financial loss from defaults. The Group measures credit risk on a fair value basis.
The credit risk on financial assets of the Group which have been recognised on the Statement of Financial Position, other than investments in shares, is generally the carrying amount, net of any allowances for doubtful debts. Equity investments which are traded on organised stock markets will vary with market movements.
The Group has an exposure to gain or loss in the event counterparties fail to settle a derivative contract with the Group. At 30 June 2016, the Group had exposure and commitments to gold forward contracts, with a hedge liability of $19,878,000 (2015: $5,938,000 asset including silver forward contracts) (refer Note 31 (k)).
The credit risk on liquid funds and derivative financial instruments is limited because the counterparties are banks with high credit-ratings assigned by international credit-rating agencies.
j) Liquidity risk management
Ultimate responsibility for liquidity risk management rests with the Board, who have built an appropriate liquidity risk management framework for management of the Group’s short, medium and long-term funding and liquidity management requirements. The Group manages liquidity risk by maintaining adequate cash reserves by continuously monitoring forecast and actual cash flows and matching maturity profiles of financial assets and liabilities.
Liquidity and interest risk tables
The following table details the Group’s remaining contractual maturity for its financial liabilities. The tables have been drawn up based on the undiscounted cash flows of financial liabilities based on the earliest date on which the Group can be required to pay. The table includes both interest and principal cash flows.
For
per
sona
l use
onl
y

Troy Resources Limited Annual Financial Report
For the Financial Year Ended 30 June 2016
Notes to the consolidated financial statements
71
31. FINANCIAL INSTRUMENTS (CONTINUED)
2016 LIABILITIES 1 year
or less (A$’000)
1 to 5 years (A$’000)
More than 5 years
(A$’000) Total
(A$’000)
Non-interest bearing 21,395 - - 21,395 Variable interest rate - principal 23,817 25,418 - 49,235 Variable interest rate – interest and fees 5,895 3,397 - 9,292 Gold commodity hedge liabilities 14,351 5,527 - 19,878 Financial guarantee contracts 343 - - 343 65,801 34,342 - 100,143
2015 LIABILITIES 1 year or
less (A$’000)
1 to 5 years (A$’000)
More than 5 years
(A$’000) Total
(A$’000)
Non-interest bearing 21,514 1,494 - 23,008 Variable interest rate instruments 40,700 57,841 - 98,541 Financial guarantee contracts 157 - - 157 62,371 59,335 - 121,706
The weighted average rate (including line fees) on variable interest rate instruments was 9.16% for the year ended 30 June 2016 (2015: 9.43%).
The amounts included above for the financial guarantee contracts are the maximum amounts the Group could be forced to settle under the arrangement for the full guaranteed amount if that amount is claimed by the counterparty to the guarantee. Based on expectations at the end of the reporting period, the Group considers that it is unlikely that such an amount will be payable under the arrangement. However, this estimate is subject to change depending on the probability of the counterparty claiming under the guarantee which is a function of the likelihood that the financial receivables held by the counterparty which are guaranteed suffer credit losses.
The following table details the Group’s expected maturity for its financial assets. The tables below have been drawn up based on the undiscounted contractual maturities of the financial assets including interest that will be earned on those assets except where the Group anticipates that the cash flow will occur in a different period.
2016 ASSETS Weighted
average effective interest rate
%
1 year or less
(A$’000)
1 to 5 years
(A$’000)
More than 5 years
(A$’000) Total
(A$’000) Non-interest bearing 12,915 - - 12,915 Variable interest rate instruments 0.1% 2,408 - - 2,408
USD variable deposit 0.0% 865 - - 865 Short term deposits 1.4% 163 - - 163 16,351 - - 16,351
2015 ASSETS Weighted
average effective interest rate
%
1 year or less
(A$’000)
1 to 5 years
(A$’000)
More than 5 years
(A$’000) Total
(A$’000) Non-interest bearing 12,669 - - 12,669 Variable interest rate instruments 0.7% 10,570 - - 10,570
USD variable deposit 0.1% 19,292 - - 19,292 Short term deposits 2.7% 30,694 - - 30,694 Gold/silver commodity hedges 5,938 - - 5,938 79,163 - - 79,163
For
per
sona
l use
onl
y

Troy Resources Limited Annual Financial Report
For the Financial Year Ended 30 June 2016
Notes to the consolidated financial statements
72
31. FINANCIAL INSTRUMENTS (CONTINUED) The Group’s loans to its Guyanese subsidiary at 30 June 2016 and 2015 are at commercial interest rates.
k) Commodity risk management
As a precious metals producer the Group’s revenue is exposed to gold price fluctuations. The Group has entered into gold forward sale contracts to manage its exposure to movements in commodity prices. The Group’s derivative financial instruments at reporting date are disclosed in the table below. Gold Forward Contracts The Group has entered into gold forward sale contracts to effectively fix the US dollar cash flows receivable on its production. These gold forward sale contracts are designated as cash flow hedges. Hedge accounting for cashflow designated hedges allows the gains and losses on the derivative to be recognised in a Hedging Cash Flow Reserve in equity and reclassified to the profit and loss statement when the underlying production is realised, consistent with the Group’s overriding risk management strategy and requirements under the Investec Facility.
The following table details the Group’s gold forward contracts outstanding at reporting date:
2016 Ounces
2015 Ounces
2016 Weighted Average
Price US$/oz
2015 Weighted Average
Price US$/oz Forward Sales Contracts Gold Maturing: within 12 months
48,000 80,500 1,103.50 1,198.92
Gold Maturing: greater than 12 months 18,000 - 1,103.50 -
Total Gold Forward Contracts 66,000 80,500 1,103.50 1,198.92 Silver Maturing: within 12 months(1) - 1,373,000 - 17.68
(1) All silver forward sale contracts were closed out during September 2015.
At 30 June 2016, the aggregate loss under the gold commodity contracts recognised in other comprehensive income as part of the Hedging Cash Flow Reserve before income tax is $19,878,000 (2015: $7,595,000 gain). Sales in relation to these contracts will occur during the financial year ended 30 June 2017 and 30 June 2018, at which time the amount deferred in equity will be reclassified to profit or loss (refer Note 20).
At 30 June 2016, finance and exchange gains relating to these forward contracts have been recognised as part of Finance costs, being a gain of $1,779,000 (2015: $1,705,000 loss) (refer Note 4).
Sensitivity analysis - gold and silver price
The sensitivity analysis below is based on the actual quantities of gold and silver ounces sold during the year and the stipulated price change.
2016 (A$'000)
2015 (A$'000)
Judgements of reasonably possible movements Gold Price +/- A$50.00/oz - Post tax profit - higher/(lower)
2,083
2,587
- Total equity - higher/(lower) 2,083 2,587
Silver Price +/- A$0.80/oz (discontinued operations) - Post tax profit - higher/(lower)
1,016
1,588
- Total equity - higher/(lower) 1,016 1,588
Total A$
- Post tax profit - higher/(lower) 3,099 4,175
- Total equity - higher/(lower) 3,099 4,175
For
per
sona
l use
onl
y
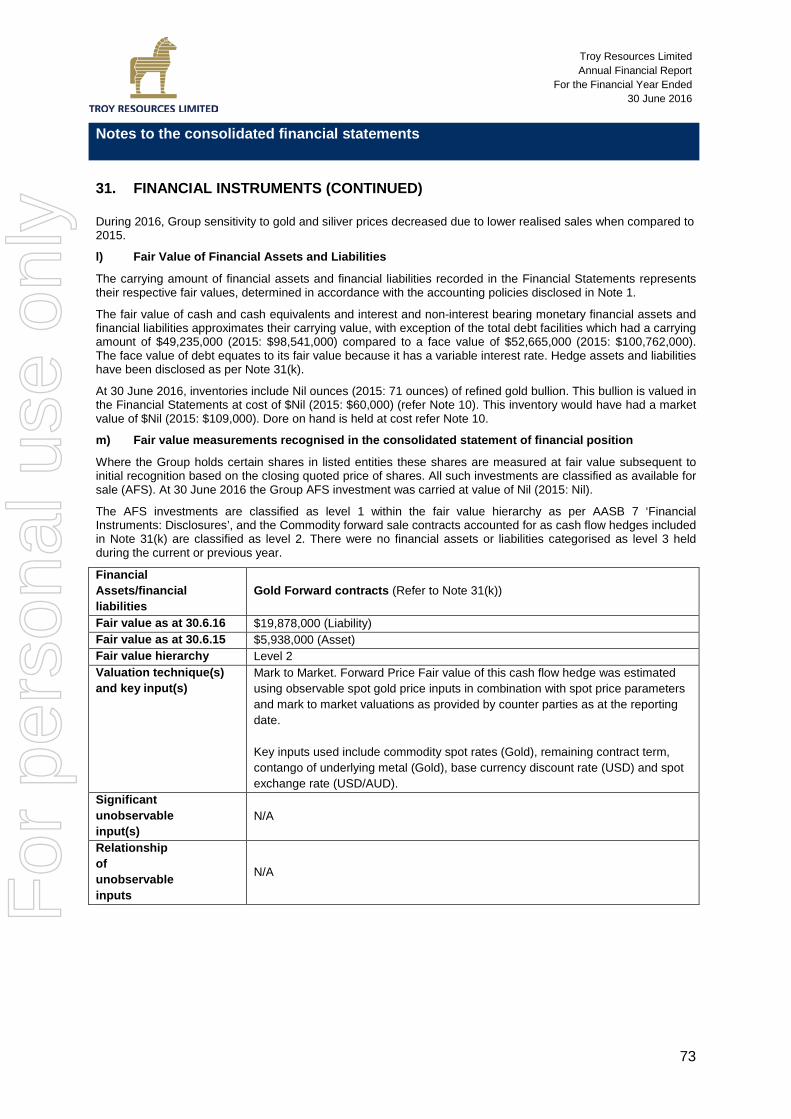
Troy Resources Limited Annual Financial Report
For the Financial Year Ended 30 June 2016
Notes to the consolidated financial statements
73
31. FINANCIAL INSTRUMENTS (CONTINUED) During 2016, Group sensitivity to gold and siliver prices decreased due to lower realised sales when compared to 2015.
l) Fair Value of Financial Assets and Liabilities
The carrying amount of financial assets and financial liabilities recorded in the Financial Statements represents their respective fair values, determined in accordance with the accounting policies disclosed in Note 1.
The fair value of cash and cash equivalents and interest and non-interest bearing monetary financial assets and financial liabilities approximates their carrying value, with exception of the total debt facilities which had a carrying amount of $49,235,000 (2015: $98,541,000) compared to a face value of $52,665,000 (2015: $100,762,000). The face value of debt equates to its fair value because it has a variable interest rate. Hedge assets and liabilities have been disclosed as per Note 31(k).
At 30 June 2016, inventories include Nil ounces (2015: 71 ounces) of refined gold bullion. This bullion is valued in the Financial Statements at cost of $Nil (2015: $60,000) (refer Note 10). This inventory would have had a market value of $Nil (2015: $109,000). Dore on hand is held at cost refer Note 10.
m) Fair value measurements recognised in the consolidated statement of financial position
Where the Group holds certain shares in listed entities these shares are measured at fair value subsequent to initial recognition based on the closing quoted price of shares. All such investments are classified as available for sale (AFS). At 30 June 2016 the Group AFS investment was carried at value of Nil (2015: Nil).
The AFS investments are classified as level 1 within the fair value hierarchy as per AASB 7 ‘Financial Instruments: Disclosures’, and the Commodity forward sale contracts accounted for as cash flow hedges included in Note 31(k) are classified as level 2. There were no financial assets or liabilities categorised as level 3 held during the current or previous year.
Financial Assets/financial liabilities
Gold Forward contracts (Refer to Note 31(k))
Fair value as at 30.6.16 $19,878,000 (Liability) Fair value as at 30.6.15 $5,938,000 (Asset) Fair value hierarchy Level 2 Valuation technique(s) and key input(s)
Mark to Market. Forward Price Fair value of this cash flow hedge was estimated using observable spot gold price inputs in combination with spot price parameters and mark to market valuations as provided by counter parties as at the reporting date. Key inputs used include commodity spot rates (Gold), remaining contract term, contango of underlying metal (Gold), base currency discount rate (USD) and spot exchange rate (USD/AUD).
Significant unobservable input(s)
N/A
Relationship of unobservable inputs
N/A
For
per
sona
l use
onl
y

Troy Resources Limited Annual Financial Report
For the Financial Year Ended 30 June 2016
Notes to the consolidated financial statements
74
32. NOTES TO THE CASHFLOW STATEMENT
a) Reconciliation of Cash
For the purposes of the Cash Flow Statement, cash and cash equivalents includes cash on hand and in banks and investments in interest bearing deposits. Cash and cash equivalents at the end of the financial year as shown in the Cash Flow Statement is reconciled to the related items in the Statement of Financial Position as follows:
2016 ($’000)
2015 ($’000)
Cash at bank 995 13,516 Cash at bank – overseas 2,331 16,346 Short term Interest bearing deposits – Australia 110 30,694 3,436 60,556
b) Cash not available for use
At balance date, $343,054 was held in support of bank guarantees and credit card facilities. Troy also holds $40,607 cash in Australian and United Kingdom bank accounts to cover unpresented dividend cheques and $5,492 in rental guarantees.
c) Reconciliation of Net Cash provided by Operating Activities to Net (Loss) / Profit after Income Tax
2016
($’000) 2015
($’000) Operating loss after income tax (93,660) (100,353) Depreciation of non-current assets 12,508 9,945 Amortisation of non-current assets 20,724 27,755 Rehabilitation provisions unwinding of discount 283 597 Gain on sale of plant & equipment (5,932) (236) Loss on disposal of subsidiary 1,678 (143) FCTR recycle to P&L - Argentina 71,333 - FCTR recycle to P&L - Brazil 16,040 - (Gain) / Loss Foreign exchange unrealised (423) (1,328) Equity settled share-based payments 77 290 Interest income received and receivable (334) (607) Hedge finance costs (1,779) 1,705 Hedge restructure amortisation 1,764 - Finance costs 4,819 2,719 Share of profit on associate 2,950 - Exploration written-off - 953 Impairment loss (before tax) - 97,866 Decrease in income tax payable (6,025) (1,531) Changes in operating assets and liabilities (1): Decrease / (increase) in current receivables (1,369) 1,540 Increase in inventories 2,850 (1,595) Increase / (decrease) in provisions (984) 2,714 Increase / (decrease) in payables 3,821 1,162 Net Cash provided by operating activities 28,341 41,454
(1) excludes net (decrease) on disposal of subsidiary.
For
per
sona
l use
onl
y

Troy Resources Limited Annual Financial Report
For the Financial Year Ended 30 June 2016
Notes to the consolidated financial statements
75
32. NOTES TO THE CASHFLOW STATEMENT (CONTINUED)
d) Non-Cash Financing and Investing Activities
During the year, the Group entered into the following non-cash investing and financing activities which are not reflected in the consolidated statement of cash flows:
• Troy issued 702,371 ordinary shares pursuant to a landowner agreement at Karouni.
33. PARENT ENTITY DISCLOSURES Accounting policies of the parent are consistent with that of the Group.
Financial Position
2016 ($’000)
2015 ($’000)
Assets Current assets 4,011 51,044 Non-current assets 226,085 214,503 Total assets 230,096 265,547 Liabilities Current liabilities 26,721 42,712 Non-current liabilities 49,549 58,862 Total liabilities 76,270 101,577 Net Assets 153,826 163,970
Equity Issued capital 314,576 305,208 Accumulated losses – opening (150,645) (60,475) Current year (loss) (4,114) (90,170) Reserves Option premium 8,878 8,904 Hedge cash flow (14,988) 5,316 Foreign exchange translation 119 (4,813) Total Equity 153,826 163,970
Financial Performance Dividends received from subsidiaries 2,283 4,447 Interest and management fees charged to subsidiaries 7,150 5,149 Other Income 306 1 Share of losses of associate (2,950) - Hedging and foreign exchange gains 5,350 - Borrowing costs (4,766) - Administration, corporate and other expenses (5,318) (3,449) (Impairment)/( loss on sale) of subsidiary (3,649) (96,318) Income tax expense (2,520) - (Loss) for the year after tax (4,114) (90,170) Other comprehensive income (15,398) 17,157 Total comprehensive income (19,512) (73,013)
For
per
sona
l use
onl
y

Troy Resources Limited Annual Financial Report
For the Financial Year Ended 30 June 2016
Notes to the consolidated financial statements
76
33. PARENT ENTITY DISCLOSURES (CONTINUED)
i. Guarantees entered into by the parent entity in relation to debts of its subsidiaries
2016
($’000) 2015
($’000)
Guarantee provided under the deed of cross guarantee - -
ii. Contingent liabilities of the parent entity
2016
($’000) 2015
($’000)
Bank guarantees - General 123 150
There are no contingent liabilities other than:
a) General bank guarantees to financial institutions of $123,476 (2015: $149,594), of which $70,000 (2015: $70,000) is cash backed.
iii. Commitments for the acquisition of property, plant and equipment, by the parent entity
As at 30 June 2016, the parent entity held no commitments for the acquisition of property, plant and equipment.
34. EVENTS OCCURRING AFTER BALANCE DATE On 23 August 2016 the Company provided guidance on its forecast production for the FY2017 year of between 85,000 and 95,000 ounces of gold, at C1 cash costs of US$500 to US$600 per ounce and All-in sustaining costs of US$750 to US$850 per ounce. On 6 September 2016, the Company announced the launch of an equity raising to raise up to approximately $40.7 million via an institutional placement and pro rata 1 for 5.5 accelerated non-renounceable entitlement offer. On 9 September it announced successful completion of the institutional component of its equity raising, which included the placement and institutional entitlement offer, and raised approximately $27.9 million by way of a fixed price bookbuild at an offer price of $0.36 per new share. The retail component of the entitlement offer which is seeking to raise approximately $12.9 million opened on 13 September 2016 and will close at 5.00pm (Sydney time) on Tuesday, 4 October 2016. Other than the above, there are no other matters or circumstances that have arisen since 30 June 2016 that have significantly affected or may significantly affect:
(i) The consolidated entity’s operations in future financial years; or (ii) The results of those operations in future financial years; or
(iii) The consolidated entity’s state of affairs in future financial years.
35. ADDITIONAL COMPANY INFORMATION
Troy Resources Limited is a listed public company, incorporated and operating in Australia with subsidiary companies operating in South America and Canada.
Registered Office Suite 2, Level 1 254 Rokeby Road Subiaco Western Australia 6008 Tel: +61 8 9481 1277
For
per
sona
l use
onl
y

Troy Resources Limited
Statutory Financial Report For the Financial Year Ended
30 June 2016
Directors’ declaration
77
Directors’ declaration The directors declare that:
a. In the Directors’ opinion, there are reasonable grounds to believe that the company will be able to pay its debts as and when they become due and payable;
b. In the Directors’ opinion the attached financial statements are in compliance with International Financial Reporting Standards, as stated in Note 1 to the financial statements;
c. In the Directors’ opinion, the attached financial statements and notes thereto are in accordance with the Corporations Act 2001, including compliance with accounting standards and giving a true and fair view of the financial position and performance of the consolidated entity; and
d. The Directors have been given the declarations required by s.295A of the Corporations Act 2001.
Signed in accordance with a resolution of the directors made pursuant to s.295(5) of the Corporations Act 2001.
On behalf of the Directors of Troy Resources Limited
F S Grimwade M D Purvis Chairman CEO & Managing Director
Perth, Western Australia 29 September 2016
For
per
sona
l use
onl
y

Liability limited by a scheme approved under Professional Standards Legislation. Member of Deloitte Touche Tohmatsu Limited
Independent Auditor’s Report to the members of Troy Resources Limited Report on the Financial Report
We have audited the accompanying financial report of Troy Resources Limited, which comprises the statement of financial position as at 30 June 2016, the statement of profit or loss, the statement of profit or loss and other comprehensive income, the statement of cash flows and the statement of changes in equity for the year ended on that date, notes comprising a summary of significant accounting policies and other explanatory information, and the directors’ declaration of the consolidated entity, comprising the company and the entities it controlled at the year’s end or from time to time during the financial year as set out on pages 17 to 77.
Directors’ Responsibility for the Financial Report The directors of the company are responsible for the preparation of the financial report that gives a true and fair view in accordance with Australian Accounting Standards and the Corporations Act 2001 and for such internal control as the directors determine is necessary to enable the preparation of the financial report that gives a true and fair view and is free from material misstatement, whether due to fraud or error. In Note 1, the directors also state, in accordance with Accounting Standard AASB 101 Presentation of Financial Statements, that the consolidated financial statements comply with International Financial Reporting
Standards. Auditor’s Responsibility Our responsibility is to express an opinion on the financial report based on our audit. We conducted our audit in accordance with Australian Auditing Standards. Those standards require that we comply with relevant ethical requirements relating to audit engagements and plan and perform the audit to obtain reasonable assurance whether the financial report is free from material misstatement.
An audit involves performing procedures to obtain audit evidence about the amounts and disclosures in the financial report. The procedures selected depend on the auditor’s judgement, including the assessment of the risks of material misstatement of the financial report, whether due to fraud or error. In making those risk assessments, the auditor considers internal control, relevant to the company’s preparation of the financial report that gives a true and fair view, in order to design audit procedures that are appropriate in the circumstances, but not for the purpose of expressing an opinion on the effectiveness of the company’s internal control. An audit also includes evaluating the appropriateness of
accounting policies used and the reasonableness of accounting estimates made by the directors, as well as evaluating the overall presentation of the financial report. We believe that the audit evidence we have obtained is sufficient and appropriate to provide a basis for our audit opinion.
Deloitte Touche Tohmatsu
ABN 74 490 121 060
Brookfield Place, Tower 2
123 St Georges Terrace
Perth WA 6000
GPO Box A46
Perth WA 6837 Australia
Tel: +61 8 9365 7000
Fax: +61 8 9365 7001
www.deloitte.com.au
For
per
sona
l use
onl
y

Auditor’s Independence Declaration In conducting our audit, we have complied with the independence requirements of the Corporations Act 2001. We confirm that the independence declaration required by the Corporations Act 2001, which has been given to the directors of Troy Resources Limited,
would be in the same terms if given to the directors as at the time of this auditor’s report. Opinion In our opinion: (a) the financial report of Troy Resources Limited is in accordance with the Corporations Act
2001, including:
(i) giving a true and fair view of the consolidated entity’s financial position as at 30 June
2016 and of its performance for the year ended on that date; and (ii) complying with Australian Accounting Standards and the Corporations Regulations
2001; and (b) the consolidated financial statements also comply with International Financial Reporting
Standards as disclosed in Note 1. Report on the Remuneration Report
We have audited the Remuneration Report included in pages 7 to 14 of the directors’ report for the year ended 30 June 2016. The directors of the company are responsible for the preparation and presentation of the Remuneration Report in accordance with section 300A of the Corporations Act 2001. Our responsibility is to express an opinion on the Remuneration Report, based on our audit conducted in accordance with Australian Auditing Standards. Opinion
In our opinion the Remuneration Report of Troy Resources Limited for the year ended 30 June 2016, complies with section 300A of the Corporations Act 2001. DELOITTE TOUCHE TOHMATSU
David Newman Partner Chartered Accountants Perth, 29 September 2016
For
per
sona
l use
onl
y