Embed Size (px)
Citation preview

For
per
sona
l use
onl
y

Mantra Group Introduction
Industry Outlook
State of Market Contents
Mantra Group Growth and Outlook
Financial Performance
3
22
35
55
9
For
per
sona
l use
onl
y
3
For
per
sona
l use
onl
y
For
per
sona
l use
onl
y

For
per
sona
l use
onl
y

For
per
sona
l use
onl
y

7
• Continued growth in resorts (variable structures)
• Strategic exposure to CBD locations (fixed and variable structures)
For
per
sona
l use
onl
y

• Low risk approach
• Focussing on Mantra Group’s competitive advantage
8
For
per
sona
l use
onl
y

For
per
sona
l use
onl
y
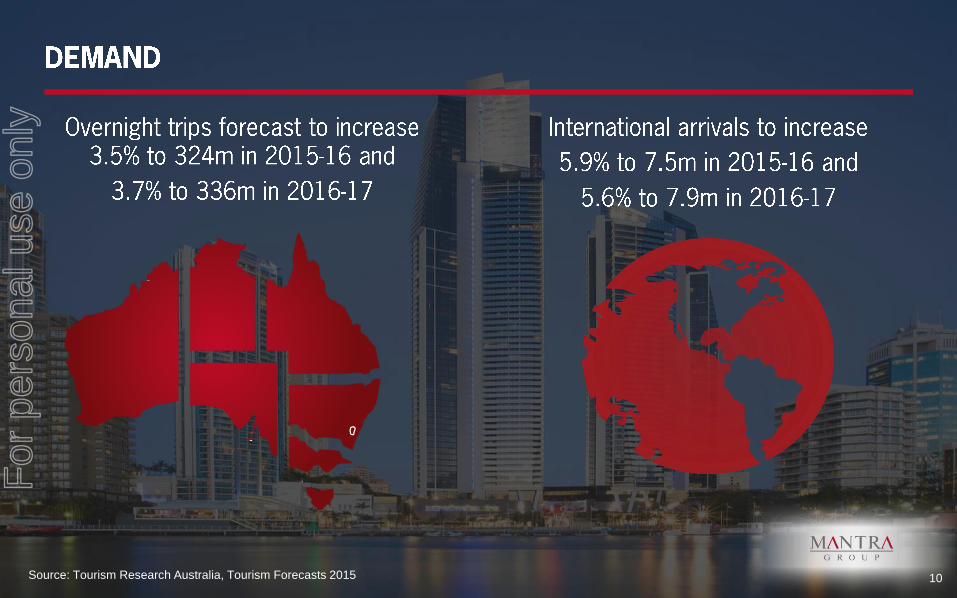
Source: Tourism Research Australia, Tourism Forecasts 2015 10
For
per
sona
l use
onl
y

Source: ABS
-
1,000,000
2,000,000
3,000,000
4,000,000
5,000,000
6,000,000
7,000,000
8,000,000
FY2006 FY2007 FY2008 FY2009 FY2010 FY2011 FY2012 FY2013 FY2014 FY2015
10 Year International Short-term (less than one year)
International Arrivals
11
For
per
sona
l use
onl
y

Source: Tourism Research Australia
21.00%
22.00%
23.00%
24.00%
25.00%
26.00%
10 Year - International Room Nights % for Hotel/Resort/Motel or Motor Inn
International
73.00%
74.00%
75.00%
76.00%
77.00%
78.00%
10 Year - Domestic Room Nights % for Hotel/Resort/Motel or Motor Inn
Domestic
12
For
per
sona
l use
onl
y

0
20,000
40,000
60,000
80,000
100,000
120,000F
Y0
0
FY
01
FY
02
FY
03
FY
04
FY
05
FY
06
FY
07
FY
08
FY
09
FY
10
FY
11
FY
12
FY
13
FY
14
FY
15F
FY
16
F
FY
17F
FY
18F
FY
19F
FY
20F
FY
21F
FY
22F
(rooms) Hotel rooms
Source: Dransfield (CLSA, The next wave, December 2014) 13
For
per
sona
l use
onl
y
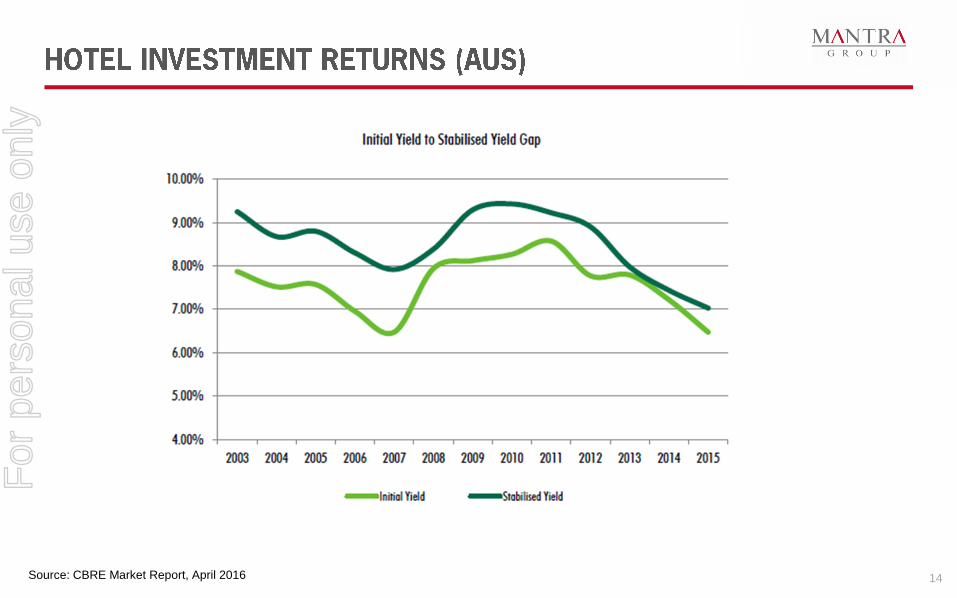
14 Source: CBRE Market Report, April 2016
For
per
sona
l use
onl
y

15
Buying existing
Upscale Hotel
12% cheaper than
building
BUILD
Example Rating Keys GRF/Key Total GFA Low Build Cost High Build Cost FF&E / OS&E Land
Mantra 4 Star 220 75 16,500 $225,000 $275,000 $25,000 $35,000
$49,500,000 $60,500,000 $5,500,000 $7,700,000
BUILD PER HOTEL $68,200,000
BUILD PER KEY $310,000
BUY (based on recent sales data)
Property Keys Buy Price Transacted Buy Per Key
Tryp Fortitude Valley, Brisbane 65 $20,000,000 Jan 2016 $307,692
Crowne Plaza Surfers Paradise 269 $54,200,000 Jun 2015 $201,487
Pullmans Cairns International 321 $75,100,000 May 2015 $233,956 Surfers Paradise Marriott Resort 329 $85,000,000 May 2015 $258,359
Next Hotel Brisbane 304 $103,000,000 Jan 2015 $338,816
Novotel Brighton Beach 296 $84,750,000 Jan 2015 $286,318
BUY PER KEY (avg) $271,105
For
per
sona
l use
onl
y
• Current state (noise in market)
• Inventory (market share)
• Mantra Group’s experience and other operators
• Percentage that is competitive
• Market segments (business, leisure, group, conference, inbound, crew, incentive, family)
• Price points
• Critical mass and operating leverage
16
For
per
sona
l use
onl
y
• No noticeable change in revenue or profitability in any market yet
• No loss of keys whatsoever
• A lot to learn / monitor
• Continued strength of OTAs
• Distribution cost static
• Sophisticated distribution model is critical
17
For
per
sona
l use
onl
y
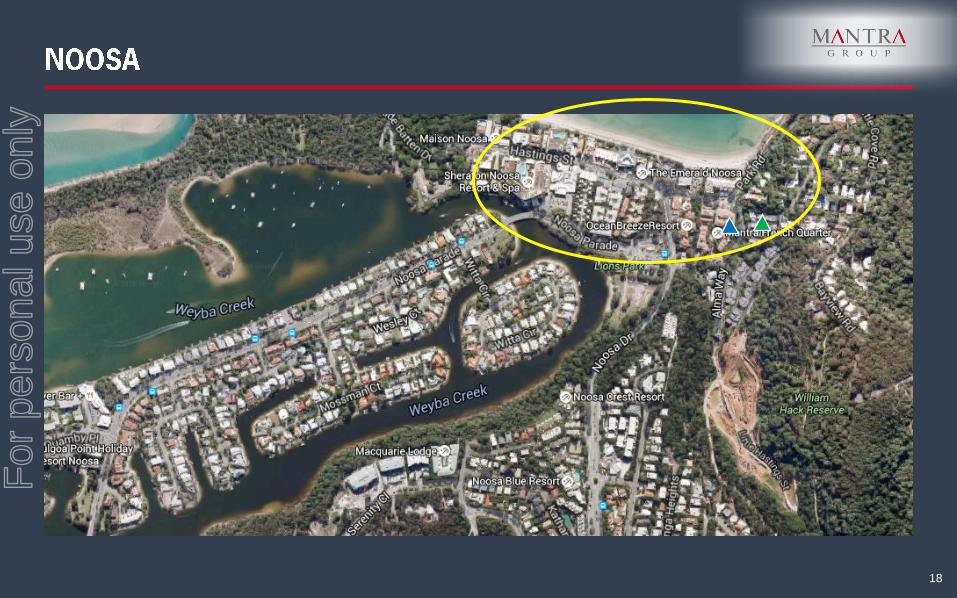
18
For
per
sona
l use
onl
y

19
For
per
sona
l use
onl
y

20
For
per
sona
l use
onl
y

21
For
per
sona
l use
onl
y
For
per
sona
l use
onl
y
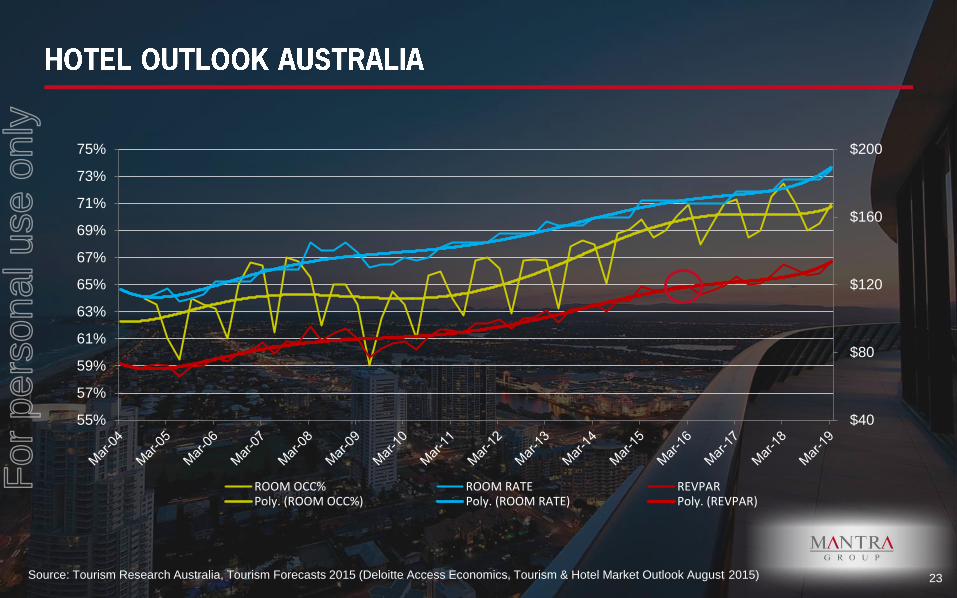
Source: Tourism Research Australia, Tourism Forecasts 2015 (Deloitte Access Economics, Tourism & Hotel Market Outlook August 2015)
$40
$80
$120
$160
$200
55%
57%
59%
61%
63%
65%
67%
69%
71%
73%
75%
ROOM OCC% ROOM RATE REVPARPoly. (ROOM OCC%) Poly. (ROOM RATE) Poly. (REVPAR)
23
For
per
sona
l use
onl
y
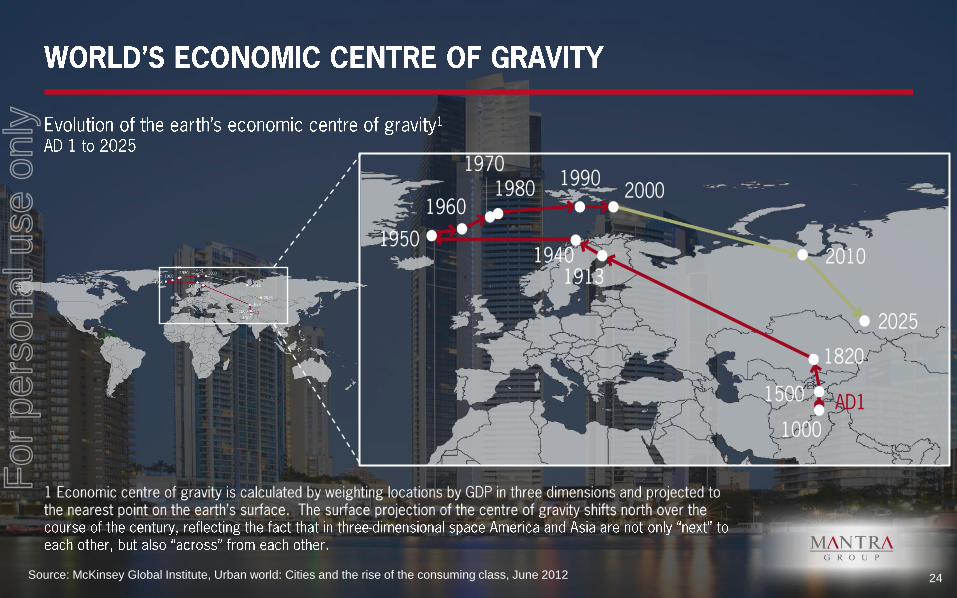
Source: McKinsey Global Institute, Urban world: Cities and the rise of the consuming class, June 2012 24
For
per
sona
l use
onl
y

Total of 528,094 rooms in the pipeline for the listed regions
Source: STR, April 2016
0 100,000 200,000 300,000
China | 316,915 | 60.0%
Indonesia | 60,717 | 11.5%
India | 46,700 | 8.8%
Malaysia | 29,680 | 5.6%
Australia | 22,116 | 4.2%
Thailand | 18,192 | 3.4%
South Korea | 10,832 | 2.1%
Vietnam | 16,751 | 3.2%
Singapore | 6,191 | 1.2%
25
For
per
sona
l use
onl
y

Source: STR, December 2015
December 2015 YTD, USD, Europe in EUR, Constant Currency
26
NORTH AMERICA
+6.3%
CENTRAL AMERICA
+1.9%
SOUTH AMERICA
+0.2%
NORTHERN AFRICA
+8.5%
SOUTHERN AFRICA
+5.6%
EUROPE
+7.1% Euro
MIDDLE EAST
-4.6%
ASIA PACIFIC
-0.5%
For
per
sona
l use
onl
y

Source: STR, December 2015
Supply & Demand % Change, December 2015 YTD
27
-2%
-1%
0%
1%
2%
3%
4%
5%
6%
North America Central & SouthAmerica
Europe Middle East Africa Asia Australia &Oceania
Supply Demand
For
per
sona
l use
onl
y

Source: 100 Years of Commercial Flight, IATA & Global Market Forecast, Flying by Numbers, 2015-2034 28
For
per
sona
l use
onl
y

Source: UNWTO Tourism Highlights, 2015 Edition 29
For
per
sona
l use
onl
y
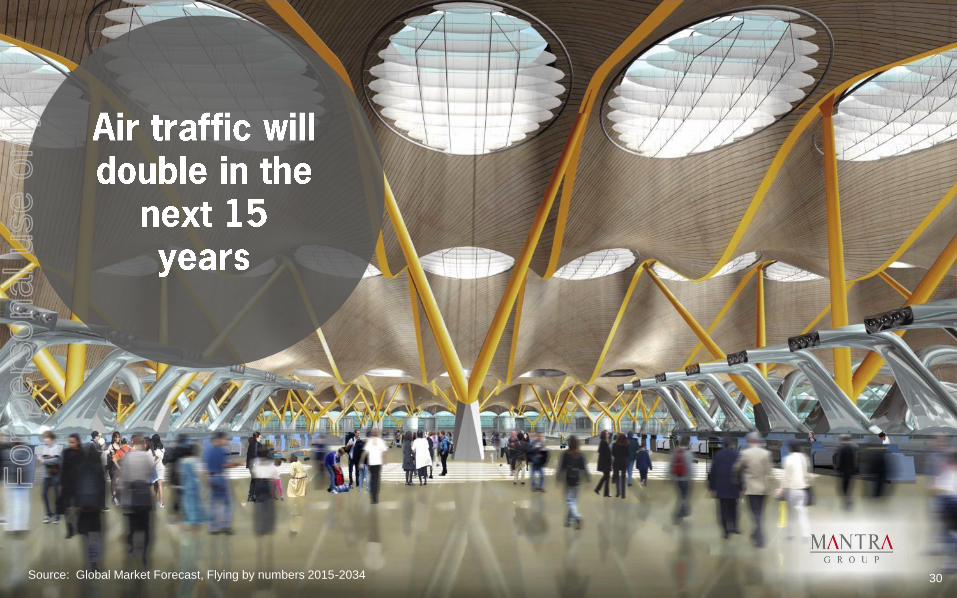
Source: Global Market Forecast, Flying by numbers 2015-2034 30
For
per
sona
l use
onl
y

Source: Global Market Forecast 2015 31
For
per
sona
l use
onl
y

Source: PWC, Australia’s Jobs Future 32
For
per
sona
l use
onl
y

0
5
10
15
20
25
0
20
40
60
80
100
120
140
160
180
200
220
05A 07A 09A 11A 13A 15CL 17CL 19CL
Outbound tourists Growth (RHS) (%)
Cagr 15%
Cagr 11%
(m)
•
•Source: CLSA, ‘The next wave’, December 2014 33
For
per
sona
l use
onl
y

Source: Flight Centre, The Golden Age of Travel, 21 April 2015 34
For
per
sona
l use
onl
y

For
per
sona
l use
onl
y
• Guidance provided in August 2015 was EBITDAI, NPAT and NPATA of between $84m - $87m, $40m - $42m and
$42.5m - $45m respectively
• Guidance for FY2016 excluded the impact of any additional conditional or uncontracted properties as at 30 June
2015 and any transaction costs associated with FY2016 acquisitions, including transaction costs associated with
Outrigger and Soul, which completed on 1 July 2015
• Inclusive of new properties to 18 February 2016, updated guidance for FY2016 is EBITDAI, NPAT and NPATA of
between $88.5m - 90.5m, $41.5m - $43m and $44.2m and $45.7m respectively
• Guidance excludes the impact of any additional conditional or uncontracted properties as at 18 February 2016 and
any transaction costs associated with FY2016 acquisitions
• Mantra Group will continue to assess suitable acquisition opportunities both domestically and abroad
Mantra Group reaffirms its FY2016 guidance
36
For
per
sona
l use
onl
y

Property: Hotel Richmont by Mantra Location: Brisbane, QLD Model: HMR Rooms: 110 Opening: H2FY2016
37
For
per
sona
l use
onl
y

Property: Mantra Hideaway Villas Location: Pecatu, Bali Model: MA Rooms: 30 Opening: H1FY2017
38
For
per
sona
l use
onl
y

Property: Peppers Kings Square Location: Perth, WA Model: HMR Rooms: 120 Opening: H1FY2017
39
For
per
sona
l use
onl
y

Property: Tribe Location: West Perth, WA Model: HMR Rooms: 120 Opening: H1FY2017
40
For
per
sona
l use
onl
y

Property: Mantra Springhill Jimbaran Location: Bali, Indonesia Model: MA Rooms: 226 Opening: H1FY2017
41
For
per
sona
l use
onl
y

Property: Mantra Wallaroo Shores Location: Wallaroo, SA Model: MA Rooms: 100 Opening: H2FY2017
42
For
per
sona
l use
onl
y
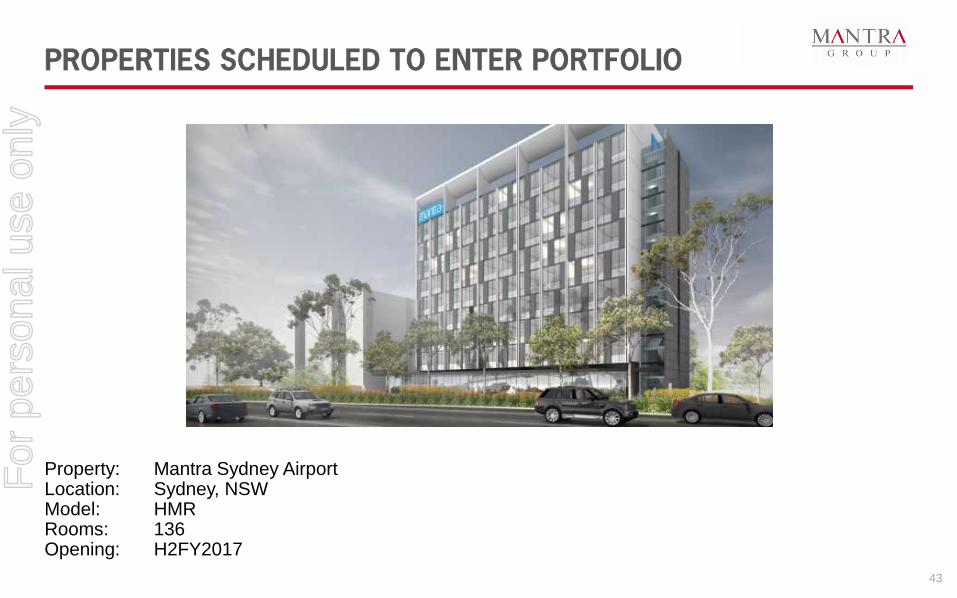
Property: Mantra Sydney Airport Location: Sydney, NSW Model: HMR Rooms: 136 Opening: H2FY2017
43
For
per
sona
l use
onl
y

Property: Mantra Macarthur Hotel Location: Canberra, ACT Model: Lease Rooms: 176 Opening: H2FY2017
44
For
per
sona
l use
onl
y

Property: Mantra Tamansari Gangga Location: Bali, Indonesia Model: MA Rooms: 132 Opening: H1FY2018
45
For
per
sona
l use
onl
y

Property: Mantra Hercules, Hamilton Harbour Location: Brisbane, Qld Model: MLR Rooms: 228 Opening: H1FY2018
46
For
per
sona
l use
onl
y
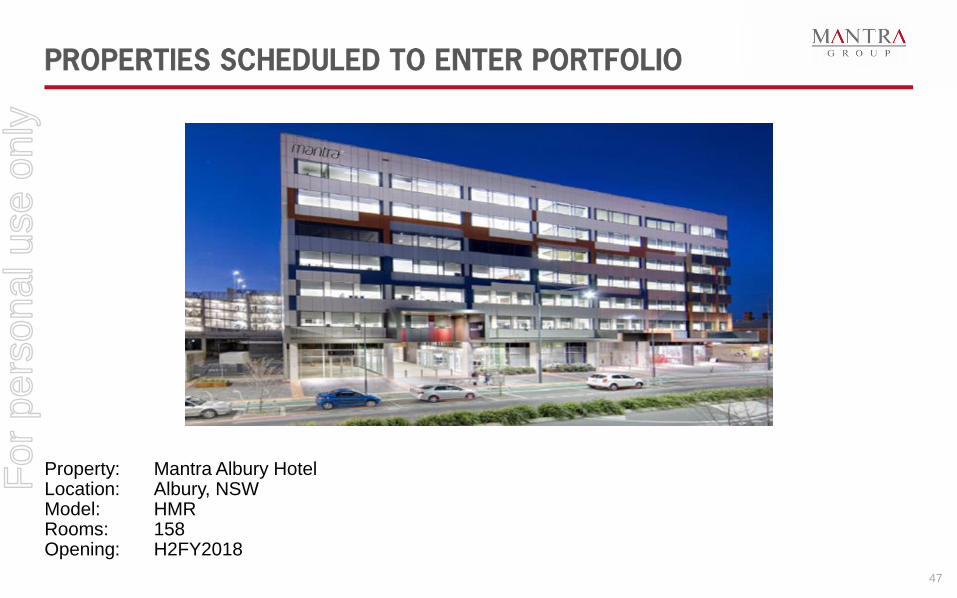
Property: Mantra Albury Hotel Location: Albury, NSW Model: HMR Rooms: 158 Opening: H2FY2018
47
For
per
sona
l use
onl
y

Property: Mantra 900 Hay Street Location: Perth, WA Model: Lease Rooms: 250 Opening: H2FY2018
48
For
per
sona
l use
onl
y

Property: Peppers James Hotel Location: Brisbane, QLD Model: HMR Rooms: 144 Opening: H2FY2018
49
For
per
sona
l use
onl
y

Property: Mantra The Miller, North Sydney Location: Sydney, NSW Model: Lease Rooms: 100 Opening: H2FY2018
50
For
per
sona
l use
onl
y
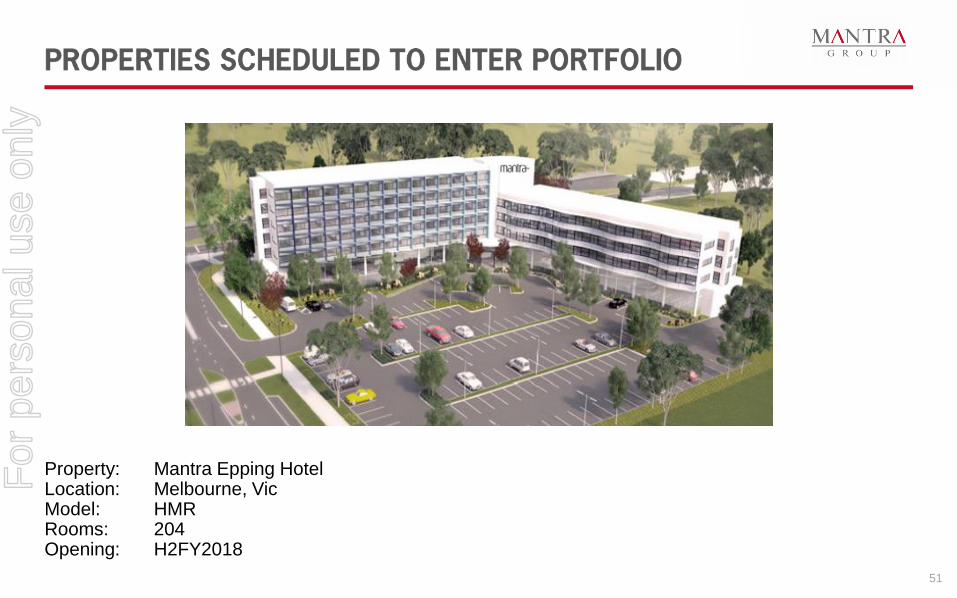
Property: Mantra Epping Hotel Location: Melbourne, Vic Model: HMR Rooms: 204 Opening: H2FY2018
51
For
per
sona
l use
onl
y

Property: Mantra Macquarie Park Location: Sydney, NSW Model: HMR Rooms: 154 Opening: H2FY2018
52
For
per
sona
l use
onl
y

Property: Mantra on Daly Location: Darwin, NT Model: MA Rooms: 201 Opening: H2FY2018
53
For
per
sona
l use
onl
y
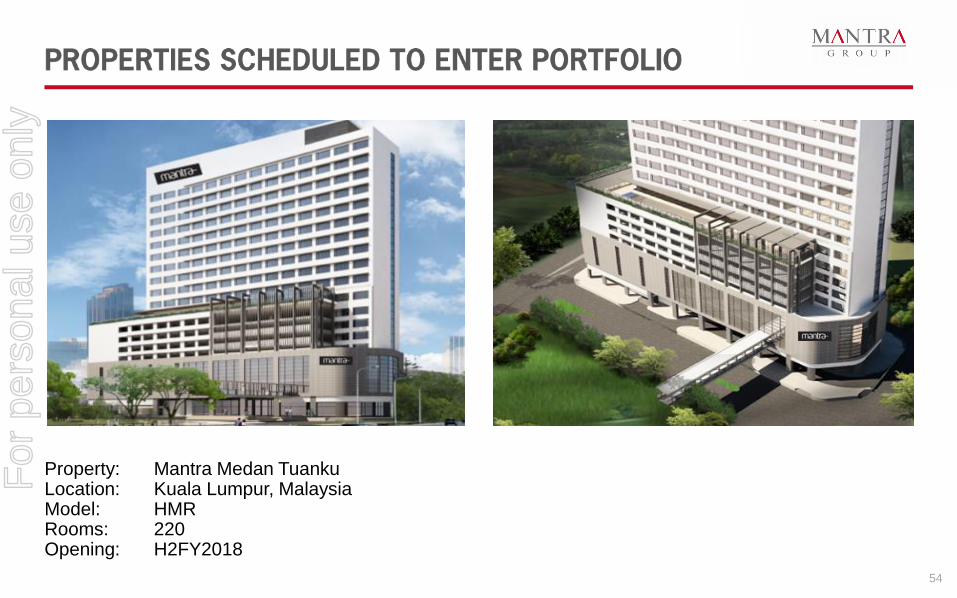
Property: Mantra Medan Tuanku Location: Kuala Lumpur, Malaysia Model: HMR Rooms: 220 Opening: H2FY2018
54
For
per
sona
l use
onl
y

For
per
sona
l use
onl
y

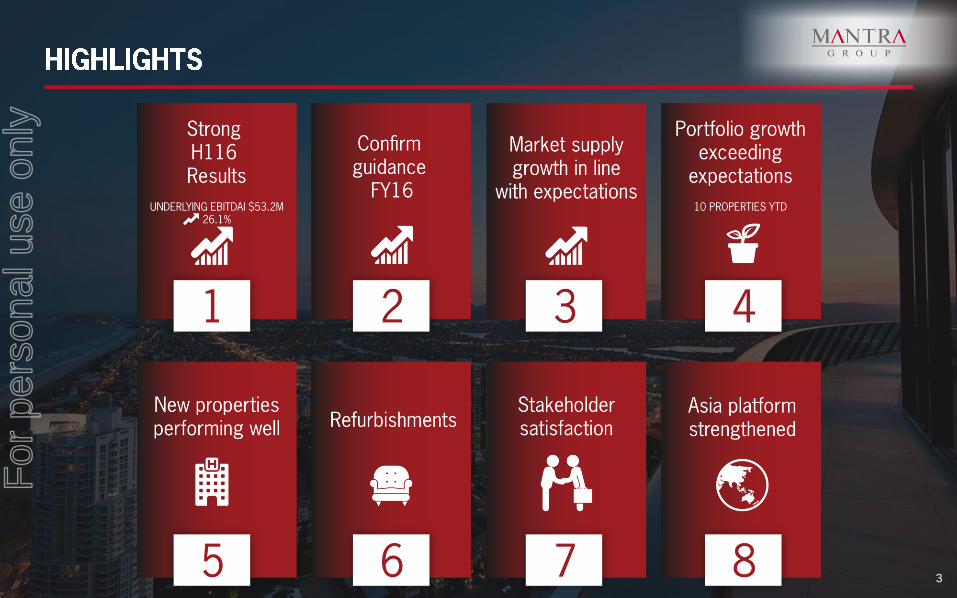
• Business has performed strongly in H1FY2016
• The commentary refers to Underlying Results2.
• Revenue, EBITDAI, NPAT and NPATA all
performed ahead of the pcp
• Total revenue increased by 21.7% to
$307.4m from $252.6m
• EBITDAI increased by $11.0m or 26.1% to
$53.2m from $42.2m
• EBITDAI margin increased from 16.7% to 17.3%
for the period primarily driven by increased rate
and occupancy in Resorts segment
• Strong revenue growth driven by
• Nine property acquisitions completed in the
period (increase of $32.2m)
• Organic3 growth (increase of $22.6m)
• Strong Chinese inbound trends continue
H1FY2016
($m)
H1FY2015
($m)
Change
($m)
Change
(%)
Total revenue 307.4 252.6 54.8 21.7
Statutory results
EBITDAI1 48.4 42.2 6.2 14.7
NPAT 24.3 21.8 2.5 11.5
NPATA 25.6 23.1 2.5 10.7
Underlying Results2
EBITDAI1 53.2 42.2 11.0 26.1
NPAT 27.6 21.8 5.8 26.6
NPATA 28.9 23.1 5.8 25.3
Other key statistics
Rooms available (‘000) 2,093 1,766 327 18.5
Occupancy (%) 79.9 78.1 1.80 2.3
Average room rate ($) 171.14 165.17 5.97 3.6
RevPAR ($) 136.82 129.04 7.78 6.0
COMMENTS
1 EBITDAI – Earnings Before Interest, Taxation, Depreciation, Amortisation and Impairment
2 Underlying Results are the statutory results excluding transaction costs of $4.8m incurred in respect of the acquisitions completed in the period 3 Organic excludes properties added in H1FY2016
56
For
per
sona
l use
onl
y
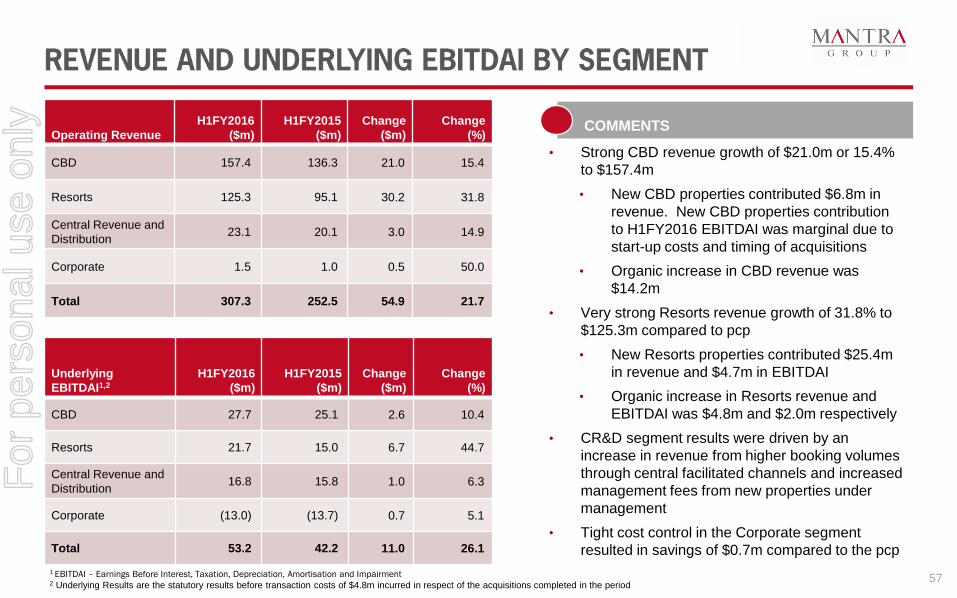
• Strong CBD revenue growth of $21.0m or 15.4%
to $157.4m
• New CBD properties contributed $6.8m in
revenue. New CBD properties contribution
to H1FY2016 EBITDAI was marginal due to
start-up costs and timing of acquisitions
• Organic increase in CBD revenue was
$14.2m
• Very strong Resorts revenue growth of 31.8% to
$125.3m compared to pcp
• New Resorts properties contributed $25.4m
in revenue and $4.7m in EBITDAI
• Organic increase in Resorts revenue and
EBITDAI was $4.8m and $2.0m respectively
• CR&D segment results were driven by an
increase in revenue from higher booking volumes
through central facilitated channels and increased
management fees from new properties under
management
• Tight cost control in the Corporate segment
resulted in savings of $0.7m compared to the pcp
Operating Revenue
H1FY2016
($m)
H1FY2015
($m)
Change
($m)
Change
(%)
CBD 157.4 136.3 21.0 15.4
Resorts 125.3 95.1 30.2 31.8
Central Revenue and
Distribution 23.1 20.1 3.0 14.9
Corporate 1.5 1.0 0.5 50.0
Total 307.3 252.5 54.9 21.7
Underlying
EBITDAI1,2
H1FY2016
($m)
H1FY2015
($m)
Change
($m)
Change
(%)
CBD 27.7 25.1 2.6 10.4
Resorts 21.7 15.0 6.7 44.7
Central Revenue and
Distribution 16.8 15.8 1.0 6.3
Corporate (13.0) (13.7) 0.7 5.1
Total 53.2 42.2 11.0 26.1
COMMENTS
1 EBITDAI – Earnings Before Interest, Taxation, Depreciation, Amortisation and Impairment 2 Underlying Results are the statutory results before transaction costs of $4.8m incurred in respect of the acquisitions completed in the period
57
For
per
sona
l use
onl
y

Ten new properties added in FY2016 and performing in line with expectations
Statement BreakFree on Collins, Melbourne Mantra on View, Surfers Paradise Mantra Twin Towns, Gold Coast
Peppers Noosa, Noosa Mantra Boathouse, Airlie Beach Peppers Waymouth Hotel, Adelaide
58
For
per
sona
l use
onl
y

Ten new properties added in FY2016 and performing in line with expectations
Statement
* Peppers Soul, Surfers Paradise
successfully transitioned from MA to
MLR during the period
Mantra on Chevron, Surfers
Paradise
Mantra on Mary, Brisbane *Peppers Soul, Surfers Paradise
Peppers Docklands, Melbourne
59
For
per
sona
l use
onl
y

Statutory balance sheet
31 Dec 15
Actual
($m)
Cash and cash equivalents 42.0
Other current assets 75.0
Current assets 117.0
PPE 120.5
Intangible assets 474.8
Other non-current assets 1.0
Total non-current assets 596.3
Total assets 713.3
Trade and other payables 45.3
Other liabilities 60.9
Total current liabilities 106.2
Borrowings 160.4
Other non-current liabilities 96.5
Total non-current liabilities 256.9
Total liabilities 363.1
Net assets 350.2
Credit metrics
Borrowings ($m) 160.4
Cash and cash equivalents ($m) 42.0
Net total indebtedness ($m) 118.4
Net debt /LTM Underlying EBITDAI 1.4x
FY2016 LTM Underlying EBITDAI/LTM Net
finance cost 20.3x
• Very strong balance sheet and cash position
• Intangible assets have increased by $110.6m
(30.4%) since 30 June 2015 following the
acquisition of nine properties
• Syndicated Facility Agreement extended by $40m
in the period. The Group is well within debt
covenants under banking facilities
• Strong balance sheet leaves the Group in a good
position to take advantage of growth
opportunities, which may include hotel
acquisitions
• The Group expects to review some of its debt
facilities pre 30 June 2016
COMMENTS
60
For
per
sona
l use
onl
y

For
per
sona
l use
onl
y


![[MS-PST]: Outlook Personal Folders (.pst) File Format · 2016-09-14 · [MS-PST]: Outlook Personal Folders (.pst) File Format Intellectual Property Rights Notice for Open Specifications](https://img.pdfslide.net/doc/110x75/5f6c9e9b4e11ae13a90bf845/ms-pst-outlook-personal-folders-pst-file-format-2016-09-14-ms-pst-outlook.jpg)


![[MS-PST]: Outlook Personal Folders (.pst) File Format · Outlook Personal Folders (.pst) File Format Intellectual Property Rights Notice for Open Specifications Documentation](https://img.pdfslide.net/doc/110x75/5f84d053d91b6903a7088ecd/ms-pst-outlook-personal-folders-pst-file-format-outlook-personal-folders-pst.jpg)
![[MS-PST]: Outlook Personal Folders (.pst) File Format · [MS-PST]: Outlook Personal Folders (.pst) File Format Intellectual Property Rights Notice for Open Specifications Documentation](https://img.pdfslide.net/doc/110x75/5e8f5f3d7d0a0a79de358e44/ms-pst-outlook-personal-folders-pst-file-format-ms-pst-outlook-personal.jpg)


![[MS-PST]: Outlook Personal Folders (.pst) File Format - Microsoft](https://img.pdfslide.net/doc/110x75/613c7b43c957d930775e4106/ms-pst-outlook-personal-folders-pst-file-format-microsoft.jpg)