Embed Size (px)
Citation preview

McMillanShakespeareGroup
MMS Group FY17Half Year Presentation
PresentersMike Salisbury, CEO
Mark Blackburn, CFOFor
per
sona
l use
onl
y

Overview
Overview
2
For
per
sona
l use
onl
y

3
Overview
Key initiatives for building long term shareholder value
Broad suite of high quality products and industry leading service to drive organic growth
Investment in technology resulting in productivity gains and margin growth
Synergy benefits from a fully integrated business
Improved return on capital employed through a more flexible approach to funding
Selective approach to acquisitions to complement organic growth
For
per
sona
l use
onl
y
Operational Highlights
Business overview
4
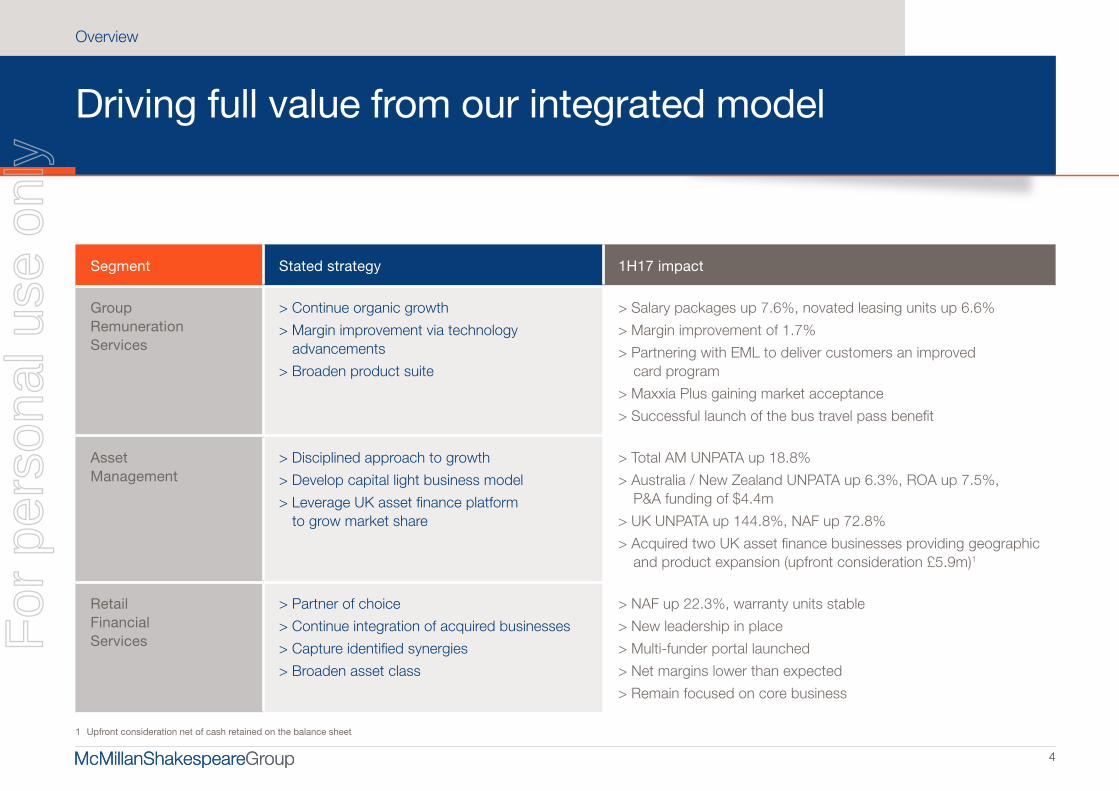
Driving full value from our integrated model
Overview
4
Segment Stated strategy 1H17 impact
Group Remuneration Services
> Continue organic growth
> Margin improvement via technology advancements
> Broaden product suite
> Salary packages up 7.6%, novated leasing units up 6.6%
> Margin improvement of 1.7%
> Partnering with EML to deliver customers an improved card program
> Maxxia Plus gaining market acceptance
> Successful launch of the bus travel pass benefit
Asset Management
> Disciplined approach to growth
> Develop capital light business model
> Leverage UK asset finance platform to grow market share
> Total AM UNPATA up 18.8%
> Australia / New Zealand UNPATA up 6.3%, ROA up 7.5%, P&A funding of $4.4m
> UK UNPATA up 144.8%, NAF up 72.8%
> Acquired two UK asset finance businesses providing geographic and product expansion (upfront consideration £5.9m)1
Retail Financial Services
> Partner of choice
> Continue integration of acquired businesses
> Capture identified synergies
> Broaden asset class
> NAF up 22.3%, warranty units stable
> New leadership in place
> Multi-funder portal launched
> Net margins lower than expected
> Remain focused on core business
1 Upfront consideration net of cash retained on the balance sheet
For
per
sona
l use
onl
y

Key Financial MetricsSolid 1H17 performance despite interruptions
Overview
5
Compared to previous corresponding period (pcp)
Segment Revenue up 2.9% to
$250.4 millionSegment EBITDA up 1.8% to
$66.4 millionUNPATA up 0.8% to
$42.1 millionUnderlying EPS unchanged at
50.6 cents/shareFully franked dividend up 6.9%
31.0 cents/share
Segment Revenue up 2.9% to
$250.4 millionSegment EBITDA up 1.8% to
$66.4 millionUNPATA up 0.8% to
$42.1 millionUnderlying EPS unchanged at
50.6 cents/shareFully franked dividend up 6.9%
31.0 cents/share
1H17 UNPATA breakdown
■ Group Remuneration Services
■ Asset Management
■ Retail Financial Services
66%19%
15%
For
per
sona
l use
onl
y
6
Overview
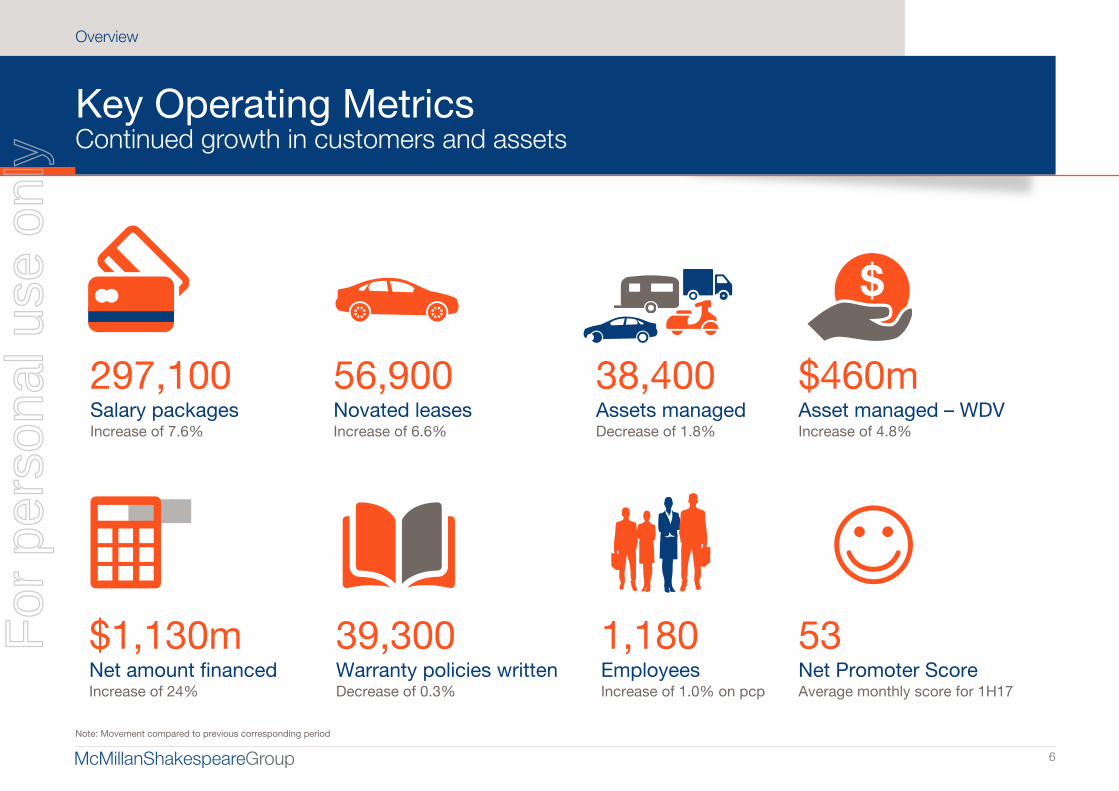
Key Operating MetricsContinued growth in customers and assets
Salary packagesIncrease of 7.6%
297,100
Warranty policies writtenDecrease of 0.3%
39,300EmployeesIncrease of 1.0% on pcp
1,180
Novated leasesIncrease of 6.6%
56,900Assets managedDecrease of 1.8%
38,400Asset managed – WDVIncrease of 4.8%
$460m
Net Promoter ScoreAverage monthly score for 1H17
53Net amount financedIncrease of 24%
$1,130m
Note: Movement compared to previous corresponding period
For
per
sona
l use
onl
y
Operational Highlights
Business overview
7
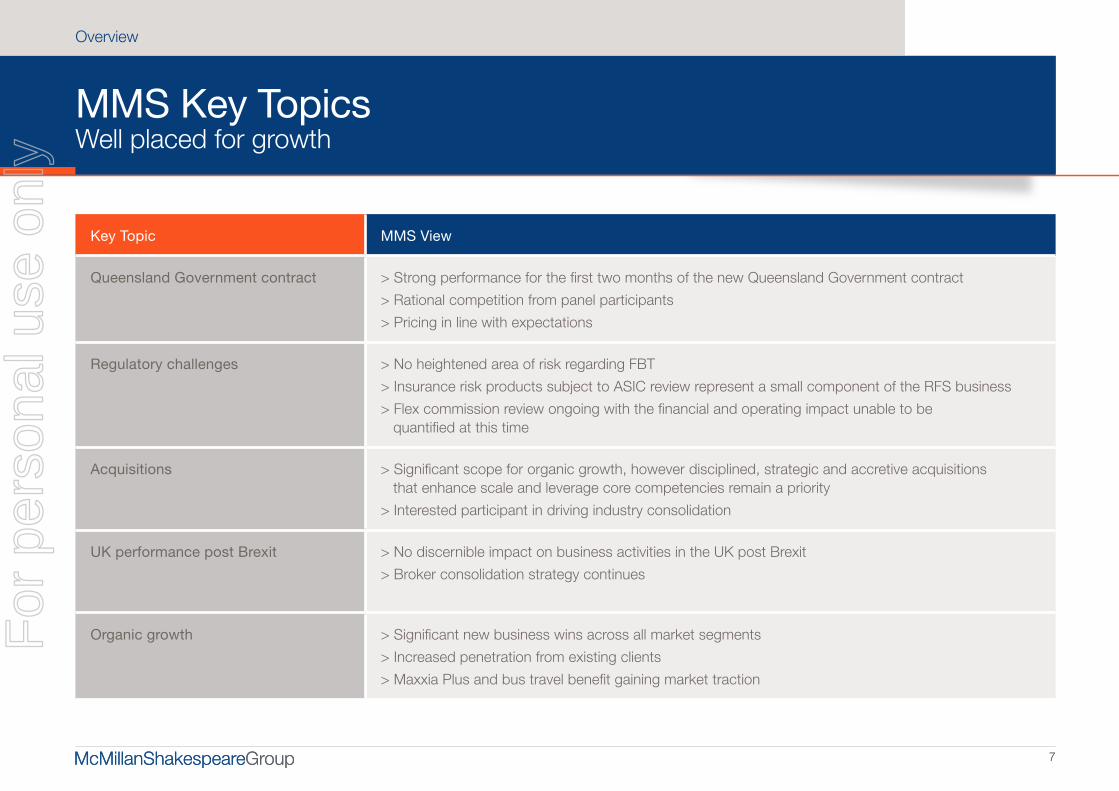
MMS Key TopicsWell placed for growth
Overview
7
Key Topic MMS View
Queensland Government contract > Strong performance for the first two months of the new Queensland Government contract
> Rational competition from panel participants
> Pricing in line with expectations
Regulatory challenges > No heightened area of risk regarding FBT
> Insurance risk products subject to ASIC review represent a small component of the RFS business
> Flex commission review ongoing with the financial and operating impact unable to be quantified at this time
Acquisitions > Significant scope for organic growth, however disciplined, strategic and accretive acquisitions that enhance scale and leverage core competencies remain a priority
> Interested participant in driving industry consolidation
UK performance post Brexit > No discernible impact on business activities in the UK post Brexit
> Broker consolidation strategy continues
Organic growth > Significant new business wins across all market segments
> Increased penetration from existing clients
> Maxxia Plus and bus travel benefit gaining market traction
For
per
sona
l use
onl
y

Financial performance
Financial performance
8
For
per
sona
l use
onl
y

9
Financial performance
9
$m 1H17 1H16 Variance
Segment revenue 250.4 243.5 2.9%
Segment EBITDA 66.4 65.2 1.8%
EBITDA margin (%) 26.5% 26.8%
Segment NPBT 60.4 59.2 2.0%
NPAT 40.4 38.9 3.8%
Underlying NPATA 42.1 41.8 0.8%
Basic earnings per share (cents) 48.6 47.1 3.2%
Underlying earnings per share (cents) 50.6 50.6 -
Dividend per share (cents) 31.0 29.0 6.9%
Payout ratio (%)1 61.3% 57.4%
Free cash flow2 34.2 53.9 (36.5%)
Return on equity (%)3 21.6% 23.0%
Return on capital employed (%)3 20.1% 20.5%
1 Payout ratio calculated by dividend per share (cents) divided by underlying earnings per share (cents)
2 Free operating cash flow before investing, financing activities and fleet increases
3 Return on equity and capital employed has been adjusted to reflect six months trading for acquisitions made in the first half
Results Summary
For
per
sona
l use
onl
y

Operational Highlights
10
Financial performance
Balance SheetStrong balance sheet to fund growth and shareholder returns
10
Dec 16 Jun 16
AM Other Group Group
Cash at bank 6.9 50.6 57.5 95.6
Other current assets 3.5 51.4 54.9 47.3
Total fleet funded assets 457.1 - 457.1 435.7
Goodwill / intangibles 42.7 214.6 257.3 254.6
Other non-current assets 5.4 5.6 11.0 12.2
Total Assets 515.6 322.2 837.8 845.4
Borrowings (current) 1.6 11.5 13.1 12.9
Other current liabilities 36.9 73.3 110.2 116.9
Borrowings (non-current) 284.4 35.8 320.2 332.6
Other non-current liabilities 11.2 3.3 14.5 12.5
Total Liabilities 334.1 123.9 458.0 474.9
Net Assets 181.5 198.3 379.8 370.5
$m
Net cash positive1
$8.4 millionDebt to funded fleet WDV2
63% vs 67% pcp
Group gearing3
42% vs 40% pcp
Interest times cover4
13.2x vs 11.9x pcp
Compared to previous corresponding period (pcp)
1 Other cash ($50.6m) less corporate debt ($47.3m) excludes fleet funded net debt, however includes $5.1m of cash held on deposit for the Capex Asset Finance acquisition completed in January 2017
2 AM borrowings (current and non-current) / total fleet funded assets
3 Group net debt / equity
4 Net interest (expenses less income) / EBIT
For
per
sona
l use
onl
y

11
Financial performance
11
Local Currency Australian Dollars ($m)
CurrencyFacility
sizeFacility
sizeAmount
drawnAmount
undrawnDuration
Asset Financing Australia Revolving A$ 220.8 220.8 161.0 59.8 (A$165m) 31 March 2018
(A$75m) 31 March 2019Asset Financing NZ Revolving NZ$ 20.0 19.2 11.3 7.9
Asset Financing UK Revolving GBP 42.0 71.5 70.4 1.1 31 March 2018
GBP 35.0 59.6 35.4 24.2 31 March 2019
Purchase of Presidian Amortising A$ 47.4 47.4 47.4 - 31 March 2020
Purchase of CLM UK Amortising GBP 4.8 8.1 8.1 - 31 March 2018
Initiated capital-light funding model for Asset Management in Australia, with the introduction of Principal and Agency (P&A) funding arrangements post 30 June 2016
Post 31 December 2016, MMS entered into a new five year, £5.9m floating rate amortising term loan facility ending on 31 December 2021 to facilitate 100% debt funding of the European Vehicle Contracts (EVC) and Capex Asset Finance (Capex) acquisitions
Funding Overview Significant funding capacity to drive growth
For
per
sona
l use
onl
y

Business overview
12
1H17 1H16
Financial performance
12
$m
Group Remuneration
Services
Asset
Management
Retail Financial Services
Unallocated /
parent co.
MMS
Group Total
MMS
Group Total
Segment NPAT 28.2 7.9 5.3 (1.0) 40.4 38.9
Non-fleet depn/amort, reserves and other non-cash items 2.5 2.9 2.0 - 7.4 9.7
Capex (non fleet) and software upgrade (3.1) (0.3) (0.3) - (3.7) (3.5)
Tax payments in excess of tax expense (1.2) (1.2) (0.6) - (3.0) (0.3)
Working capital inflow / (outflow) (2.1) (4.0) (0.8) - (6.9) 9.1
Free cashflow before investing activities and fleet increase 24.3 5.3 5.6 (1.0) 34.2 53.9
Investing activities and fleet increase:
Net growth in Asset Management portfolio - (28.2) - - (28.2) (37.3)
Sale of fleet portfolio - - - - - 27.4
Investment in acquisitions (net of cash acquired) - (3.3) - - (3.3) (35.7)
Other - (0.5) - - (0.5) (0.2)
Free cashflow 24.3 (26.7) 5.6 (1.0) 2.2 8.1
Financing activities:
Equity contribution (exercise of options) - - - - - 5.4
Intercompany funding (18.9) 24.6 (0.8) (4.9) - -
Cash on deposit for future acquisition - (5.1) - - (5.1) -
Debt borrowings (repayments) - (20.2) - (5.8) (26.0) (36.5)
New borrowings - 19.1 - - 19.1 27.0
Dividends paid - - - (28.3) (28.3) (22.5)
Net cash movement 5.4 (8.4) 4.8 (40.0) (38.1) (18.5)
Opening cash (June) 95.6 85.7
Closing cash (December) 57.5 67.2
CashflowCapital light, cash generative business model
For
per
sona
l use
onl
y
13
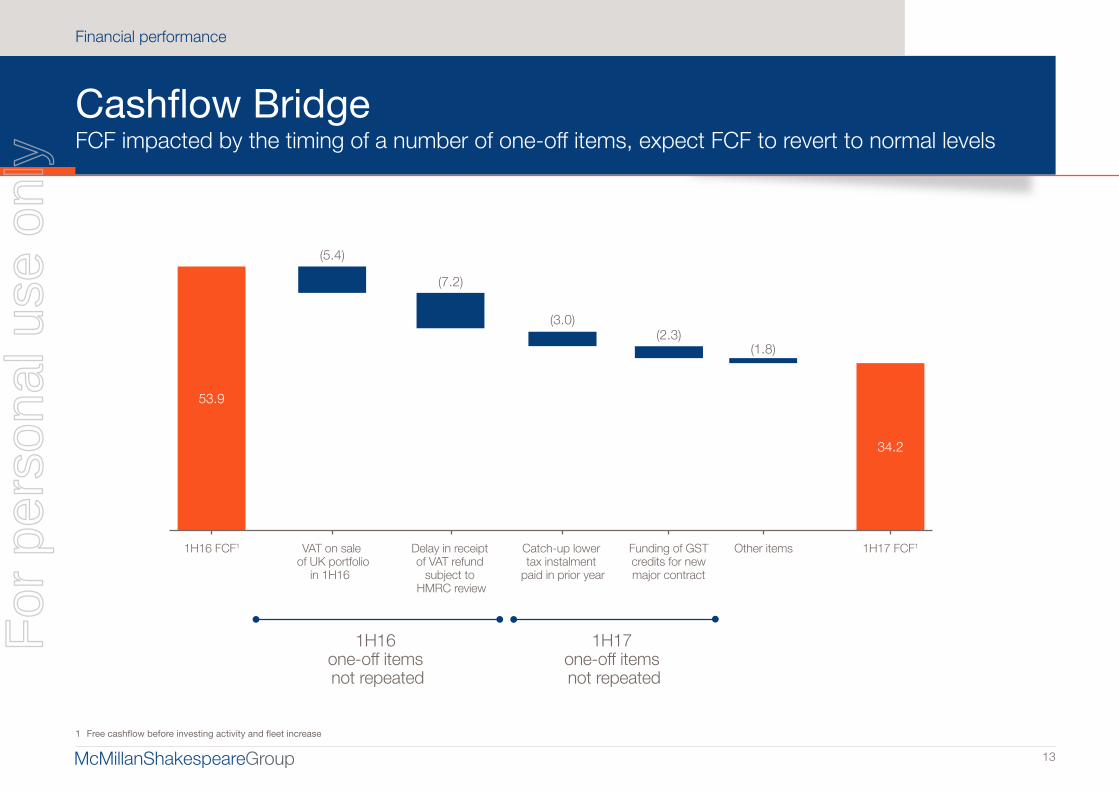
Cashflow BridgeFCF impacted by the timing of a number of one-off items, expect FCF to revert to normal levels
Financial performance
1H16 one-off items not repeated
1H17 one-off items not repeated
53.9
34.2
(5.4)
(7.2)
(3.0)(2.3)
(1.8)
1H16 FCF1 VAT on sale of UK portfolio
in 1H16
Delay in receipt of VAT refund
subject to HMRC review
Catch-up lower tax instalment
paid in prior year
Funding of GSTcredits for newmajor contract
Other items 1H17 FCF1
1 Free cashflow before investing activity and fleet increase
For
per
sona
l use
onl
y

14
Performance Ratios Consistent delivery of earnings growth over a 10 year period
Financial performance
Ten year historical performance
1H08 1H09 1H10 1H111 1H12 1H13 1H142 1H15 1H16 1H17 CAGR
Segment Revenue $m 31.5 37.7 43.7 136.3 143.0 160.2 161.5 181.2 243.5 250.4 25.9%
Segment EBITDA $m 11.8 13.6 17.0 35.4 38.9 44.7 32.6 47.4 65.2 66.4 21.1%
EBITDA margin % 37.5% 36.2% 38.8% 26.0% 27.2% 27.9% 20.2% 26.2% 26.8% 26.5%
UNPATA $m 7.9 9.5 11.2 20.5 24.9 29.7 19.3 31.3 41.8 42.1 20.4%
UNPATA margin % 25.1% 25.2% 25.6% 15.0% 17.4% 18.5% 11.9% 17.3% 17.2% 16.8%
Underlying earnings per share cents 11.8 14.1 16.6 30.2 36.3 33.9 25.8 41.4 50.6 50.6 17.6%
Dividend per share cents 7.5 8.5 10.0 16.0 22.0 24.0 21.0 25.0 29.0 31.0 17.1%
Payout ratio (UNPATA) % 63.6% 60.3% 60.2% 53.1 % 60.6% 60.2% 81.3% 60.4% 57.4% 61.3%
ROE % 33.0% 38.0% 38.0% 43.0% 40.0% 34.0% 19.0% 26.6% 23.0% 21.6%
Free cash flow (FCF) $m 8.2 11.3 13.2 15.4 25.5 27.4 26.6 32.2 53.9 34.2 17.2%
FCF as % of UNPATA % 103.8% 118.9% 117.9% 75.1% 102.4% 92.3% 137.8% 102.9% 128.9% 81.2%
1 Completed the acquisition of Interleasing (Australia) Ltd2 Negatively impacted by the former government's proposed changes to novated leasing
For
per
sona
l use
onl
y

Operational Highlights
Business overview
15
> Significant growth and profitability within Group Remuneration Services (GRS) – Operating revenues increased 12%, EBITDA by 25% and NPAT margins remain strong
> Selective approach to growth in Asset Management (AM) – Stable Australian asset book with conservative gearing levels – UK business showing momentum, commenced sale of “lifestyle leases”
> Created a new complimentary segment in Retail Financial Services (RFS) – Completed acquisition of Presidian on 27 February 2015; completed acquisition of UFS post year end (31 July 2015) – Ensures scale across the new and used vehicles customer value chain – Synergies and new growth opportunities identified with integration on track and well advanced
Segment performance
Segment performance
15
For
per
sona
l use
onl
y

Operational Highlights
16
Segment performance
Segment ReviewSolid operating result
16
Group Remuneration Services Asset Management1 Retail Financial Services Total
$m 1H17 1H16 % 1H17 1H16 % 1H17 1H16 % 1H17 1H16 %
Segment Revenue 90.5 91.4 (1.0%) 104.0 97.4 6.8% 55.9 54.6 2.3% 250.4 243.5 2.9%
Expenses 47.2 49.2 (4.0%) 90.9 85.7 6.1% 45.9 43.4 5.8% 184.1 178.3 3.2%
Segment EBITDA 43.3 42.3 2.6% 13.1 11.7 11.8% 10.0 11.2 (11.2%) 66.4 65.2 1.8%
EBITDA margin (%) 47.9% 46.2% 12.6% 12.0% 17.8% 20.6% 26.5% 26.8%
Depreciation and amortisation 2.0 2.1 (4.5%) 1.5 1.7 (11.8%) 0.8 0.6 35.0% 4.3 4.4 (2.3%)
Amortisation of intangibles - - - 0.4 0.3 30.0% 1.3 1.3 (1.9%) 1.7 1.6 4.3%
Segment NPBT 41.4 40.2 2.9% 11.1 9.6 15.5% 7.9 9.4 (15.4%) 60.4 59.2 2.0%
Tax 13.1 11.9 10.5% 3.2 3.0 9.0% 2.7 3.2 (15.5%) 19.0 18.0 5.7%
Segment NPAT 28.2 28.3 (0.3%) 7.9 6.7 18.4 % 5.3 6.2 (15.3%) 41.4 41.2 0.5%
Segment UNPATA 28.2 28.3 (0.3%) 8.2 6.9 18.8% 6.2 7.1 (13.6%)
Unallocated items
Net interest income / (expense) - (0.2)
Public company costs (0.7) (0.6)
Acquisition expense (0.6) (2.3)
Tax on unallocated items 0.3 0.8
NPAT 40.4 38.9 3.8%
UNPATA 42.1 41.8 0.8%
1 Asset Management expenses includes the share of the UK JV loss of $0.7m (1H16: $0.6m)
For
per
sona
l use
onl
y

17
Segment performance
Group Remuneration Services (GRS)Momentum building after interruption
17
Revenue 90.5 91.4 (1.0%)
Employee expenses 34.3 36.8 (7.0%)
Property & other expenses 12.9 12.3 5.0%
EBITDA 43.3 42.3 2.6%
EBITDA margin 47.9% 46.2%
Depreciation 2.0 2.1 (4.5%)
Tax 13.1 11.9 10.5%
UNPATA1 28.2 28.3 (0.3%)
UNPATA margin 31.2% 31.0%
Key metrics
Salary packages (units) 297,100 276,000 7.6%
Novated leases (fleet units) 56,900 53,400 6.6%
Direct employees (FTE's)2 548 559 (2.0%)
Key financials excluding impact of interest3
Revenue 85.8 86.6 (0.9%)
EBITDA 38.6 37.5 3.1%
1H17 1H16 Variance Commentary GRS delivered a consistent headline result with
a reduction in revenue of 1% compared to pcp, while UNPATA remained at similar levels
Queensland Government marketing restrictions prior to the appointment on 7 November 2016 affected novated leasing volume, however volumes are recovering, with yields in line with expectations, validating strength of the RemServ brand
Consistent margin improvement underpinned by ongoing productivity and technology advancements
Multiple new client wins in the half; Maxxia Plus gaining market traction via enhanced customer offering
Outlook Continue organic growth (new business and increased
penetration) evidenced by 10,000+ new salary packages due to transition in April 2017
Ongoing productivity and technology improvements underpin margin
– New salary packaging card offering to commence April 2017
– Commenced new automated on-boarding process for salary packaging
1 Segment NPAT and UNPATA are the same2 Direct employees excludes back office functions such as finance, IT, HR and marketing3 Excludes impact of interest derived from external funds administered
$m
For
per
sona
l use
onl
y

GRSContinuing organic growth in customer and asset bases
Segment performance
18
5 year CAGR : 5.6%
226.0 243.8 249.2 259.6 276.0
297.1
1H12 1H13 1H14 1H15 1H16 1H17
5 year CAGR : 11.2%
33.4 40.1
43.9 48.1
53.4 56.9
1H12 1H13 1H14 1H15 1H16 1H17
Salary packages (000)1
Net new clients: 300 novated vehicles
Increased participation: 3,200 novated vehicles
Net new clients: 3,600 packages
Increased participation: 17,500 packages
Novated vehicles (000)2
1. Total number of salary packages at period end 2. Novated leases under management at period endNote: New clients are organisations who commenced during the period
For
per
sona
l use
onl
y

19
Segment performance
GRSCombined approach of people & technology drives productivity & customer satisfaction
19
On-line claims take-up rate (%) Customer satisfaction index3Productivity index1
1 Rolling three month revenue (ex SP interest) / FTE
2 Negatively impacted by proposed changes to novated leasing
3 Based on net promoter score
4 Annual meal entertainment and venue hire capping introduced from 1 April 2016 resulted in one-off spike in call volumes leading to a temporary decline in service standards
100
120
140
160
180
0
50
100
150
200
250
300
NPS Benchmark
2 0
20
40
60
80
Launch of the online claims functionality
Launch of the mobile claims App
4
Dec 2
008
June
200
9Dec
200
9
June
201
0Dec
201
0
June
201
1Dec
201
1Ju
ne 2
012
Dec 2
012
June
201
3Dec
201
3Ju
ne 2
014
Dec 2
015
Dec 2
014
June
201
5Ju
ne 2
016
Dec2008
Dec2010
Dec2012
Dec2014
Dec2016
Dec2014
Dec2015
Dec2016
Dec2008
Dec2010
Dec2012
Dec2014
Dec2016
For
per
sona
l use
onl
y

20
Segment performance
GRSNew salary packaging card program to commence April 2017
Partnering with Emerchants Limited to provide customers the latest in salary packaging technology
For
per
sona
l use
onl
y

Asset Management (AM) – Australia / New ZealandDisciplined approach generating improved returns
Segment performance
21
Revenue 90.2 87.0 3.6%
Fleet depreciation 38.3 39.4 (2.8%)
Lease and vehicle management expenses
29.6 25.0 18.5%
Employee expenses 6.3 6.2 1.6%
Property and other expenses 5.1 5.8 (12.1%)
EBITDA 10.9 10.5 3.2%
EBITDA margin 12.0% 12.1%
Depreciation 1.2 1.5 (16.8%)
Tax 2.9 2.7 6.4%
UNPATA1 6.7 6.3 6.3%
NPAT margin 7.4% 7.2%
Key metrics
Return on assets (%) 4.3% 4.0% 7.5%
Assets managed (units)2 22,000 24,000 (8.3%)
Assets managed WDV ($m) 321.2 311.9 3.0%
– On balance sheet ($m) 316.8 311.9 1.6%
– Off balance sheet ($m) 4.4 - 100%Employees (FTE's) 82 77 6.5%
Commentary New contract wins in first half of calendar
2016 including NSW Government contributed to increasing portfolio
Off balance sheet funding commenced 1 August 2016 and WDV was $4.4m at 31 December 2016
ROA increased by 0.3% to 4.3% based on a disciplined and selective approach to capital allocation and risk
Just Honk Used Cars commenced trading on 1 December 2016. Business profitable in January 2017
Outlook Expand Daimler Fleet Management offering
to Daimler Heavy Vehicle range
Enhance digital presence in the small to medium market segment
1 Segment NPAT and UNPATA are the same2 Assets managed comprises operating and finance leases and fleet managed vehicles
$m 1H17 1H16 Variance
For
per
sona
l use
onl
y

AM – Australia / New ZealandDiversified model with strong controls
Segment performance
22
Fleet assets written down value ($m)1 1H17 WDV breakdown
1H17 Revenue breakdown
■ Mining and construction
■ Manufacturing
■ Industry
■ Wholesale and retail trade
■ Services
■ Other
■ Fleet assets funded utilising P&A
■ Principal and interest
■ Maintenance and tyres
■ Proceeds from sales of leased assets
15%21%
14%
27%
9% 14%
$316.8m 60%
5%
35%
$90.2m296.9
322.6 314.9 311.9 316.8
4.4
1H13 1H14 1H15 1H16 1H17
1 Assets written down value in FY15 restated from $311.0m to $313.5m
For
per
sona
l use
onl
y
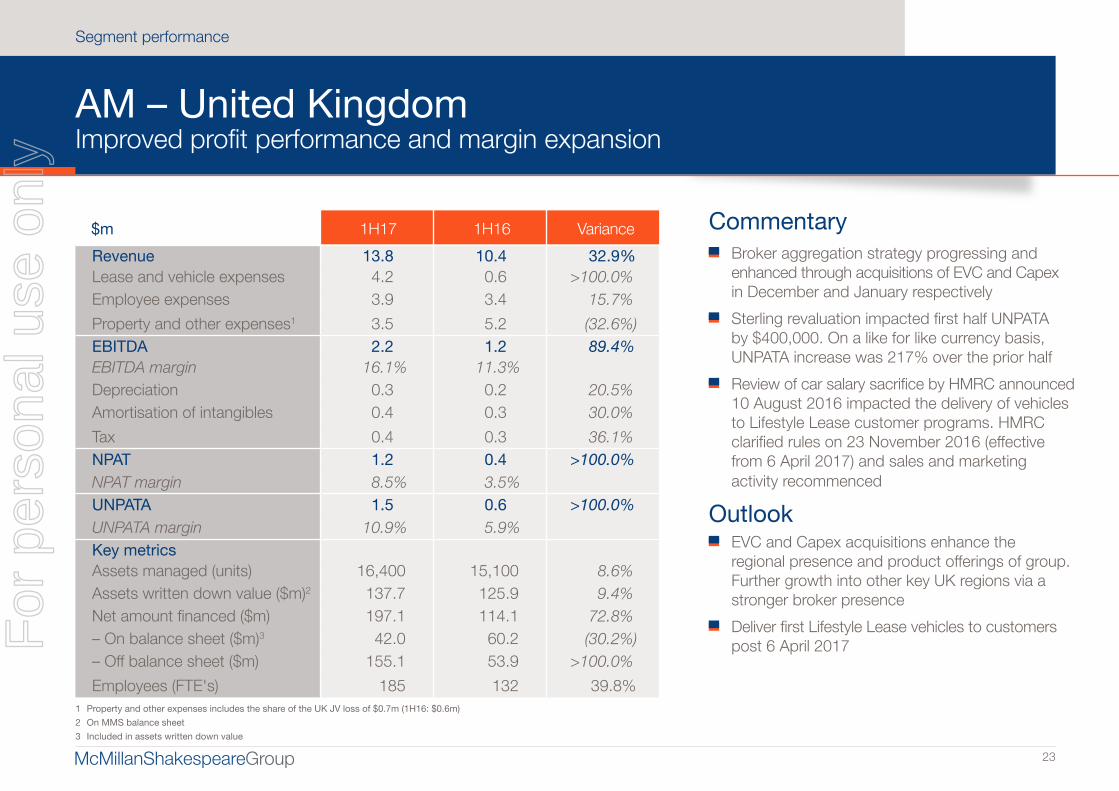
AM – United Kingdom Improved profit performance and margin expansion
Segment performance
23
Commentary Broker aggregation strategy progressing and
enhanced through acquisitions of EVC and Capex in December and January respectively
Sterling revaluation impacted first half UNPATA by $400,000. On a like for like currency basis, UNPATA increase was 217% over the prior half
Review of car salary sacrifice by HMRC announced 10 August 2016 impacted the delivery of vehicles to Lifestyle Lease customer programs. HMRC clarified rules on 23 November 2016 (effective from 6 April 2017) and sales and marketing activity recommenced
Outlook EVC and Capex acquisitions enhance the
regional presence and product offerings of group. Further growth into other key UK regions via a stronger broker presence
Deliver first Lifestyle Lease vehicles to customers post 6 April 2017
$m 1H17 1H16 Variance
Revenue 13.8 10.4 32.9%Lease and vehicle expenses 4.2 0.6 >100.0%Employee expenses 3.9 3.4 15.7%
Property and other expenses1 3.5 5.2 (32.6%)EBITDA 2.2 1.2 89.4%EBITDA margin 16.1% 11.3%Depreciation 0.3 0.2 20.5%Amortisation of intangibles 0.4 0.3 30.0%
Tax 0.4 0.3 36.1%NPAT 1.2 0.4 >100.0%NPAT margin 8.5% 3.5%UNPATA 1.5 0.6 >100.0%UNPATA margin 10.9% 5.9%Key metricsAssets managed (units) 16,400 15,100 8.6%Assets written down value ($m)2 137.7 125.9 9.4%Net amount financed ($m) 197.1 114.1 72.8%– On balance sheet ($m)3 42.0 60.2 (30.2%)– Off balance sheet ($m) 155.1 53.9 >100.0%
Employees (FTE's) 185 132 39.8%1 Property and other expenses includes the share of the UK JV loss of $0.7m (1H16: $0.6m)
2 On MMS balance sheet
3 Included in assets written down value
For
per
sona
l use
onl
y

AM – United KingdomStrong growth in net amount financed - positive lead indicator
Segment performance
24
Assets written down value ($m)1 1H17 WDV breakdown
1H17 Revenue breakdownNet amount financed ($m)
■ Services ■ Transportation and communication ■ Finance■ Manufacturing■ Wholesale and trade■ Other
■ Principal and interest ■ Other vehicle related services ■ Brokerage commission income ■ Other (3%)
36%
10%
11%
13%
23%
7%
$137.7m
26%
23%
48% $13.8m
10.0 38.6
125.9 137.7
1H14 1H15 1H16 1H17
17.0 31.6
114.1 197.1
1H14 1H15 1H16 1H17
1 An additional $27.4m was moved off balance sheet in FY16 as part of P&A funding arrangement
For
per
sona
l use
onl
y

Retail Financial Services (RFS) Leveraging scale and technology to drive performance
Segment performance
25
1 1HY16 represents six months trading for Presidian and five months trading for UFS2 Excludes acquisition associated costs and interest costs on debt associated with the acquisition of Presidian
Revenue 55.9 54.6 2.3%Net claims and brokerage commissions
28.7 25.5 12.7%
Employee expenses 12.1 13.2 (8.3%)
Property and other expenses 5.2 4.8 8.8%
EBITDA 10.0 11.2 (11.7%)EBITDA margin 17.8% 20.6%
Depreciation 0.8 0.6 35.0%
Amortisation of intangibles 1.3 1.3 (1.9%)
Tax 2.7 3.2 (15.5%)
NPAT 5.3 6.2 (15.3%)
NPAT margin 9.4% 11.4%
UNPATA 6.2 7.1 (13.6%)
UNPATA margin 11.0% 13.0%
Key metricsNet amount financed ($m) 551.0 450.7 22.3%
Warranty policies written (units) 39,300 39,400 (0.3%)
Employees (FTE's) 167 186 (10.1%)
Commentary Net amount financed grew by circa $100m
or 22% compared to pcp – Growth skewed towards aggregation
vs. retail branch network
Commissions paid by funders reduced compared to pcp
– Funder appetite has changed
Launched Horizon 2 platform which directly interfaces with a number of funders
Prudent focus on expense reduction
Outlook New leadership team across both the finance
and risk (warranty and insurance) businesses focused on leveraging scale and technology to drive performance
Monitor ASIC regulatory environment to ensure operating model adapts to any changes
$m 1H17 1H161,2 Variance
For
per
sona
l use
onl
y

RFSGrowth in net amount financed
Segment performance
26
Net amount financed ($m)
379.2 450.7
551.0
Proforma atacquisition1
1H162 1H17
1 1H15 represents the six months of the Presidian run rate at acquisition and five months of UFS run rate at acquisition2 1H16 represents six months trading for Presidian and five months trading for UFS
1H17 Revenue breakdown
1H17 Gross Margin breakdown ($m)
■ Finance
■ Warranty
■ Insurance
■ Finance
■ Warranty and insurance
63%
9%
28% $55.9m
19.7 17.8
9.5 9.4
1H16 1H17
29.227.2
For
per
sona
l use
onl
y

Summary
Summary
27
For
per
sona
l use
onl
y

SummaryResults demonstrate MMS' strength, building momentum
Summary
28
Solid operating metrics with revenue of $250.4m (+2.9%) and UNPATA of $42.1m (+0.8%)– GRS: Appointed to Queensland Government novated leasing panel.
Key revenue drivers increasing, improving margins, record new clients
– AM: Improved profitability, initiated capital light funding model in Australia, continued broker consolidation strategy in UK
– RFS: Significant increase in NAF, launched Horizon 2, installed new leadership team
Underlying EPS of 50.6 cents, with a 31 cent fully franked interim dividend (represents payout ratio of 61.3%)
Remain focused on stated strategies to drive growth in revenues and returns, deliver synergies and improve productivity across the integrated group – Cross sell into significant distribution footprint
– Competitive strengths of people, processes and technology
– Leverage financial scale and expertiseFor
per
sona
l use
onl
y

Appendix
Appendix
29
For
per
sona
l use
onl
y

Complementary diversification across the MMS Group
Appendix
30
Group Remuneration Services Asset Management Retail Financial Services
Brands
Primary service – Salary packaging
– Novated leases
– Vehicle fleet leasing and management
– Used vehicle retail sales
– Vehicle finance, insurance and warranty broking
Customers – Hospitals, health & charity workers
– Public and private sector
– Predominantly corporate customer base
– Retail customer base
– Dealer, broker and retail network
Distribution – Over 800 customers
– Circa 1.0 million employees
– Over 450 customers
– Select brokers
– 5,200+ active dealers
– 200 finance brokers
Key operating statistics – 297,100 salary packages
– 56,900 novated leases
– 38,400 total assets managed
– $460m total assets funded1
– $197m net amount financed (UK)
– $550m net amount financed
– 39,300 warranty products sold
Growth strategy
– Target organic growth via existing clients and new business
– Broaden product suite (Maxxia Plus)– Consider strategic acquisitions
– Continue P&A funding arrangements (“capital light” business model)
– Consider selective acquisitions in the UK
– Organic growth and capture of all identified synergies (revenue and cost)
– Invest in brokers within existing network
– Broaden asset class
1 Total Assets funded on and off balance sheet
For
per
sona
l use
onl
y

31
European Vehicle Contracts Limited acquisition
Appendix
MMS acquired EVC on 1 December 2016
EVC (trading as Eurodrive) is a UK leader in the point of sale (POS) provision of motor vehicle finance utilising an advanced online quotation system which has been developed in-house
The business operates through a network of 400 franchised and independent new and used car dealers, providing an interface between dealers and leaders
The business, is based in the north of England and operates mainly from Central Scotland to South Yorkshire
Originates loans of circa £50.0 million per year
Normalised EBITDA of £800,000
Established in 2008 by Stephen Dixon and Derek Goodsir. Both founders and an additional Director, Kristie Tyson, will remain with the business post acquisition
Upfront purchase price of £2.9m, represents 3.6x normalised EBITDA
Deferred consideration of up to £3.1m over 4 year period depending on the achievement of EBITDA growth rates
Provides product and channel diversification
Provides a foothold into the B2C market (through dealers), via a significant player in the specialised broker market
Synergies and cross sell benefits to be captured from the acquisition include increased scale (originations), increased panel of lenders, introduction of both B2B and B2C networks
MarketChannel
to marketCompany
B2B
Corporates
Private Individuals
B2C
Dealers
For
per
sona
l use
onl
y

32
Appendix
Capex Asset Finance Limited acquisition
Acquired on 6 January 2017
Capex provides an extensive portfolio of finance solutions to business customers in the asset finance and vehicle finance marketplace
Located in Birmingham, the second largest city in the UK
– Capex is the largest independent broker in Birmingham
Originates loans of circa £50.0 million per year
Normalised EBITDA of £650,000
Established in 2003 by the directors, Julian Percival, Alan Hunt and Warren Badger, who will all remain with the business
Upfront purchase price of £3.0m, represents 4.6x normalised EBITDA
Deferred consideration of up to £3.7m over 5 year period depending on the achievement of EBITDA growth rates
Provides geographic diversification
The acquisition of Capex continues MMS’s stated UK growth strategy and importantly provides geographic expansion to MMS’s existing asset finance operations, Anglo Scottish.
For
per
sona
l use
onl
y

Risks and sensitivities
Appendix
33
Regulation of consumer insurance products1
Regulation of consumer lending products2
Acquisition and integration risk
Second hand car prices (remarketing earnings)
New and used car sales
Interest rates (earnings on float)
Loss or repricing of major customers
Government policy development
General economic conditions and consumer confidence
1 Consumer Insurance Products Include Underwritten Warranty, Guaranteed Asset Protection Insurance (GAP), Consumer Credit Insurance (CCI), Loan Termination Insurance (LTI), Comprehensive Motor Vehicle Insurance (CMV), Total Asset Insurance (TAI)
2 Consumer Lending Products includes the ability of the dealer or broker flex the interest rate above the based lending rate provided by the financier
For
per
sona
l use
onl
y

34
Integrated model drives sustainable performance
Appendix
Group Remuneration Services
Asset ManagementRetail Financial Services
Customer base:800+ customers
1.0+ million employees
Customer base:5,200+ active dealers200+ finance brokers
Customer base:450+ customers
34
Integrated service and delivery model
Leverage strong customer
relationships
Drive scale and productivity
Reinforce competitive
position
Profitable growth and enhanced shareholder returns will be delivered by leveraging core strengths across the enlarged distribution footprint.
In addition to organic growth via client wins and retention of contracts, 3 key initiatives have been prioritised:
Implementation of the Maxxia Plus employee benefits offering
Enhanced technology drive
Selective acquisitions that enhance the development of the existing businesses
For
per
sona
l use
onl
y

35
Appendix
Reconciliation between NPAT and UNPATA
35
NPAT 40.4 38.9 3.8%
Acquisition transaction costs after tax 0.5 1.7 (72.1%)
Amortisation of intangibles from acquisitions after-tax 1.2 1.2 5.0%
EBITDA 42.1 41.8 0.8%
1H17 1H16 Variance $m
For
per
sona
l use
onl
y

Disclaimer and important notice
36
e
This presentation has been prepared by McMillan Shakespeare Limited ABN 74 107 233 983 (“MMS”). It contains summary information about MMS and its subsidiaries and their activities current as at the date of this presentation. The presentation contains selected information and does not purport to be all inclusive or to contain informa-tion that may be relevant to a prospective investor. The information in this presentation should not be considered as advice or a recommendation to investors or potential investors and it does not take into account the investment objectives, financial situation and particular needs of any particular investor and each person is responsible for conducting its own examination of MMS and assessment of the merits and risks of investing in MMS' shares.
This presentation contains certain forward-looking statements. These statements are only predictions. Actual events or results may differ materially. Nothing in this presentation is a promise or representation as to the future. MMS does not make any representation or warranty as to the accuracy of such statements or assumptions.
The information in this presentation is for information purposes only and is not an offer of securities for subscription, purchase or sale in any jurisdiction. No representation or warranty, express or implied, is made as to the fairness, accuracy, reliability, completeness or correctness of the information, opinions and conclusions contained in this presentation. To the maximum extent permitted by law, none of MMS, its directors, employees, agents or advisers, nor any other person accepts any liability for any loss arising from the use of this presentation or its contents or otherwise arising in connection with it, including, without limitation, any liability arising from fault or negligence on the part of MMS or its directors, employees, agents or advisers.
An investment in MMS is subject to known and unknown risks, some of which are beyond the control of MMS, including possible loss of income and principal invested. MMS does not guarantee any particular rate of return or the performance of MMS, nor does it guarantee the repayment of capital from MMS or any particular tax treat-ment. Each person should have regard to MMS' other periodic and continuous disclosure documents when making their investment decision and should consult such advisers as they consider necessary before making an investment decision. Past performance information given in this presentation is given for illustrative purposes only and should not be relied upon as (and is not) an indication of future performance.
Financial data
All dollar values are in Australian dollars ($) unless stated otherwise.
Effect of rounding
A number of figures, amounts, percentages, estimates, calculations of value and fractions in this presentation are subject to the effect of rounding. Accordingly, the actual calculation of these figures may differ from the figures set out in this presentation.
AppendixF
or p
erso
nal u
se o
nly

McMillanShakespeareGroup
For
per
sona
l use
onl
y