Embed Size (px)
Citation preview

1
For
per
sona
l use
onl
y
2
Summary information
This presentation contains summary information about Fairfax Media Limited and its activities current as at 14 August 2014. The information in this
presentation is of a general background nature and does not purport to be complete. It should be read in conjunction with Fairfax Media Limited other
periodic and continuous disclosure announcements which are available at www.fairfaxmedia.com.au.
Not financial product advice
This presentation is for information purposes only and is not financial product or investment advice or a recommendation to acquire Fairfax Media
Limited securities and has been prepared without taking into account the objectives, financial situation or needs of individuals. Before making an
investment decision, prospective investors should consider the appropriateness of the information having regard to their own objectives, financial
situation and needs and seek legal and taxation advice appropriate to their jurisdiction. Statements made in this presentation are made as at the date of
the presentation unless otherwise stated.
Past performance
Past performance information given in this presentation is given for illustrative purposes only and should not be relied upon as (and is not) an indication
of future performance.
Future performance
This presentation contains certain “forward-looking statements”. The words “expect”, “should”, “could”, “may”, “predict”, “plan” and other similar
expressions are intended to identify forward-looking statements. Indications of, and guidance on, future earnings and financial position and
performance are also forward-looking statements. Forward-looking statements, opinions and estimates provided in this presentation are based on
assumptions and contingencies which are subject to change without notice, as are statements about market and industry trends, which are based on
interpretations of current market conditions. Forward-looking statements including projections, guidance on future earnings and estimates are provided
as a general guide only and should not be relied upon as an indication or guarantee of future performance. Actual results, performance or
achievements may vary materially for many projections because events and actual circumstances frequently do not occur as forecast and these
differences can be material. This presentation contains such statements that are subject to risk factors associated with the industries in which Fairfax
Media Limited operates which may materially impact on future performance. Investors should form their own views as to these matters and any
assumptions on which any forward-looking statements are based. Fairfax Media Limited assumes no obligation to update or revise such information to
reflect any change in expectations or assumptions. The inclusion of forward-looking statements in this presentation should not be regarded as a
representation, warranty of guarantee with respect to its accuracy or the accuracy of the underlying assumptions or that Fairfax Media Limited will
achieve, or is likely to achieve, any particular results.
For
per
sona
l use
onl
y
3
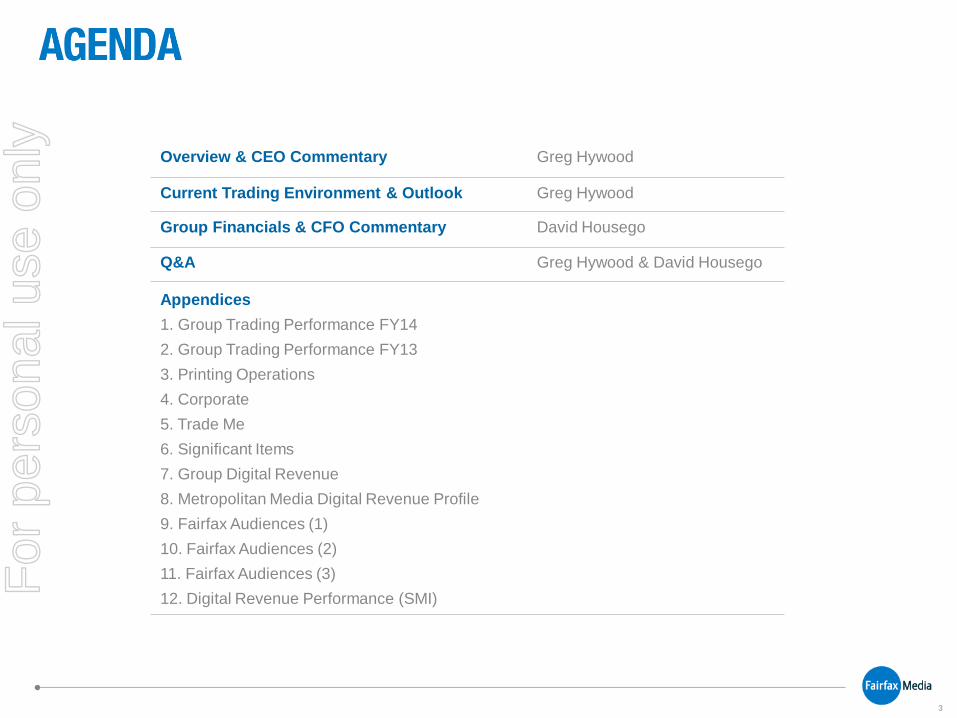
Overview & CEO Commentary Greg Hywood
Current Trading Environment & Outlook Greg Hywood
Group Financials & CFO Commentary David Housego
Q&A Greg Hywood & David Housego
Appendices
1. Group Trading Performance FY14
2. Group Trading Performance FY13
3. Printing Operations
4. Corporate
5. Trade Me
6. Significant Items
7. Group Digital Revenue
8. Metropolitan Media Digital Revenue Profile
9. Fairfax Audiences (1)
10. Fairfax Audiences (2)
11. Fairfax Audiences (3)
12. Digital Revenue Performance (SMI)
For
per
sona
l use
onl
y
4
For
per
sona
l use
onl
y
5
Trading
Performance
excluding
significant items
Less
Entities Disposed
Trading
Performance for
continuing
businesses
Trading
Performance for
continuing
businesses
FY13 Change
$m $m $m $m %
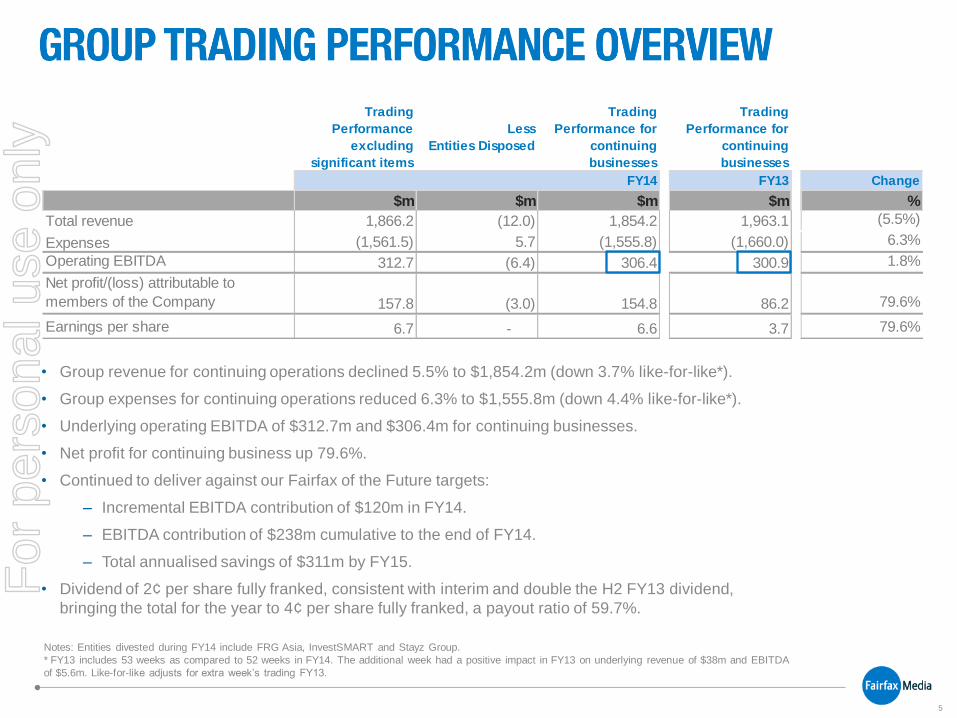
Total revenue 1,866.2 (12.0) 1,854.2 1,963.1 (5.5%)
Expenses (1,561.5) 5.7 (1,555.8) (1,660.0) 6.3%
Operating EBITDA 312.7 (6.4) 306.4 300.9 1.8%
Net profit/(loss) attributable to
members of the Company 157.8 (3.0) 154.8 86.2 79.6%
Earnings per share 6.7 - 6.6 3.7 79.6%
FY14
• Group revenue for continuing operations declined 5.5% to $1,854.2m (down 3.7% like-for-like*).
• Group expenses for continuing operations reduced 6.3% to $1,555.8m (down 4.4% like-for-like*).
• Underlying operating EBITDA of $312.7m and $306.4m for continuing businesses.
• Net profit for continuing business up 79.6%.
• Continued to deliver against our Fairfax of the Future targets:
– Incremental EBITDA contribution of $120m in FY14.
– EBITDA contribution of $238m cumulative to the end of FY14.
– Total annualised savings of $311m by FY15.
• Dividend of 2¢ per share fully franked, consistent with interim and double the H2 FY13 dividend,
bringing the total for the year to 4¢ per share fully franked, a payout ratio of 59.7%.
Notes: Entities divested during FY14 include FRG Asia, InvestSMART and Stayz Group.
* FY13 includes 53 weeks as compared to 52 weeks in FY14. The additional week had a positive impact in FY13 on underlying revenue of $38m and EBITDA
of $5.6m. Like-for-like adjusts for extra week’s trading FY13.
For
per
sona
l use
onl
y
6
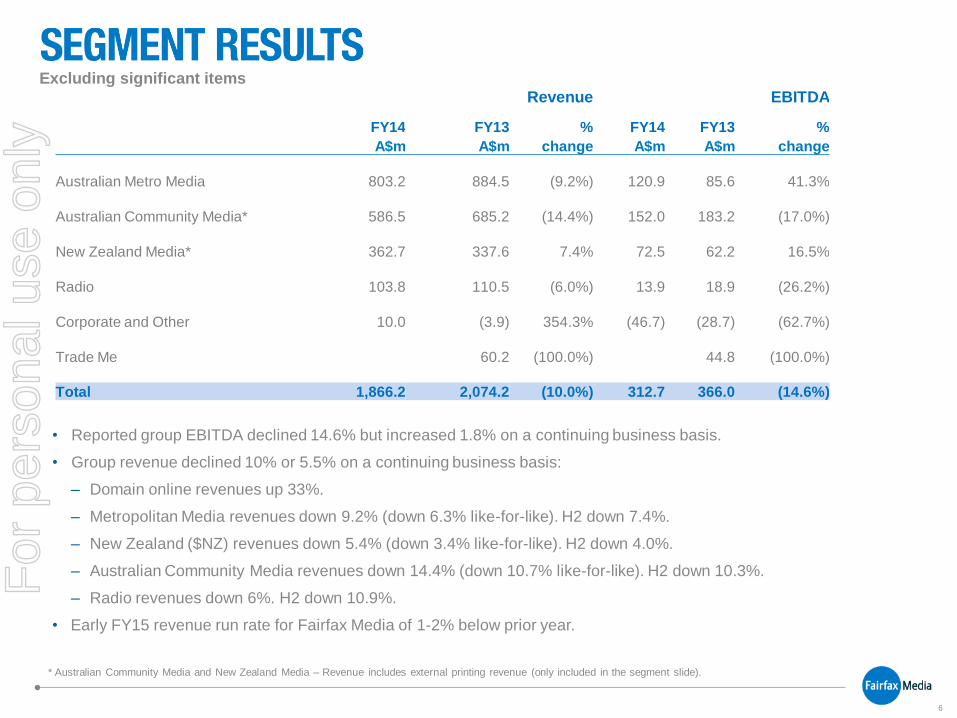
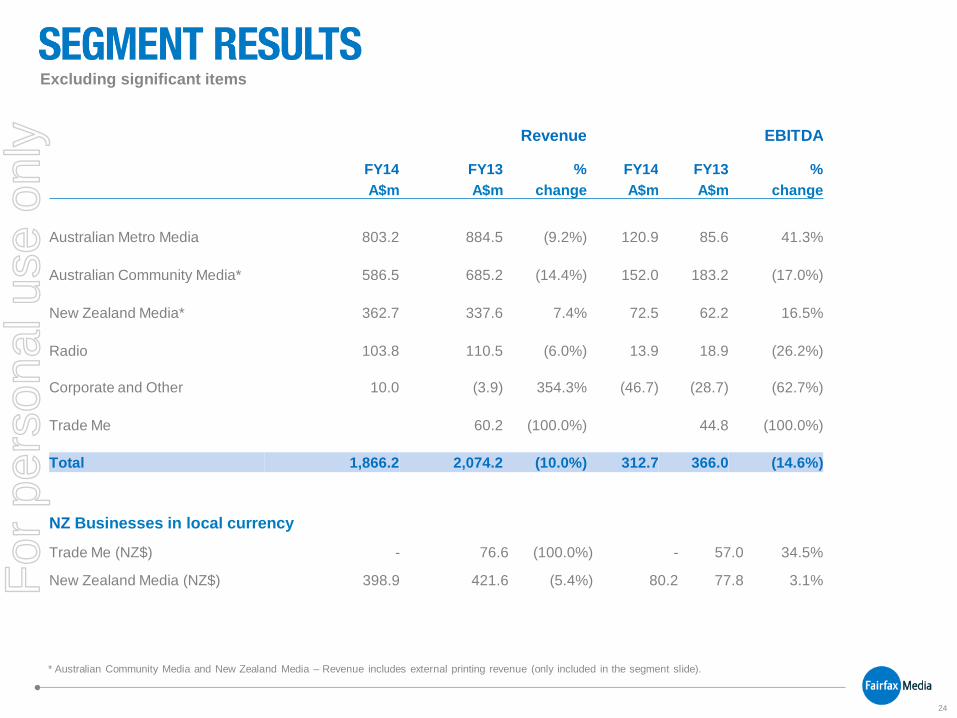
• Reported group EBITDA declined 14.6% but increased 1.8% on a continuing business basis.
• Group revenue declined 10% or 5.5% on a continuing business basis:
– Domain online revenues up 33%.
– Metropolitan Media revenues down 9.2% (down 6.3% like-for-like). H2 down 7.4%.
– New Zealand ($NZ) revenues down 5.4% (down 3.4% like-for-like). H2 down 4.0%.
– Australian Community Media revenues down 14.4% (down 10.7% like-for-like). H2 down 10.3%.
– Radio revenues down 6%. H2 down 10.9%.
• Early FY15 revenue run rate for Fairfax Media of 1-2% below prior year.
Excluding significant items
Revenue EBITDA
FY14 FY13 % FY14 FY13 %
A$m A$m change A$m A$m change
Australian Metro Media 803.2 884.5 (9.2%) 120.9 85.6 41.3%
Australian Community Media* 586.5 685.2 (14.4%) 152.0 183.2 (17.0%)
New Zealand Media* 362.7 337.6 7.4% 72.5 62.2 16.5%
Radio 103.8 110.5 (6.0%) 13.9 18.9 (26.2%)
Corporate and Other 10.0 (3.9) 354.3% (46.7) (28.7) (62.7%)
Trade Me 60.2 (100.0%) 44.8 (100.0%)
Total 1,866.2 2,074.2 (10.0%) 312.7 366.0 (14.6%)
* Australian Community Media and New Zealand Media – Revenue includes external printing revenue (only included in the segment slide).
For
per
sona
l use
onl
y
7
• Progress on new revenue initiatives:
– Digital subscriptions continuing to perform strongly (as at 11 August 2014):
• 140,000+ paid digital subscriptions for The Sydney Morning Herald and The Age.
• 111,000+ existing SMH/The Age print subscribers signed up for digital access.
– Marketing Services division created which includes the Content Marketing and Events businesses:
• The Events business is building on a solid portfolio and expanding into new geographic markets via
key platforms including Food and Sport.
• Content Marketing continues to attract significant interest from major corporations and has a strong
pipeline of activity.
– Our Data strategy is well progressed. We are in active discussions with potential partners as well as having
positive commercial discussions with a number of Australia’s largest advertisers.
– The Domain Group is expanding aggressively, increasing margins and accelerating its digital growth.
• Investment in additional sales and product capability.
• Premium depth products continue to drive Domain’s digital growth, up 61% year-on-year.
• Agent subscribers up 12% from a year ago, representing approximately 80% market penetration.
• Strategic acquisition of property data and mapping provider Property Data Solutions and announced
acquisition of Canberra’s leading real estate listings business Allhomes, subject to regulatory approval.
For
per
sona
l use
onl
y
8
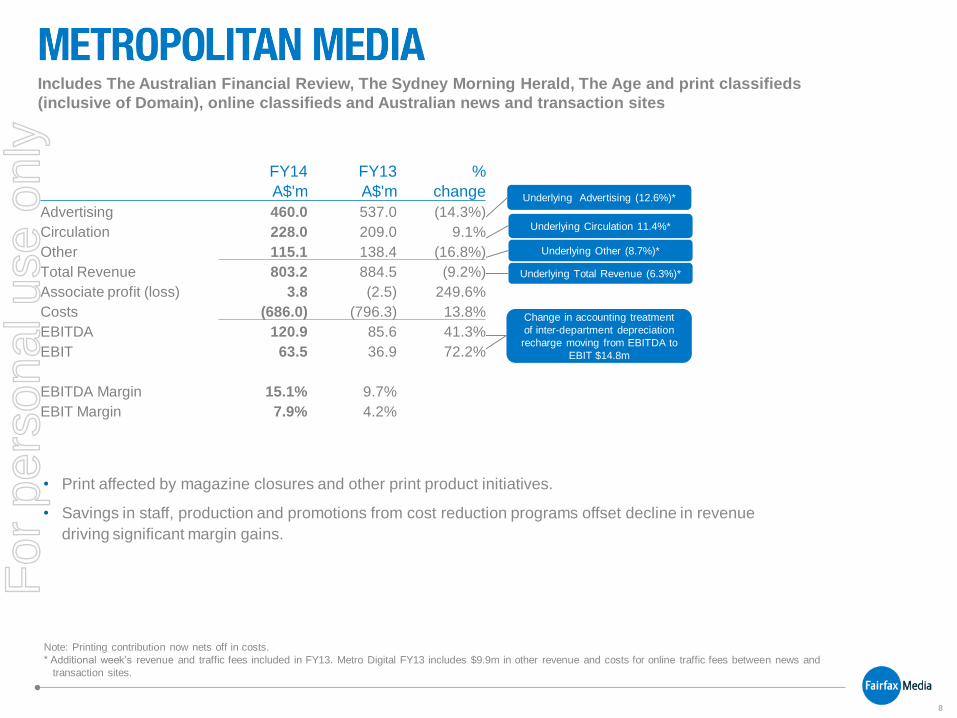
Underlying Advertising (12.6%)*
Underlying Circulation 11.4%*
Underlying Other (8.7%)*
Underlying Total Revenue (6.3%)*
Change in accounting treatment
of inter-department depreciation
recharge moving from EBITDA to
EBIT $14.8m
Note: Printing contribution now nets off in costs.
* Additional week’s revenue and traffic fees included in FY13. Metro Digital FY13 includes $9.9m in other revenue and costs for online traffic fees between news and
transaction sites.
Includes The Australian Financial Review, The Sydney Morning Herald, The Age and print classifieds
(inclusive of Domain), online classifieds and Australian news and transaction sites
• Print affected by magazine closures and other print product initiatives.
• Savings in staff, production and promotions from cost reduction programs offset decline in revenue
driving significant margin gains.
FY14 FY13 %
A$'m A$'m change
Advertising 460.0 537.0 (14.3%)
Circulation 228.0 209.0 9.1%
Other 115.1 138.4 (16.8%)
Total Revenue 803.2 884.5 (9.2%)
Associate profit (loss) 3.8 (2.5) 249.6%
Costs (686.0) (796.3) 13.8%
EBITDA 120.9 85.6 41.3%
EBIT 63.5 36.9 72.2%
EBITDA Margin 15.1% 9.7%
EBIT Margin 7.9% 4.2%
For
per
sona
l use
onl
y
9
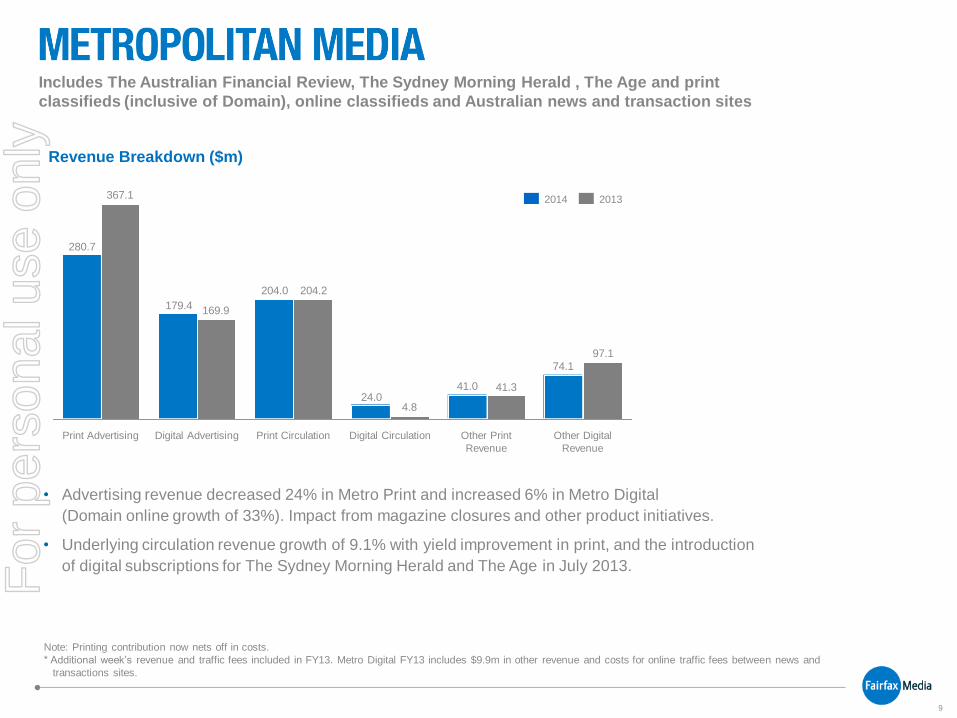
74.1
41.024.0
204.0
179.4
280.7
97.1
41.3
4.8
204.2
169.9
367.1 2014 2013
Print Advertising Digital Circulation Digital Advertising Other Print
Revenue
Print Circulation Other Digital
Revenue
Includes The Australian Financial Review, The Sydney Morning Herald , The Age and print
classifieds (inclusive of Domain), online classifieds and Australian news and transaction sites
Note: Printing contribution now nets off in costs.
* Additional week’s revenue and traffic fees included in FY13. Metro Digital FY13 includes $9.9m in other revenue and costs for online traffic fees between news and
transactions sites.
• Advertising revenue decreased 24% in Metro Print and increased 6% in Metro Digital
(Domain online growth of 33%). Impact from magazine closures and other product initiatives.
• Underlying circulation revenue growth of 9.1% with yield improvement in print, and the introduction
of digital subscriptions for The Sydney Morning Herald and The Age in July 2013.
Revenue Breakdown ($m)
For
per
sona
l use
onl
y
10
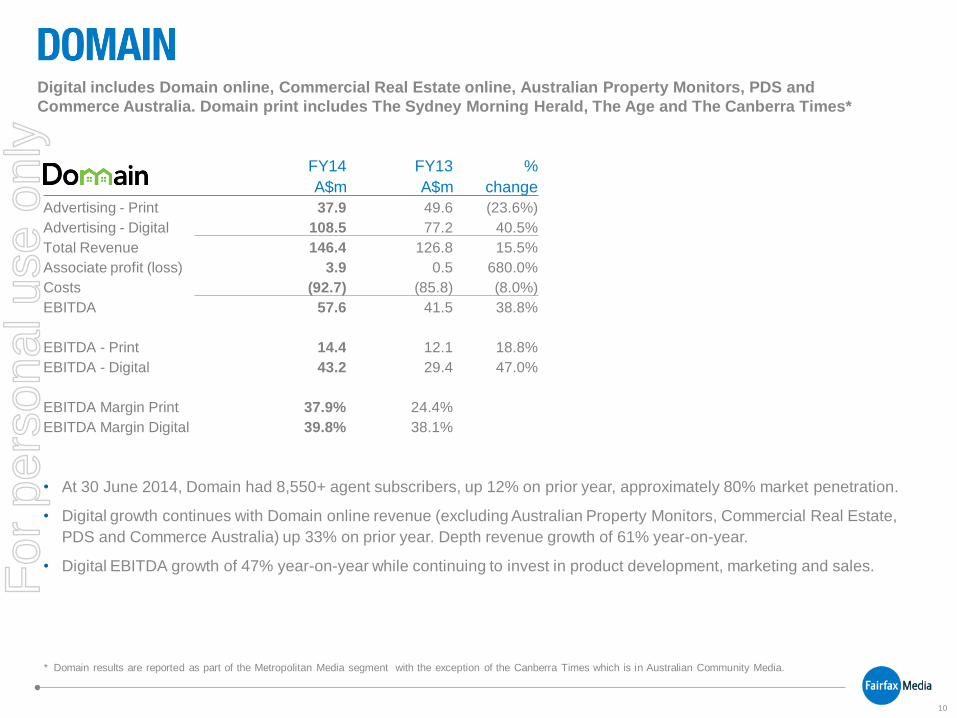
FY14 FY13 %
A$m A$m change
Advertising - Print 37.9 49.6 (23.6%)
Advertising - Digital 108.5 77.2 40.5%
Total Revenue 146.4 126.8 15.5%
Associate profit (loss) 3.9 0.5 680.0%
Costs (92.7) (85.8) (8.0%)
EBITDA 57.6 41.5 38.8%
EBITDA - Print 14.4 12.1 18.8%
EBITDA - Digital 43.2 29.4 47.0%
EBITDA Margin Print 37.9% 24.4%
EBITDA Margin Digital 39.8% 38.1%
• At 30 June 2014, Domain had 8,550+ agent subscribers, up 12% on prior year, approximately 80% market penetration.
• Digital growth continues with Domain online revenue (excluding Australian Property Monitors, Commercial Real Estate,
PDS and Commerce Australia) up 33% on prior year. Depth revenue growth of 61% year-on-year.
• Digital EBITDA growth of 47% year-on-year while continuing to invest in product development, marketing and sales.
Digital includes Domain online, Commercial Real Estate online, Australian Property Monitors, PDS and
Commerce Australia. Domain print includes The Sydney Morning Herald, The Age and The Canberra Times*
* Domain results are reported as part of the Metropolitan Media segment with the exception of the Canberra Times which is in Australian Community Media.
For
per
sona
l use
onl
y
11
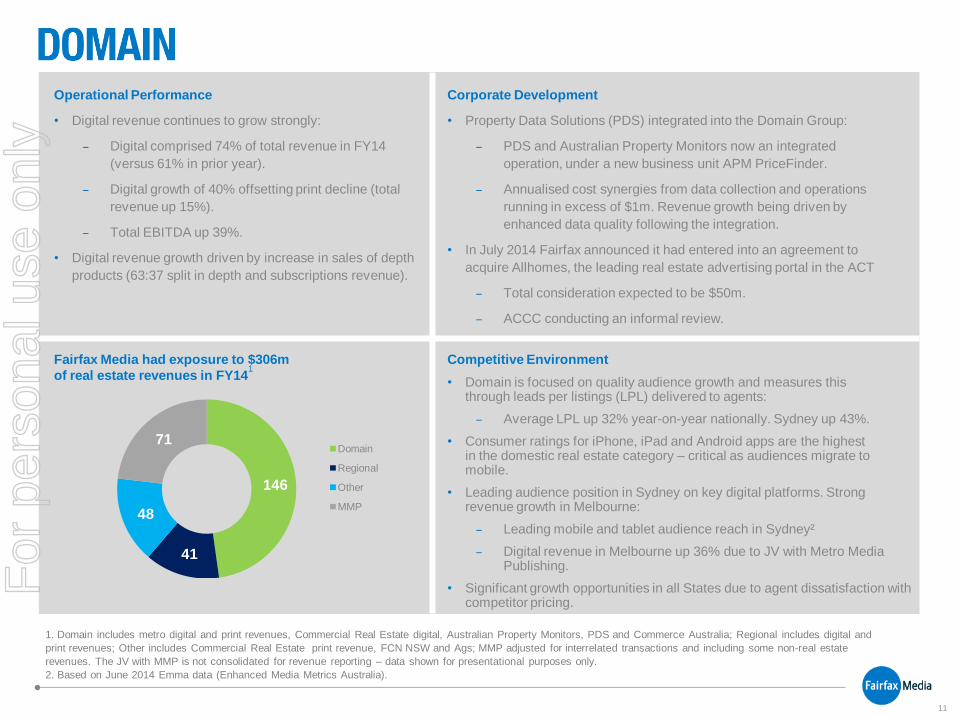
Operational Performance
• Digital revenue continues to grow strongly:
− Digital comprised 74% of total revenue in FY14
(versus 61% in prior year).
− Digital growth of 40% offsetting print decline (total
revenue up 15%).
− Total EBITDA up 39%.
• Digital revenue growth driven by increase in sales of depth
products (63:37 split in depth and subscriptions revenue).
Corporate Development
• Property Data Solutions (PDS) integrated into the Domain Group:
− PDS and Australian Property Monitors now an integrated
operation, under a new business unit APM PriceFinder.
− Annualised cost synergies from data collection and operations
running in excess of $1m. Revenue growth being driven by
enhanced data quality following the integration.
• In July 2014 Fairfax announced it had entered into an agreement to
acquire Allhomes, the leading real estate advertising portal in the ACT
− Total consideration expected to be $50m.
− ACCC conducting an informal review.
Fairfax Media had exposure to $306m
of real estate revenues in FY141
Competitive Environment
• Domain is focused on quality audience growth and measures this through leads per listings (LPL) delivered to agents:
− Average LPL up 32% year-on-year nationally. Sydney up 43%.
• Consumer ratings for iPhone, iPad and Android apps are the highest in the domestic real estate category – critical as audiences migrate to mobile.
• Leading audience position in Sydney on key digital platforms. Strong revenue growth in Melbourne:
− Leading mobile and tablet audience reach in Sydney²
− Digital revenue in Melbourne up 36% due to JV with Metro Media Publishing.
• Significant growth opportunities in all States due to agent dissatisfaction with competitor pricing.
146
41
48
71 Domain
Regional
Other
MMP
1. Domain includes metro digital and print revenues, Commercial Real Estate digital, Australian Property Monitors, PDS and Commerce Australia; Regional includes digital and
print revenues; Other includes Commercial Real Estate print revenue, FCN NSW and Ags; MMP adjusted for interrelated transactions and including some non-real estate
revenues. The JV with MMP is not consolidated for revenue reporting – data shown for presentational purposes only.
2. Based on June 2014 Emma data (Enhanced Media Metrics Australia).
For
per
sona
l use
onl
y
12
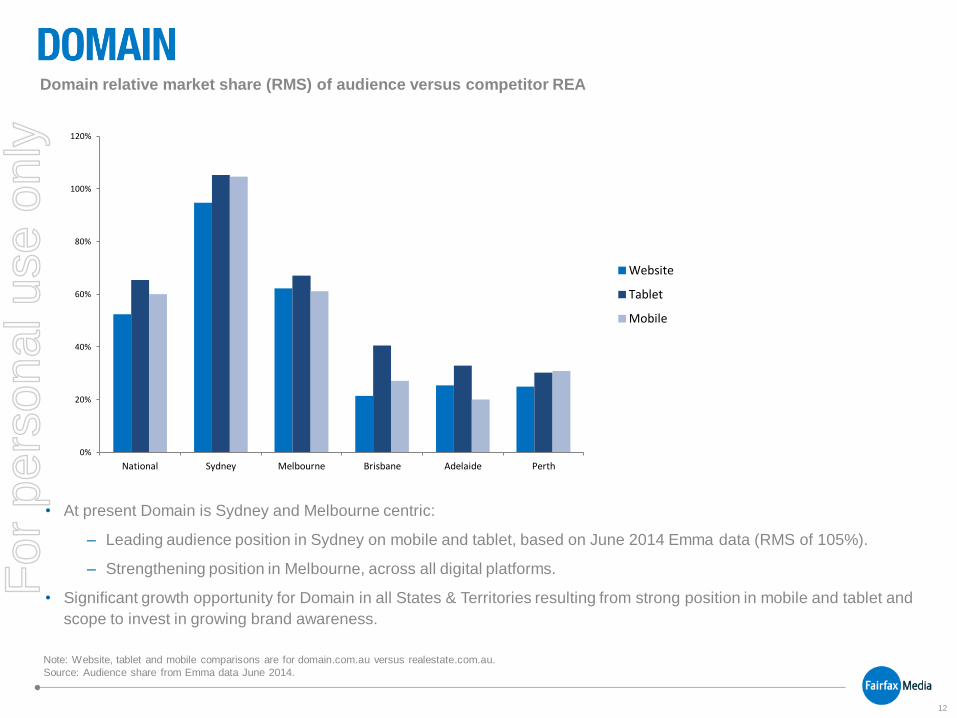
• At present Domain is Sydney and Melbourne centric:
– Leading audience position in Sydney on mobile and tablet, based on June 2014 Emma data (RMS of 105%).
– Strengthening position in Melbourne, across all digital platforms.
• Significant growth opportunity for Domain in all States & Territories resulting from strong position in mobile and tablet and
scope to invest in growing brand awareness.
Note: Website, tablet and mobile comparisons are for domain.com.au versus realestate.com.au.
Source: Audience share from Emma data June 2014.
Domain relative market share (RMS) of audience versus competitor REA
0%
20%
40%
60%
80%
100%
120%
National Sydney Melbourne Brisbane Adelaide Perth
Website
Tablet
Mobile
For
per
sona
l use
onl
y
13
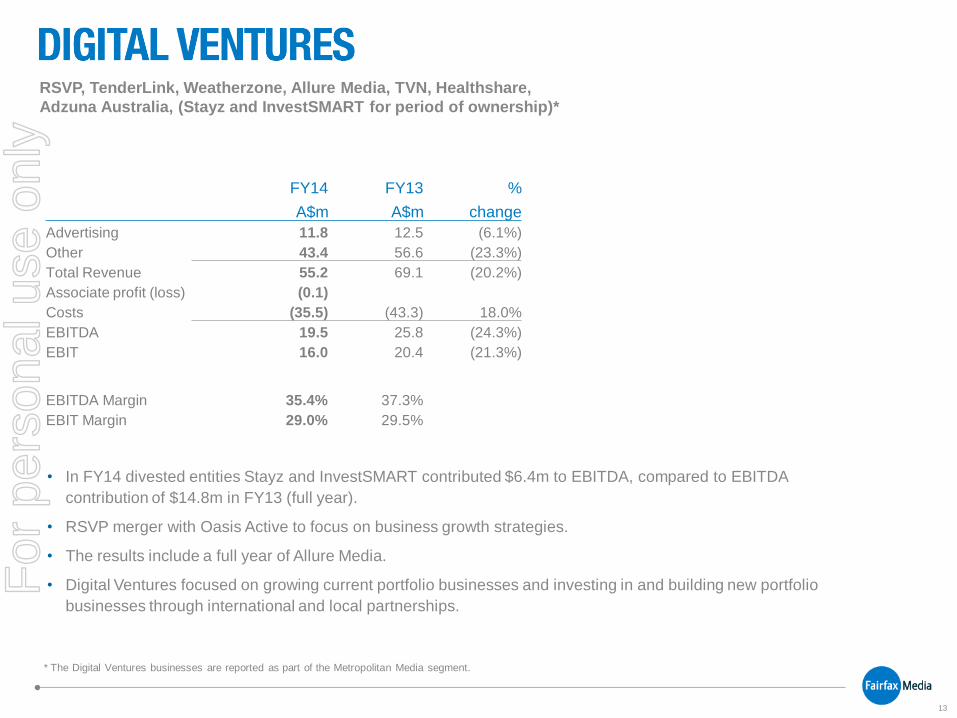
RSVP, TenderLink, Weatherzone, Allure Media, TVN, Healthshare,
Adzuna Australia, (Stayz and InvestSMART for period of ownership)*
• In FY14 divested entities Stayz and InvestSMART contributed $6.4m to EBITDA, compared to EBITDA
contribution of $14.8m in FY13 (full year).
• RSVP merger with Oasis Active to focus on business growth strategies.
• The results include a full year of Allure Media.
• Digital Ventures focused on growing current portfolio businesses and investing in and building new portfolio
businesses through international and local partnerships.
* The Digital Ventures businesses are reported as part of the Metropolitan Media segment.
FY14 FY13 %
A$m A$m change
Advertising 11.8 12.5 (6.1%)
Other 43.4 56.6 (23.3%)
Total Revenue 55.2 69.1 (20.2%)
Associate profit (loss) (0.1)
Costs (35.5) (43.3) 18.0%
EBITDA 19.5 25.8 (24.3%)
EBIT 16.0 20.4 (21.3%)
EBITDA Margin 35.4% 37.3%
EBIT Margin 29.0% 29.5%
For
per
sona
l use
onl
y
14
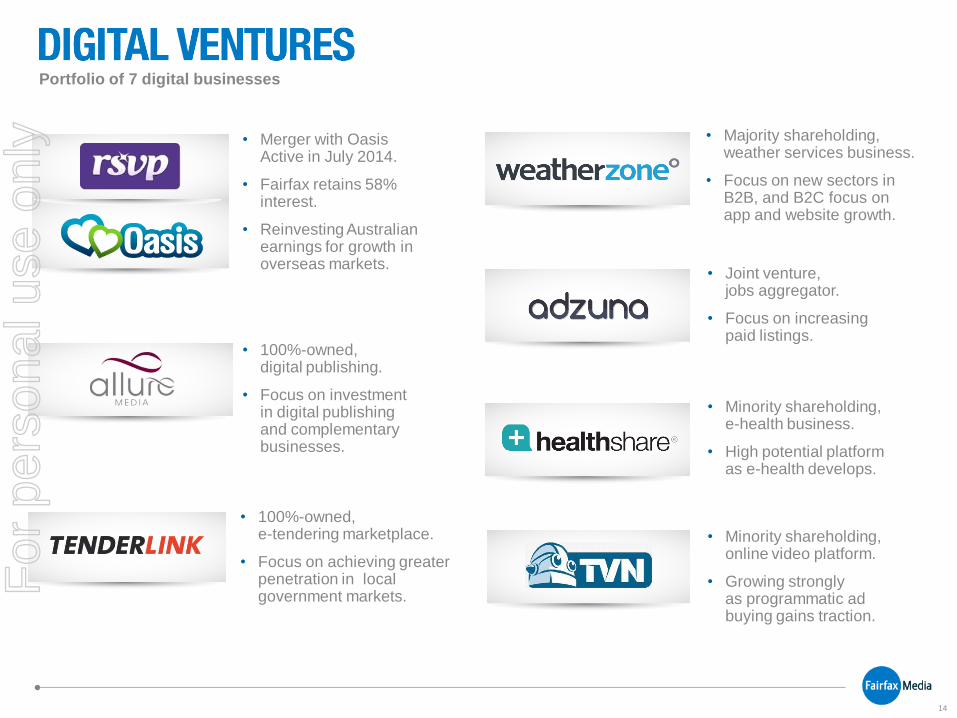
Portfolio of 7 digital businesses
• Merger with Oasis Active in July 2014.
• Fairfax retains 58% interest.
• Reinvesting Australian earnings for growth in overseas markets.
• 100%-owned, digital publishing.
• Focus on investment in digital publishing and complementary businesses.
• 100%-owned, e-tendering marketplace.
• Focus on achieving greater penetration in local government markets.
• Majority shareholding, weather services business.
• Focus on new sectors in B2B, and B2C focus on app and website growth.
• Joint venture, jobs aggregator.
• Focus on increasing paid listings.
• Minority shareholding, e-health business.
• High potential platform as e-health develops.
• Minority shareholding, online video platform.
• Growing strongly as programmatic ad buying gains traction.
For
per
sona
l use
onl
y
15
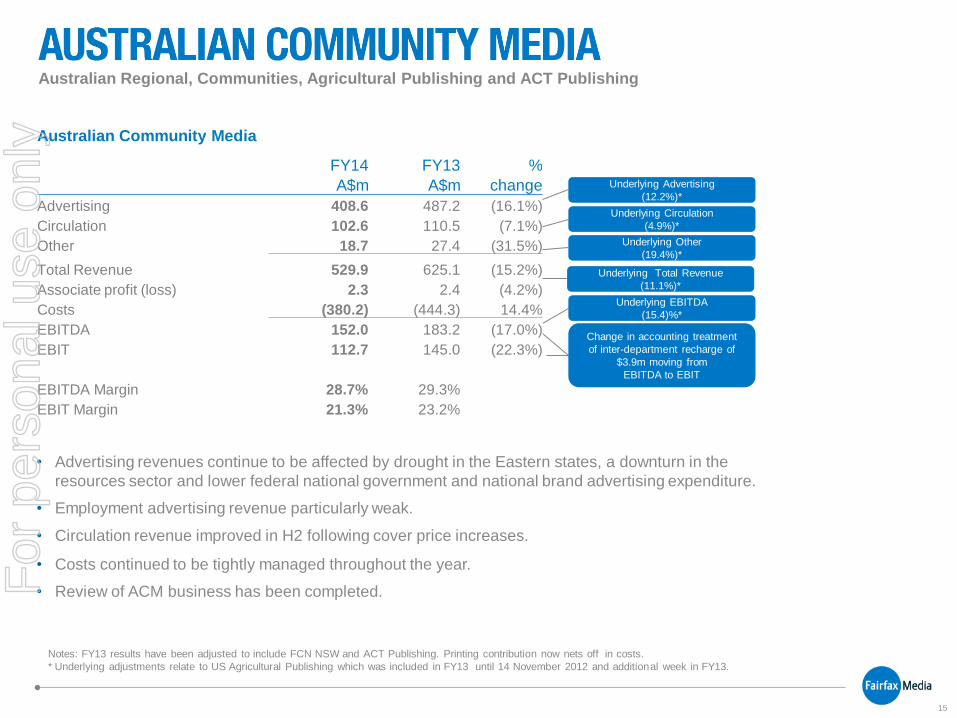
Australian Regional, Communities, Agricultural Publishing and ACT Publishing
Underlying Total Revenue
(11.1%)*
Notes: FY13 results have been adjusted to include FCN NSW and ACT Publishing. Printing contribution now nets off in costs.
* Underlying adjustments relate to US Agricultural Publishing which was included in FY13 until 14 November 2012 and additional week in FY13.
Change in accounting treatment
of inter-department recharge of
$3.9m moving from
EBITDA to EBIT
Underlying Advertising
(12.2%)*
Underlying Circulation
(4.9%)*
Underlying EBITDA
(15.4)%*
• Advertising revenues continue to be affected by drought in the Eastern states, a downturn in the
resources sector and lower federal national government and national brand advertising expenditure.
• Employment advertising revenue particularly weak.
• Circulation revenue improved in H2 following cover price increases.
• Costs continued to be tightly managed throughout the year.
• Review of ACM business has been completed.
Underlying Other
(19.4%)*
Australian Community Media
FY14 FY13 %
A$m A$m change
Advertising 408.6 487.2 (16.1%)
Circulation 102.6 110.5 (7.1%)
Other 18.7 27.4 (31.5%)
Total Revenue 529.9 625.1 (15.2%)
Associate profit (loss) 2.3 2.4 (4.2%)
Costs (380.2) (444.3) 14.4%
EBITDA 152.0 183.2 (17.0%)
EBIT 112.7 145.0 (22.3%)
EBITDA Margin 28.7% 29.3%
EBIT Margin 21.3% 23.2%
For
per
sona
l use
onl
y
16
• ACM comprises more than 150 newspapers and websites in hundreds of local communities:
– Print audience of 2.2 million readers*.
– Online audience of 1.4 million*.
• A flatter and simplified management structure will be in place by October 2014 for the ACM group,
bringing together Fairfax Regional Media, Agricultural Media, Fairfax Community Media, Newcastle,
Canberra and Illawarra.
• Program anticipated to deliver annualised savings of around $40m by 2016. There is a one-off cost
of $40m in FY15 involved in achieving these savings.
• New structure and model is not about closing mastheads or leaving markets. Changes will sustain
and strengthen the ACM business.
• Limited consolidation of mastheads and product changes in markets where there is significant overlap
of readership.
• Maintaining strong local content and sales capability is an absolute priority.
* Emma June 2014.
For
per
sona
l use
onl
y
17
• Phased introduction of new operating model over 12 to 18 months to:
– Deliver our journalism in the most effective ways possible;
– Respond to changes in audience habits;
– Reduce duplication and cost;
– Achieve operational efficiencies;
– Drive consistency across the business;
– Grow digital revenue streams; and
– Build out our advertising network.
• Greater use of Shared Services for support functions such as Finance,
IT, Circulation & Distribution and Human Resources.
• Detailed implementation plans will be developed in consultation with mastheads.
For
per
sona
l use
onl
y
18
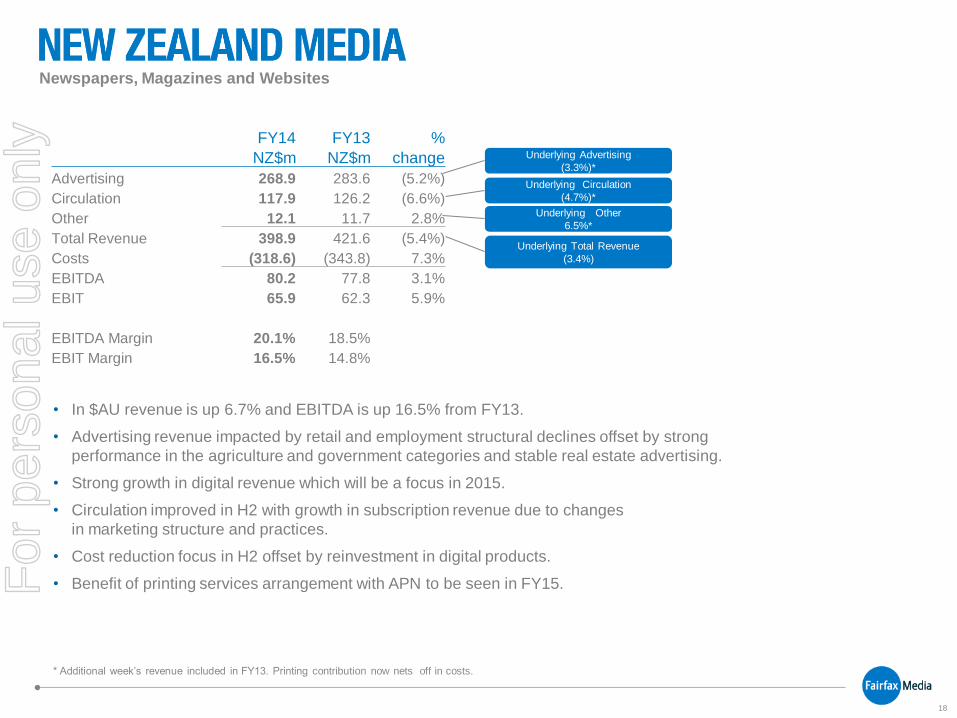
Newspapers, Magazines and Websites
• In $AU revenue is up 6.7% and EBITDA is up 16.5% from FY13.
• Advertising revenue impacted by retail and employment structural declines offset by strong
performance in the agriculture and government categories and stable real estate advertising.
• Strong growth in digital revenue which will be a focus in 2015.
• Circulation improved in H2 with growth in subscription revenue due to changes
in marketing structure and practices.
• Cost reduction focus in H2 offset by reinvestment in digital products.
• Benefit of printing services arrangement with APN to be seen in FY15.
Underlying Total Revenue
(3.4%)
* Additional week’s revenue included in FY13. Printing contribution now nets off in costs.
FY14 FY13 %
NZ$m NZ$m change
Advertising 268.9 283.6 (5.2%)
Circulation 117.9 126.2 (6.6%)
Other 12.1 11.7 2.8%
Total Revenue 398.9 421.6 (5.4%)
Costs (318.6) (343.8) 7.3%
EBITDA 80.2 77.8 3.1%
EBIT 65.9 62.3 5.9%
EBITDA Margin 20.1% 18.5%
EBIT Margin 16.5% 14.8%
Underlying Advertising
(3.3%)*
Underlying Circulation
(4.7%)*
Underlying Other
6.5%*
For
per
sona
l use
onl
y
19
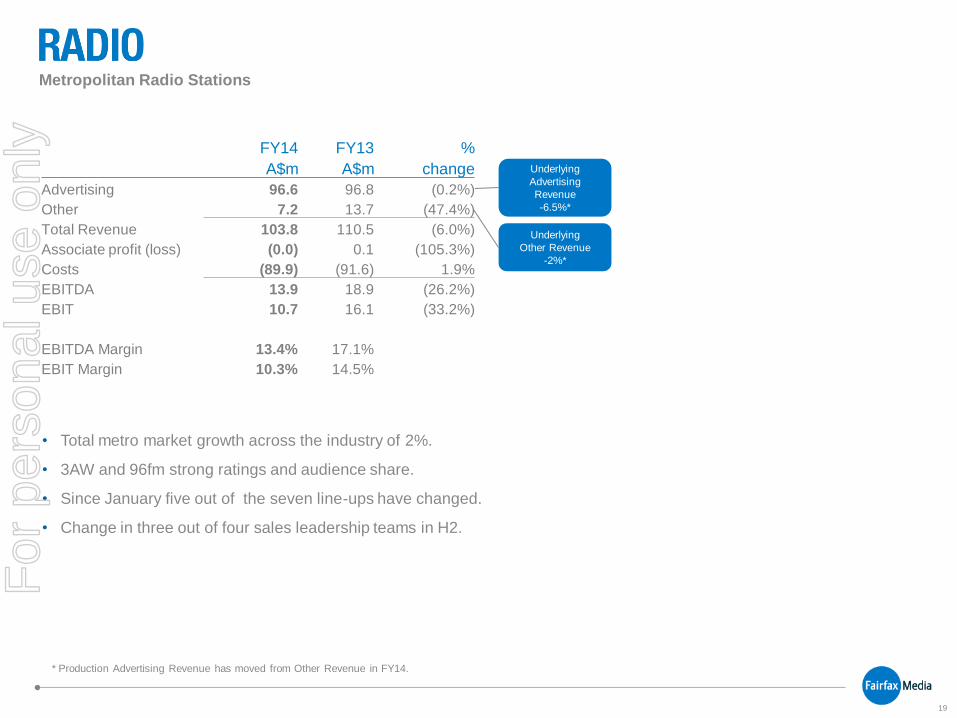
Metropolitan Radio Stations
• Total metro market growth across the industry of 2%.
• 3AW and 96fm strong ratings and audience share.
• Since January five out of the seven line-ups have changed.
• Change in three out of four sales leadership teams in H2.
Underlying
Advertising
Revenue
-6.5%*
FY14 FY13 %
A$m A$m change
Advertising 96.6 96.8 (0.2%)
Other 7.2 13.7 (47.4%)
Total Revenue 103.8 110.5 (6.0%)
Associate profit (loss) (0.0) 0.1 (105.3%)
Costs (89.9) (91.6) 1.9%
EBITDA 13.9 18.9 (26.2%)
EBIT 10.7 16.1 (33.2%)
EBITDA Margin 13.4% 17.1%
EBIT Margin 10.3% 14.5%
* Production Advertising Revenue has moved from Other Revenue in FY14.
Underlying
Other Revenue
-2%*
For
per
sona
l use
onl
y

20
For
per
sona
l use
onl
y
21
• Trading in the first five weeks of FY15 H1 saw revenues 1-2% below last year.
• We continue to identify further opportunity for operational cost savings.
For
per
sona
l use
onl
y

22
For
per
sona
l use
onl
y
23
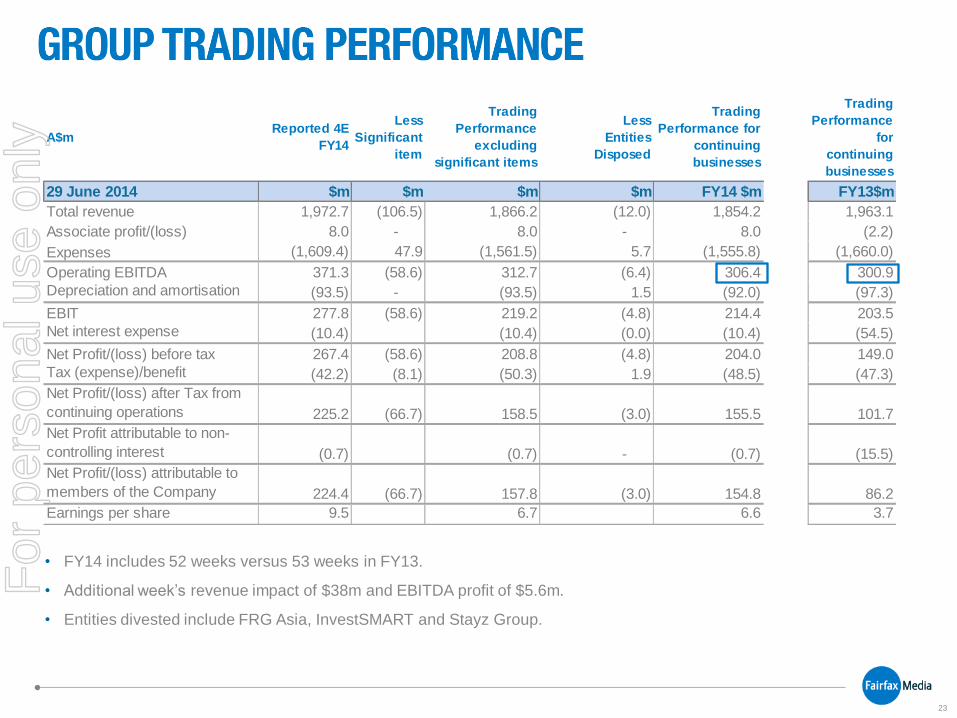
A$mReported 4E
FY14
Less
Significant
item
Trading
Performance
excluding
significant items
Less
Entities
Disposed
Trading
Performance for
continuing
businesses
Trading
Performance
for
continuing
businesses
29 June 2014 $m $m $m $m FY14 $m FY13$m
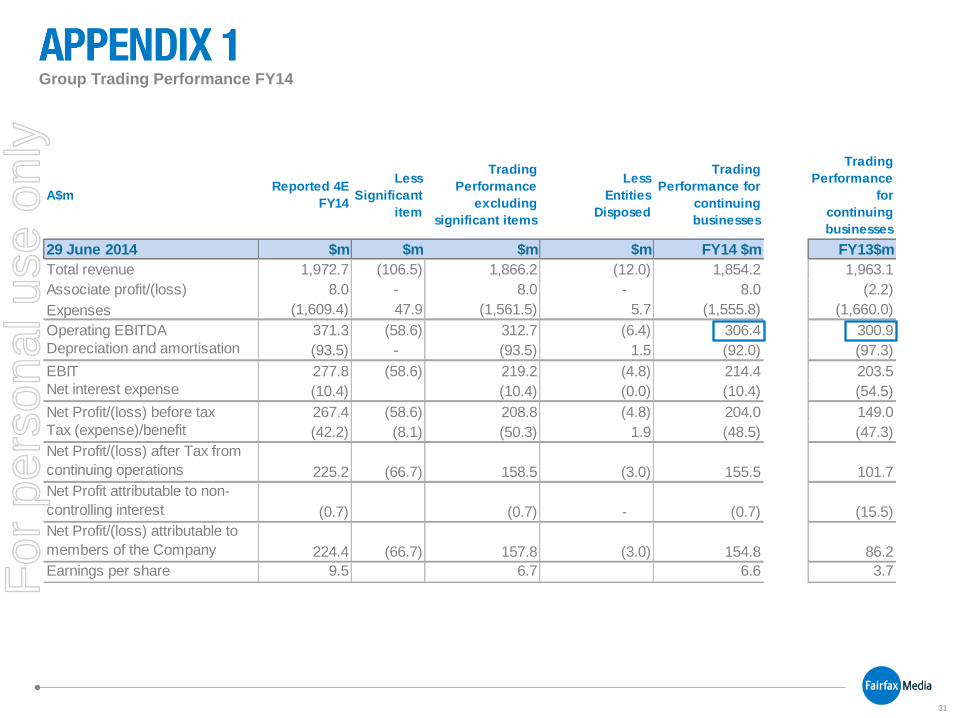
Total revenue 1,972.7 (106.5) 1,866.2 (12.0) 1,854.2 1,963.1
Associate profit/(loss) 8.0 - 8.0 - 8.0 (2.2)
Expenses (1,609.4) 47.9 (1,561.5) 5.7 (1,555.8) (1,660.0)
Operating EBITDA 371.3 (58.6) 312.7 (6.4) 306.4 300.9
Depreciation and amortisation (93.5) - (93.5) 1.5 (92.0) (97.3)
EBIT 277.8 (58.6) 219.2 (4.8) 214.4 203.5
Net interest expense (10.4) (10.4) (0.0) (10.4) (54.5)
Net Profit/(loss) before tax 267.4 (58.6) 208.8 (4.8) 204.0 149.0
Tax (expense)/benefit (42.2) (8.1) (50.3) 1.9 (48.5) (47.3)
Net Profit/(loss) after Tax from
continuing operations 225.2 (66.7) 158.5 (3.0) 155.5 101.7
Net Profit attributable to non-
controlling interest (0.7) (0.7) - (0.7) (15.5)
Net Profit/(loss) attributable to
members of the Company 224.4 (66.7) 157.8 (3.0) 154.8 86.2
Earnings per share 9.5 6.7 6.6 3.7
• FY14 includes 52 weeks versus 53 weeks in FY13.
• Additional week’s revenue impact of $38m and EBITDA profit of $5.6m.
• Entities divested include FRG Asia, InvestSMART and Stayz Group.
For
per
sona
l use
onl
y
24
* Australian Community Media and New Zealand Media – Revenue includes external printing revenue (only included in the segment slide).
NZ Businesses in local currency
Trade Me (NZ$) - 76.6 (100.0%) - 57.0 34.5%
New Zealand Media (NZ$) 398.9 421.6 (5.4%) 80.2 77.8 3.1%
Excluding significant items
Revenue EBITDA
FY14 FY13 % FY14 FY13 %
A$m A$m change A$m A$m change
Australian Metro Media 803.2 884.5 (9.2%) 120.9 85.6 41.3%
Australian Community Media* 586.5 685.2 (14.4%) 152.0 183.2 (17.0%)
New Zealand Media* 362.7 337.6 7.4% 72.5 62.2 16.5%
Radio 103.8 110.5 (6.0%) 13.9 18.9 (26.2%)
Corporate and Other 10.0 (3.9) 354.3% (46.7) (28.7) (62.7%)
Trade Me 60.2 (100.0%) 44.8 (100.0%)
Total 1,866.2 2,074.2 (10.0%) 312.7 366.0 (14.6%)
For
per
sona
l use
onl
y
25
• Since commencing our Fairfax of the Future three-year transformation program in February 2012 we
have continued to exceed in delivering against our cost-out targets:
– FY15 targeted annualised savings of $311m.
– Further operational cost savings will take place outside this program.
• Net costs to deliver the Fairfax of the Future program through FY15 are expected to be about $290m:
– Cash redundancy costs of $245m.
– Capital expenditure of $86m.
– Operational expenditure of $25m.
– Costs offset by expected sale proceeds from legacy print sites and other surplus property.
For
per
sona
l use
onl
y
26
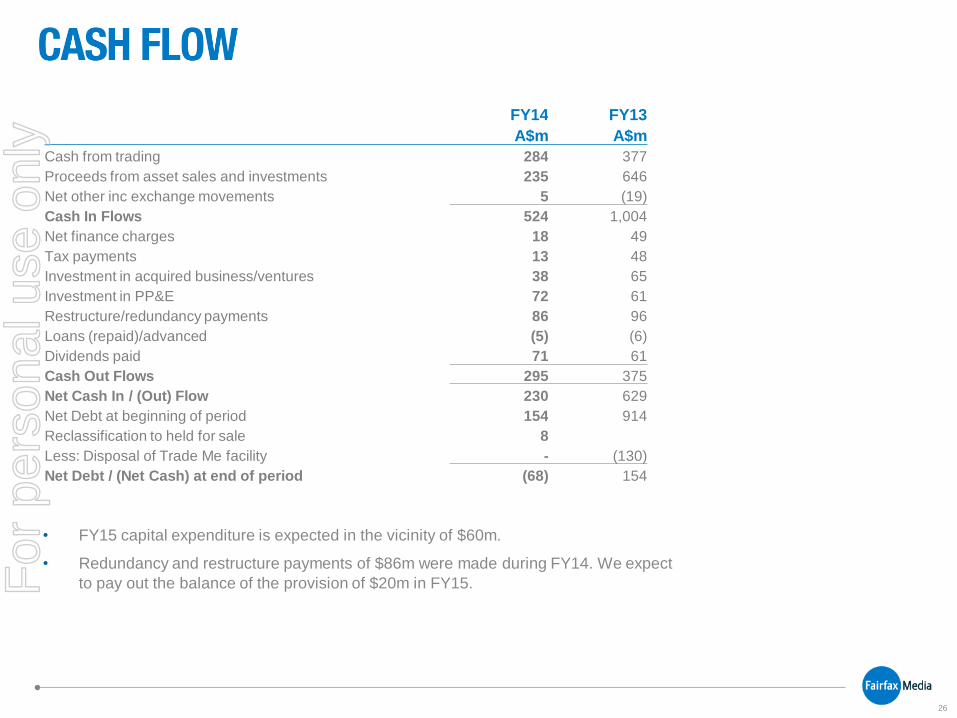
FY14 FY13
A$m A$m
Cash from trading 284 377
Proceeds from asset sales and investments 235 646
Net other inc exchange movements 5 (19)
Cash In Flows 524 1,004
Net finance charges 18 49
Tax payments 13 48
Investment in acquired business/ventures 38 65
Investment in PP&E 72 61
Restructure/redundancy payments 86 96
Loans (repaid)/advanced (5) (6)
Dividends paid 71 61
Cash Out Flows 295 375
Net Cash In / (Out) Flow 230 629
Net Debt at beginning of period 154 914
Reclassification to held for sale 8
Less: Disposal of Trade Me facility - (130)
Net Debt / (Net Cash) at end of period (68) 154
• FY15 capital expenditure is expected in the vicinity of $60m.
• Redundancy and restructure payments of $86m were made during FY14. We expect
to pay out the balance of the provision of $20m in FY15.
For
per
sona
l use
onl
y
27
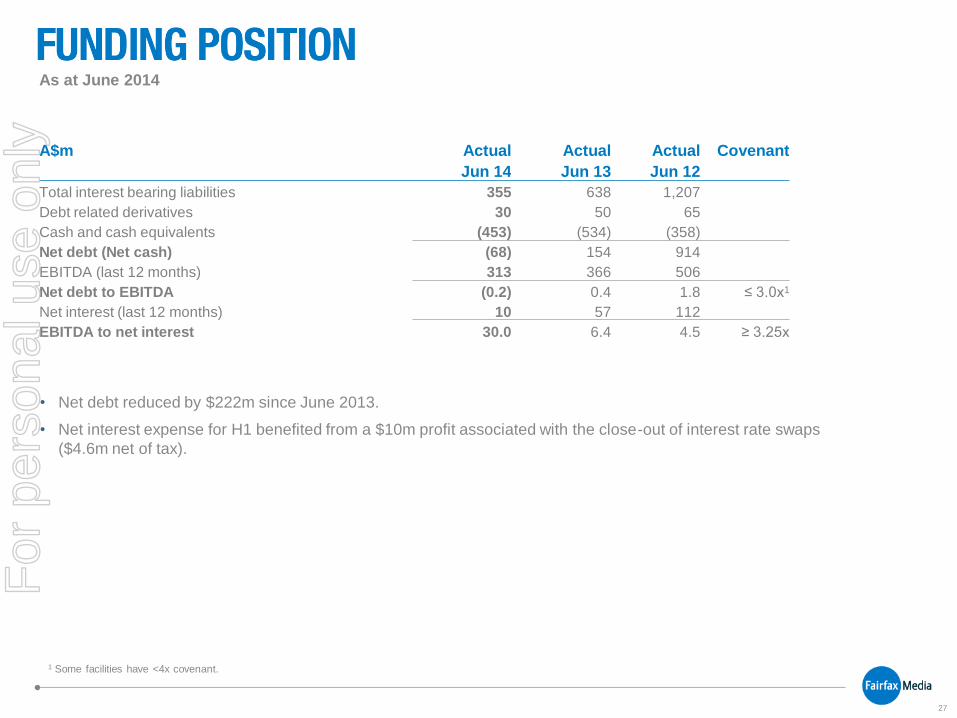
• Net debt reduced by $222m since June 2013.
• Net interest expense for H1 benefited from a $10m profit associated with the close-out of interest rate swaps
($4.6m net of tax).
A$m Actual Actual Actual Covenant
Jun 14 Jun 13 Jun 12
Total interest bearing liabilities 355 638 1,207
Debt related derivatives 30 50 65
Cash and cash equivalents (453) (534) (358)
Net debt (Net cash) (68) 154 914
EBITDA (last 12 months) 313 366 506
Net debt to EBITDA (0.2) 0.4 1.8 ≤ 3.0x1
Net interest (last 12 months) 10 57 112
EBITDA to net interest 30.0 6.4 4.5 ≥ 3.25x
As at June 2014
1 Some facilities have <4x covenant.
For
per
sona
l use
onl
y
28
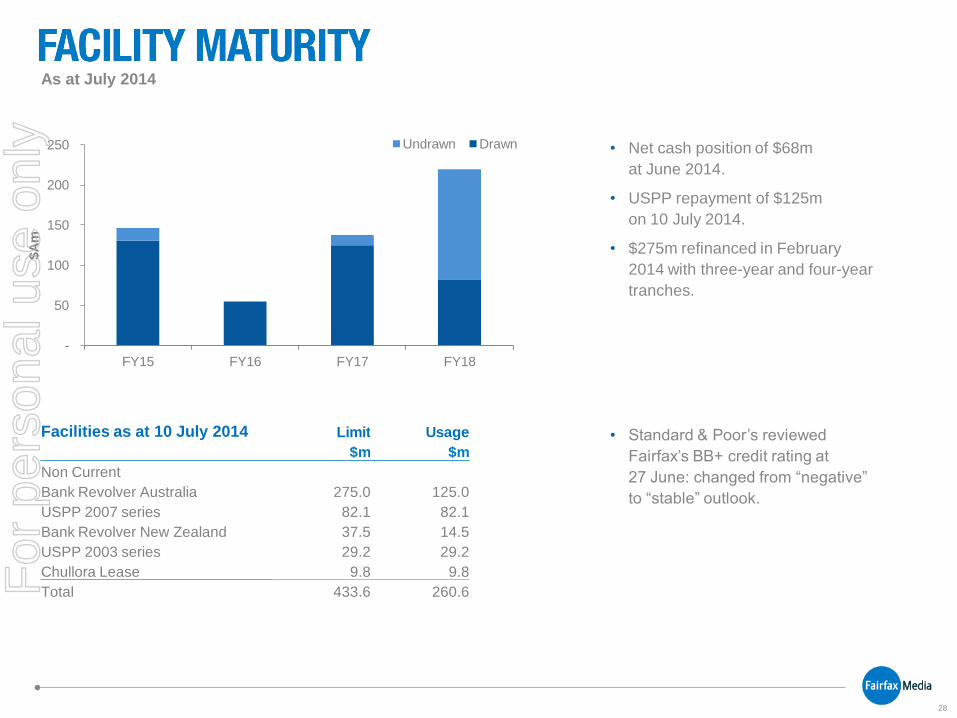
• Net cash position of $68m
at June 2014.
• USPP repayment of $125m
on 10 July 2014.
• $275m refinanced in February
2014 with three-year and four-year
tranches.
• Standard & Poor’s reviewed
Fairfax’s BB+ credit rating at
27 June: changed from “negative”
to “stable” outlook.
As at July 2014
Facilities as at 10 July 2014 Limit Usage
$m $m
Non Current
Bank Revolver Australia 275.0 125.0
USPP 2007 series 82.1 82.1
Bank Revolver New Zealand 37.5 14.5
USPP 2003 series 29.2 29.2
Chullora Lease 9.8 9.8
Total 433.6 260.6
-
50
100
150
200
250
FY15 FY16 FY17 FY18
$A
m
Undrawn Drawn
For
per
sona
l use
onl
y

29
For
per
sona
l use
onl
y

30
For
per
sona
l use
onl
y
31
A$mReported 4E
FY14
Less
Significant
item
Trading
Performance
excluding
significant items
Less
Entities
Disposed
Trading
Performance for
continuing
businesses
Trading
Performance
for
continuing
businesses
29 June 2014 $m $m $m $m FY14 $m FY13$m
Total revenue 1,972.7 (106.5) 1,866.2 (12.0) 1,854.2 1,963.1
Associate profit/(loss) 8.0 - 8.0 - 8.0 (2.2)
Expenses (1,609.4) 47.9 (1,561.5) 5.7 (1,555.8) (1,660.0)
Operating EBITDA 371.3 (58.6) 312.7 (6.4) 306.4 300.9
Depreciation and amortisation (93.5) - (93.5) 1.5 (92.0) (97.3)
EBIT 277.8 (58.6) 219.2 (4.8) 214.4 203.5
Net interest expense (10.4) (10.4) (0.0) (10.4) (54.5)
Net Profit/(loss) before tax 267.4 (58.6) 208.8 (4.8) 204.0 149.0
Tax (expense)/benefit (42.2) (8.1) (50.3) 1.9 (48.5) (47.3)
Net Profit/(loss) after Tax from
continuing operations 225.2 (66.7) 158.5 (3.0) 155.5 101.7
Net Profit attributable to non-
controlling interest (0.7) (0.7) - (0.7) (15.5)
Net Profit/(loss) attributable to
members of the Company 224.4 (66.7) 157.8 (3.0) 154.8 86.2
Earnings per share 9.5 6.7 6.6 3.7
Group Trading Performance FY14
For
per
sona
l use
onl
y
32
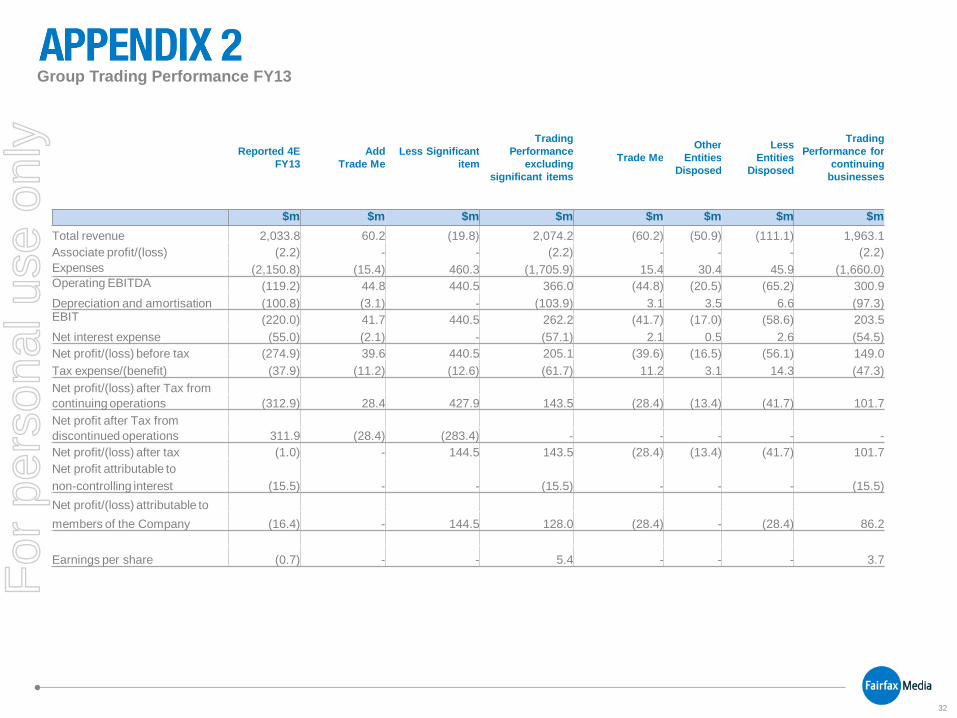
Group Trading Performance FY13
Reported 4E
FY13
Add
Trade Me
Less Significant
item
Trading
Performance
excluding
significant items
Trade Me
Other
Entities
Disposed
Less
Entities
Disposed
Trading
Performance for
continuing
businesses
$m $m $m $m $m $m $m $m
Total revenue 2,033.8 60.2 (19.8) 2,074.2 (60.2) (50.9) (111.1) 1,963.1
Associate profit/(loss) (2.2) - - (2.2) - - - (2.2)
Expenses (2,150.8) (15.4) 460.3 (1,705.9) 15.4 30.4 45.9 (1,660.0) Operating EBITDA (119.2) 44.8 440.5 366.0 (44.8) (20.5) (65.2) 300.9
Depreciation and amortisation (100.8) (3.1) - (103.9) 3.1 3.5 6.6 (97.3) EBIT (220.0) 41.7 440.5 262.2 (41.7) (17.0) (58.6) 203.5
Net interest expense (55.0) (2.1) - (57.1) 2.1 0.5 2.6 (54.5)
Net profit/(loss) before tax (274.9) 39.6 440.5 205.1 (39.6) (16.5) (56.1) 149.0
Tax expense/(benefit) (37.9) (11.2) (12.6) (61.7) 11.2 3.1 14.3 (47.3)
Net profit/(loss) after Tax from
continuing operations (312.9) 28.4 427.9 143.5 (28.4) (13.4) (41.7) 101.7
Net profit after Tax from
discontinued operations 311.9 (28.4) (283.4) - - - - -
Net profit/(loss) after tax (1.0) - 144.5 143.5 (28.4) (13.4) (41.7) 101.7
Net profit attributable to
non-controlling interest (15.5) - - (15.5) - - - (15.5)
Net profit/(loss) attributable to
members of the Company (16.4) - 144.5 128.0 (28.4) - (28.4) 86.2
Earnings per share (0.7) - - 5.4 - - - 3.7
For
per
sona
l use
onl
y
33
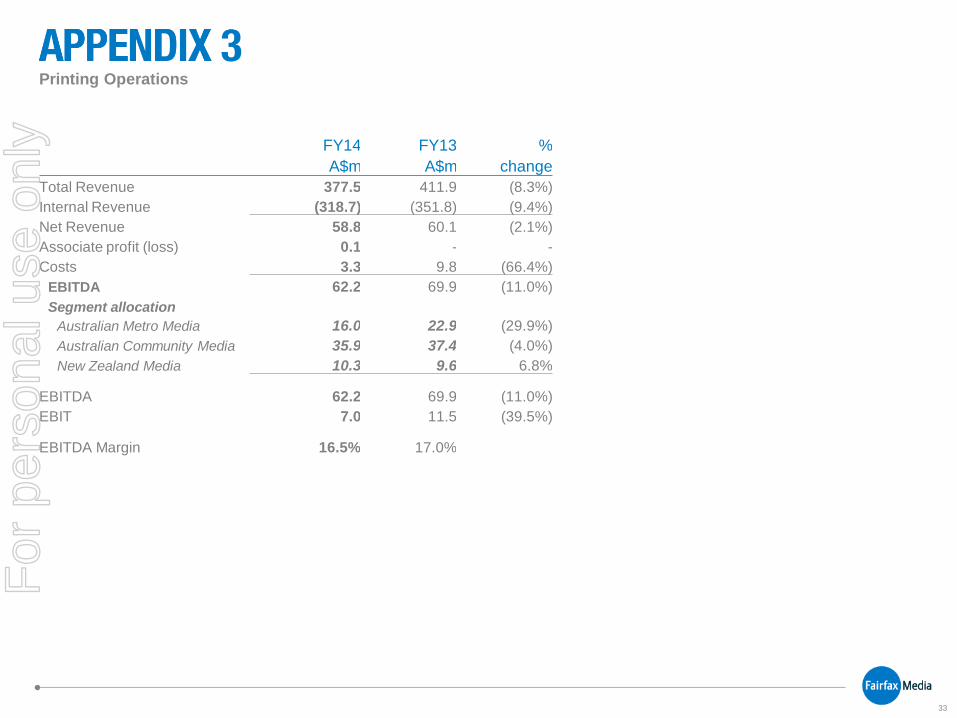
Printing Operations
FY14 FY13 %
A$m A$m change
Total Revenue 377.5 411.9 (8.3%)
Internal Revenue (318.7) (351.8) (9.4%)
Net Revenue 58.8 60.1 (2.1%)
Associate profit (loss) 0.1 - -
Costs 3.3 9.8 (66.4%)
EBITDA 62.2 69.9 (11.0%)
Segment allocation
Australian Metro Media 16.0 22.9 (29.9%)
Australian Community Media 35.9 37.4 (4.0%)
New Zealand Media 10.3 9.6 6.8%
EBITDA 62.2 69.9 (11.0%)
EBIT 7.0 11.5 (39.5%)
EBITDA Margin 16.5% 17.0%
For
per
sona
l use
onl
y
34
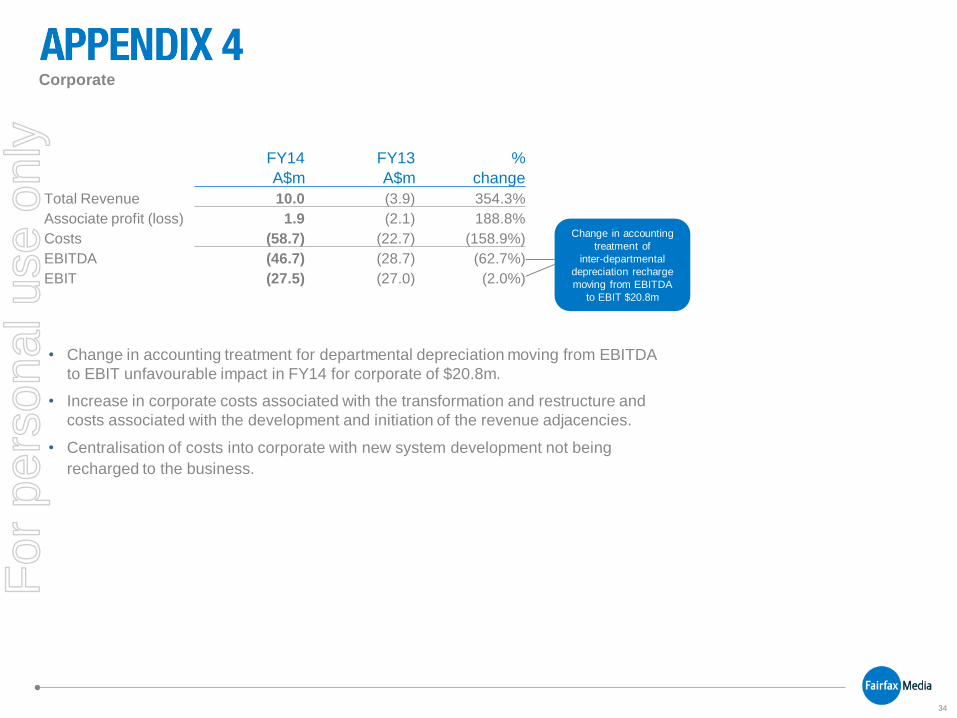
Corporate
• Change in accounting treatment for departmental depreciation moving from EBITDA
to EBIT unfavourable impact in FY14 for corporate of $20.8m.
• Increase in corporate costs associated with the transformation and restructure and
costs associated with the development and initiation of the revenue adjacencies.
• Centralisation of costs into corporate with new system development not being
recharged to the business.
Change in accounting
treatment of
inter-departmental
depreciation recharge
moving from EBITDA
to EBIT $20.8m
FY14 FY13 %
A$m A$m change
Total Revenue 10.0 (3.9) 354.3%
Associate profit (loss) 1.9 (2.1) 188.8%
Costs (58.7) (22.7) (158.9%)
EBITDA (46.7) (28.7) (62.7%)
EBIT (27.5) (27.0) (2.0%)
For
per
sona
l use
onl
y
35
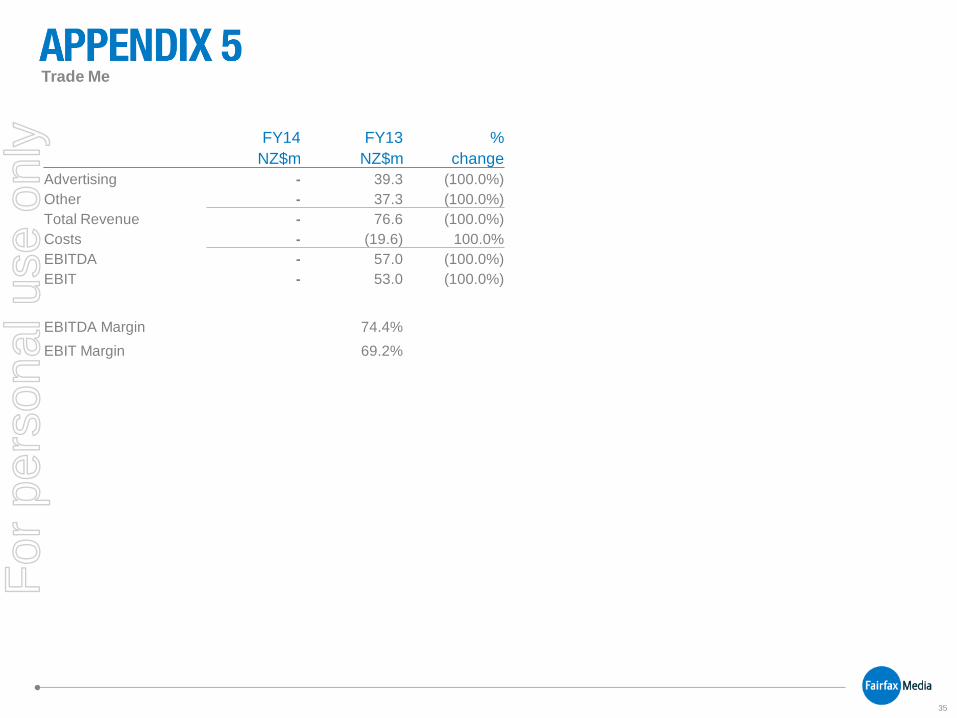
Trade Me
FY14 FY13 %
NZ$m NZ$m change
Advertising - 39.3 (100.0%)
Other - 37.3 (100.0%)
Total Revenue - 76.6 (100.0%)
Costs - (19.6) 100.0%
EBITDA - 57.0 (100.0%)
EBIT - 53.0 (100.0%)
EBITDA Margin 74.4%
EBIT Margin 69.2%
For
per
sona
l use
onl
y
36
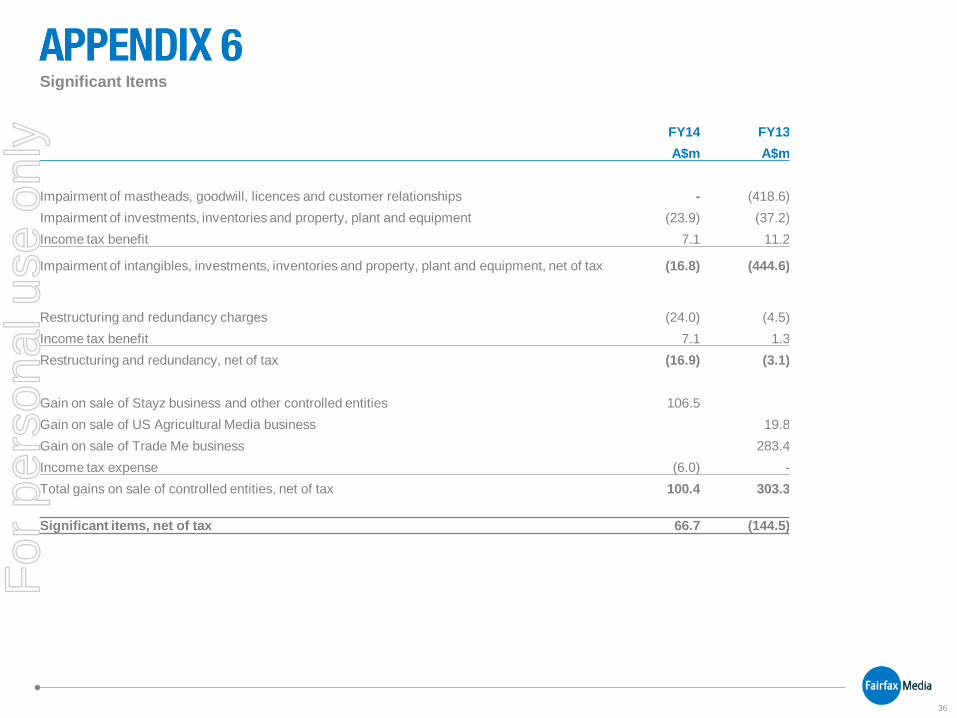
Significant Items
FY14 FY13
A$m A$m
Impairment of mastheads, goodwill, licences and customer relationships - (418.6)
Impairment of investments, inventories and property, plant and equipment (23.9) (37.2)
Income tax benefit 7.1 11.2
Impairment of intangibles, investments, inventories and property, plant and equipment, net of tax (16.8) (444.6)
Restructuring and redundancy charges (24.0) (4.5)
Income tax benefit 7.1 1.3
Restructuring and redundancy, net of tax (16.9) (3.1)
Gain on sale of Stayz business and other controlled entities 106.5
Gain on sale of US Agricultural Media business 19.8
Gain on sale of Trade Me business 283.4
Income tax expense (6.0) -
Total gains on sale of controlled entities, net of tax 100.4 303.3
Significant items, net of tax 66.7 (144.5)
For
per
sona
l use
onl
y
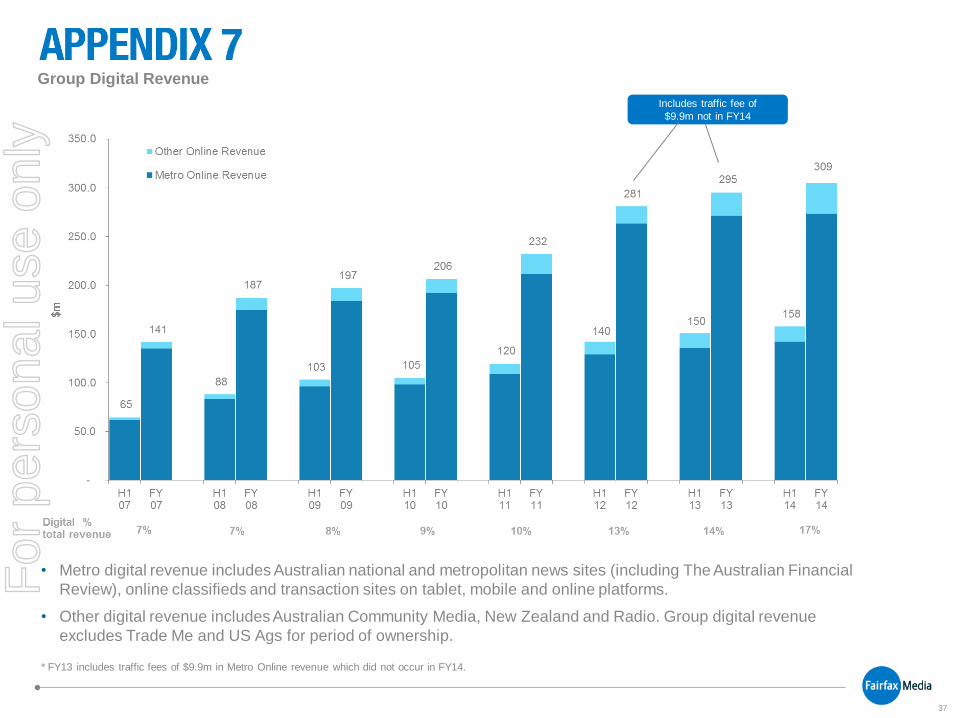
37
• Metro digital revenue includes Australian national and metropolitan news sites (including The Australian Financial
Review), online classifieds and transaction sites on tablet, mobile and online platforms.
• Other digital revenue includes Australian Community Media, New Zealand and Radio. Group digital revenue
excludes Trade Me and US Ags for period of ownership.
* FY13 includes traffic fees of $9.9m in Metro Online revenue which did not occur in FY14.
Includes traffic fee of
$9.9m not in FY14
Group Digital Revenue
For
per
sona
l use
onl
y
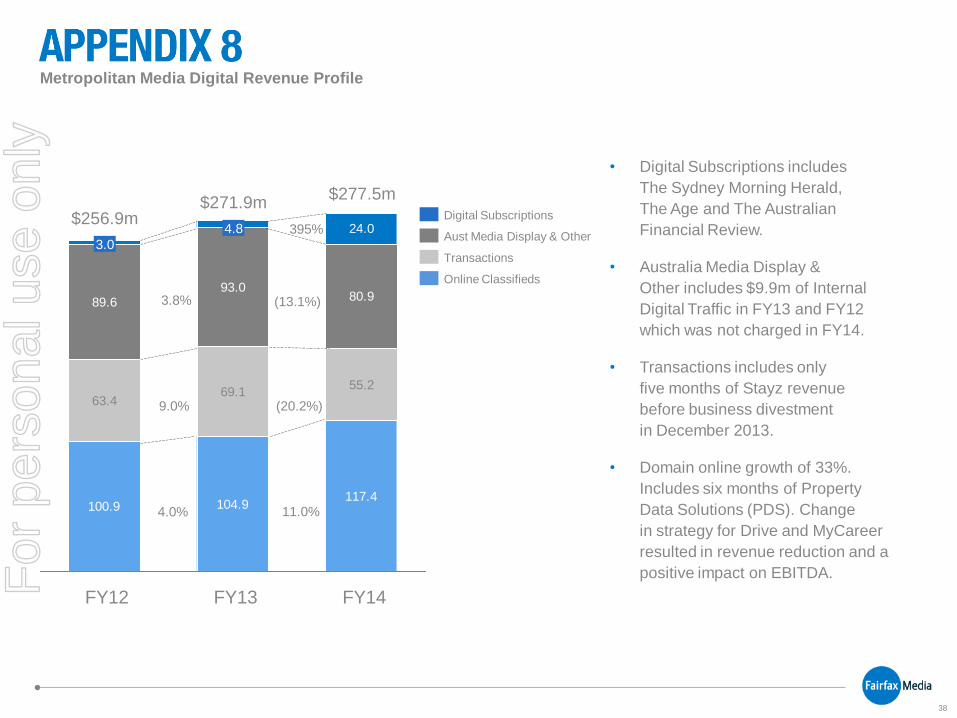
38
100.9 104.9117.4
63.469.1
55.2
89.693.0
80.9
24.0
• Digital Subscriptions includes
The Sydney Morning Herald,
The Age and The Australian
Financial Review.
• Australia Media Display &
Other includes $9.9m of Internal
Digital Traffic in FY13 and FY12
which was not charged in FY14.
• Transactions includes only
five months of Stayz revenue
before business divestment
in December 2013.
• Domain online growth of 33%.
Includes six months of Property
Data Solutions (PDS). Change
in strategy for Drive and MyCareer
resulted in revenue reduction and a
positive impact on EBITDA.
Metropolitan Media Digital Revenue Profile
FY12
3.0
$256.9m $271.9m
4.8
FY13 FY14
$277.5m
Online Classifieds
Aust Media Display & Other
Digital Subscriptions
Transactions
4.0% 11.0%
9.0% (20.2%)
3.8% (13.1%)
395%
For
per
sona
l use
onl
y
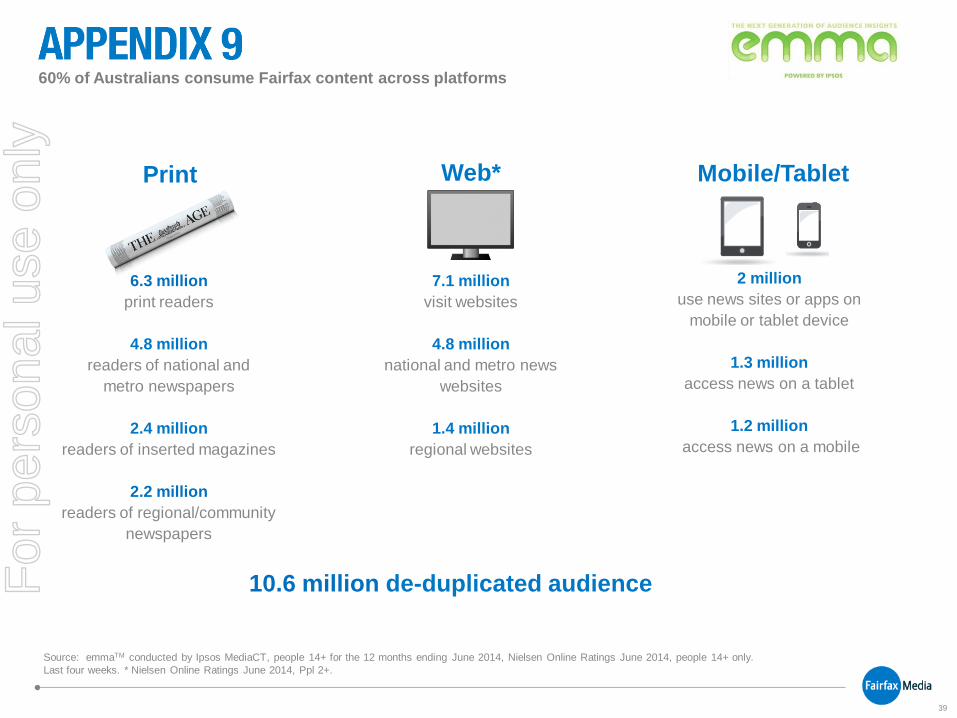
39
60% of Australians consume Fairfax content across platforms
7.1 million
visit websites
4.8 million
national and metro news
websites
1.4 million
regional websites
2 million
use news sites or apps on
mobile or tablet device
1.3 million
access news on a tablet
1.2 million
access news on a mobile
Source: emmaTM conducted by Ipsos MediaCT, people 14+ for the 12 months ending June 2014, Nielsen Online Ratings June 2014, people 14+ only.
Last four weeks. * Nielsen Online Ratings June 2014, Ppl 2+.
Web* Mobile/Tablet
10.6 million de-duplicated audience
6.3 million
print readers
4.8 million
readers of national and
metro newspapers
2.4 million
readers of inserted magazines
2.2 million
readers of regional/community
newspapers
For
per
sona
l use
onl
y
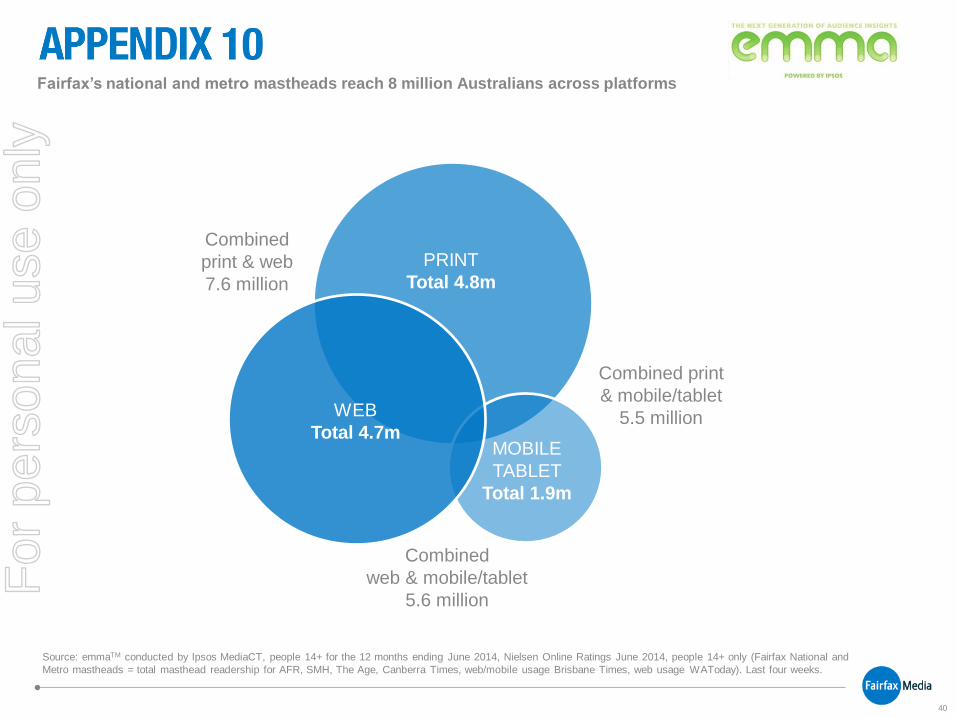
40
Fairfax’s national and metro mastheads reach 8 million Australians across platforms
Combined
web & mobile/tablet
5.6 million
Combined print
& mobile/tablet
5.5 million
Combined
print & web
7.6 million
Source: emmaTM conducted by Ipsos MediaCT, people 14+ for the 12 months ending June 2014, Nielsen Online Ratings June 2014, people 14+ only (Fairfax National and
Metro mastheads = total masthead readership for AFR, SMH, The Age, Canberra Times, web/mobile usage Brisbane Times, web usage WAToday). Last four weeks.
MOBILE
TABLET
Total 1.9m
WEB
Total 4.7m
Total 4.8m
For
per
sona
l use
onl
y
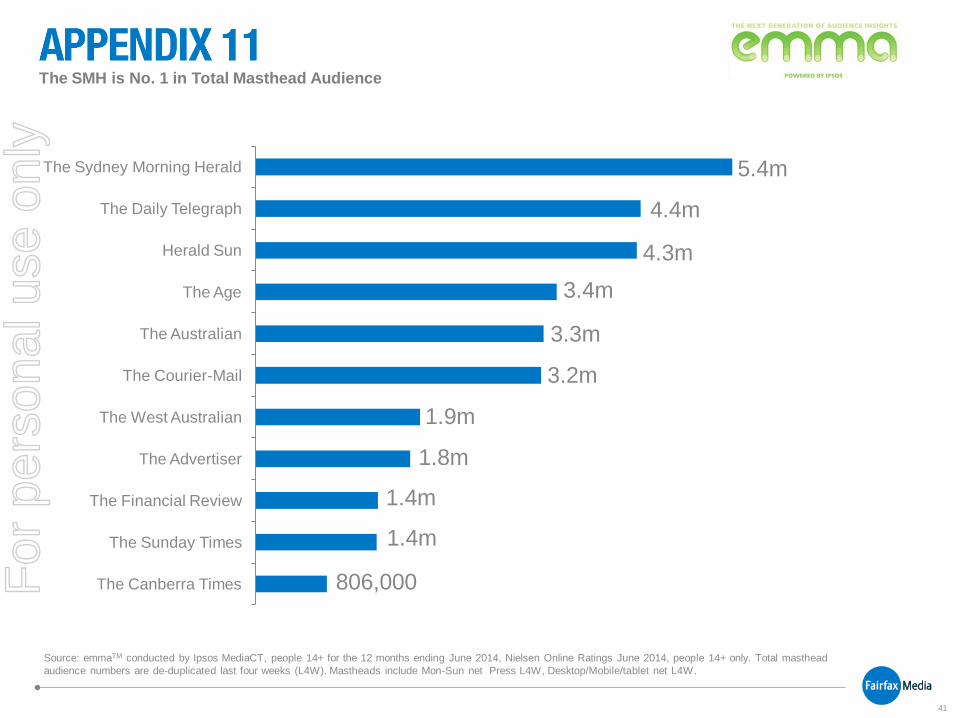
41
The Canberra Times
The Sunday Times
The Financial Review
The Advertiser
The West Australian
The Courier-Mail
The Australian
The Age
Herald Sun
The Daily Telegraph
The Sydney Morning Herald 5.4m
4.4m
4.3m
3.4m
3.3m
3.2m
1.8m
1.4m
1.4m
806,000
1.9m
The SMH is No. 1 in Total Masthead Audience
Source: emmaTM conducted by Ipsos MediaCT, people 14+ for the 12 months ending June 2014, Nielsen Online Ratings June 2014, people 14+ only. Total masthead
audience numbers are de-duplicated last four weeks (L4W). Mastheads include Mon-Sun net Press L4W, Desktop/Mobile/tablet net L4W.
For
per
sona
l use
onl
y
42
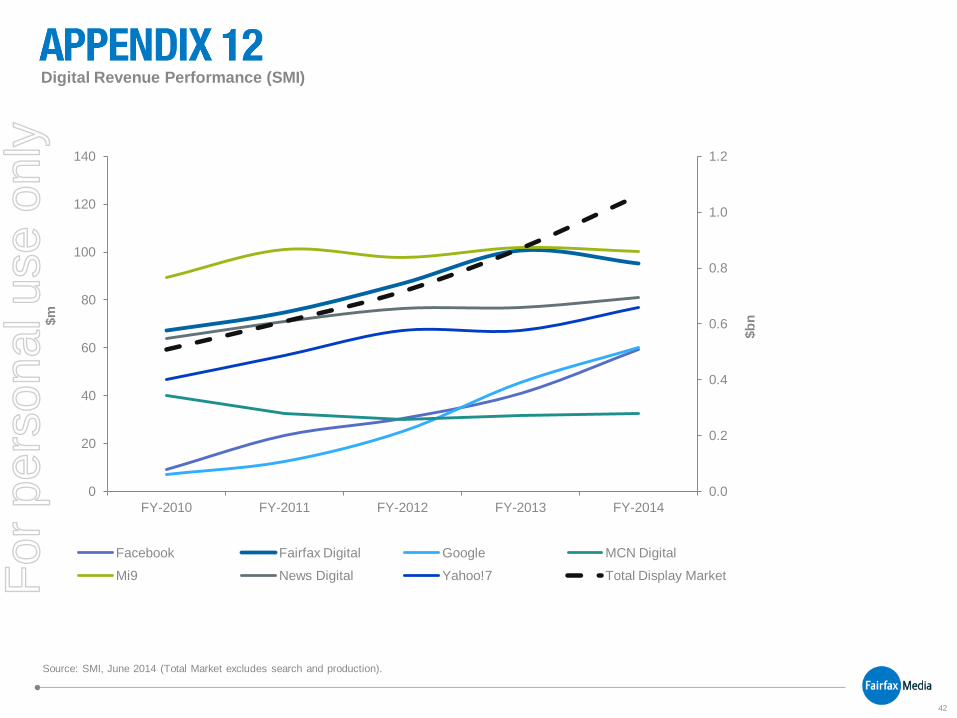
Digital Revenue Performance (SMI)
Source: SMI, June 2014 (Total Market excludes search and production).
0.0
0.2
0.4
0.6
0.8
1.0
1.2
0
20
40
60
80
100
120
140
FY-2010 FY-2011 FY-2012 FY-2013 FY-2014
$b
n
$m
Facebook Fairfax Digital Google MCN Digital
Mi9 News Digital Yahoo!7 Total Display Market For
per
sona
l use
onl
y

43
For
per
sona
l use
onl
y