Embed Size (px)
Citation preview
© Europe: Daydream GmbH; USA: Dynovel Inc.; Asia: Daydream Business Consulting (Shanghai) Ltd; All rights reserved. P a g e | 1
Patents, Turnover, Growth Drivers
& A3 Method
for Profitability Growth for Chemical Companies
-White Paper, January 2019 -
An analysis of the performance of the top 50 chemical companies (The Top 50 companies ranking combines $825
billion in sales and 61,807 published patents in 2017) highlights several key elements:
o There are significant historical and cultural differences between different regions of the world that
impact the way business is conducted from region to region, including how decisions are made regarding
R&D, marketing, sales, and capital investment.
o The way in which R&D investments (i.e. investments in patent publications) translate to actual $ sales
can evolve quite rapidly, with many differences from company to company and year to year.
o Within the top 50, Japanese and South Korean chemical companies lead the way in terms of number of
published patents as well as chemical sales per 1,000 employees in 2017.
An analysis of the current relationship between R&D investment & turnover begs the following questions: o How can companies improve the efficiency of their R&D processes by reducing time to market and
improving the success rate of R&D projects in terms of the percentage of those projects that turn into actual sales?
o How can companies improve the profitability of their business?
In the following White Paper, we start by exploring the quantitative relationship between R&D investment
and sales (Part 1). We follow this by briefly introducing the concept of an Economic Value Added (EVA) tree
(Part 2), a tool that aids in the analysis of the company’s profitability and allows leadership to prioritize the
specific areas of improvement to be focused on in order to create added value. Finally, in Part 3, we introduce
the tools that we have developed precisely to help companies make better decisions as to what markets to
target with their chemical products, how to optimize their pricing strategies and what sales opportunities to
focus in the short, medium and long-term.
o Part #1: Analysis of the top chemical companies and the relationship between R&D investment & sales (a) Top 50 chemical companies (b) Illustration for 7 companies, including BASF, Dow & Covestro (refer to Appendix 1)
o Part #2: Introduction to the Economic Value Added (EVA) tree for profitability improvement
o Part #3: A3 Method - Introduction to tools designed to optimize pricing, market strategy & sales
opportunity pipeline (a) Introduction to A3 tools (refer to Appendix 2 for more details) (b) Focus on PriSim tool (refer to Appendix 2 for more details)
Global Contact: Jean-Louis Cougoul ([email protected])
Local Contact: Stephanie Lorini ([email protected])
© Europe: Daydream GmbH; USA: Dynovel Inc.; Asia: Daydream Business Consulting (Shanghai) Ltd; All rights reserved. P a g e | 2
Table of Contents
1. Part #1: Analysis of the top 50 chemical companies and the relationship between R&D investment (#
of published patents) & sales ................................................................................................................................. 3
a. Overview of the Global Top 50 chemical companies .................................................................................... 3
b. Case study for 7 selected chemical companies: see Appendix 1. ................................................................. 6
2. Part #2: Introduction to the Economic Value Added (EVA) tree for profitability improvement ............. 7
3. Part #3: A3 Method: Introduction to tools designed to optimize pricing, market strategy & sales
opportunity pipeline ............................................................................................................................................... 8
a. Introduction to A3 tools (*) ............................................................................................................................. 8
b. PriSim (Pricing Simulation) Introduction ..................................................................................................... 9
4. Next step: Sales Growth Plan .................................................................................................................... 10
Appendix 1: Case study for the 7 selected chemical companies ..................................................................... 11
o Wanhua Chemical (China) ............................................................................................................................................................. 11
o Shin-Etsu Chemical (Japan) ........................................................................................................................................................... 11
o LG Chem (South Korea) ................................................................................................................................................................. 11
o BASF (Germany) ............................................................................................................................................................................ 11
o Arkema (France) ............................................................................................................................................................................ 11
o Covestro (Germany) ...................................................................................................................................................................... 11
o Dow (USA) ...................................................................................................................................................................................... 11
Appendix 2: A3 Suite and PriSim (Pricing Simulation)..................................................................................... 18
Appendix 2.1: A3 Suite overview .................................................................................................................... 18
Phase 1: ”Define” the business ................................................................................................................. 18
Phase 2: “Farm” the business .................................................................................................................... 19
Phase 3: “Hunt” new business ................................................................................................................... 19
Appendix 2.2: Pricing Simulation (PriSim) App detail and illustration ..................................................... 20
© Europe: Daydream GmbH; USA: Dynovel Inc.; Asia: Daydream Business Consulting (Shanghai) Ltd; All rights reserved. P a g e | 3
1. Part #1: Analysis of the top 50 chemical companies and the relationship between R&D investment
(# of published patents) & sales
In this section, we study the top 50 global chemical companies (by turnover), and specifically the
relationship between their sales of chemicals and patent publication performance in 2017. The specific
parameters that are used to frame the analysis are the Chemical Sales per 1,000 employees and the number
of Published Patents per 1,000 employees.
a. Overview of the Global Top 50 chemical companies
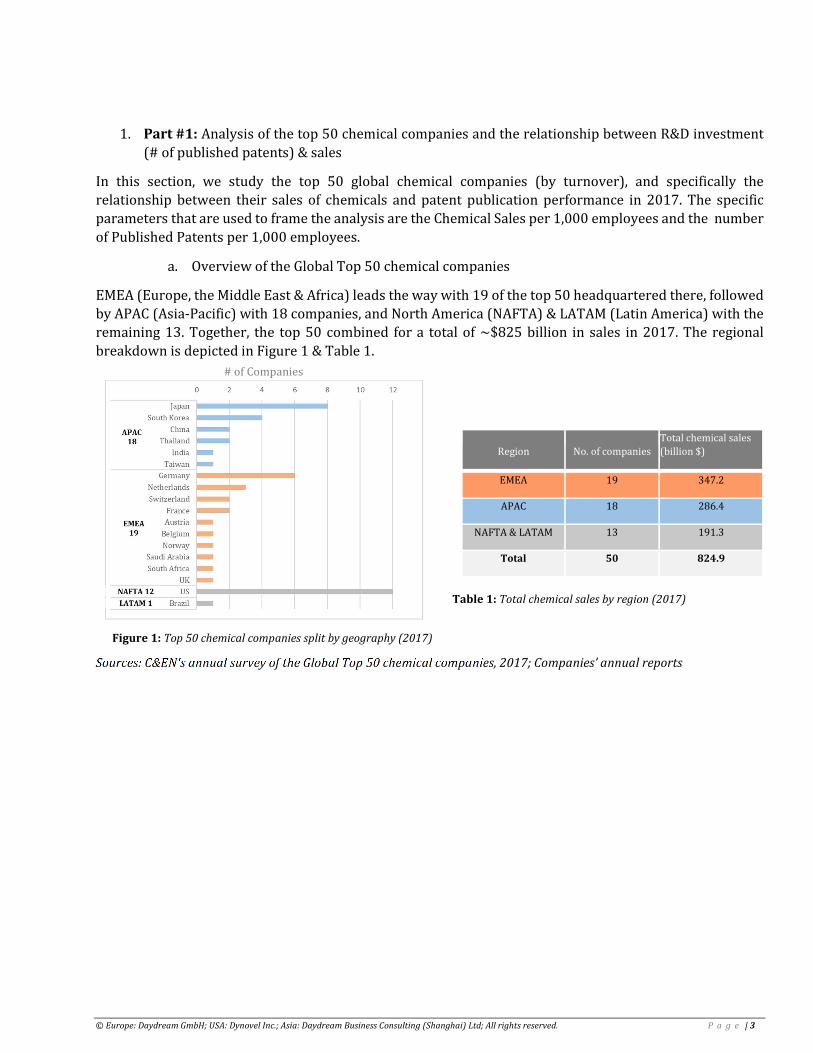
EMEA (Europe, the Middle East & Africa) leads the way with 19 of the top 50 headquartered there, followed
by APAC (Asia-Pacific) with 18 companies, and North America (NAFTA) & LATAM (Latin America) with the
remaining 13. Together, the top 50 combined for a total of ~$825 billion in sales in 2017. The regional
breakdown is depicted in Figure 1 & Table 1.
Sources: C&EN's annual survey of the Global Top 50 chemical companies, 2017; Companies’ annual reports
Region No. of companies
Total chemical sales
(billion $)
EMEA 19 347.2
APAC 18 286.4
NAFTA & LATAM 13 191.3
Total 50 824.9
Figure 1: Top 50 chemical companies split by geography (2017)
Table 1: Total chemical sales by region (2017)
# of Companies

© Europe: Daydream GmbH; USA: Dynovel Inc.; Asia: Daydream Business Consulting (Shanghai) Ltd; All rights reserved. P a g e | 4
Japanese & South Korean chemical companies in the Top 50 are generally the leaders when it comes to
number of patents published per 1,000 employees as well as total chemical sales per 1,000 employees, as
can be seen in Figure 2 below. However, they are not necessarily leaders in terms of efficiently transforming
their R&D investments into actual sales.
Sources: C&EN's annual survey of the Global Top 50 chemical companies, 2017; Companies’ annual reports & sustainability reports; Google Patent
Note: The size of a company’s bubble is proportional to its total chemical sales. :For ExxonMobil, Sinopec & Bayer, their respective chemical sales represented are only the sales related to their Chemical Business i.e. for Exxon, chemical business accounts for 12.1% of total sales, Sinopec for 15.8%, and Bayer for 27.4% - However, the values for the # of employees & # of published patents used for all 3 companies for the purposes of this analysis are the total values, not just those associated with the chemical side of their business.
Below, Figure 3 zooms in on the top 10 companies by number of published patents per 1,000 employees that
are depicted in Figure 2, while Figure 4 focuses on the top 10 companies by chemical sales per 1,000
employees as depicted in Figure 2 once again.
Figure 2: Performances of Top 50 chemical companies in terms of chemical sales and # of published patents per 1,000 employees in 2017.

© Europe: Daydream GmbH; USA: Dynovel Inc.; Asia: Daydream Business Consulting (Shanghai) Ltd; All rights reserved. P a g e | 5
Figure 3: Analysis of the patent-to-turnover performance of the top 10 companies that lead the way in terms of # of published patents per 1,000 employees, taken from the Figure 2 analysis.
Figure 4: Analysis of the patent-to-turnover performance of the top 10 companies that lead the way in terms of chemical sales per 1,000 employees, taken from the Figure 2 analysis.
© Europe: Daydream GmbH; USA: Dynovel Inc.; Asia: Daydream Business Consulting (Shanghai) Ltd; All rights reserved. P a g e | 6
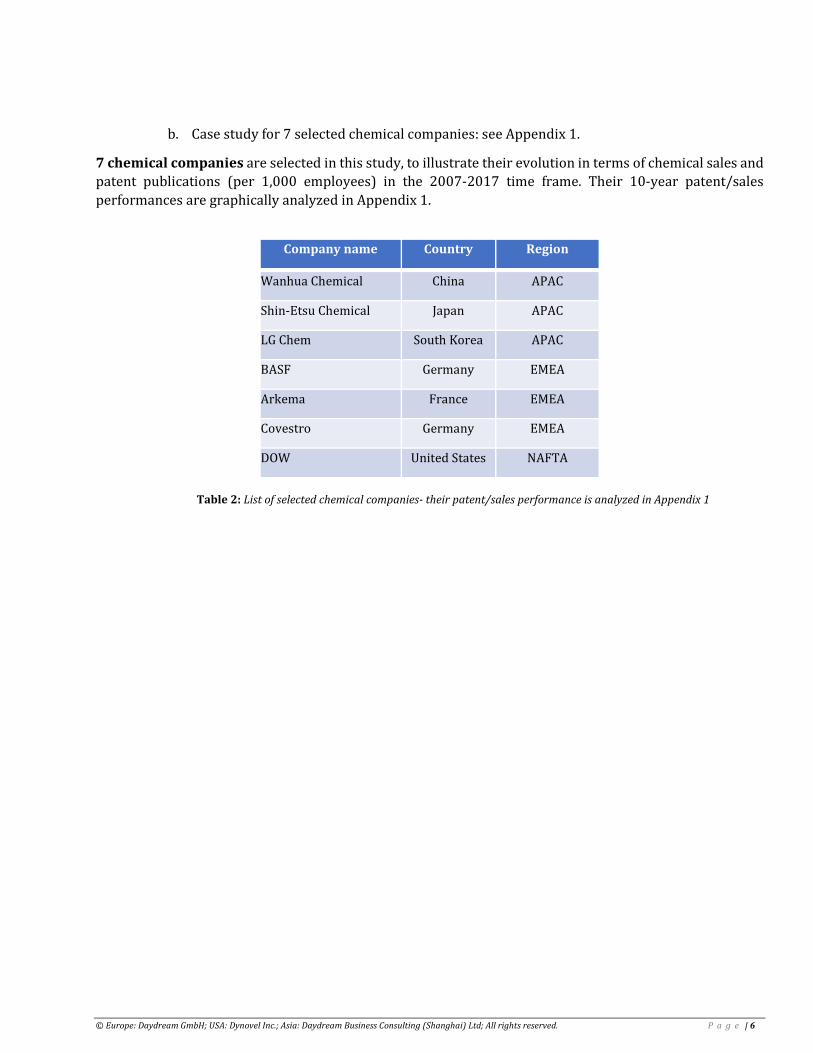
b. Case study for 7 selected chemical companies: see Appendix 1.
7 chemical companies are selected in this study, to illustrate their evolution in terms of chemical sales and
patent publications (per 1,000 employees) in the 2007-2017 time frame. Their 10-year patent/sales
performances are graphically analyzed in Appendix 1.
Company name Country Region
Wanhua Chemical China APAC
Shin-Etsu Chemical Japan APAC
LG Chem South Korea APAC
BASF Germany EMEA
Arkema France EMEA
Covestro Germany EMEA
DOW United States NAFTA
Table 2: List of selected chemical companies- their patent/sales performance is analyzed in Appendix 1
© Europe: Daydream GmbH; USA: Dynovel Inc.; Asia: Daydream Business Consulting (Shanghai) Ltd; All rights reserved. P a g e | 7
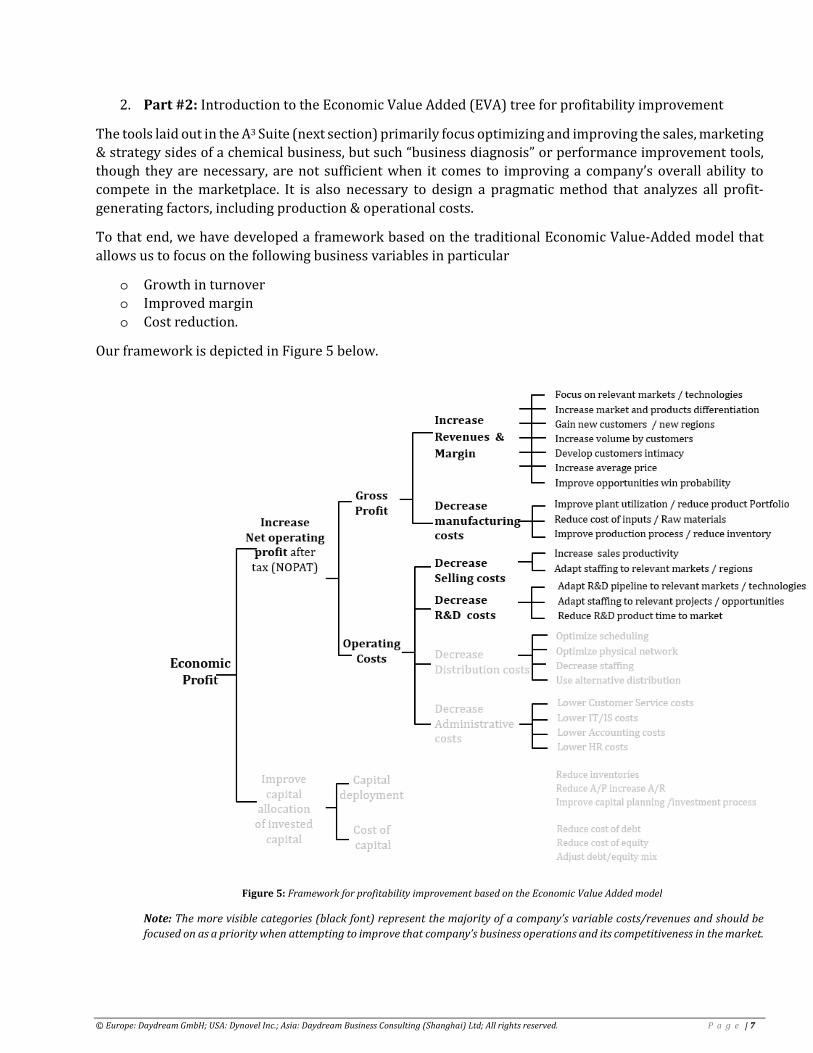
2. Part #2: Introduction to the Economic Value Added (EVA) tree for profitability improvement
The tools laid out in the A3 Suite (next section) primarily focus optimizing and improving the sales, marketing
& strategy sides of a chemical business, but such “business diagnosis” or performance improvement tools,
though they are necessary, are not sufficient when it comes to improving a company’s overall ability to
compete in the marketplace. It is also necessary to design a pragmatic method that analyzes all profit-
generating factors, including production & operational costs.
To that end, we have developed a framework based on the traditional Economic Value-Added model that
allows us to focus on the following business variables in particular
o Growth in turnover
o Improved margin
o Cost reduction.
Our framework is depicted in Figure 5 below.
Note: The more visible categories (black font) represent the majority of a company’s variable costs/revenues and should be focused on as a priority when attempting to improve that company’s business operations and its competitiveness in the market.
Figure 5: Framework for profitability improvement based on the Economic Value Added model
© Europe: Daydream GmbH; USA: Dynovel Inc.; Asia: Daydream Business Consulting (Shanghai) Ltd; All rights reserved. P a g e | 8
3. Part #3: A3 Method: Introduction to tools designed to optimize pricing, market strategy & sales
opportunity pipeline
a. Introduction to A3 tools (*)
Our October Newsletter provided a short teaser introduction to A3, our new suite of tools designed to help
improve the way in which leading companies in the Chemical industry make decisions as to what markets
to target with their products, how to price these products, what sales opportunities to focus on and
ultimately how these companies manage their vast portfolio of current and potential customers to achieve
growth in a systematic manner.
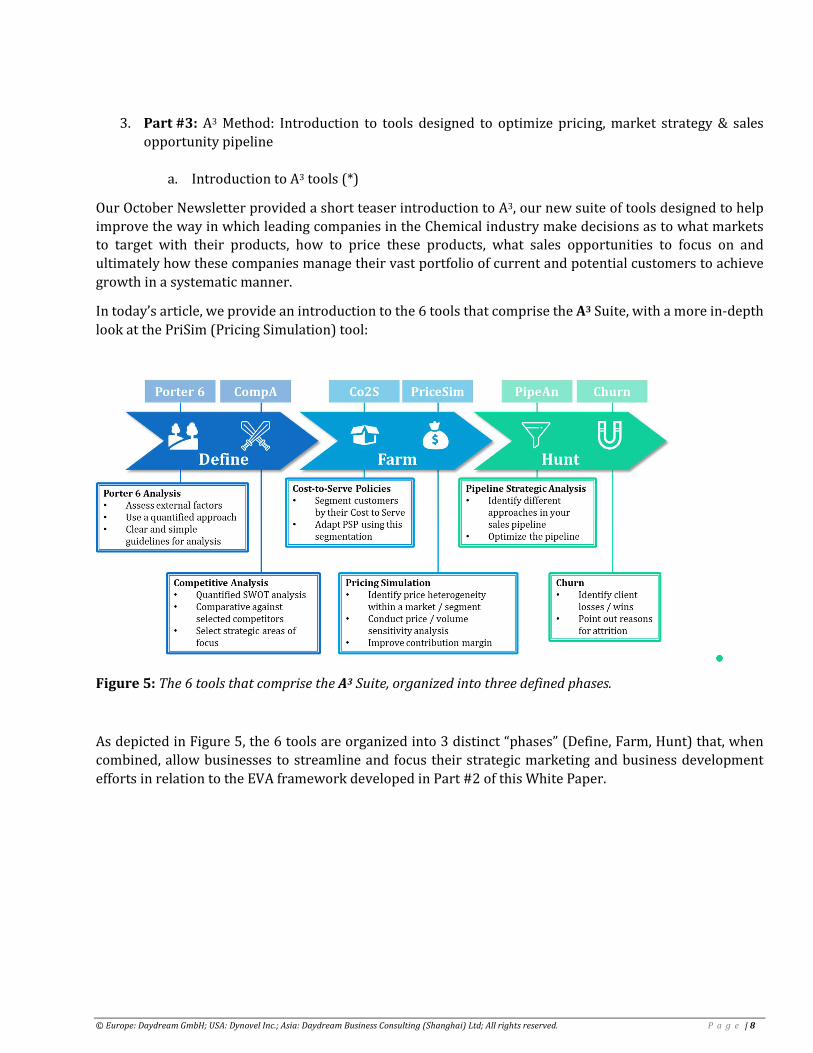
In today’s article, we provide an introduction to the 6 tools that comprise the A3 Suite, with a more in-depth
look at the PriSim (Pricing Simulation) tool:
Figure 5: The 6 tools that comprise the A3 Suite, organized into three defined phases.
As depicted in Figure 5, the 6 tools are organized into 3 distinct “phases” (Define, Farm, Hunt) that, when
combined, allow businesses to streamline and focus their strategic marketing and business development
efforts in relation to the EVA framework developed in Part #2 of this White Paper.
© Europe: Daydream GmbH; USA: Dynovel Inc.; Asia: Daydream Business Consulting (Shanghai) Ltd; All rights reserved. P a g e | 9
The A3 suite provides 6 tools that can help to better define their strategic marketing goals, their
pricing strategies and ultimately their sales and growth strategies across different markets,
customer groups and geographies.
o Porter 6 Analysis
o CompA (Competitive Analysis)
o Co2S (Cost-to-Serve Analysis)
o PriSim (Pricing Simulation)
o PipeAn (Pipeline Strategic Analysis)
o Churn Analysis
(*): For A3 more detail: Appendix 2.
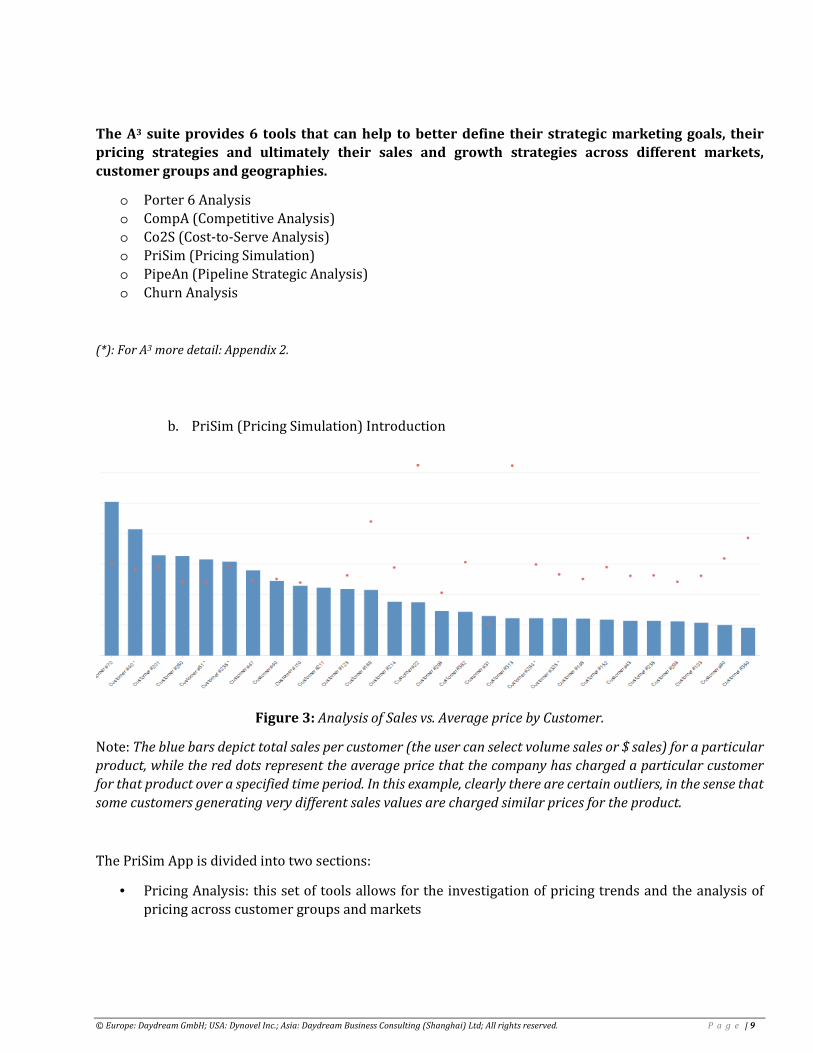
b. PriSim (Pricing Simulation) Introduction
Figure 3: Analysis of Sales vs. Average price by Customer.
Note: The blue bars depict total sales per customer (the user can select volume sales or $ sales) for a particular product, while the red dots represent the average price that the company has charged a particular customer for that product over a specified time period. In this example, clearly there are certain outliers, in the sense that some customers generating very different sales values are charged similar prices for the product.
The PriSim App is divided into two sections:
• Pricing Analysis: this set of tools allows for the investigation of pricing trends and the analysis of
pricing across customer groups and markets
© Europe: Daydream GmbH; USA: Dynovel Inc.; Asia: Daydream Business Consulting (Shanghai) Ltd; All rights reserved. P a g e | 10
• Pricing Simulation: this is a customized tool that takes price elasticity of demand of each customer
into account and runs simulations predicting the results of price increases on sales, volumes &
subsequently total turnover
There are a number of ways in which pricing can be analyzed under the Pricing Analysis section of the PriSim
Method:
• Pareto Analysis
o Pareto analyses can be performed to understand which customers, products or regions
(geographies) create the most value in terms of total sales generated, and which ones create
the least. These analyses allow the App user to segment customers or products based on
sales, and this kind of segmentation is extremely useful to businesses looking to analyze their
customer portfolio and their overall pricing strategies.
o The Pareto parameters can be customized as befits the particular needs of the PriSim App
user. For example, the analysis can be performed such that the user can identify the
customers, products or regions that generate a certain percentage of the user’s overall sales,
and that percentage can be set in the App (e.g. 80% is typical, but 70% or 90% are also often
chosen, while other percentages can be input as well).
• Our Price Trending tool
o In addition to the Pareto analysis, the PriSim App offers tools that allow for the analysis of
pricing trends (i.e. how prices have changed over time) by product or customer, all the while
helping identify “pricing outliers”- for example, there may be some customers that are buying
similar volumes that are charged wildly different (average) prices for the same product,
while other customers that are buying very different volumes may be being charged the same
prices for the product. All of this information is extremely useful for companies to know as
they determine their pricing strategies going forwards.
For more details regarding the Pricing Simulation section of the PriSim App and this tool in general, refer to
Appendix 2.
4. Next step: Sales Growth Plan
We have the ability to implement performance improvement plans for Growth sales and margin and to learn
more, please contact the following members of our team, depending on your region of interest:
• USA: Stephanie Lorini ([email protected]), Justin Shemonsky ([email protected])
• Europe: Fabrice Lacombe ([email protected]), Jean-Pierre Molitor (jean-
[email protected]), Nicolas Messin ([email protected])
• Asia: Yusi Chen ([email protected]), Wei Huang ([email protected])
• Global / General Contact: Jean-Louis Cougoul ([email protected])
In mid-2019, we will publish a White Paper detailing an analysis of the performance of the Top 100
Chemical Companies in terms of the relationship between their R&D investments & actual Sales/
Growth.
© Europe: Daydream GmbH; USA: Dynovel Inc.; Asia: Daydream Business Consulting (Shanghai) Ltd; All rights reserved. P a g e | 11
Appendix 1: Case study for the 7 selected chemical companies
It seems interesting to compare companies with each other on economic and R & D criteria. And it also
seemed interesting to look for leaders, the Turnover evolution and Patents during the last 10 years to try to
visualize correlations between Patents and Turnover and speed of change: we have done this exercise for 7
companies.
o Wanhua Chemical (China)
o Shin-Etsu Chemical (Japan)
o LG Chem (South Korea)
o BASF (Germany)
o Arkema (France)
o Covestro (Germany)
o Dow (USA)
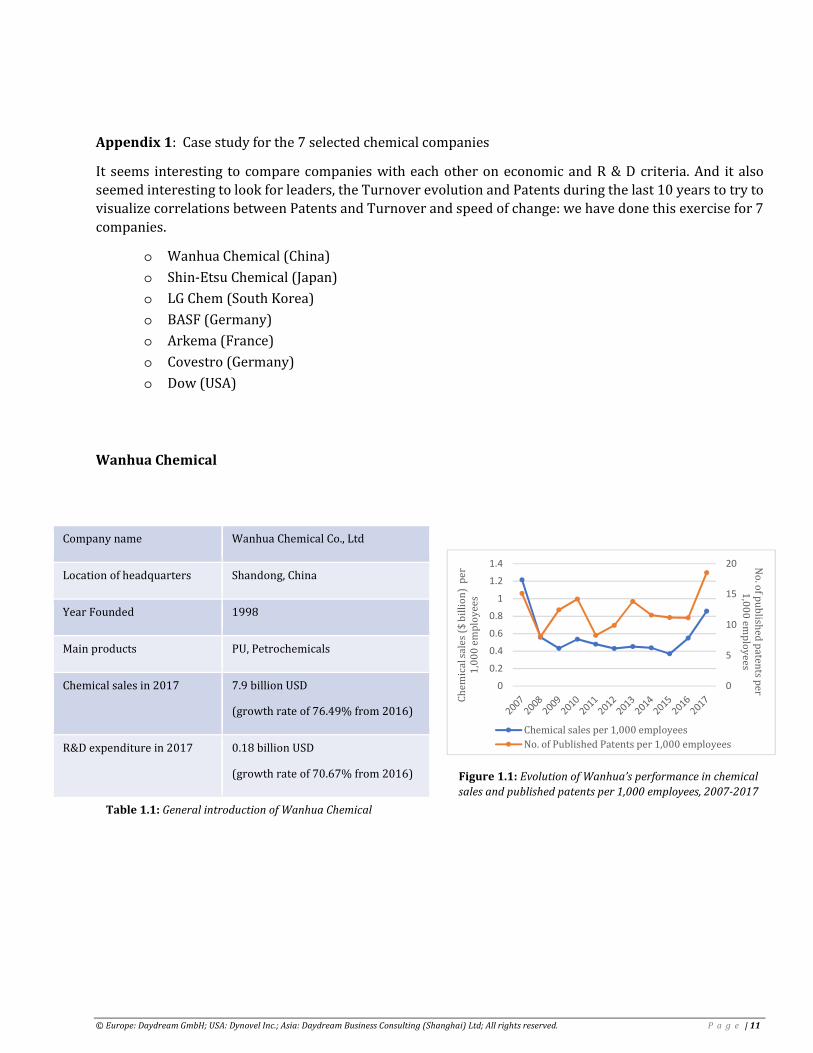
Wanhua Chemical
Company name Wanhua Chemical Co., Ltd
Location of headquarters Shandong, China
Year Founded 1998
Main products PU, Petrochemicals
Chemical sales in 2017 7.9 billion USD
(growth rate of 76.49% from 2016)
R&D expenditure in 2017 0.18 billion USD
(growth rate of 70.67% from 2016)
0
5
10
15
20
0
0.2
0.4
0.6
0.8
1
1.2
1.4 No
. of p
ub
lishe
d p
ate
nts p
er
1,0
00
em
plo
ye
es
Ch
em
ica
l sa
les
($ b
illi
on
) p
er
1,0
00
em
plo
ye
es
Chemical sales per 1,000 employees
No. of Published Patents per 1,000 employees
Figure 1.1: Evolution of Wanhua’s performance in chemical sales and published patents per 1,000 employees, 2007-2017
Table 1.1: General introduction of Wanhua Chemical

© Europe: Daydream GmbH; USA: Dynovel Inc.; Asia: Daydream Business Consulting (Shanghai) Ltd; All rights reserved. P a g e | 12
Shin-Etsu Chemical
Company name Shin-Etsu Chemical
Location of headquarters Tokyo, Japan
Year Founded 1926
Main products PVC/Chlor-Alkali, Semiconductor
Silicon, Electronics & Functional
Materials, Silicones etc.
Chemical sales in 2017 12.8 billion USD
R&D expenditure in 2017 0.488 billion USD
0
20
40
60
80
100
0
0.1
0.2
0.3
0.4
0.5
0.6
0.7
0.8
No
. of p
ub
lishe
d p
ate
nts p
er
1,0
00
em
plo
ye
es
Ch
em
ica
l sa
les
($ b
illi
on
) p
er
1,0
00
em
plo
ye
es
Chemical sales per 1,000 employees
No. of Published Patents per 1,000 employees
Figure 1.2: Evolution of Shin-Etsu’s performance in chemical sales and published patents per 1,000 employees, 2007-2017
Table 1.2: General introduction of Shin-Etsu Chemical

© Europe: Daydream GmbH; USA: Dynovel Inc.; Asia: Daydream Business Consulting (Shanghai) Ltd; All rights reserved. P a g e | 13
LG Chem
Company name LG Chem, Ltd.
Location of
headquarters
Seoul, South Korea
Year Founded 1947
Main products 1. Basic Material & Chemicals (Propylene,
Polyolefins, PVC etc.)
2. Energy solutions (Automotive Battery etc.)
3. IT&E Materials (Optical Materials, etc.)
4. Advanced Material (Battery Material, etc.)
5. Life Sciences (Primary Drugs, Specialty
Drugs, etc.)
Chemical sales in
2017
23.2 billion USD
R&D expenditure
in 2017
0.841 billion USD
(CAGR at 21.3% from 2013-2017)
0
50
100
150
200
250
300
350
0
0.2
0.4
0.6
0.8
1
1.2 No
. of p
ub
lishe
d p
ate
nts p
er
1,0
00
em
plo
ye
es
Ch
em
ica
l sa
les
($ b
illi
on
) p
er
1,0
00
em
plo
ye
es
Chemical sales per 1,000 employeesNo. of Published Patents per 1,000 employees
Figure 1.3: Evolution of LG Chem’s performance in chemical sales and published patents per 1,000 employees, 2007-2017
Table 1.3: General introduction of LG Chem

© Europe: Daydream GmbH; USA: Dynovel Inc.; Asia: Daydream Business Consulting (Shanghai) Ltd; All rights reserved. P a g e | 14
BASF
Company name BASF
Location of
headquarters
Ludwigshafen, Germany
Year Founded 1865
Main products 1. Chemicals (Petrochemical, monomers and
intermediates)
2. Performance Products (Dispersions &
Pigments, Care Chemicals, etc.)
3. Functional Materials & Solutions
(Performance Materials, Catalysts, Coatings
etc.)
4. Agriculture Solutions
Chemical sales in
2017
69.2 billion USD
R&D expenditure
in 2017
2.1 billion USD (CAGR at 3.2% in 2007-2017)
0
20
40
60
80
100
120
0
0.1
0.2
0.3
0.4
0.5
0.6
0.7 No
. of p
ub
lishe
d p
ate
nts p
er
1,0
00
em
plo
ye
es
Ch
em
ica
l sa
les
($ b
illi
on
) p
er
1,0
00
em
plo
ye
es
Chemical sales per 1,000 employees
No. of Published Patents per 1,000 employees
Figure 1.4: Evolution of BASF’s performance in chemical sales and published patents per 1,000 employees, 2007-2017
Table 1.4: General introduction of BASF

© Europe: Daydream GmbH; USA: Dynovel Inc.; Asia: Daydream Business Consulting (Shanghai) Ltd; All rights reserved. P a g e | 15
Arkema
Company name Arkema
Location of
headquarters
Colombes, France
Year Founded 2004 (Divested from Total)
Main products 1. High Performance Materials (Adhesives and
Sealants, Specialty Polyamides, PVDF, UV
Curing Resins, Organic Peroxides etc.)
2. Industrial Specialties (PMMA, Thiochemicals,
Fluorogases and Hydrogen Peroxide)
3. Coating Solutions (Acrylics, Coating Resins
and Additives)
Chemical sales in
2017
9.4 billion USD
R&D expenditure
in 2017
0.265 billion USD (CAGR at 3.2% in 2007-2017)
0
20
40
60
80
0
0.1
0.2
0.3
0.4
0.5
0.6 No
. of p
ub
lishe
d p
ate
nts p
er
1,0
00
em
plo
ye
es
Ch
em
ica
l sa
les
($ b
illi
on
) p
er
1,0
00
em
plo
ye
es
Chemical sales per 1,000 employees
No. of Published Patents per 1,000 employees
Figure 1.5: Evolution of Arkema’s performance in chemical sales and published patents per 1,000 employees, 2007-2017
Table 1.5: General introduction of Arkema

© Europe: Daydream GmbH; USA: Dynovel Inc.; Asia: Daydream Business Consulting (Shanghai) Ltd; All rights reserved. P a g e | 16
Covestro
Company name Covestro (formally known as Bayer
MaterialScience)
Location of
headquarters
Leverkusen, Germany
Year Founded 2015 (Bayer spin off)
Main products Polyurethanes (PUR)
Polycarbonates (PCS)
Coatings, Adhesives, Specialties (CAS)
Chemical sales in
2017
16.0 billion USD
R&D expenditure
in 2017
0.312 billion USD
(CAGR at 8.9% in 2014-2017)
0
10
20
30
40
50
60
0
0.2
0.4
0.6
0.8
1
1.2
2014 2015 2016 2017
No
. of p
ub
lishe
d p
ate
nts p
er
1,0
00
em
op
loy
ees
Ch
em
ica
l sa
les
($ b
illi
on
) p
er
1,0
00
em
plo
ye
es
Chemical sales per 1,000 employees
No. of Published Patents per 1,000 employees
Figure 1.6: Evolution of Covestro’s performance in chemical sales and published patents per 1,000 employees, 2014-2017
Table 1.6: General introduction of Covestro
© Europe: Daydream GmbH; USA: Dynovel Inc.; Asia: Daydream Business Consulting (Shanghai) Ltd; All rights reserved. P a g e | 17
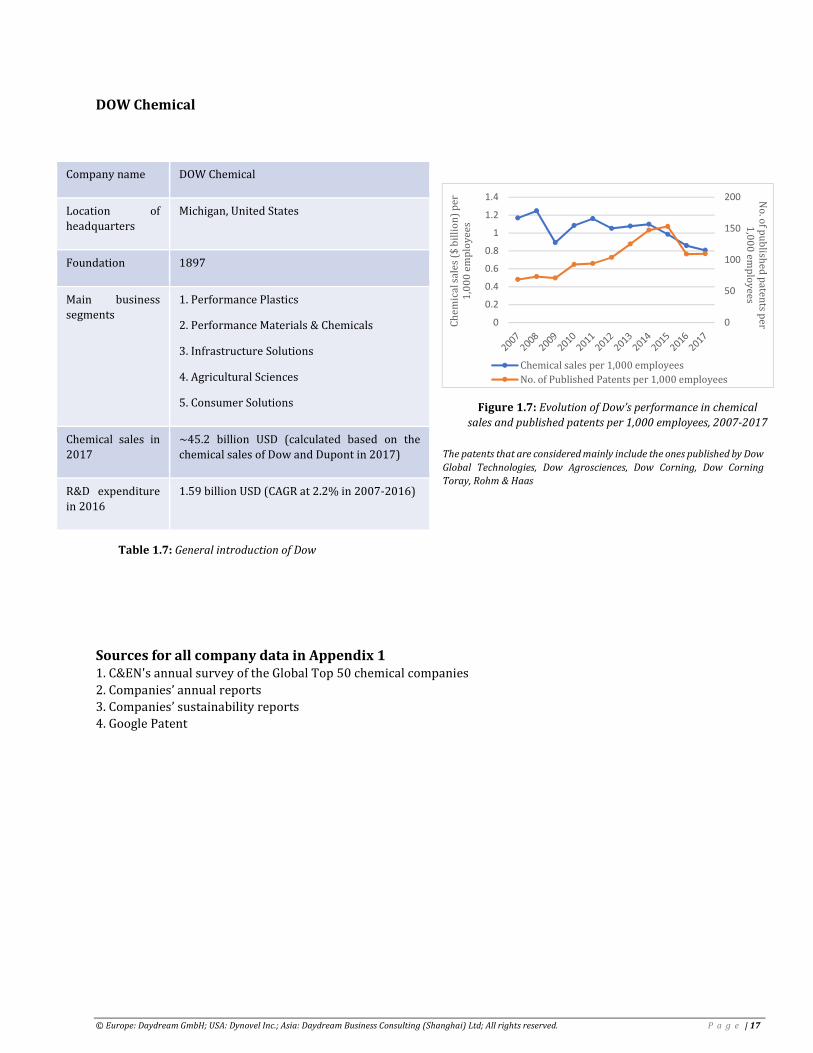
DOW Chemical
The patents that are considered mainly include the ones published by Dow Global Technologies, Dow Agrosciences, Dow Corning, Dow Corning Toray, Rohm & Haas
Sources for all company data in Appendix 1
1. C&EN's annual survey of the Global Top 50 chemical companies
2. Companies’ annual reports
3. Companies’ sustainability reports
4. Google Patent
Company name DOW Chemical
Location of
headquarters
Michigan, United States
Foundation 1897
Main business
segments
1. Performance Plastics
2. Performance Materials & Chemicals
3. Infrastructure Solutions
4. Agricultural Sciences
5. Consumer Solutions
Chemical sales in
2017
~45.2 billion USD (calculated based on the
chemical sales of Dow and Dupont in 2017)
R&D expenditure
in 2016
1.59 billion USD (CAGR at 2.2% in 2007-2016)
0
50
100
150
200
0
0.2
0.4
0.6
0.8
1
1.2
1.4 No
. of p
ub
lishe
d p
ate
nts p
er
1,0
00
em
plo
ye
es
Ch
em
ica
l sa
les
($ b
illi
on
) p
er
1,0
00
em
plo
ye
es
Chemical sales per 1,000 employees
No. of Published Patents per 1,000 employees
Figure 1.7: Evolution of Dow’s performance in chemical sales and published patents per 1,000 employees, 2007-2017
Table 1.7: General introduction of Dow
© Europe: Daydream GmbH; USA: Dynovel Inc.; Asia: Daydream Business Consulting (Shanghai) Ltd; All rights reserved. P a g e | 18
Appendix 2: A3 Suite and PriSim (Pricing Simulation)
Appendix 2.1: A3 Suite overview
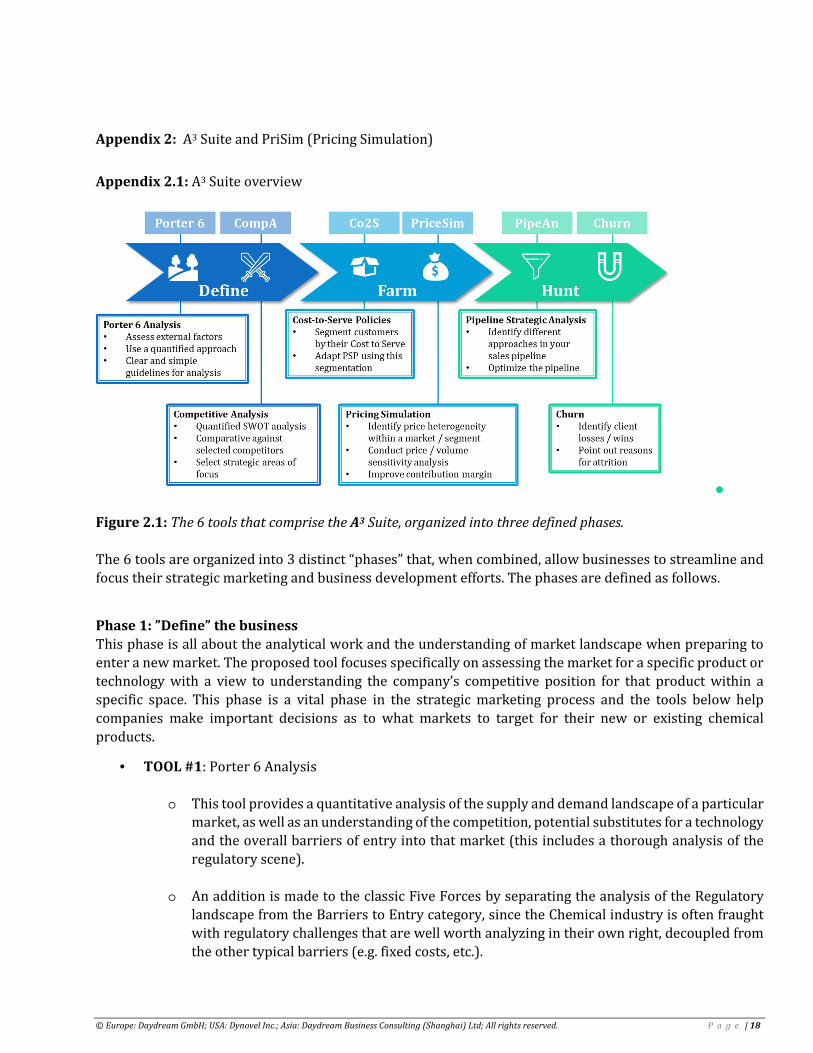
Figure 2.1: The 6 tools that comprise the A3 Suite, organized into three defined phases.
The 6 tools are organized into 3 distinct “phases” that, when combined, allow businesses to streamline and
focus their strategic marketing and business development efforts. The phases are defined as follows.
Phase 1: ”Define” the business
This phase is all about the analytical work and the understanding of market landscape when preparing to
enter a new market. The proposed tool focuses specifically on assessing the market for a specific product or
technology with a view to understanding the company’s competitive position for that product within a
specific space. This phase is a vital phase in the strategic marketing process and the tools below help
companies make important decisions as to what markets to target for their new or existing chemical
products.
• TOOL #1: Porter 6 Analysis
o This tool provides a quantitative analysis of the supply and demand landscape of a particular
market, as well as an understanding of the competition, potential substitutes for a technology
and the overall barriers of entry into that market (this includes a thorough analysis of the
regulatory scene).
o An addition is made to the classic Five Forces by separating the analysis of the Regulatory
landscape from the Barriers to Entry category, since the Chemical industry is often fraught
with regulatory challenges that are well worth analyzing in their own right, decoupled from
the other typical barriers (e.g. fixed costs, etc.).
© Europe: Daydream GmbH; USA: Dynovel Inc.; Asia: Daydream Business Consulting (Shanghai) Ltd; All rights reserved. P a g e | 19
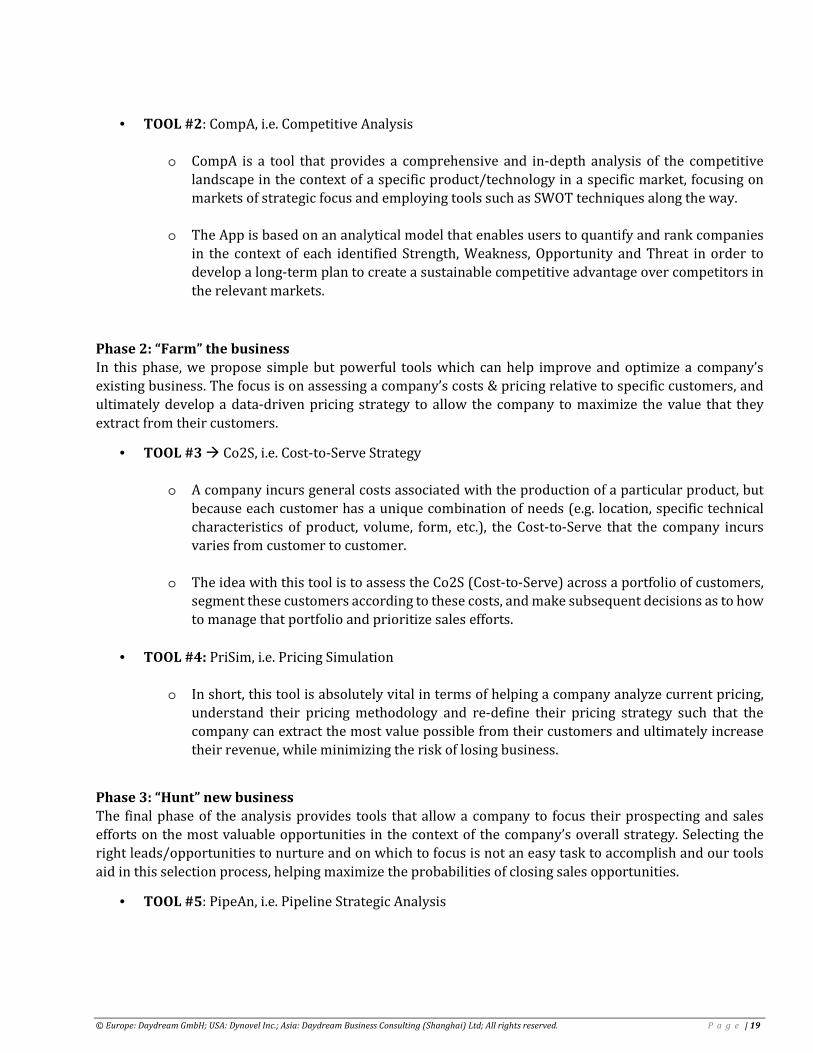
• TOOL #2: CompA, i.e. Competitive Analysis
o CompA is a tool that provides a comprehensive and in-depth analysis of the competitive
landscape in the context of a specific product/technology in a specific market, focusing on
markets of strategic focus and employing tools such as SWOT techniques along the way.
o The App is based on an analytical model that enables users to quantify and rank companies
in the context of each identified Strength, Weakness, Opportunity and Threat in order to
develop a long-term plan to create a sustainable competitive advantage over competitors in
the relevant markets.
Phase 2: “Farm” the business
In this phase, we propose simple but powerful tools which can help improve and optimize a company’s
existing business. The focus is on assessing a company’s costs & pricing relative to specific customers, and
ultimately develop a data-driven pricing strategy to allow the company to maximize the value that they
extract from their customers.
• TOOL #3 Co2S, i.e. Cost-to-Serve Strategy
o A company incurs general costs associated with the production of a particular product, but
because each customer has a unique combination of needs (e.g. location, specific technical
characteristics of product, volume, form, etc.), the Cost-to-Serve that the company incurs
varies from customer to customer.
o The idea with this tool is to assess the Co2S (Cost-to-Serve) across a portfolio of customers,
segment these customers according to these costs, and make subsequent decisions as to how
to manage that portfolio and prioritize sales efforts.
• TOOL #4: PriSim, i.e. Pricing Simulation
o In short, this tool is absolutely vital in terms of helping a company analyze current pricing,
understand their pricing methodology and re-define their pricing strategy such that the
company can extract the most value possible from their customers and ultimately increase
their revenue, while minimizing the risk of losing business.
Phase 3: “Hunt” new business
The final phase of the analysis provides tools that allow a company to focus their prospecting and sales
efforts on the most valuable opportunities in the context of the company’s overall strategy. Selecting the
right leads/opportunities to nurture and on which to focus is not an easy task to accomplish and our tools
aid in this selection process, helping maximize the probabilities of closing sales opportunities.
• TOOL #5: PipeAn, i.e. Pipeline Strategic Analysis

© Europe: Daydream GmbH; USA: Dynovel Inc.; Asia: Daydream Business Consulting (Shanghai) Ltd; All rights reserved. P a g e | 20
o This tool provides a quantitative method to rank the opportunities that are currently
available within a company’s pipeline and make data-driven decisions as to the ones that
should be prioritized, all the while conforming to the company’s overall marketing strategy.
• TOOL #6: Churn Analysis
o The idea is to provide a methodical tool to perform a full-scale churn analysis, identify the
attrition rate, understand the specific causes behind the loss of current and potential clients,
and ultimately implement effective strategies to improve customer retention (and increase
sales closing ratio).
Appendix 2.2: Pricing Simulation (PriSim) App detail and illustration
Figure 2.2: Analysis of Sales vs. Average price by Customer. The blue bars depict total sales per customer (the user can select volume sales or $ sales) for a particular product, while the red dots represent the average price that the company has charged a particular customer for that product over a specified time period. In this example, clearly there are certain outliers, in the sense that some customers generating very different sales values are charged similar prices for the product.
Pricing Analysis- More details
There are a number of ways in which pricing can be analyzed under the Pricing Analysis section of the PriSim
App.
• Pareto Analysis
o Pareto analyses can be performed to understand which customers, products or regions
(geographies) create the most value in terms of total sales generated, and which ones create
the least. These analyses allow the App user to segment customers or products based on
sales, and this kind of segmentation is extremely useful to businesses looking to analyze their
customer portfolio and their overall pricing strategies.
© Europe: Daydream GmbH; USA: Dynovel Inc.; Asia: Daydream Business Consulting (Shanghai) Ltd; All rights reserved. P a g e | 21
o The Pareto parameters can be customized as befits the particular needs of the PriSim App
user. For example, the analysis can be performed such that the user can identify the
customers, products or regions that generate a certain percentage of the user’s overall sales,
and that percentage can be set in the App (e.g. 80% is typical, but 70% or 90% are also often
chosen, while other percentages can be input as well).
• Our Price Trending tool
o In addition to the Pareto analysis, the PriSim App offers tools that allow for the analysis of
pricing trends (i.e. how prices have changed over time) by product or customer, all the while
helping identify “pricing outliers”- for example, there may be some customers that are buying
similar volumes that are charged wildly different (average) prices for the same product,
while other customers that are buying very different volumes may be being charged the same
prices for the product. All of this information is extremely useful for companies to know as
they determine their pricing strategies going forwards.
Pricing Simulation- More Details
On the Pricing Simulation side, the ability to simulate pricing scenarios really depends on the company’s
understanding of the specific price elasticity of demand associated with their various customers, and this is
a metric that the company’s sales teams can evaluate and decide on based on their own experiences with
their customers. Once elasticity is input into the PriSim tool, a whole host of pricing simulations can be run.
The company may have specific customer groups and may want to run simulations depicting the effect of a
price increase on specific groups. Perhaps the company would like to focus on a specific geography or a
specific market- they subsequently might segment their customers by price charged, and run similar price
increase simulations.
The simulations are entirely customizable- the price elasticity parameter is one of a number of metrics that
the user of the App has the ability to customize to fit specific business scenarios and run simulations
accordingly.
A number of simulations can be run for a number of price increase scenarios. The scenarios can then be
compared to determine which is the best in terms of additional value created (i.e. profitability), and in each
scenario, the risk of losing customers in the event of a certain price increase can also be assessed.
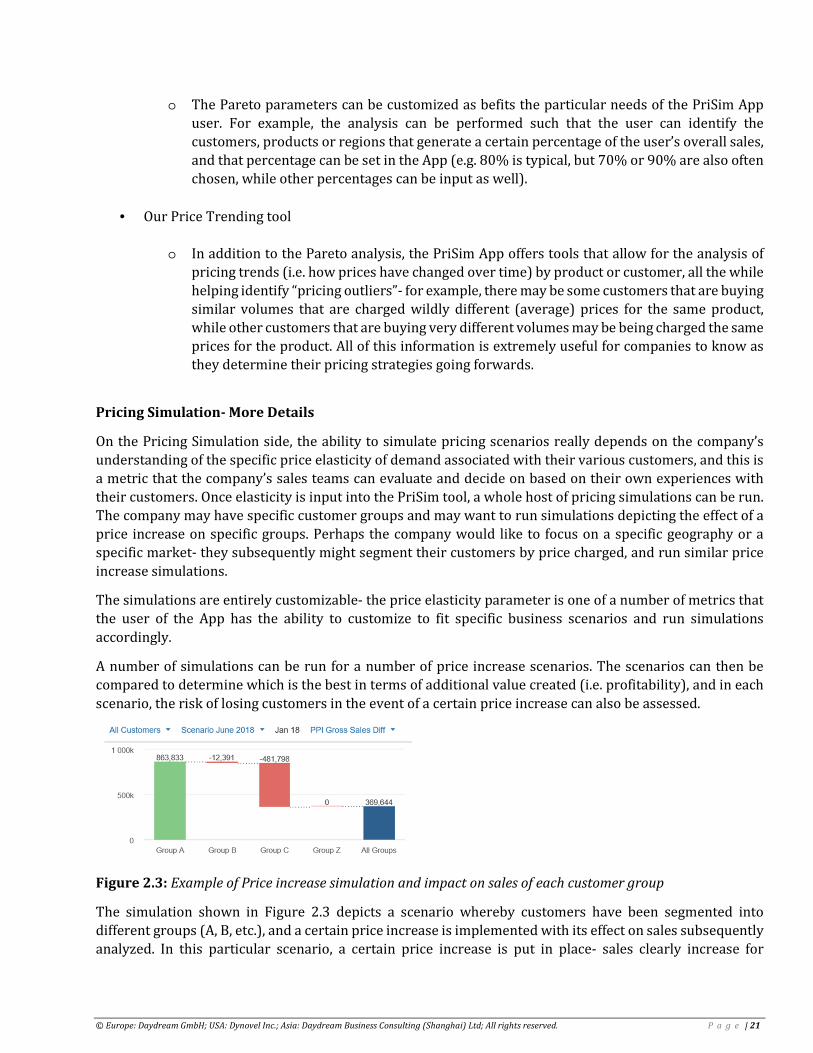
Figure 2.3: Example of Price increase simulation and impact on sales of each customer group
The simulation shown in Figure 2.3 depicts a scenario whereby customers have been segmented into
different groups (A, B, etc.), and a certain price increase is implemented with its effect on sales subsequently
analyzed. In this particular scenario, a certain price increase is put in place- sales clearly increase for
© Europe: Daydream GmbH; USA: Dynovel Inc.; Asia: Daydream Business Consulting (Shanghai) Ltd; All rights reserved. P a g e | 22
customers in Group A (with a large volume increase as well), sales remain relatively stable for customers in
Group B, while sales decrease for customers in Group C, with the overall effect being a net increase in sales
by about $370K.
Overall, the PriSim tool incorporates past and current sales data across customer groups, across markets
and across regions and runs price increase simulations to determine how the company’s sales would be
affected by specific and strategic price increases, taking price elasticity and changing volumes into account.
In addition, the company can use these simulations to streamline their customers and better understand
which ones are creating the most value for them. In some scenarios, it may be more profitable to have less
customers within a customer group but to charge a higher price.
In summary, the PriSim tool can be used to do the following, among others:
• Grow the business by increasing price and controlling the risk of customer loss
o Customers can be segmented by market, by geography and by size, and the simulations can
be run such that they target these specific customer segments
• Investigate historical price trends across customer segments by analyzing past sales data
• Use those trends & the results of the price increase simulations to define a clear pricing strategy
across markets, customer groups & geographies that reflects the company’s future sales goals
• Identify client growth opportunities after analyzing of the results of these simulations, and
subsequently define client growth strategies
• Understand which customers are the most profitable for the company
Built-in within the tool are modules and charts that allow the user to immediately visualize the results of the
simulations, to segment sales data by customer groups / markets / geographies, to visualize pricing trends
& to employ analysis techniques such as Pareto Analysis to evaluate and depict sales data in the context of
the most profitable and important customers.
To conclude:
All the A3 tools are developed in such a way to allow users to easily visualize the results of the
analysis, with built-in charts and modules that can segment results, depict pricing simulations
visually, rank opportunities and do much more. In terms of data analysis, the benefits of using this
tool over alternatives like Excel are clear:
• The tool is interactive and customizable
• The data is secured in an online platform that is collaborative and allows for input from multiple
sources at the company
• “One-click results”: once the historical pricing data is input into the system and the parameters are
chosen (e.g. Pareto parameters, price elasticity, etc.), one click is all it takes to run a simulation and
depict results in a highly visual, easy-to-understand graphical manner (charts), a process which
would take a lot longer using traditional tools like Excel
Authors: Siwen Pan, Jie Du, Andrew Jreissaty, Yusi Chen, Stephanie Lorini, Jean-Louis Cougoul, Christine Carcelen.