Embed Size (px)
Citation preview

PNWD-3222 WTP-RPT-030 Rev 0
Small Column Testing of SuperLig 639 for Removing 99Tc from Hanford Tank Waste Envelope A (Tank 241-AP-101) I. E. Burgeson D. L. Blanchard Jr. J. R. Deschane December 2002 Prepared for Bechtel National, Inc. under Contract 24590-101-TSA-W000-0004

LEGAL NOTICE
This report was prepared by Battelle Memorial Institute (Battelle) as an account of sponsored research activities. Neither Client nor Battelle nor any person acting on behalf of either:
MAKES ANY WARRANTY OR REPRESENTATION, EXPRESS OR IMPLIED, with respect to the accuracy, completeness, or usefulness of the information contained in this report, or that the use of any information, apparatus, process, or composition disclosed in this report may not infringe privately owned rights; or
Assumes any liabilities with respect to the use of, or for damages resulting from the use of, any information, apparatus, process, or composition disclosed in this report.
References herein to any specific commercial product, process, or service by trade name, trademark, manufacturer, or otherwise, does not necessarily constitute or imply its endorsement, recommendation, or favoring by Battelle. The views and opinions of authors expressed herein do not necessarily state or reflect those of Battelle.

PNWD-3222 WTP-RPT-030 Rev 0
Small Column Testing of SuperLig 639 for Removing 99Tc from Hanford Tank Waste Envelope A (Tank 241-AP-101)
I. E. Burgeson D. L. Blanchard Jr. J. R. Deschane December 2002 Test specification: TSP-W375-00-00028 Test plan: CHG-TP-41500-013, Rev. 0 Test exceptions: None R&T focus area: Pretreatment Test Scoping Statement(s): B-43a Battelle, Pacific Northwest Division Richland, Washington, 99352

COMPLETENESS OF TESTING This report describes the results of work and testing specified by Test Specification TSP-W375-00-00028 and Test Plan CHG-TP-41500-013, Rev. 0. The work and any associated testing followed the quality assurance requirements outlined in the Test Specification/Plan. The descriptions provided in this test report are an accurate account of both the conduct of the work and the data collected. Test plan results are reported. Also reported are any unusual or anomalous occurrences that are different from expected results. The test results and this report have been reviewed and verified.
_____________________________________ _________________ Gordon H. Beeman, Manager Date WTP R&T Support Project
_____________________________________ _________________ G. Todd Wright, Manager Date Research and Technology
iii
Summary
The River Protection Project-Waste Treatment Plant (RPP-WTP) baseline process for 99Tc removal from Hanford tank waste is ion exchange. The current flowsheet includes the use of TcO4
- -selective sorbent SuperLig 639 (SL-639) for Tc removal from the aqueous waste fraction. This material has been developed and supplied by IBC Advanced Technologies, Inc., American Fork, UT.
This report documents the results of small-scale column testing of the SL-639 sorbent with waste
from Tank 241-AP-101 (AP-101) for Bechtel International, Inc. in accordance with Test Specification TSP-W375-00-00028, Rev.1 (Johnson 2000). Section 5 of the Research and Technology Plan (BNI 2002) identifies the research needs for Tc ion exchange process verification [Statement of Work (SOW) Ref Sec C.6 Std 2(a)(3)(ii) and Work Breakdown Structure (WBS) 02.08.04]. The Tc ion exchange process verification tests are also addressed in Scoping Statement B-43a, which is included in Appendix C of the Research and Technology Plan. These studies are to verify design and operating parameters for plant-scale ion exchange systems. Test results will also be used to validate ion exchange models. Objectives The Tc ion exchange test objectives were to
• demonstrate the effectiveness of all SL-639 process steps
• prepare loading breakthrough profiles and elution profiles with diluted AP-101
• prepare batch-distribution isotherms
• produce and characterize a Tc eluate solution for additional testing
• produce a final effluent that removed at least 98% of the technetium from the AP-101 tank waste feed within a process goal of 250 bed volumes (BVs) of feed.
Conduct of Testing
This report documents the results of dual-column testing of the SL-639 sorbent with the diluted feed
AP-101 for Bechtel National, Inc. Two columns were arranged in series with each column containing a 5.0-mL bed, L/D(1) = 2.1. The AP-101 supernate was diluted to ~4.8 M Na and processed for Cs removal by ion exchange using SuperLig644 before removing technetium. Approximately 1.1 L of the diluted waste feed was processed for technetium removal, which correlates to 220 BV of feed. All ion exchange process steps were tested, including resin-bed preparation, loading, feed displacement, water rinse, elution, eluant rinse, and resin regeneration. Results and Performance Against Objectives
After processing 220 BVs of feed (1100 mL), the 99Tc lead and lag column final breakthrough ratios, C/C0, were ~5.2% and 0.5%, respectively. The initial 99Tc decontamination factors (DFs) for the feed passing through the first column and the whole column system (derived from the 99Tc concentration in the (1) L/D = Ratio of bed height to bed diameter

iv
first sample from each column) were 230 and 210, respectively, indicating that >99% of the technetium was removed from the initial lead and lag column samples, respectively. The final DF of the effluent was 105, as measured by the concentration of 99Tc present in the initial and processed feed. The 99Tc concentration in the effluent composite was 0.477 µCi/L and the initial concentration was 50.1 µCi/L, providing an overall 99Tc removal of 99%, which meets the success criteria of ≥98% removal of technetium.
Both columns were monitored during loading; however, only the lead column was eluted (deionized [DI] water at 65°C). The peak 99Tc concentration of the eluate was 105 times the 99Tc concentration in the feed and was found in the 2nd BV. After this, the elution proceeded relatively quickly; 17 BVs of eluant were required for the 99Tc concentration to drop below C/C0 = 0.01. The 99Tc concentration of the composited eluate was 454 µCi/L, which correlates to a C/C0 of 9.0.
The column-distribution value, λ, approximately represents the effective capacity of the SL-639 resin and is the number of BVs processed when the concentration of pertechnetate (or total technetium) reaches 50% of the feed concentration (C/C0 = 0.5). Based upon the batch-distribution measurements and resin-bed density (Kd x resin bed density), it was expected that ~500 BVs would be processed before reaching C/C0= 0.50 for technetium. This value compares quite favorably with the column λ value of ~500 BVs, which was extrapolated from ~5% breakthrough. The batch-contact and column performance data are summarized in Table S1.
Table S1. Summary of Observed and Predicted Column Performance for AP-101 Diluted Feed
Composite Decontamination Factor
(a) Flow Rate, BV/h
Extrapolated Tc (b)
column λ value TcO4
-
(pertechnetate)
99Tc (total Tc)
TcO4- Kd,
mL/g λ
value (c)
3.0 500 123 105 1220 500 (a) The DF is determined by dividing the final effluent technetium concentration by the
initial feed concentration. (b) Extrapolated from final breakthrough at 220 BVs (5%) to 50% C/C0. (c) Extrapolated from batch contact 95mTcO4
- Kd value, 1220 mL/g. Quality Requirements
Battelle, Pacific Northwest Division (PNWD) implemented the RPP-WTP quality requirements by performing work in accordance with the quality assurance (QA) project plan approved by the RPP-WTP QA organization. This work was conducted to the quality requirements of NQA-1-1989 and NQA-2a-1990, Part 2.7, as instituted through PNWD’s Waste Treatment Plant Support Project Quality Assurance Requirements and Description (WTPSP) Manual.
PNWD addressed verification activities by conducting an independent technical review of the final data report in accordance with Procedure QA-RPP-WTP-604. This review verified that the reported

v
results were traceable, that inferences and conclusions were soundly based, and that the reported work satisfied the Test Plan objectives. Issues No WTP design or operational issues were identified. References Bechtel National, Inc. (BNI). 2002. Research and Technology Plan, 24590-WTP-PL-RT-01-002, Rev 1, U.S. Department of Energy, Office of River Protection, Richland, WA. Johnson ME. 2000. Tank 241-AN-102 and 241-AP-101 Ion Exchange Test Specification, TSP-W375-00028, Rev 1, CH2M Hill Hanford Group, Inc. Richland, WA.

vii
Terms, Symbols, and Abbreviations
AEA alpha energy analysis
BNI Bechtel National, Inc.
BV bed volume
DF decontamination factor
DI distilled and deionized
GEA gamma energy analysis
IC ion chromatography
ICP-AES inductively coupled plasma/atomic emission spectrometry
ICP-MS inductively coupled plasma-mass spectrometry
λ column distribution ratio; approximately the number of BV processed at 50% breakthrough
L/D ratio of bed height to bed diameter
LAW low-activity waste feed
MRQ minimum reportable quantity
PNWD Battelle-Pacific Northwest Division
QA quality assurance
RPL Radiochemical Processing Laboratory
RPP River Protection Project
SAL Shielded Analytical Laboratory
TIC total inorganic carbon
TOC total organic carbon
TRU transuranic
WBS work breakdown structure
WTP Waste Treatment Plant
WTPSP Waste Treatment Plant Support Project Quality Assurance Requirements and Description


ix
Contents
Summary ...................................................................................................................................................... iii
Terms, Symbols, and Abbreviations ...........................................................................................................vii
1.0 Introduction........................................................................................................................................ 1.1
2.0 Experimental ...................................................................................................................................... 2.1
2.1 AP-101 Sample History ............................................................................................................. 2.1
2.2 Feed Preparation......................................................................................................................... 2.1
2.3 SL-639 Resin and Bed Preparation ............................................................................................ 2.2
2.4 History of Technetium Processing with Resin Bed.................................................................... 2.3
2.5 Batch Distribution Measurement................................................................................................ 2.3
2.6 Tc Removal Column System...................................................................................................... 2.4
2.7 Column Ion Exchange Test Procedure and Conditions.............................................................. 2.5
3.0 Results and Discussion....................................................................................................................... 3.1
3.1 Feed Composition ...................................................................................................................... 3.1
3.2 Batch Distribution ...................................................................................................................... 3.2
3.3 AP-101 Column Test – Sample Loading ................................................................................... 3.4
3.4 AP-101 Column Test – Feed Displacement and Column Rinse ................................................ 3.6
3.5 AP-101 Column Test—Elution and Resin Regeneration........................................................... 3.9
3.6 AP-101 Column Test—Elution Composite and Effluent Composite Analysis........................ 3.11
3.7 Comparison of AP-101 Initial Feed and Effluent Composite Composition............................. 3.14
3.8 Technetium Recovery .............................................................................................................. 3.16 3.8.1 System Recovery Using Composite Solution 99Tc Data................................................ 3.16 3.8.2 Recovery for Lead Column Loading and Elution Using Individual 99Tc Sample
Data................................................................................................................................ 3.17 3.8.3 Estimate of Technetium Retained on Lead and Lag Columns....................................... 3.18
3.9 Summary of Objectives and System Performance ................................................................... 3.19
x
4.0 Conclusions........................................................................................................................................ 4.1
5.0 References .......................................................................................................................................... 5.1
Appendix A: Sample Identification .......................................................................................................... A.1
Appendix B: Column Run Spreadsheets....................................................................................................B.1
Figures
Figure 2.1. Schematic Representation of Column System for Removing Technetium ............................ 2.5
Figure 3.1. 99Tc- and TcO4--Derived Kd Values........................................................................................ 3.4
Figure 3.2. AP-101 Technetium Loading Breakthrough Curves, Lead and Lag Columns....................... 3.5
Figure 3.3. 99Tc and 95mTcO4- C/C0 for Feed Displacement ...................................................................... 3.7
Figure 3.4. Component Concentrations in Feed-Displacement Samples.................................................. 3.8
Figure 3.5. Elution of Technetium from Lead Column .......................................................................... 3.10

xi
Tables
Table S1. Summary of Observed and Predicted Column Performance for AP-101 Diluted Feed ............. iv Table 2.1. Sieving Data for SL-639 Batch Number 010227CTC-9-23 .................................................... 2.2
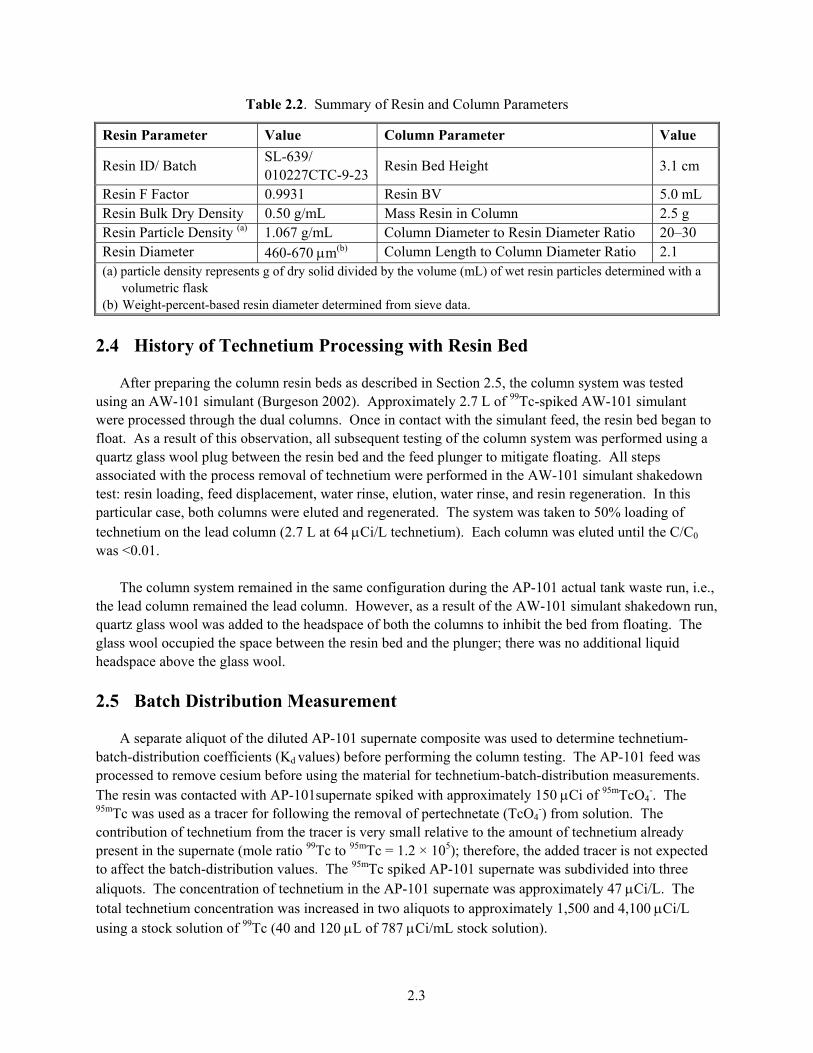
Table 2.2. Summary of Resin and Column Parameters ............................................................................ 2.3
Table 2.3. Experimental Conditions of AP-101 Supernate Small-Scale (a) Ion Exchange ........................ 2.6
Table 2.4. Sampling Interval and Analyses of Small-Scale Ion Exchange Column Process Stages ........ 2.7
Table 3.1. Composition of AP-101 Supernate (Envelope A Feed)........................................................... 3.1
Table 3.2. Selected Composition of AP-101 Supernate (Envelope A Feed) ............................................ 3.2
Table 3.3. AP-101 Technetium Kd Values—Average of Duplicate Measurements ................................. 3.3
Table 3.4. Percent Displacement (a) of Feed Analytes from Resin Beds ................................................... 3.9
Table 3.5. Composition of Column Regenerate after AP-101 Column Run........................................... 3.11
Table 3.6. Analysis Results for AP-101 Technetium Eluate Composite ................................................ 3.12
Table 3.7. Inorganic and Carbon Composition of Tc and Cs IX Effluent Composite AP-101............... 3.13
Table 3.8. Radiochemical Composition of Tc and Cs Ion Exchange Effluent Composite AP101 ......... 3.13
Table 3.9. Comparison of Initial Feed and Effluent Composite Composition........................................ 3.15
Table 3.10. Recovery for Technetium During Processing Using Composite Solution Data(a) ............... 3.16
Table 3.11. Recovery for Lead Column Loading and Elution of Technetium........................................ 3.18
Table 3.12. Estimate of Technetium retained on Lead and Lag Columns .............................................. 3.19

1.1
1.0 Introduction
The U.S. Department of Energy’s Hanford Site in southeastern Washington State contains 177 large underground storage tanks with approximately 55-million gallons of radioactive waste. Plans are underway to separate the waste into high-level and low-activity waste (LAW) streams. The primary unit processes of the Hanford waste-treatment flowsheet for LAW feed are cross-flow filtration, Sr/TRU(1) precipitation,(2) cesium and technetium ion exchange, evaporation, and vitrification. After solids are removed, the LAW feed will be passed through ion exchange columns to remove cesium and technetium. The decontaminated LAW feed will contain the bulk of the waste volume and will be vitrified as a low-activity glass and stored at the Hanford Site. The cesium and technetium eluted from the ion exchange columns will be mixed with tank sludge, vitrified as high-level waste, and eventually stored at a federal repository. This report describes the results of small-column testing of the SL-639 sorbent with 241-AP-101 tank waste supernate.(3) (The 241 prefix, common to all Hanford tanks, will not be used hereafter). Approximately 1.1 L of diluted tank waste feed (at 4.8 M Na) was processed through dual small-scale ion exchange columns. This tank waste did not undergo solids removal by cross-flow filtration or Sr/TRU removal, but was processed for Cs removal by ion exchange using SuperLig644 (Fiskum et al. 2002) before technetium ion exchange. The removal goal for the diluted AP-101 feed is to reduce the total Tc concentration by at least 98% after processing ≥ 250 bed volumes (BVs) of solution. The objectives of this work were to • demonstrate the effectiveness of all SL-639 process steps, including loading, feed displacement,
deionized (DI) water washing, elution, and resin regeneration • investigate the potential for resin and/or column fouling • demonstrate the 99Tc decontamination of an Envelope A material (Tank AP-101) • provide a technetium-decontaminated sample for downstream process testing (i.e., LAW melter-feed
testing and vitrification) • provide batch-distribution measurements on actual tank-waste feed.
This report discusses the experimental conditions for the column ion exchange test procedure. Work was performed in accordance with Scoping Statement B-43a, the test specification TSP-W375-00-00028,(4) Rev.1, and test plan CHG-TP-41500-013 Rev 0. The results of the feed composition, the batch distribution, the AP-101 column test, the comparison of the AP-101 initial feed and effluent composite composition, and the technetium mass balance are presented.
(1) TRU = transuranic. (2) Sr/TRU precipitation is only performed with Envelope C tank waste feed. Since AP-101 is an Envelope A feed,
Sr/TRU processing was not performed. (3) Work performed according to test plan CHG-TP-41500-013 Rev 0 Actual Waste Ion Exchange Testing for the
RPP-WTP Project and test instruction TI-RPP-WTP-083 Rev 0 AP-101 Tc Column Test Instructions. (4) Test Specification: “Tank 241-AN-102 and 241-AP-101 Ion Exchange”, TSP-W375-00-00028, Rev. 1,
December 11, 2000, M.E. Johnson, CH2MHill Hanford Group, Inc, Richland, WA.

2.1
2.0 Experimental
This section describes the sampling history for the AP-101 grab samples used in this testing, the feed preparation, and the SL-639 resin and bed preparation. It also covers the history of technetium processing with a resin bed, the batch-distribution measurements, and the column system for removing Tc. The column ion exchange test procedure and conditions are described. 2.1 AP-101 Sample History Hanford site personnel grab sampled Tank AP-101 in February 2000. The grab-sampling event collected three 125-mL bottles of AP-101 tank waste material from five elevations. Three sets of five sample bottles were grouped to allow the formation of a whole-tank composite. One set of the 125-mL bottles (one bottle from each elevation sampled) was immediately transferred to Battelle, Pacific Northwest Division (PNWD) for complete characterization (Urie et al. 2000), and the other two sets were archived at the 222-S laboratory. Subsequently, in January 2001, five bottles of AP-101 archived supernate (another set representing material from the same sampling event) was sent to PNWD for process testing. The 750 mL of this virgin material was supplemented with approximately 450 mL of archived AP-101 supernate from the same sampling event. Some of this archived material was diluted slightly with water at the 222-S laboratory, but was otherwise unaltered. These two sets of samples were delivered to PNWD in 13 bottles. 2.2 Feed Preparation Thirteen samples of the AP-101 supernate, a total of 1237 mL, were received in the Shielded Analytical Laboratory (SAL) at the Radiochemical Processing Laboratory (RPL) on January 17, 2001. These 13 bottles contained pristine material collected in the February 2000 grab-sampling event, some contained residual sample from processing at the 222-S laboratory, and some contained diluted AP-101 material. All of the supernate was composited into a single container, thoroughly mixed, and diluted by approximately 20% with the addition of DI water. The goal of the dilution was to produce an AP-101 feed with a sodium concentration of approximately 4.7 M, as specified by the client. The composite was thoroughly mixed after dilution and characterized (Urie et al. 2002). Approximately 1200 mL of the diluted AP-101 supernate composite was processed for cesium removal by ion exchange. The supernate did not undergo dilution or other intentional alteration as a result of the cesium ion exchange processing. After receipt of the sample from cesium ion exchange process testing (Fiskum 2002), 353 µCi of 95mTc (t1/2 = 61 days, decays to stable 95Mo) was added to the AP-101 supernate to act as a tracer for monitoring the removal of pertechnetate (TcO4
-). The 95mTc provides a strong gamma emission peak at 205 KeV. The radiotracer was added using a small volume (142 µL) of 2.49-mCi/mL ammonium pertechnetate (NH4
95mTcO4) prepared in 0.05 M ammonium hydroxide. The mole ratio of 99Tc to 95mTc was 2.1 × 10⁵, demonstrating that the contribution of the tracer to the total technetium is negligible. A 2-mL aliquot of the spiked feed provided 34,700 counts (peak area) in a 5-min count.

2.2
2.3 SL-639 Resin and Bed Preparation The SL-639 resin was supplied by IBC Technologies, Inc. (American Fork, UT) from batch # 010227CTC-9-23. The resin consists of a proprietary organic compound (ligand) attached to spherical styrene beads. SL-639 functions by extracting the sodium pertechnetate salt-pair from either acidic or basic solutions. The manufacturer reports the mean diameter of the beads (Dp) as 0.5 mm in diameter. A separate aliquot of this batch of SL-639 resin was sieved to determine the particle size distribution of the resin. Table 2.1 provides the results.
Table 2.1. Sieving Data for SL-639 Batch Number 010227CTC-9-23
Sieve Number Particle Size, µm Mass of Resin, g % of Total, (mass basis) Sieve 18 >1000 0.1345 1.35 Sieve 30 1000-600 2.6099 26.1 Sieve 40 600–425 5.9904 60.0 Sieve 50 425–300 1.1000 11.0 Sieve 70 300–212 0.1456 1.46
Sieve 100 212–150 0.0075 0.08 Totals 9.9879 100.0
A subsample of the as-received resin was pulled from the original 1-L container by scooping ~2-g increments of the resin while rotating and occasionally inverting the resin within the container. This material was not sieved. The resin was soaked in a 10-fold excess volume of DI water (14 g of resin soaked in 140 mL of water) for 2-h, the water was decanted, and the resin was soaked a second time in 1.0 M NaOH for 2-h and then decanted. No volume change was observed going from the dry-resin form to the wet-resin form. An aliquot of the resin was transferred to each of the two columns using the following approach. The resin (in 1.0 M NaOH) was transferred to a 10-mL graduated cylinder and allowed to settle overnight. The resin BV was adjusted to 5.0 ± 0.05 mL, slurried, and quantitatively transferred to the ion exchange column. The settled resin bed height was 3.1 cm, with a BV of 5.0 mL and a length-to-diameter ratio (L/D) of 2.1. The ratio of the column diameter (Dc) to the diameter of the resin beads (Dp) was approximately 20 to 30:1, which is a large enough Dc/Dp ratio to avoid wall-effects during small-scale column tests. The resin beds were gently packed with approximately 1 cm of quartz glass wool to prevent floating of the resin during contact with the AP-101 supernate. Duplicate fractions of the as-received resin (0.5 g each) were dried in a vacuum oven at 50°C until the dry mass was constant (within ±0.0006 g). This allowed a determination of the F factor (0.9931), which is the ratio of the mass of the dried exchanger to the mass of the wet exchanger. The bed density was determined by weighing 5.0 mL of exchanger in a 5-mL graduated cylinder (0.50 g/mL). Based on an as-received bed density of 0.50 g/mL and an F factor of 0.993, the dry mass of SL-639 in each column was estimated to be 2.5 g. Table 2.2 summarizes these values. The columns were prepared for AP-101 loading by flushing them with 5 BV (25 mL) of 0.25 M NaOH. This was done primarily to assure that the bed was sufficiently settled before starting the column run.
2.3
Table 2.2. Summary of Resin and Column Parameters
Resin Parameter Value Column Parameter Value
Resin ID/ Batch SL-639/ 010227CTC-9-23 Resin Bed Height 3.1 cm
Resin F Factor 0.9931 Resin BV 5.0 mL Resin Bulk Dry Density 0.50 g/mL Mass Resin in Column 2.5 g Resin Particle Density (a) 1.067 g/mL Column Diameter to Resin Diameter Ratio 20–30 Resin Diameter 460-670 µm(b) Column Length to Column Diameter Ratio 2.1 (a) particle density represents g of dry solid divided by the volume (mL) of wet resin particles determined with a
volumetric flask (b) Weight-percent-based resin diameter determined from sieve data.
2.4 History of Technetium Processing with Resin Bed After preparing the column resin beds as described in Section 2.5, the column system was tested using an AW-101 simulant (Burgeson 2002). Approximately 2.7 L of 99Tc-spiked AW-101 simulant were processed through the dual columns. Once in contact with the simulant feed, the resin bed began to float. As a result of this observation, all subsequent testing of the column system was performed using a quartz glass wool plug between the resin bed and the feed plunger to mitigate floating. All steps associated with the process removal of technetium were performed in the AW-101 simulant shakedown test: resin loading, feed displacement, water rinse, elution, water rinse, and resin regeneration. In this particular case, both columns were eluted and regenerated. The system was taken to 50% loading of technetium on the lead column (2.7 L at 64 µCi/L technetium). Each column was eluted until the C/C0 was <0.01. The column system remained in the same configuration during the AP-101 actual tank waste run, i.e., the lead column remained the lead column. However, as a result of the AW-101 simulant shakedown run, quartz glass wool was added to the headspace of both the columns to inhibit the bed from floating. The glass wool occupied the space between the resin bed and the plunger; there was no additional liquid headspace above the glass wool.
2.5 Batch Distribution Measurement A separate aliquot of the diluted AP-101 supernate composite was used to determine technetium-batch-distribution coefficients (Kd values) before performing the column testing. The AP-101 feed was processed to remove cesium before using the material for technetium-batch-distribution measurements. The resin was contacted with AP-101supernate spiked with approximately 150 µCi of 95mTcO4
-. The 95mTc was used as a tracer for following the removal of pertechnetate (TcO4
-) from solution. The contribution of technetium from the tracer is very small relative to the amount of technetium already present in the supernate (mole ratio 99Tc to 95mTc = 1.2 × 10⁵); therefore, the added tracer is not expected to affect the batch-distribution values. The 95mTc spiked AP-101 supernate was subdivided into three aliquots. The concentration of technetium in the AP-101 supernate was approximately 47 µCi/L. The total technetium concentration was increased in two aliquots to approximately 1,500 and 4,100 µCi/L using a stock solution of 99Tc (40 and 120 µL of 787 µCi/mL stock solution).

2.4
The batch contacts were conducted at a phase ratio of approximately 100:1 (liquid volume to resin mass), using a 50:50 mixture of SL-639 Batch #981015DHC720011 and 990420DHC720067. Five milliliters of AP-101 solution was contacted with 0.05 g of exchanger. The exchanger mass was determined to an accuracy of ±0.0001 g. The waste volume was transferred by pipette, and the actual volume was determined from the mass difference (±0.0002 g accuracy) and the solution density. An orbital shaker was used to provide agitation for approximately 96 h. The temperature was not controlled, and it varied between approximately 22°C and 25°C over the course of the 4-day contacts. All batch-distribution experiments were conducted in duplicate. After equilibration, the supernate was syringe filtered using a 0.45-µm nylon filter. The total 99Tc concentration in the AP-101 supernate was determined by inductively coupled plasma-mass spectroscopy (ICP-MS), which in turn was used to calculate the 99Tc Kds. The total 99TcO4
- concentration in the AP-101 supernates was determined by radiochemical separation and beta counting, which was used to calculate the 99TcO4
- Kds. The initial set of batch distributions was measured before receiving a new batch of SL-639 resin. The column run was performed with this new batch of resin, # 010227CTC-9-23. Therefore, another set of batch distributions was measured (in duplicate) using the new batch of resin. AP-101 supernate was spiked with 3.3 µCi of 95mTcO4
- and contacted with SL-639 Batch # 010227CTC-9-23. Four milliliters of AP-101 solution were contacted with 0.040 g of exchanger. An orbital shaker was used to provide agitation for approximately 96 h. The temperature was not controlled, and it varied between approximately 23°C and 25°C over the course of the 4-day contacts. Both the 95mTcO4
- Kd and 99Tc Kds were determined at the original technetium concentration of 47 µCi/mL. The batch distribution coefficient, Kd (with units of mL/g), was determined using the following relationship:
F*M
V * C
)C-C( = K1
10d (2.1)
where
C0 and C1 = the initial and final concentrations in solution, respectively, of the species of interest (i.e., 95mTcO4
- , 99TcO4- and 99Tc)
V = the volume of the liquid sample (mL) M = the mass of resin used for the contact (g) F = the mass of a sample of dried resin divided by its mass before drying. The resin was
sampled for F-factor determination at the same time resin samples for the batch contacts were measured to minimize mass changes due to changes in atmospheric humidity.
2.6 Tc Removal Column System Figure 2.1 is a schematic of the column system for removing technetium. The system, which is mounted in a radiological fume hood, consists of two small columns containing the sorbent resin, a small metering pump, three valves, a pressure gauge, and a pressure-relief valve. The pump inlet tube was manually switched between the waste feed and various process solutions. Valves 1, 2, and 3 are three-

2.5
way valves that can be turned to a flow position, a sample position, or a no-flow position. Valve 1 is placed at the outlet of the pump and is used to eliminate air from the system, purge the initial volume of the system, or isolate the columns from the pump. Valves 2 and 3 are primarily used for obtaining samples and may also be used to isolate the columns from the rest of the system. The columns are Spectra Chrom chromatography columns made of glass with adjustable plungers on the bottom and the top. The inside diameter of the columns is 1.5 cm, which corresponds to a volume of 1.77 mL per cm of length. The columns are jacketed with a clear plastic to provide temperature regulation and a safety shield. The connecting tubing is a polyfluorinated plastic with 1/8-in. OD and 1/16-in. ID. The columns are connected in series with the first column referred to as the lead column and the second column referred to as the lag column. An Accu piston pump (SciLog, Middleton, WI) was used to deliver feed to the columns. The flow rate was controlled with a metering pump head (Fluid Metering, Inc., Oyster Bay, NY) and a pump stroke rate controller (0.025 mL/stroke). The volume actually pumped through the system is determined using the effluent mass (including analytical samples) and the fluid density. The pressure-relief valve is set at 40 psi, which is below the maximum operating pressure for the columns. The pressure indicated on the pressure gauge remained below 5 psi during the run. The system apparatus volume was measured to be 20 mL (4 BV) with approximately 10 mL (2 BV) volume holdup from the feed line to the lead column.
PR PG
Col
umn
1
V alve #1 3 - Way Valve
Valve #2
Samples from Column 1
Col
umn
2
Effluent Collection Jug
Valve #3
Samples from Column 2
Pressure Relief Valve
Pressure Gauge Metering
Pump
Figure 2.1. Schematic Representation of Column System for Removing Technetium
2.7 Column Ion Exchange Test Procedure and Conditions Table 2.3 shows the experimental conditions for each process step of the column ion exchange test. The bed preparation, loading, and feed-displacement steps were conducted by passing the specified solution through both resin beds connected in series. Only the lead column was rinsed with DI water, eluted, and regenerated, as indicated in column one of the table.

2.6
Table 2.3. Experimental Conditions of AP-101 Supernate Small-Scale (a) Ion Exchange
Column Process Step Solution Total Vol mL/(BV)
Flow rate mL/h/(BV/h)
Time, h (min)
Lead and Lag Column Prep 0.25 M NaOH 15 (3) 15 (3) 1 (60) Lead and Lag Loading AP-101 Feed 1100–1200
(220–240) 15 (3) 73–80
Lead and Lag Feed (b) Displacement 0.10 M NaOH ~45 (2 apparatus volumes)
15 (3) ~2.7 (~160)
Lead Rinse DI water 10 (2) 15 (3) 0.7 (40) Lead Elution DI @ 65°C 200 (40) 5 (1) 40 (2400) Lead Regeneration 0.25 M NaOH ~20 (2) 5 (1) ~8 (480) (a) The BV for each column was 5.0 ± 0.1 mL. (b) 0.10 M NaOH is used to prevent the feed from precipitating, even though it has been
demonstrated to slightly elute technetium from the loaded column. The adjustable plungers at the top of each column were used to minimize the volume of solution above each of the resin beds. The resin beds were gently packed with approximately 0.7 cm of quartz glass wool to prevent the resin from floating during contact with the AP-101 feed. Both the resin bed height and quartz glass-wool height were carefully monitored throughout the loading and elution process. There was no observed change in the height of either material, indicating that if the resin BV changed during the run, the change was less than 0.1 mL, or less than 2% of the total BV. All steps of the column run were performed at ambient temperature, with the exception of the elution, which was performed at 65°C. Ambient temperature during this run ranged from 24 to 28°C. A recirculating water bath was used to circulate heated water through the column jacket during elution. Unlike the results observed in previous column tests where elution was performed with 50°C water or 0.5M HNO3 (Blanchard et al. 2000a, Blanchard et al. 2000b), the elution progressed relatively quickly. Table 2.4 shows the sampling-and-analysis protocol. The TcO4
- C/C0 was determined in all samples by counting the 95mTc gamma emission at 205 KeV with a portable gamma spectrometer equipped with a Ge flat crystal detector. All analytical samples collected during the loading stage were approximately 2 mL. The analytical samples were weighed to within ±0.0001 g and counted for 95mTc. The counting data were normalized to 2.0 mL of solution using the density of the AP-101 feed and compared to the counts of 2.0 mL of the AP-101 feed solution. All other analytical samples were collected in 5 mL or larger increments; thus, 2-mL sample aliquots were counted, and no data adjustment was necessary. The TcO4
-
C/C0 ratios were determined by taking the ratio of the peak area of the original feed with the peak area of the loading and the effluent samples. The original feed sample was recounted periodically (at least every 4 h) to minimize the effects of the 95mTc decay on the C/C0 calculations. This method allowed near real-time monitoring of the loading and elution steps. After completing the loading and elution cycles, the samples were recounted over a 2-day period to provide more consistent counting data in samples with low levels of technetium (i.e., 95mTc). The total technetium (99Tc) levels were determined by inductively coupled plasma-mass spectrometry (ICP-MS) in selected samples encompassing the entire processing scheme after the run was concluded. Inductively coupled plasma-atomic emission spectrometry (ICP-AES) was used to determine sodium and other elemental concentrations for samples from the feed displacement and regeneration steps. Free

2.7
hydroxide ion concentrations were determined by titration with standard hydrochloric acid solutions for the feed displacement and regeneration samples. Table 2.4 identifies the analyses performed on the samples collected during the ion exchange column run and the final sample composites.
Table 2.4. Sampling Interval and Analyses of Small-Scale Ion Exchange Column Process Stages
Process Step Lead Column
BV Lag Column
BV
Analytical Sample Vol
(mL) Analyses (a)
Original Feed -- -- -- ICP-MS, ICP-AES, OH-, IC(c) anions and pertechnetate
Column Prep. - - - - Loading Every 10 BV Every 20 BV 2 ICP-MS Feed Displacement - Every 1 BV 5 ICP-AES, ICP-MS, OH- DI water rinse 2 BV - 10 ICP-AES, ICP-MS, OH-
Elution Every ½ /1 BV (b)
- 2.5/5 (b) ICP-MS
Regeneration - 1 composite 10 ICP-AES, ICP-MS, OH- Composite Samples
Effluent - 1 composite 20 ICP-AES, IC(c) , TOC(d) TIC,(e) IC, OH-, ICP-MS, U, Radchem (f)
Eluate 1 composite - 20 ICP-AES, TIC, TOC, IC, OH- ICP-MS, U, Radchem (g)
(a) The composite samples were analyzed for both the ion exchange analytes as well as the high level waste and LAW vitrification analytes of interest. This table identifies only the Tc ion exchange analytes of interest.
(b) Initial samples (first 10 BV) were taken in ½ BV increments, resulting in 2.5-mL samples. (c) IC = ion chromatography (d) TOC = total organic carbon (e) TIC = total inorganic carbon (f) Radchem analyses were separation/alpha energy analysis (AEA), extended counting gamma energy analysis
(GEA), and pertechnetate speciation. (g) Radchem analyses were 90Sr and GEA.
3.1
3.0 Results and Discussion
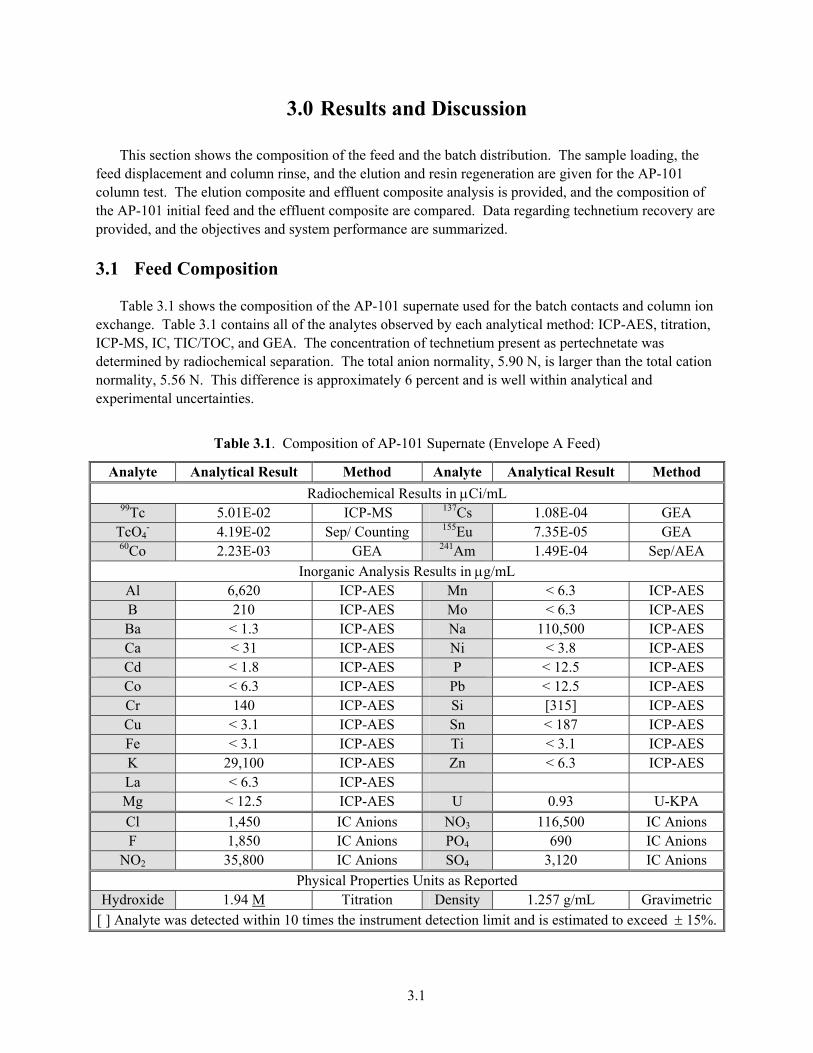
This section shows the composition of the feed and the batch distribution. The sample loading, the feed displacement and column rinse, and the elution and resin regeneration are given for the AP-101 column test. The elution composite and effluent composite analysis is provided, and the composition of the AP-101 initial feed and the effluent composite are compared. Data regarding technetium recovery are provided, and the objectives and system performance are summarized. 3.1 Feed Composition Table 3.1 shows the composition of the AP-101 supernate used for the batch contacts and column ion exchange. Table 3.1 contains all of the analytes observed by each analytical method: ICP-AES, titration, ICP-MS, IC, TIC/TOC, and GEA. The concentration of technetium present as pertechnetate was determined by radiochemical separation. The total anion normality, 5.90 N, is larger than the total cation normality, 5.56 N. This difference is approximately 6 percent and is well within analytical and experimental uncertainties.
Table 3.1. Composition of AP-101 Supernate (Envelope A Feed)
Analyte Analytical Result Method Analyte Analytical Result Method Radiochemical Results in µCi/mL
99Tc 5.01E-02 ICP-MS 137Cs 1.08E-04 GEA TcO4
- 4.19E-02 Sep/ Counting 155Eu 7.35E-05 GEA 60Co 2.23E-03 GEA 241Am 1.49E-04 Sep/AEA
Inorganic Analysis Results in µg/mL Al 6,620 ICP-AES Mn < 6.3 ICP-AES B 210 ICP-AES Mo < 6.3 ICP-AES Ba < 1.3 ICP-AES Na 110,500 ICP-AES Ca < 31 ICP-AES Ni < 3.8 ICP-AES Cd < 1.8 ICP-AES P < 12.5 ICP-AES Co < 6.3 ICP-AES Pb < 12.5 ICP-AES Cr 140 ICP-AES Si [315] ICP-AES Cu < 3.1 ICP-AES Sn < 187 ICP-AES Fe < 3.1 ICP-AES Ti < 3.1 ICP-AES K 29,100 ICP-AES Zn < 6.3 ICP-AES La < 6.3 ICP-AES Mg < 12.5 ICP-AES U 0.93 U-KPA Cl 1,450 IC Anions NO3 116,500 IC Anions F 1,850 IC Anions PO4 690 IC Anions
NO2 35,800 IC Anions SO4 3,120 IC Anions Physical Properties Units as Reported
Hydroxide 1.94 M Titration Density 1.257 g/mL Gravimetric [ ] Analyte was detected within 10 times the instrument detection limit and is estimated to exceed ± 15%.

3.2
The compositions of selected anions and cations, as well as information important to technetium ion exchange are collected in Table 3.2.
Table 3.2. Selected Composition of AP-101 Supernate (Envelope A Feed)
Analyte Moles/Liter (M) Na+ 4.81 K+ 0.75 AlO2
- (a) 0.25 Cl- 0.04 CO3
-2 (b) 0.49 CrO4
-2 (a) 0.003 NO2
- 0.78 NO3
- 1.88 OH- (b) 2.40 PO4
-3 0.01 SO4
-2 0.03 Oxalate 0.02
99Tc and Competing Ion Ratios 99Tc, µCi/L (mg/L) 50.1 (2.97)
99Tc as pertechnetate, µCi/L (mg/L) 42 (c) (2.47) NO3
-/99Tc mole ratio 6.25E+04 CrO4
-2/99Tc mole ratio 90 Solution Density, g/mL 1.257
(a) Elemental Al and Cr were determined by ICP-AES. The anionic form, CrO4
-2, is assumed on the basis of waste chemistry. (b) Hydroxide and carbonate were determined by titration. Hydroxide was
assigned as the first equivalence point, and carbonate was assigned as the second equivalence point.
(c) These pertechnetate analytical results are suspected of being artificially low.
3.2 Batch Distribution The equilibrium behavior of the sorbent material was assessed by measuring batch-distribution coefficients on the original feed and the feed spiked at two higher concentrations of technetium. Table 3.3 shows the results of duplicate distribution-coefficient measurements. The sodium, nitrate, and technetium concentrations and the density reported in the column “Feed Conditions” reflect initial conditions. The nitrate-to-technetium mole ratio reflects the equilibrium concentration of nitrate and the equilibrium concentration of technetium.

3.3
Table 3.3. AP-101 Technetium Kd Values—Average of Duplicate Measurements
Sample Feed Conditions Total Tc Kd, mL/g (a)
(% Removal) TcO4
- Kd, mL/g(b) (%Removal)
AP-101 Original
Na = 4.8 M 99Tc= 47 µCi/L (2.77 mg/L) NO3
-/Tc, eq = 5.13E+05 NO3
-/TcO4-, eq = 6.45E+05
SL-639 batch #981015DHC720011 and 990420DHC720067
790 (89%)
Percent Difference (c) = 2%
790 (89%)
Percent Difference (c) = 17%
AP-101 Spike 1
Na = 4.8 M 99Tc = 1510 µCi/L (88.9 mg/L) NO3
-/Tc, eq = 1.19E+04 NO3
-/TcO4-, eq = 1.50E+04
SL-639 batch #981015DHC720011 and 990420DHC720067
590 (82%)
Percent Difference (c) = 13%
570 (82%)
Percent Difference (c) = 36%
AP-101 Spike 2
Na = 4.8 M 99Tc = 4095 µCi/L (241 mg/L) NO3
-/Tc, eq = 2.70E+03 NO3
-/TcO4-, eq = 3.64E+03
SL-639 batch #981015DHC720011 and 990420DHC720067
330 (75%)
Percent Difference (c) = 8%
330 (75%)
Percent Difference (c) = 2%
AP-101 Original
Na = 4.8 M 99Tc = 47 µCi/L (2.77 mg/L) NO3/Tc, eq = 1.60E+06 NO3
-/TcO4-, eq = 9.41E+03
SL-639 batch #010227CTC-9-23
1780 (95%)
Percent Difference (c) = 0%
1220 (92%) (d)
Percent Difference (c) = 12%
(a) The total Tc Kd is assumed to be equal to the 99Tc Kd. (b) The TcO4
- Kd is determined from pertechnetate speciation data. (c) The percent difference is determined by taking (Initial Kd –Duplicate Kd)/Initial Kd times 100. (d) The Kd is based upon 95mTc counting data. The distribution coefficients were determined by assessing the change in both the 99Tc and TcO4
- in solution and are reported as either 99Tc or TcO4
- Kd values. The 99Tc concentration reflects the total technetium-solution concentration, which includes both pertechnetate and non-pertechnetate forms of technetium. The equilibrium mole ratio of nitrate to technetium was determined using the equilibrium concentration of nitrate and the equilibrium concentration of either total technetium or pertechnetate. Table 3.3 shows both values. The 99Tc Kd values are assumed to be equivalent to the total Tc Kds. The percent differences between the duplicate measurements are indicated along with the average Kd values in the table. Note that the Kd values are the same for both 99Tc- and TcO4
--derived values, with the exception of the AP-101 Spike 1 results (590 versus 570). Figure 3.1 is a plot of the Kds versus the equilibrium mole ratio of nitrate to technetium. Both the 99Tc- and TcO4
--derived Kd values are shown in the figure.

3.4
Equilibrium Mole Ratio NO3-/ 99 or 95mTc
1.0e+2 1.0e+3 1.0e+4 1.0e+5 1.0e+6
Tc
Kd m
L/g
0
200
400
600
800
1000
1200 ConditionsSolution: AP101 @ 4.8 M NaBatch: 50:50 981015DHC720011 and 990420DHC720067OR batch 010227CTC-9-23Phase Ratio: 100 mL/g C0 (99Tc): 47 uCi/L (2.77 mg/L)NO3: 1.87 M
50:50 batch, Tc-99
50:50 batch, 95mTcO4-
batch 010227CTC-9-23, 95mTcO4-
TcO4- Fit
99Tc Fit
AP101 Feed NO3-/Tc Ratio
Figure 3.1. 99Tc- and TcO4
--Derived Kd Values
As can be seen in Figure 3.1, the Kd values for resin batch 010227CTC-9-23 are significantly higher than the Kd values for the 50:50 mixture resin batch (1220 versus 790). Because there was a limited amount of AP-101 feed available, only one mixture was contacted with the 010227CTC-9-23 batch. Hence, it is necessary to extrapolate the data based upon the results of the 50:50 batch to predict the column performance with the new batch of resin. Using the slope determined from the first set of Kds (50:50 batch), the predicted Kd value at the AP-101 initial feed conditions for the 010227CTC-9-23 resin batch is ~1000. This results in an estimated λ value (Kd x resin density) of ~500 BVs. 3.3 AP-101 Column Test – Sample Loading The ion exchange system was shaken down using an AW-101 simulant before performing the AP-101 run (Burgeson et al. 2002). The AW-101 simulant was tested under the same conditions as the AP-101 run described in Section 2.5 with one exception. Both columns were eluted independently in the AW-101 simulant run. After elution, both columns were regenerated using 0.25 M NaOH and were stored under these conditions for 9 days before starting the AP-101 ion exchange testing. Immediately before starting to load the AP-101 feed, the system was flushed with fresh 0.25 M NaOH (25 mL at 15 mL/h). The AP-101 feed was processed through the system beginning May 21, 2001. The loading stage lasted for 94 h, in which time 220 BVs of AP-101 feed were processed. The flow rate was determined at each sampling event and was approximately 16 mL/h (3.2 BV/h) throughout the run. There were no observed anomalies, i.e., bed fluidization, gas bubbles, changes in resin bed height or color, etc. The pressure remained below 5 psi during the entire loading cycle.

3.5
Analytical samples were collected from the lead column at 1, 4, 7, and 10 BVs of processed feed. The feed was first processed through the column system until 1½ apparatus volumes had passed through the system. At this point, the first sample collected was considered to be 1 BV. After the tenth BV of feed was processed, only one analytical sample was collected every 10 BVs from the lead column. The lag column was not sampled as frequently as the lead column; samples were collected after the 4th and 10th BVs of processed feed, and then the frequency was decreased to 1 every 20 BVs. The column loading was monitored using gamma emission spectrometry analysis of 95mTc, which reflects the concentration of total pertechnetate present in each sample. The ratio of the measured 95mTc passing through the lead and lag column with respect to the initial amount of 95mTc in the ion exchange feed (C/C0) was calculated and is reported in Figure 3.2 for each sample. In addition, selected loading samples were analyzed for total technetium (99Tc). Figure 3.2 also shows the ratio of the initial 99Tc and the 99Tc measured in the loading samples.
Bed Volumes of Feed
0 100 200 300 400 500
Tc
C/C
0 %
0.01
0.1
1
10
30
50
99Tc Lead Column99Tc Lag Column95mTcO4
- Lead Column 98% removal of Tc
Process Information for AP-101 RunFeed: AP-101 @ 4.8 M NaFeed Rate: 16 mL/hrBed Volume: 5.0 mLTemperature: 24-28 CResin: SuperLig 639Batch: 010227CTC-9-23C0 (99Tc): 50 uCi/L (2.97 mg/L)
NO3/ 99Tc: 62,600
C/C0 = 2% (98% removal of 99Tc)
C/C0 = 50% @ ~500 BV
Figure 3.2. AP-101 Technetium Loading Breakthrough Curves, Lead and Lag Columns
The C0 value for 99Tc was 50.1 µCi/L (2.97 mg/mL).(1) The initial 95mTcO4
- C0 was 2720 counts/min/mL of sample. This decayed to 2505 counts/min/mL of sample by the end of the run. The 95mTcO4
- C0 was recounted periodically to account for this decay. The C/C0 % values are plotted on a
(1) Note that the 99Tc concentration (50 µCi/L) of the ion exchange feed is not the same as that of the initial batch
distribution 99Tc concentration (47 µCi/L). This difference of 6% is within the stated analytical uncertainty.
3.6
probability scale. The C/C0 value of 2% is marked on the plot. This corresponds to 98% removal of technetium, the target technetium removal for Envelope A and B waste feeds. The technetium breakthrough, after processing approximately 1100 mL of AP-101 feed, was 5.2% on the lead column and 0.5% on the lag column, based upon the 99Tc concentration values. The 95mTcO4
-
breakthrough, measured during monitoring of the loading, was approximately 4.9% on the lead column and 0.2% on the lag column, indicating that the 95mTcO4
- tracer monitors the system fairly accurately. Comparing the 99Tc and 95mTcO4
- values demonstrates that approximately 99.5% of the technetium was in the pertechnetate form. The 95mTcO4
- values for the lag column were scattered and are not shown in the figure. The 99Tc values demonstrate that the technetium concentration in samples from the lag column was essentially constant. The data for the lead column provided fairly typical breakthrough curves once the concentration of the technetium passing through the column was high enough to quantitate accurately. The initial 99Tc decontamination factors (DFs) for the first and second columns (derived from the 99Tc concentration in the first sample from each column) are 230 and 210, respectively. The corresponding initial DFs for pertechnetate (similarly derived from the 95mTcO4
- C/C0 in the first sample from each column) were >320. This value is based upon the counting data collected on the samples after processing 50 BVs of feed. These were the first samples in which the pertechnetate counting data were approximately 100 counts above background. A better measurement of the technetium decontamination is the total DF observed for the system, i.e., the concentration of technetium remaining in the effluent compared to the initial concentration of the ion exchange feed. The overall TcO4
- DF was 123. The concentration of TcO4- in the effluent composite was
3.42E-01 µCi/L, and the initial concentration of TcO4- was 4.19E+01 µCi/L. The effluent composite
concentration demonstrates a pertechnetate removal of 99.2%. The overall 99Tc DF was 105. The concentration of 99Tc in the effluent composite was 4.77E-01 µCi/L, and the concentration of 99Tc in the initial feed was 50.1 µCi/L. The effluent composite concentration demonstrates a total technetium removal of 99%. The λ value is the number of BVs of processed feed at which the C/C0 value reaches 50% and is a direct indicator of the effective capacity of the resin. Since there was only ~5% breakthrough of technetium on the lead column, the λ value could not be experimentally determined. A rough estimate of the λ value can be obtained from extrapolating the loading-curve data plotted on a linear scale. This extrapolation provides an estimate of 500 BVs of feed that could be processed before reaching 50% C/C0 breakthrough. This value compares favorably with the λ value calculated from the batch-contact data, i.e., 500 BVs. 3.4 AP-101 Column Test – Feed Displacement and Column Rinse Feed displacement was started immediately after the last load sample was collected. The beds were flushed in series with 0.10 M NaOH at 3.0 BV/h to displace the feed before elution. The feed displacement was monitored using gamma emission spectrometry analysis of 95mTc, which reflects the concentration of total pertechnetate present in each sample. The ratio of the measured 95mTc passing through the lead and lag column with respect to the initial amount of 95mTc in the ion exchange feed (C/C0) was calculated during displacement. After rinsing for 8 BVs, a small sample was collected

3.7
from the lead column and measured for 95mTcO4-. The C/C0 was ~7%. The feed displacement was
continued for an additional 2 BV, and then another sample was collected from the lead column. The C/C0 was 17%, indicating that the 0.10 M NaOH solution was eluting technetium from the lead column. The feed displacement was immediately stopped, and enough DI water was passed through the system (20 mL) to rinse the lead column.
The ratio of the measured 95mTc passing through the lead and lag column with respect to the initial amount of 95mTc in the ion exchange feed (C/C0) was calculated and is reported in Figure 3.3 for each feed displacement and water rinse sample. In addition, selected feed-displacement samples were analyzed for total technetium (99Tc). Figure 3.3 also shows the ratio of the initial 99Tc and the 99Tc measured in the last loading sample (x = 0).
Figure 3.3. 99Tc and 95mTcO4
- C/C0 for Feed Displacement
The 95mTcO4
- concentration from the lag column remained essentially unchanged throughout the feed displacement and rinse stages. The lead column 95mTcO4
- concentration began to increase quickly after 8 BVs. The elution was caused by a decrease in the ionic strength of the solution in contact with the SL-639 resin. The elution of TcO4
- with 0.10 M NaOH has been observed in previous column waste

3.8
testing (Blanchard 2000a, 2000b) and is consistent with observations from Savannah River testing (King 1999). The magnitude of the 95mTcO4
- increase is not mimicked by the 99Tc data, indicating that the technetium elution during feed displacement and rinsing may be over estimated by the counting data. The feed-displacement solutions were analyzed to determine the concentration of Al, K, Na, and OH- present in each solution. Figure 3.4 shows the concentrations of sodium, potassium, aluminum, and hydroxide in the feed displacement. The concentrations of Na, K, and Al are indicated on the left-hand axis while the OH- concentration is shown on the right-hand axis. Both Y-axes are logarithmic scales in order to clearly show the large decreases in the analyte concentrations. The samples were collected from the lag column after the solution had passed sequentially through both columns.
Bed Volume
0 2 4 6 8 10 12 14
Al,
K, N
a C
once
ntra
tion,
ug/
mL
1e+1
1e+2
1e+3
1e+4
1e+5
1e+6
Con
cent
ratio
n O
H- , M
0.01
0.1
1
10
Al, ug/mL K, ug/mL Na, ug/mL
OH-, M Rinse DatafromColumn 1
DI RinseCaustic Wash (0.10 M NaOH)
Figure 3.4. Component Concentrations in Feed-Displacement Samples
The concentrations of the four feed components did not change during the first four BVs of processing. The concentrations dropped significantly (at least 50% decrease) starting at the fifth BV and continuing through the feed-displacement process. The displacement of the feed was reasonably sharp, but there were some observed concentration fluctuations during feed displacement. The Na and OH- concentrations do not drop as low as the other analytes because they are present in the displacement solution. Table 3.3 reports the percent reduction of the analyte concentrations during feed displacement. The observed color change in the samples (from yellow to colorless) and the behavior of 99Tc, 95mTcO4
-, and the other feed analytes demonstrate that the first four BVs consist of feed holdup. This is consistent with the estimated system-holdup volume of 4 BVs, as stated in Section 2.5.

3.9
The 0.10 M NaOH feed displacement was followed by a room temperature DI water rinse of only the lead column. The column was rinsed immediately after the feed displacement was completed. The DI water-rinse stage used approximately 2 BVs of water flowing at a rate of 3 BV/h. The rinse sample was collected as one sample. Figure 3.4 and Table 3.4 show the concentrations of sodium, potassium, aluminum, and hydroxide that were measured in the rinse sample. The elution of technetium, started during feed displacement, continued during the water wash. The 95mTcO4
- was measured in the rinse sample at a C/C0 value of 24%.
Table 3.4. Percent Displacement (a) of Feed Analytes from Resin Beds
Sample
Bed Volumes
Al, % displaced
K, % displaced
Na, % displaced
OH-, % displaced
FD-1 Lag Column 1.1 4.5 5.3 0.8 16.8 FD-2 Lag Column 2.1 4.7 5.3 -1.5 18.9 FD-3 Lag Column 3.2 6.6 7.4 0.9 16.8 FD-4 Lag Column 4.2 12.0 9.3 4.8 21.3 FD-5 Lag Column 5.3 63.7 59.0 53.3 58.2 FD-6 Lag Column 6.3 87.1 79.1 82.7 87.7 FD-7 Lag Column 6.7 96.6 85.3 94.5 94.7 FD-9 Lag Column 8.8 98.4 90.3 96.7 96.3 FD-10 Lag Column 9.9 99.1 94.3 97.4 95.5 FD-8 Lead Column 7.8 94.0 93.5 92.1 91.0 FD-11 Lead Column 10.3 99.5 99.5 97.7 95.9 Rinse Sample- Lead
Column 12.3 99.6 99.7 97.7 95.9
(a) The percent displaced is determined from the difference of the original AP-101 feed composition and the analyzed feed-displacement samples.
3.5 AP-101 Column Test—Elution and Resin Regeneration At the completion of the DI water rinse, the lead column was immediately eluted with 65°C DI water at a rate of 1 BV/h. The column was equilibrated for approximately 15 min before elution was started by running pre-equilibrated 65°C water through the column jacket. The elapsed time between the rinse cycle and the start of the elution was 15 min. The eluate was collected in 1-BV increments and monitored using gamma emission spectrometry analysis of 95mTc.
Figure 3.5 indicates the ratio of the measured 95mTc eluted from the lead column with respect to the initial amount of 95mTc in the ion exchange feed (95mTc C/C0), which was calculated for each sample during the elution stage. In addition, selected elution samples were analyzed for total technetium (99Tc). Figure 3.5 also shows the ratio of the initial 99Tc and the 99Tc measured in the elution samples. The Y-axis is a logarithmic scale to clearly show the large range of C/C0 values.

3.10
Bed Volumes Processed
0 5 10 15 20 25
Tc
C/C
0
0.001
0.01
0.1
1
10
100
1000
99Tc95mTc
Elution of AP-101 Lead Column with Water Waste: AP101 @ 4.8 M NaEluant: DI WaterFeed Rate: 5 mL/hrBed Volume: 5.0 mLTemperature: 65 CResin: SuperLig 639Batch: 010227CTC-9-23C/Co <1% at 17 CV
C/C0 = 1%
Figure 3.5. Elution of Technetium from Lead Column
The concentrations of 99Tc and 95mTcO4
- paralleled one another quite nicely. The elution of technetium peaked at approximately 2 BVs with a value approximately 105 times higher than the initial feed concentration. There was a slight fluctuation in the elution data during the peak elution stage of 2 to 5 BVs, but thereafter, the elution progressed smoothly. The 95mTcO4
- C/C0 values show a high variability once the concentration of technetium decreased below 4 percent of the original feed concentration. However, the elution could be readily followed to C/C0 ≤1%, the target column elution value. This target, C/C0 ≤1%, was reached after processing 17 BVs of eluant. To assure that the 95mTcO4
- C/C0 value had reached the target C/C0 ≤1% value, a total of 23 BVs of eluant was passed through the lead column. The system was stored in the water eluant for 6 days before regenerating the lead column with 0.25 M NaOH to allow time to resolve questions with the initial elution data. Ten milliliters of NaOH were passed through the lead column at a flow rate of 1 BV/h. The regenerate was analyzed for various analytes; Table 3.5 shows the results of these analyses.

3.11
Table 3.5. Composition of Column Regenerate after AP-101 Column Run
Analyte Concentration, µg/mL Concentration, M Na 1040 4.75E-02 K < 10 < 1.03E-03 Al 13.8 5.12E-04
OH- - 2.1E-02 99Tc 0.042 (7.11E-04 µCi/mL) 4.23E-07
The concentration of 99Tc present in the regeneration sample was 3.4% of the amount of Tc observed in the initial feed. The measured concentration of sodium and hydroxide was much less than the expected concentration of sodium and hydroxide based upon the presence of 0.25 M NaOH. This indicates that the amount of 0.25 M NaOH passed through the column for regeneration was small compared to the holdup of DI water in the system. Although the target volume for regeneration was 20 mL, only half of that volume was processed during regeneration. 3.6 AP-101 Column Test—Elution Composite and Effluent Composite
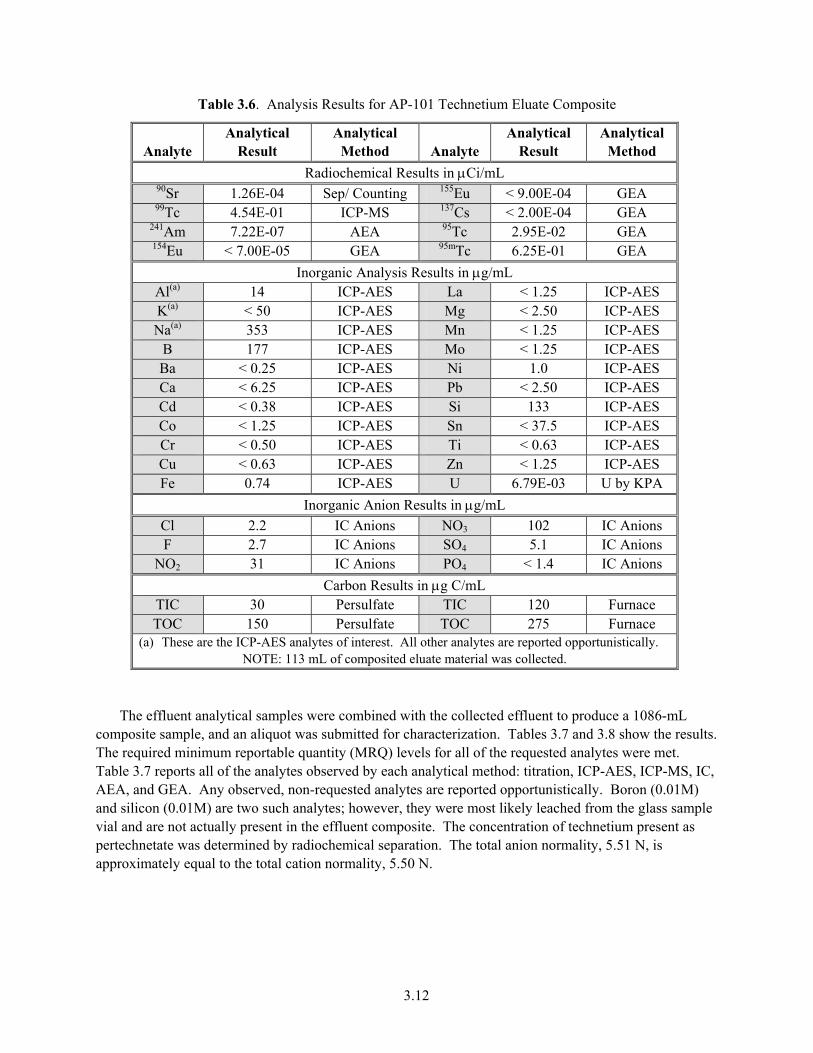
Analysis The eluate samples were combined to produce a 116-mL composite sample, and an aliquot was submitted for characterization. Table 3.6 shows the results. The required minimum reportable quantity (MRQ) levels for all of the requested analytes were met. Table 3.6 contains all of the analytes observed by each analytical method: titration, ICP-AES, ICP-MS, IC, AEA, and GEA. Any observed, non-requested analytes are reported opportunistically. The main chemical components of the eluate composite were sodium and hydroxide. Although silicon and boron were both observed in the eluate composite, they were most likely due to leaching of the borosilicate glass vials used for sample storage. Aluminum, chloride, fluoride, and sulfate were observed in very low quantities. Nitrate and nitrite were observed at approximately 0.1% of the initial feed, indicating that there may have been either some retention and subsequent elution of nitrate and nitrite by the resin or a slight feed residue was in the eluate composite—most likely due to the first few elution samples or holdup in a sampling valve. The TIC and TOC values were 30 µg C/mL and 150 µg C/mL, respectively. The TIC value is approximately 0.5% of the initial feed, and the TOC value is 8% of the original feed. The TOC content was higher than the TIC content in the eluate, whereas in the original feed, the TIC was higher than the TOC. The elevated TOC level may be due to picking up some organic material from the resin, e.g., from decomposition of the resin. Alternatively, there may have been some retention and subsequent elution of oxalate by the resin. The major radionuclide observed in solution was technetium. A slight amount of 90Sr, 0.2% of original feed, was also present in the eluate composite. This corroborates the observation that there was feed hold up in the system after feed displacement and rinsing.
3.12
Table 3.6. Analysis Results for AP-101 Technetium Eluate Composite
Analyte Analytical
Result Analytical
Method Analyte Analytical
Result Analytical
Method Radiochemical Results in µCi/mL
90Sr 1.26E-04 Sep/ Counting 155Eu < 9.00E-04 GEA 99Tc 4.54E-01 ICP-MS 137Cs < 2.00E-04 GEA
241Am 7.22E-07 AEA 95Tc 2.95E-02 GEA 154Eu < 7.00E-05 GEA 95mTc 6.25E-01 GEA
Inorganic Analysis Results in µg/mL Al(a) 14 ICP-AES La < 1.25 ICP-AES K(a) < 50 ICP-AES Mg < 2.50 ICP-AES Na(a) 353 ICP-AES Mn < 1.25 ICP-AES
B 177 ICP-AES Mo < 1.25 ICP-AES Ba < 0.25 ICP-AES Ni 1.0 ICP-AES Ca < 6.25 ICP-AES Pb < 2.50 ICP-AES Cd < 0.38 ICP-AES Si 133 ICP-AES Co < 1.25 ICP-AES Sn < 37.5 ICP-AES Cr < 0.50 ICP-AES Ti < 0.63 ICP-AES Cu < 0.63 ICP-AES Zn < 1.25 ICP-AES Fe 0.74 ICP-AES U 6.79E-03 U by KPA
Inorganic Anion Results in µg/mL Cl 2.2 IC Anions NO3 102 IC Anions F 2.7 IC Anions SO4 5.1 IC Anions
NO2 31 IC Anions PO4 < 1.4 IC Anions Carbon Results in µg C/mL
TIC 30 Persulfate TIC 120 Furnace TOC 150 Persulfate TOC 275 Furnace
(a) These are the ICP-AES analytes of interest. All other analytes are reported opportunistically. NOTE: 113 mL of composited eluate material was collected.
The effluent analytical samples were combined with the collected effluent to produce a 1086-mL composite sample, and an aliquot was submitted for characterization. Tables 3.7 and 3.8 show the results. The required minimum reportable quantity (MRQ) levels for all of the requested analytes were met. Table 3.7 reports all of the analytes observed by each analytical method: titration, ICP-AES, ICP-MS, IC, AEA, and GEA. Any observed, non-requested analytes are reported opportunistically. Boron (0.01M) and silicon (0.01M) are two such analytes; however, they were most likely leached from the glass sample vial and are not actually present in the effluent composite. The concentration of technetium present as pertechnetate was determined by radiochemical separation. The total anion normality, 5.51 N, is approximately equal to the total cation normality, 5.50 N.

3.13
Table 3.7. Inorganic and Carbon Composition of Tc and Cs IX Effluent Composite AP-101
Analyte Analytical Result Analytical
Method Analyte Analytical Result Analytical
Method Inorganic Analysis Results in µg/mL
Al 6,305 (0.23 M) ICP-AES Mo [12] (1.2E-04 M) ICP-AES B 84.2 (7.6E-03 M) ICP-AES Na 111,500 (4.85 M) ICP-AES Ba [0.33] (2.4E-06 M) ICP-AES Ni [3.0] (5.1E-05 M) ICP-AES Be [0.91] (1.0E-04 M) ICP-AES P 348 (1.1E-02 M) ICP-AES Ca [11] (2.9E-04 M) ICP-AES Pb [5.8] (2.8E-05 M) ICP-AES Cd [2.1] (1.9E-05 M) ICP-AES Rb 3.24 (3.8E-05 M) ICP-AES Cr 131 (2.5E-03 M) ICP-AES S -- (a) ICP-AES Cs < 2.5E-03 ICP-MS Si 380 (1.4E-02 M) ICP-AES Fe [1.2] (2.2E-05 M) ICP-AES Sn [64] (5.4E-04 M) ICP-AES K 25,850 (0.66 M) ICP-AES Zn [4.7] (5.1E-05 M) ICP-AES La < 1.3 (< 9.2E-06 M) ICP-AES Mg
< 2.5 (< 1.1E-04 M) ICP-AES U 1.09 (4.6E-06 M) U by KPA
Inorganic Anion Results in µg/mL Cl 1,395 (0.039 M) IC Anions NO3 96,150 (1.55 M) IC Anions F 2,235 (0.12 M) (b) IC Anions PO4 885 (0.0093 M) IC Anions NO2 34,000 (0.74 M) IC Anions SO4 2,975 (0.031 M) IC Anions
Carbon Results in µg C/mL TIC 5,265 Persulfate TIC 3,450 Furnace TOC 1,595 Persulfate TOC 3,450 Furnace
Physical Properties Units as Reported Hydroxide 1.94 M Titration Density 1.258 g/mL Gravimetric
[ ] Analyte was detected within 10 times the instrument detection limit and is estimated to exceed ± 15%. (a) S could not be measured on the ICP-AES system. No alternate methods are available. (b) The analytical accuracy for F is estimated at ± 20%. NOTE: 1086 mL of composited effluent were collected.
Table 3.8. Radiochemical Composition of Tc and Cs Ion Exchange Effluent Composite AP101
Analyte Analytical Result Analytical
Method Analyte Analytical
Result Analytical
Method Radiochemical Results in µCi/mL
237Np 4.93E-07 ICP-MS 241Am 1.01E-04 Sep/AEA 239Pu 5.48E-04 ICP-MS 242Cm 7.77E-08 Sep/AEA 240Pu 9.91E-05 ICP-MS 243/244Cm 8.26E-07 Sep/AEA
241Pu /241Am < 2.01E-04 ICP-MS 154Eu 8.21E-05 GEA 99Tc 4.77E-04 ICP-MS 155Eu 3.81E-05 GEA
TcO4- 3.42E-04 Sep/Counting 60Co 2.01E-03 GEA
90Sr 5.38E-02 Sep/Counting 137Cs 7.75E-05 GEA 238Pu 2.42E-06 Sep/AEA Total α 7.51E-05 alpha counting
239/240Pu 1.74E-05 Sep/AEA Sum of α 1.22E-04 calculation

3.14
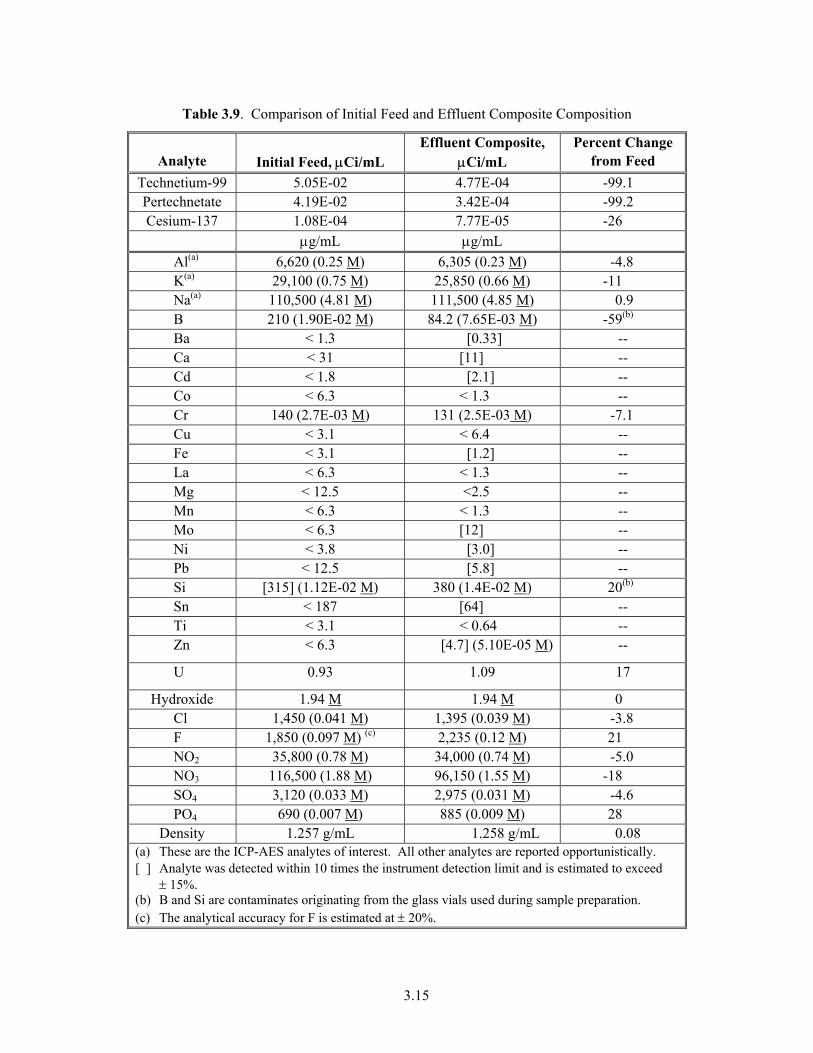
There was a significant difference in the TIC/TOC values between the two analytical methods. This difference was also observed in the characterization of the diluted feed (Urie 2002a). The hot persulfate-based values are the generally considered the best representation of the TIC and TOC content. The persulfate effluent TIC and TOC values correlate extremely well with the persulfate diluted feed values (Urie 2002a), 98% and 97%, respectively. 3.7 Comparison of AP-101 Initial Feed and Effluent Composite Composition The analysis of the effluent composite can be compared with the initial feed analysis to determine the effect, if any, on the analytes in solution upon passing through the resin bed. Table 3.9 compares the initial feed characterization with the final effluent composition. Note that the effluent composite contains the column effluent, feed-displacement solutions (52 g), and column wash solution (9.5 g). Adding the feed displacement and rinse solutions would result in a dilution to the effluent of approximately 5%. The table also shows the percent change in concentration from the initial feed composition. A negative percent change indicates that the effluent composition was lower than the initial feed composition. Changes of less than 15% are likely insignificant since a combination of the analytical uncertainty (±10%) and the dilution (5%) could result in the observed difference of 5 to 15%.
3.15
Table 3.9. Comparison of Initial Feed and Effluent Composite Composition
Analyte
Initial Feed, µCi/mL
Effluent Composite, µCi/mL
Percent Change from Feed
Technetium-99 5.05E-02 4.77E-04 -99.1 Pertechnetate 4.19E-02 3.42E-04 -99.2 Cesium-137 1.08E-04 7.77E-05 -26
µg/mL µg/mL Al(a) 6,620 (0.25 M) 6,305 (0.23 M) -4.8 K(a) 29,100 (0.75 M) 25,850 (0.66 M) -11 Na(a) 110,500 (4.81 M) 111,500 (4.85 M) 0.9 B 210 (1.90E-02 M) 84.2 (7.65E-03 M) -59(b) Ba < 1.3 [0.33] -- Ca < 31 [11] -- Cd < 1.8 [2.1] -- Co < 6.3 < 1.3 -- Cr 140 (2.7E-03 M) 131 (2.5E-03 M) -7.1 Cu < 3.1 < 6.4 -- Fe < 3.1 [1.2] -- La < 6.3 < 1.3 -- Mg < 12.5 <2.5 -- Mn < 6.3 < 1.3 -- Mo < 6.3 [12] -- Ni < 3.8 [3.0] -- Pb < 12.5 [5.8] -- Si [315] (1.12E-02 M) 380 (1.4E-02 M) 20(b) Sn < 187 [64] -- Ti < 3.1 < 0.64 -- Zn < 6.3 [4.7] (5.10E-05 M) --
U 0.93 1.09 17
Hydroxide 1.94 M 1.94 M 0 Cl 1,450 (0.041 M) 1,395 (0.039 M) -3.8 F 1,850 (0.097 M) (c) 2,235 (0.12 M) 21 NO2 35,800 (0.78 M) 34,000 (0.74 M) -5.0 NO3 116,500 (1.88 M) 96,150 (1.55 M) -18 SO4 3,120 (0.033 M) 2,975 (0.031 M) -4.6 PO4 690 (0.007 M) 885 (0.009 M) 28
Density 1.257 g/mL 1.258 g/mL 0.08 (a) These are the ICP-AES analytes of interest. All other analytes are reported opportunistically. [ ] Analyte was detected within 10 times the instrument detection limit and is estimated to exceed
± 15%. (b) B and Si are contaminates originating from the glass vials used during sample preparation. (c) The analytical accuracy for F is estimated at ± 20%.
3.16
Concentration changes of greater than 15% were observed for boron, fluoride, nitrate, phosphate silicon, uranium, and 137Cs. The presence of boron and silicon were caused by leaching from the glass storage vials; thus, the apparent concentration changes were artifacts. The fluoride values are within the stated analytical uncertainty for that analyte (±20%). The 137Cs results are near the detection limit, and the two reported values are a good indication of the method uncertainty at those levels. The uranium data also appear to demonstrate the uncertainty of the analytical method. There is an apparent increase in phosphate during ion exchange processing, which is also mirrored by the ICP-MS results for phosphorus. However, the SL-639 resin is an anion exchanger that traps TcO4
-; thus, it is anticipated that other large oxy-anions would also be retained by the resin. The phosphate concentration increase appears then to be due to analytical uncertainty. The nitrate concentration decrease is small enough that it could be attributed to the uncertainty of the analytical measurement; however, the changes may also be due, in part, to interaction with the resin bed. 3.8 Technetium Recovery All stages of the column run were monitored with a 95mTcO4
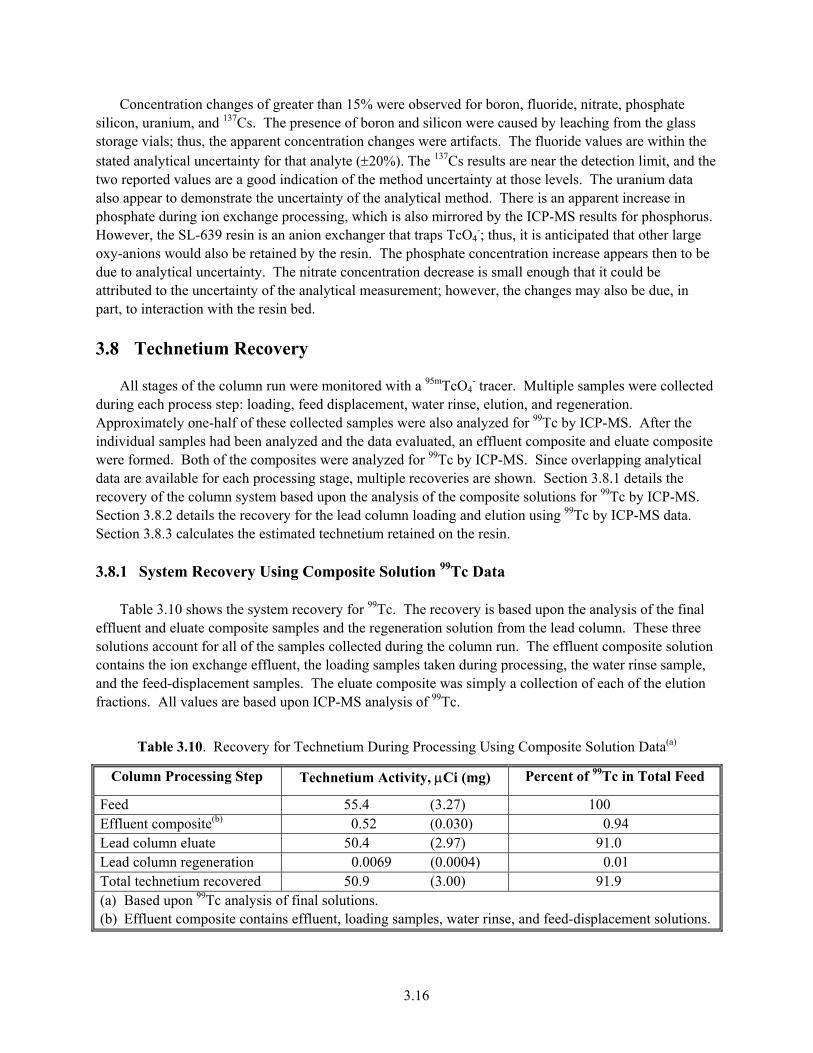
- tracer. Multiple samples were collected during each process step: loading, feed displacement, water rinse, elution, and regeneration. Approximately one-half of these collected samples were also analyzed for 99Tc by ICP-MS. After the individual samples had been analyzed and the data evaluated, an effluent composite and eluate composite were formed. Both of the composites were analyzed for 99Tc by ICP-MS. Since overlapping analytical data are available for each processing stage, multiple recoveries are shown. Section 3.8.1 details the recovery of the column system based upon the analysis of the composite solutions for 99Tc by ICP-MS. Section 3.8.2 details the recovery for the lead column loading and elution using 99Tc by ICP-MS data. Section 3.8.3 calculates the estimated technetium retained on the resin. 3.8.1 System Recovery Using Composite Solution 99Tc Data Table 3.10 shows the system recovery for 99Tc. The recovery is based upon the analysis of the final effluent and eluate composite samples and the regeneration solution from the lead column. These three solutions account for all of the samples collected during the column run. The effluent composite solution contains the ion exchange effluent, the loading samples taken during processing, the water rinse sample, and the feed-displacement samples. The eluate composite was simply a collection of each of the elution fractions. All values are based upon ICP-MS analysis of 99Tc.
Table 3.10. Recovery for Technetium During Processing Using Composite Solution Data(a)
Column Processing Step Technetium Activity, µCi (mg) Percent of 99Tc in Total Feed
Feed 55.4 (3.27) 100 Effluent composite(b) 0.52 (0.030) 0.94 Lead column eluate 50.4 (2.97) 91.0 Lead column regeneration 0.0069 (0.0004) 0.01 Total technetium recovered 50.9 (3.00) 91.9 (a) Based upon 99Tc analysis of final solutions. (b) Effluent composite contains effluent, loading samples, water rinse, and feed-displacement solutions.

3.17
A total of 55.4 µCi of 99Tc was processed through the column system. The total recovery, based upon composite solutions, is 92% of the processed technetium. The data reported in Table 3.10 do not account for the technetium loaded on the lag column. Section 3.8.3 includes the lag column loading and retention of technetium. 3.8.2 Recovery for Lead Column Loading and Elution Using Individual 99Tc Sample Data The loading and elution curves for the lead and lag columns, combined with the feed displacement, water rinse, and regeneration solutions, provide an accounting of all of the technetium passing through the system during processing. Table 3.9 shows a recovery for the lead column loading and the elution of AP-101 tank-waste feed. The amount of technetium loaded onto the lead column was calculated by the following equation:
[ ]∑=
=
∆−Ni
0i0i0 )V)(C()C/C1( i (3.1)
where
C/C0 = the ratio of Tc in each sample versus the Tc present in the initial feed C0 = the initial feed technetium concentration ∆V = the volume of feed processed between each sample (including sample volume)
N = the number of samples collected during loading. The amount of technetium eluted from the lead column during elution was determined using Equation 3.2.
[ ]∑=
=
∆Ni
0i0i0 )V)(C()C/C( i (3.2)
where
C/C0 = the ratio of Tc in each elution sample versus the Tc present in the initial feed C0 = the initial feed technetium concentration ∆V = the volume of each elution sample
N = the number of samples collected during elution. Table 3.11 shows the lead column loading and elution recovery calculated for total technetium.

3.18
Table 3.11. Recovery for Lead Column Loading and Elution of Technetium
Column Processing Step Technetium Activity,
µCi (mg) Percent of 99Tc in
Total Feed, % Total Technetium Processed 55.4 (3.27) 100 Loaded on Lead Column 54.3 (3.20) 98.0 Eluted from Lead Column (a) 49.7 (2.93) 89.7 Fraction Eluted from Lead Column 92% (a) Based upon the sum of µCi eluted during: elution (49.62), feed displacement (0.049), water rinse (0.024), and regeneration stages (0.007)
Since elution also occurred during feed displacement, rinsing, and regeneration of the lead column, the contribution of those samples was also included in the table. The data indicate that although elution was performed until the concentration of the eluate was <1% of the concentration in the initial feed, the recovery calculations indicate that approximately 8% of the technetium loaded on the column was retained. The estimate of technetium retained on the column is based solely on solution analyses. When all actual waste testing is completed, the resin will be dissolved and analyzed to determine residual Tc and other metals. Further discussion of technetium retention is provided in the next section. 3.8.3 Estimate of Technetium Retained on Lead and Lag Columns Table 3.12 provides an estimate of the amount of technetium retained on the lead and lag columns. The calculation of the technetium loaded onto the lead column was determined using Equation 3.1. The amount of technetium eluted from the lead column was based upon analysis of the eluate composite solution combined with the analysis of the regeneration samples, feed-displacement samples, and water-rinse sample. This value (50.4 µCi) should be a more accurate value than the one derived from the sum of individual measurements (49.7 µCi) shown in Table 3.11. The sum of individual measurements will have a higher uncertainty associated with it because of the higher number of measurements. Nonetheless, these two elution values agree quite well, with a difference of <2%. Equation 3.3 was used to calculate the amount of technetium passing through the lag column during processing:
[ ]∑=
=
∆Ni
0iLi0i0 )V)(C()C/C( (3.3)
where
C/C0 = the ratio of Tc exiting the lead column with respect to the initial technetium feed concentration C0 = the initial feed technetium concentration
∆VL = the volume of feed processed by the lag column N = the number of samples collected during loading of the lag column.
The concentration of technetium exiting the lead column, which represents the technetium entering the lag column, is calculated in the term (C/C0) × C0. Equation 3.2 was used to calculate the technetium eluted from the lag column during elution.

3.19
Table 3.12. Estimate of Technetium retained on Lead and Lag Columns
Column Processing Step Technetium Activity,
µCi (mg) Percent of 99Tc in
Total Feed, % Loaded on Lead Column 54.3 (3.20) 98.0 Eluted from Lead Column (a) 50.4 (2.97) 91.0 Estimated Retained on Lead Column 3.9 (0.23) 7.0 Technetium Entering Lag Column 0.94 (0.055) 1.7 Eluted from Lag Column 0.26 (0.015) 0.5 Estimate Retained on Lag Column 0.68 (0.040) 1.2 Estimate Retained on Both Columns 4.48 (0.27) 8.2 (a) Based upon analysis of elution composite sample. This value is slightly different than the elution value obtained by interpolating and summing the 99Tc elution samples (49.7 µCi) shown in Table 3.9. Using this value, the amount of technetium retained on the lead column was 4.6 µCi and the total retained by the system was 5.28 µCi (9.5%).
The data indicate that approximately 8% of the technetium present in the processed feed was retained on the two columns. This value of 8% is within the analytical method uncertainty. Thus, this value may reflect analytical uncertainties rather than the actual amount of technetium retained on the columns. Note that the estimate of technetium retained on both columns is based solely on solution analyses. When all actual waste testing is completed, the resin will be dissolved and analyzed to determine residual Tc and other metals. 3.9 Summary of Objectives and System Performance
The objectives of this testing were to
• demonstrate the effectiveness of all SL-639 process steps, including loading, feed displacement, DI water washing, elution, and resin regeneration
• investigate the potential for resin and/or column fouling
• demonstrate the 99Tc decontamination of an Envelope A material (Tank AP-101)
• provide a technetium-decontaminated sample for downstream process testing (i.e., corrosion testing, LAW melter feed testing and vitrification)
• provide batch-distribution measurements on actual tank waste feed. Each of the objectives is discussed in detail below.

3.20
Demonstrate the effectiveness of all SL-639 process steps, including loading, feed displacement, DI water washing, elution, and resin regeneration The processing of the column system using AP-101 waste feed and SL-639 resin progressed without difficulties. A total of 220 BVs of feed (1100 mL) was processed through the dual-column system. The lead and lag column breakthroughs were slight, 5.2% and 0.5%, respectively, based upon 99Tc analytical data, indicating that the system removed technetium quite effectively. A comparison of the 99Tc and 95mTcO4
- values demonstrates that >99.5% of the technetium was in the pertechnetate form. This does not correlate to the analysis results of the initial feed, which indicates that ~17% of the technetium was in the non-pertechnetate form. The pertechnetate analysis of the initial feed is suspect; the analytical duplicates and method controls did not meet the quality assurance (QA) requirements. Feed displacement was observed after passage of 4 BV of 0.10 M NaOH through the system, as indicated by a sharp drop in the concentration of feed components (Na, Al, P, K). This volume coincides with the system-holdup volume of 20 mL. The feed-displacement sample collected after 8 BV showed that technetium was eluting slightly from the lead column. A water rinse of the first column slightly reduced most of the feed components. This rinse volume does not appear to significantly reduce the concentration of sodium hydroxide or other salts, but it does elute technetium. The flowsheet-specified rinse volume is one-half an apparatus volume, which correlates to 2 BVs of water in this system. The elution of the technetium-loaded columns with DI water at 65°C progressed quickly. The concentration of 99Tc peaked in the 2nd BV, giving a C/C0 = 105. The elution peak was fairly sharp, with tailing starting near the 10th BV. The C/C0 ratio was already quite low, ~0.02, at this point. The target C/C0 value of <0.01 was reached at the 17th BV. Continuing the elution for an additional 12 BVs only succeeded in reducing the C/C0 ratio to 0.008. The resin was regenerated with 2 BVs of 0.25 M NaOH. This volume was adequate to rinse the lead resin bed with caustic. The regeneration effluent was collected in one batch, in which the 99Tc concentration was found to be 0.042 µCi/L. Investigate the potential for resin and/or column fouling No anomalies were observed during the column run. For example, during loading, feed displacement, and elution, there was no observed back pressure, no decrease in flow rate, no resin color change, no change in resin bed height or glass wool height, and no evidence of channeling. Demonstrate the 99Tc decontamination of an Envelope A material (Tank AP-101) Tank waste feed from Tank AP-101 was successfully processed through a dual 5.0-mL resin-bed column system that had previously been loaded and eluted with AW-101 simulant. The AP-101 feed contained 50.4 µCi/L 99Tc, and 1100 mL of feed (220 BV) were processed through the column system. The total amount of technetium processed through the two columns was 55.1 µCi. The final effluent composite 99Tc concentration was 0.477 µCi/L, which correlates to 99% removal of technetium. An overall 99Tc DF value of 105 was obtained using the two 5.0-mL beds in series.

3.21
Provide A technetium-decontaminated sample for downstream process testing (i.e., LAW melter feed testing and vitrification). The column effluent was combined with the collected loading samples, feed displacement, and column-rinse solutions, providing approximately 1000 mL of solution. This solution is the LAW vitrification feed and contains 0.477 µCi/L 99Tc and 0.078 µCi/L 137Cs. The eluate samples were composited to provide 116 mL of solution. This solution is the HLW vitrification feed and contains 454 µCi/L 99Tc. Provide Batch distribution measurements on actual tank waste feed. Batch distributions were measured with AP-101 waste feed using a 50:50 batch of SL-639 resin (Batches #981015DHC720011 and 990420DHC720067). The SL-639 resin demonstrated excellent removal of technetium: the 99TcO4
- and 99Tc Kd values were both ~800, providing 89% removal of technetium. This resin was going to be used during actual waste testing; however, a new batch of SL-639 resin (010227CTC-9-23) was obtained before starting the AP-101 column run. The new batch of resin also demonstrated excellent removal of technetium: the 95mTcO4
- Kd value was ~1200, providing 92% removal of pertechnetate. The 99Tc Kd value was slightly larger than the 95mTcO4
- Kd value at ~1800, correlating to 95% removal of technetium. The batch λ value derived from the 95mTcO4
- batch-contact data extrapolated to the initial feed conditions (~500 BVs) compares quite favorably with the extrapolated column λ value (~500 BVs).
4.1
4.0 Conclusions
All objectives of the testing were met.
• All process steps for 99Tc decontamination of AP-101 waste feed were successfully demonstrated.
• No resin or column fouling was observed.
• The 99Tc decontamination of an Envelope A waste (AP-101) was successfully demonstrated. A total of 220 BV (1100 mL, 50.1 µCi 99Tc/L) of feed was processed, resulting in 99% removal of 99Tc. This exceeds the 98% removal expected to be needed for this waste to meet the required 80% running average removal as the wastes are processed.
• The Tc-decontaminated AP-101 feed (1086 mL, 0.477 µCi 99Tc/L) and the Tc eluate (113 mL, 454 µCi 99Tc/L) were provided for downstream LAW and HLW vitrification feed, respectively.
• Batch-distribution measurements were made on the AP-101 feed. The resulting batch λ value compares quite favorably with the column λ value determined by extrapolating the observed breakthrough to 50%.
• A comparison of the 99Tc and 95mTcO4- results demonstrates that >99.5% of the technetium was in the
pertechnetate form.
5.1
5.0 References
Blanchard Jr., DL, DE Kurath, and BM Rapko. June 2000a. Small Column Testing of Superlig 639 for Removal of 99Tc from Hanford Tank Waste Envelope C (Tank 241-AN-107). PNWD-3028, Battelle Pacific Northwest Division, Richland, Washington. (BNFL-RPT-022).
Blanchard Jr., DL, DE Kurath, JR Bontha. August 2000b. Small Column Testing of Superlig 639 for Removal of 99Tc from Hanford Tank Waste Envelope A (Tank 241-AW-101). PNWD-3004, Battelle Pacific Northwest Division, Richland, Washington. (BNFL-RPT-016)
Burgeson, IE, JR Deschane, DL Blanchard Jr. Small Column Testing of Superlig 639 for Removal of 99Tc from an AW-101 Simulant. In progress. Battelle Pacific Northwest Division, Richland, Washington.
Fiskum, SK, DL Blanchard Jr., BM Rapko, ST Arm. February 2002 Small Column Testing of Superlig 644 for Removal of 137Cs from Hanford Tank Waste Envelope A (Tank 241-AP-101). WTP-RPT-026, Rev 0, Battelle Pacific Northwest Division, Richland, Washington.
King, WD 1999. Evaluation of Superlig 639 Resin for the Removal of Perrhenate Ion from Hanford Envelope A Simulant. BNF-003-098-0140, IBC Technologies, Inc., American Fork, Utah.
Urie, MW, SC Goheen, PR Bredt, OT Farmer, SK Fiskum, KA Gaither, LR Greenwood, LK Jagoda, AP Poloski, RD Scheele, CZ Soderquist, RG Swoboda, MP Thomas, JJ Wagner. January 2002. Chemical Analysis and Physical Property Testing of Diluted 241-AP-101 Tank Waste, WTP-RTP-022 Rev A Battelle Pacific Northwest Division, Richland, Washington.
Urie, MW, SK Fiskum, PR Bredt, JA Campbell, OT Farmer, LR Greenwood, EW Hoppe, VF Hoopes, Lumetta, GJ, GM Mong, RT Ratner, CZ Soderquist, MJ Steele, RG Swoboda, JJ Wagner. October 2000. Inorganic, Radioisotopic and Organic Analysis of 241-AP-101 Tank Waste, PNNL-13354, Rev 0, Battelle, Richland, Washington (formerly PNWD-3046, also published as WTP-RPT-009).

Appendix A Sample Identification

A.1
Appendix A: Sample Identification Sample ID Sample # Description AP1-Tc-0 01-1203 Initial feed sample AP1-Tc-PL1 through 7 Lead and lag column reservoir collected during
initial loading AP1-Tc-LL1 through LL24 Loading samples from lead column AP1-Tc-PL1 through PL24 Loading samples from lag column AP1-Tc-FD-P1 through P11 01-1171 to
01-1202 Feed displacement samples
AP1-Tc-RL1 DI water rinse sample AP1-Tc-E1-1 through E1-33 Lead column eluate samples AP1-Tc-Regen 1 01-2121 Lead column regeneration sample Tc-AP1-EFF-COMP (also called AP1-Tc-Eff-1)
01-1613 Effluent composite sample (contains feed displacement and rinse solutions)
Tc-AP1-Eluate 01-1843 Eluate composite sample AP101L-E-comp 01-1842 Cs IX elution composite sample. Analyzed in
same analytical batch as Tc IX samples.

Appendix B
Column-Run Spreadsheets

B.1
Appendix B: Column-Run Spreadsheets

PNWD-3222 WTP-RPT-030 Rev 0
Distr.1
Distribution No. of Copies OFFSITE
No. of Copies ONSITE
Jim Marra Savannah River Site Aiken, South Carolina 29808 Harold Sturm Savannah River Site Building 773-A Aiken, South Carolina 29808 Larry Hamm Savannah River Site Building 773-42A Aiken, South Carolina 29808 Neguib Hassan Savannah River Site Building 773-A Aiken, South Carolina 29808 Charles Nash Savannah River Site Building 773-42A Aiken, South Carolina 29808
6 Bechtel National, Inc. S. Barnes H4-02 W. Graves H4-02 S. Jenkins H4-02 R. Peterson H4-02 T. Wright H4-02 WTP PDC Coordinator H4-02 15 Battelle, Pacific Northwest Division
S. T. Arm P7-25 I. E. Burgeson (5) P7-25 D.L. Blanchard, Jr. P7-25 J. R. Deschane P7-25 O. B. Egorov P7-22 S. K. Fiskum P7-25 D.E. Kurath P7-28 B. M. Rapko P7-25 Project Office P7-28 Information Release (2) K1-06