Embed Size (px)
Citation preview

F O R
S A L E


El Creston Overview 1Location 2Regional Geology 4Local Geology 5Creston Property History 8Resource Estimation 11Other Zones of Interest 13Red Hill West Zone 14Red Hill Deep Zone 15A-37 Zone 18Alejandra Zone 19Copper Anomoly 20Executive Summary 22
The information regarding the El Creston property has been reviewed and approved by David Visagie, P.Geo., a non-independent quali�ed person under NI 43-101 who is a consultant to Starcore International Mines Ltd. Mr. Visagie is familiar with the property as he was previously the Exploration Manager and Quali�ed Person for Creston Moly Corp.
Starcore International Mines owns a 100% interest in the El Creston porphyry Molybdenum Copper deposit in Sonora, Mexico. The property is located in the north central Sonora state Mexico, approximately 100 km northwest of Hermosillo the State Capital, consists of 9 mining claims totalling 11,462 hectares in size. The property is readily accessible through a combination of paved and gravel roads. Opodepe, a small village, is 6 km to the northeast.
El Creston Property hosts a 5.5 km long x up to 1.5 km wide trend of hydrothermal alteration in which several zones of molybdenum +/- copper +/- silver mineralization occur.
At the El Creston Main/Red Hill Zone a signi�cant resource of molybdenum and copper has been outlined. In addition, there are �ve other zones, Alejandra, A-37, Red Hill West, Red Hill Deep and the West Copper, with potential to host signi�cant resources of molybdenum and/or copper.
PROJECT SUMMARY
This is an overview of the El Creston Molybdenum Copper deposit owned by Starcore International Mines Ltd. The report contains the Executive Summary from JDS Mining and Energy’s Preliminary Economic Assessment, El Creston Project, Opodepe, Sonora, Mexico, dated December 2010.
9 mining claims
Sonora State, Mexico
11,462ha
A PROMISING OPPORTUNITY
EL CRESTON
TSX:SAM / El Creston | 1
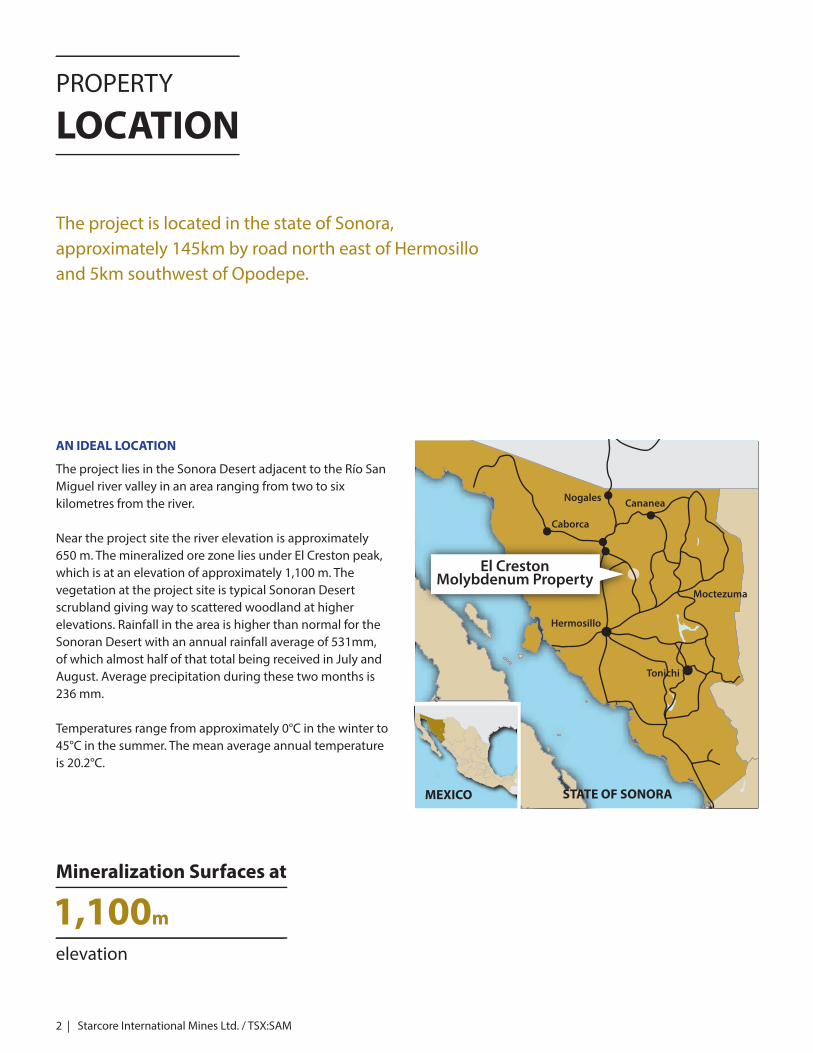
The project lies in the Sonora Desert adjacent to the Río San Miguel river valley in an area ranging from two to six kilometres from the river.
Near the project site the river elevation is approximately 650 m. The mineralized ore zone lies under El Creston peak, which is at an elevation of approximately 1,100 m. The vegetation at the project site is typical Sonoran Desert scrubland giving way to scattered woodland at higher elevations. Rainfall in the area is higher than normal for the Sonoran Desert with an annual rainfall average of 531mm, of which almost half of that total being received in July and August. Average precipitation during these two months is 236 mm.
Temperatures range from approximately 0°C in the winter to 45°C in the summer. The mean average annual temperature is 20.2°C.
AN IDEAL LOCATION
The project is located in the state of Sonora, approximately 145km by road north east of Hermosillo and 5km southwest of Opodepe.
PROPERTY
LOCATION
Mineralization Surfaces at
elevation
1,100m
2 | Starcore International Mines Ltd. / TSX:SAM
Tonichi
Cananea
Caborca
Nogales
Moctezuma
Hermosillo
El CrestonMolybdenum Property
MEXICO STATE OF SONORA
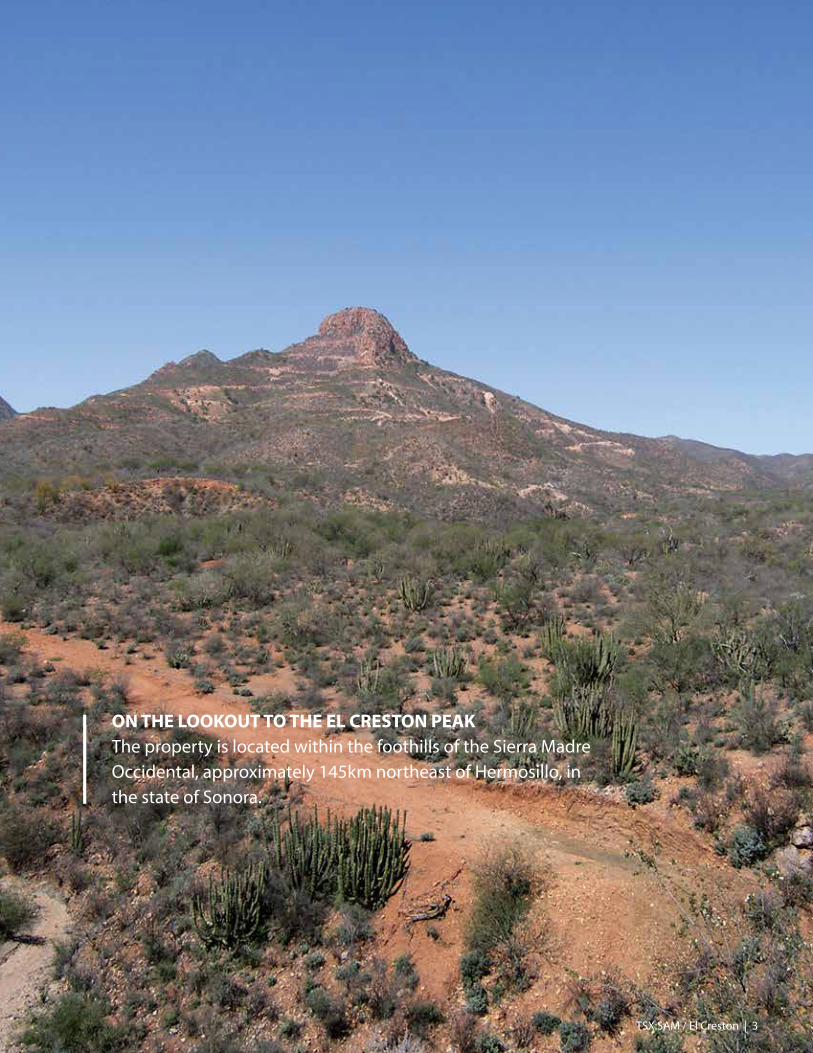
ON THE LOOKOUT TO THE EL CRESTON PEAKThe property is located within the foothills of the Sierra Madre Occidental, approximately 145km northeast of Hermosillo, in the state of Sonora.
TSX:SAM / El Creston | 3
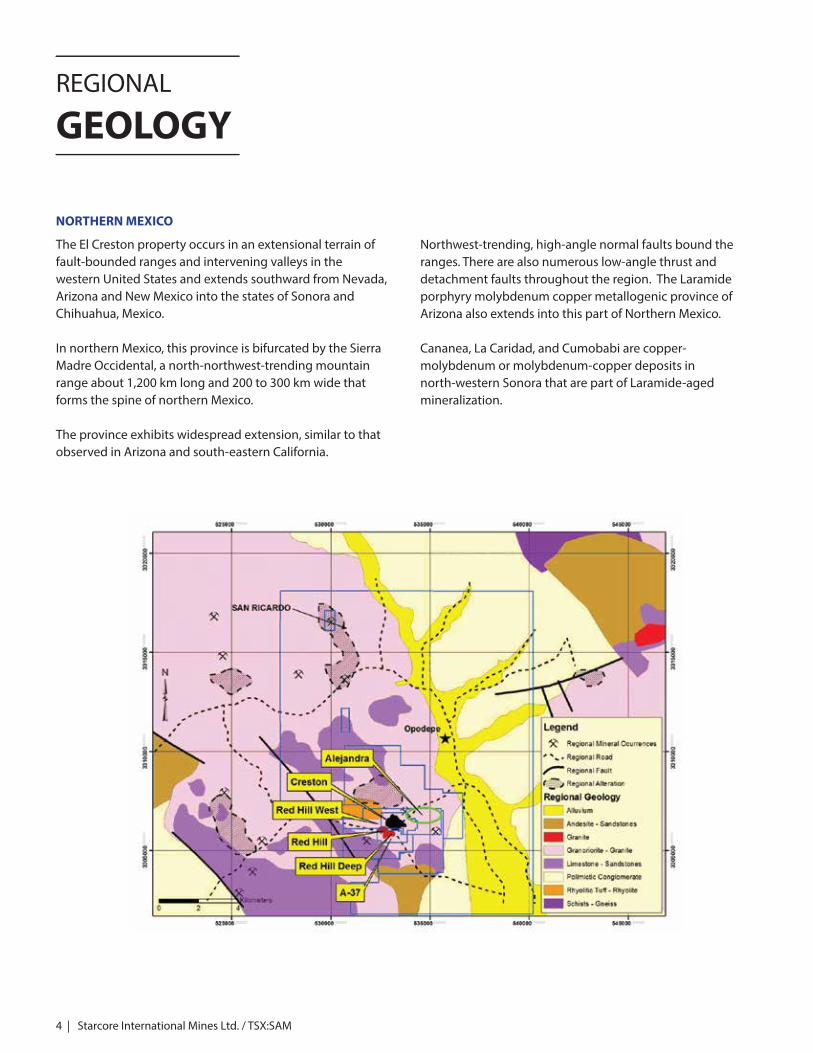
The El Creston property occurs in an extensional terrain of fault-bounded ranges and intervening valleys in the western United States and extends southward from Nevada, Arizona and New Mexico into the states of Sonora and Chihuahua, Mexico.
In northern Mexico, this province is bifurcated by the Sierra Madre Occidental, a north-northwest-trending mountain range about 1,200 km long and 200 to 300 km wide that forms the spine of northern Mexico.
The province exhibits widespread extension, similar to that observed in Arizona and south-eastern California.
Northwest-trending, high-angle normal faults bound the ranges. There are also numerous low-angle thrust and detachment faults throughout the region. The Laramide porphyry molybdenum copper metallogenic province of Arizona also extends into this part of Northern Mexico.
Cananea, La Caridad, and Cumobabi are copper- molybdenum or molybdenum-copper deposits in north-western Sonora that are part of Laramide-aged mineralization.
NORTHERN MEXICO
REGIONAL
GEOLOGY
4 | Starcore International Mines Ltd. / TSX:SAM

The Creston Property occurs within a large roof pendant of Precambrian to Palaeozoic metamorphic rocks, including the Creston granite, which rests on the Tertiary-aged Sonoran batholith, which includes intrusions ranging from granodiorite to quartz monzonite in composition.
The predominant lithologies known at Creston include metamorphic rocks of Precambrian and perhaps Paleozoic age, intrusions of various compositions, dikes, and breccias of Paleozoic and Tertiary age, and Recent conglomerate, talus, and landslide deposits. The combination of strong hydrothermal alteration, post-mineralization structural events, and supergene e�ects makes some of the rock types virtually unrecognizable. This is particularly true in the Creston deposit area, where contact relationships are di�cult to map.
At the Creston Deposit molybdenum and copper occur in both Creston Granite and hydrothermal breccias with the Creston granite being the principal host.
The granite is composed of quartz, potassium feldspar, and altered plagioclase, with only local remnants of altered ma�c minerals. It exhibits two phases:
• A weakly foliated, coarse-grained, dark gray, predominantly equigranular rock that is the main phase of the meta-granite and
• A weakly foliated, �ne to medium-grained,bu�-white to brown, equigranular to locally Porphyritic rock which may represent the chilled border or contact phase of the main granite.
At the Creston Deposit, the Creston granite and the deposit itself are �oored by the Creston and Ordonez faults, the two most important of a series of low-angle normal faults at Creston. Some molybdenum has been intersected in drill holes below these faults in unfoliated, felsic porphyritic intrusions and magmatic-hydrothermal breccias.”
“In the central part of the Creston deposit, hydrothermal alteration related has obliterated the original contacts and mineral contents of both phases of the Creston granite.” M3 (2009)
ACCORDING TO AQUE (2011)
“Several types of breccias occur in the Creston property; those with clear hydrothermal nature are separated from breccias whose magmatic origin can be argued.
Slide breccias, or super�cial breccias formed as a consequence of slope evolution, and/or fault activity have been treated as recent deposits, and fault breccia, respectively.
The intrusive breccias formed during the polyphased intrusion of the quartz-monzonite stock; it is mineralized in some portions next to the parent intrusive body.
The hydrothermal breccias formed as catastrophic events accompanying the emplacement of some dyke rocks, particularly the qtz-eyes K-feldspars porphyry granite; the original position of the gross of the hydrothermal breccia is at the margin of a large intrusive breccia, in correspondence of a culmination of the intrusive porhyritic quartz-monzonite, and outcoming dykes.
Pipe-breccias and collapse breccias are common expression of explosive extrusion of hydrothermal �uid, and subsequent gravitational collapse when pressure drops.
All the hydrothermal breccias are mineralized and show intense silici�cation; usually potassic alteration a�ects the clasts (eventually crossed by mineralized veins), while phyllic assemblage in�ll is cementing the breccia and is carrying most of the mineralization.”
“Emplacement of the Tertiary batholith caused extensive fracturing of the roof pendant, which may have provided rock preparation prior to the Creston mineralization.”Leon and Miller (1981)
LOCAL
GEOLOGY
TSX:SAM / El Creston | 5
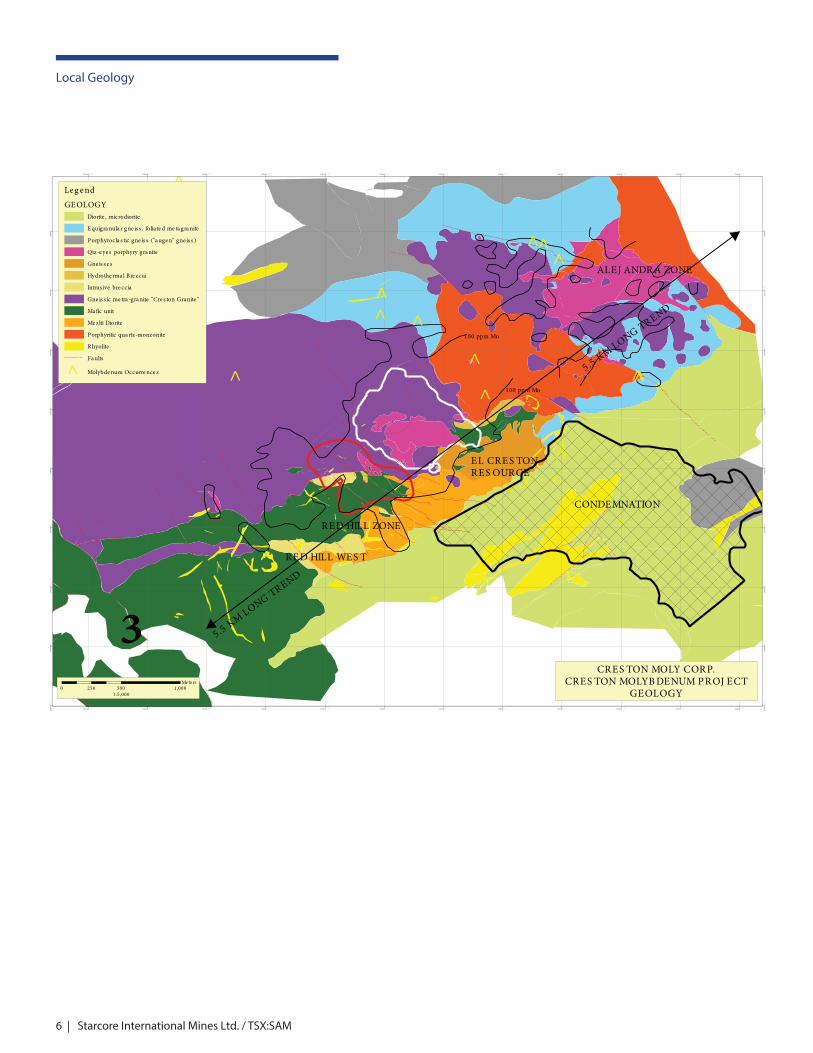
6 | Starcore International Mines Ltd. / TSX:SAM
Local Geology
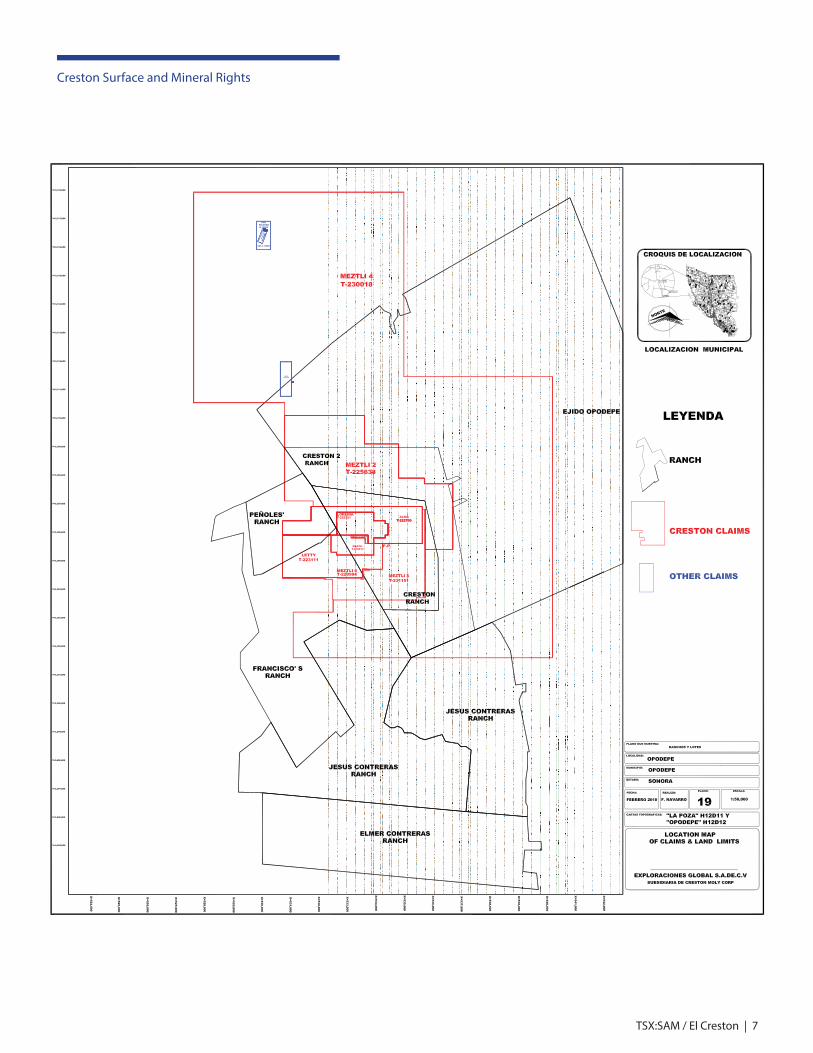
TSX:SAM / El Creston | 7
Creston Surface and Mineral Rights
8 | Starcore International Mines Ltd. / TSX:SAM
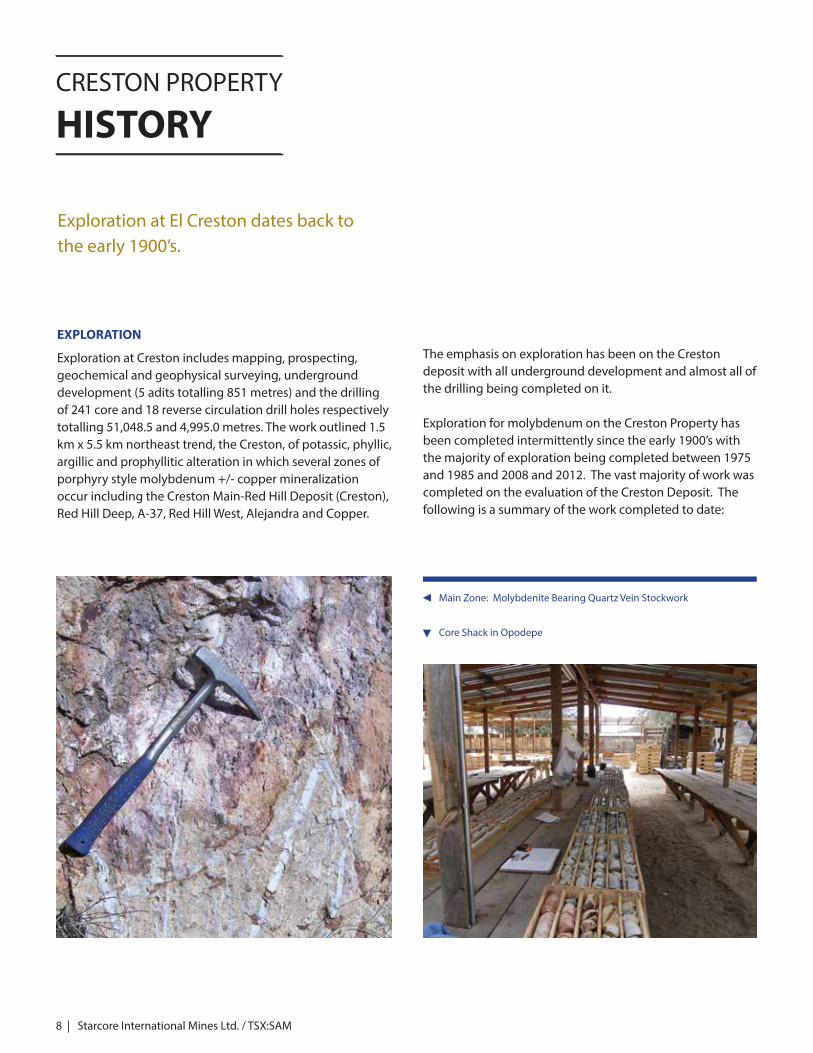
Main Zone: Molybdenite Bearing Quartz Vein Stockwork
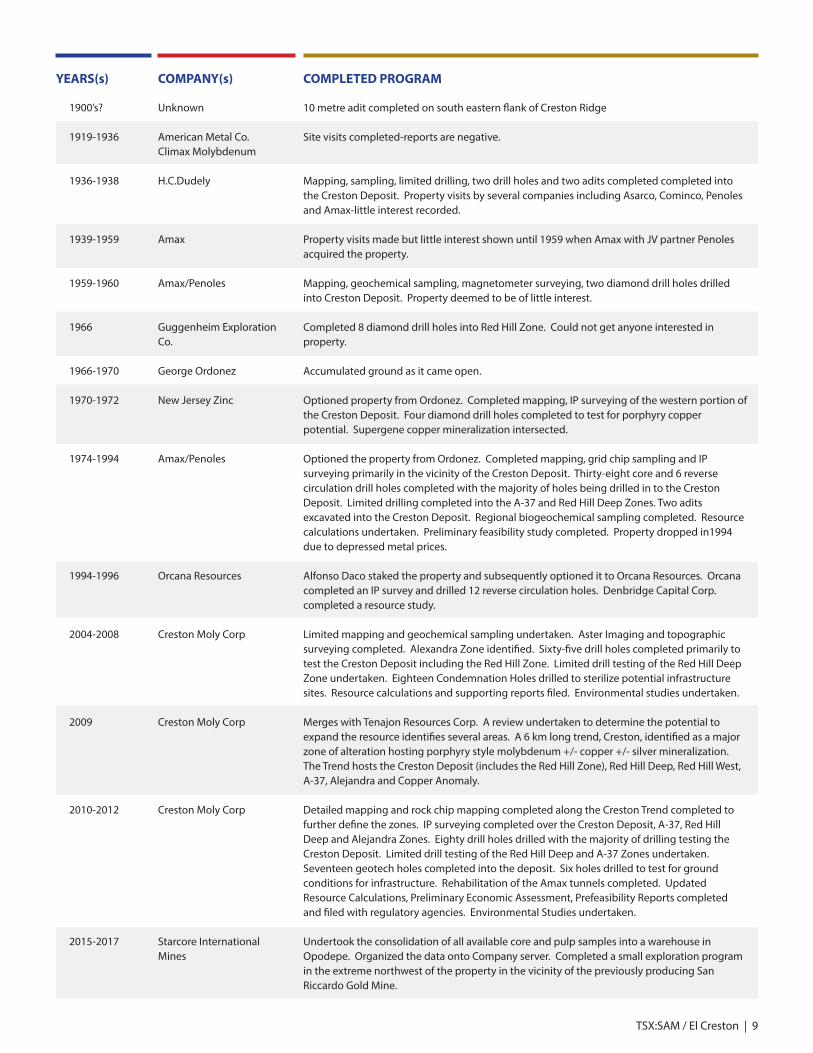
Core Shack in Opodepe
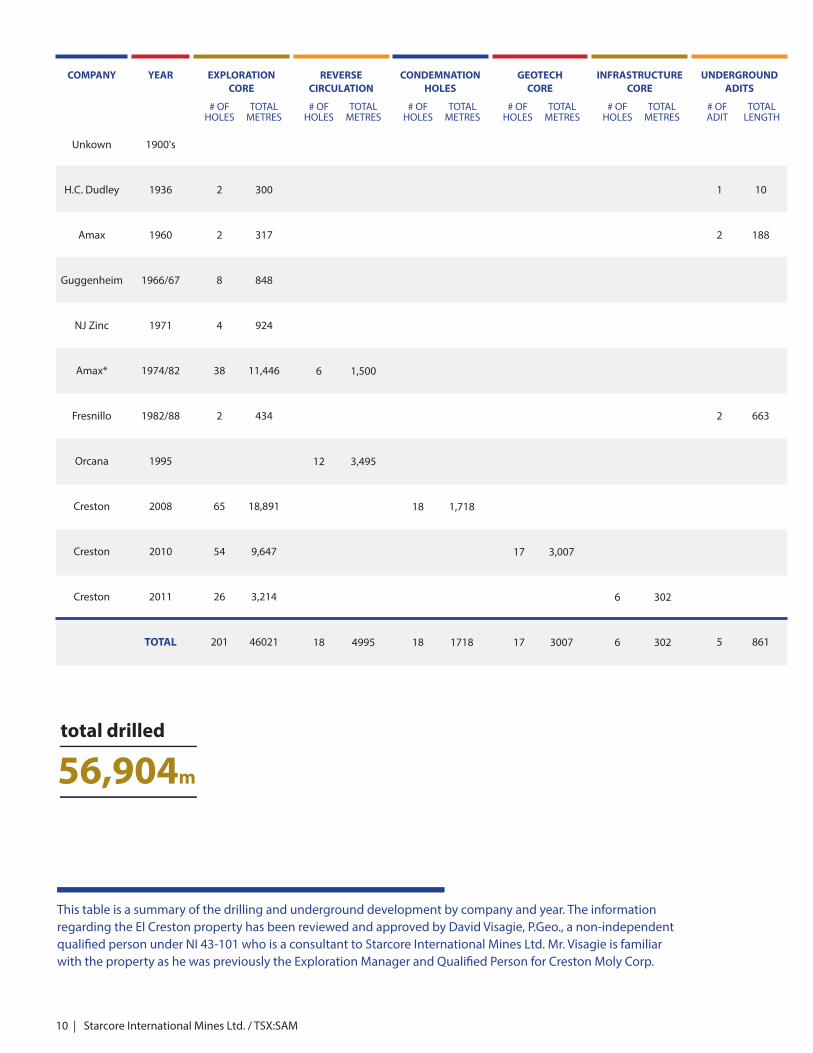
The emphasis on exploration has been on the Creston deposit with all underground development and almost all of the drilling being completed on it. Exploration for molybdenum on the Creston Property has been completed intermittently since the early 1900’s with the majority of exploration being completed between 1975 and 1985 and 2008 and 2012. The vast majority of work was completed on the evaluation of the Creston Deposit. The following is a summary of the work completed to date:
CRESTON PROPERTY
HISTORY
Exploration at El Creston dates back to the early 1900’s.
Exploration at Creston includes mapping, prospecting, geochemical and geophysical surveying, underground development (5 adits totalling 851 metres) and the drilling of 241 core and 18 reverse circulation drill holes respectively totalling 51,048.5 and 4,995.0 metres. The work outlined 1.5 km x 5.5 km northeast trend, the Creston, of potassic, phyllic, argillic and prophyllitic alteration in which several zones of porphyry style molybdenum +/- copper mineralization occur including the Creston Main-Red Hill Deposit (Creston), Red Hill Deep, A-37, Red Hill West, Alejandra and Copper.
EXPLORATION
YEARS(s) COMPANY(s) COMPLETED PROGRAM
10 metre adit completed on south eastern �ank of Creston Ridge
Site visits completed-reports are negative.
Mapping, sampling, limited drilling, two drill holes and two adits completed completed into the Creston Deposit. Property visits by several companies including Asarco, Cominco, Penoles and Amax-little interest recorded.
Property visits made but little interest shown until 1959 when Amax with JV partner Penoles acquired the property.
Mapping, geochemical sampling, magnetometer surveying, two diamond drill holes drilled into Creston Deposit. Property deemed to be of little interest.
Completed 8 diamond drill holes into Red Hill Zone. Could not get anyone interested in property.
Accumulated ground as it came open.
Optioned property from Ordonez. Completed mapping, IP surveying of the western portion of the Creston Deposit. Four diamond drill holes completed to test for porphyry copper potential. Supergene copper mineralization intersected.
Optioned the property from Ordonez. Completed mapping, grid chip sampling and IP surveying primarily in the vicinity of the Creston Deposit. Thirty-eight core and 6 reverse circulation drill holes completed with the majority of holes being drilled in to the Creston Deposit. Limited drilling completed into the A-37 and Red Hill Deep Zones. Two adits excavated into the Creston Deposit. Regional biogeochemical sampling completed. Resource calculations undertaken. Preliminary feasibility study completed. Property dropped in1994 due to depressed metal prices.
Alfonso Daco staked the property and subsequently optioned it to Orcana Resources. Orcana completed an IP survey and drilled 12 reverse circulation holes. Denbridge Capital Corp. completed a resource study.
Limited mapping and geochemical sampling undertaken. Aster Imaging and topographic surveying completed. Alexandra Zone identi�ed. Sixty-�ve drill holes completed primarily to test the Creston Deposit including the Red Hill Zone. Limited drill testing of the Red Hill Deep Zone undertaken. Eighteen Condemnation Holes drilled to sterilize potential infrastructure sites. Resource calculations and supporting reports �led. Environmental studies undertaken.
Merges with Tenajon Resources Corp. A review undertaken to determine the potential to expand the resource identi�es several areas. A 6 km long trend, Creston, identi�ed as a major zone of alteration hosting porphyry style molybdenum +/- copper +/- silver mineralization. The Trend hosts the Creston Deposit (includes the Red Hill Zone), Red Hill Deep, Red Hill West, A-37, Alejandra and Copper Anomaly.
Detailed mapping and rock chip mapping completed along the Creston Trend completed to further de�ne the zones. IP surveying completed over the Creston Deposit, A-37, Red Hill Deep and Alejandra Zones. Eighty drill holes drilled with the majority of drilling testing the Creston Deposit. Limited drill testing of the Red Hill Deep and A-37 Zones undertaken. Seventeen geotech holes completed into the deposit. Six holes drilled to test for ground conditions for infrastructure. Rehabilitation of the Amax tunnels completed. Updated Resource Calculations, Preliminary Economic Assessment, Prefeasibility Reports completed and �led with regulatory agencies. Environmental Studies undertaken.
Undertook the consolidation of all available core and pulp samples into a warehouse in Opodepe. Organized the data onto Company server. Completed a small exploration program in the extreme northwest of the property in the vicinity of the previously producing San Riccardo Gold Mine.
Unknown
American Metal Co.Climax Molybdenum
H.C.Dudely
Amax
Amax/Penoles
Guggenheim Exploration Co.
George Ordonez
New Jersey Zinc
Amax/Penoles
Orcana Resources
Creston Moly Corp
Creston Moly Corp
Creston Moly Corp
Starcore International Mines
1900’s?
1919-1936
1936-1938
1939-1959
1959-1960
1966
1966-1970
1970-1972
1974-1994
1994-1996
2004-2008
2009
2010-2012
2015-2017
TSX:SAM / El Creston | 9
10 | Starcore International Mines Ltd. / TSX:SAM
COMPANY YEAR EXPLORATIONCORE
REVERSECIRCULATION
1900's
1936
1960
1966/67
1971
1974/82
1982/88
1995
2008
2010
2011
TOTAL
2
2
8
4
38
2
65
54
26
201
300
317
848
924
11,446
434
18,891
9,647
3,214
46021
1
2
2
5
10
188
663
861
6
12
18
1,500
3,495
4995
18
18
1,718
1718
17
17
3,007
3007
6
6
302
302
Unkown
H.C. Dudley
Amax
Guggenheim
NJ Zinc
Amax*
Fresnillo
Orcana
Creston
Creston
Creston
CONDEMNATIONHOLES
GEOTECHCORE
INFRASTRUCTURECORE
UNDERGROUNDADITS
# OFHOLES
TOTALMETRES
# OFHOLES
TOTALMETRES
# OFHOLES
TOTALMETRES
# OFHOLES
TOTALMETRES
# OFHOLES
TOTALMETRES
# OFADIT
TOTALLENGTH
This table is a summary of the drilling and underground development by company and year. The information regarding the El Creston property has been reviewed and approved by David Visagie, P.Geo., a non-independent quali�ed person under NI 43-101 who is a consultant to Starcore International Mines Ltd. Mr. Visagie is familiar with the property as he was previously the Exploration Manager and Quali�ed Person for Creston Moly Corp.
total drilled
56,904m
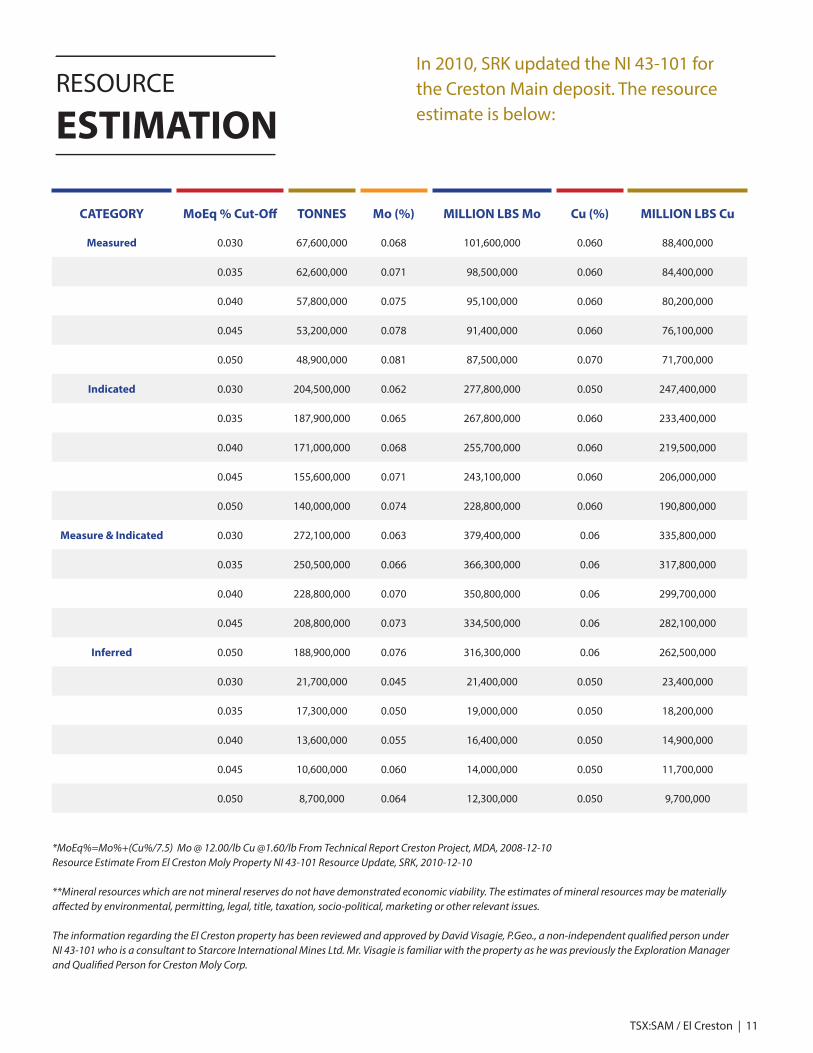
In 2010, SRK updated the NI 43-101 for the Creston Main deposit. The resource estimate is below:
RESOURCE
ESTIMATION
CATEGORY MoEq % Cut-O�
0.030
0.035
0.040
0.045
0.050
0.030
0.035
0.040
0.045
0.050
0.030
0.035
0.040
0.045
0.050
0.030
0.035
0.040
0.045
0.050
Measured
Indicated
Measure & Indicated
Inferred
TONNES Mo (%)
0.068
0.071
0.075
0.078
0.081
0.062
0.065
0.068
0.071
0.074
0.063
0.066
0.070
0.073
0.076
0.045
0.050
0.055
0.060
0.064
67,600,000
62,600,000
57,800,000
53,200,000
48,900,000
204,500,000
187,900,000
171,000,000
155,600,000
140,000,000
272,100,000
250,500,000
228,800,000
208,800,000
188,900,000
21,700,000
17,300,000
13,600,000
10,600,000
8,700,000
MILLION LBS Mo MILLION LBS Cu
88,400,000
84,400,000
80,200,000
76,100,000
71,700,000
247,400,000
233,400,000
219,500,000
206,000,000
190,800,000
335,800,000
317,800,000
299,700,000
282,100,000
262,500,000
23,400,000
18,200,000
14,900,000
11,700,000
9,700,000
101,600,000
98,500,000
95,100,000
91,400,000
87,500,000
277,800,000
267,800,000
255,700,000
243,100,000
228,800,000
379,400,000
366,300,000
350,800,000
334,500,000
316,300,000
21,400,000
19,000,000
16,400,000
14,000,000
12,300,000
*MoEq%=Mo%+(Cu%/7.5) Mo @ 12.00/lb Cu @1.60/lb From Technical Report Creston Project, MDA, 2008-12-10Resource Estimate From El Creston Moly Property NI 43-101 Resource Update, SRK, 2010-12-10
**Mineral resources which are not mineral reserves do not have demonstrated economic viability. The estimates of mineral resources may be materially a�ected by environmental, permitting, legal, title, taxation, socio-political, marketing or other relevant issues.
The information regarding the El Creston property has been reviewed and approved by David Visagie, P.Geo., a non-independent quali�ed person under NI 43-101 who is a consultant to Starcore International Mines Ltd. Mr. Visagie is familiar with the property as he was previously the Exploration Manager and Quali�ed Person for Creston Moly Corp.
TSX:SAM / El Creston | 11
Cu (%)
0.060
0.060
0.060
0.060
0.070
0.050
0.060
0.060
0.060
0.060
0.06
0.06
0.06
0.06
0.06
0.050
0.050
0.050
0.050
0.050

“A concentration or occurrence of diamonds, natural solid inorganic material or natural solid fossilized organic material including base and precious metals, coal and industrial minerals in or on the Earth’s crust in such form and quantity and of such grade or quality that is has reasonable prospects for economic extraction. The location, quantity, grade, geological characteristics ad continuity of a Mineral Resource are known, estimated or interpreted from speci�c geological evidence and knowledge.”
Mineral Resources are not mineral Reserves and do not have demonstrated economic viability. Mineral Resources are subdivided in order of increasing geological con�dence into Inferred, Indicated and Measured categories.
“An inferred Mineral Resource is that part of a Mineral Resource for which quantity and grade or quality can be estimated on the basis of geological evidence and limited sampling and reasonably assumed but not veri�ed geological and grade continuity. The estimate is based on limited information and sampling gathered through appropriate techniques for locations such as outcrops, trenches, pits workings and drill holes.
Due to the uncertainty that may be attached to Inferred Mineral Resources it cannot be assumed that all or any part of an indicated Mineral Resource will be upgraded to an Indicated or Measured Mineral Resource as a result of continued exploration.
An Indicated Mineral Resource is that part of a Mineral Resource for which quantity, grade or quality, densities, shape and physical characteristics can be estimated with a level of con�dence to allow the appropriate application of technical and economic parameters, to support mine planning and evaluation of the economic viability of the deposit. The estimate is based on detailed and reliable exploration and testing information gathered through appropriate techniques for locations such as outcrop, trenches, pits, workings and drill holes that are spaced closely enough for geological and grade continuity to be reasonably assumed.
A Measured Mineral Resource is that part of a Mineral Resource for which quantity, grade or quality, densities, shape and physical characteristics are so well established that they can be estimated with con�dence su�cient to allow the appropriate application of technical and economic parameters, to support production, planning and evaluation of the economic viability of the deposit. The estimate is based on detailed and reliable exploration and testing information gathered through appropriate techniques for locations such as outcrop, trenches, pits, workings and drill holes that are spaced closely enough to con�rm both geological and grade continuity.”
12 | Starcore International Mines Ltd. / TSX:SAM
de�nition standards for a:
diamonds, precious metals, coal,industrial minerals
Mineral Resource
CIM De�nition Standards for Mineral Resources and Mineral Reserves de�ned a Mineral Resource as:
CIM DEFINITION
STANDARDS
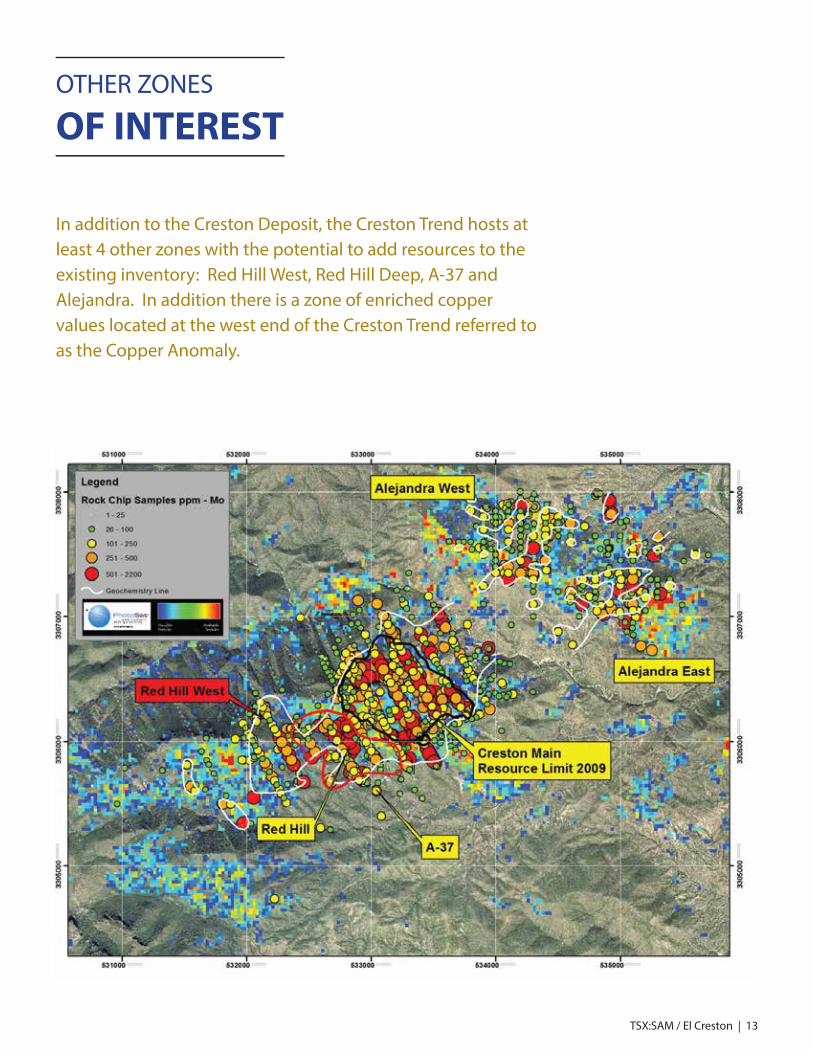
In addition to the Creston Deposit, the Creston Trend hosts at least 4 other zones with the potential to add resources to the existing inventory: Red Hill West, Red Hill Deep, A-37 and Alejandra. In addition there is a zone of enriched copper values located at the west end of the Creston Trend referred to as the Copper Anomaly.
OTHER ZONES
OF INTEREST
TSX:SAM / El Creston | 13
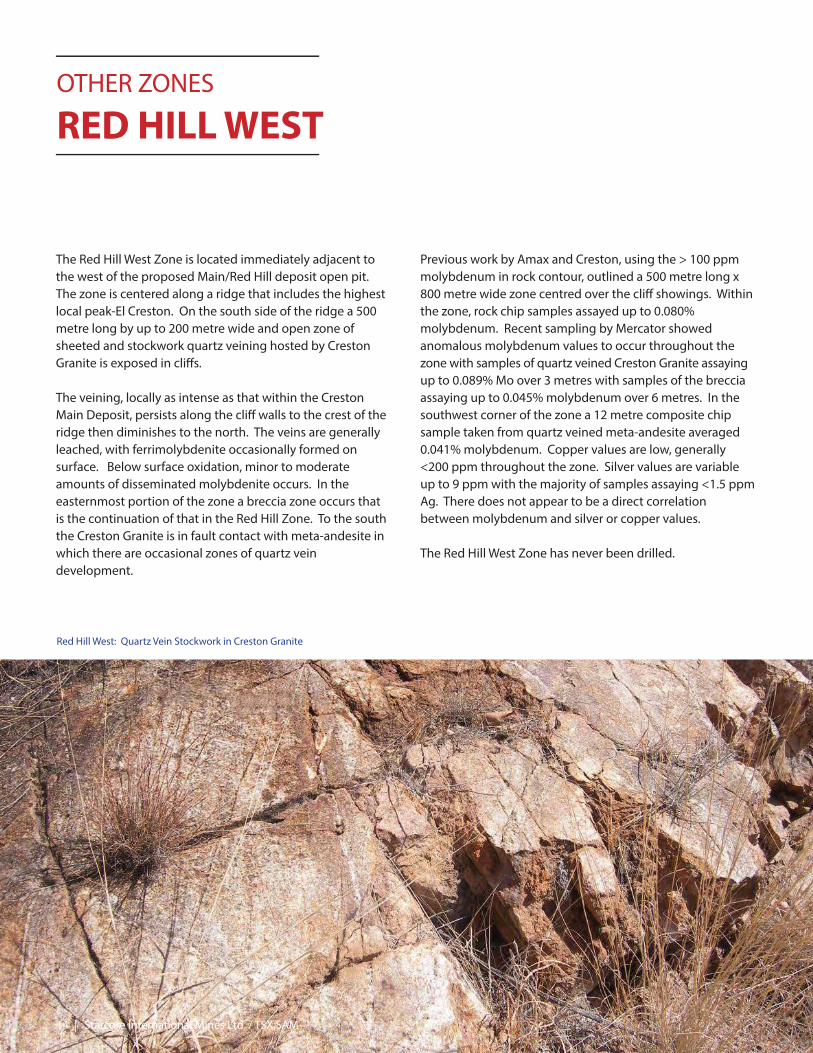
The Red Hill West Zone is located immediately adjacent to the west of the proposed Main/Red Hill deposit open pit. The zone is centered along a ridge that includes the highest local peak-El Creston. On the south side of the ridge a 500 metre long by up to 200 metre wide and open zone of sheeted and stockwork quartz veining hosted by Creston Granite is exposed in cli�s.
The veining, locally as intense as that within the Creston Main Deposit, persists along the cli� walls to the crest of the ridge then diminishes to the north. The veins are generally leached, with ferrimolybdenite occasionally formed on surface. Below surface oxidation, minor to moderate amounts of disseminated molybdenite occurs. In the easternmost portion of the zone a breccia zone occurs that is the continuation of that in the Red Hill Zone. To the south the Creston Granite is in fault contact with meta-andesite in which there are occasional zones of quartz vein development.
Previous work by Amax and Creston, using the > 100 ppm molybdenum in rock contour, outlined a 500 metre long x 800 metre wide zone centred over the cli� showings. Within the zone, rock chip samples assayed up to 0.080% molybdenum. Recent sampling by Mercator showed anomalous molybdenum values to occur throughout the zone with samples of quartz veined Creston Granite assaying up to 0.089% Mo over 3 metres with samples of the breccia assaying up to 0.045% molybdenum over 6 metres. In the southwest corner of the zone a 12 metre composite chip sample taken from quartz veined meta-andesite averaged 0.041% molybdenum. Copper values are low, generally <200 ppm throughout the zone. Silver values are variable up to 9 ppm with the majority of samples assaying <1.5 ppm Ag. There does not appear to be a direct correlation between molybdenum and silver or copper values.
The Red Hill West Zone has never been drilled.
OTHER ZONES
RED HILL WEST
Red Hill West: Quartz Vein Stockwork in Creston Granite
14 | Starcore International Mines Ltd. / TSX:SAM
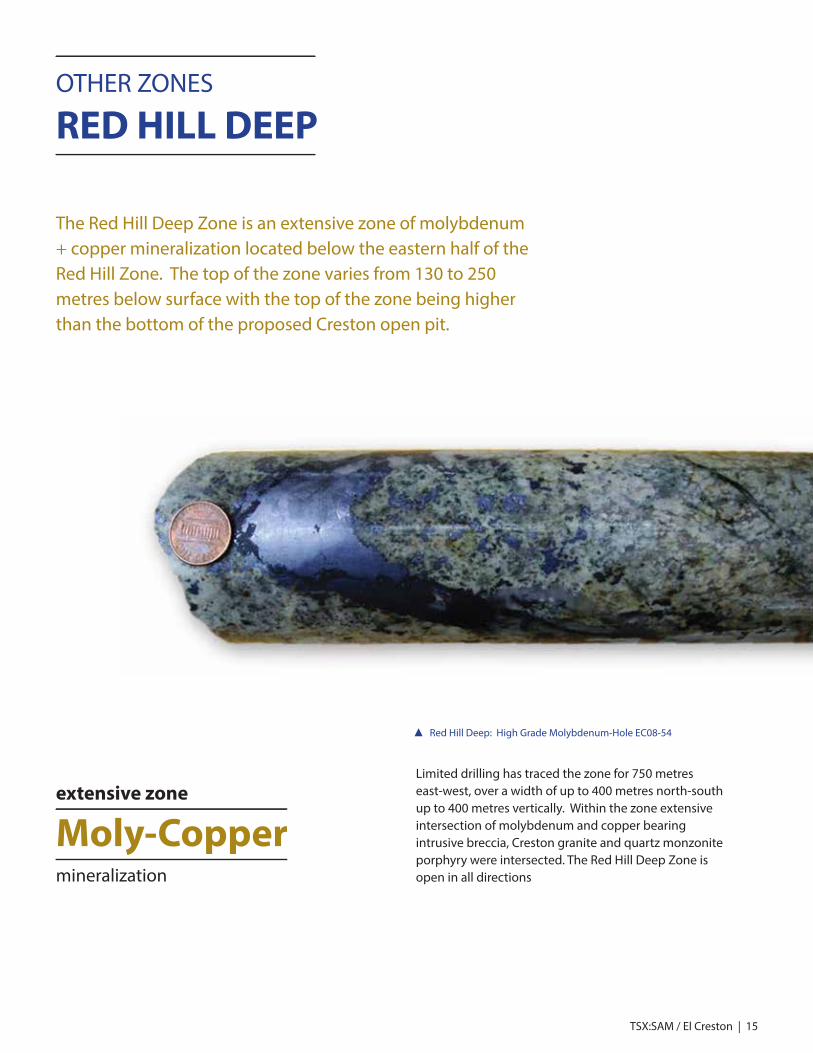
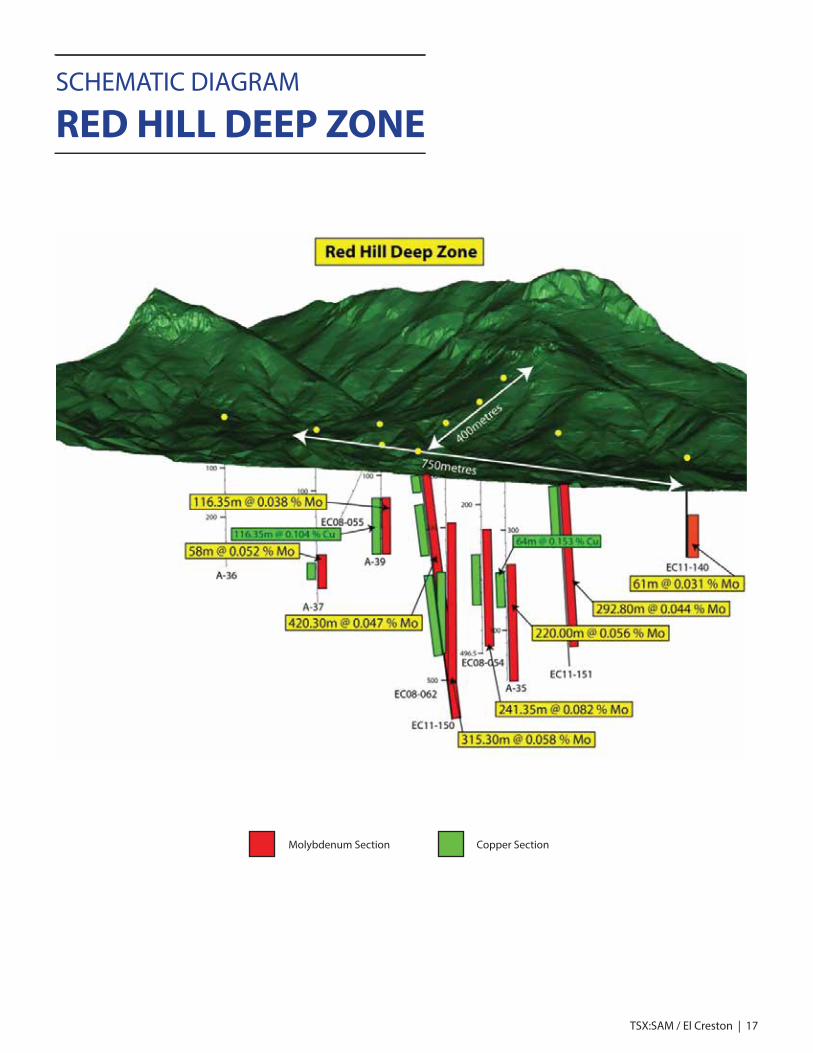
Limited drilling has traced the zone for 750 metres east-west, over a width of up to 400 metres north-south up to 400 metres vertically. Within the zone extensive intersection of molybdenum and copper bearing intrusive breccia, Creston granite and quartz monzonite porphyry were intersected. The Red Hill Deep Zone is open in all directions
The Red Hill Deep Zone is an extensive zone of molybdenum + copper mineralization located below the eastern half of the Red Hill Zone. The top of the zone varies from 130 to 250 metres below surface with the top of the zone being higher than the bottom of the proposed Creston open pit.
OTHER ZONES
RED HILL DEEP
extensive zone
mineralization
Moly-Copper
Red Hill Deep: High Grade Molybdenum-Hole EC08-54
TSX:SAM / El Creston | 15

16 | Starcore International Mines Ltd. / TSX:SAM
HOLE LENGTH(M)
DIP FROM(M)
600.10
300.00
317.75
256.35
496.50
499.10
210.50
575.90
469.70
-90
-90
-90
-90
-90
-90
inc
-90
-70
-82
212.00
266.00
370.00
452.00
122.00
226.00
140.00
206.00
253.15
183.80
332.60
140.30
155.55
379.80
293.85
A-35
A-36
A-37
A-39
EC08-54
EC08-62
EC11-140
EC11-150
EC11-151
TO(M)
INTERVAL(M)
HOST
Nine holes have tested the zone. The results are summarized below:
MO(%)
CU(%)
252.00
320.00
442.00
558.00
132.00
284.00
172.00
256.65
460.90
499.10
440.70
201.30
536.8
436.15
405.65
40.00
54.00
72.00
106.00
10.00
58.00
32.00
50.65
207.75
315.30
88.10
61.00
381.25
56.35
111.80
0.043
0.051
0.065
0.070
0.046
0.052
0.047
0.041
0.091
0.058
0.079
0.031
0.047
0.087
0.068
Insig.
Insig.
0.140
0.040
0.048
0.081
0.055
0.126
0.065
0.062
0.085
Insig.
0.055
0.113
Insig.
Creston Granite
Creston Granite
Creston Granite
Quartz Monzonite Porphyry
Ma�c Unit
Augen Gneiss
Ma�c Unit, Creston Granite
Ma�c Unit
Creston Granite, Breccia
Ma�c Unit, Intrusive Breccia
Intrusive Breccia
Quartz Monzonite Porphyry
Intrusive Breccia, Quartz Monzonite
Intrusive Breccia
Intrusive Breccia, Quartz Monzonite
TSX:SAM / El Creston | 17
SCHEMATIC DIAGRAM
RED HILL DEEP ZONE
Molybdenum Section Copper Section
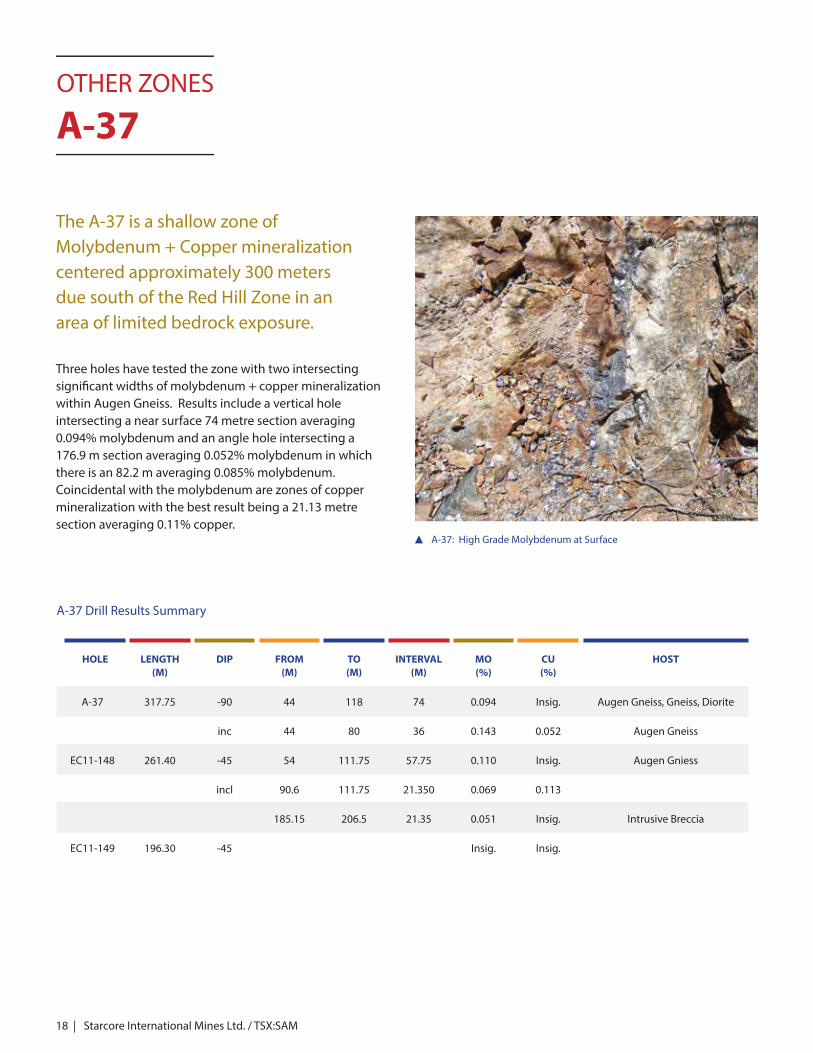
The A-37 is a shallow zone of Molybdenum + Copper mineralization centered approximately 300 meters due south of the Red Hill Zone in an area of limited bedrock exposure.
Three holes have tested the zone with two intersecting signi�cant widths of molybdenum + copper mineralization within Augen Gneiss. Results include a vertical hole intersecting a near surface 74 metre section averaging 0.094% molybdenum and an angle hole intersecting a 176.9 m section averaging 0.052% molybdenum in which there is an 82.2 m averaging 0.085% molybdenum. Coincidental with the molybdenum are zones of copper mineralization with the best result being a 21.13 metre section averaging 0.11% copper.
OTHER ZONES
A-37
HOLE LENGTH(M)
DIP FROM(M)
317.75
261.40
196.30
-90
inc
-45
incl
-45
44
44
54
90.6
185.15
A-37
EC11-148
EC11-149
TO(M)
INTERVAL(M)
HOST
A-37 Drill Results Summary
MO(%)
CU(%)
118
80
111.75
111.75
206.5
74
36
57.75
21.350
21.35
0.094
0.143
0.110
0.069
0.051
Insig.
Insig.
0.052
Insig.
0.113
Insig.
Insig.
Augen Gneiss, Gneiss, Diorite
Augen Gneiss
Augen Gniess
Intrusive Breccia
A-37: High Grade Molybdenum at Surface
18 | Starcore International Mines Ltd. / TSX:SAM
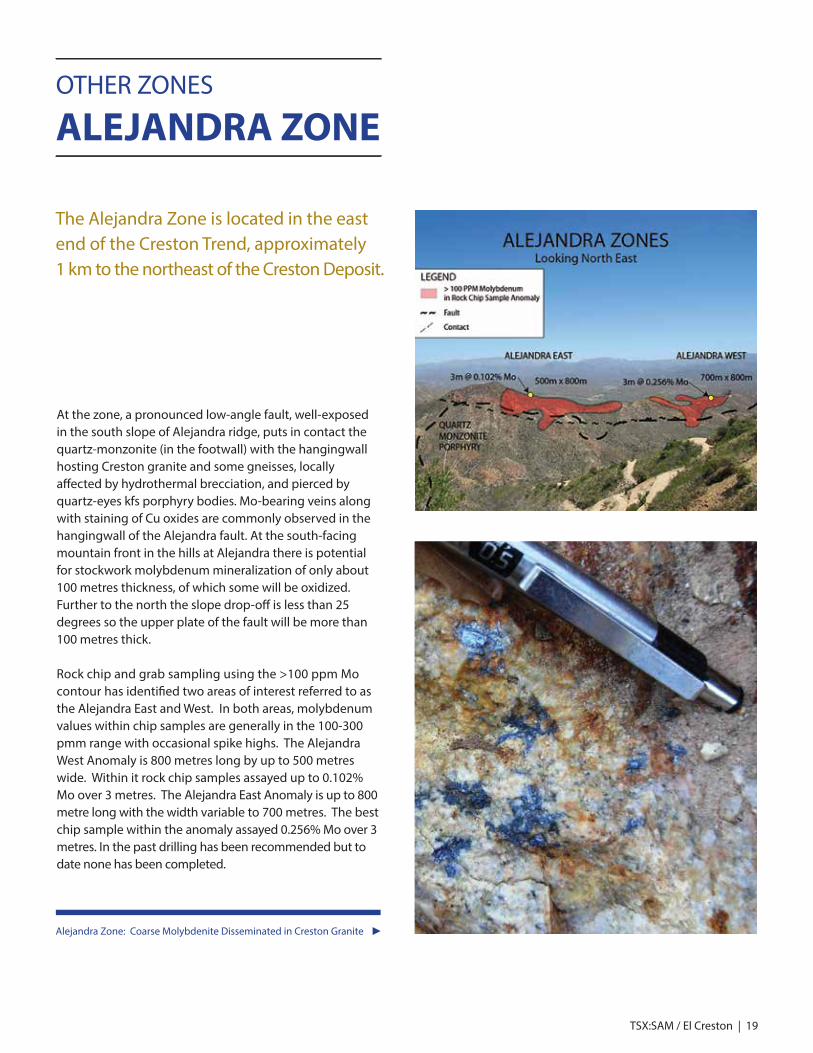
Alejandra Zone: Coarse Molybdenite Disseminated in Creston Granite
OTHER ZONES
ALEJANDRA ZONE
The Alejandra Zone is located in the east end of the Creston Trend, approximately1 km to the northeast of the Creston Deposit.
TSX:SAM / El Creston | 19
At the zone, a pronounced low-angle fault, well-exposed in the south slope of Alejandra ridge, puts in contact the quartz-monzonite (in the footwall) with the hangingwall hosting Creston granite and some gneisses, locally a�ected by hydrothermal brecciation, and pierced by quartz-eyes kfs porphyry bodies. Mo-bearing veins along with staining of Cu oxides are commonly observed in the hangingwall of the Alejandra fault. At the south-facing mountain front in the hills at Alejandra there is potential for stockwork molybdenum mineralization of only about 100 metres thickness, of which some will be oxidized. Further to the north the slope drop-o� is less than 25 degrees so the upper plate of the fault will be more than 100 metres thick.
Rock chip and grab sampling using the >100 ppm Mo contour has identi�ed two areas of interest referred to as the Alejandra East and West. In both areas, molybdenum values within chip samples are generally in the 100-300 pmm range with occasional spike highs. The Alejandra West Anomaly is 800 metres long by up to 500 metres wide. Within it rock chip samples assayed up to 0.102% Mo over 3 metres. The Alejandra East Anomaly is up to 800 metre long with the width variable to 700 metres. The best chip sample within the anomaly assayed 0.256% Mo over 3 metres. In the past drilling has been recommended but to date none has been completed.
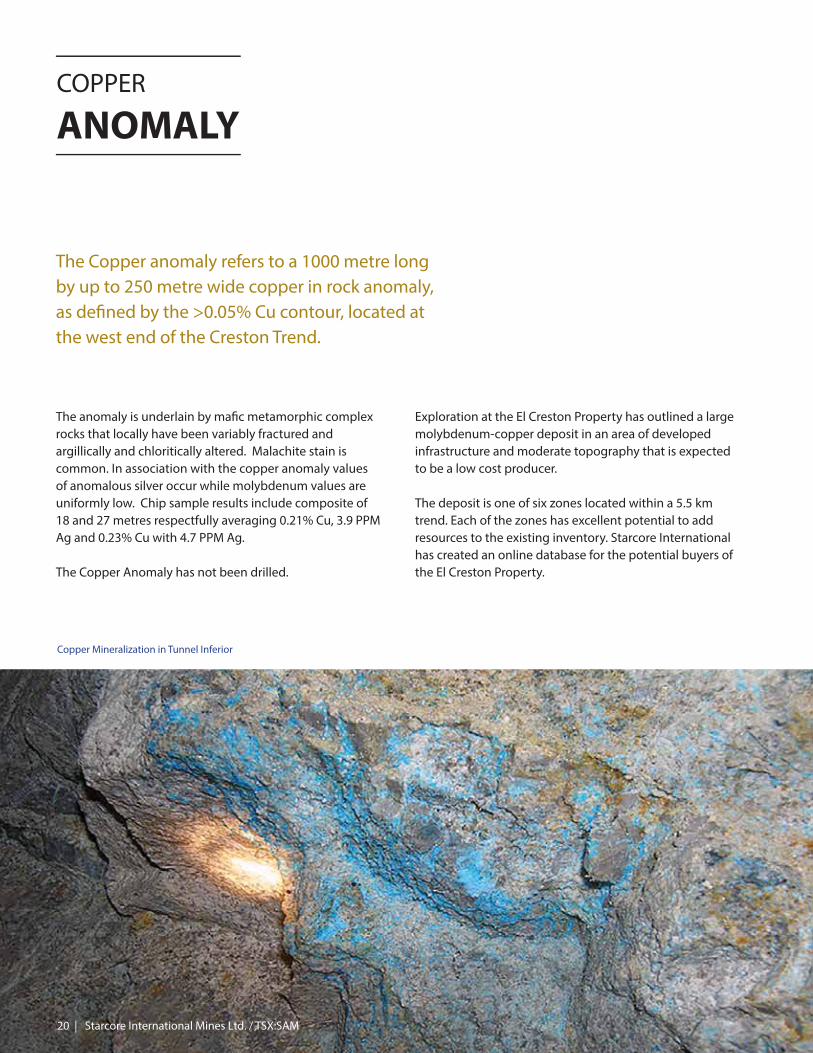
The anomaly is underlain by ma�c metamorphic complex rocks that locally have been variably fractured and argillically and chloritically altered. Malachite stain is common. In association with the copper anomaly values of anomalous silver occur while molybdenum values are uniformly low. Chip sample results include composite of 18 and 27 metres respectfully averaging 0.21% Cu, 3.9 PPM Ag and 0.23% Cu with 4.7 PPM Ag.
The Copper Anomaly has not been drilled.
COPPER
ANOMALY
Copper Mineralization in Tunnel Inferior
The Copper anomaly refers to a 1000 metre long by up to 250 metre wide copper in rock anomaly, as de�ned by the >0.05% Cu contour, located at the west end of the Creston Trend.
20 | Starcore International Mines Ltd. / TSX:SAM
Exploration at the El Creston Property has outlined a large molybdenum-copper deposit in an area of developed infrastructure and moderate topography that is expected to be a low cost producer.
The deposit is one of six zones located within a 5.5 km trend. Each of the zones has excellent potential to add resources to the existing inventory. Starcore International has created an online database for the potential buyers of the El Creston Property.

For access to our exclusive online database,please contact Robert Eadie
[email protected] | 1-604-602-4935www.starcore.com
TSX|SAM
TSX:SAM / El Creston | 21
This report contains information derived by Starcore from published data that has been �led on SEDAR. All data has been derived from the sources noted and the reader is cautioned as to their current applicability as the information and reports are dated and reporting guidelines may have changed due to regulatory changes in the reporting jurisdictions. The reader is cautioned not to place undue reliance on the data presented herein and the implications of such data. The data contained herein is provided for informational purposes only and has been compiled from sources believed to be reliable, although this summary may still contain technical or other inaccuracies, omissions, or typographical errors, for which Starcore assumes no responsibility. Starcore does not guarantee the validity, accuracy, or completeness of any claims, statements or information herein. The information herein should also not be construed as an o�er to buy or sell securities. Furthermore, some statements contained in this report are forward-looking and, therefore, involve uncertainties or risks that could cause actual results to di�er materially. Accordingly, readers are cautioned to not place undue reliance on information provided. This report contains the Executive Summary from the NI 43-101 Preliminary Economic Study completed by JDS Energy and Mining completed in 2010. The full report is available on SEDAR.
The information regarding the El Creston property has been reviewed and approved by David Visagie, P.Geo., a non-independent quali�ed person under NI 43-101 who is a consultant to Starcore International Mines Ltd. Mr. Visagie is familiar with the property as he was previously the Exploration Manager and Quali�ed Person for Creston Moly Corp.
DISCLAIMER
PRELIMINARY ECONOMIC ASSESSMENT EL CRESTON PROJECT
OPODEPE, SONORA, MEXICO
Prepared For: CRESTON MOLY CORP. 860 – 625 HOWE STREET VANCOUVER, BC V6C 2T6
December 16, 2010
Prepared by: JDS Energy & Mining Inc. #4 – 1441 St. Paul Street Kelowna, British Columbia V1Y 2E4 Tel: (250) 763-6369 Fax: (250) 763-6302
JDS ENERGY & MINING INC.
CRESTON MOLY CORP. JDS-CMCELC-001 CRESTON PRELIMINARY ECONOMIC ASSESSMENT
TITLE PAGE 2
PRELIMINARY ECONOMIC ASSESSMENT
EL CRESTON PROJECT OPODEPE, SONORA, MEXICO
December 16, 2010 Prepared For: CRESTON MOLY CORP. 860 – 625 HOWE STREET VANCOUVER, BC V6C 2T6 Prepared by: JDS Energy & Mining Inc. #4 – 1441 St. Paul Street Kelowna, British Columbia V1Y 2E4 Tel: (250) 763-6369 Fax: (250) 763-6302 JDS Project Number CMCELC-001 Authors: Michael Makarenko, P.Eng., JDS Energy & Mining Inc.; Ali Sheykholeslami, P.Eng., JDS Energy & Mining Inc.; Kenneth Meikle, P.Eng., JDS Energy & Mining Inc.; Allan Reeves, P. Geo., JDS Energy & Mining Inc.; Dave Visagie, P.Geo., Creston Moly Corp. Gilles Arseneau, P. Geo., SRK Consulting (Canada) Inc.; David Kidd, P.E., Golder Associates Inc.; Hoe Teh. P. Eng., Hoe Teh Consulting Inc.;
JDS ENERGY & MINING INC.
CRESTON MOLY CORP. JDS-CMCELC-001 CRESTON PRELIMINARY ECONOMIC ASSESSMENT
TOC - 1
TABLE OF CONTENTS
1 EXECUTIVE SUMMARY ..............................................................................................................................8 1.1 INTRODUCTION .........................................................................................................................................8 1.2 LOCATION.................................................................................................................................................9 1.3 GEOLOGY AND MINERALIZATION .............................................................................................................9 1.4 MINERAL PROCESSING AND METALLURGY.............................................................................................10
1.4.1 Metallurgical testing ............................................................................................................10 1.4.2 Process flow sheet ................................................................................................................11 1.4.3 Metal Recoveries ..................................................................................................................11
1.5 MINERAL RESOURCE ESTIMATE .............................................................................................................11 1.6 MINE PLAN .............................................................................................................................................12 1.7 WASTE MANAGEMENT PLAN..................................................................................................................14 1.8 ENVIRONMENTAL CONSIDERATIONS.......................................................................................................14 1.9 ECONOMIC ANALYSIS .............................................................................................................................16
1.9.1 Capital and Operating Costs................................................................................................17 1.9.2 Sensitivity Analysis ...............................................................................................................19
1.10 CONCLUSIONS.........................................................................................................................................21 1.11 RECOMMENDATIONS...............................................................................................................................22
JDS ENERGY & MINING INC.
CRESTON MOLY CORP. JDS-CMCELC-001
CRESTON PRELIMINARY ECONOMIC ASSESSMENT 8
1 EXECUTIVE SUMMARY
1.1 INTRODUCTION This Preliminary Economic Assessment Technical Report (“PEA”) was compiled by JDS Energy & Mining Inc. (“JDS”) for Creston Moly Corporation (“Creston Moly” or “CMC” or the “Company”).
A Pre-Feasibility Study (“PFS”) on the project was completed by M3 Engineering & Technology Corporation (“M3”) of Tucson, Arizona in March 2009 for Creston Moly.
In order to optimize the project in follow up to the merger of Creston Moly and Tenajon Resources Corp., and in conjunction with the 2009 PFS, CMC sought advice from JDS. An internal report in October 2009 was delivered to CMC and an optimization program was initiated to advance the project to delivery of a Feasibility Study while addressing recommendations in the report. Opportunities to enhance the project economics included but not limited to the following:
• Increase contiguous geological and mining resources by step-out drilling,
• Revise the mining plan to match the updated resource and minimize rehandle and total stripping,
• Optimize/increase plant throughput to match the resource,
• Address surface rights issues to remove limitations for more economic tailings and waste rock storage locations,
• Conduct additional testwork to optimize metallurgical recovery and reagent consumption,
• Incorporate more efficient development execution and capture the cost benefits.
As a result of work based on the recommendations, key improvements and variances of this 2010 PEA to the 2009 PFS include, but are not limited to:
• Increased resources as a result of the 2010 step out drilling program,
• Increased plant throughput from 40 ktpd to 50 ktpd to match resource size,
• Modified process design based on additional metallurgical testing,
• Reduced stripping ratio due to the new resource profile,
• Establishing agreements for land access to a preferred Tailing Storage Facility (TSF) location,
• Identification of a copper enriched zone below the oxide cap.
During 2010 additional information has been collected and is being analysed to advance the Feasibility Study and potentially further improve the project economics. This additional information includes, but is not limited to:

JDS ENERGY & MINING INC.
CRESTON MOLY CORP. JDS-CMCELC-001
CRESTON PRELIMINARY ECONOMIC ASSESSMENT 9
• Metallurgical tests to optimize recovery, reagent and power consumption for grinding alternatives,
• The collection of geotechnical (core drilling and surface traverse) data to optimize pit slope design,
• The optimization of open pit mining and waste rock removal and disposal, and tailings geochemical analysis,
• The optimization of the TSF including water balance and additional geotechnical, and environmental considerations,
• Baseline environmental data collection over the orebody and proposed tailings area,
• Delineation of a power line right-of-way and commencement of permitting,
• Initiating capture of baseline socio-economic data.
This report summarizes the findings of the work done to date and resultant changes to the project design and economic value. It also highlights the recommended work required to continue the project to a Feasibility Study. While compiled by JDS, this report also relied on the professional contributions of the following companies: Creston Moly Corp, SRK Consulting (Canada) Inc., Golder and Associates and Hoe Teh Consulting, Inc.
1.2 LOCATION
The Creston Project is located in the north-central part of the state of Sonora, in northwestern Mexico, approximately 145 km by road north-northeast of Hermosillo and 5 km southwest of the village of Opodepe.
The project lies in the Sonoran Desert within the Río San Miguel river valley in an area ranging from two to six kilometers from the river. Near the project site the river elevation is approximately 650 m above mean sea level. The mineralized ore zone lies under El Creston peak, which is at an elevation of approximately 1,100 m. The vegetation at the project site is typical Sonoran Desert scrubland giving way to scattered woodland at higher elevations.
Rainfall in the area is higher than is typical for the Sonoran Desert with an annual rainfall average of 531 mm, of which almost half of that total being received in July and August. Average precipitation during these two months is 236 mm.
Temperatures range from approximately 0°C in the winter to 45°C in the summer. The mean average annual temperature is 20.2°C.
1.3 GEOLOGY AND MINERALIZATION
“The Creston property lies within the Basin and Range Province, an extensional terrain of fault-bounded ranges and intervening valleys that extends into northern Mexico from the southwestern
JDS ENERGY & MINING INC.
CRESTON MOLY CORP. JDS-CMCELC-001
CRESTON PRELIMINARY ECONOMIC ASSESSMENT 10
United States. The province is bifurcated by the Sierra Madre Occidental mountain range; Creston lies close to the Sierra’s western flank. In addition to northwest trending, high-angle normal faults that bound the ranges, there are numerous low-angle thrust and detachment faults throughout the region.
The weakly foliated Creston granite is the principal host of molybdenum and copper mineralization within the Main deposit at Creston, which has been classified as a porphyry molybdenum, low-fluorine type of deposit (Theodore, 1986). The Creston granite and molybdenum mineralization in the Main deposit area are floored by the Creston and Ordoñez faults, the two most important of a series of low-angle normal faults at Creston, although some mineralization has been intersected in drill holes below these faults in unfoliated felsic porphyritic intrusions and magmatic-hydrothermal breccias. The low-angle fault system appears to have transported the Main deposit mineralization to the northeast, leaving the possible roots of the system in the general area of Red Hill.
There are two principal styles of mineralization at the Main deposit: predominantly subvertical quartz-molybdenite-pyrite veinlets hosted by the Creston granite and molybdenite-pyrite within the quartz matrix of magmatic-hydrothermal breccia of the East Breccia body, which cuts the Creston granite. While minor amounts of chalcopyrite accompany the molybdenite mineralization, more significant quantities of copper occur as chalcocite replacements of pyrite within secondary enrichment blankets that parallel present-day topography. Some chalcocite also occurs below the enrichment blankets, primarily along permeable structural zones such as the Ordoñez fault zone. The Main deposit occurs over an area of about 1,150 m in an east-west direction, a maximum of 875 m in a north-south direction, and 550 m vertically. Higher-grade molybdenum mineralization tends to be concentrated in a west-northwest-trending zone that forms the core of the Main deposit. This high-grade core is centered on the East Breccia in the eastern portion of the deposit, and it continues into the Creston granite to the west.
The Creston granite is extensively altered to potassic, phyllic, argillic, and propylitic alteration assemblages, along with locally strong silicification, over an area measuring approximately 2.5 by 6 km. Most of the molybdenum mineralization is associated with potassic and phyllic (quartz-sericite) alteration, often accompanied by various degrees of silicification” (M3 2009)
1.4 MINERAL PROCESSING AND METALLURGY
1.4.1 Metallurgical testing The Creston deposit has been the subject of metallurgical testing by both American Metal Company (AMAX) and Compania Fresnillo S.A. de C.V. (Fresnillo) during the late 1970’s and early 1980’s. In 2005, P&E Mining Consultants Inc., Brampton, Ontario, Canada, (“P&E”) summarized the results of this early test work in the NI 43-101 compliant technical report “Evaluation Report on the Creston Molybdenum Deposit, Sonora State, Mexico”. In 2008 M3 assisted Creston in developing the metallurgical test protocol and subcontracted the test work to METCON Research, Inc. In 2010 a comprehensive metallurgical test program on the Creston Moly Cu-Mo ore types and to develop the appropriate process flowsheet and design criteria was contracted to G&T Metallurgical Services Ltd.

JDS ENERGY & MINING INC.
CRESTON MOLY CORP. JDS-CMCELC-001
CRESTON PRELIMINARY ECONOMIC ASSESSMENT 11
of Kamloops, BC. The test program was aimed at developing a conventional Cu-Mo flowsheet comprising comminution and bulk flotation followed by Cu-Mo separation. This test work is presently in progress. Flotation feed will consist of a primary grind size of 80% passing 300 microns and regrind steps of 80% passing 40 microns. Molybdenum will be recovered in a molybdenum concentrate in a separate flotation circuit.
1.4.2 Process flow sheet
Ore will be transported from the mine to the concentrator by off-highway haulage trucks. Mineral concentrates of copper and molybdenum will be produced by mineral flotation technology. The sulfide concentrator will consist of one SAG mill in line with two ball mills and a conventional flotation circuit consisting of tank and column cells and separate circuits being employed for molybdenum and copper following the initial bulk moly/copper rougher flotation circuit. Molybdenum concentrate will be transported to a roasting facility. The Creston Moly Project design is to process 50,000 dry tonnes per day or 18,250,000 dry tonnes per year over a period of approximately 13 years. The flotation plant will also produce a copper concentrate which will be trucked offsite for sale or further processing.
1.4.3 Metal Recoveries
As current metallurgical testing has not been completed, the following data is taken from the M3 PFS that was published in 2009. JDS and their sub-consultant Hoe-Teh Consulting Inc. have reviewed the values and have adopted them for the completion of this PEA: Copper recovery to copper concentrate, percent 84.0 Copper concentrate grade, percent copper 28.0 Molybdenum recovery to molybdenum concentrate, percent 88.4 Molybdenum concentrate grade, percent molybdenum 55.0
1.5 MINERAL RESOURCE ESTIMATE
The updated resource estimate was completed by Dr. Gilles Arseneau, P.Geo., and Mike Johnson, P.Geo., SRK Consulting (Canada) Inc., using industry standard methods that conform to National Instrument 43-101 and utilizing GEMSTM Software.
The molybdenum and copper mineralization were modelled and estimated using drillhole data, geological and structural models and interpreted mineral domains. The El Creston deposit Mo mineralization was estimated into a single domain, with a lower boundary formed by the Creston fault and an upper boundary formed by the interpreted lower boundary of the oxide zone. The copper mineralization was estimated into two domains, a higher grade supergene enriched upper zone and a lower grade zone. For all domains, statistical analysis was used to establish appropriate estimation parameters and methods.

JDS ENERGY & MINING INC.
CRESTON MOLY CORP. JDS-CMCELC-001
CRESTON PRELIMINARY ECONOMIC ASSESSMENT 12
The molybdenum and copper grades were estimated into a three-dimensional (“3D”) block model with 10 m by 10 m by 12 m blocks. All estimated blocks were then tested against limiting thresholds; a Whittle open pit optimization and an overriding minimum molybdenum-equivalent grade. These tests were used only for the purposes of determining reasonable prospects of economic extraction on a block-by-block basis. Only blocks within the limits of these tests are included in the Mineral Resource estimate. JDS completed the final Mineral Resource summary based upon SRK’s block model estimates. The Mineral Resource statement is presented in Table 1-1.
TABLE 1-1 IN-PIT MINERAL RESOURCE STATEMENT*, CRESTON MOLY PROJECT, MEXICO, JDS ENERGY AND MINING INC., OCTOBER 26, 2010
Resource Class Total Tonnes Mo (%)
Contained Mo (lbs)
Cu (%)
Contained Cu (lbs)
Measured 56,300,000 0.074% 91,300,000 0.06% 72,000,000
Indicated 159,100,000 0.070% 244,200,000 0.06% 209,000,000
Inferred 7,600,000 0.057% 9,500,000 0.06% 9,000,000
Measured + Indicated
215,400,000 0.071% 335,500,000 0.06% 281,000,000
*Reported at a cut-off grade of 0.036% molybdenum-equivalent within a Whittle pit shell. Mineral Resources are not Mineral Reserves and do not have demonstrated economic viability. All numbers have been rounded to reflect the relative accuracy of the estimates.
(SRK 2010)
1.6 MINE PLAN The mine will be by open pit method employing a conventional open pit truck shovel operation. The mine plan was developed following the selection of an optimized pit shell and subsequent design of an ultimate pit with ramps and designed slopes. The pit optimization results, by resource class, are found in Table 1-2.
TABLE 1-2 PIT OPTIMIZATION RESULTS BY RESOURCE CLASS
Contained Metal Resource Class M Tonnes Mo % Cu %
Mo (M lbs)
Cu (M lbs)
Measured 56.32 0.074 0.058 91.29 71.58
Indicated 159.10 0.070 0.060 244.21 208.91
Measured + Indicated 215.42 0.071 0.059 335.50 280.49
Inferred 7.59 0.057 0.058 9.52 9.91
Mineral Resources that are not mineral reserves do not have demonstrated economic viability. Mineral resource estimates do not account for mineability, selectivity, mining loss and dilution. These mineral

JDS ENERGY & MINING INC.
CRESTON MOLY CORP. JDS-CMCELC-001
CRESTON PRELIMINARY ECONOMIC ASSESSMENT 13
resource estimates include inferred mineral resources that are normally considered too speculative geologically to have economic considerations applied to them that would enable them to be categorized as mineral reserves. There is also no certainty that these inferred mineral resources will be converted to measured and indicated categories through further drilling, or into mineral reserves, once economic considerations are applied.
Pre-stripping will begin in the second half of Year -2 (1-1.5 years before operation) and will provide embankment material for the TSF’s South and East Dams, as well as for other construction fill purposes. Some plant feed material will need to be stockpiled during Year -1 to permit efficient development of the pre-mine, but all of the material is scheduled to be rehandled and processed in Year 1.
At full production the mine is expected to generate 50,000 tonnes ore per day over 365 operating days per year or 18,250,000 ore tonnes annually. Mining begins in a relatively higher grade copper zone. The stripping ratio for the LOM averages approximately 1:1 and varies as shown in the mine production plan in Table 1-3. The inferred mineral resources included in the mine production plan represent 3.4% of the total plant feed.
TABLE 1-3 MINE PRODUCTION PLAN
Year Plant Feed (Mt)
Waste (Mt)
Total (Mt)
W: O Ratio
Mo (%)
Cu (%)
Mo (M lbs)
Cu (M lbs)
-1 2.99 37.22 40.21 12.44 0.054 0.162 3.56 10.66
1 11.61 31.13 42.74 2.68 0.069 0.075 17.68 19.11
2 18.25 25.46 43.71 1.39 0.070 0.089 28.26 35.68
3 18.25 33.14 51.39 1.82 0.060 0.112 24.15 44.99
4 18.25 18.39 36.64 1.01 0.057 0.114 22.88 45.69
5 18.25 13.77 32.02 0.75 0.065 0.099 25.98 40.01
6 18.25 10.35 28.60 0.57 0.069 0.070 27.66 27.99
7 18.25 8.95 27.20 0.49 0.074 0.054 29.92 21.87
8 18.25 8.52 26.77 0.47 0.076 0.034 30.41 13.67
9 18.25 7.50 25.75 0.41 0.073 0.027 29.44 10.88
10 18.25 8.19 26.44 0.45 0.071 0.023 28.41 9.45
11 18.25 8.80 27.05 0.48 0.073 0.023 29.40 9.28
12 18.25 5.47 23.72 0.30 0.063 0.021 25.47 8.49
13 17.08 7.31 24.38 0.43 0.074 0.019 27.83 7.18
Total 232.43 224.19 456.62 0.96 0.069 0.060 351.05 304.95
JDS ENERGY & MINING INC.
CRESTON MOLY CORP. JDS-CMCELC-001
CRESTON PRELIMINARY ECONOMIC ASSESSMENT 14
1.7 WASTE MANAGEMENT PLAN
Mill tailings will be sent to a surface Tailings Site Facility (TSF) to the south of the process plant in a drainage basin identified as El Batamonte. This is the area identified as Tailings Pond #8 in the PFS and was preferred by Golder Associates because of the larger containment area and potential for increased capacity. It was not selected for the PFS as Creston Moly Corporation had not completed negotiations with the land owner at that time. This was rectified in 2010 and legal agreements are now in place.
Tailings will be dewatered in the plant thickener to a nominal 60% solids and pumped to the TSF. The LOM plan shows an estimated 372 million cubic meters of tailings to be stored on surface. The El Batamonte TSF differs from the option chosen in the M3 2009 PFS in that it is further from the mine and plant location, will be a dedicated TSF rather than co-mingled with mine waste rock, and will contain a coarser (P80) material.
The mine will generate an estimated 224 million tonnes of waste rock which will be placed in the former (PFS) TSF location, but of increased height of Run of Mine (ROM) material. In comparison to the PFS TSF/RSF comingled concept, the approach taken in the PEA will result in net cost reduction due to shorter hauls and less effort in special handling/thinner lifts.
Waste rock characterization work has begun by SRK Consulting Inc. (“SRK”) and the final results and conclusions will be included in the Feasibility Study. Also part of their scope of work is a pit lake chemistry analysis. The preliminary characterization results indicate there is potential for approximately 18% of the waste rock and pit wall rock material to generate acid and leach metals when exposed to air and water. Furthermore, results from the adit stockpiles suggest that as the material weathers, soluble salts will form and the material will become more reactive over time. Even though the potential magnitude of constituent release is low in comparison to higher sulfidation systems, there is limited neutralization capacity (currently estimated at 7%) in the system to buffer the acid generation and as a result some engineering controls will be necessary in order to mitigate the potential for constituent release.
It is estimated that 75% of the material will be neutral (non-PAG). Further work on the pyrite bearing ore is intended to see if a concentrate could be developed for sale to one of the nearby smelters. At the very least, successful removal of pyrite will help reduce ARD potential in the tailings pond. SRK is currently conducting detailed work to identify and correlate ARD potential material to the primary rock types encountered during the 2010 drill programs and remapping of old and new road cuts. This work will assist in preparing a waste management plan that will be incorporated into the Feasibility Study.
1.8 ENVIRONMENTAL CONSIDERATIONS
“For the most part, federal laws regulate mining in Mexico, but there are some aspects subject to state or local approval. The Secretary of Environment and Natural Resources (SEMARNAT) is the chief agency regulating environmental matters in Mexico. The Mexican national water commission (CONAGUA) has authority over all matters concerning water rights and activities that affect groundwater and surface water, including diversion of floodwaters.
JDS ENERGY & MINING INC.
CRESTON MOLY CORP. JDS-CMCELC-001
CRESTON PRELIMINARY ECONOMIC ASSESSMENT 15
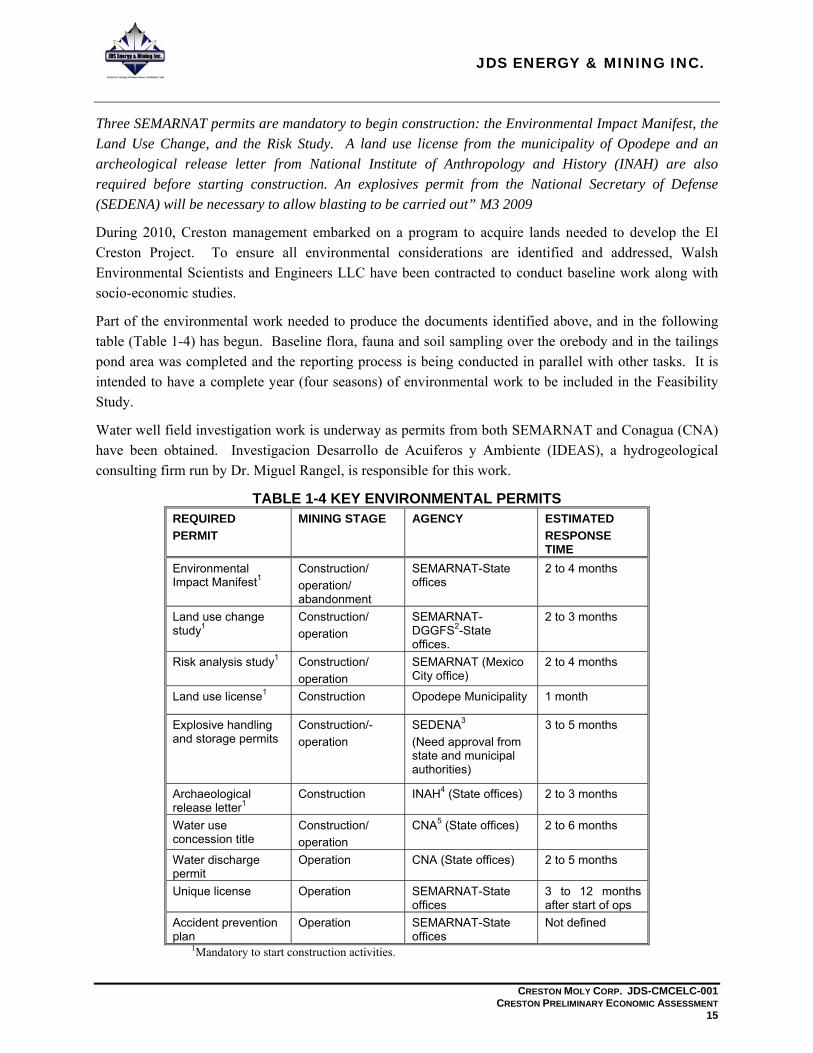
Three SEMARNAT permits are mandatory to begin construction: the Environmental Impact Manifest, the Land Use Change, and the Risk Study. A land use license from the municipality of Opodepe and an archeological release letter from National Institute of Anthropology and History (INAH) are also required before starting construction. An explosives permit from the National Secretary of Defense (SEDENA) will be necessary to allow blasting to be carried out” M3 2009
During 2010, Creston management embarked on a program to acquire lands needed to develop the El Creston Project. To ensure all environmental considerations are identified and addressed, Walsh Environmental Scientists and Engineers LLC have been contracted to conduct baseline work along with socio-economic studies.
Part of the environmental work needed to produce the documents identified above, and in the following table (Table 1-4) has begun. Baseline flora, fauna and soil sampling over the orebody and in the tailings pond area was completed and the reporting process is being conducted in parallel with other tasks. It is intended to have a complete year (four seasons) of environmental work to be included in the Feasibility Study.
Water well field investigation work is underway as permits from both SEMARNAT and Conagua (CNA) have been obtained. Investigacion Desarrollo de Acuiferos y Ambiente (IDEAS), a hydrogeological consulting firm run by Dr. Miguel Rangel, is responsible for this work.
TABLE 1-4 KEY ENVIRONMENTAL PERMITS REQUIRED PERMIT
MINING STAGE AGENCY ESTIMATED RESPONSE TIME
Environmental Impact Manifest1
Construction/ operation/ abandonment
SEMARNAT-State offices
2 to 4 months
Land use change study1
Construction/ operation
SEMARNAT-DGGFS2-State offices.
2 to 3 months
Risk analysis study1 Construction/ operation
SEMARNAT (Mexico City office)
2 to 4 months
Land use license1 Construction Opodepe Municipality 1 month
Explosive handling and storage permits
Construction/- operation
SEDENA3 (Need approval from state and municipal authorities)
3 to 5 months
Archaeological release letter1
Construction INAH4 (State offices) 2 to 3 months
Water use concession title
Construction/ operation
CNA5 (State offices) 2 to 6 months
Water discharge permit
Operation CNA (State offices) 2 to 5 months
Unique license Operation SEMARNAT-State offices
3 to 12 months after start of ops
Accident prevention plan
Operation SEMARNAT-State offices
Not defined
1Mandatory to start construction activities.
JDS ENERGY & MINING INC.
CRESTON MOLY CORP. JDS-CMCELC-001
CRESTON PRELIMINARY ECONOMIC ASSESSMENT 16
2DGGFS (General Department of Permitting for Forestry and Soils) 3SEDENA (National Secretary of Defense) 4INAH (National Institute of Anthropology and History) 5CNA (National Water Commission)
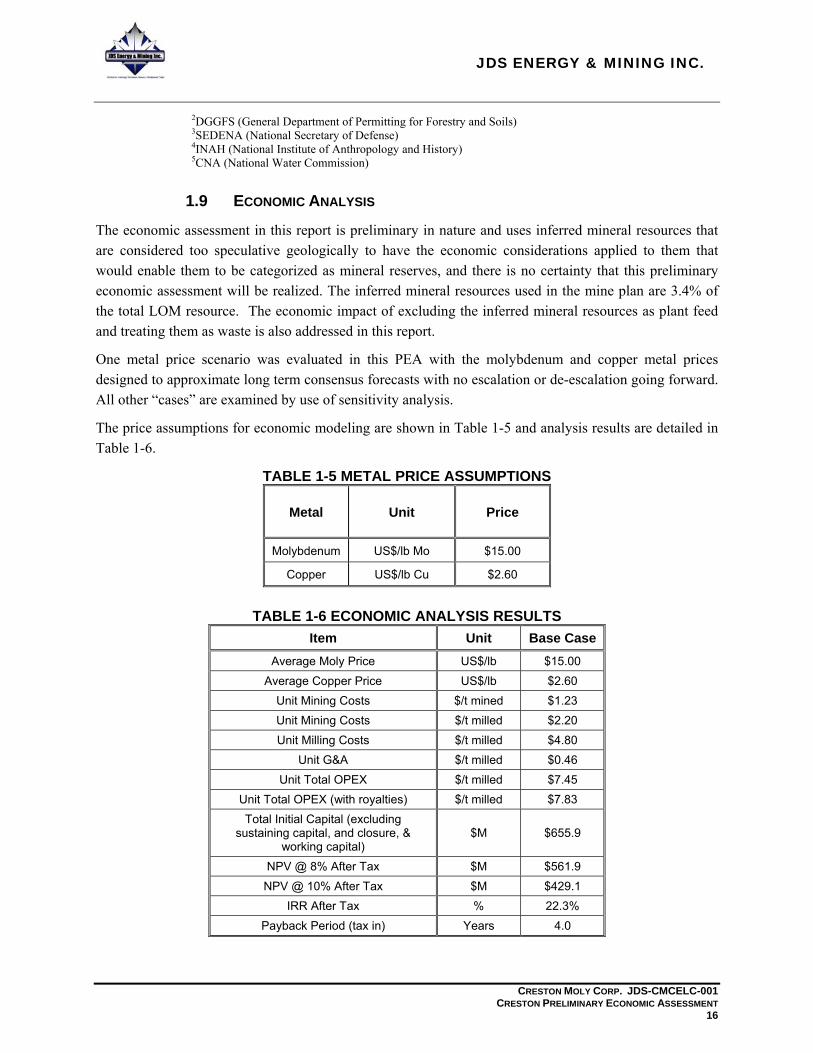
1.9 ECONOMIC ANALYSIS
The economic assessment in this report is preliminary in nature and uses inferred mineral resources that are considered too speculative geologically to have the economic considerations applied to them that would enable them to be categorized as mineral reserves, and there is no certainty that this preliminary economic assessment will be realized. The inferred mineral resources used in the mine plan are 3.4% of the total LOM resource. The economic impact of excluding the inferred mineral resources as plant feed and treating them as waste is also addressed in this report.
One metal price scenario was evaluated in this PEA with the molybdenum and copper metal prices designed to approximate long term consensus forecasts with no escalation or de-escalation going forward. All other “cases” are examined by use of sensitivity analysis.
The price assumptions for economic modeling are shown in Table 1-5 and analysis results are detailed in Table 1-6.
TABLE 1-5 METAL PRICE ASSUMPTIONS
Metal Unit Price
Molybdenum US$/lb Mo $15.00
Copper US$/lb Cu $2.60
TABLE 1-6 ECONOMIC ANALYSIS RESULTS
Item Unit Base Case Average Moly Price US$/lb $15.00
Average Copper Price US$/lb $2.60 Unit Mining Costs $/t mined $1.23 Unit Mining Costs $/t milled $2.20 Unit Milling Costs $/t milled $4.80
Unit G&A $/t milled $0.46 Unit Total OPEX $/t milled $7.45
Unit Total OPEX (with royalties) $/t milled $7.83 Total Initial Capital (excluding
sustaining capital, and closure, & working capital)
$M $655.9
NPV @ 8% After Tax $M $561.9 NPV @ 10% After Tax $M $429.1
IRR After Tax % 22.3% Payback Period (tax in) Years 4.0

JDS ENERGY & MINING INC.
CRESTON MOLY CORP. JDS-CMCELC-001
CRESTON PRELIMINARY ECONOMIC ASSESSMENT 17
1.9.1 Capital and Operating Costs All capital costs are in US dollars. Total capital and operating costs are summarized in Table 1-7 and Table 1-8.
TABLE 1-7 CAPITAL COST SUMMARY
ITEMS (millions)
Mine (including pre-stripping) $145.7
Process Plant $195.5
Tailings $32.2
General Site and Ancillaries $64.0
Camp $8.4
Direct Cost Total $445.9
Contractor Indirects $15.3
Freight, IMMEX $36.0
Engineering & Management $52.6
Contingency $75.3
Owner's Costs, CFE and Startup Spares $30.7
Total Capital Cost $655.9
Working Capital is $20.7 M in Year -1.

JDS ENERGY & MINING INC.
CRESTON MOLY CORP. JDS-CMCELC-001
CRESTON PRELIMINARY ECONOMIC ASSESSMENT 18
TABLE 1-8 TOTAL PROJECT OPERATING COST
Sulfide Ore Tonnes (processed tonnes x 1000) 232,428
Molybdenum - produced (lbs x 1000) 310,378
Total Tonnes Mined (tonnes x 1000) 416,402 (excludes Pre-Strip)
LOM Cost
Mining Operations ($ x1000) $/Total Tonnes Mined $/Moly Lb - produced
Load & Haul $301,036 $0.72 $0.97
Drill & Blast $116,740 $0.28 $0.38
Mine General $25,481 $0.06 $0.08
Mine Maintenance $20,886 $0.05 $0.07
Contract $45,022 $0.11 $0.15
Rehandle $2,154 $0.01 $0.01
Total Mining $511,319 $1.23 $1.65
Mill Operations $/Ore Tonnes Processed
Crushing & Conveying $80,652 $0.35 $0.26
Grinding & Classification $707,975 $3.05 $2.28
Flotation & Regrind $151,543 $0.65 $0.49
Concentrate Filtration & Dewatering $62,756 $0.27 $0.20
Tailing Disposal $27,426 $0.12 $0.09
Ancillary Services $84,371 $0.36 $0.27
Total Mill Operations $1,114,724 $4.80 $3.59
General & Administrative $105,777 $0.46 $0.34
Total Operating Cost $1,731,820 $7.45 $5.58
LOM copper credits (payable copper less conversion costs) would be $1.46/lb Mo, offsetting the $5.58/lb Mo operating cost to $4.12/lb Mo (produced/recovered). A production summary is shown in Table 1-9.
JDS ENERGY & MINING INC.
CRESTON MOLY CORP. JDS-CMCELC-001
CRESTON PRELIMINARY ECONOMIC ASSESSMENT 19
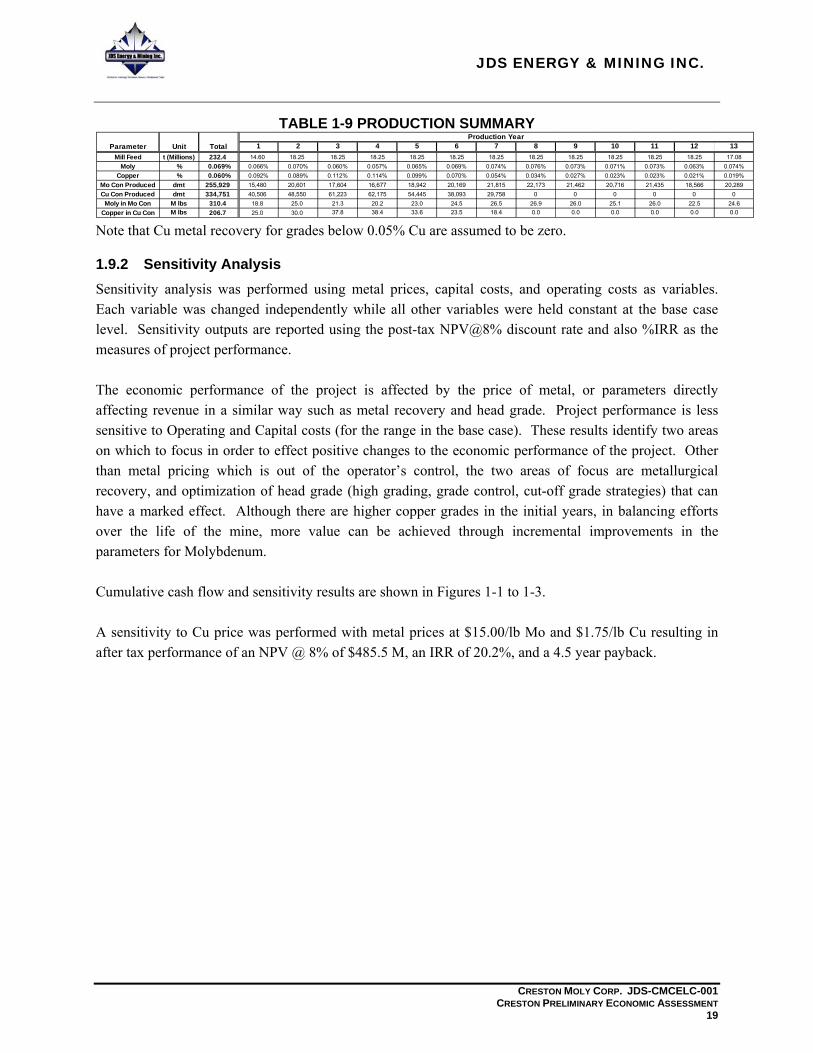
TABLE 1-9 PRODUCTION SUMMARY 1 2 3 4 5 6 7 8 9 10 11 12 13
Mill Feed t (Millions) 232.4 14.60 18.25 18.25 18.25 18.25 18.25 18.25 18.25 18.25 18.25 18.25 18.25 17.08 Moly % 0.069% 0.066% 0.070% 0.060% 0.057% 0.065% 0.069% 0.074% 0.076% 0.073% 0.071% 0.073% 0.063% 0.074%
Copper % 0.060% 0.092% 0.089% 0.112% 0.114% 0.099% 0.070% 0.054% 0.034% 0.027% 0.023% 0.023% 0.021% 0.019%Mo Con Produced dmt 255,929 15,480 20,601 17,604 16,677 18,942 20,169 21,815 22,173 21,462 20,716 21,435 18,566 20,289 Cu Con Produced dmt 334,751 40,506 48,550 61,223 62,175 54,445 38,093 29,758 0 0 0 0 0 0
Moly in Mo Con M lbs 310.4 18.8 25.0 21.3 20.2 23.0 24.5 26.5 26.9 26.0 25.1 26.0 22.5 24.6 Copper in Cu Con M lbs 206.7 25.0 30.0 37.8 38.4 33.6 23.5 18.4 0.0 0.0 0.0 0.0 0.0 0.0
Parameter Unit TotalProduction Year
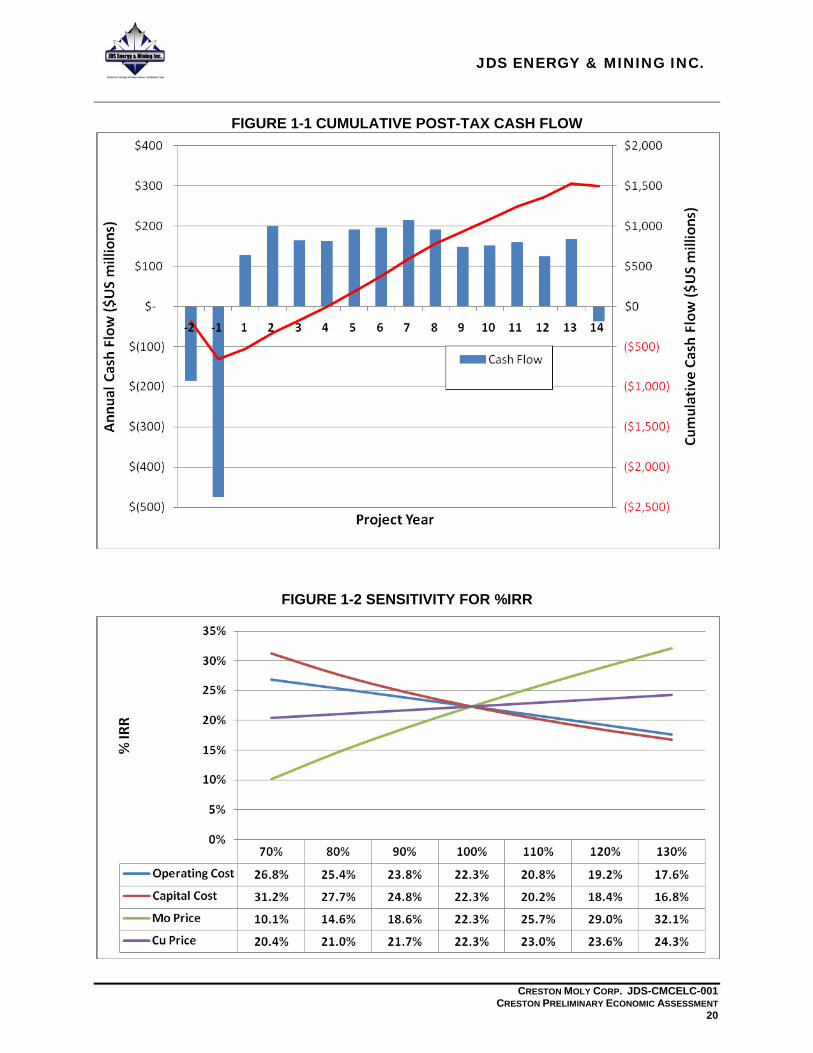
Note that Cu metal recovery for grades below 0.05% Cu are assumed to be zero. 1.9.2 Sensitivity Analysis Sensitivity analysis was performed using metal prices, capital costs, and operating costs as variables. Each variable was changed independently while all other variables were held constant at the base case level. Sensitivity outputs are reported using the post-tax NPV@8% discount rate and also %IRR as the measures of project performance. The economic performance of the project is affected by the price of metal, or parameters directly affecting revenue in a similar way such as metal recovery and head grade. Project performance is less sensitive to Operating and Capital costs (for the range in the base case). These results identify two areas on which to focus in order to effect positive changes to the economic performance of the project. Other than metal pricing which is out of the operator’s control, the two areas of focus are metallurgical recovery, and optimization of head grade (high grading, grade control, cut-off grade strategies) that can have a marked effect. Although there are higher copper grades in the initial years, in balancing efforts over the life of the mine, more value can be achieved through incremental improvements in the parameters for Molybdenum. Cumulative cash flow and sensitivity results are shown in Figures 1-1 to 1-3. A sensitivity to Cu price was performed with metal prices at $15.00/lb Mo and $1.75/lb Cu resulting in after tax performance of an NPV @ 8% of $485.5 M, an IRR of 20.2%, and a 4.5 year payback.
JDS ENERGY & MINING INC.
CRESTON MOLY CORP. JDS-CMCELC-001
CRESTON PRELIMINARY ECONOMIC ASSESSMENT 20
FIGURE 1-1 CUMULATIVE POST-TAX CASH FLOW
FIGURE 1-2 SENSITIVITY FOR %IRR

JDS ENERGY & MINING INC.
CRESTON MOLY CORP. JDS-CMCELC-001
CRESTON PRELIMINARY ECONOMIC ASSESSMENT 21
FIGURE 1-3 SENSITIVITY FOR NPV @ 8%
1.10 CONCLUSIONS
The Creston Project contains a substantial sulphide resource that can be mined by open pit methods.
At the metal prices used for evaluation, the project is economic and should proceed to a completed Feasibility Study.
There is a likelihood of improving the project economics by further optimization of the mining plan to expose higher grade ore earlier in the production schedule and as well as by the use of mining contractor services.
Pit slopes are not optimized and are subject to the results of a pending geotechnical analysis.
Plant process performance is not optimized and metallurgical programs are in progress to optimize design criteria.
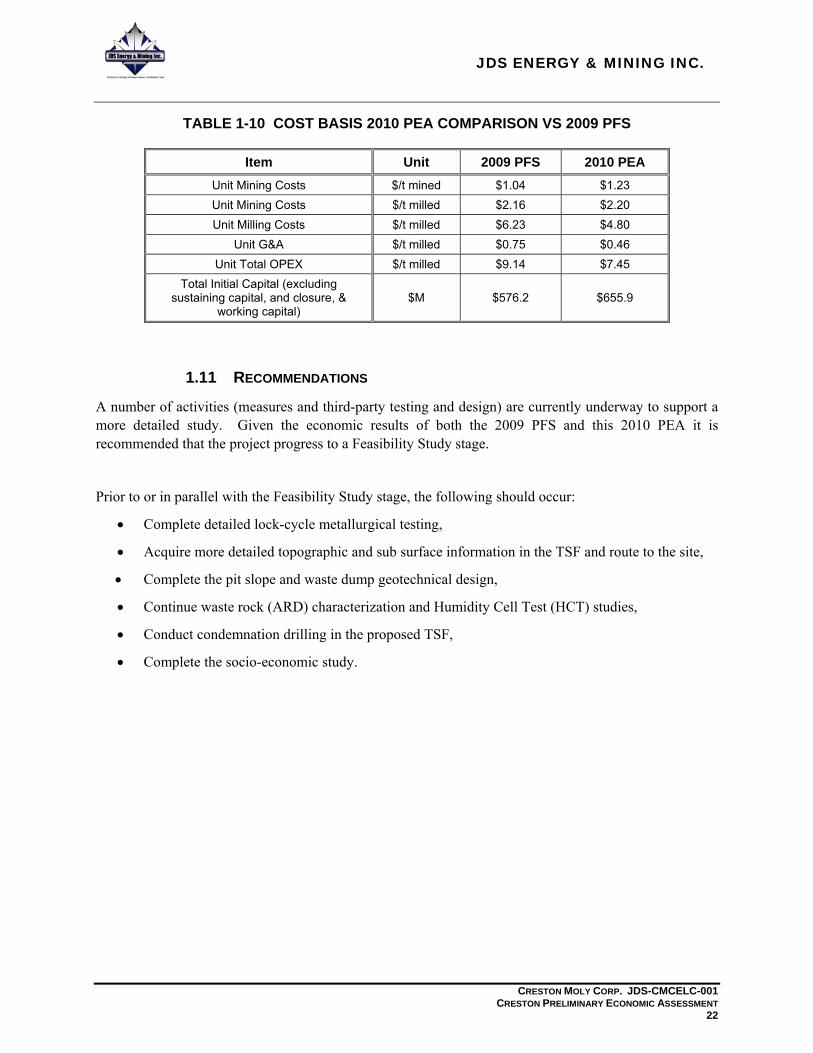
The changes and improvements made to the 2009 PFS are based on an increased resource base, metallurgical testwork (coarser grind results) and land position agreements. The cost input comparisons are quantified in Table 1-10.
JDS ENERGY & MINING INC.
CRESTON MOLY CORP. JDS-CMCELC-001
CRESTON PRELIMINARY ECONOMIC ASSESSMENT 22
TABLE 1-10 COST BASIS 2010 PEA COMPARISON VS 2009 PFS
Item Unit 2009 PFS 2010 PEA Unit Mining Costs $/t mined $1.04 $1.23 Unit Mining Costs $/t milled $2.16 $2.20 Unit Milling Costs $/t milled $6.23 $4.80
Unit G&A $/t milled $0.75 $0.46 Unit Total OPEX $/t milled $9.14 $7.45
Total Initial Capital (excluding sustaining capital, and closure, &
working capital) $M $576.2 $655.9
1.11 RECOMMENDATIONS
A number of activities (measures and third-party testing and design) are currently underway to support a more detailed study. Given the economic results of both the 2009 PFS and this 2010 PEA it is recommended that the project progress to a Feasibility Study stage.
Prior to or in parallel with the Feasibility Study stage, the following should occur:
• Complete detailed lock-cycle metallurgical testing,
• Acquire more detailed topographic and sub surface information in the TSF and route to the site,
• Complete the pit slope and waste dump geotechnical design,
• Continue waste rock (ARD) characterization and Humidity Cell Test (HCT) studies,
• Conduct condemnation drilling in the proposed TSF,
• Complete the socio-economic study.
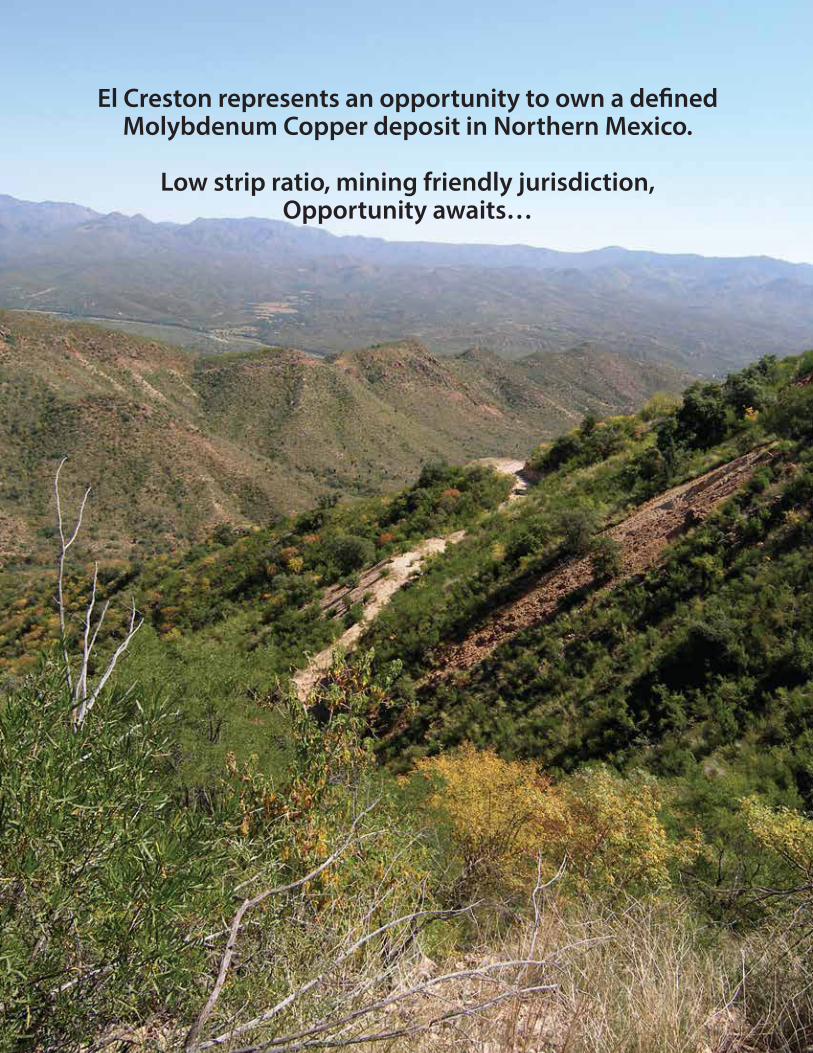
El Creston represents an opportunity to own a de�ned Molybdenum Copper deposit in Northern Mexico.
Low strip ratio, mining friendly jurisdiction,Opportunity awaits…
STARCORE INTERNATIONAL MINES LTD.
An Introducion to the El Creston Deposit
TSX:SAM