Embed Size (px)
Citation preview

Citibank Japan Ltd.
Annual Report For the Fiscal Year Ended March 31, 2014
www.citibank.co.jp


Table of Contents
Message from the CEO 1
Company Overview 2
Our History 5
Management Strategy 6
Business Outline 8
Risk Management Framework 17
Compliance Framework 19
Diversity and CSR Activities 20
Citibank Japan Ltd. Financial Information under Japanese GAAP 21 For the Fiscal Year Ended March 31, 2014
1. Matters Related to Principal Business 22
2. Financial Statements 40
3. Market Value Information 56
4. Major Shareholders 61
5. Disclosure Items Based on Pillar 3 of Basel III 62

Citibank Japan Ltd. 1
Message from the CEO
To Our Valued Customers,
On June 1, 2014, I assumed the role of President & CEO of Citibank Japan Ltd. It is a great honor to lead this company and proudly serve our clients as we have been doing over our 112 year history. Over that time Citibank Japan has built a reputation for providing innovative and high quality services to our retail, corporate and institutional customers. I am determined to work with our employees to further strengthen our business and continue to improve the quality of our products and services for our customers in Japan and around the world.
Fiscal year 2013 has seen moderate recovery in the Japanese economy, as several measures aimed at boosting the Japanese economy have taken effect. This has brought with it both opportunities and challenges for Japanese individuals and corporations. Citibank Japan is well positioned to help our customers succeed in such an environment.
Citibank Japan is financially strong and well capitalized, and as a part of Citi is a member of a global financial services group that does business in more than 160 countries and jurisdictions. Citibank Japan is committed to being a bank that meets local market expectations, with a strong compliance and governance framework; to serving Japanese consumers, corporations, governments and institutions; and to making our contribution as part of Japan's society and economy.
Thank you very much for your continued patronage and support.
July 2014
Peter B. Eliot Representative Director, President & CEO
Citibank Japan Ltd.
1
2 Citibank Japan Ltd.
Company Overview
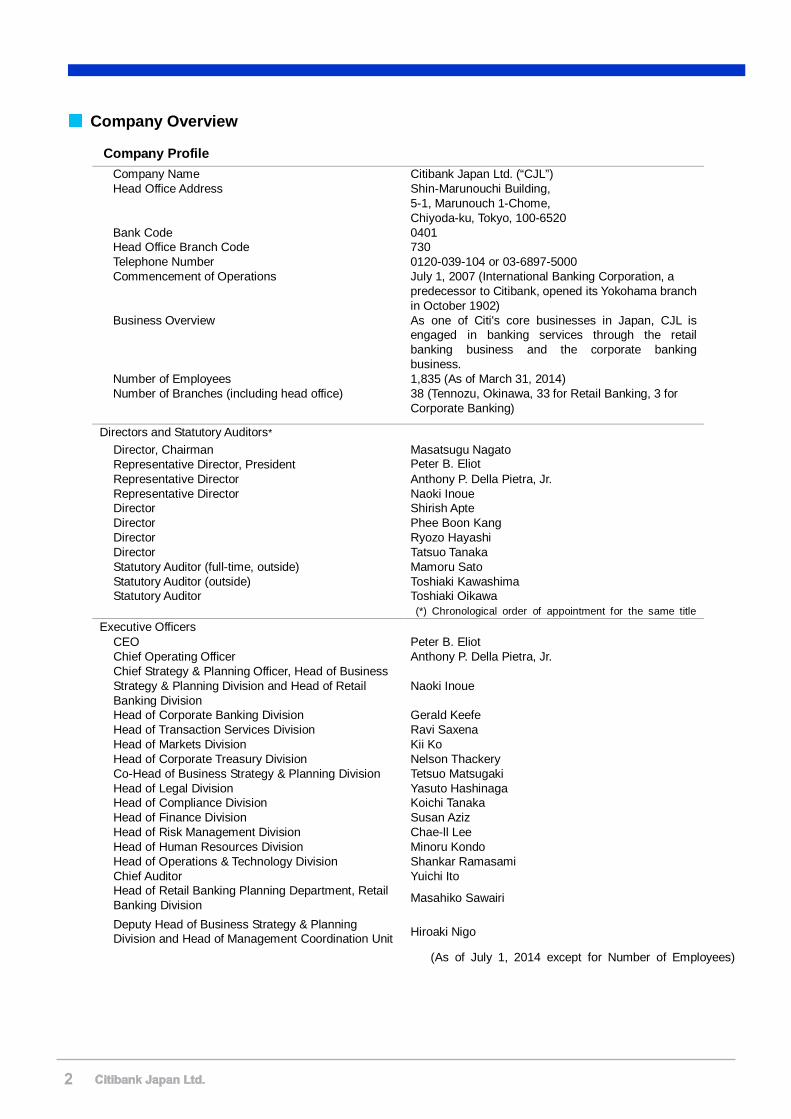
Company Profile Company Name Citibank Japan Ltd. (“CJL”) Head Office Address Shin-Marunouchi Building,
5-1, Marunouch 1-Chome, Chiyoda-ku, Tokyo, 100-6520
Bank Code 0401 Head Office Branch Code 730 Telephone Number 0120-039-104 or 03-6897-5000 Commencement of Operations July 1, 2007 (International Banking Corporation, a
predecessor to Citibank, opened its Yokohama branch in October 1902)
Business Overview As one of Citi's core businesses in Japan, CJL is engaged in banking services through the retail banking business and the corporate banking business.
Number of Employees 1,835 (As of March 31, 2014) Number of Branches (including head office) 38 (Tennozu, Okinawa, 33 for Retail Banking, 3 for
Corporate Banking)
Directors and Statutory Auditors* Director, Chairman Masatsugu Nagato Representative Director, President Peter B. Eliot Representative Director Anthony P. Della Pietra, Jr. Representative Director Naoki Inoue Director Shirish Apte Director Phee Boon Kang Director Ryozo Hayashi Director Tatsuo Tanaka Statutory Auditor (full-time, outside) Mamoru Sato Statutory Auditor (outside) Toshiaki Kawashima Statutory Auditor Toshiaki Oikawa
(*) Chronological order of appointment for the same title Executive Officers
CEO Peter B. Eliot Chief Operating Officer Anthony P. Della Pietra, Jr. Chief Strategy & Planning Officer, Head of Business Strategy & Planning Division and Head of Retail Banking Division
Naoki Inoue
Head of Corporate Banking Division Gerald Keefe Head of Transaction Services Division Ravi Saxena Head of Markets Division Kii Ko Head of Corporate Treasury Division Nelson Thackery Co-Head of Business Strategy & Planning Division Tetsuo Matsugaki Head of Legal Division Yasuto Hashinaga Head of Compliance Division Koichi Tanaka Head of Finance Division Susan Aziz Head of Risk Management Division Chae-ll Lee Head of Human Resources Division Minoru Kondo Head of Operations & Technology Division Shankar Ramasami Chief Auditor Yuichi Ito Head of Retail Banking Planning Department, Retail Banking Division Masahiko Sawairi
Deputy Head of Business Strategy & PlanningDivision and Head of Management Coordination Unit Hiroaki Nigo
(As of July 1, 2014 except for Number of Employees)
2
Citibank Japan Ltd. 3
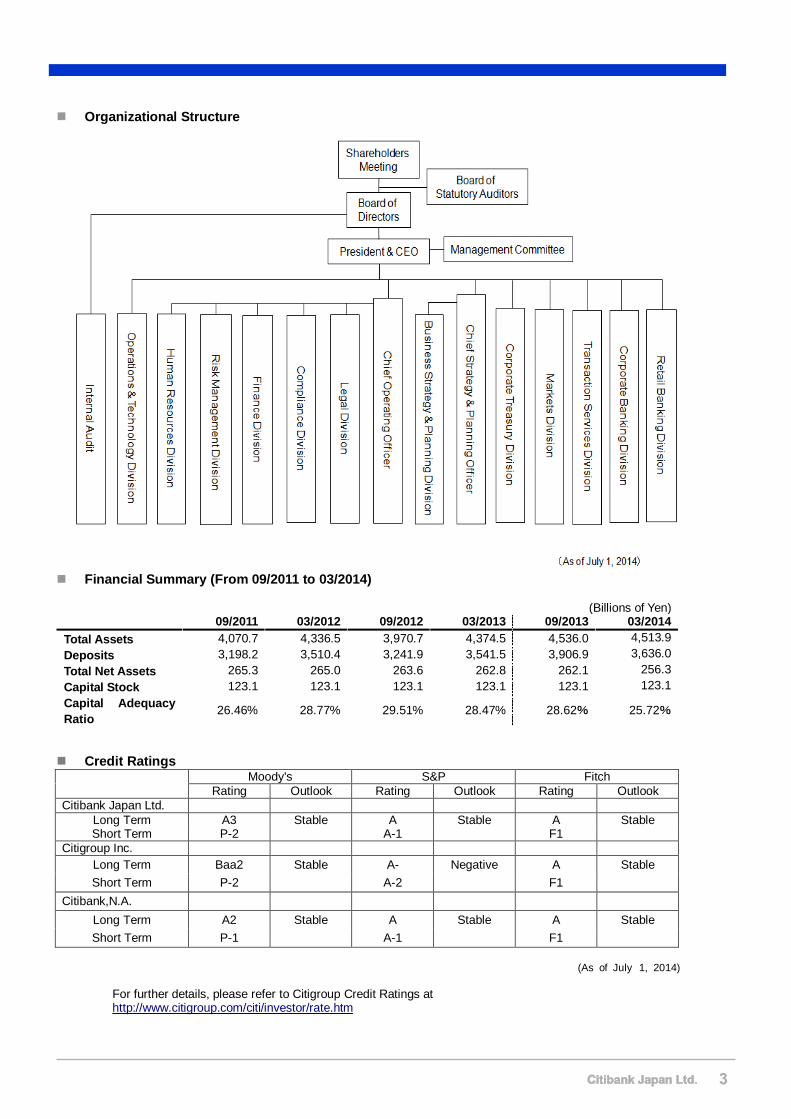
Organizational Structure
Financial Summary (From 09/2011 to 03/2014)
(Billions of Yen) 09/2011 03/2012 09/2012 03/2013 09/2013 03/2014 Total Assets 4,070.7 4,336.5 3,970.7 4,374.5 4,536.0 4,513.9 Deposits 3,198.2 3,510.4 3,241.9 3,541.5 3,906.9 3,636.0 Total Net Assets 265.3 265.0 263.6 262.8 262.1 256.3 Capital Stock 123.1 123.1 123.1 123.1 123.1 123.1 Capital Adequacy Ratio
26.46% 28.77% 29.51% 28.47% 28.62% 25.72%
Credit Ratings
Moody's S&P Fitch Rating Outlook Rating Outlook Rating Outlook
Citibank Japan Ltd. Long Term A3 Stable A Stable A Stable Short Term P-2 A-1 F1
Citigroup Inc. Long Term Baa2 Stable A- Negative A Stable Short Term P-2 A-2 F1
Citibank,N.A. Long Term A2 Stable A Stable A Stable Short Term P-1 A-1 F1
(As of July 1, 2014)
For further details, please refer to Citigroup Credit Ratings at http://www.citigroup.com/citi/investor/rate.htm
3
4 Citibank Japan Ltd.
Deposit Insurance
CJL has its head office located in Japan and is a member of the Deposit Insurance Corporation (DIC). Pursuant to the Deposit Insurance System, non-interest-bearing Yen deposits for payment and settlement purposes accepted by CJL are protected in full per depositor; and interest-bearing Yen deposits accepted by CJL are protected up to a maximum of 10 million yen in principal plus related interest thereon per depositor.
Bank Agency Service
Name of Bank Agent Citigroup Global Markets Japan, Inc. (“CGMJ”) Offices of Bank Agent CGMJ Tokyo Headquarters Service Coverage Intermediary of certain produces offered by CJL’s Corporate
Banking Division (yen/foreign currency deposits and remittance services)
Foreign Bank Agency Service
Designated Dispute Resolution Organization for CJL
Japanese Bankers Association (“JBA”) Contact for consultation and exchange of views: JBA Customer Relations Center 0570-017109 or 03-5252-3772
CJL has concluded a Basic Contract for Implementation of Dispute Resolution Procedure with JBA, the Designated Dispute Resolution Organization under the Banking Act. JBA runs the JBA Customer Relations Center as a contact point to which customers can go for consultation and inquiries or to which they can direct their opinions and complaints about banks. Refer to the JBA website for more information. http://www.zenginkyo.or.jp/adr/ * JBA Customer Relations Center’s services are available only in Japanese.
Name of Affiliated ForeignBank
Citibank, N.A.
Offices of Bank Agent CJL Head Office and Osaka Branch Service Coverage -Intermediation for acceptance of deposits or installment savings
-Intermediation for making of loans or negotiation of bills/notes -Intermediation for exchange transactions -Intermediation for issuance of bank guarantee and acceptance of bills/notes
-Intermediations for other ancillary services(Letter of Credit related)
4
Citibank Japan Ltd. 5
Our History
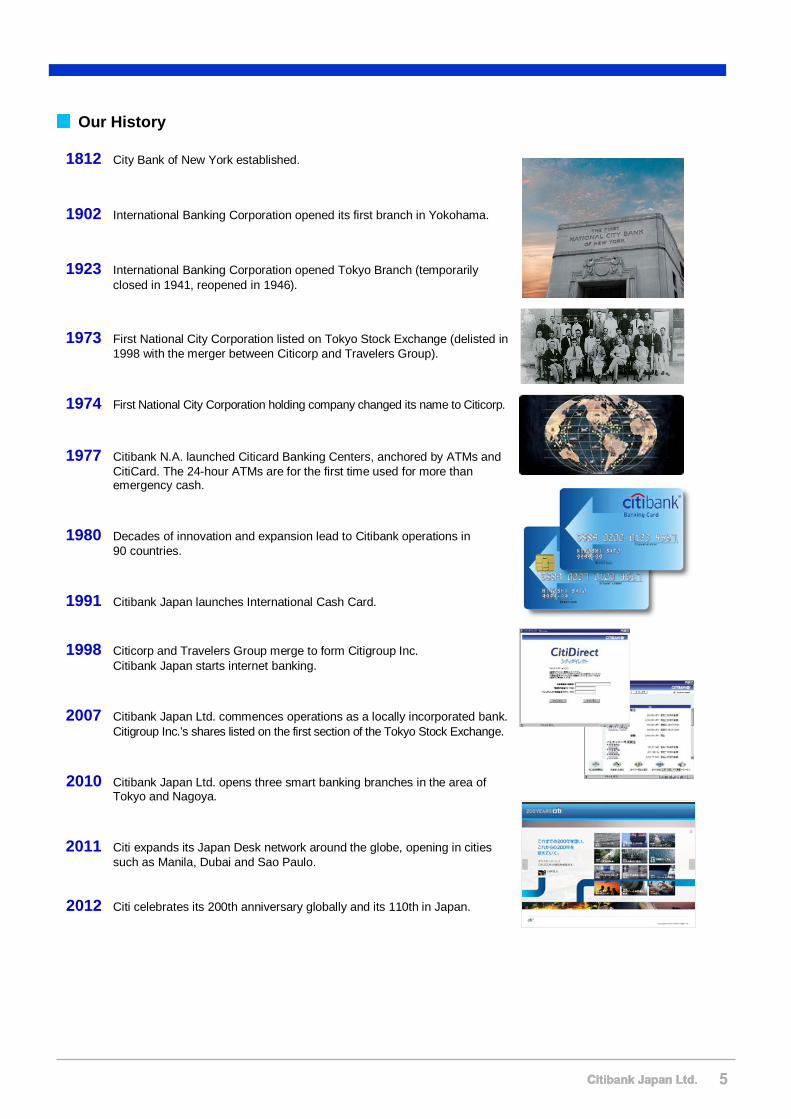
1812 City Bank of New York established.
1902 International Banking Corporation opened its first branch in Yokohama.
1923 International Banking Corporation opened Tokyo Branch (temporarilyclosed in 1941, reopened in 1946).
1973 First National City Corporation listed on Tokyo Stock Exchange (delisted in1998 with the merger between Citicorp and Travelers Group).
1974 First National City Corporation holding company changed its name to Citicorp.
1977 Citibank N.A. launched Citicard Banking Centers, anchored by ATMs andCitiCard. The 24-hour ATMs are for the first time used for more than emergency cash.
1980 Decades of innovation and expansion lead to Citibank operations in90 countries.
1991 Citibank Japan launches International Cash Card.
1998 Citicorp and Travelers Group merge to form Citigroup Inc.Citibank Japan starts internet banking.
2007 Citibank Japan Ltd. commences operations as a locally incorporated bank.Citigroup Inc.’s shares listed on the first section of the Tokyo Stock Exchange.
2010 Citibank Japan Ltd. opens three smart banking branches in the area ofTokyo and Nagoya.
2011 Citi expands its Japan Desk network around the globe, opening in citiessuch as Manila, Dubai and Sao Paulo.
2012 Citi celebrates its 200th anniversary globally and its 110th in Japan.
5
6 Citibank Japan Ltd.
Management Strategy
Citi’s Mission: Enabling Progress
Citi works tirelessly to serve individuals, communities, institutions and nations. With 200 years of experience meeting the world's toughest challenges and seizing its greatest opportunities, we strive to create the best outcomes for our clients and customers with financial solutions that are simple, creative and responsible. An institution connecting over 1,000 cities, 160 countries and millions of people, we are your global bank; we are Citi.
The four key principles—the values that guide us as we perform our mission—are:
Citibank Japan Management Strategy
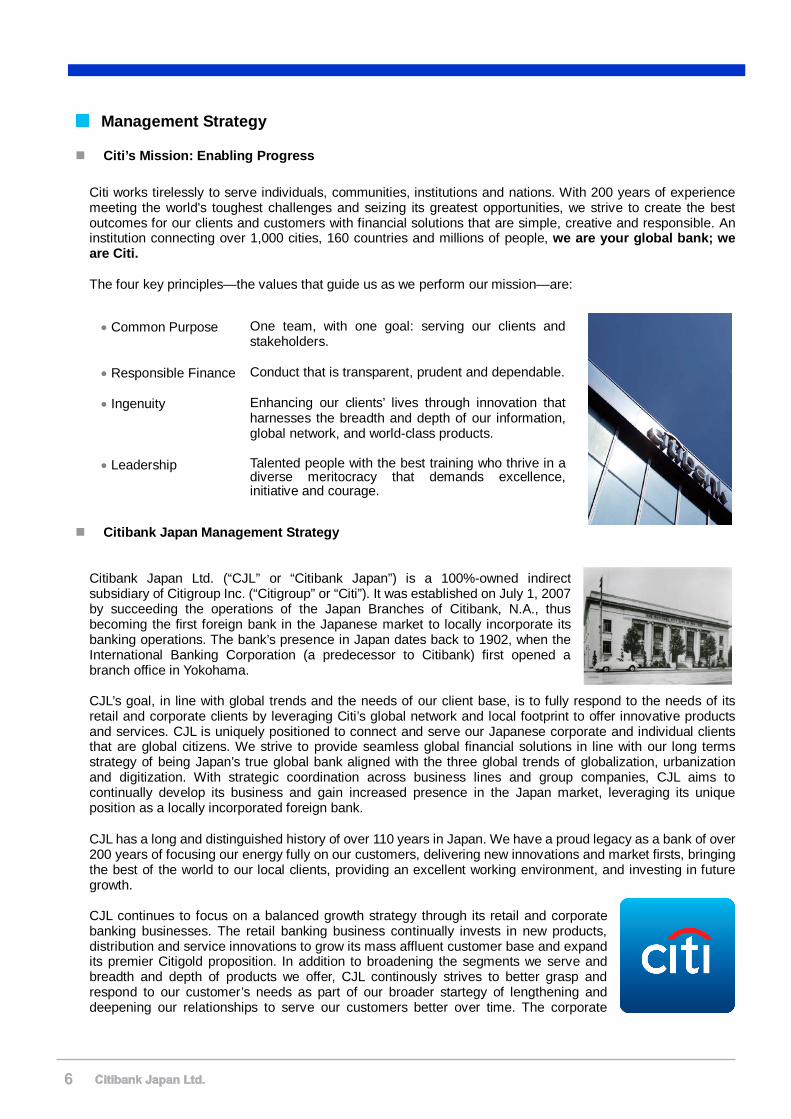
Citibank Japan Ltd. (“CJL” or “Citibank Japan”) is a 100%-owned indirect subsidiary of Citigroup Inc. (“Citigroup” or “Citi”). It was established on July 1, 2007 by succeeding the operations of the Japan Branches of Citibank, N.A., thus becoming the first foreign bank in the Japanese market to locally incorporate its banking operations. The bank’s presence in Japan dates back to 1902, when the International Banking Corporation (a predecessor to Citibank) first opened a branch office in Yokohama.
CJL’s goal, in line with global trends and the needs of our client base, is to fully respond to the needs of its retail and corporate clients by leveraging Citi’s global network and local footprint to offer innovative products and services. CJL is uniquely positioned to connect and serve our Japanese corporate and individual clients that are global citizens. We strive to provide seamless global financial solutions in line with our long terms strategy of being Japan’s true global bank aligned with the three global trends of globalization, urbanization and digitization. With strategic coordination across business lines and group companies, CJL aims to continually develop its business and gain increased presence in the Japan market, leveraging its unique position as a locally incorporated foreign bank.
CJL has a long and distinguished history of over 110 years in Japan. We have a proud legacy as a bank of over 200 years of focusing our energy fully on our customers, delivering new innovations and market firsts, bringing the best of the world to our local clients, providing an excellent working environment, and investing in future growth.
CJL continues to focus on a balanced growth strategy through its retail and corporate banking businesses. The retail banking business continually invests in new products, distribution and service innovations to grow its mass affluent customer base and expand its premier Citigold proposition. In addition to broadening the segments we serve and breadth and depth of products we offer, CJL continously strives to better grasp and respond to our customer’s needs as part of our broader startegy of lengthening and deepening our relationships to serve our customers better over time. The corporate
• Common Purpose One team, with one goal: serving our clients and stakeholders.
• Responsible Finance Conduct that is transparent, prudent and dependable.
• Ingenuity Enhancing our clients’ lives through innovation that harnesses the breadth and depth of our information, global network, and world-class products.
• Leadership Talented people with the best training who thrive in a diverse meritocracy that demands excellence, initiative and courage.
6
Citibank Japan Ltd. 7
banking business has a selected core group of relationships which it leverages to deliver Citi's global strengths, providing high quality financial products, services and advice to help our customers succeed. Both the retail and corporate businesses continually look to improve customer experience and operational excellence. CJL is committed to handle earnestly any consultation from Small and Medium-sized Enterprises customers related to business improvement, or those related to the amendments to the existing lending conditions, etc. In addition, CJL will continue its best efforts to fulfill corporate social responsibility to local communities. The Financial Service Agency of Japan (“FSA”) issued an administrative action against CJL on December 16, 2011. In response, CJL submitted a business improvement plan to the FSA on January 31, 2012. CJL takes this administrative action very seriously and implements the business improvement plan including all necessary measures to prevent future occurrence of the problems identified, and endeavors to sustain this improvement actions within the organization. CJL takes seriously its obligations to confront in a resolute manner any undue demands from anti-social forces that threaten social order and safety. CJL is committed to providing a working environment where its employees can thrive and achieve their full potential. The diversity of our workforce is a core value and a source of strength and pride for CJL and our clients. By attracting and training the best people, and providing them broad career development opportunities at every level, we aim to foster an environment where employees are able to provide our clients with outstanding financial products, services and advice that fit their needs over the long term. CJL is proud of its contributions to a broad range of diversity and community initiatives. Our community activities focus broadly on improving access to financial education, assisting those with disabilities, promoting environmental and social sustainability, as well as development of the communities in which we operate. In addition we also continue to enhance the opportunities available to working parents through our childcare center in our head office.
7
8 Citibank Japan Ltd.
Business Outline
Retail Banking Division
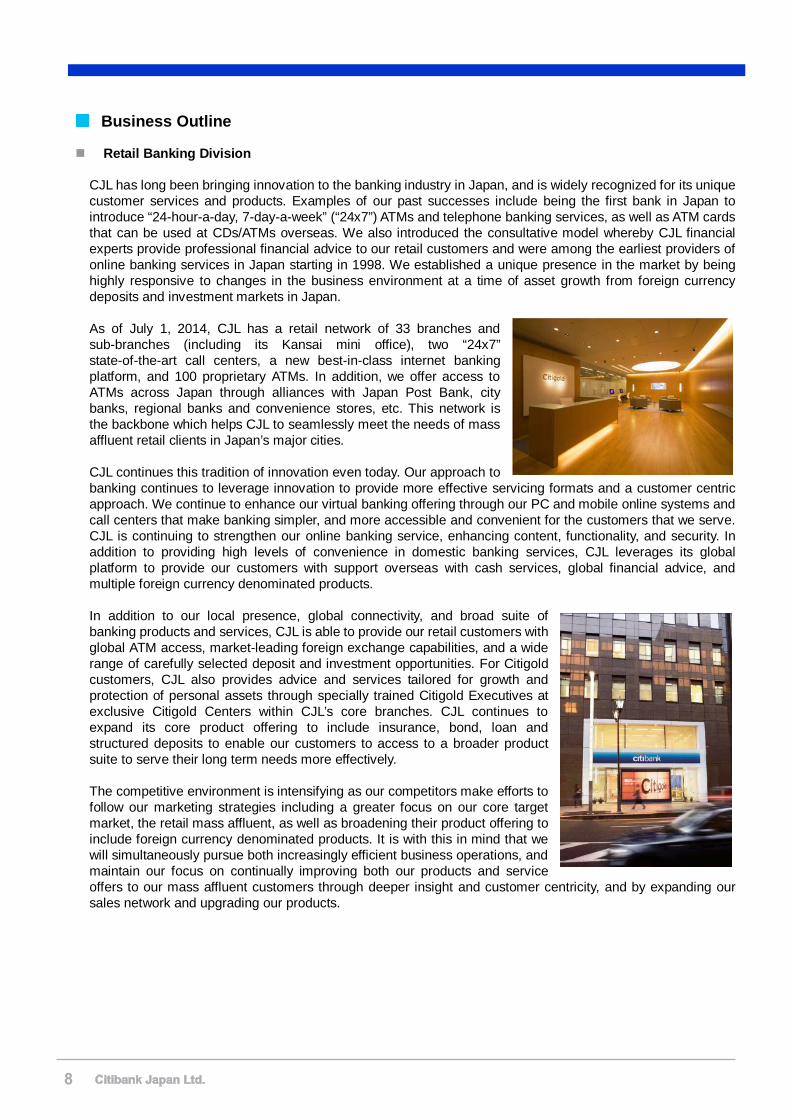
CJL has long been bringing innovation to the banking industry in Japan, and is widely recognized for its unique customer services and products. Examples of our past successes include being the first bank in Japan to introduce “24-hour-a-day, 7-day-a-week” (“24x7”) ATMs and telephone banking services, as well as ATM cards that can be used at CDs/ATMs overseas. We also introduced the consultative model whereby CJL financial experts provide professional financial advice to our retail customers and were among the earliest providers of online banking services in Japan starting in 1998. We established a unique presence in the market by being highly responsive to changes in the business environment at a time of asset growth from foreign currency deposits and investment markets in Japan. As of July 1, 2014, CJL has a retail network of 33 branches and sub-branches (including its Kansai mini office), two “24x7” state-of-the-art call centers, a new best-in-class internet banking platform, and 100 proprietary ATMs. In addition, we offer access to ATMs across Japan through alliances with Japan Post Bank, city banks, regional banks and convenience stores, etc. This network is the backbone which helps CJL to seamlessly meet the needs of mass affluent retail clients in Japan’s major cities. CJL continues this tradition of innovation even today. Our approach to banking continues to leverage innovation to provide more effective servicing formats and a customer centric approach. We continue to enhance our virtual banking offering through our PC and mobile online systems and call centers that make banking simpler, and more accessible and convenient for the customers that we serve. CJL is continuing to strengthen our online banking service, enhancing content, functionality, and security. In addition to providing high levels of convenience in domestic banking services, CJL leverages its global platform to provide our customers with support overseas with cash services, global financial advice, and multiple foreign currency denominated products. In addition to our local presence, global connectivity, and broad suite of banking products and services, CJL is able to provide our retail customers with global ATM access, market-leading foreign exchange capabilities, and a wide range of carefully selected deposit and investment opportunities. For Citigold customers, CJL also provides advice and services tailored for growth and protection of personal assets through specially trained Citigold Executives at exclusive Citigold Centers within CJL’s core branches. CJL continues to expand its core product offering to include insurance, bond, loan and structured deposits to enable our customers to access to a broader product suite to serve their long term needs more effectively. The competitive environment is intensifying as our competitors make efforts to follow our marketing strategies including a greater focus on our core target market, the retail mass affluent, as well as broadening their product offering to include foreign currency denominated products. It is with this in mind that we will simultaneously pursue both increasingly efficient business operations, and maintain our focus on continually improving both our products and service offers to our mass affluent customers through deeper insight and customer centricity, and by expanding our sales network and upgrading our products.
8
Citibank Japan Ltd. 9
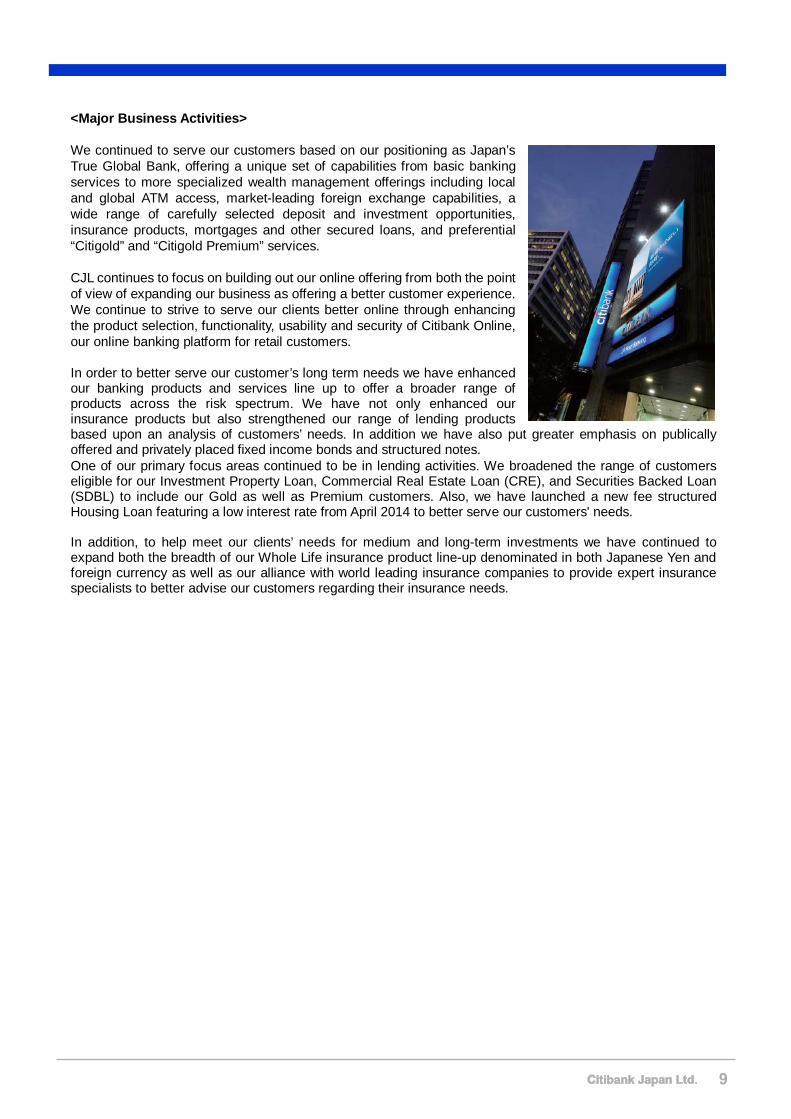
<Major Business Activities> We continued to serve our customers based on our positioning as Japan’s True Global Bank, offering a unique set of capabilities from basic banking services to more specialized wealth management offerings including local and global ATM access, market-leading foreign exchange capabilities, a wide range of carefully selected deposit and investment opportunities, insurance products, mortgages and other secured loans, and preferential “Citigold” and “Citigold Premium” services. CJL continues to focus on building out our online offering from both the point of view of expanding our business as offering a better customer experience. We continue to strive to serve our clients better online through enhancing the product selection, functionality, usability and security of Citibank Online, our online banking platform for retail customers. In order to better serve our customer’s long term needs we have enhanced our banking products and services line up to offer a broader range of products across the risk spectrum. We have not only enhanced our insurance products but also strengthened our range of lending products based upon an analysis of customers’ needs. In addition we have also put greater emphasis on publically offered and privately placed fixed income bonds and structured notes. One of our primary focus areas continued to be in lending activities. We broadened the range of customers eligible for our Investment Property Loan, Commercial Real Estate Loan (CRE), and Securities Backed Loan (SDBL) to include our Gold as well as Premium customers. Also, we have launched a new fee structured Housing Loan featuring a low interest rate from April 2014 to better serve our customers' needs. In addition, to help meet our clients’ needs for medium and long-term investments we have continued to expand both the breadth of our Whole Life insurance product line-up denominated in both Japanese Yen and foreign currency as well as our alliance with world leading insurance companies to provide expert insurance specialists to better advise our customers regarding their insurance needs.
9
10 Citibank Japan Ltd.
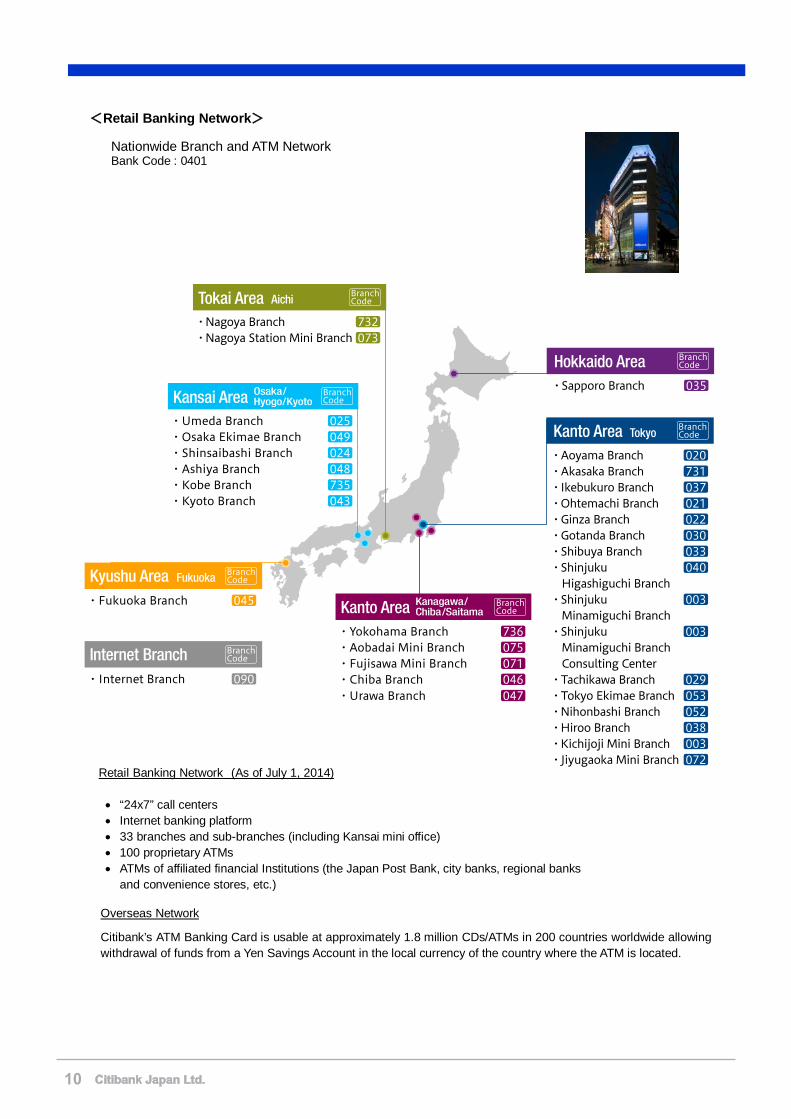
<Retail Banking Network>
Retail Banking Network (As of July 1, 2014)
• “24x7” call centers• Internet banking platform• 33 branches and sub-branches (including Kansai mini office)• 100 proprietary ATMs• ATMs of affiliated financial Institutions (the Japan Post Bank, city banks, regional banks
and convenience stores, etc.)
Overseas Network
Citibank’s ATM Banking Card is usable at approximately 1.8 million CDs/ATMs in 200 countries worldwide allowing withdrawal of funds from a Yen Savings Account in the local currency of the country where the ATM is located.
Nationwide Branch and ATM Network Bank Code : 0401
10
Citibank Japan Ltd. 11
Corporate Banking Division
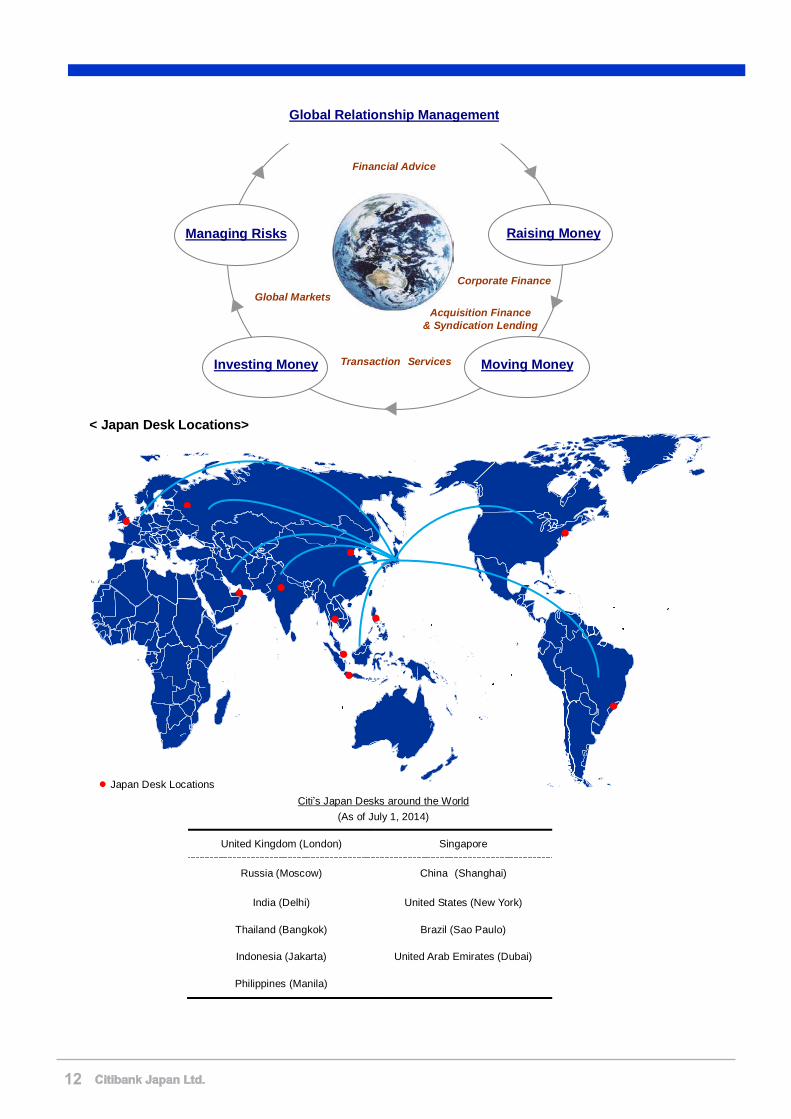
In corporate banking, CJL focuses on providing comprehensive global relationship management services to a targeted set of Japan’s largest multi-national companies and institutions. We coordinate and leverage Citi’s broad range of products and services, together with Citi’s unrivaled global network, in order to support the growth ambitions of our clients both here in Japan and around the globe. CJL’s Corporate Banking Division, located in Tokyo and Osaka, focuses on delivering innovative relationship-driven solutions for our clients’ needs related to both their day-to-day operations and their strategic business objectives. We are one of the leading finance providers in the syndicated loan market in Japan. Furthermore, CJL pioneered the structured finance market in Japan in the mid-1980’s and over the years has played a vitally important role as a market leader in providing innovative solutions to many of our clients. Corporate Banking Division has a client group consisting of relationship managers and a product group responsible for Corporate Finance product development and offering. Citibank Japan Ltd. also has product groups in Transaction Services Division and in Markets Division. The client group and product groups together provide solutions to the diversified client needs. Each client group and product group coordinates across the respective global network within Citi, which enables us to build comprehensive relationships with our clients and their affiliates both in Japan and overseas. This has been the unique and unrivaled strength of Citi. <Major Business Activities> Our client coverage model consists of 3 departments: Corporate Relationship Management Dept., Financial Institutions & Public Sector Relationship Management Dept. and Global Subsidiaries Group Relationship Management Dept. Each client coverage department is committed to serving the unique needs of their client set, by combining information and services with specialized Industry insight. By combining a deep understanding of each client’s unique needs with a view of key industry trends, we are in a position to tailor structured solutions to help our clients meet their growth ambitions. We focus on responding to our clients’ various day-to-day needs, as well as strategic business objectives by offering financing alternatives and bank capital in an effort to build and further deepen long term relationships. Corporate Banking Division works closely with 3 product groups of Citibank Japan Ltd. - Transaction Services Division (Cash Management, Trade Finance, Securities Fund Services and Export Agency Finance), Markets Division (Foreign Exchange and Risk Treasury) and Corporate Finance Department (Structured Finance, Real Estate and Acquisition Finance & Syndicated Lending) - to serve our clients and provide solutions that meet their needs. We have further strengthened our capability to support our Japanese clients around the globe through “Japan Desks” offering exclusive relationship management efforts by experienced bankers. We are located in 11 countries. Many of these Japan Desks provide coverage to neighboring countries and jurisdictions. Our client support structure has become increasingly more available pan-regionally around the globe, covering North and South America, Europe, Middle East, Africa, and Asia. Citi’s Japan Desk Network is an unrivaled and unique service to our clients. Our bankers at Japan Desks leverage their vast experiences in Japan, continue to build and further deepen great relationships with our clients and colleagues around the globe, and support our clients to meet their financial needs.
11
12 Citibank Japan Ltd.
< Japan Desk Locations>
United Kingdom (London) Singapore
Russia (Moscow) China (Shanghai)
India (Delhi) United States (New York)
Thailand (Bangkok) Brazil (Sao Paulo)
Indonesia (Jakarta) United Arab Emirates (Dubai)
Philippines (Manila)
●
●
●
●
●
●
●
●
● Japan Desk Locations
●
●
●
Global Markets
Financial Advice
Acquisition Finance & Syndication Lending
Transaction Services
Managing Risks
Global Relationship Management
Investing Money Moving Money
Raising Money
Corporate Finance
Citi’s Japan Desks around the World (As of July 1, 2014)
12
Citibank Japan Ltd. 13
Transaction Services Division
Transaction Services Division provides various services in the Treasury and Trade Solutions (TTS) and Securities Services (SS) businesses. Our services integrate cash management, trade finance, and securities services to multinational corporations, financial institutions and public sector clients in Japan and around the world.
Transaction Services is closely aligned with three important on-going trends - globalization, urbanization and digitization – and as the business world continues to get smaller and our clients continue to expand globally, we have been stepping up support to assist our Japanese and other global clients expand. Capability Leveraging the industry's largest proprietary network, we serve both the local and cross-border interests of clients. As Japanese companies continue the process of rapid globalization, Citi is positioned to be their partner and Global Bank. CJL Transaction Services is part of Citi’s global network servicing clients in over 100 countries and top cities in the world. Experience Transaction Services is part of Citi’s legacy in Japan which dates back over 110 years to when we opened our first Japanese branch. We strive to be a trusted advisor on industry issues such as local securities markets, emerging markets, settlement risk, receivables and payment processes, securities infrastructure and technology integration to our clients, regulatory organizations and third-party partners. Innovation Our on-line portal, CitiDirect BE and its mobile/Tablet version are examples of Citi’s investments in innovation that add to our offering of solutions in Japan. We introduced a Japanese language version of our mobile smart phone application and launched Tablet version in 2013. We also provide our clients in Japan with Treasury analytics and technology tools to enhance their efforts to effectively manage their businesses.
< Major Business Activities >
Treasury and Trade Solutions Citi serves our clients in as an industry leader in cash management solutions. With 232 connections to Cash clearing systems across the globe, Citi has a global infrastructure providing a wide range of innovative financial solutions. Our extensive network of qualified banking professionals provides a combination of local knowledge and global expertise to help meet clients’ strategic business goals. Citi's portfolio of global cash management products offers tailored solutions to help manage collection and payment processes by establishing interfaces between the client’s treasury system and Citi's payment systems. Trade Finance and Services Unit provides web-based, simple and quick supplier financing for not only domestic purchases but also cross-border international trade transactions. Various risk-hedge solutions are provided to clients’ exports to help them effectively manage their risk and supply chains. In addition to traditional financial support for exports and investments from Japan, our Export and Agency Finance Unit has started to provide new services such as medium-long term loans for overseas Japanese subsidiaries’ exporting and agricultural commodities imported by our clients in Japan. Securities Services In Securities Services, CJL supports foreign investors’ investment in Japanese securities through our stable capabilities in custody services. In addition to such traditional services, the introduction of innovative Third Party Clearing offerings allow our resident intermediary clients to focus on what matters most, to grow core businesses through our clearing and settlement outsourcing solutions. Our proprietary network is the largest in the industry covering 61 markets surpassing our closest competitor by over 20 markets.
13
14 Citibank Japan Ltd.
2013 Japan Awards Best Overall Internet Bank - Global Winner by Global Finance, World’s Best Internet Banks 2013 Best Corporate / Institutional Internet Bank – Global Winner by Global Finance, World’s Best Internet Banks
2013 Best Overall Trade Finance Bank in Asia Pacific – Trade Finance 2013 Trade Finance Deal of the Year for NEXI untied loan to Vinacomin – Trade Finance 2013 Top Rated in Japan for Leading Clients Category and Cross-Border/Non-Affiliate Category in Global
Custodian’s Agent Banks in Major Markets Survey 2013 Best Subcustodian in Japan for The Asset’s Triple A Asset Servicing Awards 2013
14
Citibank Japan Ltd. 15
Markets Division
The Markets Division is a division, established in July 2013, with a mission to provide foreign exchange, money market and derivative products and services to the customers of the Corporate Banking Division and the Transaction Services Division. Prior to its establishment, these services were provided by the Markets Department in the Corporate Banking Division and the Treasury Division. An independent division was established to focus on market trades and aim to build a more robust transaction base for customers by providing more valuable information. The Markets Division consists of two departments, Market Sales and Risk Treasury. The Market Sales Department consists of two units, Corporate FX Sales Unit and Corporate Derivative Sales Unit, and conducts foreign exchange and derivative transactions for the customers of the Corporate Banking Division and the Transaction Services Division. The Corporate FX Sales unit leverages Citigroup’s international network and global resources to deliver real-time information to the customers. The unit also provides various types of risk-management related advice and foreign exchange transaction support, building on its well-established and powerful presence as a “market maker” in the foreign exchange market. The Corporate Derivative Sales unit offers a wide range of derivative solutions to the customers, in order to satisfy their diverse needs. The Risk Treasury Department leverages Citigroup’s extensive international network to provide money market transactions in various currencies, in order to meet the customers’ funding and investment needs. Risk Treasury also acts as a funding department in CJL. Based on the policy decisions of the Asset Liability Committee, a sub-committee of CJL’s Management Committee, Risk Treasury ensures appropriate liquidity management and conducts Banking account management as part of the comprehensive risk management framework, in coordination with the Corporate Treasury Division, which is responsible for liquidity risk management.
15
16 Citibank Japan Ltd.
List of CJL’s Major Activities
CJL provides the following services:
1. Acceptance of Deposits Current deposit, savings deposit, time deposit, negotiable certificate of deposit, foreign currency deposit, etc.
2. Fund Lending etc.
Loan on bills, loan on deeds, overdraft, discount of commercial bills, etc. 3. Fund Transfer, etc.
Outward/inward remittance, fund transfer and collection of payment 4. Foreign Exchange, etc.
Foreign exchange transactions (including foreign currency sales and purchase) 5. Others
(1) Guaranty of liabilities (acceptance of payments), issuance of letter of credit and acceptance of bills
(2) Arrangement for syndicated loan (3) Trade finance (purchase of trade notes, etc.) (4) Investment / Trading in securities (Japanese government bonds, etc.) (5) Acquisition or transfer of monetary claims, and securitization related services (6) Handling of receipt of money and other affairs pertaining to money of Government of Japan, local
public authorities, and companies, etc. (7) Dealing in financial derivatives (interest rate, currency, etc.) (8) Over-the-counter sales of mutual funds and insurance products (9) Safekeeping and transfer of securities, etc. (10) Brokerage for clearing of securities, etc. (11) Handling of private placement of securities (12) Financial instruments intermediary service (13) Money exchange (14) Foreign Bank Agency Service (15) Transaction service for electronically recorded monetary claims
16
Citibank Japan Ltd. 17
Risk Management Framework
Risk Management Structure CJL’s risk management framework balances strong corporate oversight by the Board of Directors with well defined oversight roles and responsibilities amongst the Control functions covering the various risk types. CJL has the following three layers of risk management or control:
1) Risk ownership by the business divisions 2) Oversight by the control functions 3) Independent Assessment by Internal Audit
All three layers of control work together to achieve CJL’s shared goals with the following particular items:
• To maintain a highly effective control environment and to establish efficient, proactive risk management; and
• To foster appropriate solutions for our customers and to facilitate business growth in accordance with agreed strategic goals and with the risk management capacity of CJL
CJL establishes a fundamental principle “Comprehensive Risk Management Policy” which is approved by Board of Directors and it defines its risk management structure. Additionally, CJL establishes “Comprehensive Risk Management Rules” to define its risk management procedures. CJL adopts a comprehensive risk management approach and a Comprehensive Risk Manager who oversees risks will ensure that Management Committee and the Board of Directors are kept advised of the risks of and to CJL in a comprehensive management.
Type of risk to be managed CJL identifies credit risk, market risk, liquidity risk, and operational risk as major risks and those are subjected to manage.
• Credit Risk
1. Structure of Credit Risk Management: Credit risk is the risk of loss arising from decline in asset value attributable to deterioration of obligor’s credit condition. It includes the risk of difficulty to collect principal and interest due to default of obligor and decline in credit value due to increase of reserves arising from deterioration of obligor’s credit condition. CJL establishes “Credit Risk Management Policies” which defines the fundamental principle to comprehensively manage its credit risk in Corporate Banking Division and Retail Banking Division. In terms of credit management in each division, CJL also follows “Institutional Client Group Risk Management Manual”, “Global Consumer Credit and Fraud Risk Policies” and “Global Commercial Credit Policies” in order to set and govern credit risk management structure. Furthermore, Credit Risk Management Committee (“CRMC”) is established and managed by Head of the Risk Management Division to oversee CJL’s credit risk including the management of self-assessment of assets with further involvement of management.
2. Procedure of Credit Risk Management: CJL manages credit risk based on obligor analysis and whole portfolio analysis, monitoring concentration of credit to certain industries, ratings, obligors on relationship basis and delinquency trend of a portfolio. Such portfolio view of our credit exposures is reviewed and reported to the Credit Risk Management Committee in a timely manner.
17
18 Citibank Japan Ltd.
• Market Risk / Liquidity Risk
1. Structure of Market Risk / Liquidity Risk Management: Market risk is the risk of loss resulting from fluctuating value of financial asset and debt position which CJL possesses or executes, reflecting market trend. Liquidity risk is the risk of loss resulting from unavailability to secure sufficient asset liquidity against debt due to rising financing costs or mismatch of use of funds and source of funds. In CJL, market risk and liquidity risk management structures are established and operated in accordance with the “Liquidity Risk Management Policy”, the “Market Risk Management Policy” or related management policies. Furthermore, CJL has established Asset Liability Committee (“ALCO”) which is chaired by President and Head of the Corporate Treasury Division to oversee market risk and liquidity risk, monitoring accrual portfolio and trading portfolio of CJL and managing balance sheet as well as capital adequacy.
2. Procedure of Market / Liquidity Risk Management:
CJL Market Risk Management captures consolidated profiles of interest rates and durations of the financial assets and liabilities, performs risk monitoring process using gap analysis and interest rate factor sensitivity analysis, and reports the result to the ALCO meeting on a monthly basis. CJL’s market risk amount is measured by Value-at-Risk (“VaR”) method quantitatively and its regulated compliance status is monitored. ALCO is managing Liquidity Risk by monitoring various liquidity ratios such as Large Fund Provider concentration ratio, Total Customer Deposits / Total Customer Loans ratio. ALCO is also monitoring whether there is sufficient liquidity to meet all maturing obligations within 12 months under the Highly Stressed Market Disruption stress scenario.
• Operational Risk
1. Structure of Operational Risk Management: Operational risk is the risk of loss resulting from inadequate or failed internal processes, systems, or human factors, or from external events. It includes reputation and franchise risks associated with CJL’s business practices or market conduct. It also includes the risk of failing to comply with laws, regulations, ethical standards, regulatory administrative actions or Citigroup policies. To comprehensively manage operational risk, CJL establishes policies and rules for operational risk which clearly defines risks, the control environment, as well as assessment and reporting procedures. CJL separately manages its Jimu risk and System risk in accordance with the established policies and standards. Moreover, CJL has established Enterprise Risk Management Unit under Risk Management Division as a responsible unit for comprehensive operational risk management. The status update of operational risk management is reported to Business Risk, Compliance & Control Committee (“BRCC”), and Jimu risk and System risk are reported to System and Operations Committee (“SOC”), with further involvement of management.
2. Procedure of Operational Risk Management: CJL adopts a Manager’s Control Assessment (“MCA”) program as a tool to manage ‘significant’ operational risks. The MCA is used to self-assess key operational risks and controls and identify and address weaknesses in the design and/or effectiveness of internal controls that mitigate significant operational risks. Corrective actions are monitored continuously for full implementation. Results of MCA are reported managements through BRCC at quarter end. Critical operational processes of each business department are reviewed periodically in consideration of changes to the operational processes and regulatory environment, and latest information shall be reflected into MCA
18
Citibank Japan Ltd. 19
Compliance Framework
Basic Policy
As a bank, CJL fully recognizes the importance of its social responsibilities and the public nature of its business. We understand that conducting business with fairness and integrity based on the Code of Conduct and in compliance with laws and regulations, etc. is the basic principle of our management.
Compliance Management Framework
CJL’s Compliance Division covers compliance related matters and is independent from businesses. The Division consists of 5 units under the Head of Compliance Division; (i) Retail Banking Compliance Unit, (ii) Corporate Banking Compliance Unit, (iii) Anti-Money Laundering Compliance Unit, (iv) Infrastructure Unit and (v) Compliance Testing Unit. The first two units are responsible for compliance matters relevant to businesses, AML Compliance Unit covers matters relevant to anti-social forces and the prevention of money laundering, and Infrastructure Unit is responsible for matters relevant to overall banking operations. Compliance Testing Unit has responsibility for testing to assure that controls over compliance matters are reasonably designed and functioning effectively. The Compliance Division owns the Code of Conduct and, in accordance with Compliance Policy, promotes compliance and cultivates a compliance mindset, through following activities.
The Compliance Division reports compliance related issues and compliance status to the Business Risk, Compliance and Control Committee and the Management Committee on a regular and ad-hoc basis. Material issues are to be escalated to the Board of Director through the Management Committee.
Preventive Measures against Anti-Social Forces and Money Laundering
CJL considers that preventive measures against anti-social forces and money laundering are one of the most important parts of legal compliance as a financial institution with public nature, and has continued its efforts to establish a proper prevention framework.
Measures against the Breach of Legal Compliance
It is the responsibility of each of the directors and the employees to comply with the Code of Conduct that provides an overview of some of the key policies of which all need to be aware. We strongly encourage employees to raise concerns or questions regarding ethics and applicable laws, regulations and policies, and to report violations and suspected violations in accordance with the relevant internal policies. We believe that it is critical to identify issues at an early stage and proactively resolve those issues in order to maintain the highest standards of conduct required at a financial institution. CJL has established, in addition to the standard reporting procedures, an Ethics Hotline in order to properly take measures for a violation or a suspected violation of legal compliance.
• Advice and support related to Compliance • Creation and execution of internal rules related to Compliance • Oversees the development and maintenance of adequate risk management systems related to
Compliance • Education and training related to Compliance • Monitors legal and regulatory development that affect the Bank • Oversees the development and maintenance of adequate risk management systems related to
Anti-Money Laundering activities, including customer identification and matters related to Anti Social Forces
• Conducts Compliance Testing
19
20 Citibank Japan Ltd.
Environment
CJL believes that working to promote environmental and social sustainability is a good business practice. Under the banner of “Green Citi”, we are committed to protect the environment through the following initiatives: <Major Activities>
- The Equator Principles - The Carbon Principle (Citi was a drafting member and has adopted these principles) - Achieved LEED (Leadership in Energy and Environmental
Design) Certification Received Silver certification: Citibank Tokyo Call Center
(June 2009) Received Gold certification ・Aoyama Branch (May 2010) ・Nihonbashi Branch and Tokyo Ekimae Branch (July 2011) ・Nagoya Branch (October 2011) ・Shinjuku Higashiguchi Branch and Kobe Branch (April 2012) ・Ikebukuro branch (July 2012), Shinjuku Minamiguchi Branch (Sep. 2012)
- Office Initiatives Energy and Resource Savings Paperless processes Recycling in the office
Diversity and CSR Activities
CJL pursues Corporate Social Responsibility (“CSR”) activities in alignment with Citi’s global policies and priorities. We embrace the responsibility, as a socially responsible financial group, to make a difference in the community and to promote environmental and social sustainability by building positive relationships with customers, employees and their families, the community, and stakeholders. Through our CSR activities, we respond to corporate governance and compliance initiatives and also reinforce our commitment to Financial Education, Community Development, the Environment, and Diversity with employees from various backgrounds and nationalities.
Diversity
CJL values and promotes Diversity as a strategic activity. By respecting and accepting various values, ways of thinking and attributes such as nationality, age, gender, sexual orientation, language and religion, we create an environment where differences are respected. Creating an environment where Diversity thrives, actively encourages a wide range of thoughts and ideas in support of our business goals. We encourage our employees to participate and take responsibility for their engagement in Diversity activities, internally and externally which adds to the richness of the society in which we live. <Major Activities>
- Improving career development for women; Celebrating women’s success , International Women’s day 2014
- Work-Life Balance - Encourage the hiring of people with
disabilities
Community Development
CJL strives to make a difference where our employees live and work. We encourage and provide support for philanthropic activities undertaken by our employees and their families, leading many of them to participate actively in the community. <Major Activities>
- Support for the disaster-impacted areas: Volunteer activities by the employees and family, Relief Donations by the employees and the customers, Grants to NPO’s actively engaged in the disaster-impacted areas.
- United Nations World Food Program (WFP) School Feeding Initiatives through Cafeteria Charity Program "Share Your Lunch"
- FIT (Financial Industry in Tokyo) for Charity Run - YMCA Charity Run - Citi Volunteer Program - Global Community Day - Supporting NPOs and NGOs
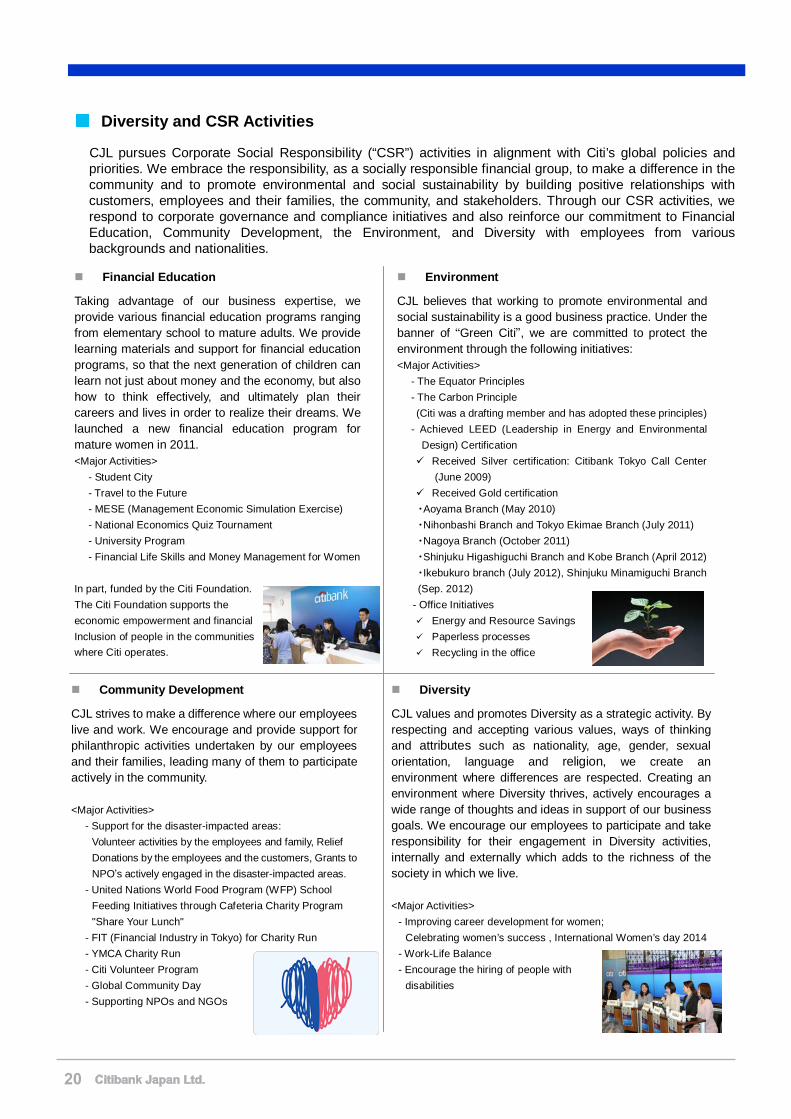
Financial Education
Taking advantage of our business expertise, we provide various financial education programs ranging from elementary school to mature adults. We provide learning materials and support for financial education programs, so that the next generation of children can learn not just about money and the economy, but also how to think effectively, and ultimately plan their careers and lives in order to realize their dreams. We launched a new financial education program for mature women in 2011. <Major Activities>
- Student City - Travel to the Future - MESE (Management Economic Simulation Exercise) - National Economics Quiz Tournament - University Program - Financial Life Skills and Money Management for Women
In part, funded by the Citi Foundation. The Citi Foundation supports the economic empowerment and financial Inclusion of people in the communities where Citi operates.
20
Citibank Japan Ltd.
Financial Information under Japanese GAAP For the fiscal year ended March 31, 2014
21
1. Matters Related to Principal Business
< Business Overview>
Results of Operations for Fiscal Year ended March 31, 2014
We had a net income of 1.3 billion yen for the year ended March 31, 2014 compared to net loss of 1.9 billion yen for the prior fiscal year.
Ordinary income totaled 68.3 billion yen, up by 3.6 billion yen from the prior fiscal year.
Interest income totaled 30.3 billion yen, down by 4.3 billion yen from the prior fiscal year. Fees and commissions totaled 21.5 billion yen, up by 6.4 billion yen from the prior fiscal year. Other ordinary income totaled 15.2 billion yen, up by 2.2 billion yen from the prior fiscal year.
Ordinary expenses totaled 65.4 billion yen, down by 0.7 billion yen from the prior fiscal year.
Interest expense totaled 3.5 billion yen, down by 1.1 billion yen from the prior fiscal year. Trading losses was 0.4 billion yen compared to trading income of 0.8 billion yen in the prior fiscal
year. General and administrative expenses totaled 58.6 billion yen, down by 0.4 billion yen from the prior
fiscal year. Ordinary profit was 2.8 billion yen compared to ordinary loss of 1.5 billion yen in the prior fiscal year.
Income before income taxes (including extraordinary income and loss) was 2.8 billion yen compared
to loss before income taxes of 2.0 billion yen in the prior fiscal year.
Assets, liabilities, net assets, cash flows, and capital adequacy ratio were as follows;
As of March 31, 2014, total assets were 4,513.9 billion yen, up by 139.3 billion yen compared to March 31, 2013.
Cash and deposits to other banks (due from banks) totaled 1,841.8 billion yen, up by 112.6 billion
yen from the prior fiscal year end. Call loans were 240.2 billion yen, up by 68.1 billion yen from the prior fiscal year end. Receivables under resale agreements were 731.6 billion yen, up by 42.8 billion yen from the prior
fiscal year end. Trading assets were 181.4 billion yen, up by 45.9 billion yen from the prior fiscal year end. Available for sales securities (“AFS securities”) were 785.2 billion yen, down by 73.4 billion yen
from the prior fiscal year end. Loans and bills discounted totaled 356.2 billion yen, up by 25.6 billion yen from the prior fiscal year
end.
As of March 31, 2014, total liabilities were 4,257.5 billion yen, up by 145.8 billion yen compared to March 31, 2013.
Deposits totaled 3,636.0 billion yen, up by 94.5 billion yen from the prior fiscal year end. Negotiable certificates of deposit totaled 6.0 billion yen, down by 29.0 billion yen from the prior
fiscal year end. Foreign exchanges totaled 346.2 billion yen, up by 240.0 billion yen from the prior fiscal year end.
22

As of March 31, 2014, total net assets were 256.3 billion yen, down by 6.4 billion yen from the prior fiscal year end. Among net assets, retained earnings decreased 5.0 billion yen to 7.3 billion yen, due to 6.4 billion yen payment as interim dividend.
Cash flows from operating activities in the year totaled 678.7 billion yen (Inflow). Cash from investing
activities was 68.1 billion yen (Inflow). Cash from financing activities was 6.4 billion yen (Outflow). As a result, cash and cash equivalents as of the end of the period totaled 1,280.4 billion yen.
The capital adequacy ratio (Basel3 National standards) at the end of the period was 25.72%. (Basel2
National standards as of March 31, 2013 28.47%).
23
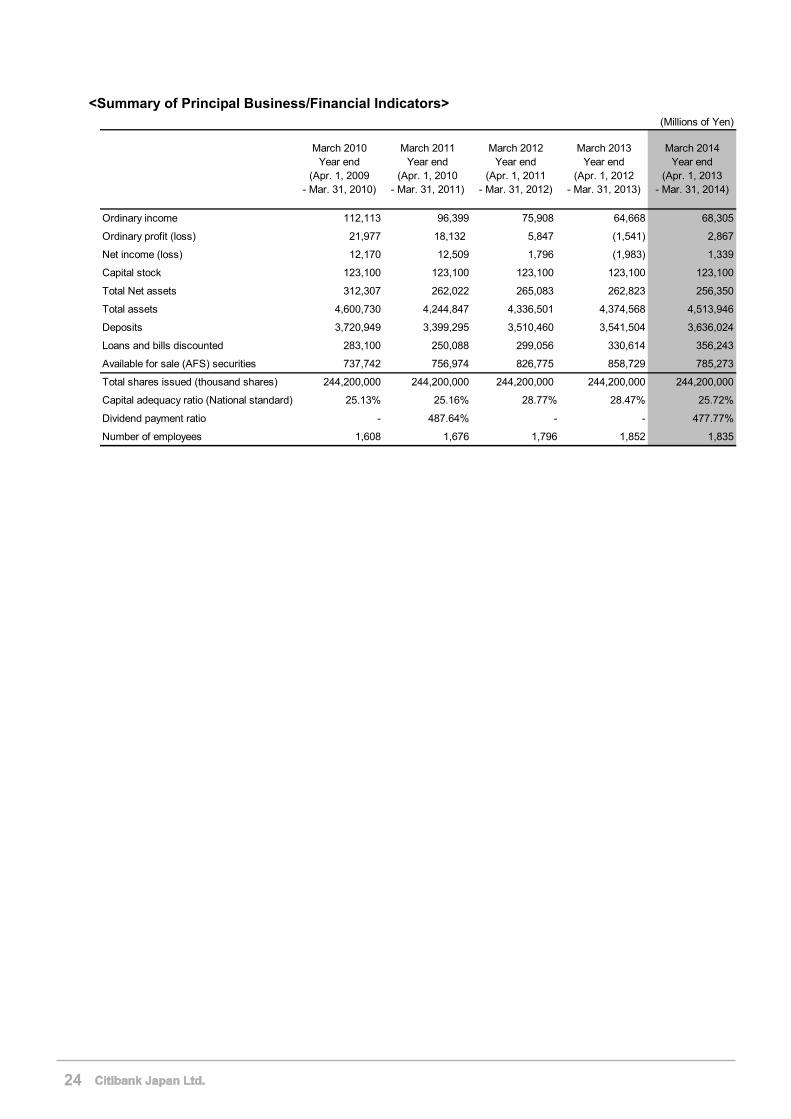
<Summary of Principal Business/Financial Indicators> (Millions of Yen)
Ordinary income 112,113 96,399 75,908 64,668 68,305
Ordinary profit (loss) 21,977 18,132 5,847 (1,541) 2,867
Net income (loss) 12,170 12,509 1,796 (1,983) 1,339
Capital stock 123,100 123,100 123,100 123,100 123,100
Total Net assets 312,307 262,022 265,083 262,823 256,350
Total assets 4,600,730 4,244,847 4,336,501 4,374,568 4,513,946
Deposits 3,720,949 3,399,295 3,510,460 3,541,504 3,636,024
Loans and bills discounted 283,100 250,088 299,056 330,614 356,243
Available for sale (AFS) securities 737,742 756,974 826,775 858,729 785,273
Total shares issued (thousand shares) 244,200,000 244,200,000 244,200,000 244,200,000 244,200,000
Capital adequacy ratio (National standard) 25.13% 25.16% 28.77% 28.47% 25.72%
Dividend payment ratio - 487.64% - - 477.77%
Number of employees 1,608 1,676 1,796 1,852 1,835
March 2014Year end
(Apr. 1, 2013- Mar. 31, 2014)
March 2010Year end
(Apr. 1, 2009- Mar. 31, 2010)
March 2011Year end
(Apr. 1, 2010- Mar. 31, 2011)
March 2012Year end
(Apr. 1, 2011- Mar. 31, 2012)
March 2013Year end
(Apr. 1, 2012- Mar. 31, 2013)
24
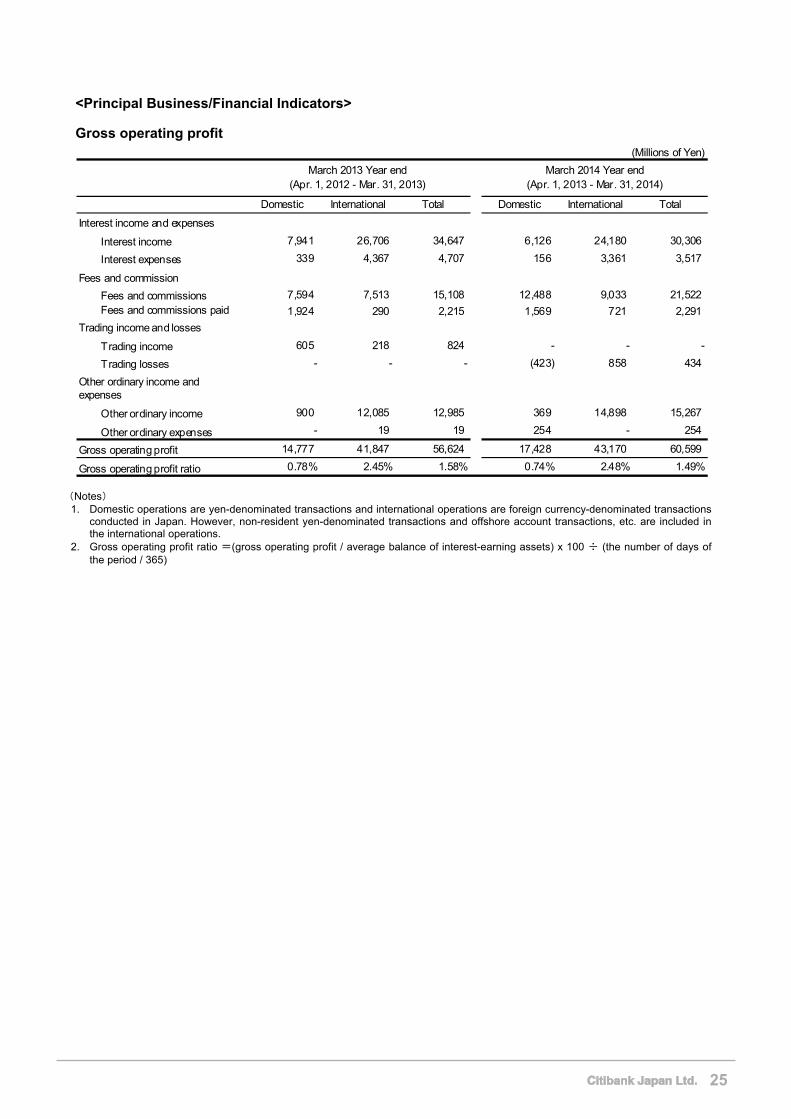
<Principal Business/Financial Indicators> Gross operating profit
(Millions of Yen)
Domestic International Total Domestic International Total
Interest income 7,941 26,706 34,647 6,126 24,180 30,306
Interest expenses 339 4,367 4,707 156 3,361 3,517
Fees and commissions 7,594 7,513 15,108 12,488 9,033 21,522
Fees and commissions paid 1,924 290 2,215 1,569 721 2,291
Trading income 605 218 824 - - -
Trading losses - - - (423) 858 434
Other ordinary income 900 12,085 12,985 369 14,898 15,267
Other ordinary expenses - 19 19 254 - 254
14,777 41,847 56,624 17,428 43,170 60,599
0.78% 2.45% 1.58% 0.74% 2.48% 1.49%
Gross operating profit
Gross operating profit ratio
March 2013 Year end(Apr. 1, 2012 - Mar. 31, 2013)
March 2014 Year end(Apr. 1, 2013 - Mar. 31, 2014)
Interest income and expenses
Fees and commission
Trading income and losses
Other ordinary income andexpenses
(Notes) 1. Domestic operations are yen-denominated transactions and international operations are foreign currency-denominated transactions
conducted in Japan. However, non-resident yen-denominated transactions and offshore account transactions, etc. are included in the international operations.
2. Gross operating profit ratio =(gross operating profit / average balance of interest-earning assets) x 100 ÷ (the number of days of the period / 365)
25
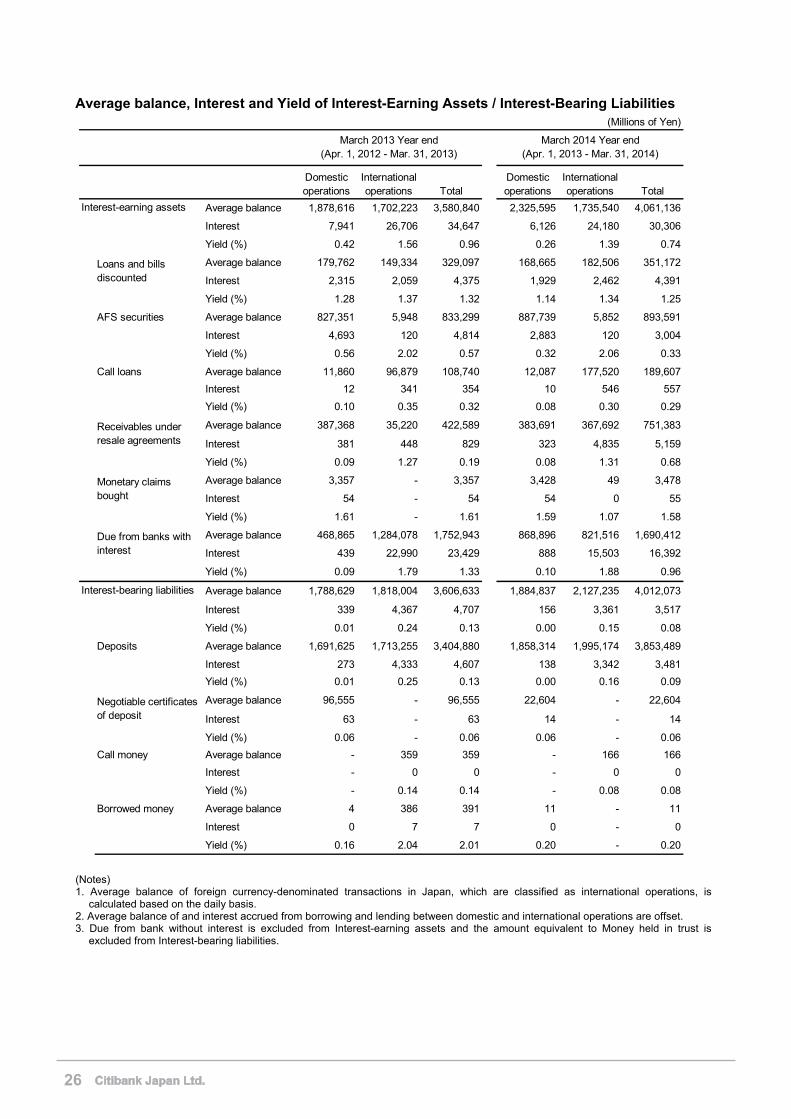
Average balance, Interest and Yield of Interest-Earning Assets / Interest-Bearing Liabilities (Millions of Yen)
Domesticoperations
Internationaloperations Total
Domesticoperations
Internationaloperations Total
Average balance 1,878,616 1,702,223 3,580,840 2,325,595 1,735,540 4,061,136
Interest 7,941 26,706 34,647 6,126 24,180 30,306
Yield (%) 0.42 1.56 0.96 0.26 1.39 0.74
Average balance 179,762 149,334 329,097 168,665 182,506 351,172
Interest 2,315 2,059 4,375 1,929 2,462 4,391
Yield (%) 1.28 1.37 1.32 1.14 1.34 1.25
AFS securities Average balance 827,351 5,948 833,299 887,739 5,852 893,591
Interest 4,693 120 4,814 2,883 120 3,004
Yield (%) 0.56 2.02 0.57 0.32 2.06 0.33
Call loans Average balance 11,860 96,879 108,740 12,087 177,520 189,607
Interest 12 341 354 10 546 557
Yield (%) 0.10 0.35 0.32 0.08 0.30 0.29
Average balance 387,368 35,220 422,589 383,691 367,692 751,383
Interest 381 448 829 323 4,835 5,159
Yield (%) 0.09 1.27 0.19 0.08 1.31 0.68
Average balance 3,357 - 3,357 3,428 49 3,478
Interest 54 - 54 54 0 55
Yield (%) 1.61 - 1.61 1.59 1.07 1.58
Average balance 468,865 1,284,078 1,752,943 868,896 821,516 1,690,412
Interest 439 22,990 23,429 888 15,503 16,392
Yield (%) 0.09 1.79 1.33 0.10 1.88 0.96
Average balance 1,788,629 1,818,004 3,606,633 1,884,837 2,127,235 4,012,073
Interest 339 4,367 4,707 156 3,361 3,517
Yield (%) 0.01 0.24 0.13 0.00 0.15 0.08
Deposits Average balance 1,691,625 1,713,255 3,404,880 1,858,314 1,995,174 3,853,489
Interest 273 4,333 4,607 138 3,342 3,481
Yield (%) 0.01 0.25 0.13 0.00 0.16 0.09
Average balance 96,555 - 96,555 22,604 - 22,604
Interest 63 - 63 14 - 14
Yield (%) 0.06 - 0.06 0.06 - 0.06
Call money Average balance - 359 359 - 166 166
Interest - 0 0 - 0 0
Yield (%) - 0.14 0.14 - 0.08 0.08
Borrowed money Average balance 4 386 391 11 - 11
Interest 0 7 7 0 - 0
Yield (%) 0.16 2.04 2.01 0.20 - 0.20
Negotiable certificatesof deposit
Loans and billsdiscounted
March 2013 Year end(Apr. 1, 2012 - Mar. 31, 2013)
March 2014 Year end(Apr. 1, 2013 - Mar. 31, 2014)
Interest-earning assets
Interest-bearing liabilities
Due from banks withinterest
Monetary claimsbought
Receivables underresale agreements
(Notes) 1. Average balance of foreign currency-denominated transactions in Japan, which are classified as international operations, is
calculated based on the daily basis. 2. Average balance of and interest accrued from borrowing and lending between domestic and international operations are offset. 3. Due from bank without interest is excluded from Interest-earning assets and the amount equivalent to Money held in trust is
excluded from Interest-bearing liabilities.
26
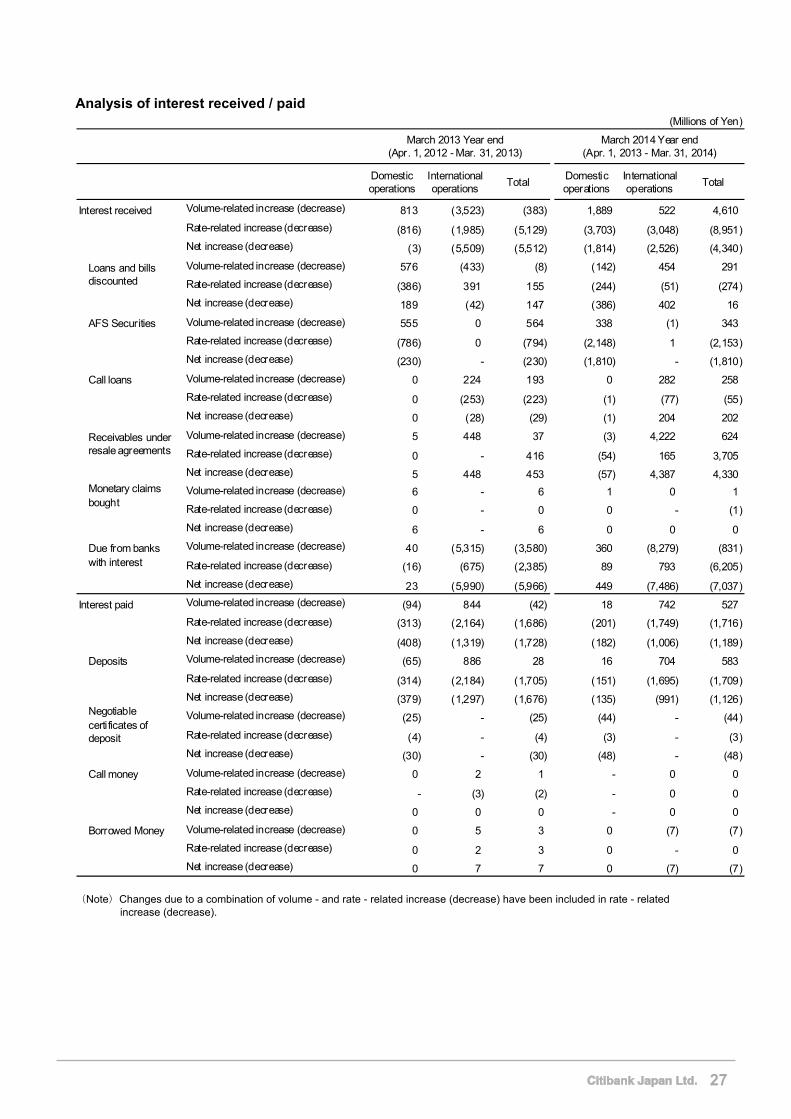
Analysis of interest received / paid (Millions of Yen)
Domesticoperations
Internationaloperations
TotalDomesticoperations
Internationaloperations
Total
Volume-related increase (decrease) 813 (3,523) (383) 1,889 522 4,610
Rate-related increase (decrease) (816) (1,985) (5,129) (3,703) (3,048) (8,951)
Net increase (decrease) (3) (5,509) (5,512) (1,814) (2,526) (4,340)
Volume-related increase (decrease) 576 (433) (8) (142) 454 291
Rate-related increase (decrease) (386) 391 155 (244) (51) (274)
Net increase (decrease) 189 (42) 147 (386) 402 16
AFS Securities Volume-related increase (decrease) 555 0 564 338 (1) 343
Rate-related increase (decrease) (786) 0 (794) (2,148) 1 (2,153)
Net increase (decrease) (230) - (230) (1,810) - (1,810)
Call loans Volume-related increase (decrease) 0 224 193 0 282 258
Rate-related increase (decrease) 0 (253) (223) (1) (77) (55)
Net increase (decrease) 0 (28) (29) (1) 204 202
Volume-related increase (decrease) 5 448 37 (3) 4,222 624
Rate-related increase (decrease) 0 - 416 (54) 165 3,705
Net increase (decrease) 5 448 453 (57) 4,387 4,330
Volume-related increase (decrease) 6 - 6 1 0 1
Rate-related increase (decrease) 0 - 0 0 - (1)
Net increase (decrease) 6 - 6 0 0 0
Volume-related increase (decrease) 40 (5,315) (3,580) 360 (8,279) (831)
Rate-related increase (decrease) (16) (675) (2,385) 89 793 (6,205)
Net increase (decrease) 23 (5,990) (5,966) 449 (7,486) (7,037)
Volume-related increase (decrease) (94) 844 (42) 18 742 527
Rate-related increase (decrease) (313) (2,164) (1,686) (201) (1,749) (1,716)
Net increase (decrease) (408) (1,319) (1,728) (182) (1,006) (1,189)
Deposits Volume-related increase (decrease) (65) 886 28 16 704 583
Rate-related increase (decrease) (314) (2,184) (1,705) (151) (1,695) (1,709)
Net increase (decrease) (379) (1,297) (1,676) (135) (991) (1,126)
Volume-related increase (decrease) (25) - (25) (44) - (44)
Rate-related increase (decrease) (4) - (4) (3) - (3)
Net increase (decrease) (30) - (30) (48) - (48)
Call money Volume-related increase (decrease) 0 2 1 - 0 0
Rate-related increase (decrease) - (3) (2) - 0 0
Net increase (decrease) 0 0 0 - 0 0
Borrowed Money Volume-related increase (decrease) 0 5 3 0 (7) (7)
Rate-related increase (decrease) 0 2 3 0 - 0
Net increase (decrease) 0 7 7 0 (7) (7)
March 2014 Year end(Apr. 1, 2013 - Mar. 31, 2014)
Negotiablecertificates ofdeposit
March 2013 Year end(Apr. 1, 2012 - Mar. 31, 2013)
Interest received
Interest paid
Loans and billsdiscounted
Receivables underresale agreements
Due from bankswith interest
Monetary claimsbought
(Note)Changes due to a combination of volume - and rate - related increase (decrease) have been included in rate - related
increase (decrease).
27
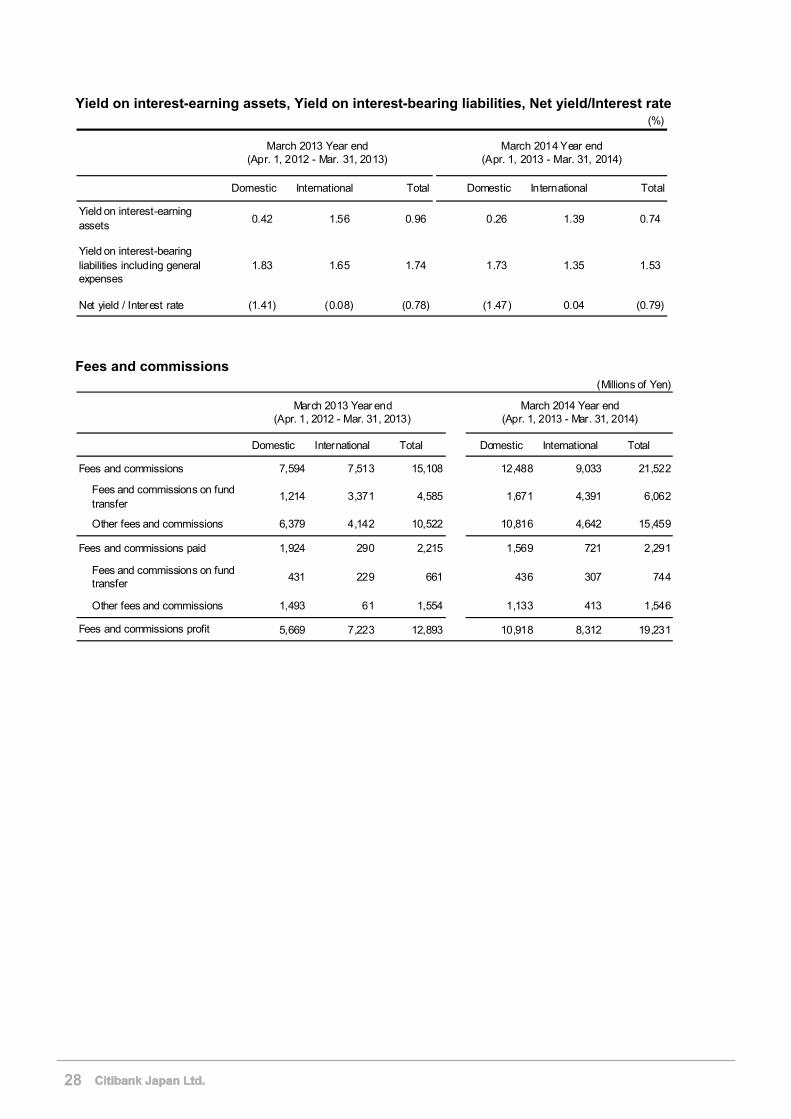
Yield on interest-earning assets, Yield on interest-bearing liabilities, Net yield/Interest rate (%)
Domestic International Total Domestic International Total
Yield on interest-earningassets
0.42 1.56 0.96 0.26 1.39 0.74
Yield on interest-bearingliabilities including generalexpenses
1.83 1.65 1.74 1.73 1.35 1.53
Net yield / Interest rate (1.41) (0.08) (0.78) (1.47) 0.04 (0.79)
March 2013 Year end(Apr. 1, 2012 - Mar. 31, 2013)
March 2014 Year end(Apr. 1, 2013 - Mar. 31, 2014)
Fees and commissions
(Millions of Yen)
Domestic International Total Domestic International Total
7,594 7,513 15,108 12,488 9,033 21,522
Fees and commissions on fundtransfer
1,214 3,371 4,585 1,671 4,391 6,062
Other fees and commissions 6,379 4,142 10,522 10,816 4,642 15,459
1,924 290 2,215 1,569 721 2,291
Fees and commissions on fundtransfer
431 229 661 436 307 744
Other fees and commissions 1,493 61 1,554 1,133 413 1,546
5,669 7,223 12,893 10,918 8,312 19,231Fees and commissions profit
March 2013 Year end(Apr. 1, 2012 - Mar. 31, 2013)
March 2014 Year end(Apr. 1, 2013 - Mar. 31, 2014)
Fees and commissions
Fees and commissions paid
28
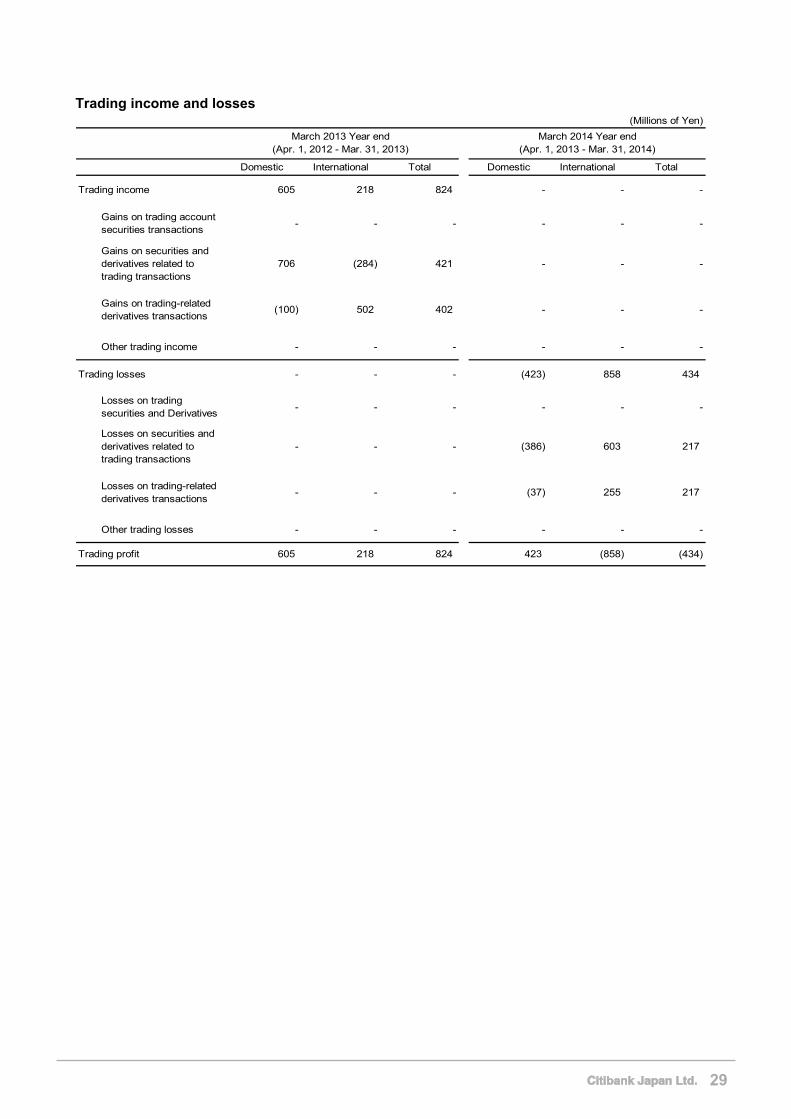
Trading income and losses (Millions of Yen)
Domestic International Total Domestic International Total
Trading income 605 218 824 - - -
Gains on trading accountsecurities transactions
- - - - - -
Gains on securities andderivatives related totrading transactions
706 (284) 421 - - -
Gains on trading-relatedderivatives transactions
(100) 502 402 - - -
Other trading income - - - - - -
Trading losses - - - (423) 858 434
Losses on tradingsecurities and Derivatives
- - - - - -
Losses on securities andderivatives related totrading transactions
- - - (386) 603 217
Losses on trading-relatedderivatives transactions
- - - (37) 255 217
Other trading losses - - - - - -
Trading profit 605 218 824 423 (858) (434)
March 2013 Year end(Apr. 1, 2012 - Mar. 31, 2013)
March 2014 Year end(Apr. 1, 2013 - Mar. 31, 2014)
29
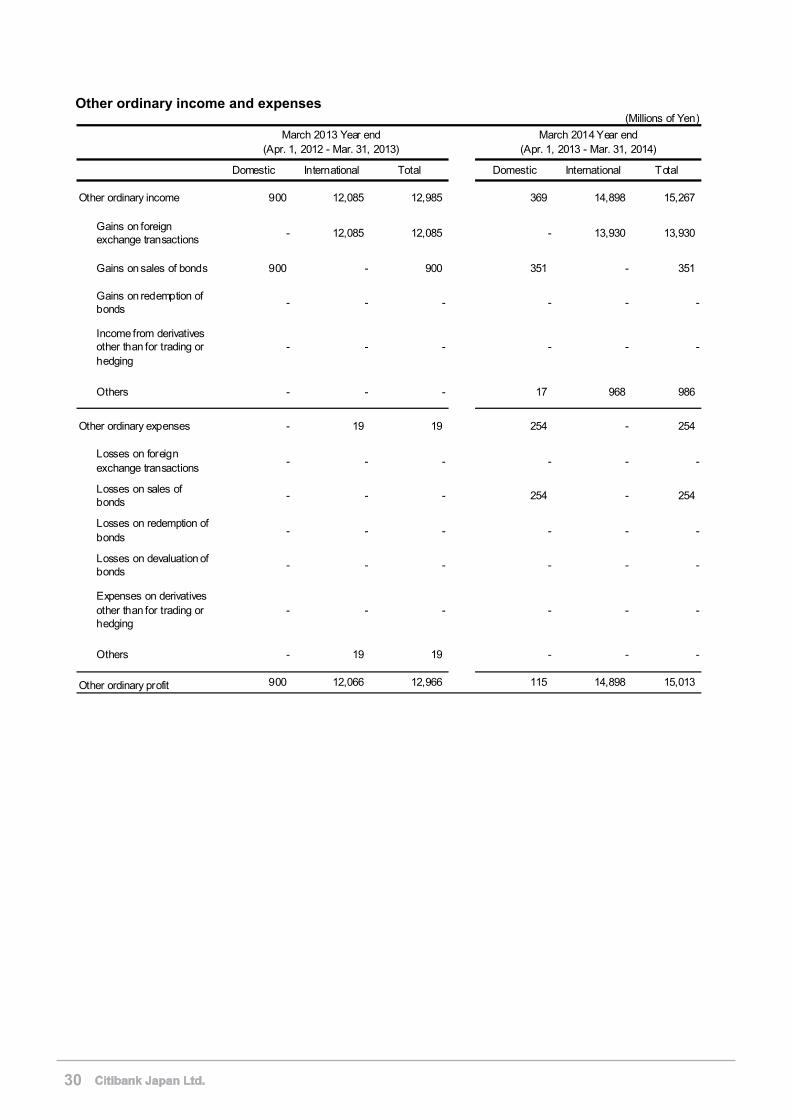
Other ordinary income and expenses (Millions of Yen)
Domestic International Total Domestic International Total
Other ordinary income 900 12,085 12,985 369 14,898 15,267
Gains on foreignexchange transactions
- 12,085 12,085 - 13,930 13,930
Gains on sales of bonds 900 - 900 351 - 351
Gains on redemption ofbonds
- - - - - -
Income from derivativesother than for trading orhedging
- - - - - -
Others - - - 17 968 986
Other ordinary expenses - 19 19 254 - 254
Losses on foreignexchange transactions
- - - - - -
Losses on sales ofbonds
- - - 254 - 254
Losses on redemption ofbonds
- - - - - -
Losses on devaluation ofbonds
- - - - - -
Expenses on derivativesother than for trading orhedging
- - - - - -
Others - 19 19 - - -
Other ordinary profit 900 12,066 12,966 115 14,898 15,013
March 2013 Year end(Apr. 1, 2012 - Mar. 31, 2013)
March 2014 Year end(Apr. 1, 2013 - Mar. 31, 2014)
30
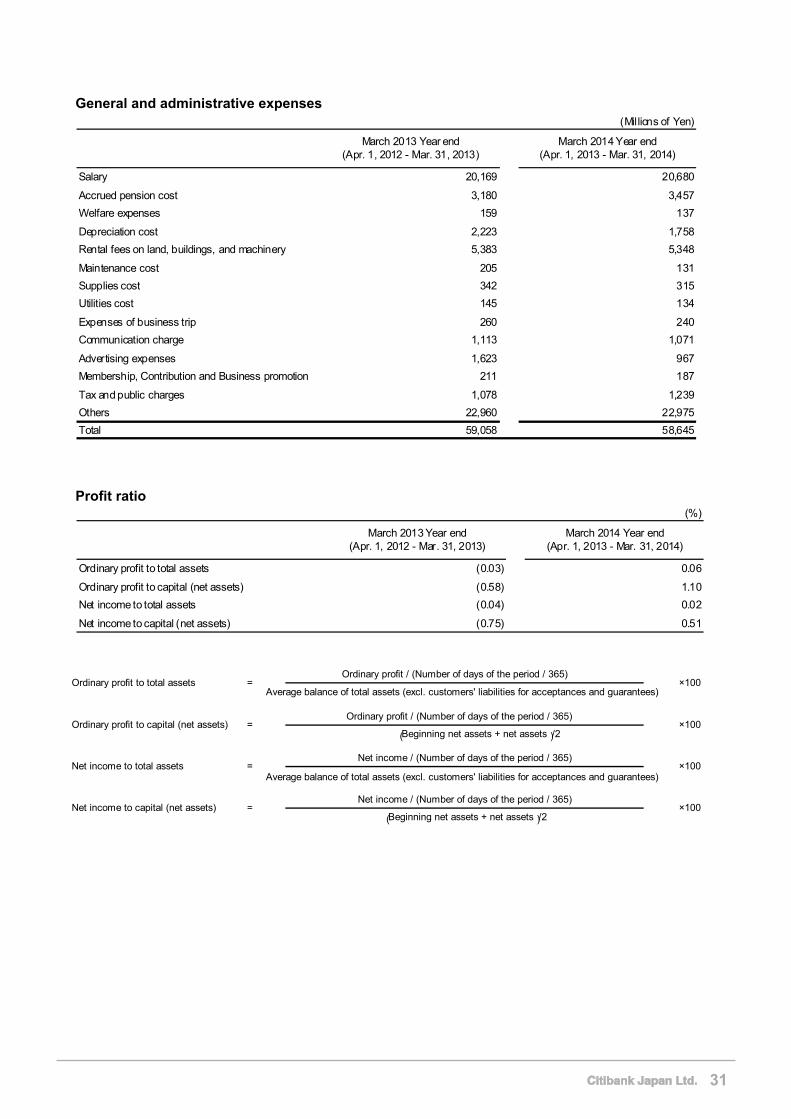
General and administrative expenses (Millions of Yen)
Salary 20,169 20,680
Accrued pension cost 3,180 3,457
Welfare expenses 159 137
Depreciation cost 2,223 1,758
Rental fees on land, buildings, and machinery 5,383 5,348
Maintenance cost 205 131
Supplies cost 342 315
Utilities cost 145 134
Expenses of business trip 260 240
Communication charge 1,113 1,071
Advertising expenses 1,623 967
Membership, Contribution and Business promotion 211 187
Tax and public charges 1,078 1,239
Others 22,960 22,975
Total 59,058 58,645
March 2013 Year end(Apr. 1, 2012 - Mar. 31, 2013)
March 2014 Year end(Apr. 1, 2013 - Mar. 31, 2014)
Profit ratio (%)
Ordinary profit to total assets (0.03) 0.06
Ordinary profit to capital (net assets) (0.58) 1.10
Net income to total assets (0.04) 0.02
Net income to capital (net assets) (0.75) 0.51
March 2013 Year end(Apr. 1, 2012 - Mar. 31, 2013)
March 2014 Year end(Apr. 1, 2013 - Mar. 31, 2014)
Ordinary profit / (Number of days of the period / 365)
Average balance of total assets (excl. customers' liabilities for acceptances and guarantees)
Ordinary profit / (Number of days of the period / 365)
(Beginning net assets + net assets)/2
Net income / (Number of days of the period / 365)
Average balance of total assets (excl. customers' liabilities for acceptances and guarantees)
Net income / (Number of days of the period / 365)
(Beginning net assets + net assets)/2
×100
= ×100
×100
×100
=
=
=
Ordinary profit to total assets
Ordinary profit to capital (net assets)
Net income to total assets
Net income to capital (net assets)
31
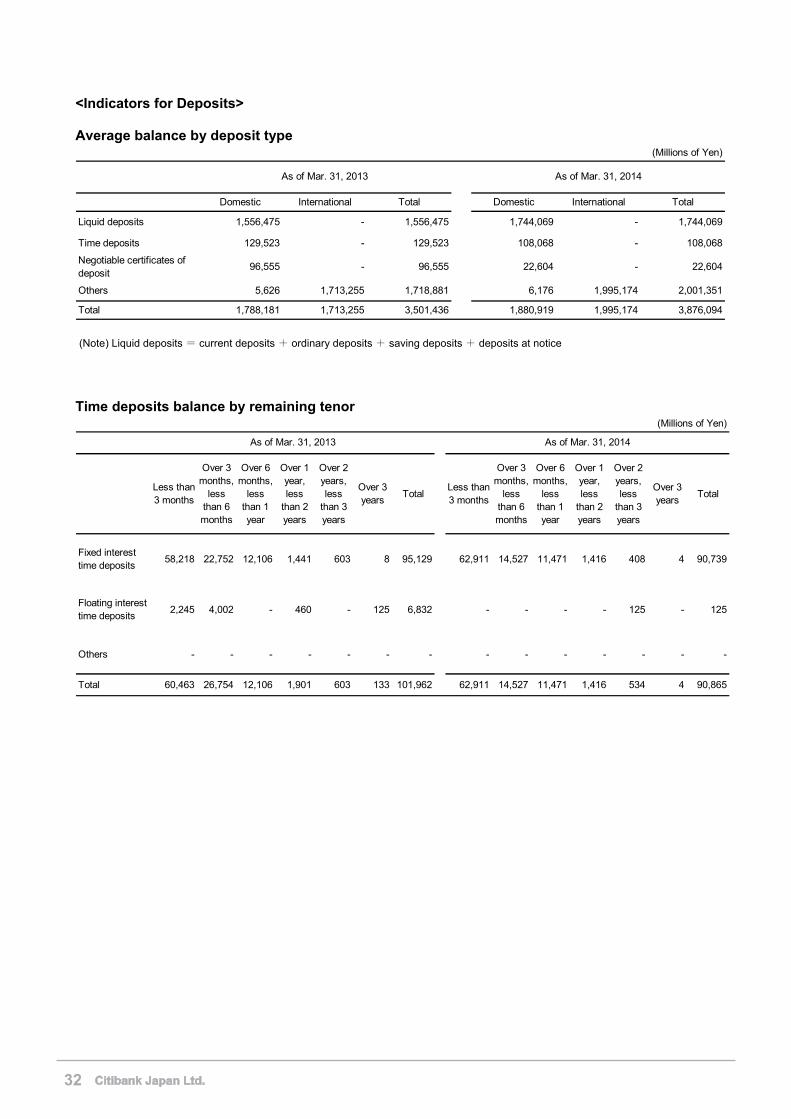
<Indicators for Deposits>
Average balance by deposit type (Millions of Yen)
Domestic International Total Domestic International Total
Liquid deposits 1,556,475 - 1,556,475 1,744,069 - 1,744,069
Time deposits 129,523 - 129,523 108,068 - 108,068
Negotiable certificates ofdeposit
96,555 - 96,555 22,604 - 22,604
Others 5,626 1,713,255 1,718,881 6,176 1,995,174 2,001,351
Total 1,788,181 1,713,255 3,501,436 1,880,919 1,995,174 3,876,094
As of Mar. 31, 2013 As of Mar. 31, 2014
(Note) Liquid deposits = current deposits + ordinary deposits + saving deposits + deposits at notice
Time deposits balance by remaining tenor
(Millions of Yen)
Less than3 months
Over 3months,
lessthan 6months
Over 6months,
lessthan 1year
Over 1year,less
than 2years
Over 2years,less
than 3years
Over 3years
TotalLess than3 months
Over 3months,
lessthan 6months
Over 6months,
lessthan 1year
Over 1year,less
than 2years
Over 2years,less
than 3years
Over 3years
Total
Fixed interesttime deposits
58,218 22,752 12,106 1,441 603 8 95,129 62,911 14,527 11,471 1,416 408 4 90,739
Floating interesttime deposits
2,245 4,002 - 460 - 125 6,832 - - - - 125 - 125
Others - - - - - - - - - - - - - -
Total 60,463 26,754 12,106 1,901 603 133 101,962 62,911 14,527 11,471 1,416 534 4 90,865
As of Mar. 31, 2013 As of Mar. 31, 2014
32
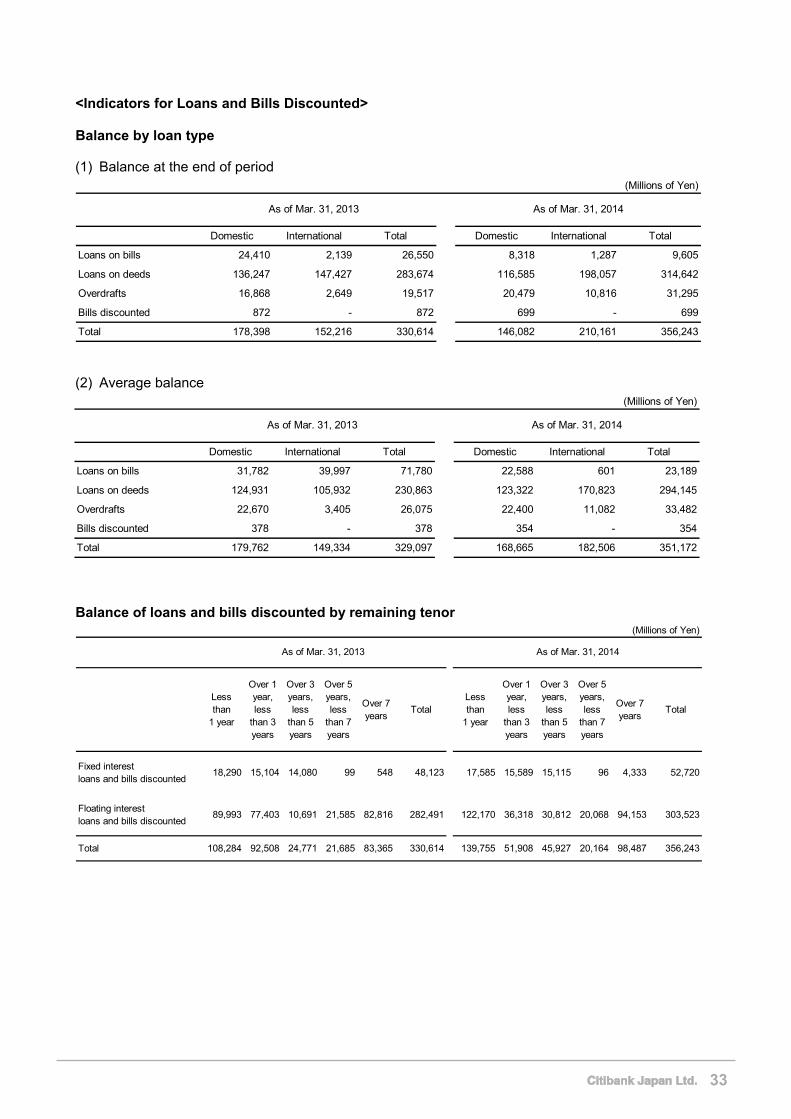
<Indicators for Loans and Bills Discounted>
Balance by loan type (1) Balance at the end of period
Domestic International Total Domestic International Total
Loans on bills 24,410 2,139 26,550 8,318 1,287 9,605
Loans on deeds 136,247 147,427 283,674 116,585 198,057 314,642
Overdrafts 16,868 2,649 19,517 20,479 10,816 31,295
Bills discounted 872 - 872 699 - 699
Total 178,398 152,216 330,614 146,082 210,161 356,243
(Millions of Yen)
As of Mar. 31, 2013 As of Mar. 31, 2014
(2) Average balance
Domestic International Total Domestic International Total
Loans on bills 31,782 39,997 71,780 22,588 601 23,189
Loans on deeds 124,931 105,932 230,863 123,322 170,823 294,145
Overdrafts 22,670 3,405 26,075 22,400 11,082 33,482
Bills discounted 378 - 378 354 - 354
Total 179,762 149,334 329,097 168,665 182,506 351,172
(Millions of Yen)
As of Mar. 31, 2013 As of Mar. 31, 2014
Balance of loans and bills discounted by remaining tenor
(Millions of Yen)
Lessthan
1 year
Over 1year,less
than 3years
Over 3years,less
than 5years
Over 5years,less
than 7years
Over 7years
TotalLessthan
1 year
Over 1year,less
than 3years
Over 3years,less
than 5years
Over 5years,less
than 7years
Over 7years
Total
Fixed interestloans and bills discounted
18,290 15,104 14,080 99 548 48,123 17,585 15,589 15,115 96 4,333 52,720
Floating interestloans and bills discounted
89,993 77,403 10,691 21,585 82,816 282,491 122,170 36,318 30,812 20,068 94,153 303,523
Total 108,284 92,508 24,771 21,685 83,365 330,614 139,755 51,908 45,927 20,164 98,487 356,243
As of Mar. 31, 2013 As of Mar. 31, 2014
33
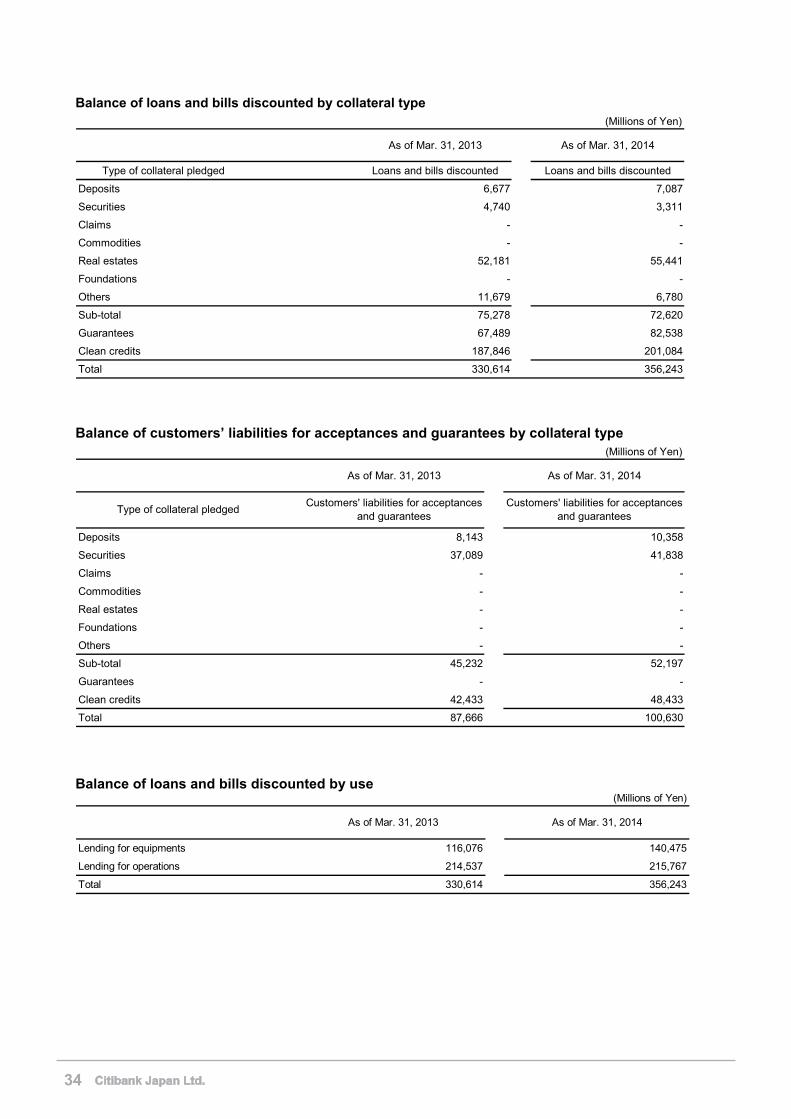
Balance of loans and bills discounted by collateral type (Millions of Yen)
As of Mar. 31, 2013 As of Mar. 31, 2014
Type of collateral pledged Loans and bills discounted Loans and bills discounted
Deposits 6,677 7,087
Securities 4,740 3,311
Claims - -
Commodities - -
Real estates 52,181 55,441
Foundations - -
Others 11,679 6,780
Sub-total 75,278 72,620
Guarantees 67,489 82,538
Clean credits 187,846 201,084
Total 330,614 356,243 Balance of customers’ liabilities for acceptances and guarantees by collateral type
(Millions of Yen)
As of Mar. 31, 2013 As of Mar. 31, 2014
Deposits 8,143 10,358
Securities 37,089 41,838
Claims - -
Commodities - -
Real estates - -
Foundations - -
Others - -
Sub-total 45,232 52,197
Guarantees - -
Clean credits 42,433 48,433
Total 87,666 100,630
Type of collateral pledgedCustomers' liabilities for acceptances
and guaranteesCustomers' liabilities for acceptances
and guarantees
Balance of loans and bills discounted by use
(Millions of Yen)
As of Mar. 31, 2013 As of Mar. 31, 2014
Lending for equipments 116,076 140,475
Lending for operations 214,537 215,767
Total 330,614 356,243
34
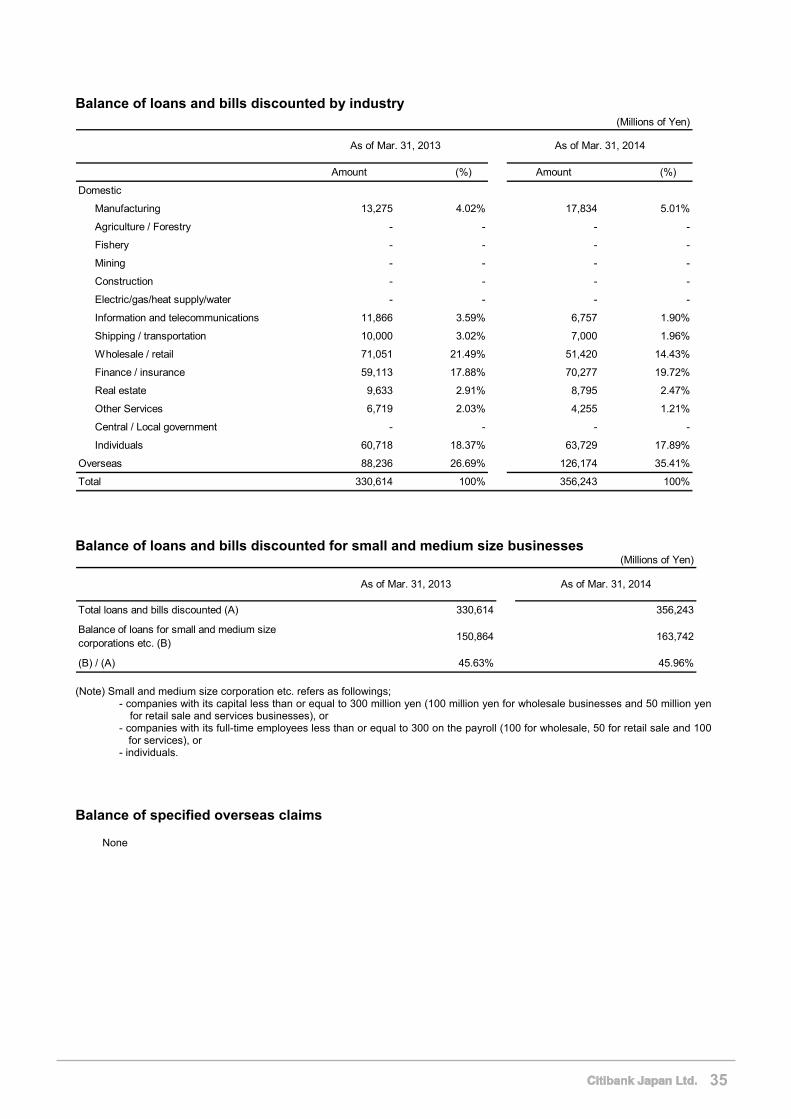
Balance of loans and bills discounted by industry (Millions of Yen)
Amount (%) Amount (%)
Domestic
Manufacturing 13,275 4.02% 17,834 5.01%
Agriculture / Forestry - - - -
Fishery - - - -
Mining - - - -
Construction - - - -
Electric/gas/heat supply/water - - - -
Information and telecommunications 11,866 3.59% 6,757 1.90%
Shipping / transportation 10,000 3.02% 7,000 1.96%
Wholesale / retail 71,051 21.49% 51,420 14.43%
Finance / insurance 59,113 17.88% 70,277 19.72%
Real estate 9,633 2.91% 8,795 2.47%
Other Services 6,719 2.03% 4,255 1.21%
Central / Local government - - - -
Individuals 60,718 18.37% 63,729 17.89%
Overseas 88,236 26.69% 126,174 35.41%
Total 330,614 100% 356,243 100%
As of Mar. 31, 2013 As of Mar. 31, 2014
Balance of loans and bills discounted for small and medium size businesses
(Millions of Yen)
As of Mar. 31, 2013 As of Mar. 31, 2014
Total loans and bills discounted (A) 330,614 356,243
Balance of loans for small and medium sizecorporations etc. (B)
150,864 163,742
(B) / (A) 45.63% 45.96% (Note) Small and medium size corporation etc. refers as followings;
- companies with its capital less than or equal to 300 million yen (100 million yen for wholesale businesses and 50 million yen for retail sale and services businesses), or
- companies with its full-time employees less than or equal to 300 on the payroll (100 for wholesale, 50 for retail sale and 100 for services), or
- individuals.
Balance of specified overseas claims None
35
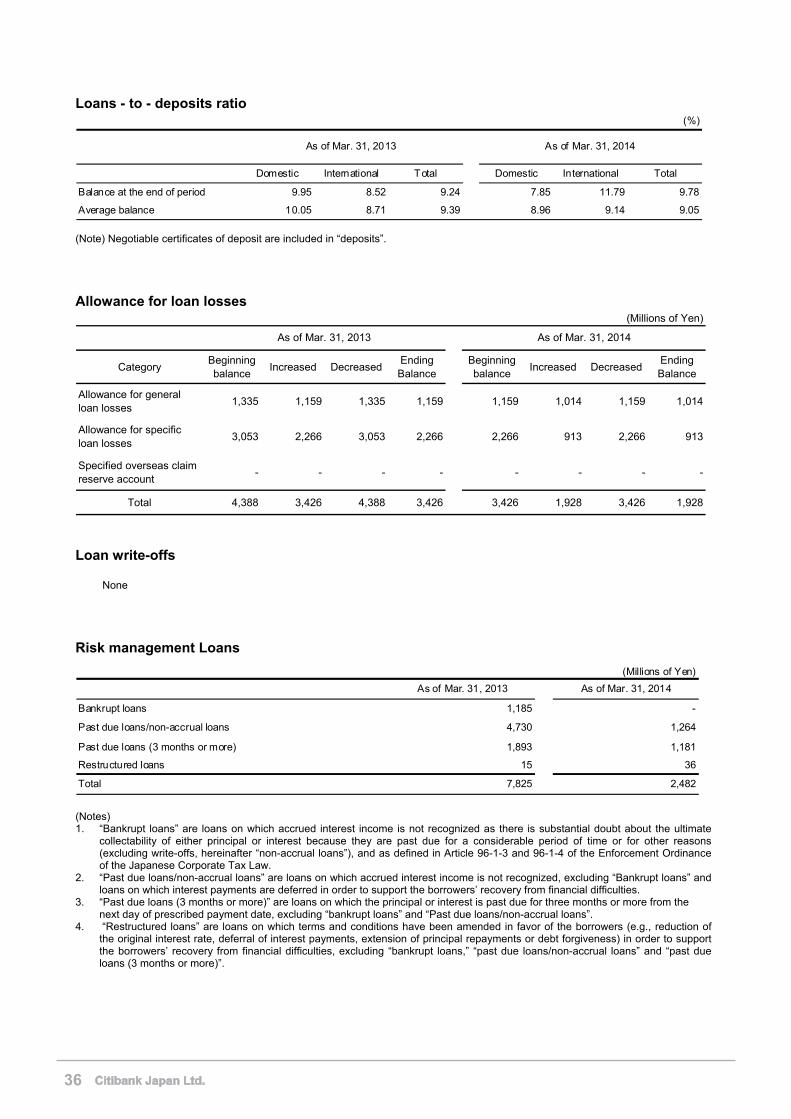
Loans - to - deposits ratio (%)
Domestic International Total Domestic International Total
Balance at the end of period 9.95 8.52 9.24 7.85 11.79 9.78
Average balance 10.05 8.71 9.39 8.96 9.14 9.05
As of Mar. 31, 2013 As of Mar. 31, 2014
(Note) Negotiable certificates of deposit are included in “deposits”.
Allowance for loan losses (Millions of Yen)
CategoryBeginningbalance
Increased DecreasedEndingBalance
Beginningbalance
Increased DecreasedEndingBalance
Allowance for generalloan losses
1,335 1,159 1,335 1,159 1,159 1,014 1,159 1,014
Allowance for specificloan losses
3,053 2,266 3,053 2,266 2,266 913 2,266 913
Specified overseas claimreserve account
- - - - - - - -
Total 4,388 3,426 4,388 3,426 3,426 1,928 3,426 1,928
As of Mar. 31, 2013 As of Mar. 31, 2014
Loan write-offs
None
Risk management Loans
(Millions of Yen)
As of Mar. 31, 2013 As of Mar. 31, 2014
Bankrupt loans 1,185 -
Past due loans/non-accrual loans 4,730 1,264
Past due loans (3 months or more) 1,893 1,181
Restructured loans 15 36
Total 7,825 2,482
(Notes) 1. “Bankrupt loans” are loans on which accrued interest income is not recognized as there is substantial doubt about the ultimate
collectability of either principal or interest because they are past due for a considerable period of time or for other reasons (excluding write-offs, hereinafter “non-accrual loans”), and as defined in Article 96-1-3 and 96-1-4 of the Enforcement Ordinance of the Japanese Corporate Tax Law.
2. “Past due loans/non-accrual loans” are loans on which accrued interest income is not recognized, excluding “Bankrupt loans” and loans on which interest payments are deferred in order to support the borrowers’ recovery from financial difficulties.
3. “Past due loans (3 months or more)” are loans on which the principal or interest is past due for three months or more from the next day of prescribed payment date, excluding “bankrupt loans” and “Past due loans/non-accrual loans”.
4. “Restructured loans” are loans on which terms and conditions have been amended in favor of the borrowers (e.g., reduction of the original interest rate, deferral of interest payments, extension of principal repayments or debt forgiveness) in order to support the borrowers’ recovery from financial difficulties, excluding “bankrupt loans,” “past due loans/non-accrual loans” and “past due loans (3 months or more)”.
36
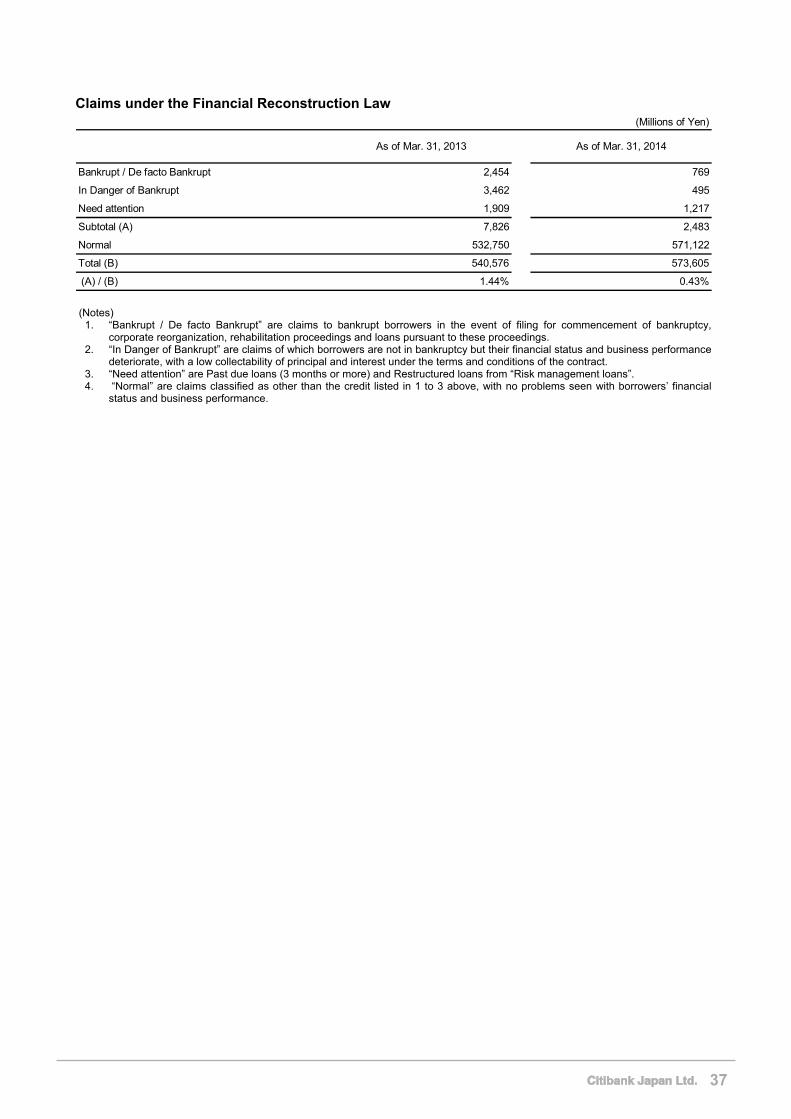
Claims under the Financial Reconstruction Law (Millions of Yen)
As of Mar. 31, 2013 As of Mar. 31, 2014
Bankrupt / De facto Bankrupt 2,454 769
In Danger of Bankrupt 3,462 495
Need attention 1,909 1,217
Subtotal (A) 7,826 2,483
Normal 532,750 571,122
Total (B) 540,576 573,605
(A) / (B) 1.44% 0.43%
(Notes)
1. “Bankrupt / De facto Bankrupt” are claims to bankrupt borrowers in the event of filing for commencement of bankruptcy, corporate reorganization, rehabilitation proceedings and loans pursuant to these proceedings.
2. “In Danger of Bankrupt” are claims of which borrowers are not in bankruptcy but their financial status and business performance deteriorate, with a low collectability of principal and interest under the terms and conditions of the contract.
3. “Need attention” are Past due loans (3 months or more) and Restructured loans from “Risk management loans”. 4. “Normal” are claims classified as other than the credit listed in 1 to 3 above, with no problems seen with borrowers’ financial
status and business performance.
37
<Indicators for Securities >
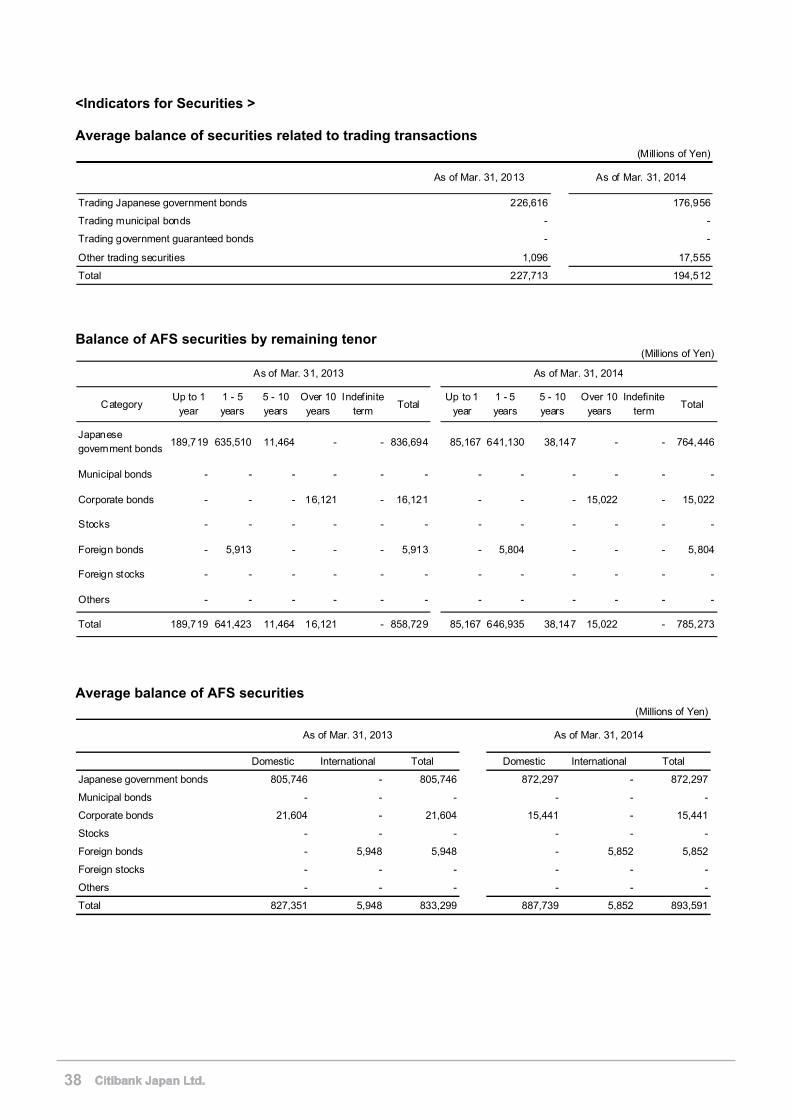
Average balance of securities related to trading transactions (Millions of Yen)
As of Mar. 31, 2013 As of Mar. 31, 2014
Trading Japanese government bonds 226,616 176,956
Trading municipal bonds - -
Trading government guaranteed bonds - -
Other trading securities 1,096 17,555
Total 227,713 194,512
Balance of AFS securities by remaining tenor
(Millions of Yen)
CategoryUp to 1
year1 - 5years
5 - 10years
Over 10years
Indefiniteterm
TotalUp to 1
year1 - 5years
5 - 10years
Over 10years
Indefiniteterm
Total
Japanesegovernment bonds
189,719 635,510 11,464 - - 836,694 85,167 641,130 38,147 - - 764,446
Municipal bonds - - - - - - - - - - - -
Corporate bonds - - - 16,121 - 16,121 - - - 15,022 - 15,022
Stocks - - - - - - - - - - - -
Foreign bonds - 5,913 - - - 5,913 - 5,804 - - - 5,804
Foreign stocks - - - - - - - - - - - -
Others - - - - - - - - - - - -
Total 189,719 641,423 11,464 16,121 - 858,729 85,167 646,935 38,147 15,022 - 785,273
As of Mar. 31, 2013 As of Mar. 31, 2014
Average balance of AFS securities (Millions of Yen)
Domestic International Total Domestic International Total
Japanese government bonds 805,746 - 805,746 872,297 - 872,297
Municipal bonds - - - - - -
Corporate bonds 21,604 - 21,604 15,441 - 15,441
Stocks - - - - - -
Foreign bonds - 5,948 5,948 - 5,852 5,852
Foreign stocks - - - - - -
Others - - - - - -
Total 827,351 5,948 833,299 887,739 5,852 893,591
As of Mar. 31, 2013 As of Mar. 31, 2014
38
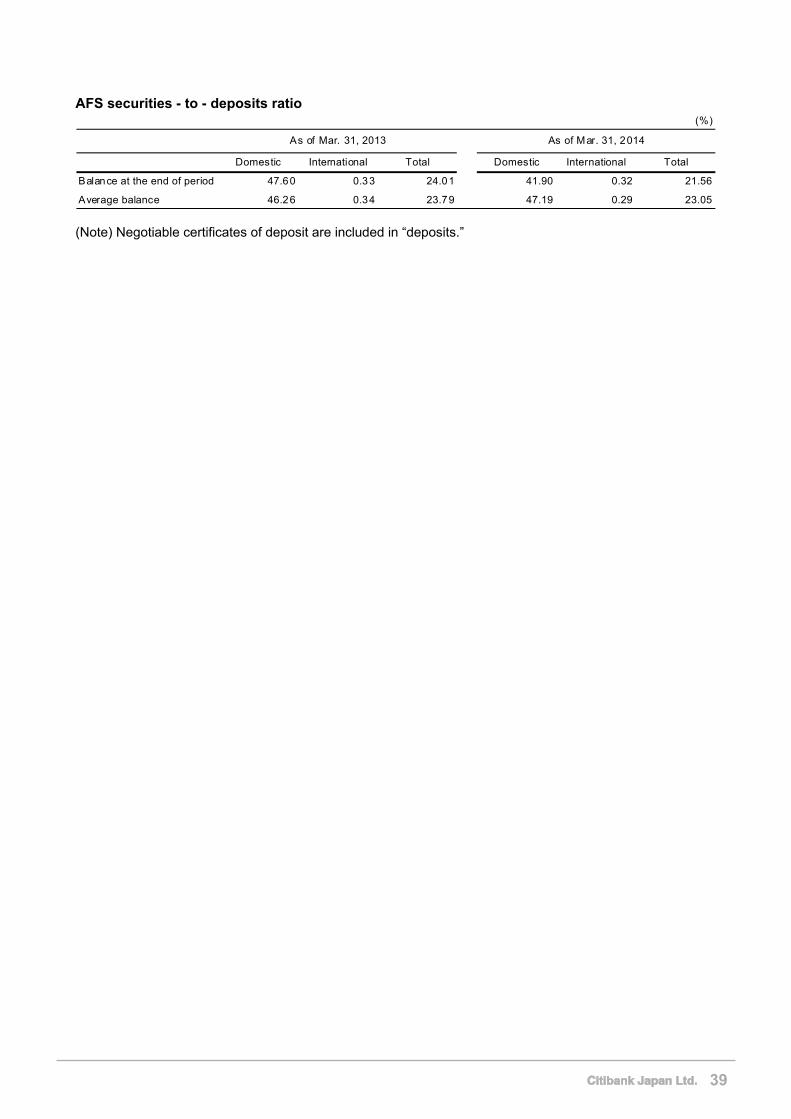
AFS securities - to - deposits ratio (%)
Domestic International Total Domestic International Total
Balance at the end of period 47.60 0.33 24.01 41.90 0.32 21.56
Average balance 46.26 0.34 23.79 47.19 0.29 23.05
As of Mar. 31, 2013 As of Mar. 31, 2014
(Note) Negotiable certificates of deposit are included in “deposits.”
39
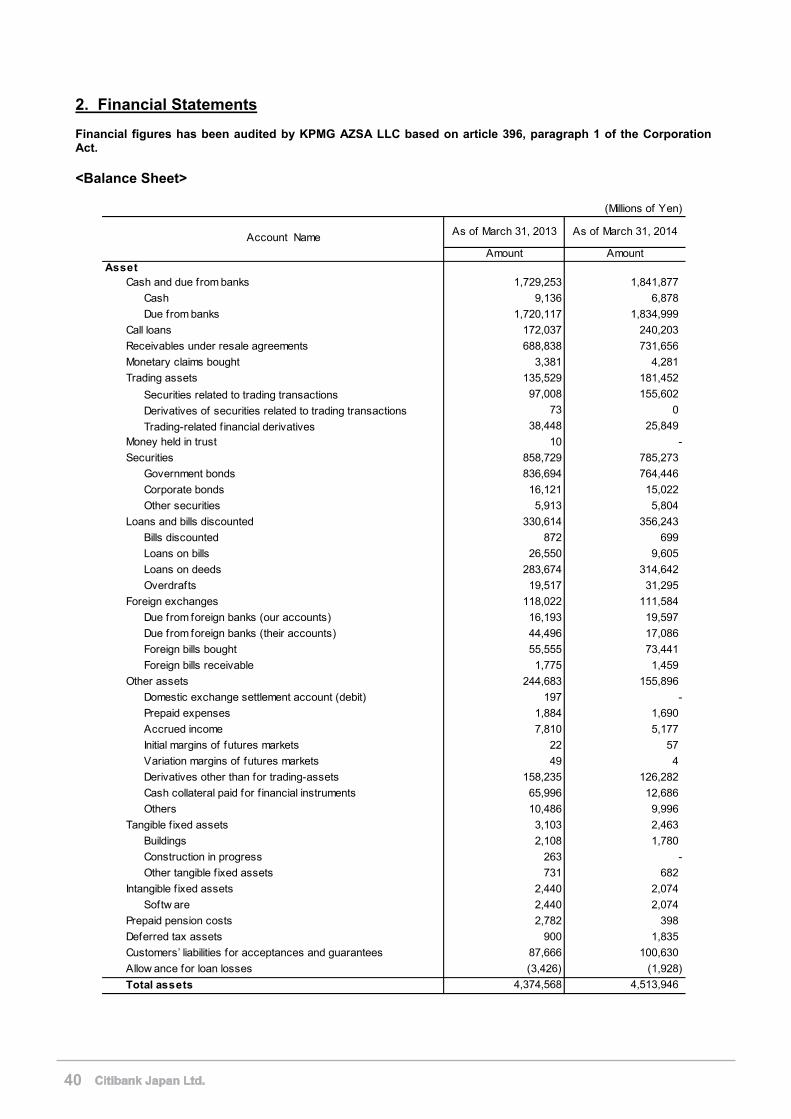
2. Financial Statements Financial figures has been audited by KPMG AZSA LLC based on article 396, paragraph 1 of the Corporation Act. <Balance Sheet>
(Millions of Yen)
As of March 31, 2013 As of March 31, 2014
Amount AmountAsset
Cash and due from banks 1,729,253 1,841,877
Cash 9,136 6,878
Due from banks 1,720,117 1,834,999
Call loans 172,037 240,203
Receivables under resale agreements 688,838 731,656
Monetary claims bought 3,381 4,281
Trading assets 135,529 181,452
Securities related to trading transactions 97,008 155,602
Derivatives of securities related to trading transactions 73 0
Trading-related f inancial derivatives 38,448 25,849
Money held in trust 10 -
Securities 858,729 785,273
Government bonds 836,694 764,446
Corporate bonds 16,121 15,022
Other securities 5,913 5,804
Loans and bills discounted 330,614 356,243
Bills discounted 872 699
Loans on bills 26,550 9,605
Loans on deeds 283,674 314,642
Overdrafts 19,517 31,295
Foreign exchanges 118,022 111,584
Due from foreign banks (our accounts) 16,193 19,597
Due from foreign banks (their accounts) 44,496 17,086
Foreign bills bought 55,555 73,441
Foreign bills receivable 1,775 1,459
Other assets 244,683 155,896
Domestic exchange settlement account (debit) 197 -
Prepaid expenses 1,884 1,690
Accrued income 7,810 5,177
Initial margins of futures markets 22 57
Variation margins of futures markets 49 4
Derivatives other than for trading-assets 158,235 126,282
Cash collateral paid for f inancial instruments 65,996 12,686
Others 10,486 9,996
Tangible f ixed assets 3,103 2,463
Buildings 2,108 1,780
Construction in progress 263 -
Other tangible f ixed assets 731 682
Intangible f ixed assets 2,440 2,074
Softw are 2,440 2,074
Prepaid pension costs 2,782 398
Deferred tax assets 900 1,835
Customers’ liabilities for acceptances and guarantees 87,666 100,630
Allow ance for loan losses (3,426) (1,928)
Total assets 4,374,568 4,513,946
Account Name
40
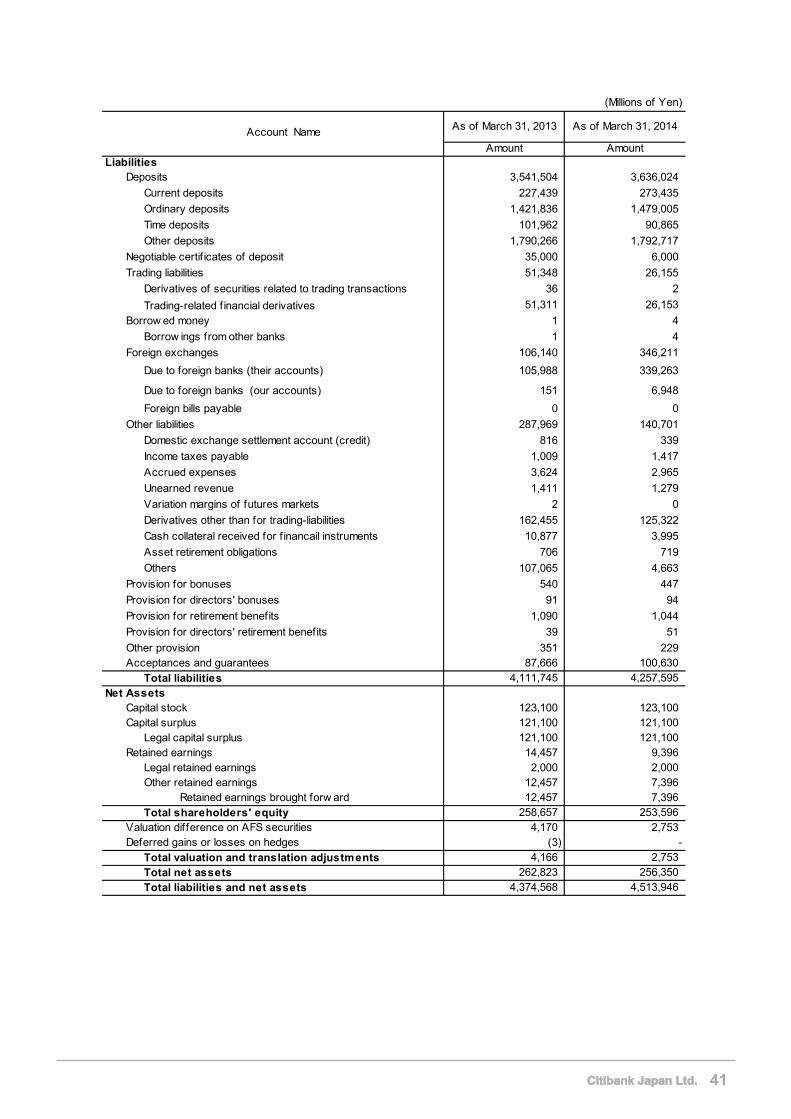
(Millions of Yen)
As of March 31, 2013 As of March 31, 2014
Amount AmountLiabilities
Deposits 3,541,504 3,636,024
Current deposits 227,439 273,435
Ordinary deposits 1,421,836 1,479,005
Time deposits 101,962 90,865
Other deposits 1,790,266 1,792,717
Negotiable certif icates of deposit 35,000 6,000
Trading liabilities 51,348 26,155
Derivatives of securities related to trading transactions 36 2
Trading-related f inancial derivatives 51,311 26,153
Borrow ed money 1 4
Borrow ings from other banks 1 4
Foreign exchanges 106,140 346,211
Due to foreign banks (their accounts) 105,988 339,263
Due to foreign banks (our accounts) 151 6,948
Foreign bills payable 0 0
Other liabilities 287,969 140,701
Domestic exchange settlement account (credit) 816 339
Income taxes payable 1,009 1,417
Accrued expenses 3,624 2,965
Unearned revenue 1,411 1,279
Variation margins of futures markets 2 0
Derivatives other than for trading-liabilities 162,455 125,322
Cash collateral received for f inancail instruments 10,877 3,995
Asset retirement obligations 706 719
Others 107,065 4,663
Provision for bonuses 540 447
Provision for directors' bonuses 91 94
Provision for retirement benefits 1,090 1,044
Provision for directors' retirement benefits 39 51
Other provision 351 229Acceptances and guarantees 87,666 100,630
Total liabilities 4,111,745 4,257,595Net Assets
Capital stock 123,100 123,100Capital surplus 121,100 121,100
Legal capital surplus 121,100 121,100Retained earnings 14,457 9,396
Legal retained earnings 2,000 2,000Other retained earnings 12,457 7,396
Retained earnings brought forw ard 12,457 7,396Total shareholders' equity 258,657 253,596
Valuation difference on AFS securities 4,170 2,753Deferred gains or losses on hedges (3) -
Total valuation and translation adjustments 4,166 2,753Total net assets 262,823 256,350
Total liabilities and net assets 4,374,568 4,513,946
Account Name
41
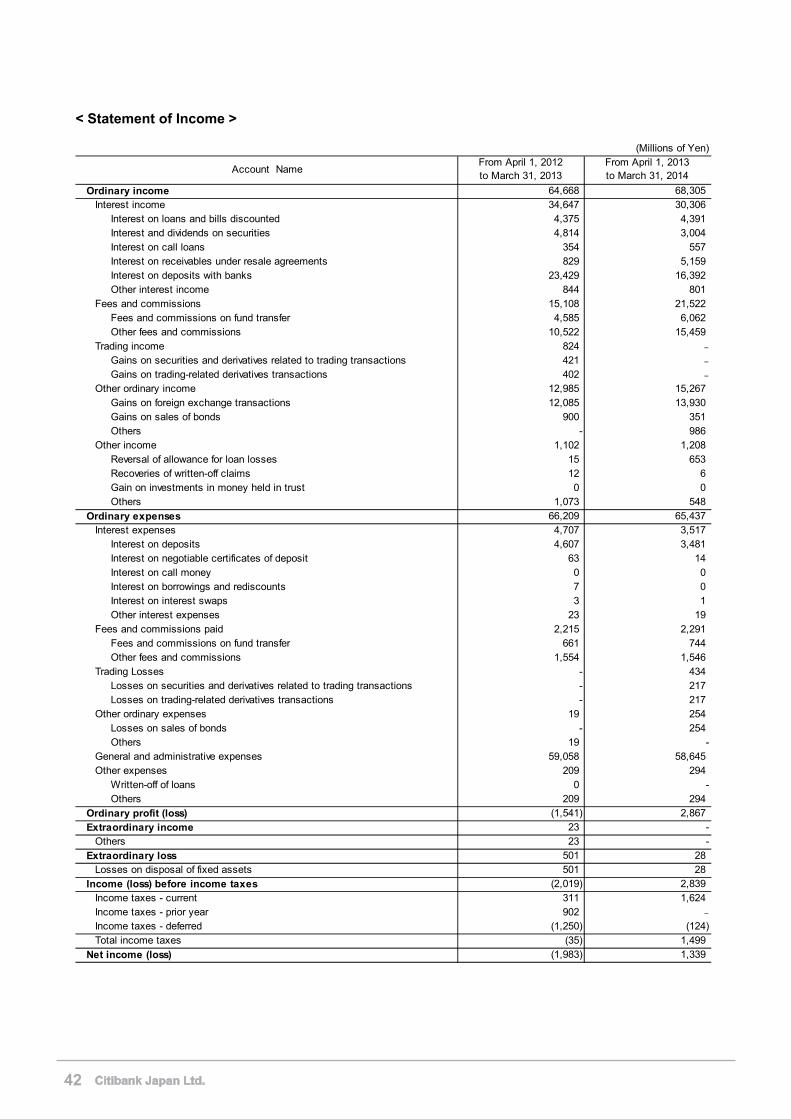
< Statement of Income >
(Millions of Yen)
64,668 68,305Interest income 34,647 30,306
Interest on loans and bills discounted 4,375 4,391Interest and dividends on securities 4,814 3,004Interest on call loans 354 557Interest on receivables under resale agreements 829 5,159Interest on deposits with banks 23,429 16,392Other interest income 844 801
Fees and commissions 15,108 21,522Fees and commissions on fund transfer 4,585 6,062Other fees and commissions 10,522 15,459
Trading income 824 -
Gains on securities and derivatives related to trading transactions 421 -
Gains on trading-related derivatives transactions 402 -
Other ordinary income 12,985 15,267Gains on foreign exchange transactions 12,085 13,930Gains on sales of bonds 900 351Others - 986
Other income 1,102 1,208Reversal of allowance for loan losses 15 653Recoveries of written-off claims 12 6Gain on investments in money held in trust 0 0Others 1,073 548
66,209 65,437Interest expenses 4,707 3,517
Interest on deposits 4,607 3,481Interest on negotiable certificates of deposit 63 14Interest on call money 0 0Interest on borrowings and rediscounts 7 0Interest on interest swaps 3 1Other interest expenses 23 19
Fees and commissions paid 2,215 2,291Fees and commissions on fund transfer 661 744Other fees and commissions 1,554 1,546
Trading Losses - 434Losses on securities and derivatives related to trading transactions - 217Losses on trading-related derivatives transactions - 217
Other ordinary expenses 19 254Losses on sales of bonds - 254Others 19 -
General and administrative expenses 59,058 58,645Other expenses 209 294
Written-off of loans 0 -Others 209 294
(1,541) 2,86723 -
Others 23 -501 28
Losses on disposal of fixed assets 501 28(2,019) 2,839
Income taxes - current 311 1,624Income taxes - prior year 902 -
Income taxes - deferred (1,250) (124)Total income taxes (35) 1,499
(1,983) 1,339
Account NameFrom April 1, 2012to March 31, 2013
From April 1, 2013to March 31, 2014
Ordinary income
Income (loss) before income taxes
Net income (loss)
Ordinary expenses
Ordinary profit (loss)Extraordinary income
Extraordinary loss
42
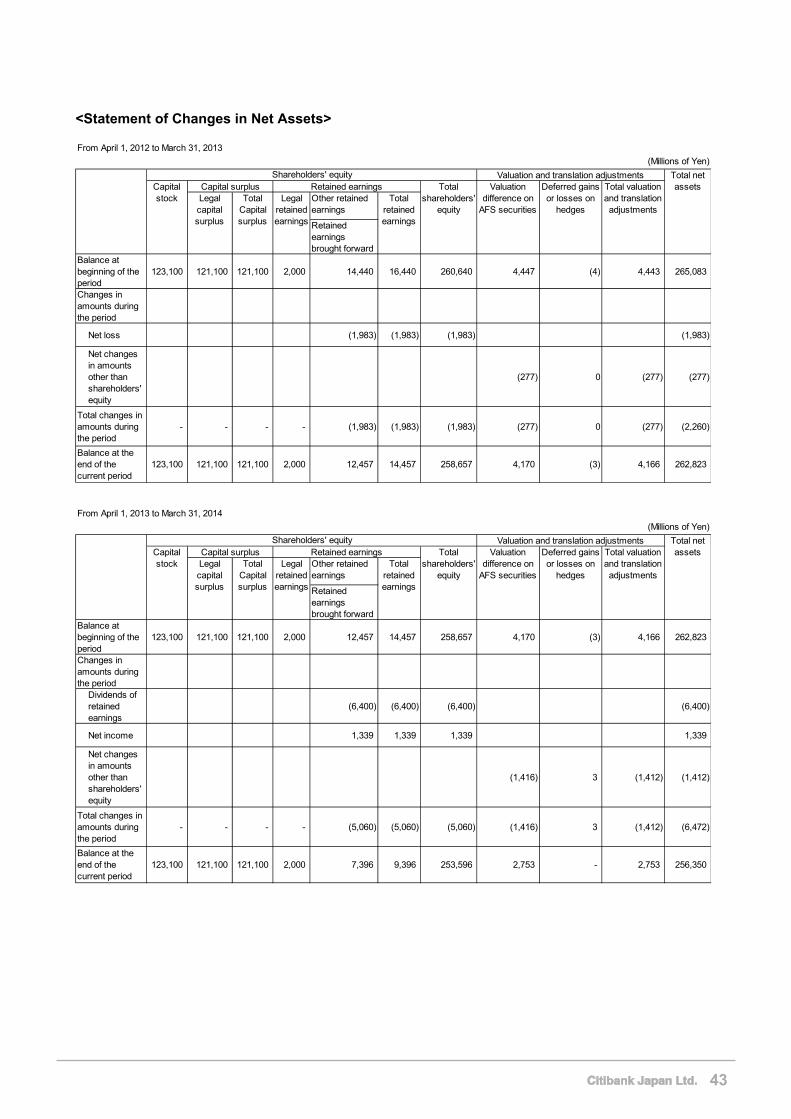
<Statement of Changes in Net Assets>
From April 1, 2012 to March 31, 2013
(Millions of Yen)
Other retainedearnings
Retainedearningsbrought forward
Balance atbeginning of theperiod
123,100 121,100 121,100 2,000 14,440 16,440 260,640 4,447 (4) 4,443 265,083
Changes inamounts duringthe period
Net loss (1,983) (1,983) (1,983) (1,983)
Net changesin amountsother thanshareholders'equity
(277) 0 (277) (277)
Total changes inamounts duringthe period
- - - - (1,983) (1,983) (1,983) (277) 0 (277) (2,260)
Balance at theend of thecurrent period
123,100 121,100 121,100 2,000 12,457 14,457 258,657 4,170 (3) 4,166 262,823
Shareholders' equity Valuation and translation adjustmentsDeferred gainsor losses on
hedges
Total valuationand translationadjustments
Legalcapitalsurplus
TotalCapitalsurplus
Legalretainedearnings
Totalretainedearnings
Total netassetsCapital
stockCapital surplus Retained earnings Total
shareholders'equity
Valuationdifference on
AFS securities
From April 1, 2013 to March 31, 2014
(Millions of Yen)
Other retainedearnings
Retainedearningsbrought forward
Balance atbeginning of theperiod
123,100 121,100 121,100 2,000 12,457 14,457 258,657 4,170 (3) 4,166 262,823
Changes inamounts duringthe period
Dividends ofretainedearnings
(6,400) (6,400) (6,400) (6,400)
Net income 1,339 1,339 1,339 1,339
Net changesin amountsother thanshareholders'equity
(1,416) 3 (1,412) (1,412)
Total changes inamounts duringthe period
- - - - (5,060) (5,060) (5,060) (1,416) 3 (1,412) (6,472)
Balance at theend of thecurrent period
123,100 121,100 121,100 2,000 7,396 9,396 253,596 2,753 - 2,753 256,350
Valuation and translation adjustmentsTotal valuationand translationadjustments
Total netassets
Legalcapitalsurplus
TotalCapitalsurplus
Totalretainedearnings
Legalretainedearnings
Shareholders' equityCapitalstock
Totalshareholders'
equity
Valuationdifference on
AFS securities
Deferred gainsor losses on
hedges
Capital surplus Retained earnings
43
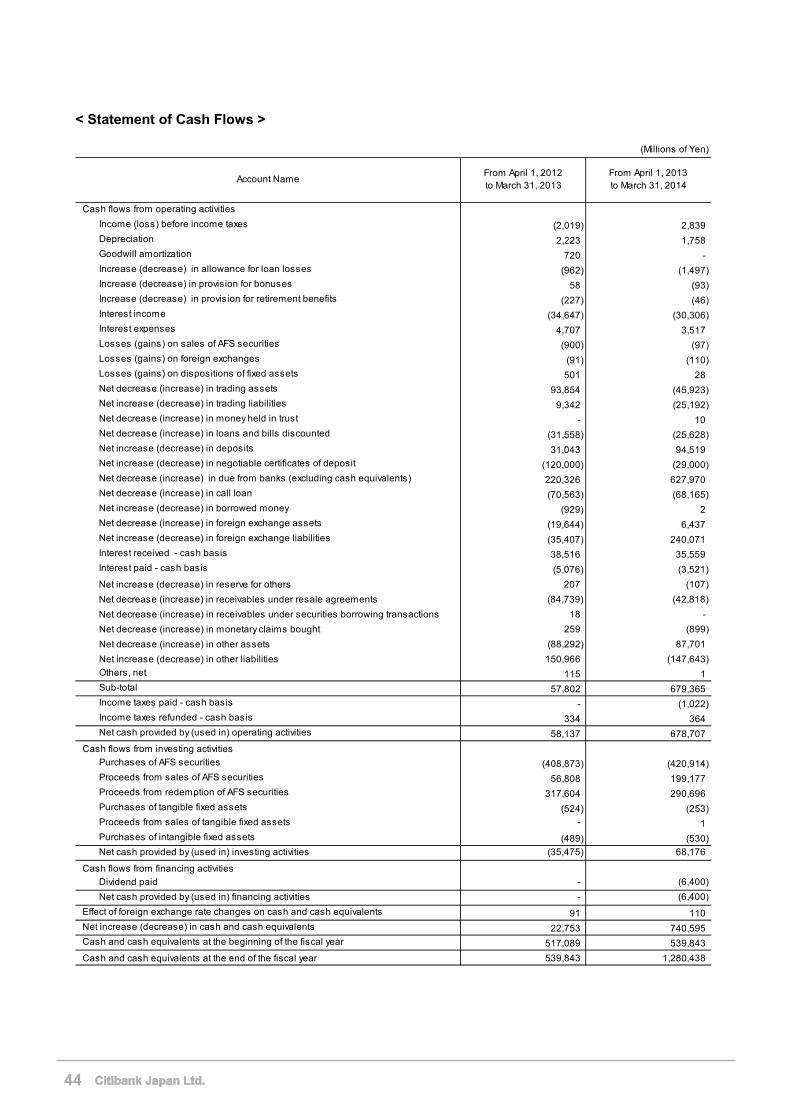
< Statement of Cash Flows >
(Millions of Yen)
Cash flows from operating activities
Income (loss) before income taxes (2,019) 2,839
Depreciation 2,223 1,758
Goodwill amortization 720 -
Increase (decrease) in allowance for loan losses (962) (1,497)
Increase (decrease) in provision for bonuses 58 (93)
Increase (decrease) in provision for retirement benefits (227) (46)
Interest income (34,647) (30,306)
Interest expenses 4,707 3,517
Losses (gains) on sales of AFS securities (900) (97)
Losses (gains) on foreign exchanges (91) (110)
Losses (gains) on dispositions of fixed assets 501 28
Net decrease (increase) in trading assets 93,854 (45,923)
Net increase (decrease) in trading liabilities 9,342 (25,192)
Net decrease (increase) in money held in trust - 10
Net decrease (increase) in loans and bills discounted (31,558) (25,628)
Net increase (decrease) in deposits 31,043 94,519
Net increase (decrease) in negotiable certificates of deposit (120,000) (29,000)
Net decrease (increase) in due from banks (excluding cash equivalents) 220,326 627,970
Net decrease (increase) in call loan (70,563) (68,165)
Net increase (decrease) in borrowed money (929) 2
Net decrease (increase) in foreign exchange assets (19,644) 6,437
Net increase (decrease) in foreign exchange liabilities (35,407) 240,071
Interest received - cash basis 38,516 35,559
Interest paid - cash basis (5,076) (3,521)
Net increase (decrease) in reserve for others 207 (107)
Net decrease (increase) in receivables under resale agreements (84,739) (42,818)
Net decrease (increase) in receivables under securities borrowing transactions 18 -
Net decrease (increase) in monetary claims bought 259 (899)
Net decrease (increase) in other assets (88,292) 87,701
Net increase (decrease) in other liabilities 150,966 (147,643)
Others, net 115 1
Sub-total 57,802 679,365
Income taxes paid - cash basis - (1,022)
Income taxes refunded - cash basis 334 364
Net cash provided by (used in) operating activities 58,137 678,707
Cash flows from investing activities
Purchases of AFS securities (408,873) (420,914)
Proceeds from sales of AFS securities 56,808 199,177
Proceeds from redemption of AFS securities 317,604 290,696
Purchases of tangible fixed assets (524) (253)
Proceeds from sales of tangible fixed assets - 1
Purchases of intangible fixed assets (489) (530)
Net cash provided by (used in) investing activities (35,475) 68,176
Cash flows from financing activities
Dividend paid - (6,400)
Net cash provided by (used in) financing activities - (6,400)
Effect of foreign exchange rate changes on cash and cash equivalents 91 110
Net increase (decrease) in cash and cash equivalents 22,753 740,595
Cash and cash equivalents at the beginning of the fiscal year 517,089 539,843
Cash and cash equivalents at the end of the fiscal year 539,843 1,280,438
Account NameFrom April 1, 2013to March 31, 2014
From April 1, 2012to March 31, 2013
44
Amounts less than one million yen have been omitted.
Accounting Policies 1. Standard for valuation of trading assets and trading liabilities / booking of income and losses for trading
purposes transaction Transactions for trading purposes, such as seeking gains arising from short-term changes in interest rates, foreign exchange rates, or securities prices and other market related indices or from variation among markets (hereinafter referred to as “Trading Purposes”), are included in “Trading assets” or “Trading liabilities” on the balance sheet on a trade date basis. Income and Expenses on trading-purpose transactions are recognized on a trading date basis, and recorded as “Trading income” and “Trading losses”.
Securities and monetary claims purchased for trading purposes are stated at the fiscal year-end market value, and financial derivatives such as swaps, futures and options are stated at amounts that would be settled if the transactions were terminated at the fiscal year-end. “Trading income” and “Trading losses” include interest received or paid during the fiscal year. The year-on-year valuation differences of securities and money claims are also recorded in the above-mentioned accounts. As for the derivatives, assuming that the settlement will be made in cash, the year-on-year valuation differences are also recorded in the above-mentioned accounts.
2. Standard and method for valuation of AFS securities AFS securities that have market prices are carried at their balance sheet date market prices (cost of securities sold is calculated using primarily the moving-average method). Net unrealized gains/losses on AFS securities, net of income taxes, are included in “Net assets”.
3. Standard and method for valuation of derivative transaction
Derivative transactions (excluding those for trading purposes) are carried at fair value. 4. Depreciation method for fixed assets
(1) Tangible fixed assets Tangible fixed assets are depreciated using the declining-balance method. The estimated useful lives are as follows:
Buildings: 3 to 18 years
Others: 2 to 20 years
(2) Intangible fixed assets Intangible fixed assets are depreciated using the straight-line method. Capitalized software for internal use is depreciated over its estimated useful life (5 years).
5. Standard for the translation into Japanese yen Assets and liabilities denominated in foreign currencies are translated into Japanese yen at the exchange rate prevailing at the balance sheet date.
6. Standard for Allowance
(1) Allowance for loan losses
Allowance for loan losses is provided as detailed below in accordance with the internal standards for write-offs and provisioning. For claims on borrowers that have entered into bankruptcy, special liquidation proceedings or similar legal proceedings (“bankrupt borrowers”) or borrowers that are not legally or formally insolvent but are regarded as substantially in the same situation (“effectively bankrupt borrowers”), an allowance is provided based on the amount of claims, after the write-off stated in the additional paragraph below, net of the expected amount of recoveries from collateral and guarantees. For claims on borrowers that are not currently bankrupt but are perceived to have a high risk of falling into bankruptcy, an allowance is provided in the amount deemed necessary based on an overall solvency assessment of the claims, net of the expected amount of recoveries from collateral and guarantees. For other claims, an allowance is provided based on the expected loan-loss ratio assigned to each risk rating. Responsible divisions for Self-Assessment and Front office mutually conduct assessment of all claims in accordance with the internal rules for self-assessment of assets, and the Internal Audit Division, independently audits their assessment. The allowance is provided based on the results of these assessments.
(2) Provision for bonuses Provision for bonuses is reported in preparation for the payment of bonuses to the employees at the amount estimated for the payment of bonuses to the employees during the fiscal year.
45
(3) Provision for directors’ bonuses
Provision for directors’ bonuses is reported in preparation for the payment of bonuses to the directors at the amount estimated for the payment of bonuses to the directors during the fiscal year.
(4) Provision for retirement benefits
Provision for retirement benefits is reported in preparation for the payment of employee retirement allowance in the amount deemed accrued at the fiscal year-end, based on the projected retirement benefit obligation and the fair value of plan assets at the fiscal year-end. The unrecognized prior service cost and actuarial differences are reported as expenses as follows;
Unrecognized prior service cost:
Amortized using the straight-line method for a period, primarily over 7 years, within the employees’ average remaining service period, commencing on the fiscal year in which the services are provided.
Actuarial differences: Amortized using the straight-line method, primarily over 7 to 8 years within the employees’ average remaining service period, commencing from the next fiscal year of incurrence.
(5) Provision for directors’ retirement benefits
Provision for directors’ retirement benefits is reported in preparation for the payment of director retirement allowance out of directors’ estimated allowance for the amount allocable to the period.
7. Method for hedge accounting
For the hedge accounting method applied to hedging transactions for interest rate risk arising from financial assets and liabilities, the deferred hedge accounting method is applied. As for the portfolio hedges to net market fluctuation, effectiveness of such hedges are assessed by classifying the hedged items (such as loans) and the hedging instruments (such as interest rate swaps) by each item.
8. Accounting for consumption taxes
National and Local Consumption Taxes are excluded from transaction amounts.
Accounting standards and relevant regulations that are not yet adopted
The “Accounting Standard for Retirement Benefits” (ASBJ Statement No. 26, May 17, 2012) and the “Application Guideline for Accounting Standard Related to Retirement Benefits” (ASBJ Guideline No. 25, May 17, 2012)
(1) Overview In accordance with improvement of financial reporting and the international trend, this accounting standard mainly represents “a revision of the accounting treatment for unrecognized net gain or loss and unrecognized prior service cost and the calculation method for Projected Benefit Obligation and service cost” and “an enhancement of disclosure”.
(2) Scheduled date of application CJL is scheduled to apply “a revision of the calculation method for Projected Benefit Obligation and service cost” from the beginning of the fiscal year starting on April 1, 2014.
(3) Impact of the adoption of this accounting standard and relevant regulation The impact of the adoption of this accounting standard and relevant regulation is that retained earnings brought forward at the beginning of the fiscal year starting on April 1, 2014 will increase by 0.5 billion yen and the impact on the statement of income for the fiscal year starting on April 1, 2014 is immaterial.
Changes in presentation
(Balance Sheet)
As a result of adoption of the appended form of ”Ordinance for Enforcement of the Banking Act” (Finance Ministry Ordinance No. 10, 1982) which had been revised by “Cabinet Office Ordinance Partially Revising Regulations on Ordinance for Enforcement of the Banking Act” (Cabinet Office Ordinance No. 63, September 27, 2013), “Prepaid Pension Cost” which had been included in “Prepaid expenses“ of Other assets up to the prior fiscal year has been separately listed effective from the current fiscal year. Balance sheet as of March 31, 2013 shown in above includes the reclassification from this change. As a result, 4667 million yen of ”Prepaid expenses” in Other assets shown in balance sheet disclosed in prior year are reclassified to 2,782 million yen of “Prepaid Pension Cost” and 1,884 million yen of “Prepaid expenses”.
46
Notes to Balance Sheet 1. For securities held as collateral under “receivables under resale agreements” and “derivative transactions” which
can be sold or pledged without restrictions, 13,007 million yen were pledged and 754,645 million yen were held by CJL as of March 31, 2014.
2. There was no Bankrupt loans. Past due loans/non-accrual loans were 1,264 million yen.
“Bankrupt loans” are loans on which accrued interest income is not recognized as there is substantial doubt about the ultimate collectability of either principal or interest because they are past due for a considerable period of time or for other reasons (excluding write-offs, hereinafter “non-accrual loans”), and as defined in Article 96-1-3 and 96-1-4 of the Enforcement Ordinance of the Japanese Corporate Tax Law. “Past due loans/non-accrual loans” are loans on which accrued interest income is not recognized, excluding “Bankrupt loans” and loans on which interest payments are deferred in order to support the borrowers’ recovery from financial difficulties.
3. Past due loans (3 months or more) totaled 1,181 million yen. “Past due loans (3 months or more)” are loans on which the principal or interest is past due for three months or more, excluding “Bankrupt loans” and “Past due loans/non-accrual loans”.
4. Restructured loans totaled 36 million yen. “Restructured loans” are loans on which terms and conditions have been amended in favor of the borrowers (e.g. reduction of the original interest rate, deferral of interest payments, extension of principal repayments or debt forgiveness) in order to support the borrowers’ recovery from financial difficulties, excluding “Bankrupt loans,” “Past due loans/non-accrual loans” and “Past due loans (3 months or more)”.
5. The total amount of “Bankrupt loans”, “Past due loans/non-accrual loans”, “Past due loans (3 months or more)” and
“Restructured loans” were 2,482 million yen. Claims shown from 2 to 5 are the amounts before the appropriate allowance.
6. Bills discounted are treated as financial transactions in accordance with JICPA Industry Audit Committee Report
No.24. CJL has rights to sell or pledge bank acceptance bought, commercial bills discounted, documentary bills and foreign bills bought without restrictions. The total face value was 74,140 million yen.
7. AFS securities of 764,446 million yen and Trading assets of 141,042 million yen were pledged as collateral for
settlements of FX transactions. In addition, other assets include Cash collateral paid for financial instruments of 12,686 million yen, initial margins of futures markets 57 million yen and other guarantee deposits of 5,157 million yen.
8. Overdraft facilities and commitment line contracts on loans are agreements to lend to customers up to a prescribed
amount, as long as there is no violation of any condition established in the contracts. The amount of unused commitments was 382,710 million yen and the amount of those with remaining period within one year was 294,291 million yen. Since many of these commitments are expected to expire without being drawn upon, the total amount of unused commitments does not necessarily represent actual future cash flow requirements. Many of these commitments include clauses under which we can reject an application from customers or reduce the contract amounts in the event that economic conditions change, we need to secure claims, or other events occur. In addition, we may request the customers to pledge collateral such as premises and securities at the time of the contracts, and take necessary measures such as monitoring customers’ financial positions, revising contracts when need arises and securing claims after contracts are made on a periodic basis.
9. Accumulated depreciation on tangible fixed assets: 7,289 million yen. 10. Non-cancellable operating lease is as follows;
Future minimum rental payments; Within one year 770 million yen Over one year 983 million yen
11. Monetary assets to affiliates amounted to 580,491 million yen.
47

12. Monetary liabilities to affiliates amounted to 659,945 million yen.
13. Dividend is subject to the limitation of article 18 of the Banking law. Under the Banking law of Japan, 20% of the retained earnings decreased by dividends shall be appropriated as a Legal retained earnings until the aggregate amount of Legal capital surplus and Legal retained earnings equals the amount of Capital stock.
48
Notes to Statement of Income 1. Income from transactions with affiliates
Total income of funding transaction 15,496 million yen Total income of fees and commissions 1,917 million yen Total income of other ordinary transactions 11,761 million yen Total income of other transactions 4 million yen
Expenses from transactions with affiliates Total expenses of funding transaction 1,131 million yen Total expenses of fees and commissions 288 million yen Total expenses of other transactions 5,668 million yen
2. Information with respect to related party transaction is as follows.
Settlement offoreign
exchange
64,056 (*2)
Due toforeign banks
(their accounts)274,006
Businesstransaction
&interest
42,980 (*2)
0
Deposit
Accruedexpenses
62,772
0
Fx&
Derivative
74,736 (*3)
Otherliabilities
74,736
Businesstransaction
&interest
529,128 (*2)
1,114
Deposit
Accruedexpenses
291,406
192
Businesstransaction
&interest
729,070 (*2)
15,171
Due from banks
Accruedincome
484,004
1,777
Funding /Lending
―100%
(indirect)Banking
USD 751Million
SouthDakota,United
States ofAmerica
Citibank,N.A.
Parent
Amount(million yen)
Name ofaccount
Balance atYear end
(million yen)Directors BusinessBusiness
Percentage ofstocks owned
Content of relationsDescription of
transactionRelation Name Address Capital
Subsidiaryof
parent
CitigroupJapan
HoldingsCorp.
Chiyoda-ku,
Tokyo
300,000Million Yen
Holdingcompany
―Double-hatted
Funding /Lending
Guarantees&
fee
―
4
Customers’liabilities foracceptances
and guarantees
Unearnedrevenue
5,713
2
Fx&
Derivative
50,904 (*3)
OtherAssets
50,904
*1 Condition of transactions and its policy are decided as same as third party transactions. *2 Average balance for amount of transaction *3 Valuation difference based on year end market rate.
49
Notes to Statement of Changes in Net Assets 1. The types and number of our shares outstanding are as follows:
(Thousands of Shares)
Number of shares
at beginning of the
period
Number of shares
increased during
the period
Number of shares
decreased during
the period
Number of shares
at end of the
period
Memo
Common stock 244,200,000 - - 244,200,000
Total 244,200,000 - - 244,200,000
2. Retained earnings decreased by 6,400 million yen due to interim dividend on October 28, 2013. Details are as
follows.
Date of resolution Type of shares Cash dividends
(Millions of Yen)
Cash dividends per
share (Yen) Record date Effective date
Meeting of the Board of
Directors held on October
10, 2013
Common
stock 6,400 0.02 - October 28, 2013
Notes to Statement of Cash flow Cash and Cash Equivalents consist of cash and due from Bank of Japan included in Cash and Due from Banks on the balance sheet.
As of March 31, 2014 (Millions of Yen)
Cash and Due from Banks 1,841,877
Due from Banks excluding Bank of Japan (561,439)
Cash and Cash Equivalents 1,280,438
50
Notes related to Financial Instruments 1.Disclosure on Financial Instruments
(1) Policy on Financial Instruments CJL is engaged in banking operations such as deposit taking business, credit extension business including loans, fund transfer and clearing business both in Yen and foreign currencies and investment business including marketable securities. The ALM, Asset and Liability Management, in CJL has related across these listed businesses. CJL has conducted integrated management of the Banking Portfolio, as ALM, for the purpose of managing interest rate and fx risk associated with market movement and liquidity risk from mismatch of future cash flows. Also it aims to minimize funding cost and maximize investment returns. As part of this effort, CJL enters into certain derivative transactions. As the banking portfolio in CJL, liabilities are sourced mainly from deposits both retail and corporate customers. And in asset, it has invested into securities, mainly in Japanese Government Bond (JGB), loans of customers and deposits to Citibank, N.A. entities.
(2) Types of and Risks associated with Financial Instruments A majority of financial assets that CJL holds are loans to corporate and retail customers in Japan and overseas, the securities and placements to the bank subsidiaries of Citigroup Inc. to which CJL belongs. Loans to corporate and retail customers in Japan and overseas, for which CJL is exposed to credit risks potentially arising from the obligors' default and also there are risks on material adverse changes in economics, politics, and social environments. Securities are mainly low credit risk Japanese government bonds. These are exposed to interest rate risk and market price risks. A majority of financing source of CJL is a stable source of deposits from retail and corporate customers, and group companies. They are exposed to liquidity risk where we may not be able to be repaid timely on maturities. Interest rate exposure is managed by establishing risk limits, etc. Derivative contracts include interest rate swaps, currency swaps, and forward FX for ALM purpose. In addition, we have trading bonds as well as trading positions that include interest rate related derivatives and currency related derivatives. These financial products are exposed to interest rate risk, foreign exchange rate risk, price risk and credit risk, etc.
(3) Risk Management System relating to Financial Instruments
① Credit Risk Management
CJL establishes consistent risk management framework and controls credit risks related to loans etc. by credit analysis conducted on transaction basis, controlling credit line, credit information, internal obligor risk rating, pledge of guarantee and collateral and managing classified or delinquent accounts, in accordance with Credit Risk Management Policy and related rules and procedures. Credit risk control aforementioned is conducted by Risk Management Division and will be reported to Credit Risk Management Committee (“CRMC”, as a sub-committee of the Management Committee) and Board of Directors’ meeting (“BOD”), which is taken place regularly. Moreover, the process of credit risk control is assessed by internal auditor periodically. Credit risk of issuers and counterparty risk of derivatives are controlled and monitored by Credit Risk Management Services Unit and Portfolio Management Unit in Risk Management Division by obtaining credit information and marked-to market periodically.
② Market Risk Management
(A) Risk Management of Banking Book CJL manages interest-rate risks on banking book through ALM. The risk management methods and procedures are clearly described in the "Market Risk Management for Accrual Portfolios Policy and Standards". CJL monitors and reviews its activity implementation status, also discusses action plans in the monthly Asset Liability Committee (“ALCO”) meeting as per the ALCO Regulation which has been approved by the Management Committee. On a day to day basis, Market Risk Management Unit captures consolidated profiles of interest rates and durations of the financial assets and liabilities, performs risk monitoring process using the gap analysis and interest rate factor sensitivity analysis, and reports the results to the ALCO meeting on a monthly basis. For the purpose of hedging interest rate risks, CJL transacts some derivative trades such as interest rate swaps.
(B) Risk Management of Trading Book
CJL mainly manages interest-rate risks and foreign exchange price risks on trading book following the Market Risk Management Policy and ALCO Regulation approved by Management Committee. CJL's market risk amount is measured by Value-at-Risk (“VaR”) method and its regulated compliance status is monitored and reported to ALCO meeting on a monthly basis.
51
(C) Quantitative information on Market Risks
a) Trading purpose financial instruments CJL adopted the Monte Carlo Method that simulates variance and covariance estimated from the historical times series data for VaR calculation (holding period of one day, with the confidence level of 99%) for trading purpose securities and trading purpose derivative products. CJL market risk amount for trading activities (probable loss amount) as of March 31, 2014 was 108 million yen. CJL also conducts VaR back testing which is a comparative analysis of the VaR result calculated by the validated model against the actual profit and loss (P&L). As per the VaR back testing result for the period of April 2013 through March 2014, one exception was observed. However, VaR still may not pick up all probability of event under unpredictable market conditions so long as it is based on the certain probability calculated by statistical method using historical market movement.
b) Non-trading purpose financial instruments
In CJL, the main financial instruments which to be influenced by interest rates as one of the key risk variables are, “Placements”, "Loans and bills discounted", "AFS securities", "Deposits", “Negotiable certificate of deposits”, "Borrowings" and "Reverse Repo". On the financial Assets and Liabilities, CJL calculates the effect amounts on profits and losses in the next one year when simulating reasonably expected moving range in the quantitative analysis for the purpose of managing interest rate risks. With respect to the revenue effect amount calculation, CJL splits respective financial asset and liability balances into groups of fixed or floating rate groups by tenor buckets responding to holding maturities and applies the interest rate moves by tenors. CJL has exercised results that the net income before taxes would increase by 4,135 million yen on the scenario that interest rate to increase by 100 basis points (1%) for total portfolio, by 3,267 million yen on the scenario that benchmark JPY interest rate to increase by 100 basis points (1%) as of March 31, 2014. On the same basis, CJL's net income before taxes would increase by 1,033 million yen on the scenario that benchmark USD interest rate to increase by 100 basis points (1%). These results are based on the stable risk variables excluding interest rates, and no correlation between interest rates and other risk variables are considered in the calculation. In case of any unexpected moves over the 100 basis points (1%) moving range, there can be larger effect than the reported effect amounts on P&L.
③ Management of Liquidity Risk associated with Funding Activities
Liquidity risk management has been regulated by related policies and procedures. ALCO, which is subject to supervision of the Management Committee, has been constituted to ensure that CJL maintains adequate liquidity, has sufficient capital to meet regulatory and business needs, has appropriate funding for business growth. ALCO's monitoring and reviewing of capital, liquidity, balance sheet and the banking account management is an integral part of the overall risk management framework of CJL.
(4) Supplement Explanation for Fair Value of Financial Instruments
Fair value of financial instruments includes market prices as well as reasonably calculated prices in cases where there are no market prices available. Since the calculations of such prices are implemented under certain conditions and assumptions, the result of calculations may vary if different assumptions are used.
52
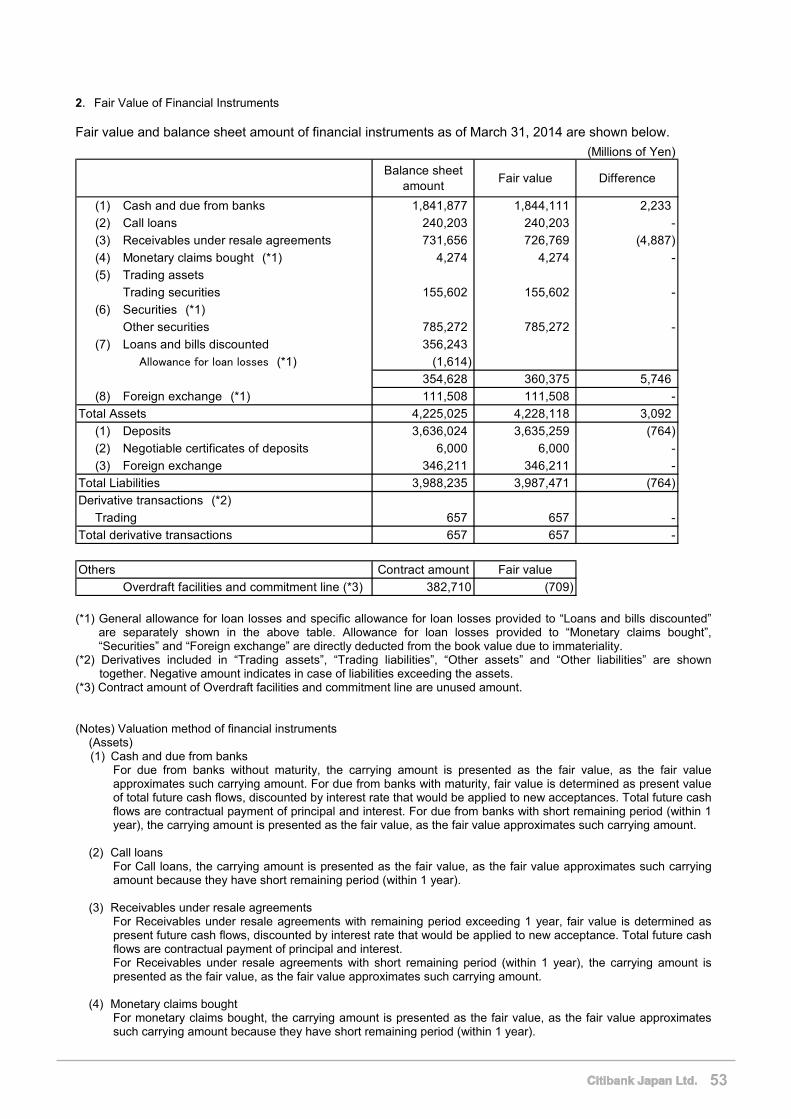
2.Fair Value of Financial Instruments Fair value and balance sheet amount of financial instruments as of March 31, 2014 are shown below.
(Millions of Yen)
Balance sheetamount
Fair value Difference
(1) Cash and due from banks 1,841,877 1,844,111 2,233
(2) Call loans 240,203 240,203 -
(3) Receivables under resale agreements 731,656 726,769 (4,887)
(4) Monetary claims bought (*1) 4,274 4,274 -
(5) Trading assets
Trading securities 155,602 155,602 -
(6) Securities (*1)
Other securities 785,272 785,272 -
(7) Loans and bills discounted 356,243
Allowance for loan losses (*1) (1,614)
354,628 360,375 5,746
(8) Foreign exchange (*1) 111,508 111,508 -
Total Assets 4,225,025 4,228,118 3,092
(1) Deposits 3,636,024 3,635,259 (764)
(2) Negotiable certificates of deposits 6,000 6,000 -
(3) Foreign exchange 346,211 346,211 -
Total Liabilities 3,988,235 3,987,471 (764)
Derivative transactions (*2)
Trading 657 657 -
Total derivative transactions 657 657 -
Others Contract amount Fair value
Overdraft facilities and commitment line (*3) 382,710 (709) (*1) General allowance for loan losses and specific allowance for loan losses provided to “Loans and bills discounted”
are separately shown in the above table. Allowance for loan losses provided to “Monetary claims bought”, “Securities” and “Foreign exchange” are directly deducted from the book value due to immateriality.
(*2) Derivatives included in “Trading assets”, “Trading liabilities”, “Other assets” and “Other liabilities” are shown together. Negative amount indicates in case of liabilities exceeding the assets.
(*3) Contract amount of Overdraft facilities and commitment line are unused amount. (Notes) Valuation method of financial instruments
(Assets) (1) Cash and due from banks
For due from banks without maturity, the carrying amount is presented as the fair value, as the fair value approximates such carrying amount. For due from banks with maturity, fair value is determined as present value of total future cash flows, discounted by interest rate that would be applied to new acceptances. Total future cash flows are contractual payment of principal and interest. For due from banks with short remaining period (within 1 year), the carrying amount is presented as the fair value, as the fair value approximates such carrying amount.
(2) Call loans For Call loans, the carrying amount is presented as the fair value, as the fair value approximates such carrying amount because they have short remaining period (within 1 year).
(3) Receivables under resale agreements For Receivables under resale agreements with remaining period exceeding 1 year, fair value is determined as present future cash flows, discounted by interest rate that would be applied to new acceptance. Total future cash flows are contractual payment of principal and interest. For Receivables under resale agreements with short remaining period (within 1 year), the carrying amount is presented as the fair value, as the fair value approximates such carrying amount.
(4) Monetary claims bought
For monetary claims bought, the carrying amount is presented as the fair value, as the fair value approximates such carrying amount because they have short remaining period (within 1 year).
53
(5) Trading assets For securities such as bonds that are held for trading, the fair value is calculated based on their market prices.
(6) Securities For securities such as bonds that are available for sale, the fair value is calculated based on their market prices.
(7) Loans and bills discounted
For loans without maturity, the carrying amount is presented as the fair value, as the fair value approximates such carrying amount because of their estimated maturity length and the interest rate conditions. For loans with short remaining period (within 1 year), the carrying amount is presented as the fair value, as the fair value approximates such carrying amount. For loan with remaining period exceeding 1 year, fair value is determined as present value of total future cash flows, discounted by interest rate that would be applied to newly accepted loans. Total future cash flows are contractual payment of principal and interest. As for the loans to bankrupt, de facto bankrupt, and potentially bankrupt borrowers, credit loss is estimated based on factors such as the present value of expected future cash flow or the expected amount to be collected from collaterals and guarantees. Since the fair value of these items approximates the carrying amount net of the currently expected credit loss amount, such carrying amount is presented as the fair value.
(8) Foreign exchange Foreign exchanges consist of foreign currency deposits with other banks (due from other foreign banks), short-term loans involving foreign currencies (due from other foreign banks), export bills etc. (purchased foreign bills), and loans on notes using import bills (foreign bills receivables). For these items, the carrying amount is presented as the fair value, as the fair value approximates such carrying amount because most of these items are deposits without maturity or have short contract term (within 1 year).
(Liabilities) (1) Deposits (2) Negotiable certificate of deposits
For demand deposits, the amount payable on demand as of balance sheet date is considered to be the fair value. Time deposits are grouped by certain maturity lengths. The fair value of such deposits is the present value discounted by expected future cash flow. The discount rate is the risk free rates adjusted with funding spread of CJL as of balance sheet date. For deposits with short remaining period (within 6 months), the carrying amount is presented as the fair value as the fair value approximates such carrying amount.
(3) Foreign exchange Among foreign exchange contracts, foreign currency deposits accepted from other banks and non-resident yen deposits are deposits without maturity. Furthermore, foreign currency short-term borrowing have no maturity. Thus, for the foreign exchanges, the carrying amount is presented as the fair value as the fair value approximates such carrying amount.
(Derivative transactions) Derivatives include interest rate related instruments (interest rate futures, interest rate options, interest rate swaps, etc.), currency related instruments (forward foreign exchange, currency options, currency swaps, etc.) and bond related instruments (bond futures, bonds future options, etc.). Fair value of these derivatives are based on market prices at exchanges, discounted present values, or amount calculated under the option pricing model.
(Others)
For overdraft facilities and commitment line, fair value is the present value discounted by the difference between the expected future cash flow calculated by contractual rate and fee rate that would be applied to newly acceptance at the balance sheet date for the contract with remaining period exceeding 1 year.
54
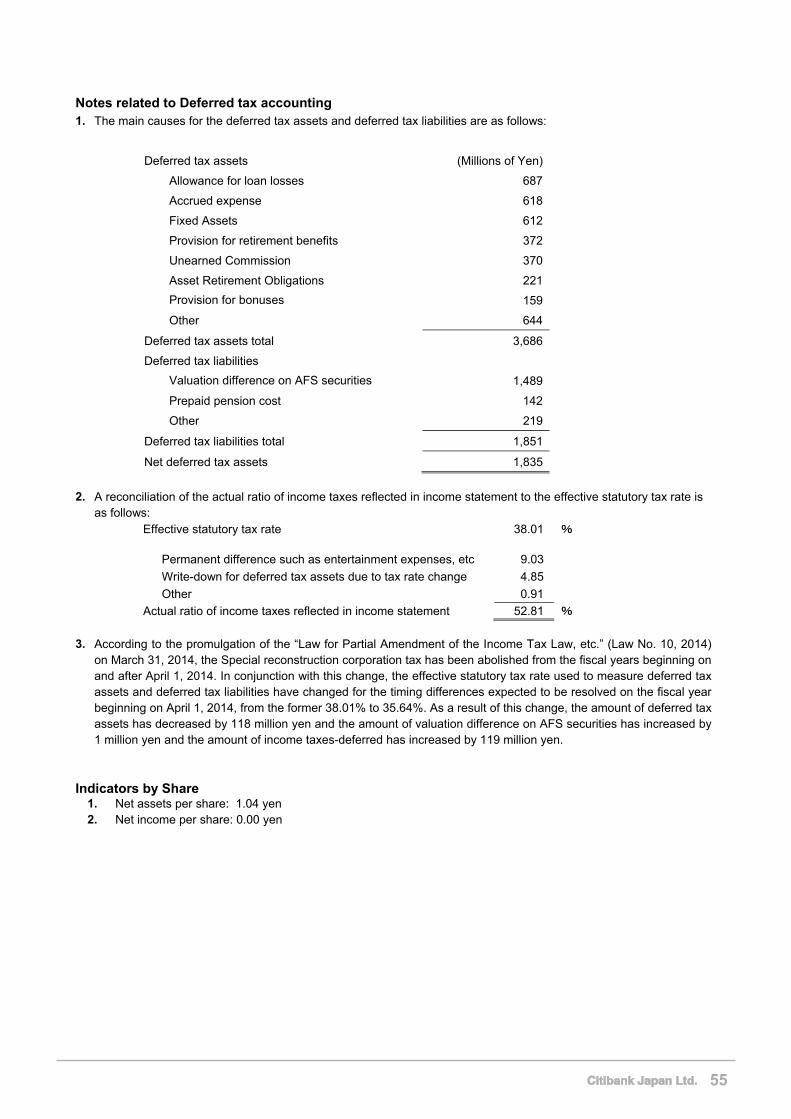
Notes related to Deferred tax accounting 1. The main causes for the deferred tax assets and deferred tax liabilities are as follows:
Deferred tax assets (Millions of Yen)
Allowance for loan losses 687
Accrued expense 618
Fixed Assets 612
Provision for retirement benefits 372
Unearned Commission 370
Asset Retirement Obligations 221
Provision for bonuses 159
Other 644
Deferred tax assets total 3,686
Deferred tax liabilities
Valuation difference on AFS securities 1,489
Prepaid pension cost 142
Other 219
Deferred tax liabilities total 1,851
Net deferred tax assets 1,835
2. A reconciliation of the actual ratio of income taxes reflected in income statement to the effective statutory tax rate is
as follows: Effective statutory tax rate 38.01 % Permanent difference such as entertainment expenses, etc 9.03
Write-down for deferred tax assets due to tax rate change 4.85
Other 0.91
Actual ratio of income taxes reflected in income statement 52.81 %
3. According to the promulgation of the “Law for Partial Amendment of the Income Tax Law, etc.” (Law No. 10, 2014)
on March 31, 2014, the Special reconstruction corporation tax has been abolished from the fiscal years beginning on and after April 1, 2014. In conjunction with this change, the effective statutory tax rate used to measure deferred tax assets and deferred tax liabilities have changed for the timing differences expected to be resolved on the fiscal year beginning on April 1, 2014, from the former 38.01% to 35.64%. As a result of this change, the amount of deferred tax assets has decreased by 118 million yen and the amount of valuation difference on AFS securities has increased by 1 million yen and the amount of income taxes-deferred has increased by 119 million yen.
Indicators by Share
1. Net assets per share: 1.04 yen 2. Net income per share: 0.00 yen
55
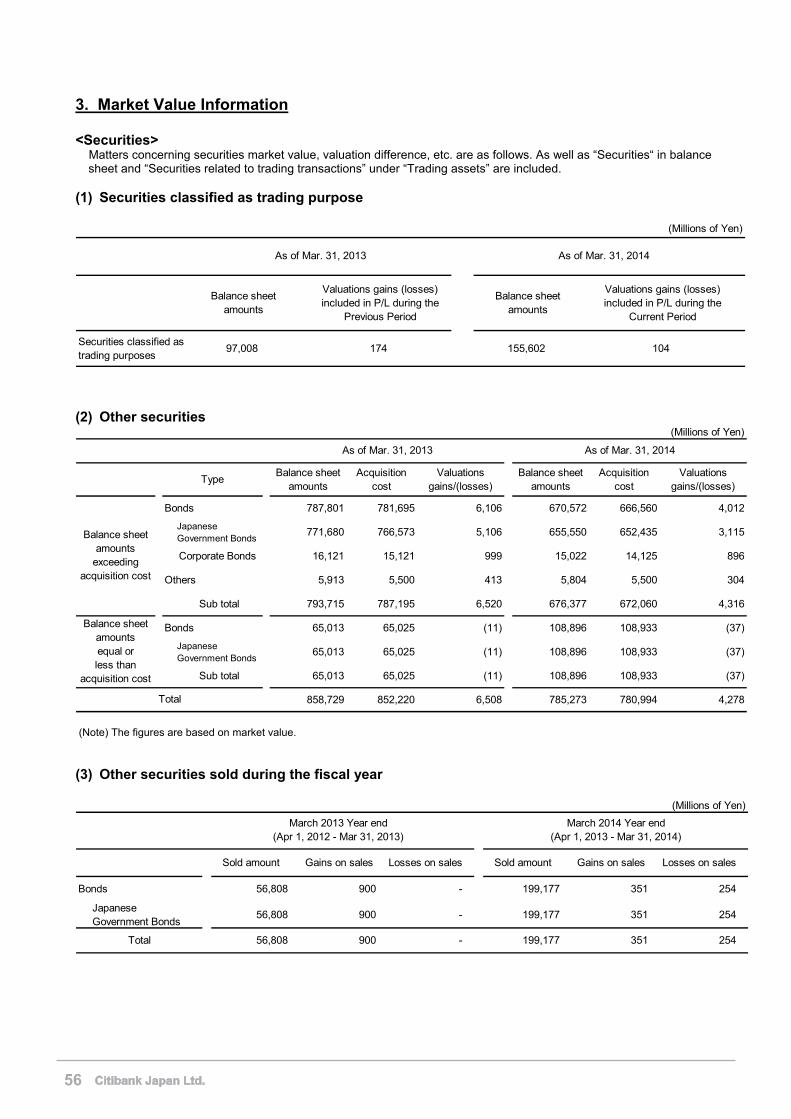
3. Market Value Information <Securities>
Matters concerning securities market value, valuation difference, etc. are as follows. As well as “Securities“ in balance sheet and “Securities related to trading transactions” under “Trading assets” are included.
(1) Securities classified as trading purpose
(Millions of Yen)
Balance sheetamounts
Valuations gains (losses)included in P/L during the
Previous Period
Balance sheetamounts
Valuations gains (losses)included in P/L during the
Current Period
Securities classified astrading purposes
97,008 174 155,602 104
As of Mar. 31, 2013 As of Mar. 31, 2014
(2) Other securities (Millions of Yen)
TypeBalance sheet
amountsAcquisition
costValuations
gains/(losses)Balance sheet
amountsAcquisition
costValuations
gains/(losses)
Bonds 787,801 781,695 6,106 670,572 666,560 4,012
Japanese Government Bonds
771,680 766,573 5,106 655,550 652,435 3,115
Corporate Bonds 16,121 15,121 999 15,022 14,125 896
Others 5,913 5,500 413 5,804 5,500 304
Sub total 793,715 787,195 6,520 676,377 672,060 4,316
Bonds 65,013 65,025 (11) 108,896 108,933 (37)
Japanese Government Bonds
65,013 65,025 (11) 108,896 108,933 (37)
Sub total 65,013 65,025 (11) 108,896 108,933 (37)
858,729 852,220 6,508 785,273 780,994 4,278
As of Mar. 31, 2014
Total
As of Mar. 31, 2013
Balance sheetamounts
exceedingacquisition cost
Balance sheetamountsequal orless than
acquisition cost
(Note) The figures are based on market value. (3) Other securities sold during the fiscal year
(Millions of Yen)
Sold amount Gains on sales Losses on sales Sold amount Gains on sales Losses on sales
Bonds 56,808 900 - 199,177 351 254
Japanese Government Bonds
56,808 900 - 199,177 351 254
Total 56,808 900 - 199,177 351 254
March 2013 Year end(Apr 1, 2012 - Mar 31, 2013)
March 2014 Year end(Apr 1, 2013 - Mar 31, 2014)
56
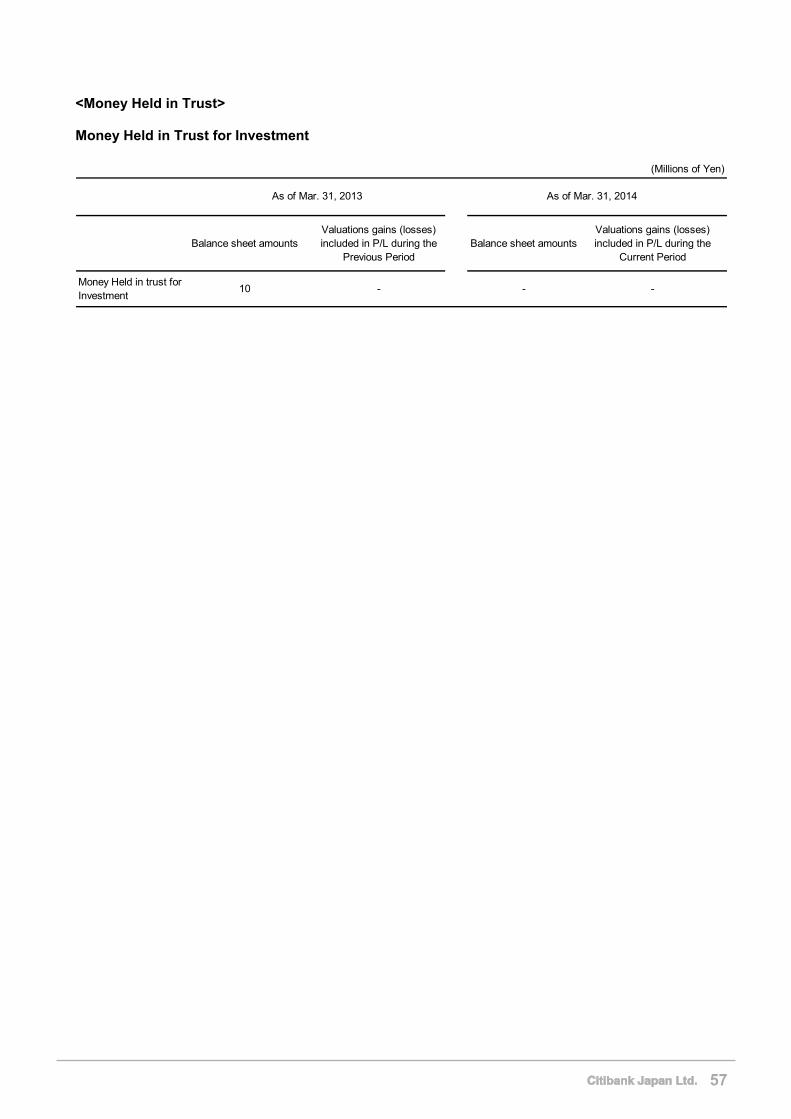
<Money Held in Trust> Money Held in Trust for Investment
(Millions of Yen)
Balance sheet amountsValuations gains (losses)included in P/L during the
Previous PeriodBalance sheet amounts
Valuations gains (losses)included in P/L during the
Current Period
Money Held in trust forInvestment
10 - - -
As of Mar. 31, 2013 As of Mar. 31, 2014
57
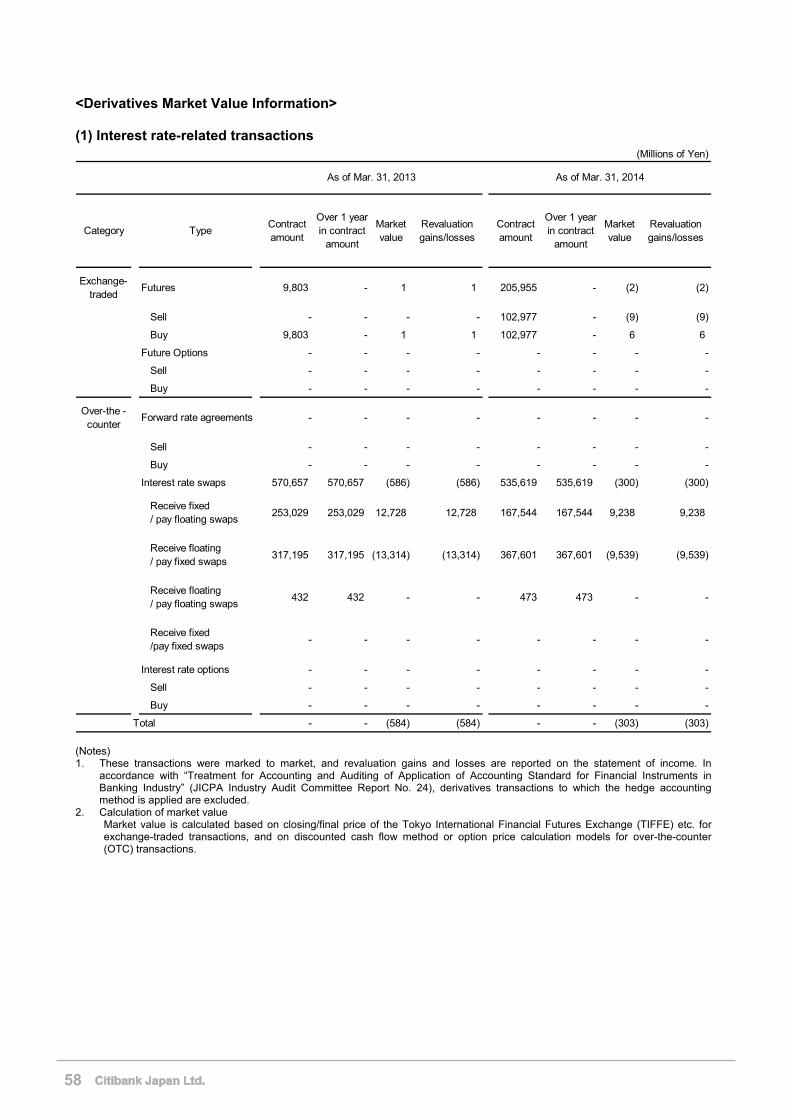
<Derivatives Market Value Information> (1) Interest rate-related transactions
(Millions of Yen)
Category TypeContractamount
Over 1 yearin contract
amount
Marketvalue
Revaluationgains/losses
Contractamount
Over 1 yearin contract
amount
Marketvalue
Revaluationgains/losses
Exchange-traded
Futures 9,803 - 1 1 205,955 - (2) (2)
Sell - - - - 102,977 - (9) (9)
Buy 9,803 - 1 1 102,977 - 6 6
Future Options - - - - - - - -
Sell - - - - - - - -
Buy - - - - - - - -
Over-the -counter
Forward rate agreements - - - - - - - -
Sell - - - - - - - -
Buy - - - - - - - -
Interest rate swaps 570,657 570,657 (586) (586) 535,619 535,619 (300) (300)
Receive fixed/ pay floating swaps
253,029 253,029 12,728 12,728 167,544 167,544 9,238 9,238
Receive floating/ pay fixed swaps
317,195 317,195 (13,314) (13,314) 367,601 367,601 (9,539) (9,539)
Receive floating/ pay floating swaps
432 432 - - 473 473 - -
Receive fixed/pay fixed swaps
- - - - - - - -
Interest rate options - - - - - - - -
Sell - - - - - - - -
Buy - - - - - - - -
Total - - (584) (584) - - (303) (303)
As of Mar. 31, 2013 As of Mar. 31, 2014
(Notes) 1. These transactions were marked to market, and revaluation gains and losses are reported on the statement of income. In
accordance with “Treatment for Accounting and Auditing of Application of Accounting Standard for Financial Instruments in Banking Industry” (JICPA Industry Audit Committee Report No. 24), derivatives transactions to which the hedge accounting method is applied are excluded.
2. Calculation of market value Market value is calculated based on closing/final price of the Tokyo International Financial Futures Exchange (TIFFE) etc. for exchange-traded transactions, and on discounted cash flow method or option price calculation models for over-the-counter (OTC) transactions.
58
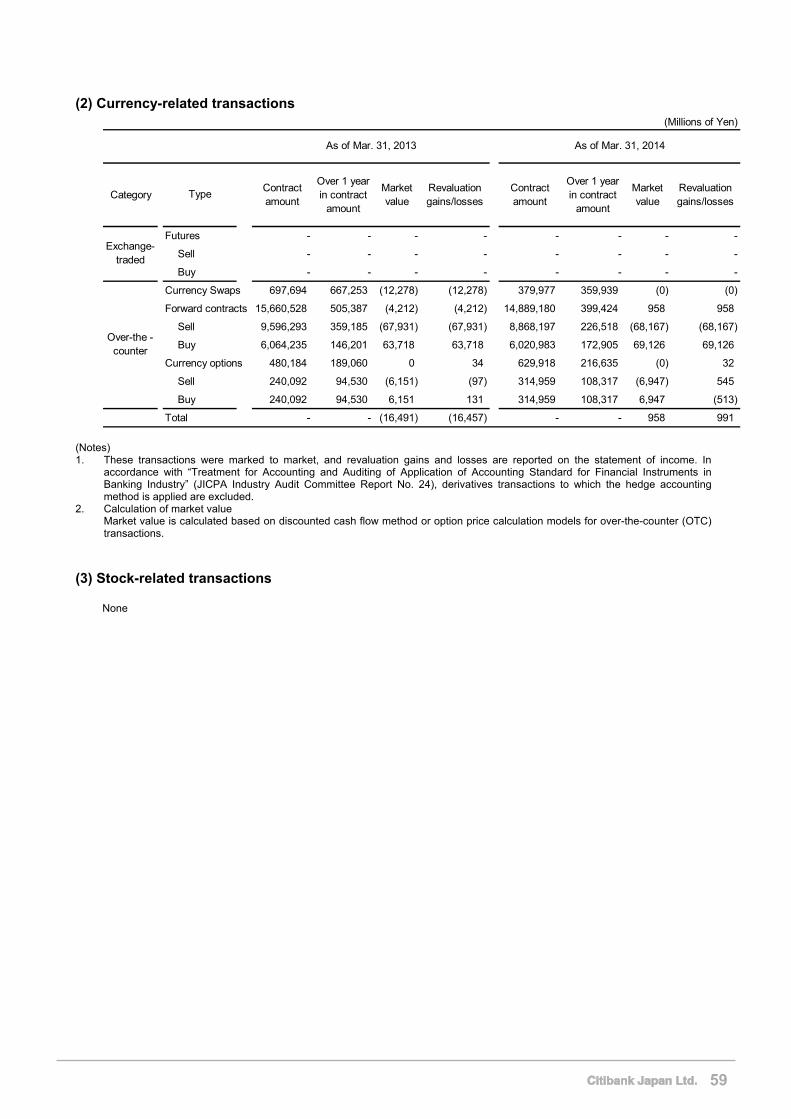
(2) Currency-related transactions (Millions of Yen)
CategoryContractamount
Over 1 yearin contract
amount
Marketvalue
Revaluationgains/losses
Contractamount
Over 1 yearin contract
amount
Marketvalue
Revaluationgains/losses
Futures - - - - - - - -
Sell - - - - - - - -
Buy - - - - - - - -
Currency Swaps 697,694 667,253 (12,278) (12,278) 379,977 359,939 (0) (0)
Forward contracts 15,660,528 505,387 (4,212) (4,212) 14,889,180 399,424 958 958
Sell 9,596,293 359,185 (67,931) (67,931) 8,868,197 226,518 (68,167) (68,167)
Buy 6,064,235 146,201 63,718 63,718 6,020,983 172,905 69,126 69,126
Currency options 480,184 189,060 0 34 629,918 216,635 (0) 32
Sell 240,092 94,530 (6,151) (97) 314,959 108,317 (6,947) 545
Buy 240,092 94,530 6,151 131 314,959 108,317 6,947 (513)
Total - - (16,491) (16,457) - - 958 991
Over-the -counter
As of Mar. 31, 2013 As of Mar. 31, 2014
Type
Exchange-traded
(Notes) 1. These transactions were marked to market, and revaluation gains and losses are reported on the statement of income. In
accordance with “Treatment for Accounting and Auditing of Application of Accounting Standard for Financial Instruments in Banking Industry” (JICPA Industry Audit Committee Report No. 24), derivatives transactions to which the hedge accounting method is applied are excluded.
2. Calculation of market value Market value is calculated based on discounted cash flow method or option price calculation models for over-the-counter (OTC) transactions.
(3) Stock-related transactions
None
59
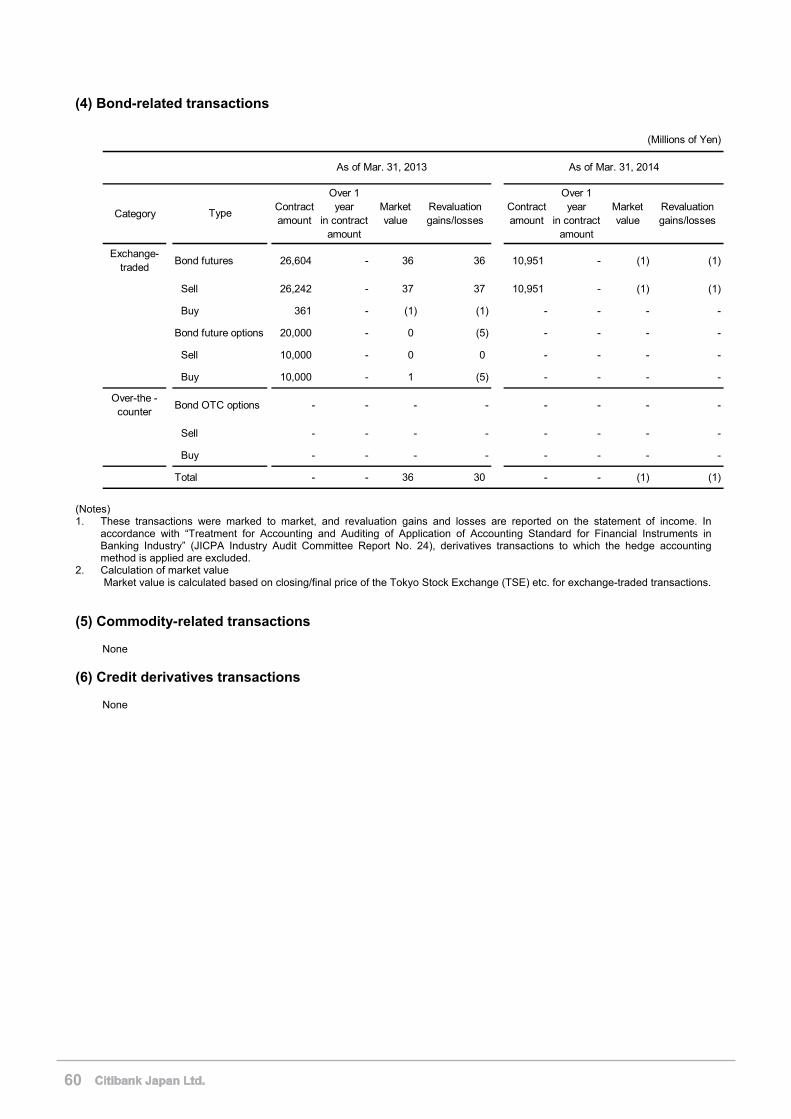
(4) Bond-related transactions
(Millions of Yen)
CategoryContractamount
Over 1year
in contractamount
Marketvalue
Revaluationgains/losses
Contractamount
Over 1year
in contractamount
Marketvalue
Revaluationgains/losses
Exchange-traded
Bond futures 26,604 - 36 36 10,951 - (1) (1)
Sell 26,242 - 37 37 10,951 - (1) (1)
Buy 361 - (1) (1) - - - -
Bond future options 20,000 - 0 (5) - - - -
Sell 10,000 - 0 0 - - - -
Buy 10,000 - 1 (5) - - - -
Over-the -counter
Bond OTC options - - - - - - - -
Sell - - - - - - - -
Buy - - - - - - - -
Total - - 36 30 - - (1) (1)
As of Mar. 31, 2013 As of Mar. 31, 2014
Type
(Notes) 1. These transactions were marked to market, and revaluation gains and losses are reported on the statement of income. In
accordance with “Treatment for Accounting and Auditing of Application of Accounting Standard for Financial Instruments in Banking Industry” (JICPA Industry Audit Committee Report No. 24), derivatives transactions to which the hedge accounting method is applied are excluded.
2. Calculation of market value Market value is calculated based on closing/final price of the Tokyo Stock Exchange (TSE) etc. for exchange-traded transactions.
(5) Commodity-related transactions None
(6) Credit derivatives transactions
None
60

4. Major Shareholders <Major Shareholders>
(As of March 31, 2014)
Name of shareholder Numbers of shares Shareholding ratio
Citibank Overseas Investment Corporation 244,200,000 thousand shares 100%
Total 244,200,000 thousand shares 100%
61
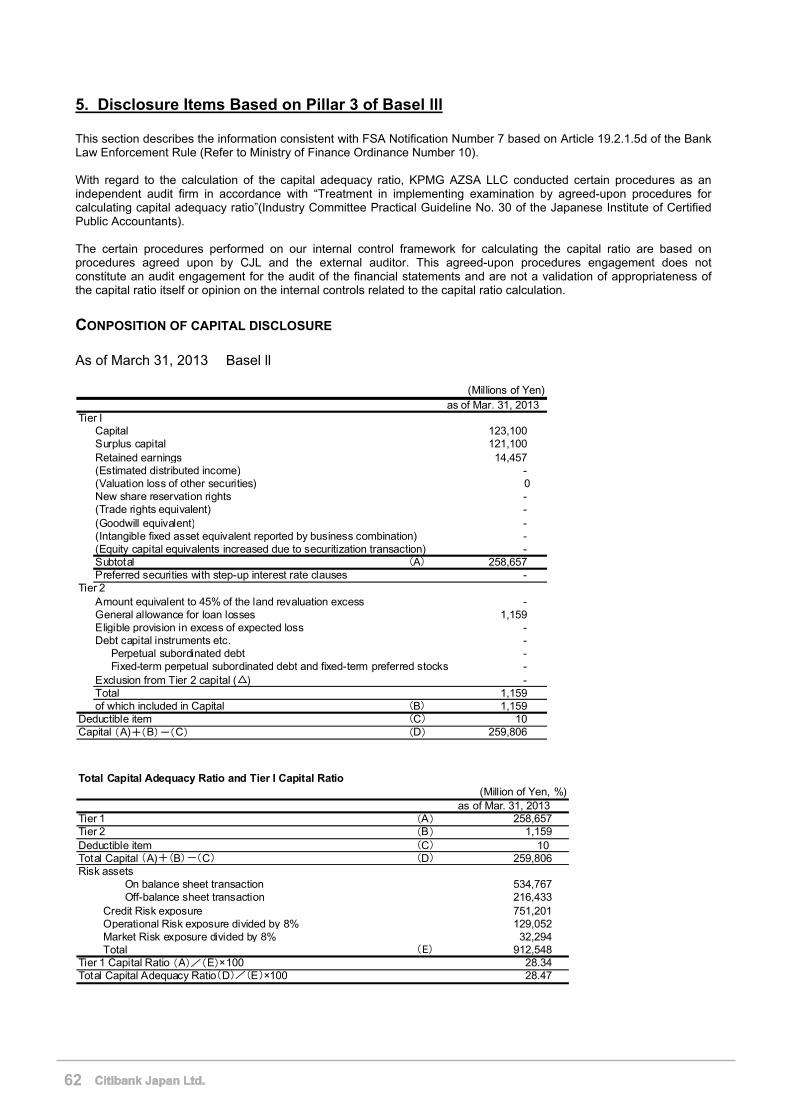
5. Disclosure Items Based on Pillar 3 of Basel lll
This section describes the information consistent with FSA Notification Number 7 based on Article 19.2.1.5d of the Bank Law Enforcement Rule (Refer to Ministry of Finance Ordinance Number 10). With regard to the calculation of the capital adequacy ratio, KPMG AZSA LLC conducted certain procedures as an independent audit firm in accordance with “Treatment in implementing examination by agreed-upon procedures for calculating capital adequacy ratio”(Industry Committee Practical Guideline No. 30 of the Japanese Institute of Certified Public Accountants). The certain procedures performed on our internal control framework for calculating the capital ratio are based on procedures agreed upon by CJL and the external auditor. This agreed-upon procedures engagement does not constitute an audit engagement for the audit of the financial statements and are not a validation of appropriateness of the capital ratio itself or opinion on the internal controls related to the capital ratio calculation.
CONPOSITION OF CAPITAL DISCLOSURE As of March 31, 2013 Basel ll
Tier ICapital 123,100 Surplus capital 121,100 Retained earnings 14,457 (Estimated distributed income) - (Valuation loss of other securities) 0New share reservation rights - (Trade rights equivalent) - (Goodwill equivalent) - (Intangible fixed asset equivalent reported by business combination) - (Equity capital equivalents increased due to securitization transaction) - Subtotal (A) 258,657 Preferred securities with step-up interest rate clauses -
Tier 2Amount equivalent to 45% of the land revaluation excess - General allowance for loan losses 1,159 Eligible provision in excess of expected loss - Debt capital instruments etc. - Perpetual subordinated debt - Fixed-term perpetual subordinated debt and fixed-term preferred stocks - Exclusion from Tier 2 capital (△) - Total 1,159 of which included in Capital (B) 1,159
Deductible item (C) 10 Capital (A)+(B)-(C) (D) 259,806
(Millions of Yen)as of Mar. 31, 2013
Total Capital Adequacy Ratio and Tier I Capital Ratio
Tier 1 (A) 258,657Tier 2 (B) 1,159Deductible item (C) 10 Total Capital (A)+(B)-(C) (D) 259,806Risk assets
On balance sheet transaction 534,767 Off-balance sheet transaction 216,433Credit Risk exposure 751,201Operational Risk exposure divided by 8% 129,052Market Risk exposure divided by 8% 32,294Total (E) 912,548
Tier 1 Capital Ratio (A)/(E)×100 28.34Total Capital Adequacy Ratio(D)/(E)×100 28.47
as of Mar. 31, 2013(Million of Yen, %)
62
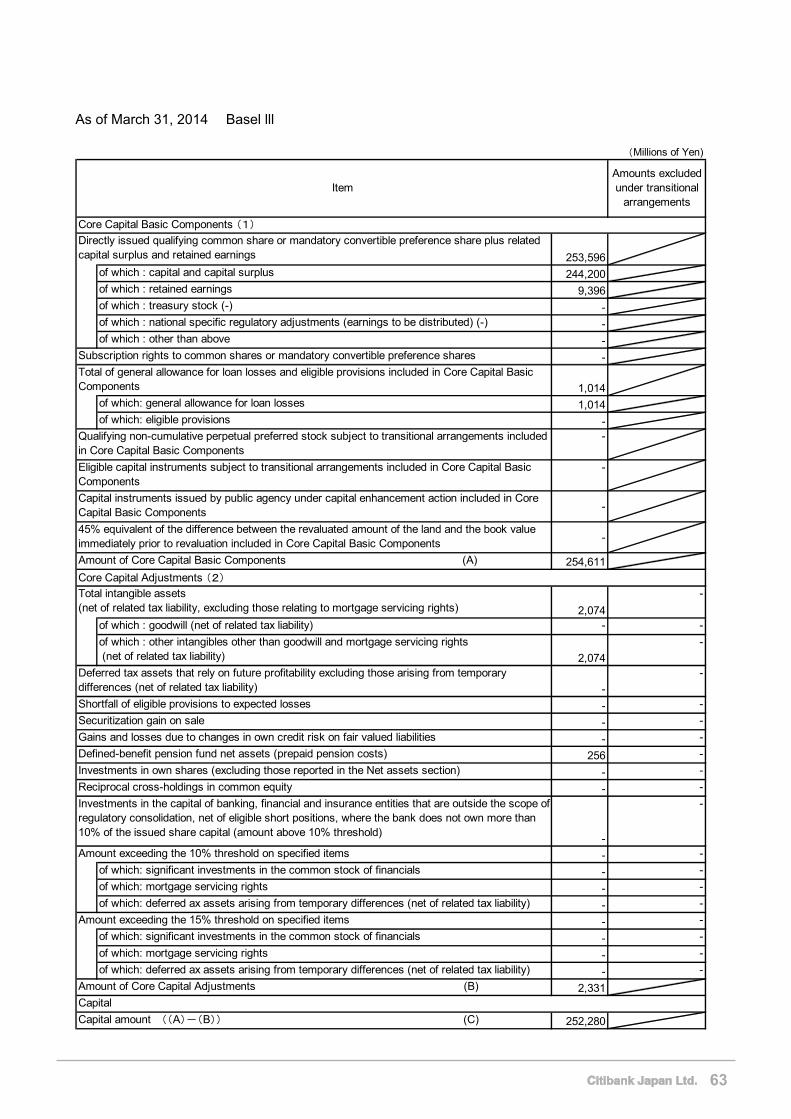
As of March 31, 2014 Basel lll
(Millions of Yen)
253,596
244,200
9,396
-
-
-
-
1,014
1,014
--
-
-
-
254,611
2,074
-
- -
2,074
-
-
-
- -
- -
- -
256 -
- -
- -
-
-
- -
- -
- -
- -
- -
- -
- -
- -
2,331
252,280
Investments in the capital of banking, financial and insurance entities that are outside the scope ofregulatory consolidation, net of eligible short positions, where the bank does not own more than10% of the issued share capital (amount above 10% threshold)
of which: significant investments in the common stock of financials
of which: deferred ax assets arising from temporary differences (net of related tax liability)
of which: mortgage servicing rights
of which: deferred ax assets arising from temporary differences (net of related tax liability)
Amount of Core Capital Basic Components (A)
Deferred tax assets that rely on future profitability excluding those arising from temporarydifferences (net of related tax liability)
Capital amount ((A)-(B)) (C)
Amount of Core Capital Adjustments (B)
Amount exceeding the 15% threshold on specified items
Investments in own shares (excluding those reported in the Net assets section)
Reciprocal cross-holdings in common equity
Total intangible assets(net of related tax liability, excluding those relating to mortgage servicing rights)
Directly issued qualifying common share or mandatory convertible preference share plus relatedcapital surplus and retained earnings
Shortfall of eligible provisions to expected losses
Securitization gain on sale
Gains and losses due to changes in own credit risk on fair valued liabilities
Subscription rights to common shares or mandatory convertible preference shares
of which: eligible provisions
of which: general allowance for loan losses
of which : capital and capital surplus
of which : retained earnings
45% equivalent of the difference between the revaluated amount of the land and the book valueimmediately prior to revaluation included in Core Capital Basic Components
Item
Capital
Amounts excludedunder transitional
arrangements
of which : treasury stock (-)
of which : national specific regulatory adjustments (earnings to be distributed) (-)
of which : other than above
Total of general allowance for loan losses and eligible provisions included in Core Capital BasicComponents
of which: significant investments in the common stock of financials
Defined-benefit pension fund net assets (prepaid pension costs)
of which: mortgage servicing rights
Core Capital Basic Components (1)
Core Capital Adjustments (2)
Amount exceeding the 10% threshold on specified items
of which : other intangibles other than goodwill and mortgage servicing rights (net of related tax liability)
of which : goodwill (net of related tax liability)
Qualifying non-cumulative perpetual preferred stock subject to transitional arrangements includedin Core Capital Basic Components
Eligible capital instruments subject to transitional arrangements included in Core Capital BasicComponents
Capital instruments issued by public agency under capital enhancement action included in CoreCapital Basic Components
63
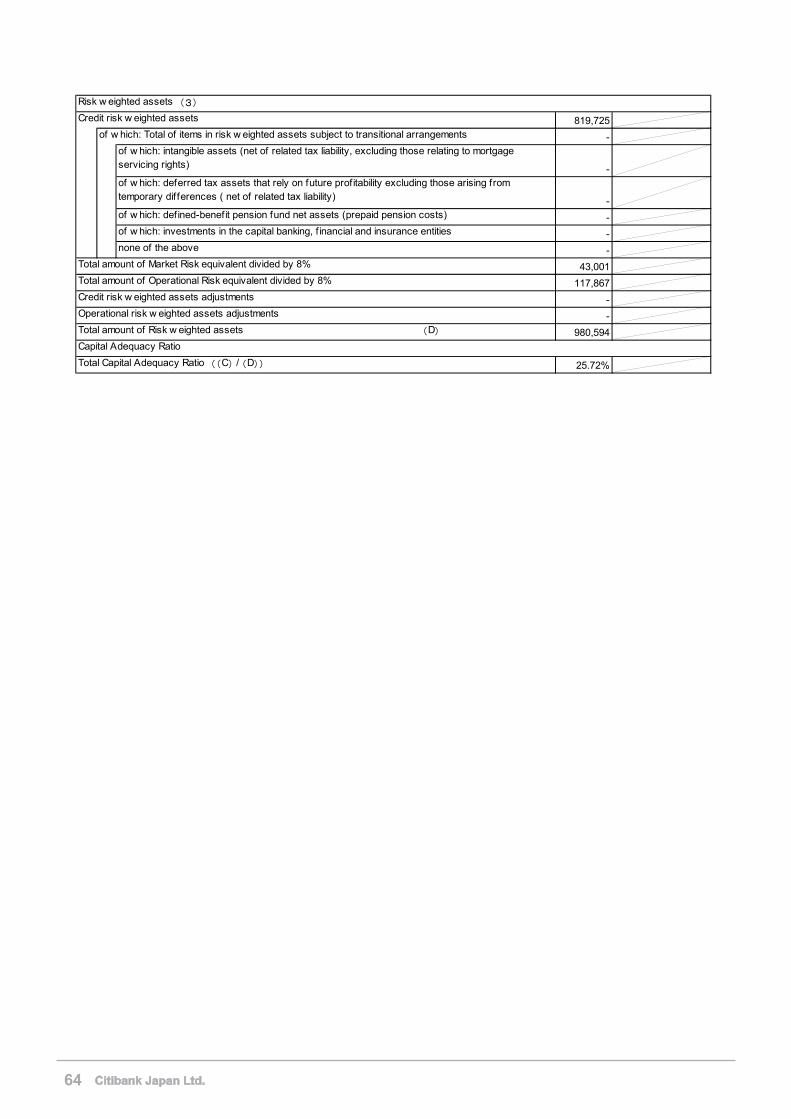
819,725of w hich: Total of items in risk w eighted assets subject to transitional arrangements -
of w hich: intangible assets (net of related tax liability, excluding those relating to mortgageservicing rights) -of w hich: deferred tax assets that rely on future profitability excluding those arising fromtemporary differences ( net of related tax liability) -of w hich: defined-benefit pension fund net assets (prepaid pension costs) -of w hich: investments in the capital banking, f inancial and insurance entities -none of the above -
43,001
117,867
-
-
980,594
25.72%
Operational risk w eighted assets adjustments
Total amount of Market Risk equivalent divided by 8%
Total amount of Operational Risk equivalent divided by 8%
Credit risk w eighted assets adjustments
Total amount of Risk w eighted assets (D)
Total Capital Adequacy Ratio ((C) / (D))
Capital Adequacy Ratio
Credit risk w eighted assets
Risk w eighted assets (3)
64
QUALITATIVE DISCLOSURE (1) Types of Capital Instruments CJL’s capital is solely funded through issuance of common stocks. (2) Capital Adequacy Assessment Process Regulatory capital and risk assets are reported to Management on a monthly basis for verification of the appropriateness of CJL’s capital adequacy. We believe the current level of CJL’s capital adequacy to be sufficiently high. We aim to maintain our regulatory capital ratio above 10.5%, in accordance with the capital plan approved by the Board of Directors (“BOD”). (3) Credit Risk Management Policies and Procedures 1. Overview of risk management policies and procedure
CJL manages its credit risk in accordance with the established “Credit Risk Management Policies”. We manage credit risk based on credit risk analysis if each customer and also manage credit risk on a portfolio basis, monitoring concentration of credit to certain industries, ratings, clients or industrial groups and delinquency trend of a portfolio. Such a portfolio view of our credit exposures is reviewed and discussed at the Credit Risk Management Committee (“CRMC”) on a monthly basis, and reported to the MC and BOD. In case a client requests credit extension in excess of the “Limit of Granting of Credit, etc” provided in the Article 13 of the Banking Act, CJL may sell loans (risk participation), sell loans once CJL provided as is the case with loan syndication, or sell loans or obtain bank guarantee in order to reduce the amount of rick capital. However, CJL is not involved in any of measures such as exchange of portfolio or securitization of its own assets at present,
CJL applies the Standardized Approach for the Basel III calculation of credit risk assets. (Corporate Banking Division)
On all the customers to whom credit is extended, CJL assigns Obligor Risk Ratings (“ORR”). On all the credit facilities established, a Facility Risk Rating (“FRR”) is assigned based on the types or nature of a transaction. An FRR can differ from the ORR of the customer in case there is a credit enhancement on that credit facility, etc. The assignment of ORR and establishment of credit facilities are done at the time of initiating a credit relationship. After the credit relationship is initiated, ORR and credit facilities are reviewed at least once a year. For approval of credit facilities (“Credit Approval”), the Credit Policy requires sign off by at least two Credit Officers (“CO”s) or Senior Credit Officers (“SCO”s). COs and SCOs are Bank officers who are given the authority to approve credit. SCOs are appointed by the CRMC and COs are appointed by a SCO. The appointment to CO/SCO is assessed based on his/her working experience in credit-related job functions, experience in credit risk training, credit judgment skills, knowledge, and aptitude. The amount of credit a SCO can approve depends on the authorized “Approval Level”. CRMC determines the Approval Level based on each officer’s experience and past record. The Level required for Credit Approval is determined by the matrix of the ORR assigned to the customer and the amount of credit facilities proposed. The lower (worse) the ORR and the larger the proposed credit facilities amount, the higher the required Approval Level.
Of the minimum two credit officers required for Credit Approval, at least one must be a Business Sponsoring Officer of the client, who is the account officer for the customer, and the other must be a Risk Management CO/SCO who is independent from business divisions. This requirement is aimed to establish and maintain check and balance mechanism within CJL. (Retail Banking Division) In the Retail Banking Division, the credit approval authority is determined on a product-by-product basis. Credit extension must be approved by COs/SCOs. At least one of COs/SCOs approving the credit must hold the Approval Level for the amount of the proposed credit. Credit approval authority is not granted to officers belonging to Sales, Marketing, Management Control or bank branches. COs and SCOs are Bank officers who are given the authority to approve credit. SCOs are appointed by the CRMC and COs are appointed by a SCO. The appointment to CO/SCO is assessed based on his/her working experience in credit-related job functions, experience in credit risk training, credit judgment skills, knowledge, and aptitude.
65
The Approval Level that is required for Credit Approval is determined by the loan amount and the deviation of a transaction from the prescript credit criteria. The higher the loan amount and the larger the deviation, the higher the required Approval Level. As a part of portfolio level risk management, risk profile of applications and loan disbursements, credit performance are being monitored.
Standard for Allowance for loan losses is described in “6. Standard for Allowance (1). Allowance for loan losses” of “Accounting Policies” which is shown in “2. Financial Statement” section of Financial Information under Japanese GAAP for March 31, 2014
2. The following items on portfolios are subject to the standardized approach
A. Name of the eligible credit rating agency, etc. used to calculate the risk weights (the reason if there has been a change in the eligible credit rating agency used)
Standard & Poor’s Ratings Services (“S&P”), Moody’s Investors Service, Inc. (“Moody’s”) and Organization for Economic Co-operation and Development (“OECD”)
B. Relationship between the type of exposure and eligible credit rating agency, etc., used by type of exposure.
The eligible External Credit Assessment Institutions (“ECAI”) etc., we use by the type of credit exposure are as shown below. i. OECD - Country Risk Score - Exposures to the central government and central bank - Exposures to the Government of Japan and the Bank of Japan - Exposures to financial institution and regulatory security firm that apply to the standards of capital ratio
provided by Basel Committee on Banking Supervision or similar standards to this.
ii. External Rating of S&P and Moody’s - Exposures to corporates - Exposures to financial institutions and regulatory security firm that don't apply to the standards of capital ratio provided by Basel Committee on Banking Supervision or similar standards to this.
(4) Credit Risk Mitigation Policies and Procedures 1. Overall Credit Risk Mitigation
CJL applies a comprehensive Credit Risk Mitigation approach based on the Standardized Approach for the Basel III calculation of credit risk assets. Its credit risk assets and regulatory capital ratio are calculated based on the risk weights and the net exposures, reflected the revaluation of exposures and the devaluation of collaterals. These evaluations are utilized by the haircut value reflecting its volatility risks.
2. Overall Credit Risk Mitigation Control Process
CJL reviews credit facilities at least once a year, and collaterals and ability to perform guarantees are also evaluated periodically for securing its portfolio. Types of collaterals and guarantees are shown in 3. Risk Mitigation Techniques below. At present, CJL does not use credit derivatives in its calculation of its risk assets and regulatory capital ratio. CJL takes into account bilateral netting agreements as risk mitigation measures for derivatives and repo transactions, if they are effective in light of regulation, etc. of the transaction country.
3. Risk Mitigation Techniques
A. Eligible financial assets as collaterals
The following assets that satisfy all the conditions stipulated by the FSA Notice No.19 of 2006 Article 89 and 90 are used as eligible collateral to reduce risk assets. Cash, deposits with CJL, gold, debt securities and equity securities.
B. Guarantees
The guarantee provided by the government, the central bank, government agencies which meet to all the conditions stipulated by the FSA Notice No.19 of 2006 Article 118, 119, and 122 must be met.
66
C. On-balance netting
Exposures that are used to calculate capital ratio shall be netted with deposits if whose exposures meet all the conditions stipulated by the FSA Notice No.19 of 2006 Article 117.
(5) Policies and Procedures for Counterparties of Derivative Products and Transactions with a
Long-Horizon Settlement Period 1. Credit risks of counterparties
Credit risk of Counterparty Pre-Settlement Risk is defined as the sum of current replacement costs based on mark-to-market and a simulated amount of potential increase due to the future fluctuation of market value until settlement date.
2. Management of credit facilities
Counterparty credit facilities for derivative transactions, etc. are managed as part of total credit facilities, together with all credit facilities for on-balance sheet transactions etc..
3. Protection by collateral and policy for loss reserve
CJL has ISDA Credit Support Annex (“CSA”) concluded with a number of financial institutions. CJL carries Derivative Transactions at fair value, for which CJL does not establish loss reserve. CJL does not have Transactions with a Long-Horizon Settlement Period.
(6) Securitization Exposure Risk Management Policies and Procedures
1. CJL’s engagement for securitization transactions
CJL’s engagement in securitization transactions can be described as follows:
A. Originator
CJL is not engaged in any securitization transaction of loan receivables for its own funding purposes or balance sheet management.
B. Investor
CJL has a framework to hold securitization exposure through arranging and providing funds to various securitization transactions (ABL, Asset Backed Commercial Paper (“ABCP”), etc.) that its clients undertake for funding purpose.
C. Swap provider
CJL may provide foreign exchange forwards or interest rate swaps to mitigate the issuer’s foreign exchange or interest rate in the securitization transactions arranged by CJL.
D. Others
CJL provides certain types of commitment lines related to liquidity facilities covering securitization transactions arranged by CJL, in connection with the ABCP business, etc.
2. Overview of risk management policies, risk characteristics, and monitoring system (including its
operational status) With regard to holding securitization exposure, CJL applies internal ratings and makes evaluations by assessing each such transactions and carefully managing the exposure together with other direct loan assets, in addition to capturing accurate understanding of the actual risk profile through due diligence from the viewpoint of investors. CJL will analyze and periodically monitor the credit risk amount of securitization transaction in the same manner as with other standard credit exposures. Also, CJL recognizes that credit risks related to CJL’s securitization transactions include those associated with committed facilities, in case CJL commits to supply funds when funding through the ABCP market becomes unavailable for certain reasons. In the case of such committed facilities provided to securitization transactions, the
67
primary source of repayment is cash, etc to be collected from the securitized assets. Therefore, the credit risk of committed facilities provided to securitization transactions is defined as the risk of being unable to recover the amount of credit extended from the securitized assets in the full amount. CJL manages credit risk in the case of committed facilities provided to securitization transactions through: (1) setting the ratio of the future cash flows from the securitized assets to the securitization exposure amount sufficiently high to cover expected credit loss (over-collateralization); (2) ensuring any other necessary credit enhancement; and (3) monitoring appropriately after the execution. Such risk management procedures are the same for the loans extended to securitization transactions arranged by CJL CJL mainly uses special purpose companies (SPC) or Japanese Trusts as the securitization conduit when undertaking securitization transactions associated with third party assets. As to credit risk management of foreign exchange forwards or interest rate swaps associated with securitization transactions, the policies and procedures are the same as for those transactions not associated with securitization transactions
3. Name of the approach used by CJL to calculate the amount of credit risk assets in securitization
exposures The Standardized Approach
4. Accounting policies for securitization transactions
CJL complies with Accounting Standard Board of Japan Statement No. 10, Accounting Standard for Financial Instruments (Business Accounting Council, January 22, 1999) in recognizing, evaluating, and booking the occurrence or extinguishment of financial assets or liabilities related to securitization transactions.
5. Names of the eligible credit rating agency used in the assessment of risk weight in securitization exposures (the reason if there has been a change in the eligible credit rating agency used) and the relationship between the type of securitization exposure and the eligible credit rating agency used
As for the eligible external credit agencies, CJL refer to S&P, Moody’s and Fitch Ratings Ltd. in determining securitization exposure risk weight.
(7) Market Risk Management Policies and Procedures
1. Overview of risk management policies and procedures
The Market Risk Management Unit (“MRM”), is independent from the business divisions and is given control authority by the Board to identify interest rate, foreign exchange rate or other types of risk factors which impact assets and liabilities (including off-balance sheet assets and liabilities) in the banking and trading books; establish evaluation methods (factor sensitivity or VaR etc.); and monitor risk exposures (including stress tests and market risk limit utilization) based on the defined CJL “Market Risk Management Policy”. MRM also coordinates management reporting to Asset-Liability Committee (“ALCO"), in addition to providing recommendations in risk analysis on a regular and timely basis.
2. Name of the approach used to calculate the market-risk-equivalent amount. Range of portfolios
using each model where the standardized approach or internal model approach is used. Standardized method
3. Methodology on Mark-to-Market calculation for Trading products based on its nature considering
expected holding period and the possibility of exceeding expected holding period. CJL limits trading products to highly liquid securities, foreign exchange or derivative transactions, and performs mark-to-market evaluation by applying theoretical prices based on market prices and other market data for the trading book. Target transactions and the method of the mark-to-market evaluation are defined by internal procedures.
4. Assumptions and valuation method for internal evaluation of capital adequacy on market risk
Risk Capital is calculated based on VaR and Stress test, and Capital Adequacy is measured together with Operational Risk and Credit Risk.
68
(8) Operational Risk Management Policies and Procedure 1. General Description of Operational Risk Management Policy and Procedures
Operational risk refers to the risk of loss resulting from inadequate or failed internal processes, systems, human factors or from external events. As with other risk types, operational risk is managed through an overall framework with checks and balances that includes: • Recognized ownership of the risk by the business divisions; • Oversight by Control Functions; and • Independent review by the Internal Audit Division. CJL’s approach to operational risk is defined in the CJL “Operational Risk Management Policy”. Specific operational risks - IT Risk, Jimu Risk, and Continuity of Business Risk - are subject to additional specialized policies and regulations. The objective of the Policy is to establish a consistent, value-added framework for assessing and communicating operational risk and the overall effectiveness of the internal control environment. CJL adopts Manager’s Control Assessment (“MCA”) as a comprehensive tool to identify, evaluate qualitatively and monitor operational risk. MCA was established as the process whereby ‘significant’ risks inherent in business activities are identified by senior business and functional managers and the effectiveness of the key controls over those risks are evaluated and monitored. In MCA processes, Annual Risk Assessment is conducted to identify significant processes; define significant risks and controls; identify optimum monitoring methods and assessment activities to assess the extent to which processes and control continue to operate effectively. These significant processes are reviewed periodically in consideration of changes to the operational processes and regulatory environment, and latest information shall be reflected in to MCA. On a quarterly basis, the results of assessment of overall effectiveness of internal controls are reviewed and approved at Business Risk, Compliance & Control (“BRCC”) Committee, and including in periodic management reporting. Since operational risk is inherent throughout the activities of CJL, all activities are subject to the Operational Risk process. Operational risk issues and trends are reported at the CJL Risk Oversight Committees responsible for operational risk management – BRCC and System and Operations Committee (“SOC”).
2. Methodology to Calculate Operational Risk
Basic Indicator Approach
(9) Equity Exposure Risk Management Policies and Procedures There is no Equity Exposure.
(10) Banking Book Interest Rate Risk Management
1. Overview of risk management policies and procedures
The Market Risk Management Unit (“MRM”), is independent from the business divisions and is given control authority by the Board to manage interest rate risk in the banking; and based on the defined CJL “Market Risk Management Policy”. MRM also coordinates management reporting to Asset-Liability Committee (“ALCO"), in addition to providing recommendations in risk analysis on a regular and timely basis.
2. Banking book interest rate risk calculation method for internal management purpose CJL measures interest rate risks in the banking book on a daily basis by applying the re-pricing ladder method, and considers changes of economic value per 1% interest rate increase for each currency as an index for internal control. CJL’s holding assets and liabilities are constructed into ladders sorted by the remaining durations for fixed rate items and by the durations till next re-pricing period for variable rate items, respectively. Liquid deposits, which do not have a clearly defined re-pricing period, or prepayment of housing loans require practical assumptions on runoff tenors and balances, and the independent market risk manager approves their relevancy. The monitored amount of interest rate risks for internal control purpose is not necessarily identical with the total amount of interest rate risks calculated in a form of the outlier ratio as per the Standardized Approach.
69
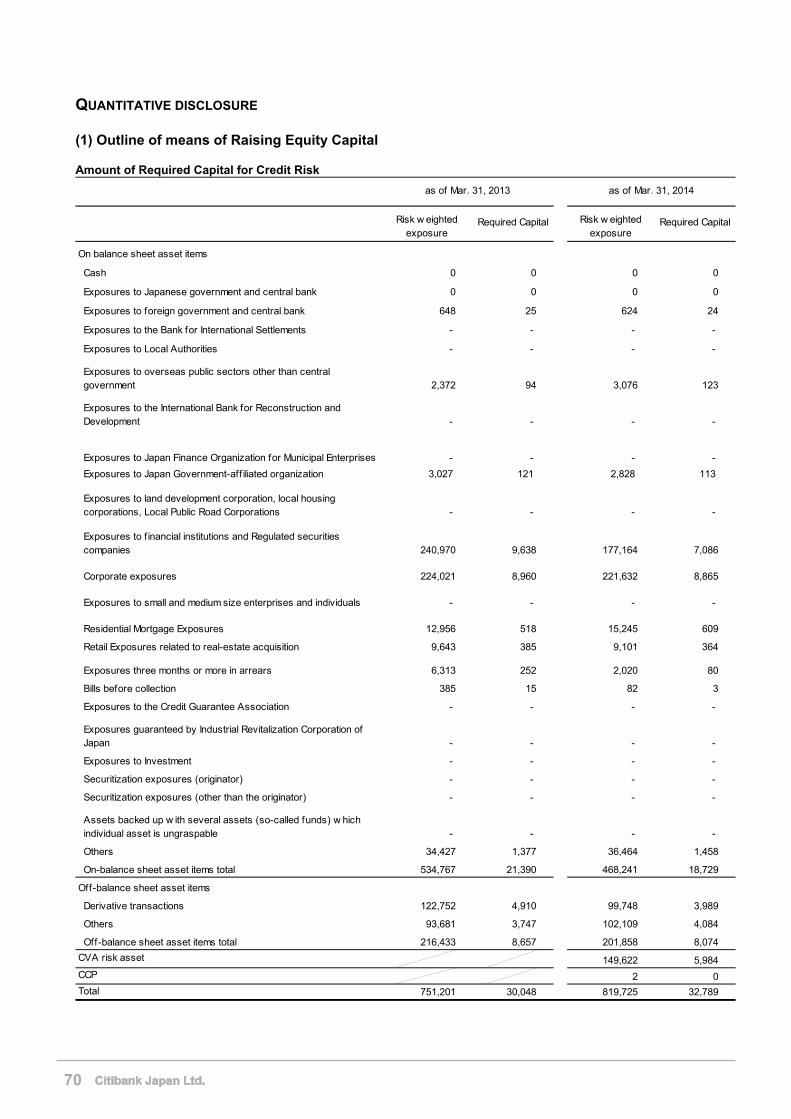
QUANTITATIVE DISCLOSURE (1) Outline of means of Raising Equity Capital Amount of Required Capital for Credit Risk
On balance sheet asset items
Cash 0 0 0 0
Exposures to Japanese government and central bank 0 0 0 0
Exposures to foreign government and central bank 648 25 624 24
Exposures to the Bank for International Settlements - - - -
Exposures to Local Authorities - - - -
Exposures to overseas public sectors other than centralgovernment 2,372 94 3,076 123
Exposures to the International Bank for Reconstruction andDevelopment - - - -
Exposures to Japan Finance Organization for Municipal Enterprises - - - -
Exposures to Japan Government-aff iliated organization 3,027 121 2,828 113
Exposures to land development corporation, local housingcorporations, Local Public Road Corporations - - - -
Exposures to f inancial institutions and Regulated securitiescompanies 240,970 9,638 177,164 7,086
Corporate exposures 224,021 8,960 221,632 8,865
Exposures to small and medium size enterprises and individuals - - - -
Residential Mortgage Exposures 12,956 518 15,245 609
Retail Exposures related to real-estate acquisition 9,643 385 9,101 364
Exposures three months or more in arrears 6,313 252 2,020 80
Bills before collection 385 15 82 3
Exposures to the Credit Guarantee Association - - - -
Exposures guaranteed by Industrial Revitalization Corporation ofJapan - - - -
Exposures to Investment - - - -
Securitization exposures (originator) - - - -
Securitization exposures (other than the originator) - - - -
Assets backed up w ith several assets (so-called funds) w hichindividual asset is ungraspable - - - -
Others 34,427 1,377 36,464 1,458
On-balance sheet asset items total 534,767 21,390 468,241 18,729
Off-balance sheet asset items
Derivative transactions 122,752 4,910 99,748 3,989
Others 93,681 3,747 102,109 4,084
Off-balance sheet asset items total 216,433 8,657 201,858 8,074
CVA risk asset 149,622 5,984
CCP 2 0
Total 751,201 30,048 819,725 32,789
as of Mar. 31, 2013 as of Mar. 31, 2014
Risk w eightedexposure
Required Capital Risk w eightedexposure
Required Capital
70
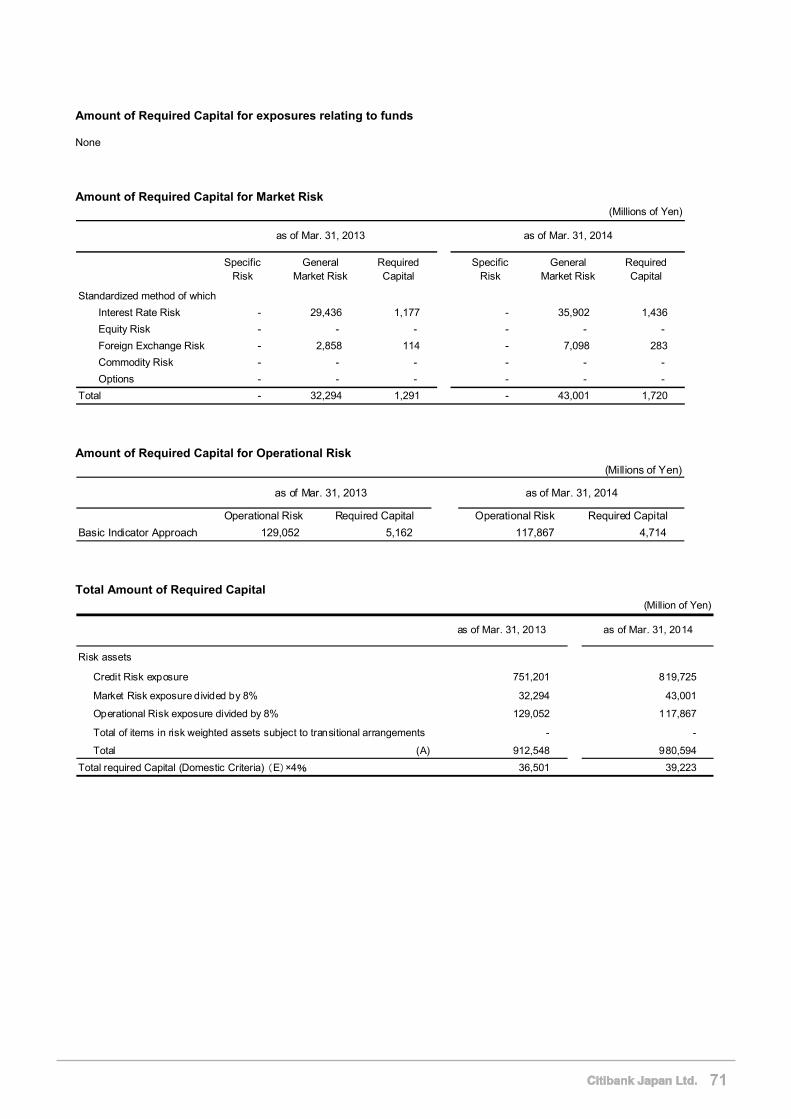
Amount of Required Capital for exposures relating to funds None Amount of Required Capital for Market Risk
Standardized method of which
Interest Rate Risk - 29,436 1,177 - 35,902 1,436
Equity Risk - - - - - -
Foreign Exchange Risk - 2,858 114 - 7,098 283
Commodity Risk - - - - - -
Options - - - - - -
Total - 32,294 1,291 - 43,001 1,720
(Millions of Yen)
as of Mar. 31, 2013 as of Mar. 31, 2014
SpecificRisk
GeneralMarket Risk
RequiredCapital
SpecificRisk
GeneralMarket Risk
RequiredCapital
Amount of Required Capital for Operational Risk
129,052 5,162 117,867 4,714Basic Indicator Approach
(Millions of Yen)
as of Mar. 31, 2013 as of Mar. 31, 2014
Operational Risk Required Capital Operational Risk Required Capital
Total Amount of Required Capital
Risk assets
Credit Risk exposure 751,201 819,725
Market Risk exposure divided by 8% 32,294 43,001
Operational Risk exposure divided by 8% 129,052 117,867
Total of items in risk weighted assets subject to transitional arrangements - -
Total (A) 912,548 980,594
Total required Capital (Domestic Criteria) (E)×4% 36,501 39,223
(Million of Yen)
as of Mar. 31, 2013 as of Mar. 31, 2014
71
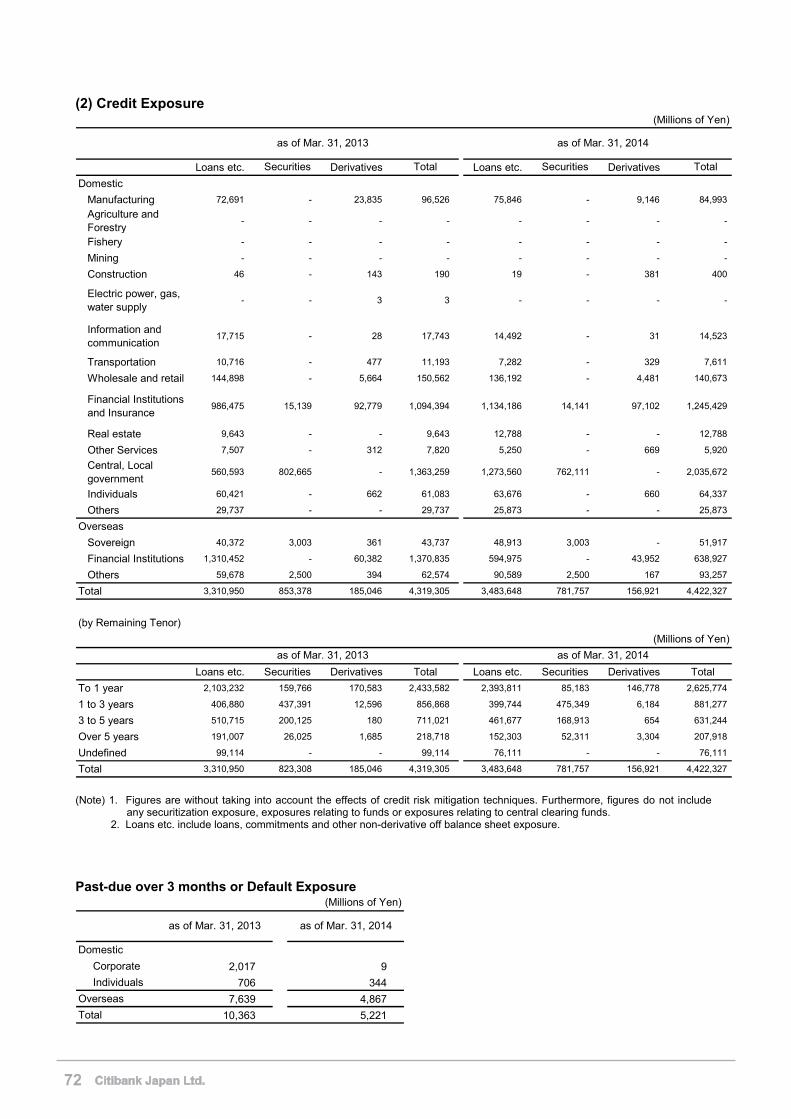
(2) Credit Exposure (Millions of Yen)
Loans etc. Derivatives Loans etc. Derivatives
Domestic
Manufacturing 72,691 - 23,835 96,526 75,846 - 9,146 84,993
Agriculture andForestry
- - - - - - - -
Fishery - - - - - - - -
Mining - - - - - - - -
Construction 46 - 143 190 19 - 381 400
Electric power, gas,water supply
- - 3 3 - - - -
Information andcommunication
17,715 - 28 17,743 14,492 - 31 14,523
Transportation 10,716 - 477 11,193 7,282 - 329 7,611
Wholesale and retail 144,898 - 5,664 150,562 136,192 - 4,481 140,673
Financial Institutionsand Insurance
986,475 15,139 92,779 1,094,394 1,134,186 14,141 97,102 1,245,429
Real estate 9,643 - - 9,643 12,788 - - 12,788
Other Services 7,507 - 312 7,820 5,250 - 669 5,920
Central, Localgovernment
560,593 802,665 - 1,363,259 1,273,560 762,111 - 2,035,672
Individuals 60,421 - 662 61,083 63,676 - 660 64,337
Others 29,737 - - 29,737 25,873 - - 25,873
Overseas
Sovereign 40,372 3,003 361 43,737 48,913 3,003 - 51,917
Financial Institutions 1,310,452 - 60,382 1,370,835 594,975 - 43,952 638,927
Others 59,678 2,500 394 62,574 90,589 2,500 167 93,257
Total 3,310,950 853,378 185,046 4,319,305 3,483,648 781,757 156,921 4,422,327
Loans etc. Securities Derivatives Total Loans etc. Securities Derivatives Total
To 1 year 2,103,232 159,766 170,583 2,433,582 2,393,811 85,183 146,778 2,625,774
1 to 3 years 406,880 437,391 12,596 856,868 399,744 475,349 6,184 881,277
3 to 5 years 510,715 200,125 180 711,021 461,677 168,913 654 631,244
Over 5 years 191,007 26,025 1,685 218,718 152,303 52,311 3,304 207,918
Undefined 99,114 - - 99,114 76,111 - - 76,111
Total 3,310,950 823,308 185,046 4,319,305 3,483,648 781,757 156,921 4,422,327
as of Mar. 31, 2013 as of Mar. 31, 2014
Securities Total Securities Total
(by Remaining Tenor)
as of Mar. 31, 2013 as of Mar. 31, 2014
(Millions of Yen)
(Note) 1. Figures are without taking into account the effects of credit risk mitigation techniques. Furthermore, figures do not include
any securitization exposure, exposures relating to funds or exposures relating to central clearing funds. 2. Loans etc. include loans, commitments and other non-derivative off balance sheet exposure.
Past-due over 3 months or Default Exposure
Domestic
Corporate 2,017 9
Individuals 706 344
Overseas 7,639 4,867
Total 10,363 5,221
(Millions of Yen)
as of Mar. 31, 2013 as of Mar. 31, 2014
72
(Note) 1. Figures are without taking into account the effects of credit risk mitigation techniques. Furthermore, figures do not include any securitization exposure, exposures relating to funds or exposures relating to central clearing funds.
2. "Past-due over 3 months or default exposure" is the exposure either in principal or interest payment is delayed more than 3 months or risk weight is 150% before the consideration of loan loss reserve.
Allowance for Loan Losses
Specific Reserve
Corporate 726 420 1,147 1,147 (824) 323 1,147 (1,141) 5
Individuals 2,253 (1,175) 1,078 1,078 (86) 991 1,078 (172) 905
Others 73 (32) 41 41 (32) 9 41 (38) 2
General Reserve 1,335 (175) 1,159 1,159 (100) 1,059 1,159 (144) 1,014
Loan loss reserve for restructuring country
(Millions of Yen)
Fiscal Year ended Mar. 2013 Interim Fiscal Period ended Sep. 2013 Fiscal Year ended Mar. 2014
Not applicable
Beginning Change Ending Beginning EndingChange Ending Beginning Change
Credit Risk Exposure after Credit Risk Mitigation by Risk weight under Standardized Approach
(Millions of Yen)
Rated Unrated Rated Unrated
0% 136 1,369,192 28 2,047,792
20% 1,082,817 134,606 708,747 126,621
35% - 37,017 - 43,563
50% 105,607 14,634 115,503 17,359
75% - - - -
100% 81,323 334,258 77,366 305,950
150% - 2,158 - 648
1250% - - - -
Deduction from Capital - - - -
Total 1,269,884 1,891,867 901,646 2,541,935
as of Mar. 31, 2013 as of Mar. 31, 2014
(Note) 1. Figures are taking into account the effects of credit risk mitigation techniques and do not include any securitization exposure.
(3) Credit Risk Mitigation
Eligible Financial Collateral
Cash 366,642 119,123
Bonds 702,381 754,636
Stocks 260 210
Others - -
Guarantee and Credit Derivatives
Guarantee 88,268 104,775
Credit Derivatives - -
Total 1,157,552 978,745
as of Mar. 31, 2013 as of Mar. 31, 2014
(Millions of Yen)
(Note) On-balance netting was adopted for the interbank Money Market transaction with Citibank, N.A. overseas main branches.
73
(4) Counterparty Credit Risk of OTC Derivatives
i.Measurement of Credit exposure Current Exposure Method
ii.Total amount of gross positive fair value 194,481 145,457
iii.Credit exposure before Credit Risk Mitigation
FX related 184,372 152,678
Interest rate related 311 4,243
Total 184,684 156,921
iv.The amount deducting iii from sum of ii and gross add-on
(Reduction by Netting agreements)
174,171 138,217
(Millions of Yen)
as of Mar. 31, 2013 as of Mar. 31, 2014
v. Collateral type None vi. Credit exposure after Credit Risk Mitigation Same as iii vii. Notional amount of credit derivatives which have counterparty risk None viii. Notional amount of credit derivatives which cover exposures by Credit Risk Mitigation None
(5) Securitization i.Securitization exposure as Originator
None ⅱ. Securitization exposure as Investor a. Information by Type of Underlying Assets
as of Mar. 31, 2013 as of Mar. 31, 2014
Claims on corporate customers - -
Residential Mortgage Loan - -Claims on individual customers(ex. Residential Mortgage Loan)
- -
Others 10 -
Total 10 -
(Millions of Yen)
74
b. Exposure by Risk Weight Category and Amount of Required Capital
Exposure Required Capital Exposure Required Capital20% - - - -50% - - - -100% - - - -350% - - - -1250% - - - -Deduction from Capital 10 10 - -Total 10 10 - -
(Millions of Yen)as of Mar. 31, 2013 as of Mar. 31, 2014
c. Amount of securitization exposure and type of underlying asset which 1250% risk weight should be adopted in accordance with
Paragraph 1, Article 247 of FSA Notice No.19 None
d.Credit risk mitigation for resecuritization exposure.
None
e. Credit Risk-Weighted Assets Calculated Pursuant to Article 15 of Supplementary Provisions of the FSA Capital Adequacy Ratio Notification
None (6) Market Risk (under Internal Model Approach) None
(7) Equity Exposure in Banking Book None
(8) Amount in regarded exposure under the Accord article 167 None (9) Interest Rate Risk in the Banking Book - the increase/(decrease) in economic value for 1%
upward rate shocks according to internal management's method.
as of Mar. 31, 2013 as of Mar. 31, 2014
Japanese Yen 10,845 16,114
US Dollar (2,236) 2,340
Euro 807 336
Others (181) (356)
Total 9,235 18,434
(Millions of Yen)
75
DISCLOSURE OF REMUNERATIONS (1) Matters relating to the development of the remuneration and other systems of the Subject
Officer and Employee of Citibank Japan Ltd. (hereafter, “CJL”) 1. The scope of “Subject Officer and Employee”
The scope of "Subject Officer" and "Subject Employee, etc." (collectively, "Subject Officer and Employee") for which the remuneration announcement stipulates the disclosure is as below.
A. The scope of “Subject Officer”
Subject Officers are Directors and Statutory Auditors of CJL, excluding Outside Directors, Outside Statutory Auditors, and part-time Directors not receiving remuneration or other payments.
B. The scope of “Subject Employee, etc.”
Among (a) officers other than Subject Officers, (b) employees of CJL, and (c) officers and employees of the major consolidated subsidiaries, etc, who are categorized into either "those who receive a large remuneration, etc.” and “those who have a significant influence on the management and the status of the property of CJL and the major consolidated subsidiaries, etc” are disclosed as "Subject Employees, etc.”
i The scope of “major consolidated subsidiaries, etc ”
CJL has no consolidated subsidiaries.
ii The scope of “those who receive a large remuneration, etc”
"Those who receive a large remuneration, etc.” are persons who receive remuneration more than the “average of the Subject Officers’ remunerations” calculated by dividing the total amount of the remunerations the “Subject Officers” received for the fiscal year by “the number of the Subject Officers”. For this calculation, “Subject Officers” who newly-appointed and retires during fiscal year are excluded.
iii The scope of “those who have a significant influence on the management and the status of the property of
CJL ”
The scope of “those who have a significant influence on the management and the status of the property of CJL” is designated as the same criteria as “Covered Employees” which is determined by Citi’s Independent Risk. The Covered Employees are comprised of “Individual Covered Employees” and “Group Covered Employees”. “Individual Covered Employees” are employees who, acting individually, have influence over the material risks of CJL or Business Units of Citi. “Group Covered Employees” are other employees who are compensated similarly and who acting together could have influence over the material risks of CJL or the material risks of a material business unit. Covered Employees can include Subject Officers, Subject Employees and persons in charge of the Risk Management Division and Risk Treasury. For the purpose of this section iii only, “Covered Employees” excluding Subject Officers is considered to be “those who have a significant influence on the management and the status of the property of CJL”.
2. Determination of the remuneration for the Subject Officer
A. Determination of the remuneration for the Subject Officer
The total amount of Director and Statutory Auditors remunerations (the maximum limited amount) is determined at the general meeting of shareholders. As for the remuneration for the Subject Officer, determination is made according to the Rules Concerning Remuneration for Officers (Yakuin). Additionally, all Directors’ annual remuneration (basic annual remuneration, bonus and equity compensation) is reviewed in respect of the appropriateness of the amount by the Chief Executive Officer, Compliance Head and Human Resources Head of CJL.
B. Determination of the remuneration for the Subject Employee, etc.
The remuneration for an employee of CJL is determined and paid according to our remuneration rules. For the rules, their system design and documentation have been conducted by Human Resources Division, which is independent from Unit/department responsible for business execution. Additionally, any employee with an annual remuneration (basic annual remuneration, bonus and stocks) exceeding 30-million yen or 300-thousand US dollar is reviewed in respect of the appropriateness of the amount by the Chief Executive Officer, Compliance Head and Human Resources Head of CJL.
76

3. Determination of the remunerations for the employees in Risk Management Division and Compliance Division
The remunerations for the employees in Risk Management Division and Compliance Division are determined according to the remuneration rules of CJL and each payment amount is fixed according to the performance appraisal ultimately decided by the each division head. In that way, their remunerations are decided independently from Unit/department responsible for business execution.
4. The total remuneration amount paid to the Remuneration Committee members and the number of
meetings held
There is not Remuneration Committee or an equivalent organization within CJL. (2) Matters relating to the assessment of the appropriateness of the design and operation of
the remuneration and other systems of the Subject Officer and Employee of CJL
1. Remuneration policy
A. Policy of the remuneration for the “Subject Officer”
With respect to the remunerations for Officers, Officer Remuneration Plan has been established according to the Rules Concerning Remuneration for Officers (Yakuin). Specifically, the Plan determines the composition of the remuneration:
・ Annual base remuneration ・ Bonus ・ Various allowances ・ Equity Compensation (or options to purchase shares) of Citigroup stock ・ Retirement benefits ・ Cash denominated awards (that earn notional investment returns).
Annual base remuneration is determined based on the roles, profile, performance, etc. as an officer, while bonus is determined based on the performance of CJL. Stocks (shares of Citigroup Inc. listed in the United States) are provided to align officer’s or employee’s interests with those of shareholders, clients and other stakeholders.
B. Policy of the remuneration for the “Subject Employee, etc.”
The remuneration for an officer or an employee of CJL is determined depending on the role, personnel evaluation, ability and performance according to the remuneration rules of CJL.
2. Significant change in the remuneration system design and operation
There is no significant change in the remuneration system design and operation. (3) Consistency of the remuneration system of the Subject Officer and Employee and the risk
management, and matters relating to linkage of the remuneration and performance
1. Methodology to take the risk into account for determining the compensation
For Individual Covered Employees, there is an annual control function review process pursuant to which the control functions (Compliance, Finance, Independent Risk, Internal Audit, and Legal) provide an evaluation of risk behaviors.
2. Performance-linked portion to determine the remuneration for the Subject Officer and Employee
A. Calculation method for the performance-linked portion
The rating from the independent review process is included in the performance evaluation system to inform the performance review conducted by the employees’ manager. The performance evaluation system includes formal risk goals for covered senior managers as well as a formal manager-provided risk rating. When incentive compensation recommendations are made, both the individual goals and risk performance goals are included in the compensation worksheet for consideration.
77
B. Methodology to make adjustment to the performance linked portion
For Covered Employees, provisions also allow for the cancellation of deferred incentive compensation awarded in the event of serious financial or reputational harm to Citi, and can allow for cancellation if a failure to supervise or monitor risks results in such significant responsibility. Separately if the global reference business of a Covered Employee has pre-tax losses in any year of the deferral period, the portion of the deferred stock award that is scheduled to vest in the year following the loss year will be reduced.
C. Confirmation as to whether the compensation system is not too focused on the linkage to the short-term
performance
It is confirmed that the compensation system is not too focused on the linkage to the short-term performance as the structure of annual incentive awards made to Covered Employees discourages imprudent risk-taking. Also the risk mitigates include substantial deferrals; vesting periods, broad-based clawbacks, and management discretion to clawback nonvested deferred compensation for improper risk-taking behavior.
D. Ensuring effective controls and risk-adjustment procedures including monitoring individual manipulation of risk
when determining compensation
Compensation is determined based on year-end performance evaluations that focus on mission-critical goals with an emphasis on risk management. Performance evaluations reflect multiple inputs including multi-perspective feedback; review of performance against key business financial, risk and client metrics as well as qualitative and/or non-financial elements of performance; manager’s review of qualitative risk behavior; and independent review of qualitative risk behavior conducted by the Control Functions (Independent Risk, Compliance, Audit, Legal and Finance)
3. Adjustment of the deferred payment
Please refer to 2B “Methodology to make adjustment to the performance linked portion”.
(4) Matters such as the categories of the remunerations for the Subject Officer and Employee
of CJL and the amounts and payment methods. The total amount of remunerations for the Subject Officers and Employees (from April 1, 2013 to March 31, 2014)
(Millions of Yen)
Categories Head Count
Remuneration, etc. in total
Fixed Remuneration
Variable Remuneration
Retirement Benefits Basic
Remuneration
Stocks/ Stock Option
OtherBasic Remuneration
Bonus Other
Subject Officers (excluding outside officers,etc.)
6 623 283 199 - 84 326 - 201 125 14
Subject Employees, etc.
1 137 22 20 - 2 115 - 48 67 -
(Note) 1. Other fixed remuneration includes housing or other allowances provided to the expatriated from Citigroup entities overseas. Subject
Officers HC 6 includes one director who retired at middle of fiscal year.
2. Other variable remuneration includes deferred remunerations, Equity Compensation, etc.
(5) Other information relevant to the remuneration and other systems of the Subject Officers
and Employees of CJL.
There is not reportable information other than the above.
78
Confirmation
July 31, 2014
Representative Director, President & CEO Peter B. Eliot I confirm, to the best of my knowledge, the following matters concerning the Citibank Japan Ltd. financial statements for the Period from April 1, 2013 to March 31, 2014:
1. Matters concerning the financial statements are in conformity with “The Regulations regarding Terminology, Format and Method of Preparation of Financial Statements, etc” and “Enforcement Regulation of the Banking Law” and others, and the financials present fairly in all material respects.
2. Citibank Japan Ltd. establishes and maintains the appropriate internal control systems as below,
and fairly presents financial statements based on it.
(1) Assignment of duties and the corresponding units in charge are clearly defined, and the system for accomplishment of operation is appropriately established.
(2) Internal Audit Division assesses the appropriateness and effectiveness of internal control systems for each responsible unit, and reports the material matters to the Management and Board of Statutory Auditors.
(3) All material information concerning Citibank Japan Ltd. is adequately reported to the Management and Board of Directors as necessary.
79


www.citibank.co.jp
![[email protected] Computerising Mathematical Texts with MathLang [email protected] = *@[email protected]](https://img.pdfslide.net/doc/110x75/613c0d6722e01a42d40e691b/emailprotected-computerising-mathematical-texts-with-mathlang-emailprotected.jpg)


![r( [email protected] [email protected] [email protected]`L](https://img.pdfslide.net/doc/110x75/6207318949d709492c2edac3/r-emailprotected-emailprotected-emailprotectedl.jpg)

![Vision Document - [email protected] - [email protected]](https://img.pdfslide.net/doc/110x75/61fb2b7e2e268c58cd5afacc/vision-document-emailprotected-emailprotected.jpg)

![CII Vision Document: [email protected] - [email protected]](https://img.pdfslide.net/doc/110x75/6203872eda24ad121e4a75f5/cii-vision-document-emailprotected-emailprotected.jpg)