Embed Size (px)
Citation preview
“FOR THE PUBLIC BENEFIT”
RAILWAYS IN THE BRITISH CAPE COLONY
African economic history working paper series
No. 30/2016
Alfonso Herranz-Loncán, University of Barcelona
Johan Fourie, Stellenbosch University

1
ISBN 978-91-981477-9-7
AEHN working papers are circulated for discussion and comment purposes. The papers have not been
peer reviewed, but published at the discretion of the AEHN committee.
The African Economic History Network is funded by Riksbankens Jubileumsfond, Sweden
2
“For the public benefit”? Railways in the British Cape Colony1
ALFONSO HERRANZ-LONCÁN2 AND JOHAN FOURIE
3
Built mostly to support the early mining industry, the Cape Colony’s railways reduced the cost
of transport to the interior and increased labor productivity in the Colony from 1859 to 1905
by, we calculate, 30 percent. Little of the gains went to the state-owned company: the Cape
parliament seems always to have seen the railways as a means to development. But the
politically overrepresented western parts of the Colony gained much more than
underrepresented areas like Basutoland or the Transkei. While boosting the economy, the
railways also had distributional effects, with consequences for racial segregation in twentieth-
century South Africa.
Keywords: railways, infrastructure, public goods, South Africa, social savings
JEL-code: N4, H4, O1
1 We thank the following for comments and suggestions: Eltjo Buringh, Estian Calitz, Kerstin Enflo, Ewout
Frankema, Erik Green, Jan Greyling, Oscar Gelderblom, Ed Kerby, Di Kilpert, Alex Moradi, Maarten Prak,
Auke Rijpma, Marlous van Waijenburg, Jan Luiten van Zanden, Dieter von Fintel and participants at the ERSA
Research Workshop on “Climate, geography and African economic history” (Cape Town, May 2014), the 9th
“New Frontiers in African Economic History Workshop” (London, October 2014), the “The Economic Impact of
Canals and Railways: New Perspectives” workshop (Canberra, March 2015), the XVII World Economic History
Congress (Kyoto, August 2015), the Annual Meeting of the Economic History Association (Nashville,
September 2015), and seminar participants at the universities of Illes Balears (Spain), Lund (Sweden),
Stellenbosch (South Africa), Universidad de la República (Uruguay), Utrecht (the Netherlands) and Zaragoza
(Spain). 2 Department of Economic History, University of Barcelona, Spain. E-mail: [email protected]. ORCID:
http://orcid.org/0000-0002-4921-2640. 3 LEAP, Department of Economics, Stellenbosch University, South Africa. E-mail: [email protected]. ORCID:
http:// orcid.org/0000-0002-7341-017X.
3
1. Introduction
Roads and railroads were for the public benefit, and in their construction they
should not look forward to profit. (MP Robert Godlonton in the Cape Legislative
Council, 1870)4
Late nineteenth-century economic growth and globalization were driven largely by the
railways. This was particularly true of developing countries which, unlike the industrialized
countries, had still to develop good transport infrastructure and well-integrated markets. South
Africa at the beginning of the railway era had seen the growth effects of globalization only
along strips of coastal land or close to navigable rivers. Across the periphery countries
economic activity often followed the railway tracks and shaped the economic geography of
many countries even long after railways had ceased to operate.
Railway construction was not spread evenly throughout the developing world. In Latin
American countries, for instance, the density of the rail networks, per square mile and per
capita, varied widely according to the degree of integration into the international economy and
level of income per capita (Bignon et al. 2015). In sub-Saharan Africa, because of huge cross-
country differences in ruggedness, climate, natural endowments and institutions, railway
density varied even more markedly: some colonial governments built a complex network of
interconnected railways, others only a few separate lines linking main ports with the interior.
By 1910, 45 percent of sub-Saharan Africa’s railway lines were in the Union of South Africa,5
and the sum of its railways and those in Portuguese East Africa, South West Africa, and
Northern and Southern Rhodesia6 made up 67 percent of sub-Saharan Africa’s rail network
(Mitchell 2003a). We may assume that, as in other regions of the world, the economic effects
of globalization were felt most strongly in the regions with the largest and densest rail networks.
In this paper we make a preliminary approach to analyzing the effects of the Cape Colony
railways during the late nineteenth and early twentieth century globalization period. This
railway system was among the largest and most dense in sub-Saharan Africa and, as we show
below, the rail transport sector share of Cape GDP was amongst the highest in the world before
4 Debates, Vol. III (1870), p. 241. 5 The four British colonies of the Cape, Natal, Transvaal and Orange River became the Union of South Africa in
May 1910. 6 Now Mozambique, Namibia, Zambia and Zimbabwe.
4
1910. Across the developing world, railways boosted growth primarily by reducing transport
costs. The size of the reduction depended on two factors: the cost advantage over the next best
alternative, and the amount of freight and number of passengers transported. The Cape railways
were not notable for the former (compared with other African countries, where the main
alternative was head porterage), but the high volume of Cape rail traffic (relative to GDP) had
large resource saving effects.
The boom in mining production weighted the Colony’s economy heavily towards rail transport.
Its railways were built to connect its main ports and farming districts first with the Kimberley
diamond fields and then with the Witwatersrand goldfields in the neighboring Transvaal. By
reducing the cost of transport to the interior, the railway eased the movement of labor, capital
goods, foodstuffs and other necessities to the mining centers. This transformed the Cape from
a traditional agrarian society into a dynamic economy attractive to immigrants. Diamond
exporting became easier and the Kimberley district flourished, as did providers of basic items.
Estimates show that the Cape’s GDP grew at a yearly rate of 4.77 percent between 1870 and
1909 (Greyling and Verhoef (2015). In helping to remove restrictions to the expansion of
mining production, the railways enabled the development of some of the Africa’s biggest
industrial hubs.
With the exception of a few private lines, the Cape railways were built and managed by the
colonial government. In contrast with their sizeable social benefits, the railway company was
not a significant source of net revenues for the government. Debates in the Cape Legislative
Council show that the railways were seen neither as a source of revenue nor as a political or
military tool but as an instrument for the economic development of the Colony. This contrasts
with other developing economies where railway expansion was left in the hands of private
companies seeking big financial returns (as in most Latin American countries; Bignon et al.
2015), or where publicly owned railways were used as a cash-cow by the government (as in
colonial India; Bogart and Chaudhary 2012).
Cape districts and sectors of the economy, hoping for a bigger share of the railway social
benefits, lobbied parliament for railways for their constituencies. The final distribution of
railway lines, reflecting to some extent differences in political influence, benefited some areas
at the expense of others. Miners and their suppliers, notably white farmers of the politically
overrepresented Western Cape, seem to have been able to capture a very large share of railway
5
gains, while regions without railway lines, such as the Transkei or Basutoland,7 mostly
populated by blacks, despite being relatively close to the mining areas could neither become
their suppliers nor benefit from the diamond boom. We argue that the absence of railways in
these regions, combined with the increasing restriction of laborers’ movements under early
segregation policies, was one of the origins of their stagnation and gradual marginalization.
Our paper contributes to three literatures. The first is the literature on the economic growth and
development of the Cape Colony during the first era of globalization (Greyling and Verhoef
2015; Cilliers and Fourie 2016; Cilliers and Mariotti 2016; Fourie et al. 2016). Boshoff and
Fourie (2016), in the first quantitative study of how improvements in transport boosted the
Colony’s economy, examine South African market integration into the global economy and
estimate 1872 as the date when the region’s wheat markets were integrated with those of
Britain’s. The railways, they argue, clearly played an important role, but they are unable to
quantify the size of its impact.
The second is the literature on the large and persistent effects of railway construction on the
economies of developing countries during the first globalization (e.g. Coatsworth 1979;
Ramírez 2001; Summerhill 2005; Herranz-Loncán 2011, 2014; Chaves et al. 2013; Zegarra
2013; Bogart et al. 2015). Many of these studies are based on the social saving methodology.
Others use detailed archival data to provide a microeconomic perspective on railway growth
effects in various countries worldwide (e.g. Tang 2014; Donaldson 2016; Jedwab et al. 2016;
Jedwab and Moradi 2016). We measured the broad resource saving effects of the railways in
the Cape Colony and compared them with estimates for other developing countries, leaving for
future research the microeconomic analysis of the local effects.
The third is the literature on the political economy of infrastructure provision and management
(Summerhill 1998; Bogart and Chaudhary 2015). While railways in many periphery countries
were built by foreign private capital (see e.g. Bignon et al. 2015), the Cape is an interesting
example of a large network owned and managed by the government. Bogart (2010) shows that
increasing state ownership reduced efficiency in most countries, with varying effects according
to whether the increase was through nationalizations or new construction. Bogart and
Chaudhary (2012), however, show that the move toward state ownership of India’s large public
railway system decreased operating costs and helped make the railways a source of public
7 The Transkei is now incorporated into the Eastern Cape Province and Basutoland is now Lesotho. The Transkei
territories were gradually annexed to the Cape Colony between the late 1870s and early 1890s. Basutoland was
part of the Colony between 1871 and 1884 and was transferred to the direct authority of the British government
thereafter.
6
revenue. This, they argue, was as a result of an undemocratic colonial government, a fiscal
system heavily reliant on railway revenues, and a regulatory environment that was not
conducive to private competition. The situation was totally different in the Cape, where the
colonial government expanded the network from the start despite being unlikely to recoup the
large resources invested in it. Here the railways, we suggest, were never seen as a potential
source of revenue but were used to encourage the Colony’s development, and to benefit those
groups, such as the mine owners and wheat farmers of the Western Cape, whose interests were
best represented in parliament. The contrast between colonial India and the Cape Colony
illustrates the different effects of railway public ownership under very different social and
political circumstances.
2. The development of Cape railways
Construction on the first railway at the Cape started in 1859 but progress was slow until the
early 1870s.8 At that date the only line in operation was a 57-mile line between Cape Town,
Wynberg and Wellington. The government acquired this line in 1872, only a few years after the
discovery of diamonds at Kimberley (1866), and from then on the construction and operation
of the network remained a public undertaking by the Cape Government Railways (CGR).9 With
the diamond rush and later the discovery of gold on the Witwatersrand in 1886, construction
accelerated rapidly. The Cape Colony’s rail network initially consisted of three trunk lines
connecting the ports of Cape Town, East London and Port Elizabeth with the diamond
producing area around Kimberley. It was gradually enlarged with numerous branch lines and
by 1910, when the CGR was incorporated into the Union Government Railways, it had reached
a length of more than 3,300 miles. Together with the railways of the Transvaal and the Orange
River Colony, it was by far the largest and densest network in Africa, both per square mile of
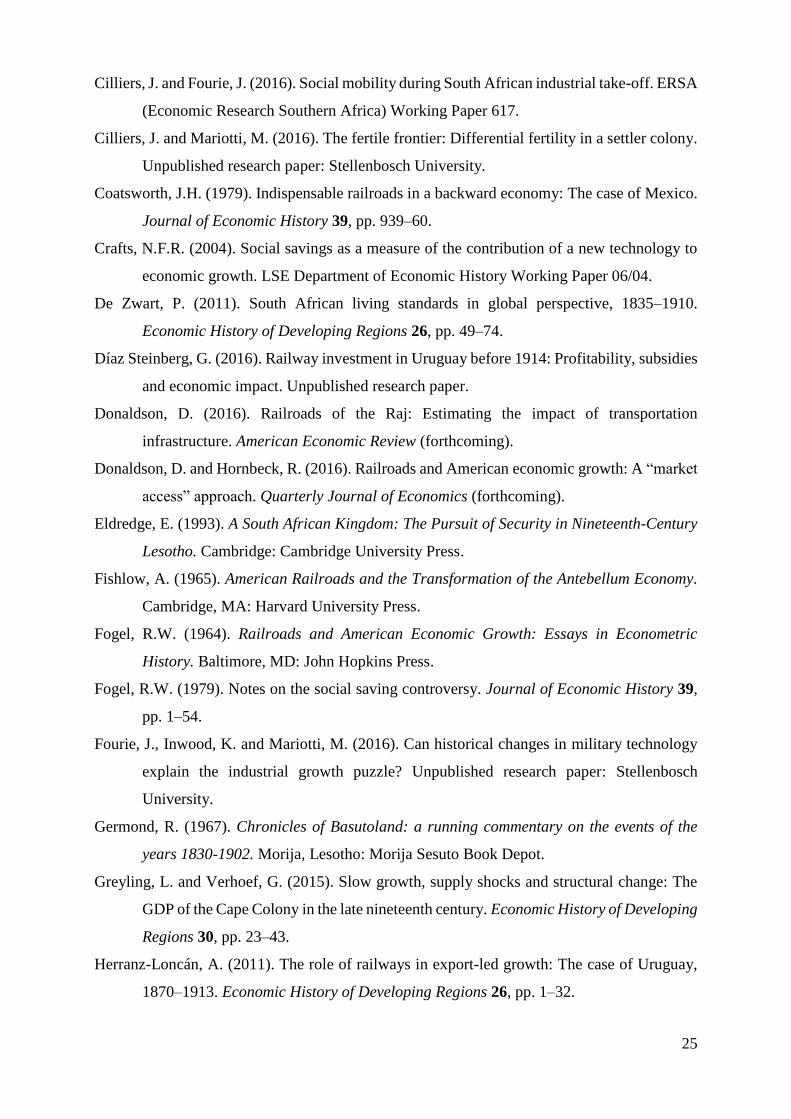
surface area and per capita, and one of the largest outside Europe and the US. Figure 1 shows
8 Our data were obtained from several sources: various years of Cape of Good Hope government documents: the
Debates in the Legislative Council (1870–1895), the Report of the General Manager of Railways (1906–1909)
and the Statistical Register of the Colony of the Cape of Good Hope (1900–1910); the 1890 Agricultural Journal
of the Department of Agriculture of the Cape Colony; the Union of South Africa’s Official Year-Book of the
Union, No. 2, 1918, published in 1919; and the Census of the British Empire, 1901, Report with Summary and
Detailed Tables for the Several Colonies…, 1906 (see Supplementary material for full details). These documents
are referred to in the paper as the Agricultural Journal, the Debates, the Report of the General Manager, the
Statistical Register, the Official Year-Book and the Census. 9 The only exceptions were a private, narrow-gauge, mining railway between the Namaqualand copper mines in
the O’Okiep area and the sea, which was built in the 1860s as a horse-drawn railway, gradually adapted to steam,
and closed in 1945, and the 205-mile line between Worcester and Mossel Bay, completed in 1906 and managed
by the New Cape Central Railway company until its takeover by the South African Railways in 1925.
7
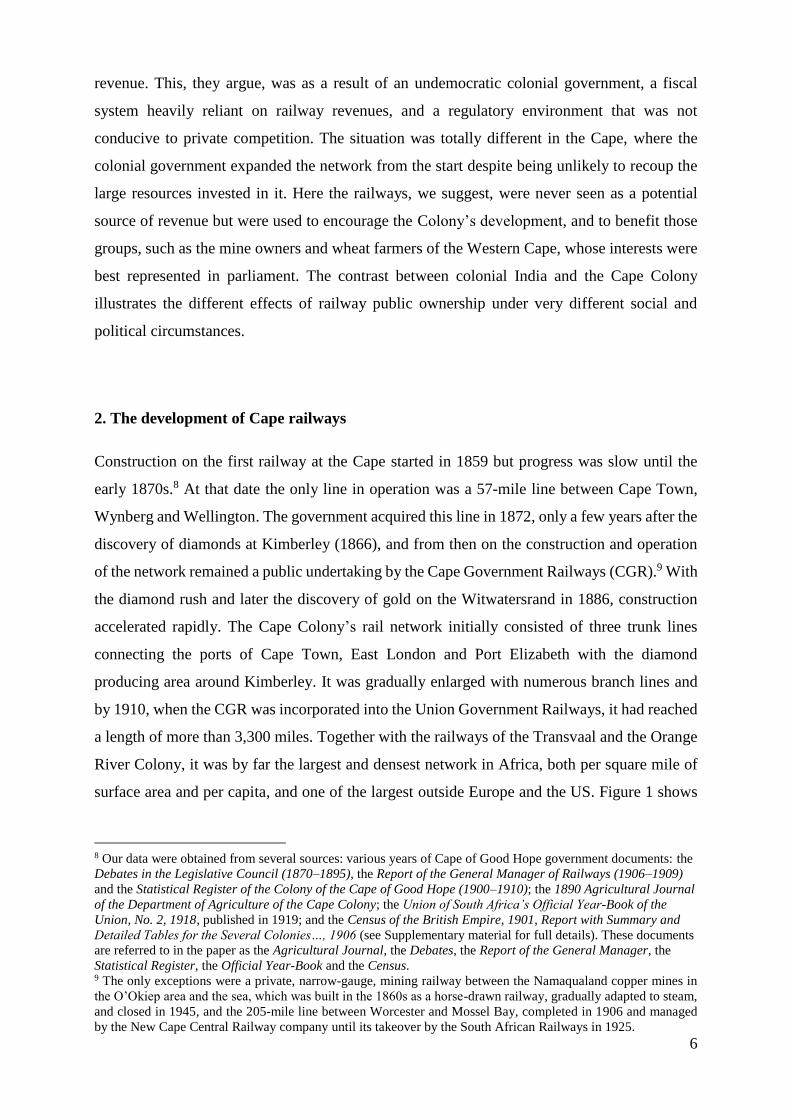
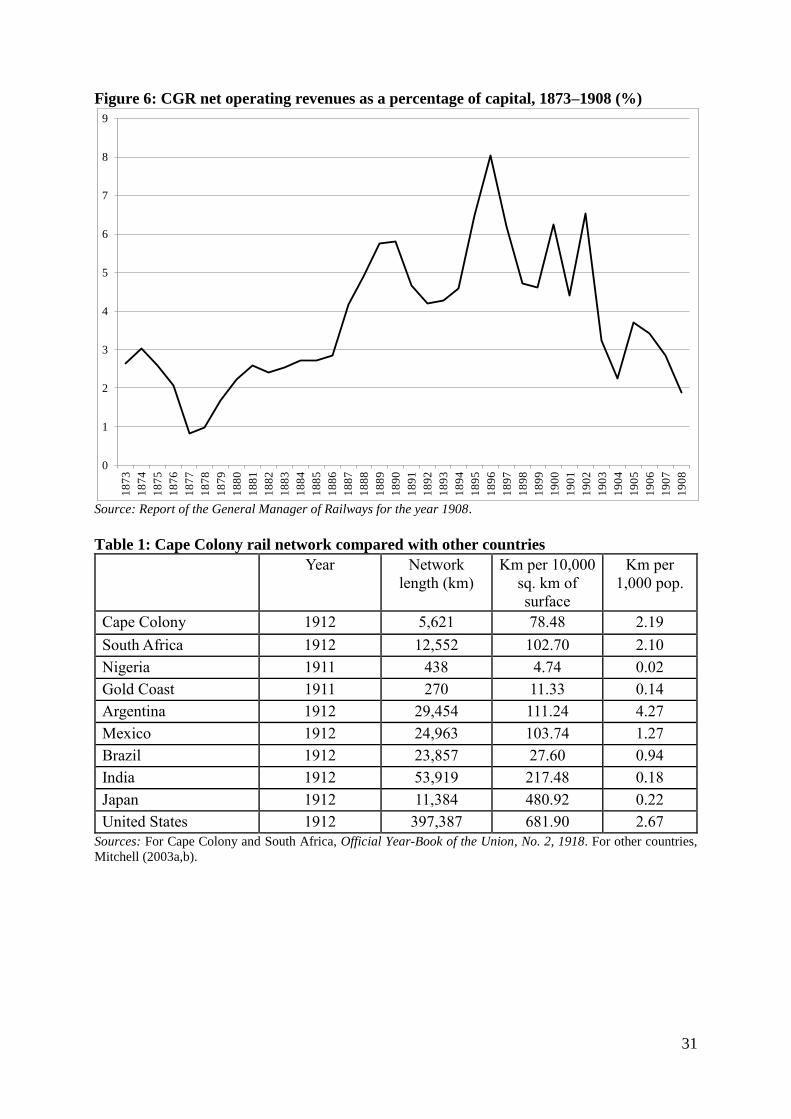
how it grew and table 1 compares the size it had reached by 1912 with the size of other
countries’ networks.
[INSERT FIGURE 1 AND TABLE 1]
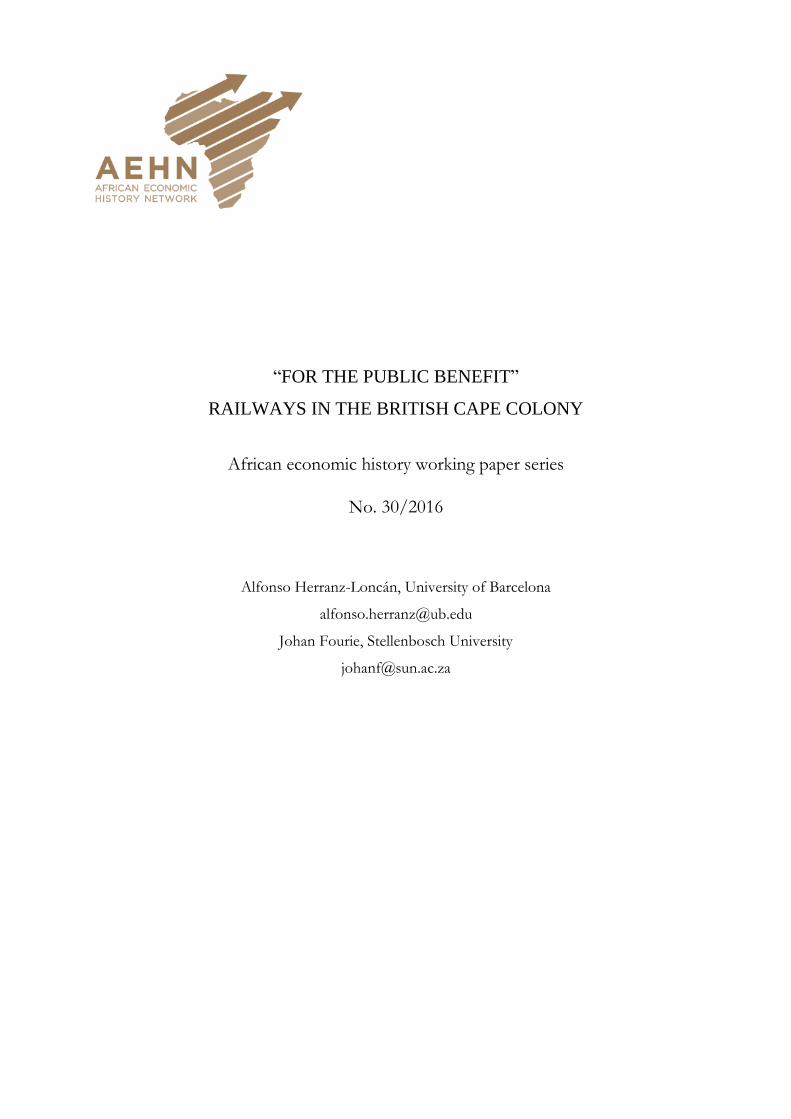
Figure 1 shows two main periods of intense railway building in the Cape Colony before 1910,
firstly between 1875 and 1885 when the government built the trunk lines linking Cape Town,
Kimberley, Port Elizabeth and East London, and secondly during the early years of the
twentieth century, right after the end of the second Anglo-Boer War. In the second expansion,
investment was concentrated on branch lines that would act as feeders to the trunk lines or as
connections between them, on the link with the Witwatersrand through Bloemfontein, and on
extending the main trunk line beyond Kimberley along the border of the Cape Colony to provide
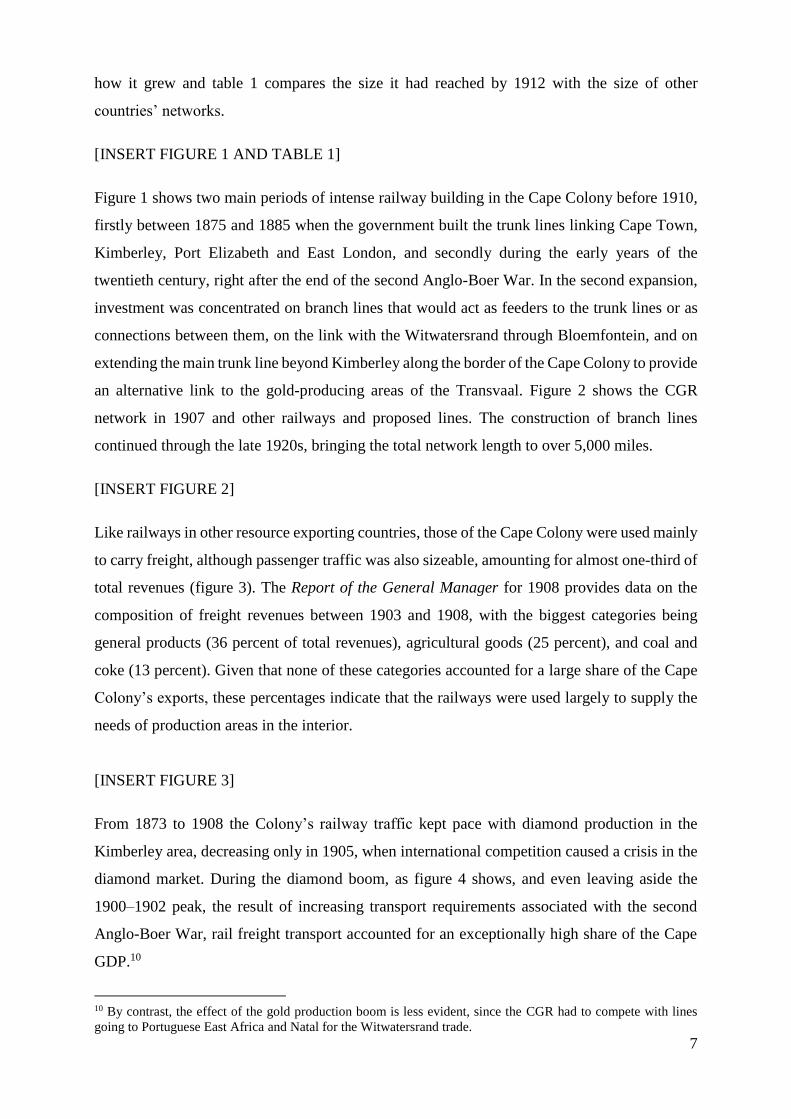
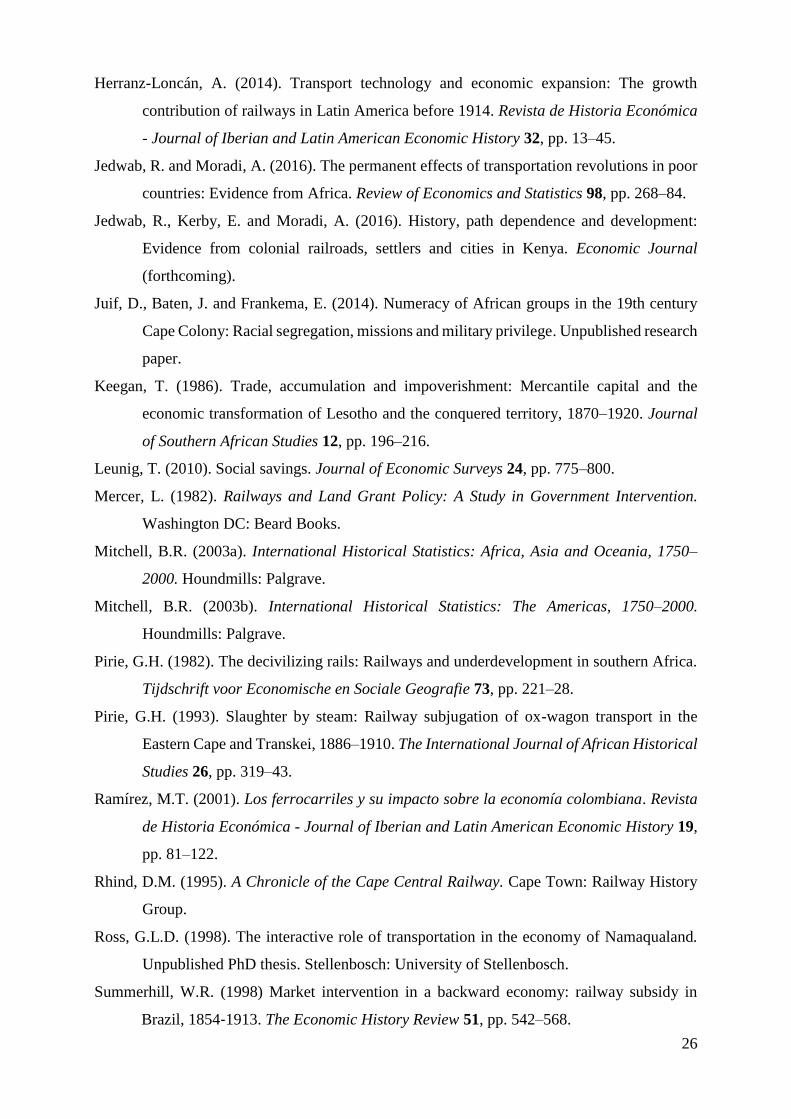
an alternative link to the gold-producing areas of the Transvaal. Figure 2 shows the CGR
network in 1907 and other railways and proposed lines. The construction of branch lines
continued through the late 1920s, bringing the total network length to over 5,000 miles.
[INSERT FIGURE 2]
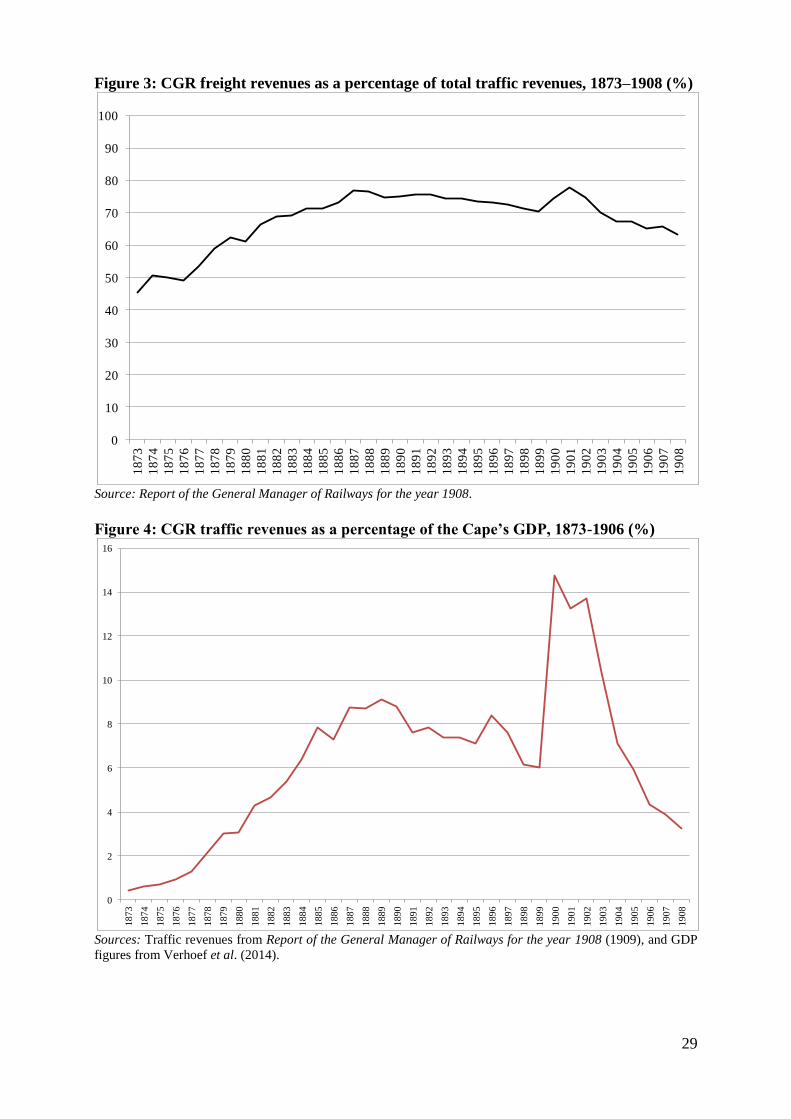
Like railways in other resource exporting countries, those of the Cape Colony were used mainly
to carry freight, although passenger traffic was also sizeable, amounting for almost one-third of
total revenues (figure 3). The Report of the General Manager for 1908 provides data on the
composition of freight revenues between 1903 and 1908, with the biggest categories being
general products (36 percent of total revenues), agricultural goods (25 percent), and coal and
coke (13 percent). Given that none of these categories accounted for a large share of the Cape
Colony’s exports, these percentages indicate that the railways were used largely to supply the
needs of production areas in the interior.
[INSERT FIGURE 3]
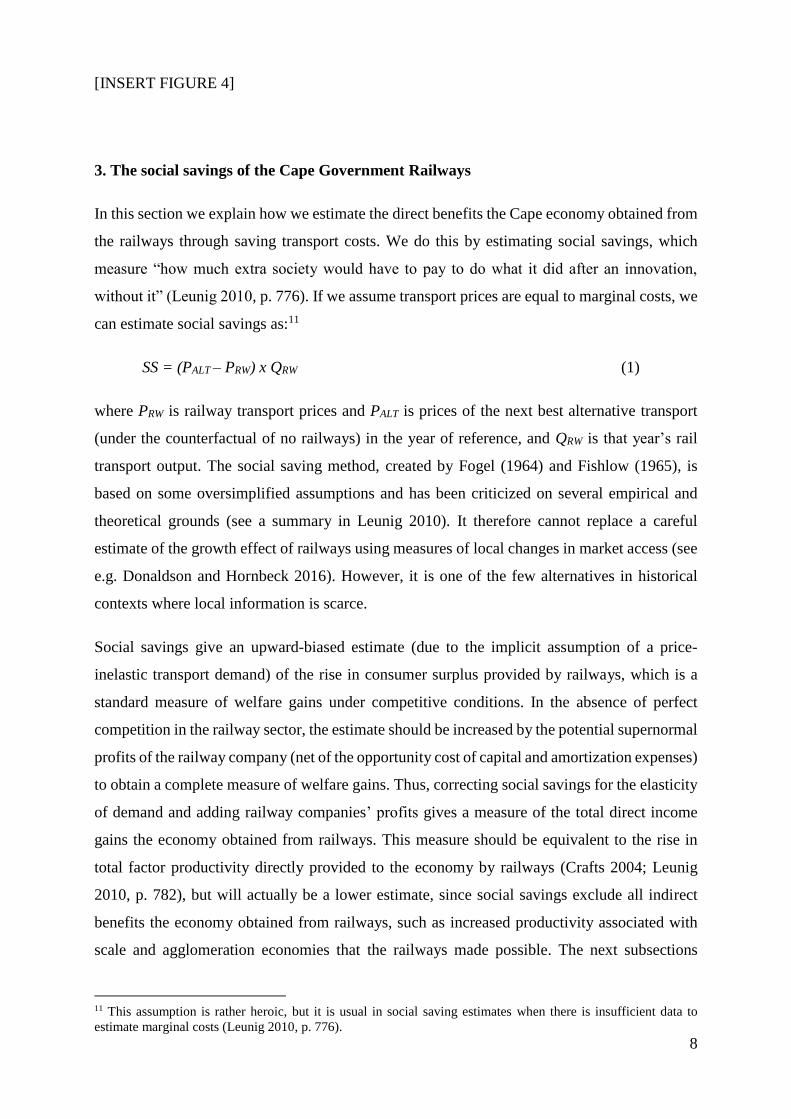
From 1873 to 1908 the Colony’s railway traffic kept pace with diamond production in the
Kimberley area, decreasing only in 1905, when international competition caused a crisis in the
diamond market. During the diamond boom, as figure 4 shows, and even leaving aside the
1900–1902 peak, the result of increasing transport requirements associated with the second
Anglo-Boer War, rail freight transport accounted for an exceptionally high share of the Cape
GDP.10
10 By contrast, the effect of the gold production boom is less evident, since the CGR had to compete with lines
going to Portuguese East Africa and Natal for the Witwatersrand trade.
8
[INSERT FIGURE 4]
3. The social savings of the Cape Government Railways
In this section we explain how we estimate the direct benefits the Cape economy obtained from
the railways through saving transport costs. We do this by estimating social savings, which
measure “how much extra society would have to pay to do what it did after an innovation,
without it” (Leunig 2010, p. 776). If we assume transport prices are equal to marginal costs, we
can estimate social savings as:11
SS = (PALT – PRW) x QRW (1)
where PRW is railway transport prices and PALT is prices of the next best alternative transport
(under the counterfactual of no railways) in the year of reference, and QRW is that year’s rail
transport output. The social saving method, created by Fogel (1964) and Fishlow (1965), is
based on some oversimplified assumptions and has been criticized on several empirical and
theoretical grounds (see a summary in Leunig 2010). It therefore cannot replace a careful
estimate of the growth effect of railways using measures of local changes in market access (see
e.g. Donaldson and Hornbeck 2016). However, it is one of the few alternatives in historical
contexts where local information is scarce.
Social savings give an upward-biased estimate (due to the implicit assumption of a price-
inelastic transport demand) of the rise in consumer surplus provided by railways, which is a
standard measure of welfare gains under competitive conditions. In the absence of perfect
competition in the railway sector, the estimate should be increased by the potential supernormal
profits of the railway company (net of the opportunity cost of capital and amortization expenses)
to obtain a complete measure of welfare gains. Thus, correcting social savings for the elasticity
of demand and adding railway companies’ profits gives a measure of the total direct income
gains the economy obtained from railways. This measure should be equivalent to the rise in
total factor productivity directly provided to the economy by railways (Crafts 2004; Leunig
2010, p. 782), but will actually be a lower estimate, since social savings exclude all indirect
benefits the economy obtained from railways, such as increased productivity associated with
scale and agglomeration economies that the railways made possible. The next subsections
11 This assumption is rather heroic, but it is usual in social saving estimates when there is insufficient data to
estimate marginal costs (Leunig 2010, p. 776).

9
present social saving estimates for the Cape Colony railways’ freight and passenger transport
in 1905, a year in which the GDP share of railway revenues was sufficiently representative of
the period 1873–1908 (see figure 4).
3.1 Freight traffic
To estimate social savings we need to know the amount of freight transported and the 1905 unit
prices of rail transport and alternative means of transport had there been no railways, i.e.
counterfactual transport. As in estimates for other countries, we use a restricted concept of
social savings which excludes improvements in the alternative means of transport.12 To
calculate the social savings, we assume that, in the absence of the railway, freight traffic would
have been moved by road.
We obtained road transport prices for the period in two ways. Firstly, we estimated the
differences in 1890 between the prices of four agricultural products (barley, maize, oat hay, and
wheat) in three South African cities that were not connected by rail in that year (Kimberley,
Johannesburg and Bloemfontein).13 Although differences between commodity prices do not
allow for a very precise estimation of transport costs (see Buringh et al. 2016), they have already
been used by other authors (e.g. Donaldson 2016; Temin 2013) and their level is consistent with
evidence from other sources (see below). According to this information, in 1905 prices, average
grain trade costs per ton-mile were 0.031 pounds sterling between Bloemfontein and Kimberley
(about 100 miles), 0.026 pounds between Bloemfontein and Johannesburg (about 250 miles),
and 0.014 pounds between Kimberley and Johannesburg (about 300 miles). These costs suggest
that road transport unit prices tended to decrease with distance, although the evidence is too
sparse to confirm this.
Secondly, we collected direct information on road transport prices from various sources. For
instance, the Report of the General Manager for 1906, estimating the competition that ox-
wagons still represented for railways, reported a price of 29 pence for transporting 100 lb
(pounds) of general goods from Port Elizabeth to Grahamstown, which would be equivalent to
12 As originally designed by Fogel (1965), the social saving analysis should allow for adjustments in the
counterfactual economy in the absence of railways (improved roads or canals, for instance). But because of scarcity
of information and methodological difficulties most social saving estimates ignore possible improvements and use
the actual situation of alternative transport in the year of analysis. 13 Our agricultural price data come from several issues of the Agricultural Journal, which provides monthly
prices; we use the average over the 12 months of the year 1890. Data on rail freight traffic and prices are from
the Report of the General Manager for 1906. Lack of data obliged us to exclude from the calculation the
transport of livestock, vehicles and parcels at high speed, which accounted for approximately 12 percent of the
total revenues of (low and high speed) freight transport between 1891 and 1908.
10
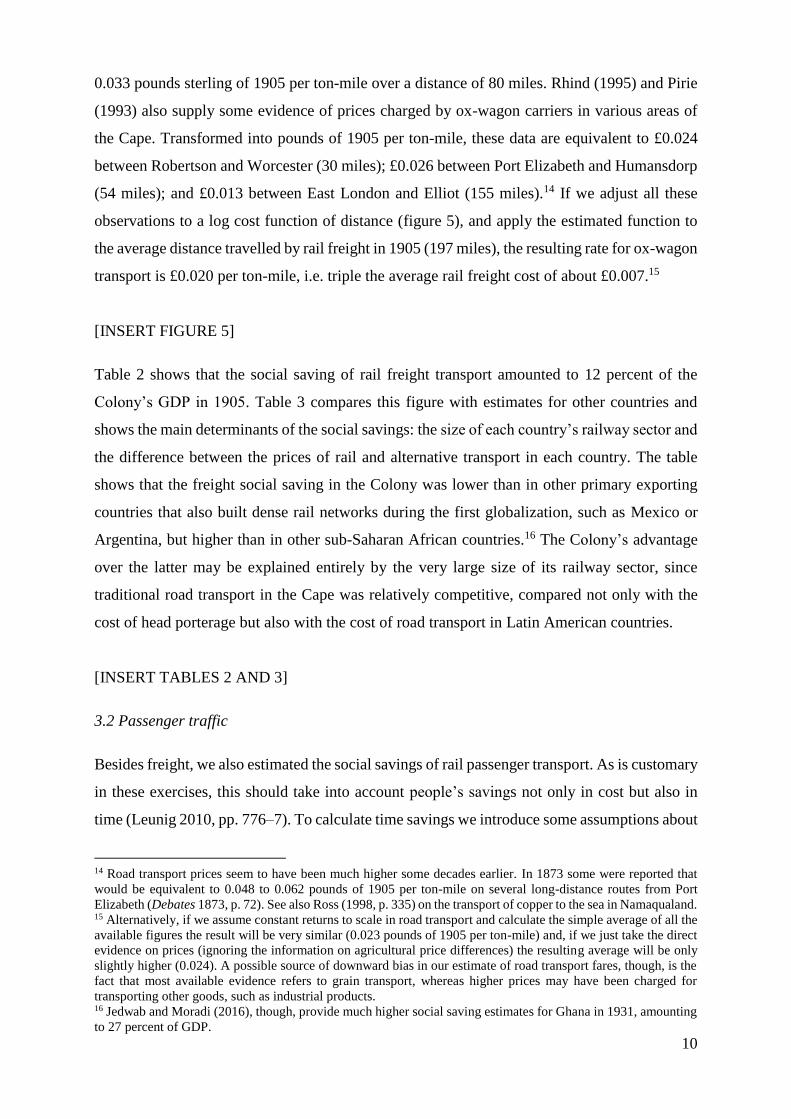
0.033 pounds sterling of 1905 per ton-mile over a distance of 80 miles. Rhind (1995) and Pirie
(1993) also supply some evidence of prices charged by ox-wagon carriers in various areas of
the Cape. Transformed into pounds of 1905 per ton-mile, these data are equivalent to £0.024
between Robertson and Worcester (30 miles); £0.026 between Port Elizabeth and Humansdorp
(54 miles); and £0.013 between East London and Elliot (155 miles).14 If we adjust all these
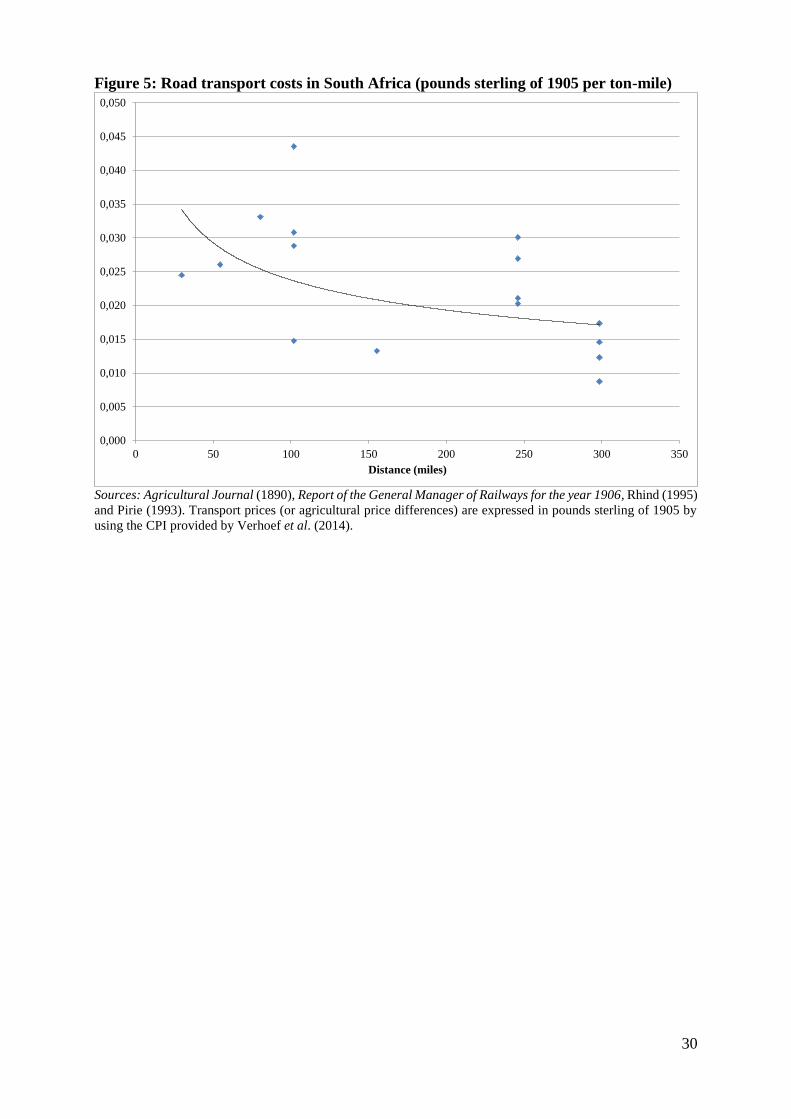
observations to a log cost function of distance (figure 5), and apply the estimated function to
the average distance travelled by rail freight in 1905 (197 miles), the resulting rate for ox-wagon
transport is £0.020 per ton-mile, i.e. triple the average rail freight cost of about £0.007.15
[INSERT FIGURE 5]
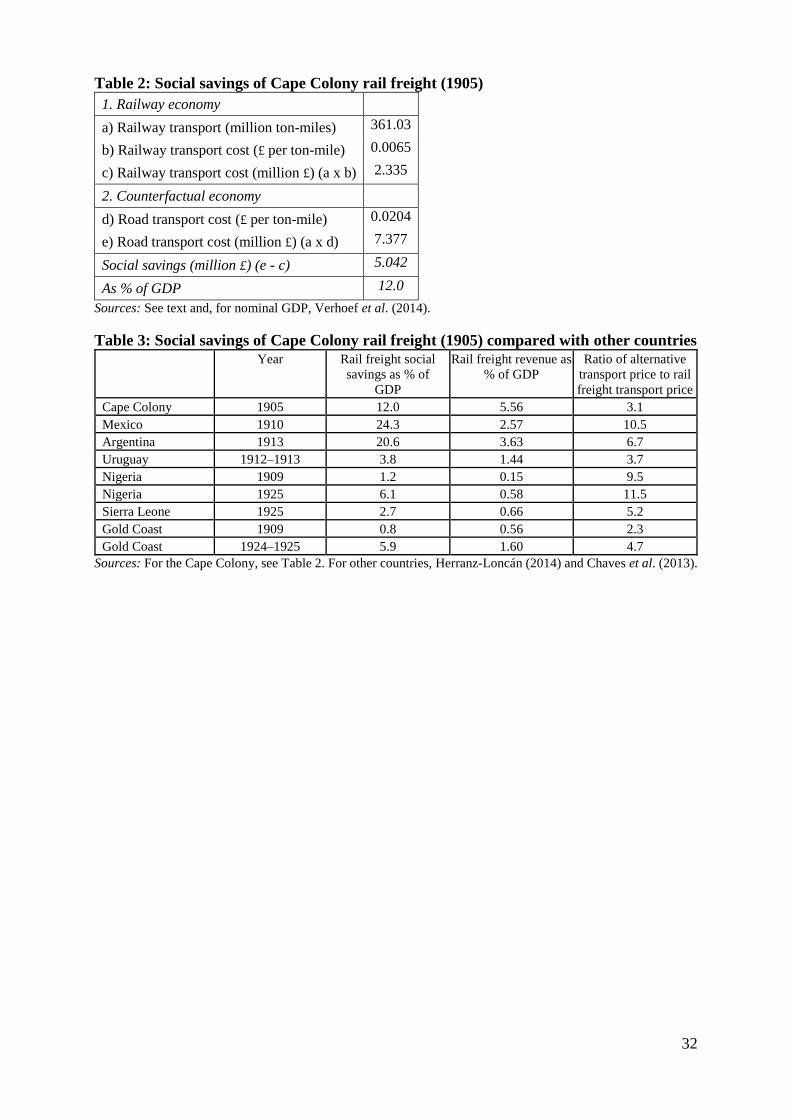
Table 2 shows that the social saving of rail freight transport amounted to 12 percent of the
Colony’s GDP in 1905. Table 3 compares this figure with estimates for other countries and
shows the main determinants of the social savings: the size of each country’s railway sector and
the difference between the prices of rail and alternative transport in each country. The table
shows that the freight social saving in the Colony was lower than in other primary exporting
countries that also built dense rail networks during the first globalization, such as Mexico or
Argentina, but higher than in other sub-Saharan African countries.16 The Colony’s advantage
over the latter may be explained entirely by the very large size of its railway sector, since
traditional road transport in the Cape was relatively competitive, compared not only with the
cost of head porterage but also with the cost of road transport in Latin American countries.
[INSERT TABLES 2 AND 3]
3.2 Passenger traffic
Besides freight, we also estimated the social savings of rail passenger transport. As is customary
in these exercises, this should take into account people’s savings not only in cost but also in
time (Leunig 2010, pp. 776–7). To calculate time savings we introduce some assumptions about
14 Road transport prices seem to have been much higher some decades earlier. In 1873 some were reported that
would be equivalent to 0.048 to 0.062 pounds of 1905 per ton-mile on several long-distance routes from Port
Elizabeth (Debates 1873, p. 72). See also Ross (1998, p. 335) on the transport of copper to the sea in Namaqualand. 15 Alternatively, if we assume constant returns to scale in road transport and calculate the simple average of all the
available figures the result will be very similar (0.023 pounds of 1905 per ton-mile) and, if we just take the direct
evidence on prices (ignoring the information on agricultural price differences) the resulting average will be only
slightly higher (0.024). A possible source of downward bias in our estimate of road transport fares, though, is the
fact that most available evidence refers to grain transport, whereas higher prices may have been charged for
transporting other goods, such as industrial products. 16 Jedwab and Moradi (2016), though, provide much higher social saving estimates for Ghana in 1931, amounting
to 27 percent of GDP.

11
the share of traveling time to deduct from the passengers’ working time in the absence of
railways, as well as their average hourly wage. Given the lack of precise data, and to make our
estimate comparable, we follow the procedures applied in research on Latin America (see
Herranz-Loncán 2014). Thus, we base our estimation on three assumptions: i) in the absence of
railways, first-class passengers would have used stagecoach transport and second and third class
passengers would have used carts or horseback, or walked; ii) the value of the working travel
time of second and third class passengers can be estimated as the average hourly wage of
unskilled workers, and that of first-class passengers as the average hourly wage of skilled
workers; and iii) only about half of the time savings were savings in working time. Table 4
shows that the total social saving that results from applying these assumptions amounts to 4.13
percent of GDP by 1905. While we recognize the significant error margin in this estimate,17 we
note that this is one of the highest percentages from a primary exporting country. In countries
like Argentina, Mexico or Brazil, for instance, the percentage ranged from 2 to 4.4 percent, and
in other sub-Saharan African countries it was negative (Chaves et al. 2013; Herranz-Loncán
2014).
[INSERT TABLE 4]
3.3 From social savings to additional consumer surplus
The sum of our estimates of freight and passenger social savings of the Cape railways in 1905
amounts to £6.78 million, or 16.1 percent of the Colony’s GDP. As noted above, this is an
upward biased estimate (due to the assumption of null demand elasticity) of the additional
consumer surplus that the economy obtained from railways. To get an unbiased estimate of that
surplus, these figures must be corrected by the elasticity of demand of freight and passenger
transport. Unfortunately, there is no information on unit prices and quantities transported by the
CGR before 1903, and the sample of observations (1903–1908) is too small to allow us to
estimate a demand function. As a second-best option, for freight we use a set of elasticity
estimates for a number of Latin American primary exporting countries in the same period,
which range from -0.5 to -0.8 (Herranz-Loncán 2014). For passengers, again using Herranz-
17 There are several possible sources of bias in this figure, arising both from the scarcity of empirical evidence and
the assumptions made. Potentially most important is the assumption of identical behavior for second and third
class passengers. If second class passengers were assumed to behave like first-class ones (i.e. to use stagecoaches
as alternative to railways) passenger social savings would increase to 8.3 percent of GDP. The estimates are also
highly sensitive to the stagecoach rates, based on an insufficiently representative sample. Therefore, a large error
margin must be allowed for the figures in table 4.
12
Loncán (2014), we assume that transport demand elasticity was approximately -1 for the first
class (since rail travel had a certain luxury component) and that, in the absence of railways, all
second and third class passengers would still have travelled by some means, because they
journeyed mainly from necessity. This would be equivalent to assuming a null elasticity to the
increasing cost of traveling for the lower classes. The estimates of consumer surplus of rail
freight and passenger transport that result from applying these elasticities to the social saving
figures are shown in table 5.18
According to these figures, the aggregate consumer surplus of freight and passenger transport
of the Cape railways can be estimated as 9.7 to 11.2 percent of GDP. To measure the total direct
income gain the Cape economy obtained from railways, we increase these figures by the amount
of extraordinary profits (net of opportunity cost and amortization of capital) that accrued to the
railway company. According to the Report of the General Manager for 1905, the CGR’s net
operating revenues were £1.073 million that year – 3.7 percent of the accounting value of its
capital.19 By comparison, the interest rates of railway bonds and most Cape Government debt
issues were set at 3.5 or 4 percent (Statistical Register for 1903). Given that net revenues should
cover both the amortization of equipment and infrastructure and the opportunity cost of capital,
any return below 5 percent of capital would have been too low to make the CGR a source of
profits for its owners (in this case, the colonial government). Although the real and the
accounting value of capital may have been different due to the prevailing accounting procedures
and inflation, it is difficult to imagine a sufficiently large difference to move this percentage to
the zone of significant positive profits. We therefore assume that the figures in table 5 account
for the Cape economy’s entire direct income gain from railways in 1905.
As noted earlier, this amount would also be equivalent to the rise in total factor productivity
directly provided by railways from the year they began operating to the year of reference of the
estimates. These TFP gains accounted for 10.9 to 12.6 percent of the increase in the Cape’s
GDP between 1873 and 1905. If we extract from GDP growth the share that is merely labor
accumulation, the result represents the Cape’s aggregate increase in labor productivity over that
18
The ratio of the additional consumer surplus to the social savings is given by [(1--1)/(1-)(-1)], where is the
absolute value of the elasticity of transport demand and is the ratio of alternative transport prices to rail transport
prices; see, for instance, Fogel (1979). 19 Data on capital for the whole period are from the Report of the General Manager for the year 1905. The
yearly population of the Colony is estimated as a log interpolation between census figures, taken from the
Official Year-Book. We deflate the yearly differences in the capital account with Verhoef et al.’s (2014) CPI and
accumulate the resulting deflated figures over time. We use GDP and CPI figures from Verhoef et al. (2014).
13
period.20 According to the usual growth accounting decomposition, that labor productivity
growth was the combined result of increase in capital per capita and TFP gains. We can
therefore estimate the total direct contribution of railways to the Colony’s labor productivity
over that period by using the sum of the railway TFP gains (table 5) and the impact on labor
productivity of the per capita growth of railway capital.
[INSERT TABLE 5]
Between 1873 and 1905 railway capital per capita grew at a yearly rate of 4.52 percent. To
transform this rate into an estimate of what railway capital accumulation contributed to labor
productivity growth, we multiply it by the factor income share of railway capital, i.e. (assuming
zero profits) the average ratio of railway net revenues to nominal GDP from 1873 to 1905,
which was 3.32 percent.21 The product is 0.15 percent, or 13.2 percent of the Cape labor
productivity growth rate. The sum of this percentage and the TFP contribution amounts to 29.2
to 31.5 percent of the increase in labor productivity in the Cape economy between 1873 and
1905. In other words, railways directly accounted for approximately 30 percent of the increase
in income per capita or labor productivity in the Cape Colony between the beginning of the
railway era and the end of the diamond boom. Despite the high error margin of this figure, due
to the insufficient empirical data and the numerous assumptions introduced in the estimation, it
is a fairly robust indication of the essential role that railways played in the growth and
transformation of the Cape’s economy during this period. Moreover, this figure excludes the
indirect effects of the railway, such as agglomeration economies arising from the urban
concentrations that railways made possible. So, economic growth in the Cape Colony during
the first globalization seems to have been, to a significant extent, directly associated with
investment in the railway.
But were those gains sufficient to justify the amount of capital invested? Comparing our
estimate of railway benefits for 1905 with the value of capital we can obtain the social rate of
return for that single year. Although this cannot replace a complete estimate of the social rate
of return for the whole life of operation of the railway system, or at least for a sufficiently long
period, it may at least provide a preliminary approach to estimating the levels the rate reached
during the diamond cycle. We estimate that railway capital was £33.20 million in 1905 (see
20 For simplicity, from now on we assume that the growth rates of labor productivity and per capita GDP were the
same. We use GDP and CPI figures from Verhoef et al. (2014). We estimate the yearly population of the colony
as a log interpolation between census figures, taken from the Official Year-Book (1919). 21 This figure is the average over 1873–1905 of the yearly ratios between the net returns of the railways from
Report of the General Manager for the year 1905 and nominal GDP from Verhoef et al. (2014).
14
footnote 23). Thus the social returns of the railways that year represented a respectable 12.3 to
14.2 percent of the capital invested. These figures are in line with the social returns of railways
in other countries with low population density, such as the US and Brazil, and are much higher
than those estimated for Canada and Uruguay (Mercer 1982; Carlos and Lewis 1992;
Summerhill 2003; Díaz Steinberg 2016).22 Given that our estimate of railway benefits excludes
the possible indirect effects, it seems safe to say that the Cape economy obtained satisfactory
social returns from the capital invested in the rail network.23
4. The distribution of the Cape railway benefits
As noted above, after 1872 almost all Cape railways were owned by the government of the
Colony and managed by a public company, the CGR. Public ownership of railways before
World War 1 was not rare in developing countries, especially in the European overseas colonies.
Public construction and management of railways could serve different aims. Bogart and
Chaudhary (2012), for instance, have shown how the colonial government in India used
railways for public revenue. By 1913, railways accounted for 35 percent of the total income of
the British Raj, making up for the government’s inability to develop the tax system and obtain
similar returns from other sources.
The case of the Cape was very different. Despite becoming the largest single unit of the
Colony’s public administration,24 the CGR seems never to have been a significant source of net
revenue for the colonial government, whose tax system was heavily dependent on custom
duties. This was the consequence of the low level of CGR’s financial returns during the whole
life of the company. Figure 6 shows the evolution of the ratio of the CGR’s net operating
revenues to the accounting value of capital. This ratio remained below 5 percent with the
exception of six years; as noted earlier, the average for the whole period was just 3.7 percent.
Under those circumstances, the railway could hardly become a big source of revenue for the
22 The significance of this comparison depends on the representativeness of the Cape railways’ social rate of return
in 1905 for their whole operating period (1873–1910). The ratio of CGR net operating revenues to accounting
capital in 1905 was 3.70 percent, very similar to the average over the period 1873–1908 (3.74 percent). If we
deflate net revenue and capital figures and express them in 1905 pounds, the 1905 ratio becomes 3.23 percent and
the average for 1873–1908 is 2.83 percent. 23 A thorough assessment of the social profitability of railways should be based on a comparison of those returns
with the returns that might have been obtained by investing the capital elsewhere. But it is difficult to imagine any
other large project which, as a whole, could have given comparable benefits to the economy. 24 Between 1906 and 1907 and 1908 and 1909, despite being years of crisis in the railway sector, the average
yearly gross revenue of the public railway system was £3.3 million, whereas all other public revenue of the Colony
together amounted to £4.1 million (Statistical Register for 1909).
15
government, since net revenues had to meet amortization requirements and the opportunity cost
of capital, and in fact it was often a financial burden. The Statistical Register for 1909 shows
public debt interest payments for the budget years 1899–1900 to 1908–09. Railway debt is
shown separately only for 1906–07 and 1907–08 but if we assume that in other years it
represented the same percentage of total public debt interest payments as in those two budget
years (63 percent), then during half of the period 1899 to 1908 railway total costs were higher
than gross revenues. Moreover, whereas the railway returns net of debt interest payments were
on average 0.21 percent of capital during those years, if we deflate the railway’s yearly gains
and losses and accumulate them over time, the final result is an accumulated loss of £97,729
(pounds of 1905) by 1908.25
[INSERT FIGURE 6]
Low financial returns reflect to some extent the low population density in the Colony. Although
not strictly comparable with more rigorous estimates of internal rates of return for other sparsely
populated countries, an average return of 3.7 percent of capital is similar to the figures for
Canada, Uruguay and some US and Brazilian lines with low railway profitability (Mercer 1982;
Carlos and Lewis 1992; Summerhill 2003; Díaz Steinberg 2016). However, the Cape
government did not see the railways as a source of public revenue. This option seems never to
have been even considered in parliament; the Debates from 1870 to 1895 provide little evidence
of public concern about the financial returns of the railway company, rather the opposite.
Apparently the prevailing opinion matched that of MP Robert Godlonton (cited at the start of
this paper) in the early discussions about acquiring the Wellington railway: the railways were
for the public benefit rather than for profit.
Most references to the railway in the Debates during the last decades of the nineteenth century
describe it as a powerful instrument of growth and development, essential for the exploitation
and export of the country’s natural resources, particularly its minerals, which were key to the
Colony’s prosperity. The railways not only brought in export revenue but also boosted the
farming districts that supplied the mines. They were thus expected to have positive effects on
land values, output, immigration and the occupation of empty land.26 By contrast, we can find
no reference whatsoever in the Debates to their potential to generate government revenue, and
almost no mention of political or administrative objectives that the railway system might serve.
25 Statistical Register for 1909. We transform the data from budget to calendar years assuming that interest
payments were equally distributed along the budget year. 26 We found many references to this in the Debates for various years. See Supplementary material.

16
Only occasionally did members of the Legislative Council allude to the military interest of some
specific lines, usually to reinforce a claim about their economic importance. And from the early
1890s, on several occasions the extension towards the Free State and the Transvaal was
described as a means to unify South Africa. Regarding the line from Port Elizabeth to
Bloemfontein, MP Mr. Bowker noted that “the time was not far distant when all the Colonies
and States of South Africa would be one people”, and the best way to bring this about was to
vote for this proposed extension.27
Given these perceptions, it is not surprising to see frequent interventions in the Legislative
Council by MPs keen to bring the railway to their own constituencies. No district wanted to be
deprived of railways, since without them, as MP Mr Wilmot observed, “their land must lie
dormant” and “neither development nor prosperity [would be] possible”.28 Bringing the
railways to certain districts to stimulate their economy was justified even if they might burden
the government budget. This was actually the position of Prime Minister Cecil John Rhodes,
who stated before the Legislative Council, regarding a railway extension project, that the
government “did not expect these railways to pay large interest on the capital expended” and
“would be content if they paid their working expenses and [gave] those very promising districts
a chance of development”.29
In other words, there was room for the construction of unprofitable railways for the benefit of
specific districts. This developmental approach to railways may partially explain the CGR’s
low returns. And we can easily understand why debates in the Legislative Council between
representatives of different regions about specific railway routes often became heated. For
instance, in response to a proposal that the Cape Government be authorized to confer with the
governments of the Orange River Colony and the Transvaal to discuss the best northern route
for the railways, MP Mr. Joubert warned that the Cape Government should attach “some weight
to the point whence the line should be extended”. He argued that if the Port Elizabeth line were
extended “we should have to give a drawback on our Customs duties” and he asked “what
advantage would that be to the Colony?” He said that finding the shortest distance was not the
only object: as the western districts produced more than the eastern, more freight could be
obtained if the western line were extended, and if this were not done, only European importers
would benefit.30
27 Debates, Vol. XXIV (1890), p. 157. 28 Debates, Vol. XXIX (1895), p. 269. 29 Debates, Vol. XXIX (1895), p. 278. 30 Debates, Vol. XXI (1887), pp. 129–30.
17
It seems therefore that the Cape parliament was fully aware of the potential distributional effects
of railway policy decisions. Thus, when the Commissioner of Crown Lands and Public Works
tabled the Railways Bill on 13 June 1881, a bill that would extend the trunk line from Cape
Town into Griqualand West (i.e. the Kimberley area), he noted that the “position of the colonial
railway was remarkably encouraging” and that “the government was justified in coming to
parliament and proposing additional railway expenditure”. He said there was “very great
demand in the country for an extension of the railway system, especially to Griqualand West”,
because the whole Colony had “shared in the advantages which had been derived from
Griqualand”.31 In response, MP Mr. Burger objected to the way the trunk lines were to be
extended, particularly when he found that the government proposals “would be most favorable
to an already highly privileged part of the Colony, and in this way an injustice was done to a
long and shamefully neglected portion of it”.32
As could be expected, not all districts, economic sectors and population groups had the same
capacity to lobby parliament for railways. Differences in political influence could result in
biases in railway policy, favoring some regions or sectors at the expense of others. As a
consequence, the social gains of the Cape railways benefited some more than others. Recent
research has found persistent spatial effects of railways in other African countries (Jedwab et
al. 2016; Jedwab and Moradi 2016). The possible bias in Cape railway policy may have had a
similarly long-term effect on income per capita from district to district.
The debates in the Legislative Council provide some scattered evidence of the lobbying
activities of certain districts and sectors. For instance, we find evidence of the influence of
mining interests in a discussion about completing the trunk line between Cape Town and
Kimberley. In 1884 the Orange River and Kimberley Railway Bill was tabled in parliament to
allow a private company to construct the remainder of the line. Mr. Upington summarized the
reason for this Bill. An attempt had been made to induce the government to pay for the
construction of the line from the Orange River to Kimberley, but the government had declined
to continue the construction using public funds. Pressure was then brought to bear on the
government “by persons connected with the Mining and other industries in Kimberley”, who
said “it would be of the greatest possible advantage to them to have the railway constructed to
Kimberley” and asked the government “to grant them an empowering Bill”.33
31 Debates, Volume XV (1881), p. 116. 32Debates, Volume XV (1881), p. 118. 33 Debates, Volume XVIII (1884), p. 231.
18
Although the names of these “persons” are not recorded, it is probable that Rhodes was
involved. He had moved to the diamond fields in 1871 and built up a business empire that led
to the establishment of De Beers Consolidated Mines in 1888. But he was also active in politics,
becoming a member of the Cape parliament in 1880 and Prime Minister in 1890. Given his
interests in the diamond mines, he might well have lobbied for completion of the last part of
the line to Kimberley. But similar links could also be found to certain farming interests. In 1877
MP Mr. Neethling noted angrily that he had “always thought that the present Government
would sympathize with the farming population, because more than one member of the Cabinet
was connected with agriculture”.34
It is difficult to quantify the influence of districts or sectors on railway policy decisions, but we
have two sets of evidence. The Report of the General Manager for 1905, for example, provides
detailed traffic information by station and freight category. From this we can see which districts
carried the most railway traffic and which were net suppliers and net importers of each category
of commodity. The first thing we note from these data is the centrality of the Kimberley
diamond fields in the railway system. Apart from Cape Town, Port Elizabeth and East London,
in 1905 Kimberley was the station that generated by far the highest revenue. The Kimberley
district received much more freight than it supplied. The very high value-to-weight ratio of
diamonds meant that a cheap transport method was needed not so much to dispatch the product
as to supply the production area with industrial commodities, construction materials, fuel and
foodstuffs. In other words, railways were necessary to support a growing settlement around the
mines. According to 1905 traffic data, the Cape rail network was used mostly to supply
Kimberley district.
By 1911 the Kimberley district, with just 3.3 percent of the Colony’s population, was the
destination of very high percentages of certain categories of rail freight. It had negative balances
in almost all categories, and in each of those categories its imports accounted for very high
shares of the sum of imports of all Cape Colony districts with deficit, such as 15 percent of
general merchandise, 13 percent of grain of South African origin, 23 percent of other South
African agricultural produce, 44 percent of flour, meal, malt and bran of South African origin,
51 percent of South African timber, 52 percent of firewood, and an impressive 79 percent of
South African coal and coke. Looking at these figures another way, we find that per person in
1905 the Kimberley district received, through the railways, 457 kg of cereals, flour, meal, malt
or bran, 14.5 kg of wine and spirits of South African origin, 265 kg of other agricultural
34 Debates, Vol. X (1877), p. 278.
19
produce, and 354 kg of firewood. These rail deliveries supplied a huge share of the Kimberley
population’s needs – clear evidence that the growth of the area was due largely to the railway.
Railways, therefore, removed the restrictions to the growth of Kimberley (as they did with the
Witwatersrand) while dramatically reducing, at the same time, the effect of distance as
determinant of domestic trade flows. Thanks to railways, the growth of Kimberley did not
depend on the supplying capacity of the closest regions; rather, the traffic data shows that its
main suppliers were the port cities and several districts that close to Cape Town, and far from
the diamond fields. Table 6, based on traffic data, shows the districts that were the main
domestic suppliers of certain foodstuffs in 1905, and the percentage of the total inter-district
railway deliveries they supplied.
[INSERT TABLE 6]
Apart from Port Elizabeth and East London, the districts in table 6 belong to the Western Cape,
and all of them except for Oudtshoorn are in the vicinity of Cape Town, i.e. at the maximum
possible distance from Kimberley. Although we cannot know the specific origins of
Kimberley’s imports, all seems to indicate that the diamond district was provisioned with
industrial commodities and foodstuffs that were either imported from other countries or
produced mainly in the western rather than the (much closer) eastern part of the Cape. The
railways negated the advantage of proximity to the mining districts. The priority given to the
connection between Cape Town and Kimberley enabled the distant (but arguably more
competitive) Western farmers to become the main suppliers of the country’s needs and, together
with the mining districts, to enjoy an exceedingly large share of the benefits of railways.
The second set of evidence we have of the results of railway policy is what the decisions did to
regions that remained almost completely deprived of railways, the most extreme cases being
Basutoland and the Transkei which, despite their high demographic density, received almost no
railway investment during the period under analysis.35 This may have caused not just economic
stagnation but actual decay. Keegan (1986, p. 200) notes that in the late 1870s “Basutoland
quickly emerged as an indispensable provisioner of the Diamond Fields… The trains of laden
transport wagons making their way through the Free State to the Diamond Fields were a
35 The only exceptions were two short branch lines that crossed the border to connect Maseru (1905) in Basutoland
and Butterworth (1906) in the Transkei to the network, but without making further advances into the territory. The
Butterworth line was extended to Mthatha only in 1916.
20
common sight at the time”. But railways soon brought competition, not only from the western
parts of the Colony but also from America and Australia. In March 1887 Robert Germond, a
missionary at Thabana Morena in Basutoland, noted that the railway had “profoundly modified”
the region’s economic situation. He said that Basutoland:
produces less and finds no outlet for its products. Its normal markets, Kimberley and the
Free State, purchase Australian and colonial wheat… Basutoland, we must admit, is a
poor country… Last year’s abundant harvest has found no outlet for, since the building
of the railway, colonial and foreign wheat have competed disastrously with the local
produce. (Germond 1967, p. 469)
The price of grain plummeted. After the construction of railways, a muid of grain
(approximately one hectoliter), which had once been worth up to 20 shillings, could be sold for
no more than 4 shillings (Eldredge 1993). The discovery of gold on the Witwatersrand in 1886
brought some brief relief. But when the railway line reached Johannesburg in 1893, it brought
with it “cheap Australian flour, just as had happened at Kimberley some years earlier” (Keegan
1986, p. 209). The Transkei, which had started to supply food to the mining areas in the 1860s
and 1870s, was similarly affected. As the rail network reached the mines these districts became
more or less isolated from the national market and their living standards declined (Juif et al.
2014). Inability to access the interior markets diminished their surplus-generating capacity and
reduced their control over the disposal of the surplus (Bundy 1972).
Lack of railways in Basutoland and the Transkei meant that an area of almost 19,000 square
miles and a population of 1,183,492 people in 1904 was disconnected from the transport
network. Demographic pressure was especially intense in the Transkei, where population
density reached 118 in 1904; in contrast, the Colony’s average density was only 9. Figure 2
shows how the railways bypassed the most densely populated regions, which were those with
the biggest black populations. The routes that were proposed in those areas were never built,
and were never intended to connect to the main network.
Both Basutoland and the Transkei were harmed by being isolated from the direct routes from
the main ports to the mines, by the ruggedness of their territory, and by their history of political
resistance. The Transkei’s interests were also negatively affected by a political system that
deprived most of its population of representation: in 1904 the Transkei had 35 percent of the
Colony’s population but in 1907 it had only 3.8 percent of the registered voters. The Transkei
was also underrepresented in parliament, with just 4 out of 107 seats in the House of Assembly
21
in 1907 (3.7 percent).36 The rest of the Colony, with 65 percent of the population, had over 96
percent of the registered voters and seats.
Not coincidentally, 40 percent of the seats in the House of Assembly and the Legislative
Council were held by the Western regions, which had only 22 percent of the population and, as
table 6 shows, included some of the areas that benefited most from the transport cost reduction
brought about by the railways.37 Under these circumstances, voices in favor of the construction
of railways in Basutoland or the Transkei were unlikely to be heard in parliament. Neither the
Kimberley miners nor the white farmers of the Western Cape had any interest in railway lines
crossing those regions, since they were not on the routes between the mining areas and the ports
or the western farming districts. And, although South African unification was mentioned in
some of the speeches in favor of railways crossing the Orange Free State border, nobody alluded
to the possibility of using railways to integrate the Transkei with the rest of the country.
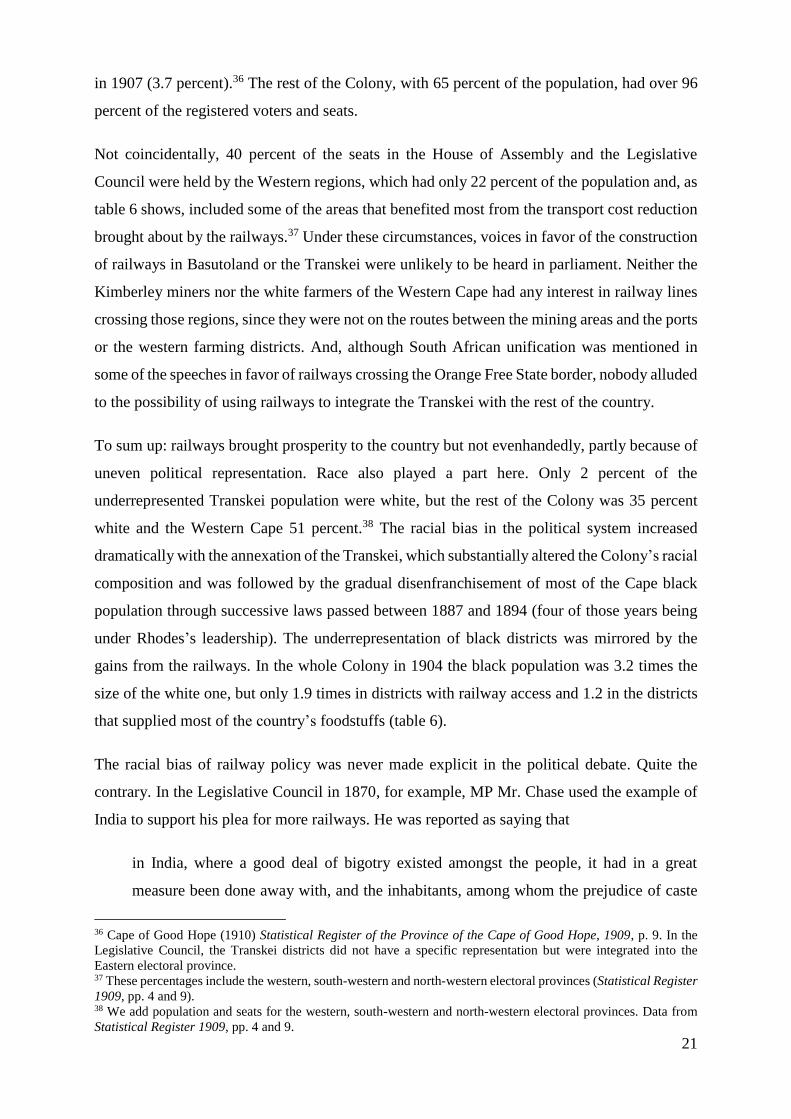
To sum up: railways brought prosperity to the country but not evenhandedly, partly because of
uneven political representation. Race also played a part here. Only 2 percent of the
underrepresented Transkei population were white, but the rest of the Colony was 35 percent
white and the Western Cape 51 percent.38 The racial bias in the political system increased
dramatically with the annexation of the Transkei, which substantially altered the Colony’s racial
composition and was followed by the gradual disenfranchisement of most of the Cape black
population through successive laws passed between 1887 and 1894 (four of those years being
under Rhodes’s leadership). The underrepresentation of black districts was mirrored by the
gains from the railways. In the whole Colony in 1904 the black population was 3.2 times the
size of the white one, but only 1.9 times in districts with railway access and 1.2 in the districts
that supplied most of the country’s foodstuffs (table 6).
The racial bias of railway policy was never made explicit in the political debate. Quite the
contrary. In the Legislative Council in 1870, for example, MP Mr. Chase used the example of
India to support his plea for more railways. He was reported as saying that
in India, where a good deal of bigotry existed amongst the people, it had in a great
measure been done away with, and the inhabitants, among whom the prejudice of caste
36 Cape of Good Hope (1910) Statistical Register of the Province of the Cape of Good Hope, 1909, p. 9. In the
Legislative Council, the Transkei districts did not have a specific representation but were integrated into the
Eastern electoral province. 37 These percentages include the western, south-western and north-western electoral provinces (Statistical Register
1909, pp. 4 and 9). 38 We add population and seats for the western, south-western and north-western electoral provinces. Data from
Statistical Register 1909, pp. 4 and 9.
22
prevailed in its extremest degree… now commingled in the common vehicle, cheapness
and convenience having banished exclusiveness. Railway extension at both ends of the
Colony was something he should like to see carried out with all speed, and it was his firm
belief that until they had more railway communication the Colony would never be what
it should be.39
But the political economy of the Cape, with its increasing underrepresentation of the
predominantly black regions, meant that Mr. Chase’s hopes were never fully realized.
To overcome the isolation that prevented them from competing as suppliers of the economic
hubs, the people of the Transkei could of course migrate there, and some did. Impoverished
black farmers left home and went to work as laborers on white-owned farms or in the mines.
But, gradually, restrictions on movement and especially permanent settlement (notably in the
Glen Grey Act promulgated by Rhodes in 1894) stopped black migrants moving to those areas
permanently. Early segregation policy thus joins distance from the railway as a force explaining
the economic decay of Cape regions such as the Transkei and Basutoland.
5. Conclusion
More than 30 years ago, Pirie (1982, p. 221) observed that railway systems in southern Africa,
“while promoting growth in some localities… had and continue to have some debilitating
effects”. He said the benefits of railways “are not evenly spread and at the same time as being
an agent of development, rail investment has been associated with underdevelopment”. Our
research investigated how this happened in the Cape Colony.
From the mid-nineteenth century, globalization and the discovery of diamonds at Kimberley
transformed the Colony into a prosperous exporting region with a steadily increasing GDP and
eventually one of the largest and densest rail networks on the continent. By reducing transport
costs to the interior, the railway eased the movement of labor and goods to the diamond fields,
and later to the Transvaal goldfields. The contribution to economic growth was enormous: we
estimate that railway may explain about 30 percent of the increase in income per capita in the
Cape during the diamond-mining period (1873–1905). This is a very large share for a single
investment and a clear indicator of the transformative power of the railways.
39 Debates, Volume III (1870), p. 232.
23
But the transformation did not benefit everyone. The railways supplied the mining centers with
overseas goods imported through the port cities and agricultural produce from the western parts
of the Colony. Suppliers in the closer eastern regions, such as the Transkei and Basutoland,
lacked railways and could not compete. Government economic policy of the time had a lot to
do with this. Unlike the case of colonial India, where railways brought high returns for the state,
in the Cape the returns hardly covered the amount the government invested and the railways
were explicitly used to encourage development. However, uneven distribution of political
representation meant that only certain regions and sectors benefited. Those with access to the
political apparatus, notably the owners of the diamond mines, with the western farmers as their
political allies, could get their demands met. Underrepresented regions, with predominantly
black populations, were largely excluded from the benefits of the mineral boom. The Cape
Colony’s railways brought prosperity but also, indirectly, racial segregation. South Africa’s
twentieth century racial inequality, it seems, arrived partly via the tracks of its nineteenth
century railroads.
24
Supplementary material
Supplementary material is available at EREH online.
References
Beet, G. (1924). Old coaching days in South Africa: Reminiscences of stirring times. In
Weinthal, L. (ed.), The Story of the Cape to Cairo Railway and River Route from 1887
to 1922. Luton: Gibbs, Bamforth and Co.: pp. 239–67.
Bignon, V., Esteves, R. and Herranz-Loncán, A. (2015). Big push or big grab? Railways,
government activism, and export growth in Latin America, 1865–1913. Economic
History Review 68, pp. 1277–305.
Bogart, D. (2010). A global perspective on railway inefficiency and the rise of state ownership,
1880–1912. Explorations in Economic History 47, pp. 158–78.
Bogart, D. and Chaudhary, L. (2012). Regulation, ownership, and costs: A historical
perspective from Indian railways. American Economic Journal: Economic Policy 4, pp.
28–57.
Bogart, D. and Chaudhary, L. (2015). Off the rails: Is state ownership bad for productivity?
Journal of Comparative Economics 43, pp. 997–1013.
Bogart, D., Chaudhary, L. and Herranz-Loncán, A. (2015). The growth contribution of colonial
Indian railways in comparative perspective. Unpublished research paper: University of
California-Irvine.
Boshoff, W.H. and Fourie, J. (2016). When did South African markets integrate into the global
economy? Studies in Economics and Econometrics (forthcoming).
Bundy, C. (1972). The emergence and decline of the South African peasantry. African Affairs
71, pp. 369–88.
Buringh, E., Bosker, M. and Van Zanden, J.L. (2016). A new look at Roman sea freight rates.
Diocletian’s price edict reconsidered. Unpublished research paper.
Burman, J. (1984). Early Railways at the Cape (Cape Town: Human & Rousseau).
Carlos, A.M. and Lewis, F. (1992). The profitability of early Canadian railways: Evidence from
the Grand Trunk and Great Western railway companies. In Goldin, C. and Rockoff, H.
(eds), Strategic Factors in Nineteenth Century American Economic History: A Volume
to Honor Robert W. Fogel. Chicago: University of Chicago Press, pp. 401–26.
Chaves, I.N., Engerman, S.L. and Robinson, J.A. (2013). Reinventing the wheel: The economic
benefits of wheeled transportation in early British Colonial West Africa. NBER
(National Bureau of Economic Research) Working Paper 19673.
25
Cilliers, J. and Fourie, J. (2016). Social mobility during South African industrial take-off. ERSA
(Economic Research Southern Africa) Working Paper 617.
Cilliers, J. and Mariotti, M. (2016). The fertile frontier: Differential fertility in a settler colony.
Unpublished research paper: Stellenbosch University.
Coatsworth, J.H. (1979). Indispensable railroads in a backward economy: The case of Mexico.
Journal of Economic History 39, pp. 939–60.
Crafts, N.F.R. (2004). Social savings as a measure of the contribution of a new technology to
economic growth. LSE Department of Economic History Working Paper 06/04.
De Zwart, P. (2011). South African living standards in global perspective, 1835–1910.
Economic History of Developing Regions 26, pp. 49–74.
Díaz Steinberg, G. (2016). Railway investment in Uruguay before 1914: Profitability, subsidies
and economic impact. Unpublished research paper.
Donaldson, D. (2016). Railroads of the Raj: Estimating the impact of transportation
infrastructure. American Economic Review (forthcoming).
Donaldson, D. and Hornbeck, R. (2016). Railroads and American economic growth: A “market
access” approach. Quarterly Journal of Economics (forthcoming).
Eldredge, E. (1993). A South African Kingdom: The Pursuit of Security in Nineteenth-Century
Lesotho. Cambridge: Cambridge University Press.
Fishlow, A. (1965). American Railroads and the Transformation of the Antebellum Economy.
Cambridge, MA: Harvard University Press.
Fogel, R.W. (1964). Railroads and American Economic Growth: Essays in Econometric
History. Baltimore, MD: John Hopkins Press.
Fogel, R.W. (1979). Notes on the social saving controversy. Journal of Economic History 39,
pp. 1–54.
Fourie, J., Inwood, K. and Mariotti, M. (2016). Can historical changes in military technology
explain the industrial growth puzzle? Unpublished research paper: Stellenbosch
University.
Germond, R. (1967). Chronicles of Basutoland: a running commentary on the events of the
years 1830-1902. Morija, Lesotho: Morija Sesuto Book Depot.
Greyling, L. and Verhoef, G. (2015). Slow growth, supply shocks and structural change: The
GDP of the Cape Colony in the late nineteenth century. Economic History of Developing
Regions 30, pp. 23–43.
Herranz-Loncán, A. (2011). The role of railways in export-led growth: The case of Uruguay,
1870–1913. Economic History of Developing Regions 26, pp. 1–32.
26
Herranz-Loncán, A. (2014). Transport technology and economic expansion: The growth
contribution of railways in Latin America before 1914. Revista de Historia Económica
- Journal of Iberian and Latin American Economic History 32, pp. 13–45.
Jedwab, R. and Moradi, A. (2016). The permanent effects of transportation revolutions in poor
countries: Evidence from Africa. Review of Economics and Statistics 98, pp. 268–84.
Jedwab, R., Kerby, E. and Moradi, A. (2016). History, path dependence and development:
Evidence from colonial railroads, settlers and cities in Kenya. Economic Journal
(forthcoming).
Juif, D., Baten, J. and Frankema, E. (2014). Numeracy of African groups in the 19th century
Cape Colony: Racial segregation, missions and military privilege. Unpublished research
paper.
Keegan, T. (1986). Trade, accumulation and impoverishment: Mercantile capital and the
economic transformation of Lesotho and the conquered territory, 1870–1920. Journal
of Southern African Studies 12, pp. 196–216.
Leunig, T. (2010). Social savings. Journal of Economic Surveys 24, pp. 775–800.
Mercer, L. (1982). Railways and Land Grant Policy: A Study in Government Intervention.
Washington DC: Beard Books.
Mitchell, B.R. (2003a). International Historical Statistics: Africa, Asia and Oceania, 1750–
2000. Houndmills: Palgrave.
Mitchell, B.R. (2003b). International Historical Statistics: The Americas, 1750–2000.
Houndmills: Palgrave.
Pirie, G.H. (1982). The decivilizing rails: Railways and underdevelopment in southern Africa.
Tijdschrift voor Economische en Sociale Geografie 73, pp. 221–28.
Pirie, G.H. (1993). Slaughter by steam: Railway subjugation of ox-wagon transport in the
Eastern Cape and Transkei, 1886–1910. The International Journal of African Historical
Studies 26, pp. 319–43.
Ramírez, M.T. (2001). Los ferrocarriles y su impacto sobre la economía colombiana. Revista
de Historia Económica - Journal of Iberian and Latin American Economic History 19,
pp. 81–122.
Rhind, D.M. (1995). A Chronicle of the Cape Central Railway. Cape Town: Railway History
Group.
Ross, G.L.D. (1998). The interactive role of transportation in the economy of Namaqualand.
Unpublished PhD thesis. Stellenbosch: University of Stellenbosch.
Summerhill, W.R. (1998) Market intervention in a backward economy: railway subsidy in
Brazil, 1854‐1913. The Economic History Review 51, pp. 542–568.
27
Summerhill, W.R. (2003). Order against Progress: Government, Foreign Investment, and
Railroads in Brazil, 1854–1913. Stanford, CA: Stanford University Press.
Summerhill, W.R. (2005). Big social savings in a small laggard economy: Railroad-led growth
in Brazil. Journal of Economic History 65, pp. 72–102.
Tang, J.P. (2014). Railroad expansion and industrialization: Evidence from Meiji Japan.
Journal of Economic History 74, pp. 863–86.
Temin, P. (2013). Statistics in ancient history. MIT Department of Economics working paper
13-06.
Verhoef, G., Greyling, L. and Mwamba, J. (2014). Savings and economic growth: A historical
analysis of the relationship between savings and economic growth in the Cape Colony
economy, 1850–1909. ERSA (Economic Research Southern Africa) working paper 408.
Zegarra, L.F. (2013). Transportation costs and the social savings of railroads in Latin America.
The case of Peru. Revista de Historia Económica - Journal of Iberian and Latin
American Economic History 31, pp. 41–72.
28
Figure 1: Length (in miles) of the Cape Government Railways network (1873–1910)
Source: Official Year-Book of the Union, No. 2, 1918
Figure 2: Map of Cape Colony rail network in 1907 with size of black population by
district
Map of the Cape Colony railroads, 1907. Districts with black population are from 1911 Union of South Africa
Census.
0
500
1000
1500
2000
2500
3000
3500
18
73
18
74
18
75
18
76
18
77
18
78
18
79
18
80
18
81
18
82
18
83
18
84
18
85
18
86
18
87
18
88
18
89
18
90
18
91
18
92
18
93
18
94
18
95
18
96
18
97
18
98
18
99
19
00
19
01
19
02
19
03
19
04
19
05
19
06
19
07
19
08
19
09
19
10
29
Figure 3: CGR freight revenues as a percentage of total traffic revenues, 1873–1908 (%)
Source: Report of the General Manager of Railways for the year 1908.
Figure 4: CGR traffic revenues as a percentage of the Cape’s GDP, 1873-1906 (%)
Sources: Traffic revenues from Report of the General Manager of Railways for the year 1908 (1909), and GDP
figures from Verhoef et al. (2014).
0
10
20
30
40
50
60
70
80
90
100
18
73
18
74
18
75
18
76
18
77
18
78
18
79
18
80
18
81
18
82
18
83
18
84
18
85
18
86
18
87
18
88
18
89
18
90
18
91
18
92
18
93
18
94
18
95
18
96
18
97
18
98
18
99
19
00
19
01
19
02
19
03
19
04
19
05
19
06
19
07
19
08
0
2
4
6
8
10
12
14
16
1873
18
74
18
75
18
76
18
77
1878
18
79
1880
18
81
1882
18
83
1884
18
85
1886
18
87
1888
18
89
1890
18
91
1892
18
93
18
94
18
95
18
96
1897
18
98
1899
19
00
1901
19
02
1903
19
04
1905
19
06
1907
19
08
30
Figure 5: Road transport costs in South Africa (pounds sterling of 1905 per ton-mile)
Sources: Agricultural Journal (1890), Report of the General Manager of Railways for the year 1906, Rhind (1995)
and Pirie (1993). Transport prices (or agricultural price differences) are expressed in pounds sterling of 1905 by
using the CPI provided by Verhoef et al. (2014).
0,000
0,005
0,010
0,015
0,020
0,025
0,030
0,035
0,040
0,045
0,050
0 50 100 150 200 250 300 350
Distance (miles)
31
Figure 6: CGR net operating revenues as a percentage of capital, 1873–1908 (%)
Source: Report of the General Manager of Railways for the year 1908.
Table 1: Cape Colony rail network compared with other countries
Year Network
length (km)
Km per 10,000
sq. km of
surface
Km per
1,000 pop.
Cape Colony 1912 5,621 78.48 2.19
South Africa 1912 12,552 102.70 2.10
Nigeria 1911 438 4.74 0.02
Gold Coast 1911 270 11.33 0.14
Argentina 1912 29,454 111.24 4.27
Mexico 1912 24,963 103.74 1.27
Brazil 1912 23,857 27.60 0.94
India 1912 53,919 217.48 0.18
Japan 1912 11,384 480.92 0.22
United States 1912 397,387 681.90 2.67
Sources: For Cape Colony and South Africa, Official Year-Book of the Union, No. 2, 1918. For other countries, Mitchell (2003a,b).
0
1
2
3
4
5
6
7
8
91
87
3
18
74
18
75
18
76
18
77
18
78
18
79
18
80
18
81
18
82
18
83
18
84
18
85
18
86
18
87
18
88
18
89
18
90
18
91
18
92
18
93
18
94
18
95
18
96
18
97
18
98
18
99
19
00
19
01
19
02
19
03
19
04
19
05
19
06
19
07
19
08
32
Table 2: Social savings of Cape Colony rail freight (1905)
1. Railway economy
a) Railway transport (million ton-miles) 361.03
b) Railway transport cost (£ per ton-mile) 0.0065
c) Railway transport cost (million £) (a x b) 2.335
2. Counterfactual economy
d) Road transport cost (£ per ton-mile) 0.0204
e) Road transport cost (million £) (a x d) 7.377
Social savings (million £) (e - c) 5.042
As % of GDP 12.0
Sources: See text and, for nominal GDP, Verhoef et al. (2014).
Table 3: Social savings of Cape Colony rail freight (1905) compared with other countries
Year Rail freight social
savings as % of
GDP
Rail freight revenue as
% of GDP
Ratio of alternative
transport price to rail
freight transport price
Cape Colony 1905 12.0 5.56 3.1
Mexico 1910 24.3 2.57 10.5
Argentina 1913 20.6 3.63 6.7
Uruguay 1912–1913 3.8 1.44 3.7
Nigeria 1909 1.2 0.15 9.5
Nigeria 1925 6.1 0.58 11.5
Sierra Leone 1925 2.7 0.66 5.2
Gold Coast 1909 0.8 0.56 2.3
Gold Coast 1924–1925 5.9 1.60 4.7
Sources: For the Cape Colony, see Table 2. For other countries, Herranz-Loncán (2014) and Chaves et al. (2013).
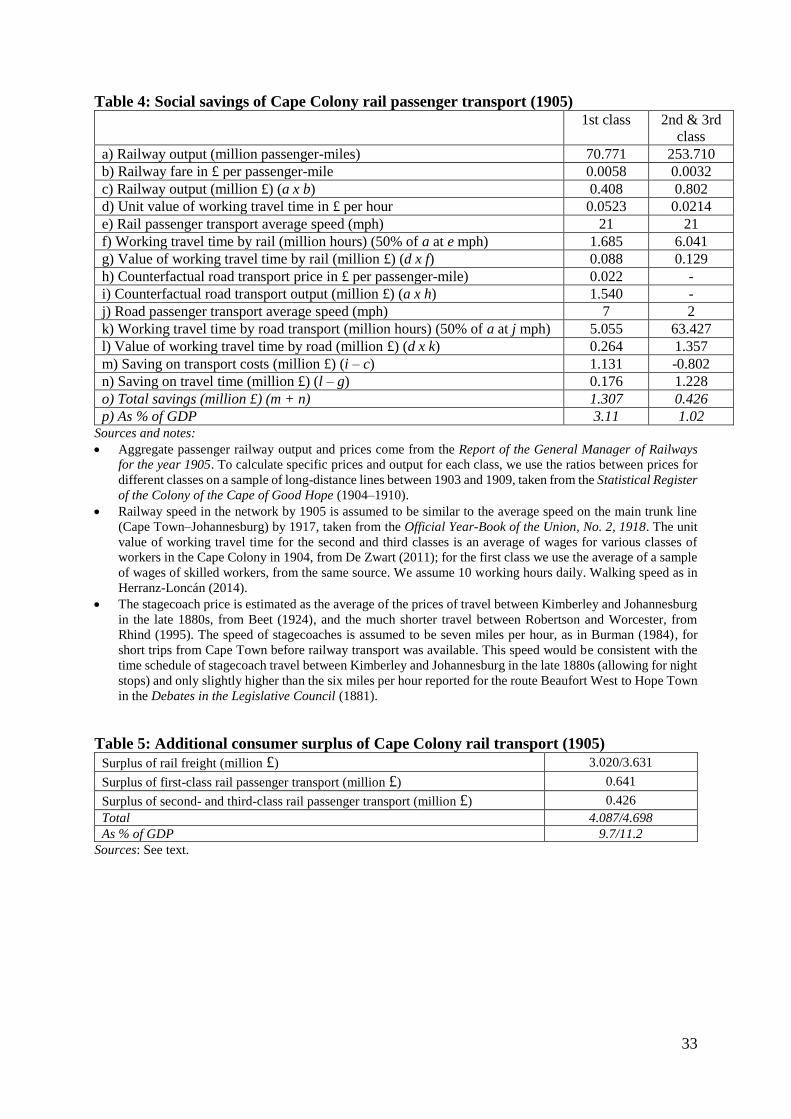
33
Table 4: Social savings of Cape Colony rail passenger transport (1905)
1st class 2nd & 3rd
class a) Railway output (million passenger-miles) 70.771 253.710 b) Railway fare in £ per passenger-mile 0.0058 0.0032 c) Railway output (million £) (a x b) 0.408 0.802 d) Unit value of working travel time in £ per hour 0.0523 0.0214 e) Rail passenger transport average speed (mph) 21 21 f) Working travel time by rail (million hours) (50% of a at e mph) 1.685 6.041 g) Value of working travel time by rail (million £) (d x f) 0.088 0.129 h) Counterfactual road transport price in £ per passenger-mile) 0.022 - i) Counterfactual road transport output (million £) (a x h) 1.540 - j) Road passenger transport average speed (mph) 7 2 k) Working travel time by road transport (million hours) (50% of a at j mph) 5.055 63.427 l) Value of working travel time by road (million £) (d x k) 0.264 1.357 m) Saving on transport costs (million £) (i – c) 1.131 -0.802 n) Saving on travel time (million £) (l – g) 0.176 1.228 o) Total savings (million £) (m + n) 1.307 0.426 p) As % of GDP 3.11 1.02
Sources and notes:
Aggregate passenger railway output and prices come from the Report of the General Manager of Railways
for the year 1905. To calculate specific prices and output for each class, we use the ratios between prices for
different classes on a sample of long-distance lines between 1903 and 1909, taken from the Statistical Register
of the Colony of the Cape of Good Hope (1904–1910).
Railway speed in the network by 1905 is assumed to be similar to the average speed on the main trunk line
(Cape Town–Johannesburg) by 1917, taken from the Official Year-Book of the Union, No. 2, 1918. The unit
value of working travel time for the second and third classes is an average of wages for various classes of
workers in the Cape Colony in 1904, from De Zwart (2011); for the first class we use the average of a sample
of wages of skilled workers, from the same source. We assume 10 working hours daily. Walking speed as in
Herranz-Loncán (2014).
The stagecoach price is estimated as the average of the prices of travel between Kimberley and Johannesburg
in the late 1880s, from Beet (1924), and the much shorter travel between Robertson and Worcester, from
Rhind (1995). The speed of stagecoaches is assumed to be seven miles per hour, as in Burman (1984), for
short trips from Cape Town before railway transport was available. This speed would be consistent with the
time schedule of stagecoach travel between Kimberley and Johannesburg in the late 1880s (allowing for night
stops) and only slightly higher than the six miles per hour reported for the route Beaufort West to Hope Town
in the Debates in the Legislative Council (1881).
Table 5: Additional consumer surplus of Cape Colony rail transport (1905)
Surplus of rail freight (million £) 3.020/3.631
Surplus of first-class rail passenger transport (million £) 0.641
Surplus of second- and third-class rail passenger transport (million £) 0.426
Total 4.087/4.698
As % of GDP 9.7/11.2
Sources: See text.

34
Table 6: Net rail deliveries of produce of South African origin from Cape Colony districts
to rest of country (1905)
Grain and cereal Flour, meal, malt and bran Other agricultural produce
District % of total net
deliveries
District % of total net
deliveries
District % of total net
deliveries
Malmesbury 36.5 Paarl 29.2 Malmesbury 35.1
East London 28.5 Tulbagh 20.5 Paarl 11.0
Caledon 23.2 Port Elizabeth 19.3 Worcester 9.9
Port Elizabeth 8.8 Cape Town 16.4 Stellenbosch 6.7
East London 6.0 Oudtshoorn 6.2
Malmesbury 4.2
Sum 97.0 Sum 95.6 Sum 68.9
Source: Own calculation from Report of the General Manager of Railways for the year 1905.