Embed Size (px)
Citation preview
Investor Presentation
Q2 21
For the Quarter Ended April 30, 2021
May 26, 2021
BMO Financial Group
May 26, 2021 2
Forward looking statements & non-GAAP measuresCaution Regarding Forward-Looking Statements
Bank of Montreal’s public communications often include written or oral forward-looking statements. Statements of this type are included in this document and may be included in other filings with Canadian securities regulators or the U.S. Securities and Exchange Commission, or in other communications. All such statements are made pursuant to the “safe harbor” provisions of, and are intended to be forward-looking statements under, the United States Private Securities Litigation Reform Act of 1995 and any applicable Canadian securities legislation. Forward-looking statements in this document may include, but are not limited to, statements with respect to our objectives and priorities for fiscal 2021 and beyond, our strategies or future actions, our targets, expectations for our financial condition or share price, the regulatory environment in which we operate and the results of or outlook for our operations or for the Canadian, U.S. and international economies, the expected impact of the COVID-19 pandemic on our business, operations, earnings, results, and financial performance and condition, as well as its impact on our customers, competitors, reputation and trading exposures, and include statements of our management. Forward-looking statements are typically identified by words such as “will”, “would”, “should”, “believe”, “expect”, “anticipate”, “project”, “intend”, “estimate”, “plan”, “goal”, “target”, “may” and “could.”By their nature, forward-looking statements require us to make assumptions and are subject to inherent risks and uncertainties, both general and specific in nature. There is significant risk that predictions, forecasts, conclusions or projections will not prove to be accurate, that our assumptions may not be correct, and that actual results may differ materially from such predictions, forecasts, conclusions or projections. The uncertainty created by the COVID-19 pandemic has heightened this risk given the increased challenge in making assumptions, predictions, forecasts, conclusions or projections. We caution readers of this document not to place undue reliance on our forward-looking statements, as a number of factors – many of which are beyond our control and the effects of which can be difficult to predict – could cause actual future results, conditions, actions or events to differ materially from the targets, expectations, estimates or intentions expressed in the forward-looking statements.The future outcomes that relate to forward-looking statements may be influenced by many factors, including but not limited to: the severity, duration and spread of the COVID-19 pandemic, its impact on local, national or international economies, and its heightening of certain risks that may affect our future results; the possible impact on our business and operations of outbreaks of disease or illness that affect local, national or international economies; general economic and market conditions in the countries in which we operate; information, privacy and cyber security, including the threat of data breaches, hacking, identity theft and corporate espionage, as well as the possibility of denial of service resulting from efforts targeted at causing system failure and service disruption; changes in monetary, fiscal, or economic policy, and tax legislation and interpretation; interest rate and currency value fluctuations, as well as benchmark interest rate reforms; technological changes and technology resiliency; political conditions, including changes relating to or affecting economic or trade matters; the Canadian housing market and consumer leverage; climate change and other environmental and social risks; weak, volatile or illiquid capital or credit markets; the level of competition in the geographic and business areas in which we operate; changes in laws or in supervisory expectations or requirements, including capital, interest rate and liquidity requirements and guidance, and the effect of such changes on funding costs; judicial or regulatory proceedings; the accuracy and completeness of the information we obtain with respect to our customers and counterparties; failure of third parties to comply with their obligations to us; our ability to execute our strategic plans and to complete proposed acquisitions or dispositions, including obtaining regulatory approvals; critical accounting estimates and the effect of changes to accounting standards, rules and interpretations on these estimates; operational and infrastructure risks, including with respect to reliance on third parties; changes to our credit ratings; global capital markets activities; the possible effects on our business of war or terrorist activities; natural disasters and disruptions to public infrastructure, such as transportation, communications, power or water supply; and our ability to anticipate and effectively manage risks arising from all of the foregoing factors.We caution that the foregoing list is not exhaustive of all possible factors. Other factors and risks could adversely affect our results. For more information, please refer to the discussion in the Risks That May Affect Future Results section, and the sections related to credit and counterparty, market, insurance, liquidity and funding, operational, legal and regulatory, strategic, environmental and social, and reputation risk, in the Enterprise-Wide Risk Management section that starts on page 73 of BMO’s 2020 Annual Report, and the Risk Management section that starts on page 31 of our Second Quarter 2021 Report to Shareholders, all of which outline certain key factors and risks that may affect our future results. Investors and others should carefully consider these factors and risks, as well as other uncertainties and potential events, and the inherent uncertainty of forward-looking statements. We do not undertake to update any forward-looking statements, whether written or oral, that may be made from time to time by the organization or on its behalf, except as required by law. The forward-looking information contained in this document is presented for the purpose of assisting our shareholders in understanding our financial position as at and for the periods ended on the dates presented, as well as our strategic priorities and objectives, and may not be appropriate for other purposes.Material economic assumptions underlying the forward-looking statements contained in this document are set out in the Economic Developments and Outlook section on page 18 of BMO’s 2020 Annual Report and updated in the Economic Review and Outlook section set forth in our Second Quarter 2021 Report to Shareholders, as well as in the Allowance for Credit Losses section on page 114 of BMO’s 2020 Annual Report and the Allowance for Credit Losses section set forth in our Second Quarter 2021 Report to Shareholders. Assumptions about the performance of the Canadian and U.S. economies, as well as overall market conditions and their combined effect on our business, are material factors we consider when determining our strategic priorities, objectives and expectations for our business. In determining our expectations for economic growth, we primarily consider historical economic data, past relationships between economic and financial variables, changes in government policies, and the risks to the domestic and global economy. Please refer to the Economic Review and Outlook and Allowance for Credit Losses sections in our Second Quarter 2021 Report to Shareholders.
Non-GAAP MeasuresBank of Montreal uses both GAAP and non-GAAP measures to assess performance. Readers are cautioned that earnings and other measures adjusted to a basis other than GAAP do not have standardized meanings under GAAP and are unlikely to be comparable to similar measures used by other companies. Reconciliations of GAAP to non-GAAP measures, the rationale for their use, as well as the effects of changes in exchange rates on BMO’s U.S. segment reported and adjusted results can be found on pages 7 and 8 of BMO’s Second Quarter 2021 Report to Shareholders and on pages 17 and 23 of BMO’s 2020 Annual Report, all of which are available on our website at www.bmo.com/investorrelationsExamples of non-GAAP amounts or measures include: efficiency and leverage ratios; revenue and other measures presented on a taxable equivalent basis (teb); amounts presented net of applicable taxes; results and measures that exclude the impact of Canadian/U.S. dollar exchange rate movements (i.e. constant currency basis or CCY), adjusted net income, revenues, non-interest expenses, earnings per share, effective tax rate, ROE, efficiency ratio, pre-provision pre-tax earnings, and other adjusted measures which exclude the impact of certain items such as, acquisition integration costs, amortization of acquisition-related intangible assets, impact of divestitures, reinsurance adjustment and restructuring costs. Bank of Montreal provides supplemental information on combined business segments to facilitate comparisons to peers.
Darryl White
Q2 21
Chief Executive Officer
Strategic Highlights May 26, 2021 4
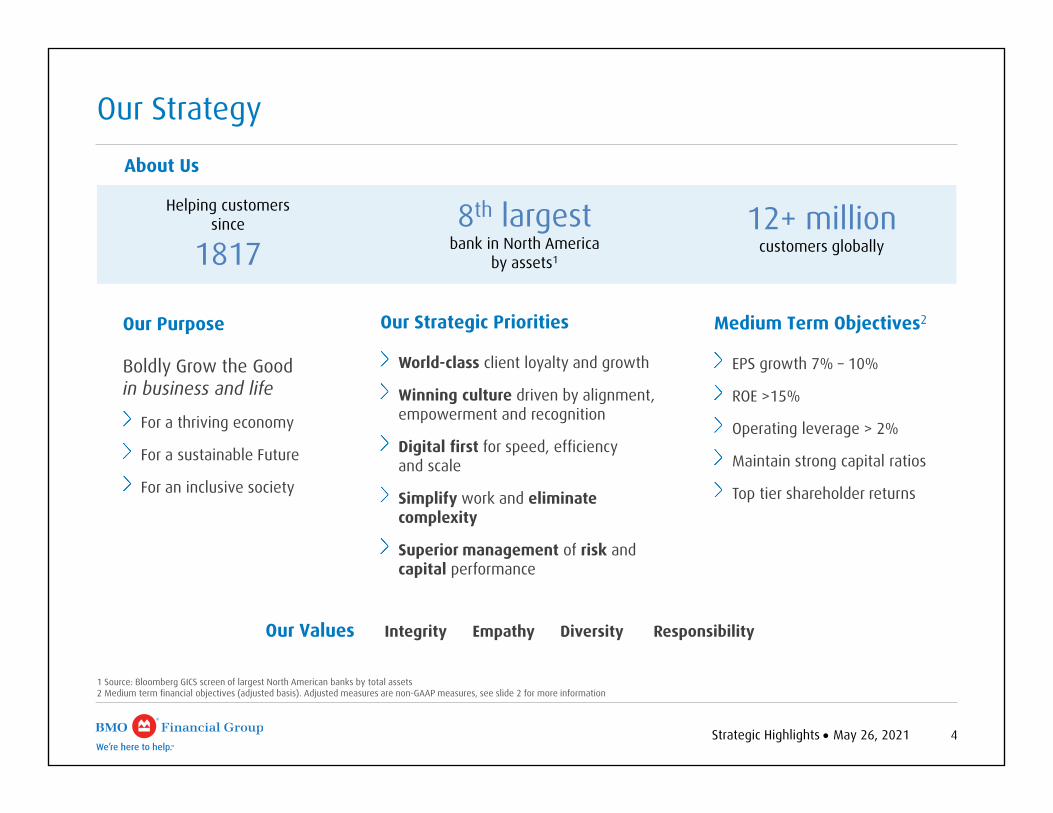
Our Strategy
1 Source: Bloomberg GICS screen of largest North American banks by total assets2 Medium term financial objectives (adjusted basis). Adjusted measures are non-GAAP measures, see slide 2 for more information
Helping customers since
18178th largest
bank in North America by assets1
12+ millioncustomers globally
Our Purpose
Boldly Grow the Good in business and life
For a thriving economy
For a sustainable Future
For an inclusive society
Our Strategic Priorities
World-class client loyalty and growth
Winning culture driven by alignment, empowerment and recognition
Digital first for speed, efficiency and scale
Simplify work and eliminate complexity
Superior management of risk and capital performance
Our Values Integrity Empathy Diversity Responsibility
Medium Term Objectives2
EPS growth 7% – 10%
ROE >15%
Operating leverage > 2%
Maintain strong capital ratios
Top tier shareholder returns
About Us
Strategic Highlights May 26, 2021 5
Financial Highlights
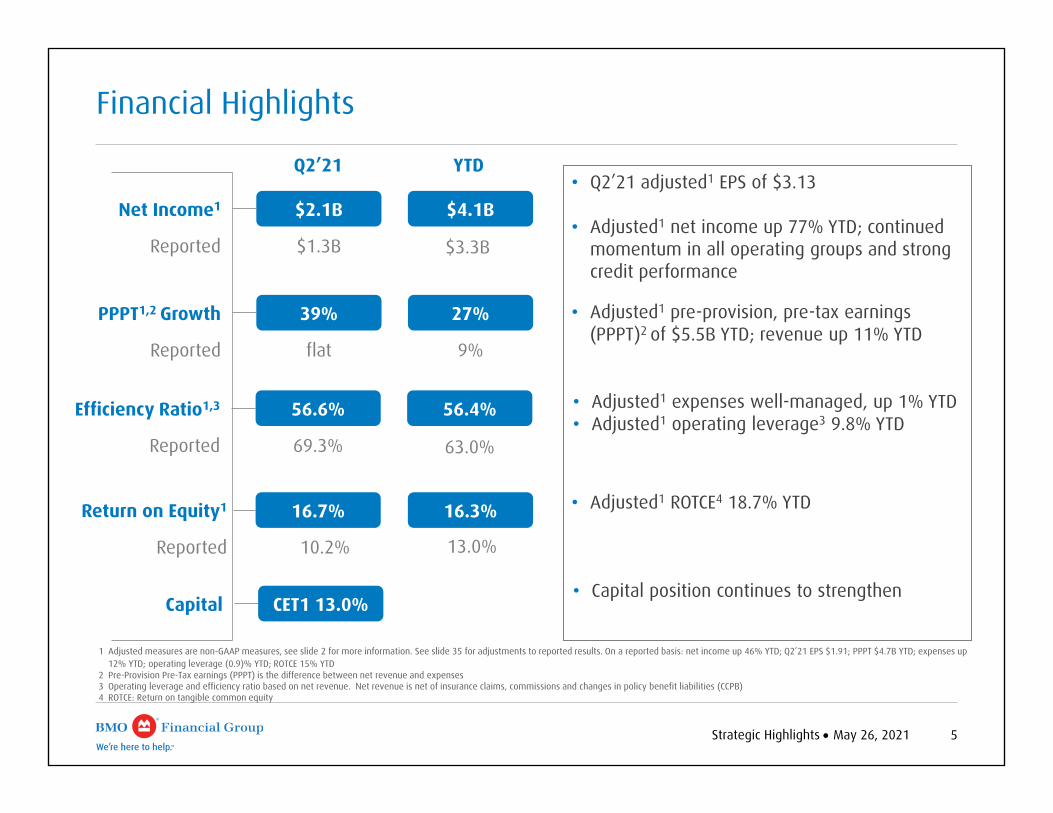
Q2’21• Q2’21 adjusted1 EPS of $3.13
• Adjusted1 net income up 77% YTD; continued momentum in all operating groups and strong credit performance
• Adjusted1 expenses well-managed, up 1% YTD• Adjusted1 operating leverage3 9.8% YTD
1 Adjusted measures are non-GAAP measures, see slide 2 for more information. See slide 35 for adjustments to reported results. On a reported basis: net income up 46% YTD; Q2’21 EPS $1.91; PPPT $4.7B YTD; expenses up 12% YTD; operating leverage (0.9)% YTD; ROTCE 15% YTD
2 Pre-Provision Pre-Tax earnings (PPPT) is the difference between net revenue and expenses3 Operating leverage and efficiency ratio based on net revenue. Net revenue is net of insurance claims, commissions and changes in policy benefit liabilities (CCPB)4 ROTCE: Return on tangible common equity
• Adjusted1 pre-provision, pre-tax earnings (PPPT)2 of $5.5B YTD; revenue up 11% YTD
Net Income1 $2.1B
Reported $1.3B
$4.1B
YTD
PPPT1,2 Growth 39%
Reported flat
27%
Efficiency Ratio1,3 56.6%
Reported 69.3%
56.4%
Return on Equity1 16.7%
Reported 10.2%
16.3%
Capital CET1 13.0%
63.0%
• Capital position continues to strengthen
• Adjusted1 ROTCE4 18.7% YTD
9%
$3.3B
13.0%
Strategic Highlights May 26, 2021 6
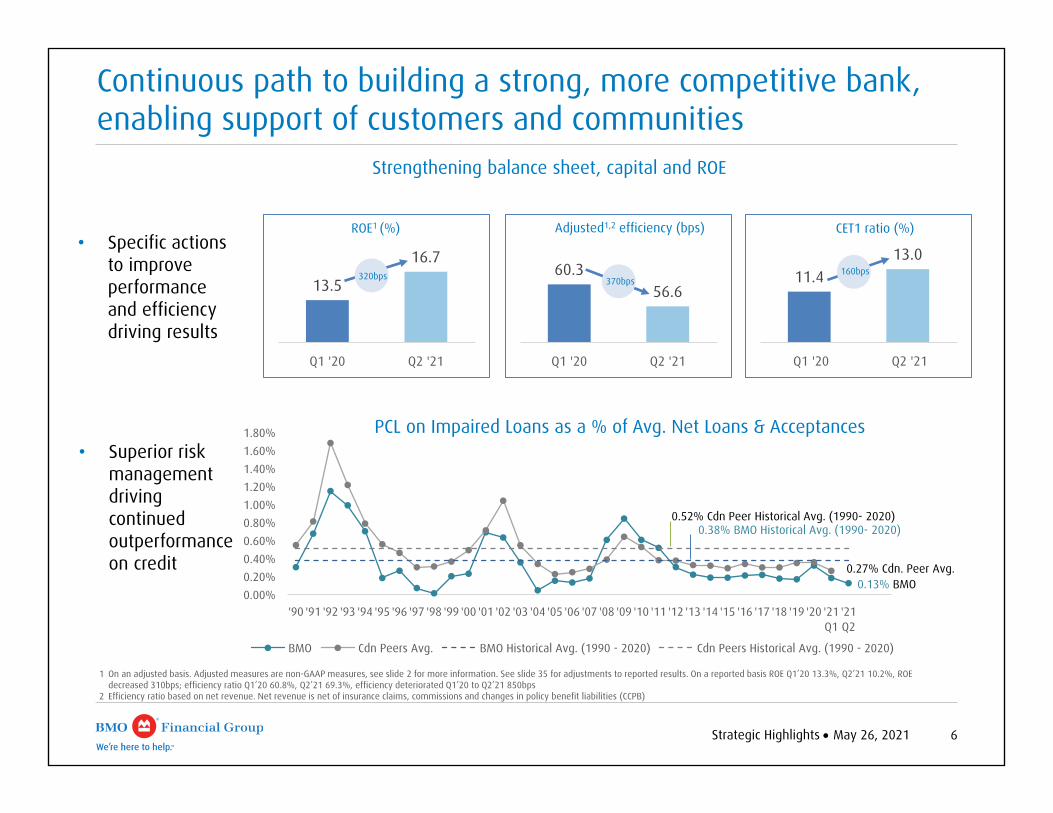
60.356.6
Q1 '20 Q2 '21
Adjusted1,2 efficiency (bps)
13.5
16.7
Q1 '20 Q2 '21
ROE1 (%)
Continuous path to building a strong, more competitive bank, enabling support of customers and communities
11.413.0
Q1 '20 Q2 '21
CET1 ratio (%)
1 On an adjusted basis. Adjusted measures are non-GAAP measures, see slide 2 for more information. See slide 35 for adjustments to reported results. On a reported basis ROE Q1’20 13.3%, Q2’21 10.2%, ROE decreased 310bps; efficiency ratio Q1’20 60.8%, Q2’21 69.3%, efficiency deteriorated Q1’20 to Q2’21 850bps
2 Efficiency ratio based on net revenue. Net revenue is net of insurance claims, commissions and changes in policy benefit liabilities (CCPB)
• Superior risk management driving continued outperformance on credit
Strengthening balance sheet, capital and ROE
370bps320bps 160bps
• Specific actions to improve performance and efficiency driving results
0.00%0.20%0.40%0.60%0.80%1.00%1.20%1.40%1.60%1.80%
'90 '91 '92 '93 '94 '95 '96 '97 '98 '99 '00 '01 '02 '03 '04 '05 '06 '07 '08 '09 '10 '11 '12 '13 '14 '15 '16 '17 '18 '19 '20 '21Q1
'21Q2
PCL on Impaired Loans as a % of Avg. Net Loans & Acceptances
BMO Cdn Peers Avg. BMO Historical Avg. (1990 - 2020) Cdn Peers Historical Avg. (1990 - 2020)
0.52% Cdn Peer Historical Avg. (1990- 2020)0.38% BMO Historical Avg. (1990- 2020)
0.27% Cdn. Peer Avg. 0.13% BMO

Strategic Highlights May 26, 2021 7
Digital first strategy, meeting customer preferences, creating efficiencies
Active Mobile Users1 (000s) Self-Serve Transaction 2 (%)
Canadian Personal
Active Mobile Users3 (000s) Self-Serve Transaction4 (%)
U.S. Personal Digital Adoption Rate3 (%)
Digital Adoption Rate1 (%)
1 Digital adoption is percent of deposit customers that logged on in last 90 days. Active mobile users is number of deposit customers that logged into mobile in the last 90 days2 Self–Serve Transactions includes deposits, bill payments, internal funds transfers, withdrawals and e-transfers sent across ATM and Digital channels3 Digital adoption is percent of retail deposit customers that logged on in last 90 days. Active mobile users is number of retail deposit customers that logged into mobile in the last 90 days 4 Self–Serve Transactions includes deposits, bill payments, internal funds transfers, withdrawals and Zelle payments (P2P) sent across ATM and Digital channels
58.7% 59.7% 60.8%
Q1 F’21Q2 F’20 Q2 F’21
+210bps
1,947 2,049 2,081
Q2 F’20 Q1 F’21 Q2 F’21
+7%
89.5% 91.8% 91.5%
Q2 F’21Q2 F’20 Q1 F’21
+200bps
47.9%50.0% 51.0%
Q2 F’21Q1 F’21Q2 F’20
+310bps
491 525 544
Q2 F’21Q2 F’20 Q1 F’21
+11%
74.0% 76.6% 76.5%
Q2 F’20 Q1 F’21 Q2 F’21
+250bps
Strategic Highlights May 26, 2021 8
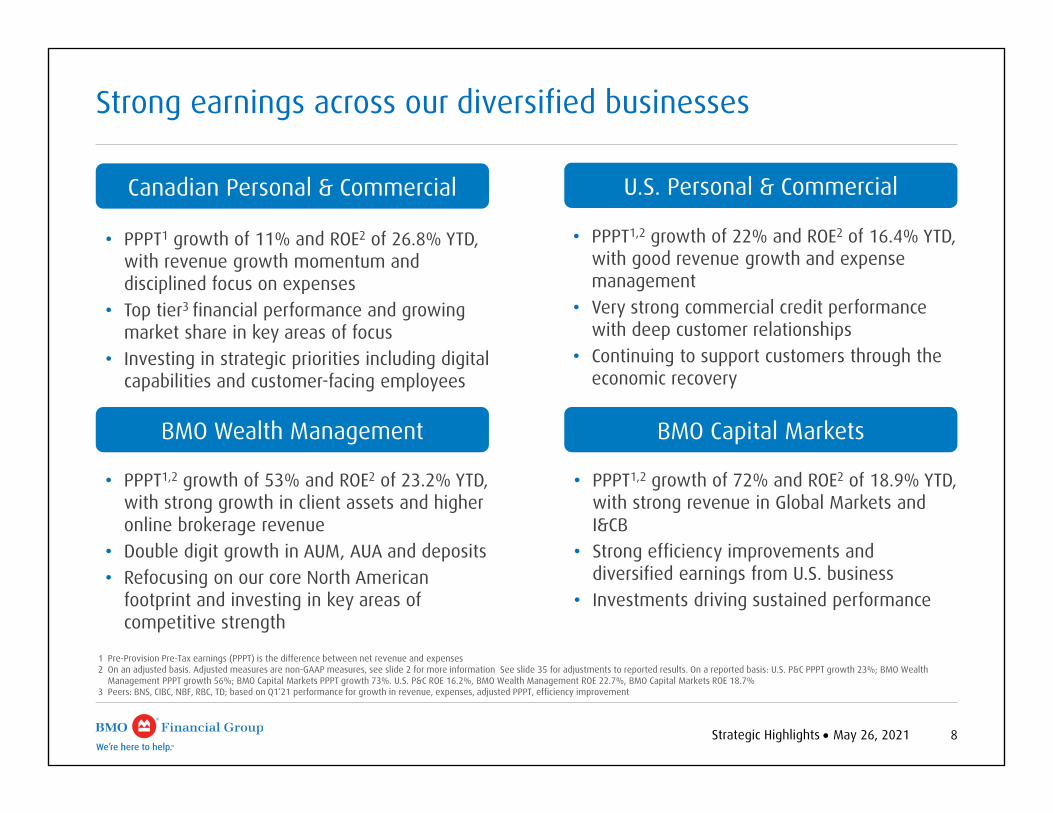
Strong earnings across our diversified businesses
Canadian Personal & Commercial U.S. Personal & Commercial
BMO Wealth Management BMO Capital Markets
• PPPT1 growth of 11% and ROE2 of 26.8% YTD, with revenue growth momentum and disciplined focus on expenses
• Top tier3 financial performance and growing market share in key areas of focus
• Investing in strategic priorities including digital capabilities and customer-facing employees
• PPPT1,2 growth of 22% and ROE2 of 16.4% YTD, with good revenue growth and expense management
• Very strong commercial credit performance with deep customer relationships
• Continuing to support customers through the economic recovery
• PPPT1,2 growth of 72% and ROE2 of 18.9% YTD, with strong revenue in Global Markets and I&CB
• Strong efficiency improvements and diversified earnings from U.S. business
• Investments driving sustained performance
• PPPT1,2 growth of 53% and ROE2 of 23.2% YTD, with strong growth in client assets and higher online brokerage revenue
• Double digit growth in AUM, AUA and deposits• Refocusing on our core North American
footprint and investing in key areas of competitive strength
1 Pre-Provision Pre-Tax earnings (PPPT) is the difference between net revenue and expenses2 On an adjusted basis. Adjusted measures are non-GAAP measures, see slide 2 for more information See slide 35 for adjustments to reported results. On a reported basis: U.S. P&C PPPT growth 23%; BMO Wealth
Management PPPT growth 56%; BMO Capital Markets PPPT growth 73%. U.S. P&C ROE 16.2%, BMO Wealth Management ROE 22.7%, BMO Capital Markets ROE 18.7%3 Peers: BNS, CIBC, NBF, RBC, TD; based on Q1‘21 performance for growth in revenue, expenses, adjusted PPPT, efficiency improvement
Strategic Highlights May 26, 2021 9
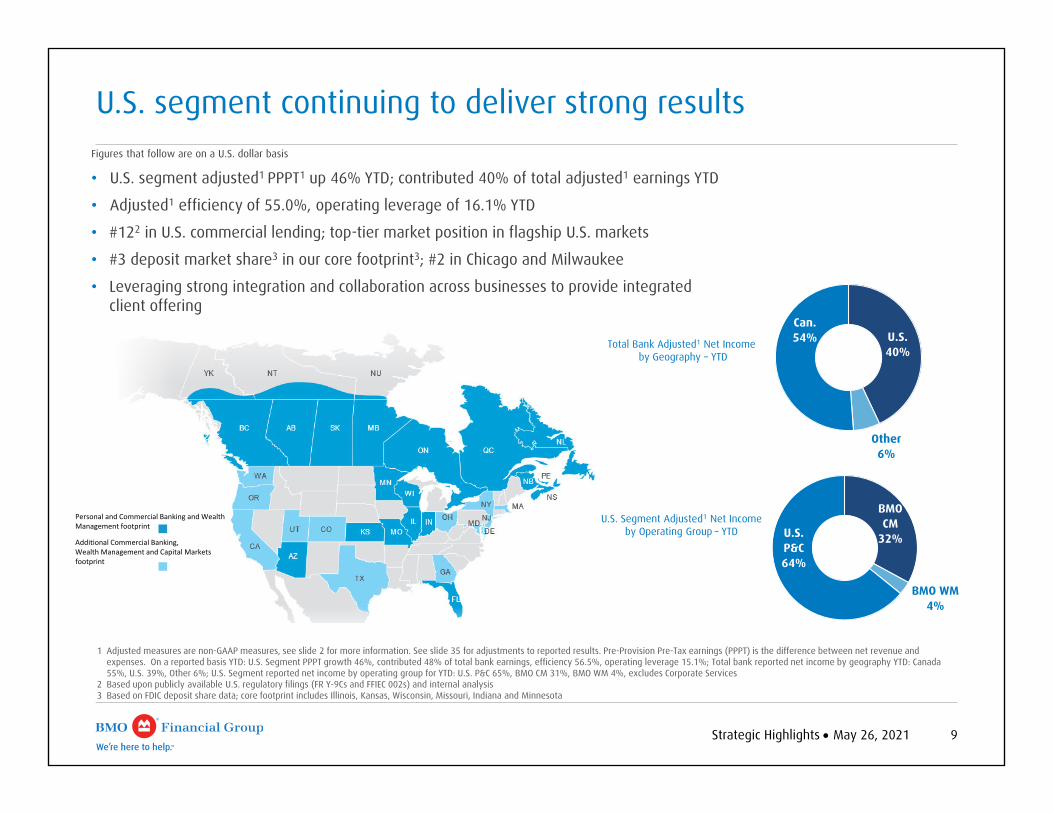
U.S. segment continuing to deliver strong results
BMO CM
32%
BMO WM4%
U.S. P&C64%
1 Adjusted measures are non-GAAP measures, see slide 2 for more information. See slide 35 for adjustments to reported results. Pre-Provision Pre-Tax earnings (PPPT) is the difference between net revenue and expenses. On a reported basis YTD: U.S. Segment PPPT growth 46%, contributed 48% of total bank earnings, efficiency 56.5%, operating leverage 15.1%; Total bank reported net income by geography YTD: Canada 55%, U.S. 39%, Other 6%; U.S. Segment reported net income by operating group for YTD: U.S. P&C 65%, BMO CM 31%, BMO WM 4%, excludes Corporate Services
2 Based upon publicly available U.S. regulatory filings (FR Y-9Cs and FFIEC 002s) and internal analysis3 Based on FDIC deposit share data; core footprint includes Illinois, Kansas, Wisconsin, Missouri, Indiana and Minnesota
U.S.40%
Other6%
Can.54%
Figures that follow are on a U.S. dollar basis
• U.S. segment adjusted1 PPPT1 up 46% YTD; contributed 40% of total adjusted1 earnings YTD
• Adjusted1 efficiency of 55.0%, operating leverage of 16.1% YTD
• #122 in U.S. commercial lending; top-tier market position in flagship U.S. markets
• #3 deposit market share3 in our core footprint3; #2 in Chicago and Milwaukee
• Leveraging strong integration and collaboration across businesses to provide integrated client offering
Total Bank Adjusted1 Net Incomeby Geography – YTD
U.S. Segment Adjusted1 Net Income by Operating Group – YTD
Personal and Commercial Banking and Wealth Management footprint
Additional Commercial Banking, Wealth Management and Capital Markets footprint
Strategic Highlights May 26, 2021 10
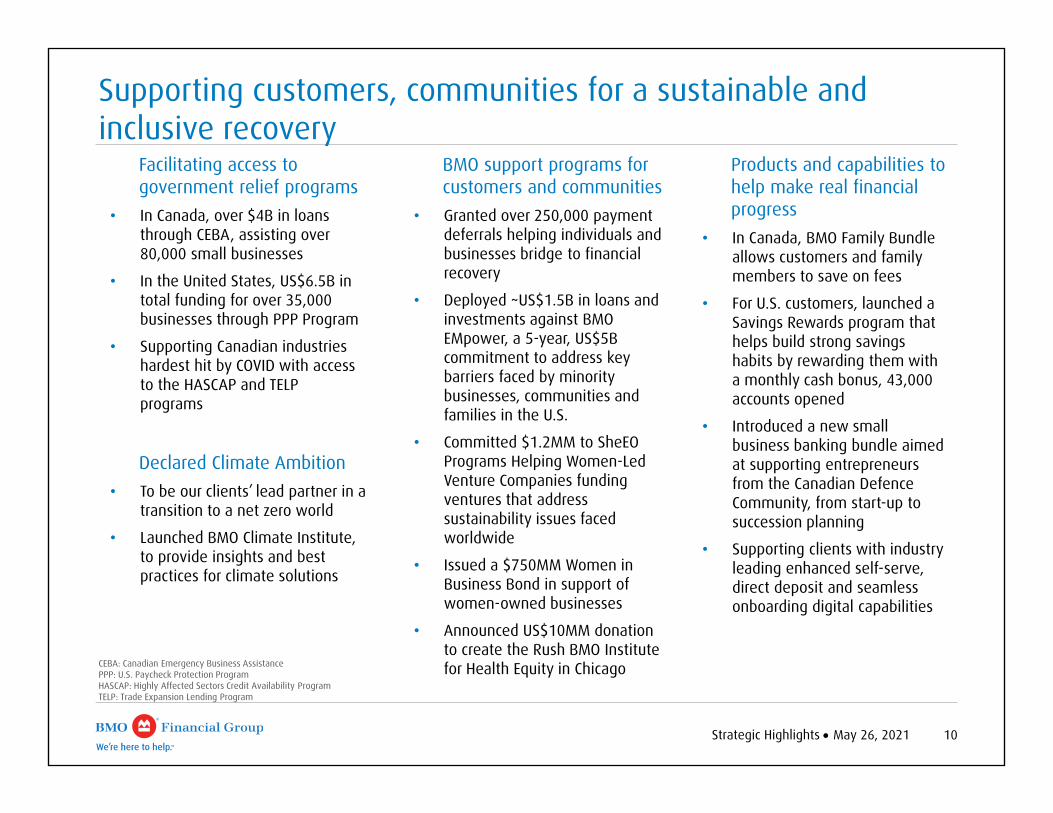
Supporting customers, communities for a sustainable and inclusive recovery
BMO support programs for customers and communities
• Granted over 250,000 payment deferrals helping individuals and businesses bridge to financial recovery
• Deployed ~US$1.5B in loans and investments against BMO EMpower, a 5-year, US$5B commitment to address key barriers faced by minority businesses, communities and families in the U.S.
• Committed $1.2MM to SheEOPrograms Helping Women-Led Venture Companies funding ventures that address sustainability issues faced worldwide
• Issued a $750MM Women in Business Bond in support of women-owned businesses
• Announced US$10MM donation to create the Rush BMO Institute for Health Equity in Chicago
Products and capabilities to help make real financial progress
• In Canada, BMO Family Bundle allows customers and family members to save on fees
• For U.S. customers, launched a Savings Rewards program that helps build strong savings habits by rewarding them with a monthly cash bonus, 43,000 accounts opened
• Introduced a new small business banking bundle aimed at supporting entrepreneurs from the Canadian DefenceCommunity, from start-up to succession planning
• Supporting clients with industry leading enhanced self-serve, direct deposit and seamless onboarding digital capabilities
CEBA: Canadian Emergency Business AssistancePPP: U.S. Paycheck Protection ProgramHASCAP: Highly Affected Sectors Credit Availability ProgramTELP: Trade Expansion Lending Program
Facilitating access to government relief programs
• In Canada, over $4B in loans through CEBA, assisting over 80,000 small businesses
• In the United States, US$6.5B in total funding for over 35,000 businesses through PPP Program
• Supporting Canadian industries hardest hit by COVID with access to the HASCAP and TELP programs
Declared Climate Ambition • To be our clients’ lead partner in a
transition to a net zero world
• Launched BMO Climate Institute, to provide insights and best practices for climate solutions
Financial ResultsFor the Quarter Ended April 30, 2021
Tayfun TuzunChief Financial Officer
Q2 21
12Financial Results May 26, 2021
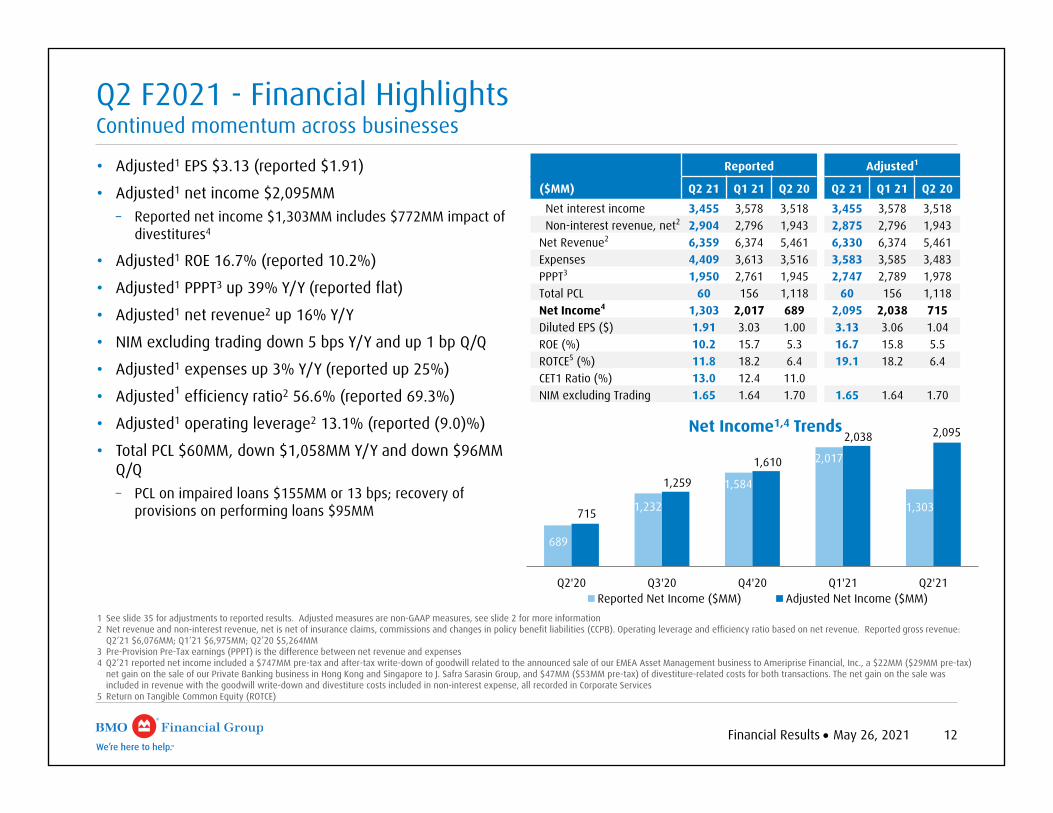
• Adjusted1 EPS $3.13 (reported $1.91)
• Adjusted1 net income $2,095MM – Reported net income $1,303MM includes $772MM impact of
divestitures4
• Adjusted1 ROE 16.7% (reported 10.2%)
• Adjusted1 PPPT3 up 39% Y/Y (reported flat)
• Adjusted1 net revenue2 up 16% Y/Y
• NIM excluding trading down 5 bps Y/Y and up 1 bp Q/Q
• Adjusted1 expenses up 3% Y/Y (reported up 25%)
• Adjusted1 efficiency ratio2 56.6% (reported 69.3%)
• Adjusted1 operating leverage2 13.1% (reported (9.0)%)
• Total PCL $60MM, down $1,058MM Y/Y and down $96MM Q/Q– PCL on impaired loans $155MM or 13 bps; recovery of
provisions on performing loans $95MM
689
1,232
1,584
2,017
1,303 715
1,259
1,610
2,038 2,095
Q2'20 Q3'20 Q4'20 Q1'21 Q2'21
Net Income1,4 Trends
Reported Net Income ($MM) Adjusted Net Income ($MM)1 See slide 35 for adjustments to reported results. Adjusted measures are non-GAAP measures, see slide 2 for more information2 Net revenue and non-interest revenue, net is net of insurance claims, commissions and changes in policy benefit liabilities (CCPB). Operating leverage and efficiency ratio based on net revenue. Reported gross revenue:
Q2‘21 $6,076MM; Q1‘21 $6,975MM; Q2’20 $5,264MM3 Pre-Provision Pre-Tax earnings (PPPT) is the difference between net revenue and expenses4 Q2’21 reported net income included a $747MM pre-tax and after-tax write-down of goodwill related to the announced sale of our EMEA Asset Management business to Ameriprise Financial, Inc., a $22MM ($29MM pre-tax)
net gain on the sale of our Private Banking business in Hong Kong and Singapore to J. Safra Sarasin Group, and $47MM ($53MM pre-tax) of divestiture-related costs for both transactions. The net gain on the sale was included in revenue with the goodwill write-down and divestiture costs included in non-interest expense, all recorded in Corporate Services
5 Return on Tangible Common Equity (ROTCE)
Q2 F2021 - Financial HighlightsContinued momentum across businesses
Reported Adjusted1
($MM) Q2 21 Q1 21 Q2 20 Q2 21 Q1 21 Q2 20
Net interest income 3,455 3,578 3,518 3,455 3,578 3,518 Non-interest revenue, net2 2,904 2,796 1,943 2,875 2,796 1,943
Net Revenue2 6,359 6,374 5,461 6,330 6,374 5,461 Expenses 4,409 3,613 3,516 3,583 3,585 3,483 PPPT3 1,950 2,761 1,945 2,747 2,789 1,978 Total PCL 60 156 1,118 60 156 1,118 Net Income4 1,303 2,017 689 2,095 2,038 715 Diluted EPS ($) 1.91 3.03 1.00 3.13 3.06 1.04 ROE (%) 10.2 15.7 5.3 16.7 15.8 5.5 ROTCE5 (%) 11.8 18.2 6.4 19.1 18.2 6.4CET1 Ratio (%) 13.0 12.4 11.0NIM excluding Trading 1.65 1.64 1.70 1.65 1.64 1.70
13Financial Results May 26, 2021
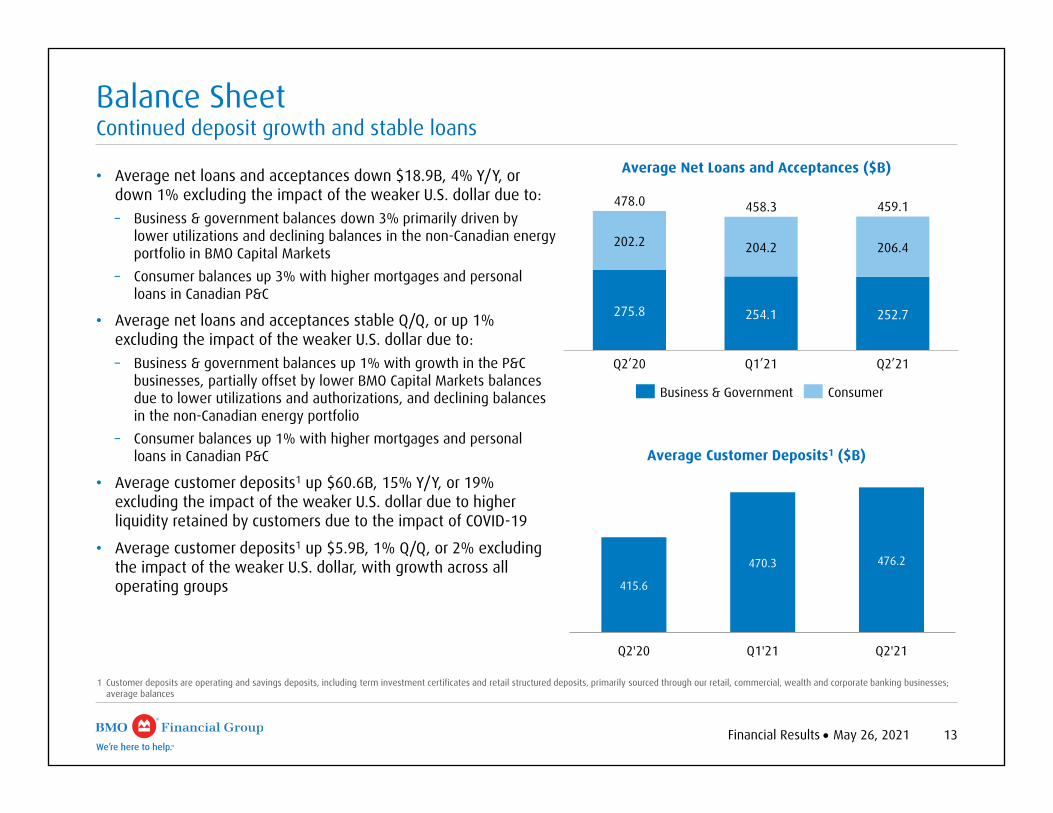
415.6
470.3 476.2
Q2'20 Q1'21 Q2'21
Balance SheetContinued deposit growth and stable loans
• Average net loans and acceptances down $18.9B, 4% Y/Y, or down 1% excluding the impact of the weaker U.S. dollar due to: – Business & government balances down 3% primarily driven by
lower utilizations and declining balances in the non-Canadian energy portfolio in BMO Capital Markets
– Consumer balances up 3% with higher mortgages and personal loans in Canadian P&C
• Average net loans and acceptances stable Q/Q, or up 1% excluding the impact of the weaker U.S. dollar due to:– Business & government balances up 1% with growth in the P&C
businesses, partially offset by lower BMO Capital Markets balances due to lower utilizations and authorizations, and declining balances in the non-Canadian energy portfolio
– Consumer balances up 1% with higher mortgages and personal loans in Canadian P&C
• Average customer deposits1 up $60.6B, 15% Y/Y, or 19% excluding the impact of the weaker U.S. dollar due to higher liquidity retained by customers due to the impact of COVID-19
• Average customer deposits1 up $5.9B, 1% Q/Q, or 2% excluding the impact of the weaker U.S. dollar, with growth across all operating groups
275.8 254.1 252.7
202.2 204.2 206.4
Q2’21Q2’20
478.0
Q1’21
459.1458.3
Business & Government Consumer
Average Net Loans and Acceptances ($B)
Average Customer Deposits1 ($B)
1 Customer deposits are operating and savings deposits, including term investment certificates and retail structured deposits, primarily sourced through our retail, commercial, wealth and corporate banking businesses; average balances
14Financial Results May 26, 2021
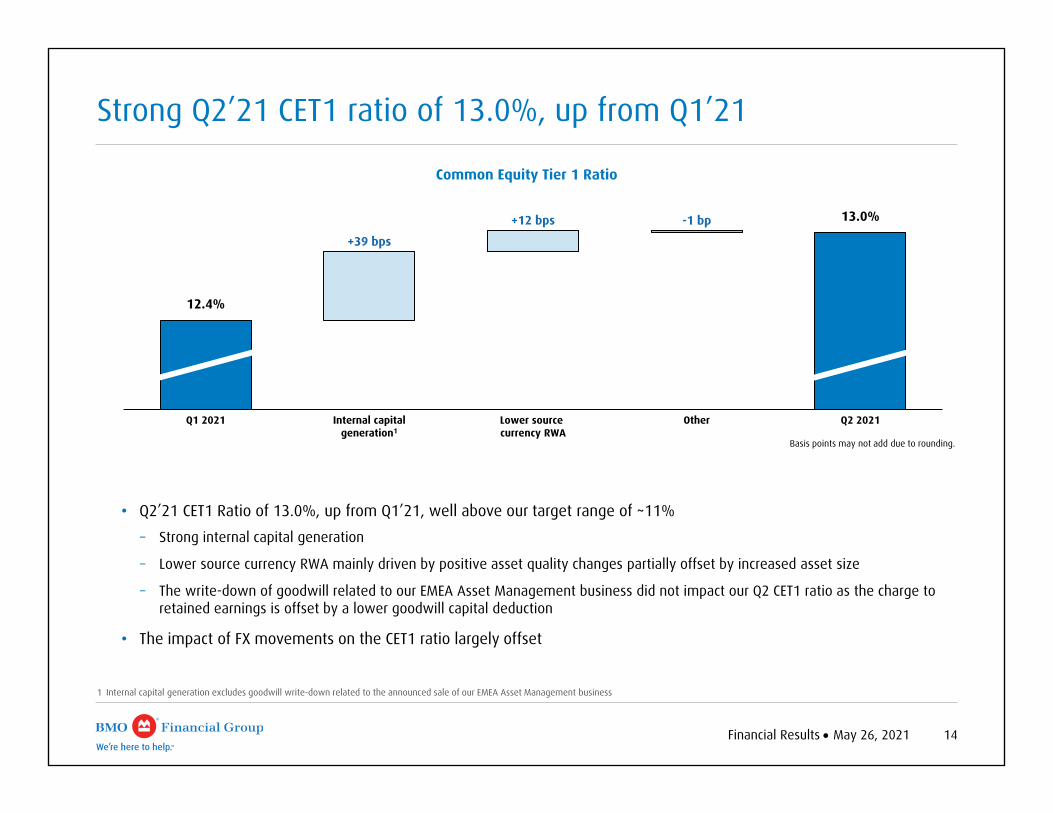
Strong Q2’21 CET1 ratio of 13.0%, up from Q1’21
• Q2’21 CET1 Ratio of 13.0%, up from Q1’21, well above our target range of ~11%– Strong internal capital generation
– Lower source currency RWA mainly driven by positive asset quality changes partially offset by increased asset size
– The write-down of goodwill related to our EMEA Asset Management business did not impact our Q2 CET1 ratio as the charge to retained earnings is offset by a lower goodwill capital deduction
• The impact of FX movements on the CET1 ratio largely offset
Common Equity Tier 1 Ratio
Basis points may not add due to rounding.
Internal capital generation1
Q1 2021 Lower source currency RWA
Q2 2021Other
13.0%
12.4%
+39 bps
-1 bp+12 bps
1 Internal capital generation excludes goodwill write-down related to the announced sale of our EMEA Asset Management business
15Financial Results May 26, 2021
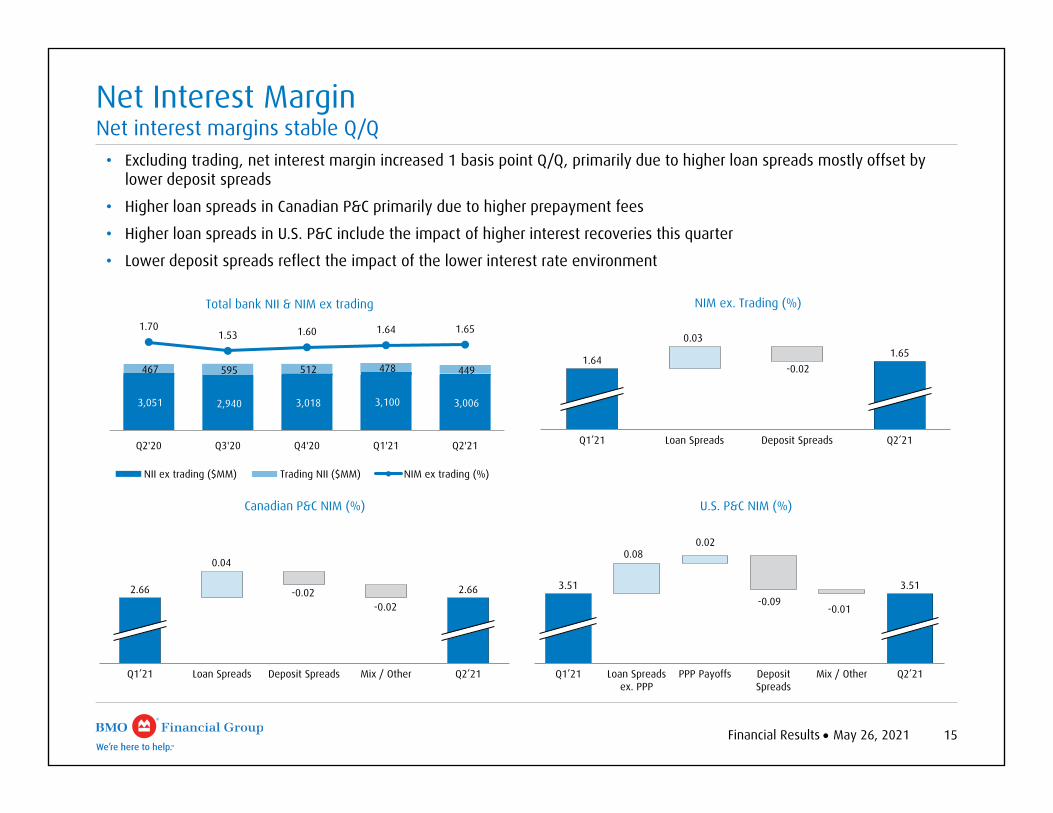
Net Interest MarginNet interest margins stable Q/Q• Excluding trading, net interest margin increased 1 basis point Q/Q, primarily due to higher loan spreads mostly offset by
lower deposit spreads
• Higher loan spreads in Canadian P&C primarily due to higher prepayment fees
• Higher loan spreads in U.S. P&C include the impact of higher interest recoveries this quarter
• Lower deposit spreads reflect the impact of the lower interest rate environment
3,051 2,940 3,018 3,100 3,006
467 595 512 478 449
1.701.53 1.60 1.64 1.65
Q2'20 Q3'20 Q4'20 Q1'21 Q2'21
Total bank NII & NIM ex trading
NII ex trading ($MM) Trading NII ($MM) NIM ex trading (%)
Loan SpreadsQ1’21 Deposit Spreads Q2’21
1.641.65
0.03
-0.02
NIM ex. Trading (%)
Q1’21 Loan Spreads
2.66
Deposit Spreads Mix / Other Q2’21
2.66
0.04
-0.02
Canadian P&C NIM (%)
-0.02
Loan Spreads ex. PPP
Q1’21 PPP Payoffs Deposit Spreads
Mix / Other Q2’21
3.51 3.51
U.S. P&C NIM (%)
0.080.02
-0.09-0.01
16Financial Results May 26, 2021
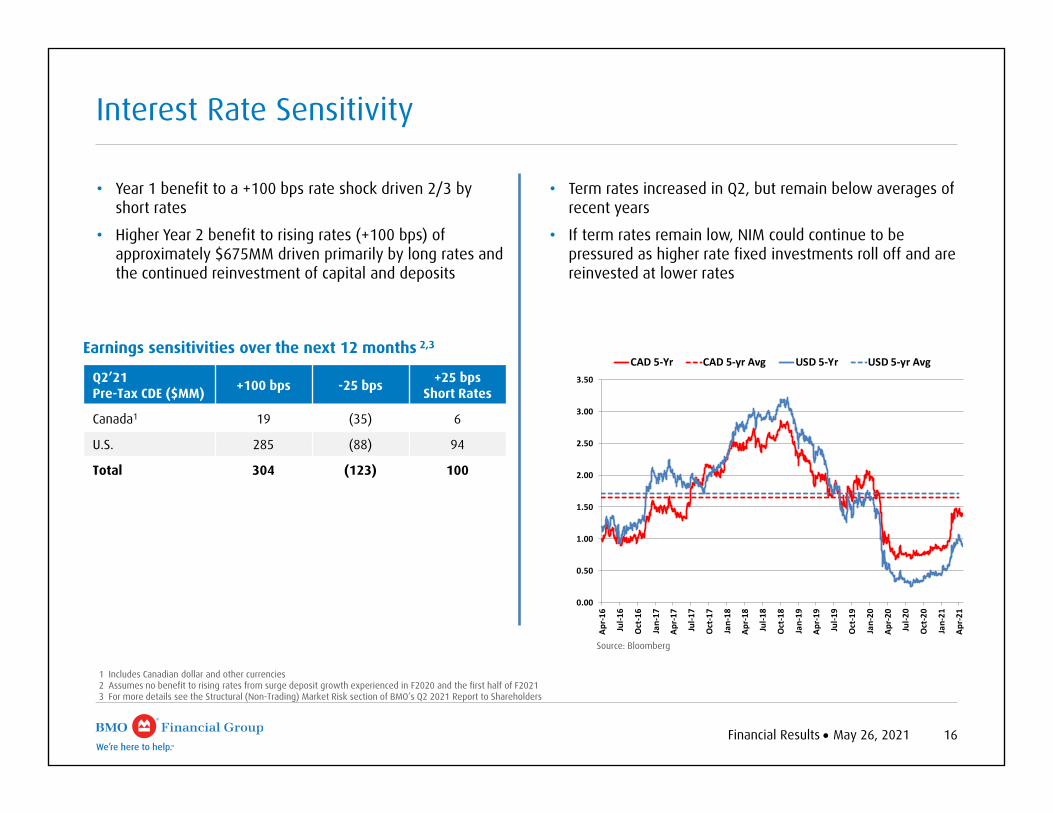
Interest Rate Sensitivity
1 Includes Canadian dollar and other currencies2 Assumes no benefit to rising rates from surge deposit growth experienced in F2020 and the first half of F20213 For more details see the Structural (Non-Trading) Market Risk section of BMO’s Q2 2021 Report to Shareholders
• Year 1 benefit to a +100 bps rate shock driven 2/3 by short rates
• Higher Year 2 benefit to rising rates (+100 bps) of approximately $675MM driven primarily by long rates and the continued reinvestment of capital and deposits
Earnings sensitivities over the next 12 months 2,3
• Term rates increased in Q2, but remain below averages of recent years
• If term rates remain low, NIM could continue to be pressured as higher rate fixed investments roll off and are reinvested at lower rates
Q2’21 Pre-Tax CDE ($MM) +100 bps -25 bps +25 bps
Short Rates
Canada1 19 (35) 6
U.S. 285 (88) 94
Total 304 (123) 100
0.00
0.50
1.00
1.50
2.00
2.50
3.00
3.50
Apr‐16
Jul‐1
6
Oct‐16
Jan‐17
Apr‐17
Jul‐1
7
Oct‐17
Jan‐18
Apr‐18
Jul‐1
8
Oct‐18
Jan‐19
Apr‐19
Jul‐1
9
Oct‐19
Jan‐20
Apr‐20
Jul‐2
0
Oct‐20
Jan‐21
Apr‐21
CAD 5‐Yr CAD 5‐yr Avg USD 5‐Yr USD 5‐yr Avg
Source: Bloomberg
17Financial Results May 26, 2021
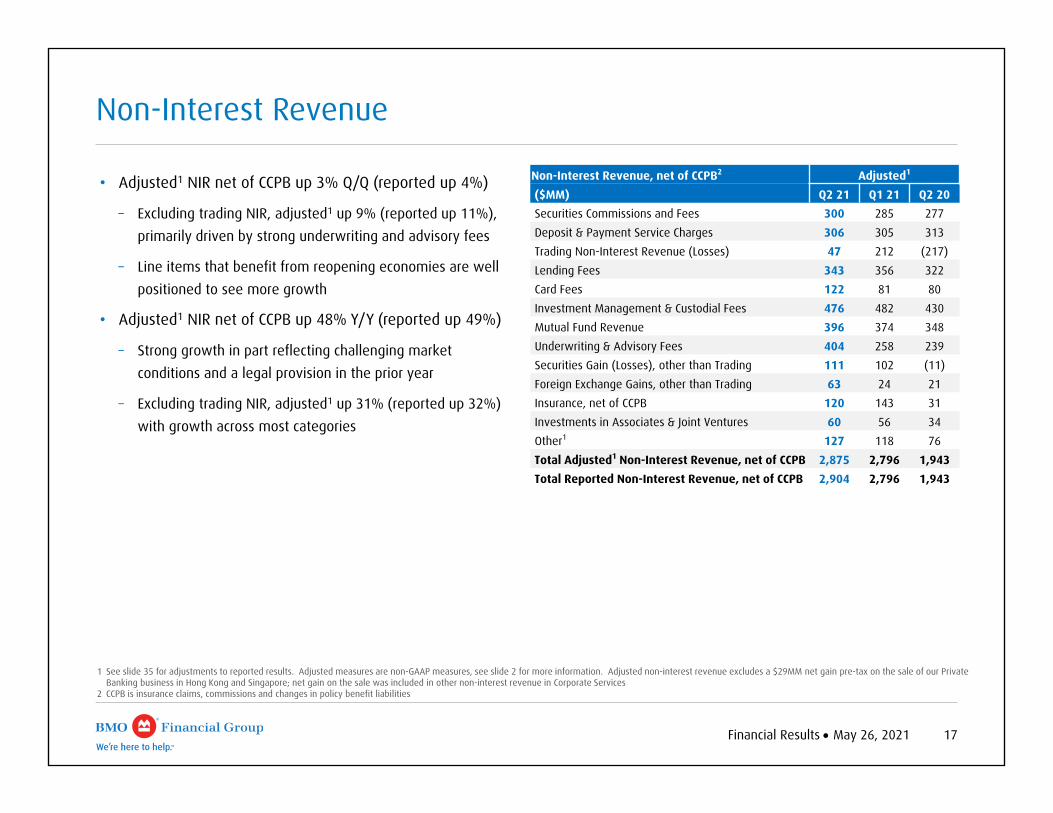
Non-Interest Revenue
• Adjusted1 NIR net of CCPB up 3% Q/Q (reported up 4%)
– Excluding trading NIR, adjusted1 up 9% (reported up 11%), primarily driven by strong underwriting and advisory fees
– Line items that benefit from reopening economies are well positioned to see more growth
• Adjusted1 NIR net of CCPB up 48% Y/Y (reported up 49%)
– Strong growth in part reflecting challenging market conditions and a legal provision in the prior year
– Excluding trading NIR, adjusted1 up 31% (reported up 32%) with growth across most categories
Non-Interest Revenue, net of CCPB2 Adjusted1
($MM) Q2 21 Q1 21 Q2 20Securities Commissions and Fees 300 285 277 Deposit & Payment Service Charges 306 305 313 Trading Non-Interest Revenue (Losses) 47 212 (217)Lending Fees 343 356 322 Card Fees 122 81 80 Investment Management & Custodial Fees 476 482 430 Mutual Fund Revenue 396 374 348 Underwriting & Advisory Fees 404 258 239 Securities Gain (Losses), other than Trading 111 102 (11)Foreign Exchange Gains, other than Trading 63 24 21 Insurance, net of CCPB 120 143 31 Investments in Associates & Joint Ventures 60 56 34 Other1 127 118 76 Total Adjusted1 Non-Interest Revenue, net of CCPB 2,875 2,796 1,943 Total Reported Non-Interest Revenue, net of CCPB 2,904 2,796 1,943
1 See slide 35 for adjustments to reported results. Adjusted measures are non-GAAP measures, see slide 2 for more information. Adjusted non-interest revenue excludes a $29MM net gain pre-tax on the sale of our Private Banking business in Hong Kong and Singapore; net gain on the sale was included in other non-interest revenue in Corporate Services
2 CCPB is insurance claims, commissions and changes in policy benefit liabilities
18Financial Results May 26, 2021
Non-Interest ExpenseExpenses up Y/Y, in-line with better performance
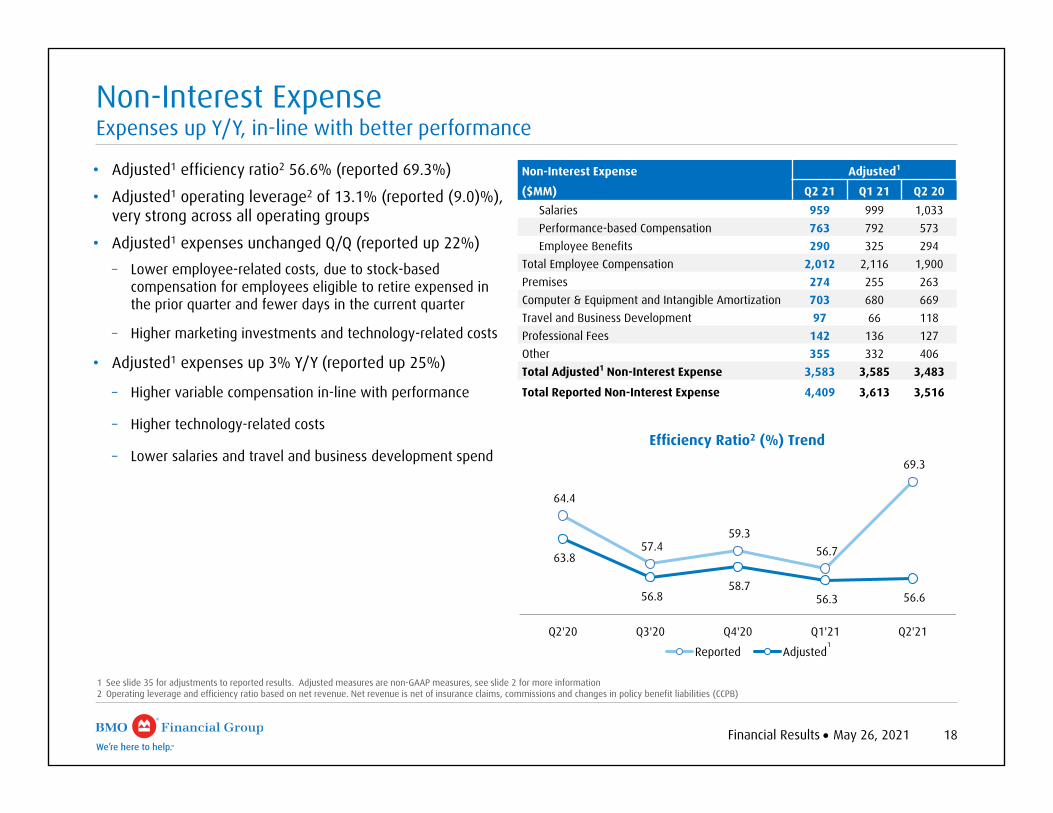
• Adjusted1 efficiency ratio2 56.6% (reported 69.3%)
• Adjusted1 operating leverage2 of 13.1% (reported (9.0)%), very strong across all operating groups
• Adjusted1 expenses unchanged Q/Q (reported up 22%)– Lower employee-related costs, due to stock-based
compensation for employees eligible to retire expensed in the prior quarter and fewer days in the current quarter
– Higher marketing investments and technology-related costs
• Adjusted1 expenses up 3% Y/Y (reported up 25%)
– Higher variable compensation in-line with performance
– Higher technology-related costs
– Lower salaries and travel and business development spendEfficiency Ratio2 (%) Trend
1 See slide 35 for adjustments to reported results. Adjusted measures are non-GAAP measures, see slide 2 for more information2 Operating leverage and efficiency ratio based on net revenue. Net revenue is net of insurance claims, commissions and changes in policy benefit liabilities (CCPB)
Non-Interest Expense Adjusted1
($MM) Q2 21 Q1 21 Q2 20Salaries 959 999 1,033 Performance-based Compensation 763 792 573 Employee Benefits 290 325 294
Total Employee Compensation 2,012 2,116 1,900 Premises 274 255 263 Computer & Equipment and Intangible Amortization 703 680 669 Travel and Business Development 97 66 118 Professional Fees 142 136 127 Other 355 332 406 Total Adjusted1 Non-Interest Expense 3,583 3,585 3,483
Total Reported Non-Interest Expense 4,409 3,613 3,516
64.4
57.4 59.3
56.7
69.3
63.8
56.8 58.7
56.3 56.6
Q2'20 Q3'20 Q4'20 Q1'21 Q2'21
Reported Adjusted1
19Financial Results May 26, 2021
1 See slide 35 for adjustments to reported results. Adjusted measures are non-GAAP measures, see slide 2 for more information. Expense growth, efficiency ratio and operating leverage shown are on an adjusted and reported basis
2 Pre-Provision Pre-Tax earnings (PPPT) is the difference between revenue and expenses3 Commercial loan growth excludes corporate and small business cards
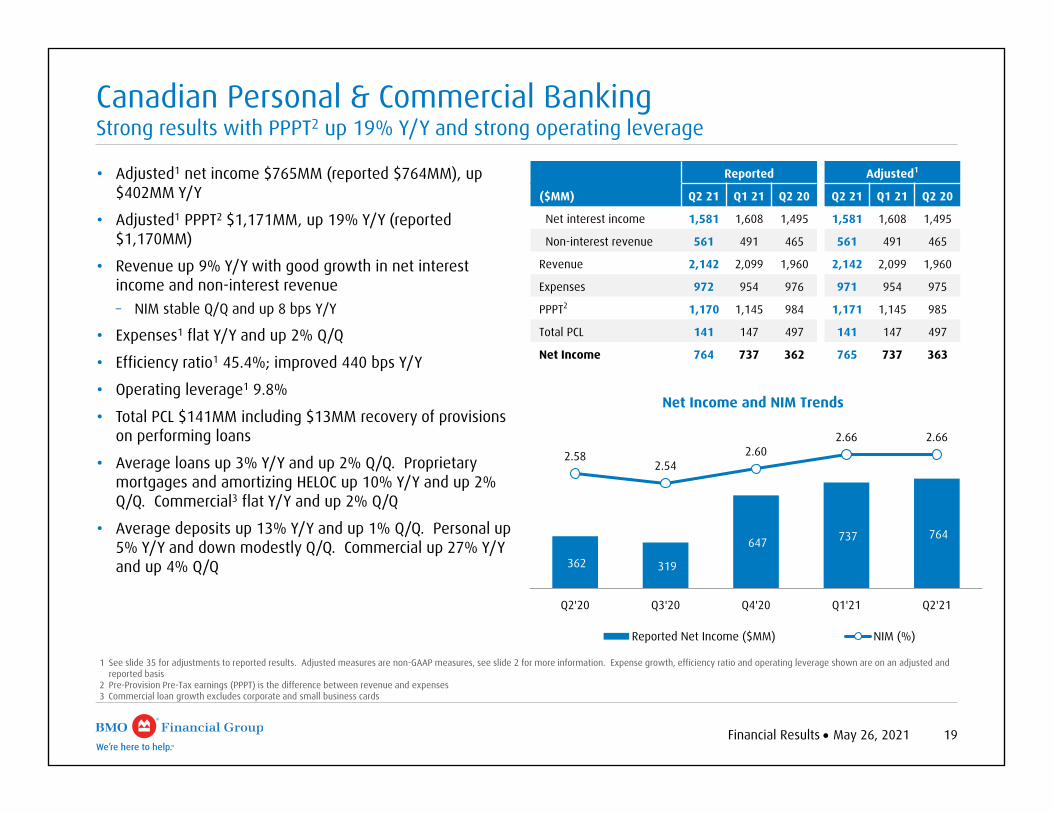
Canadian Personal & Commercial BankingStrong results with PPPT2 up 19% Y/Y and strong operating leverage
• Adjusted1 net income $765MM (reported $764MM), up $402MM Y/Y
• Adjusted1 PPPT2 $1,171MM, up 19% Y/Y (reported $1,170MM)
• Revenue up 9% Y/Y with good growth in net interest income and non-interest revenue– NIM stable Q/Q and up 8 bps Y/Y
• Expenses1 flat Y/Y and up 2% Q/Q
• Efficiency ratio1 45.4%; improved 440 bps Y/Y
• Operating leverage1 9.8%
• Total PCL $141MM including $13MM recovery of provisions on performing loans
• Average loans up 3% Y/Y and up 2% Q/Q. Proprietary mortgages and amortizing HELOC up 10% Y/Y and up 2% Q/Q. Commercial3 flat Y/Y and up 2% Q/Q
• Average deposits up 13% Y/Y and up 1% Q/Q. Personal up 5% Y/Y and down modestly Q/Q. Commercial up 27% Y/Y and up 4% Q/Q
Net Income and NIM Trends
362 319
647 737 764
2.582.54
2.602.66 2.66
Q2'20 Q3'20 Q4'20 Q1'21 Q2'21
Reported Net Income ($MM) NIM (%)
Reported Adjusted1
($MM) Q2 21 Q1 21 Q2 20 Q2 21 Q1 21 Q2 20
Net interest income 1,581 1,608 1,495 1,581 1,608 1,495
Non-interest revenue 561 491 465 561 491 465
Revenue 2,142 2,099 1,960 2,142 2,099 1,960
Expenses 972 954 976 971 954 975
PPPT2 1,170 1,145 984 1,171 1,145 985
Total PCL 141 147 497 141 147 497
Net Income 764 737 362 765 737 363
20Financial Results May 26, 2021
Net Income1 and NIM Trends
1 See slide 35 for adjustments to reported results. Adjusted measures are non-GAAP measures, see slide 2 for more information2 Average loan growth rate referenced above excludes BMO Wealth Management mortgages; average loans down 1% Y/Y and up 2% Q/Q including these balances3 Pre-Provision Pre-Tax earnings (PPPT) is the difference between revenue and expenses
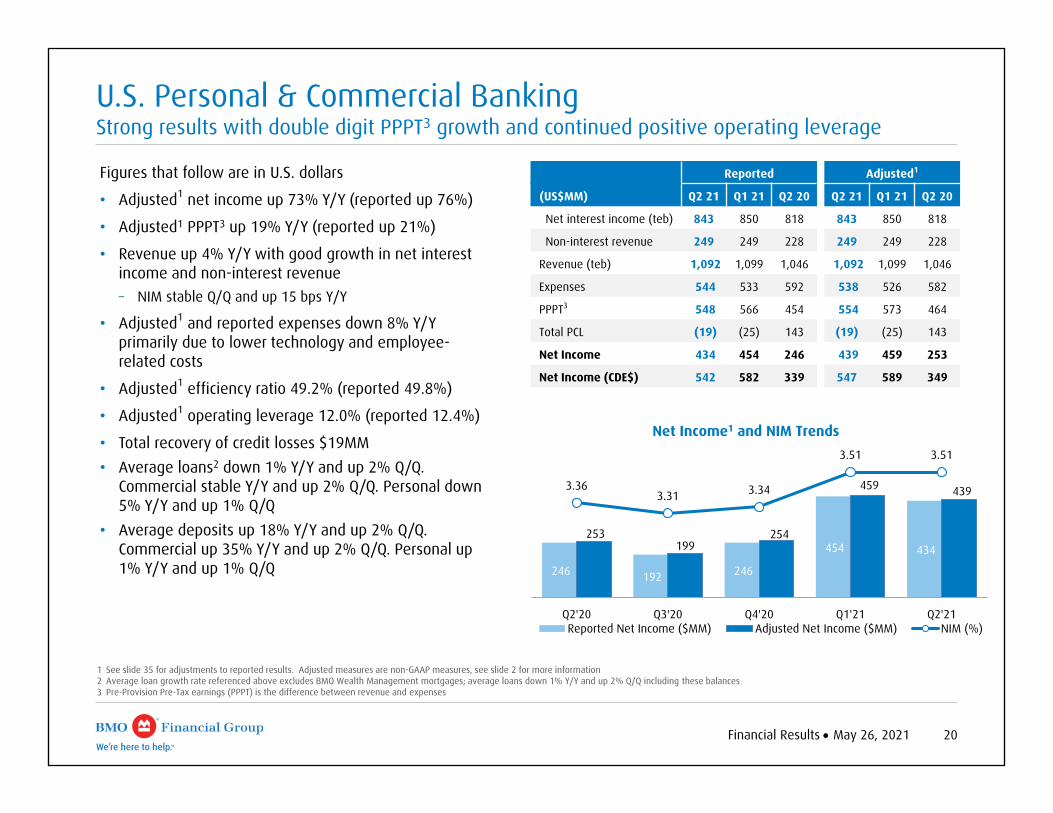
Figures that follow are in U.S. dollars
• Adjusted1 net income up 73% Y/Y (reported up 76%)
• Adjusted1 PPPT3 up 19% Y/Y (reported up 21%)
• Revenue up 4% Y/Y with good growth in net interest income and non-interest revenue– NIM stable Q/Q and up 15 bps Y/Y
• Adjusted1 and reported expenses down 8% Y/Y primarily due to lower technology and employee-related costs
• Adjusted1 efficiency ratio 49.2% (reported 49.8%)
• Adjusted1 operating leverage 12.0% (reported 12.4%)
• Total recovery of credit losses $19MM• Average loans2 down 1% Y/Y and up 2% Q/Q.
Commercial stable Y/Y and up 2% Q/Q. Personal down 5% Y/Y and up 1% Q/Q
• Average deposits up 18% Y/Y and up 2% Q/Q. Commercial up 35% Y/Y and up 2% Q/Q. Personal up 1% Y/Y and up 1% Q/Q
U.S. Personal & Commercial BankingStrong results with double digit PPPT3 growth and continued positive operating leverage
246 192 246
454 434 253
199 254
459 439 3.363.31 3.34
3.51 3.51
Q2'20 Q3'20 Q4'20 Q1'21 Q2'21Reported Net Income ($MM) Adjusted Net Income ($MM) NIM (%)
Reported Adjusted1
(US$MM) Q2 21 Q1 21 Q2 20 Q2 21 Q1 21 Q2 20
Net interest income (teb) 843 850 818 843 850 818
Non-interest revenue 249 249 228 249 249 228
Revenue (teb) 1,092 1,099 1,046 1,092 1,099 1,046
Expenses 544 533 592 538 526 582
PPPT3 548 566 454 554 573 464
Total PCL (19) (25) 143 (19) (25) 143
Net Income 434 454 246 439 459 253
Net Income (CDE$) 542 582 339 547 589 349
21Financial Results May 26, 2021
1 See slide 35 for adjustments to reported results. Adjusted measures are non-GAAP measures, see slide 2 for more information2 For purposes of this slide revenue is net of insurance claims, commissions and changes in policy benefit liabilities (CCPB). Gross revenue: Q2’21 $1,115MM, Q1’21 $1,977MM, Q2’20 $890MM. Operating leverage and efficiency
ratio based on net revenue3 Pre-Provision Pre-Tax earnings (PPPT) is the difference between revenue and expenses4 On April 12, 2021, the bank announced it had reached a definitive agreement with Ameriprise Financial, Inc. to sell its EMEA Asset Management business; the transaction is expected to close in the fourth quarter of calendar
2021. On April 30, 2021, we completed the sale of our Private Banking business in Hong Kong and Singapore to J. Safra Sarasin Group
Net Income1 Trends
Reported Adjusted Reported Adjusted Reported Adjusted Reported Adjusted Reported AdjustedQ2’20 Q3’20 Q4’20 Q1’21 Q2’21
160 169271 279 253 261 286 294 296 303
70 7067 67
72 72 50 50
144
328
(16)
320
(16)
153
349341 358 366 346 353
Insurance ($MM) Traditional Wealth ($MM)
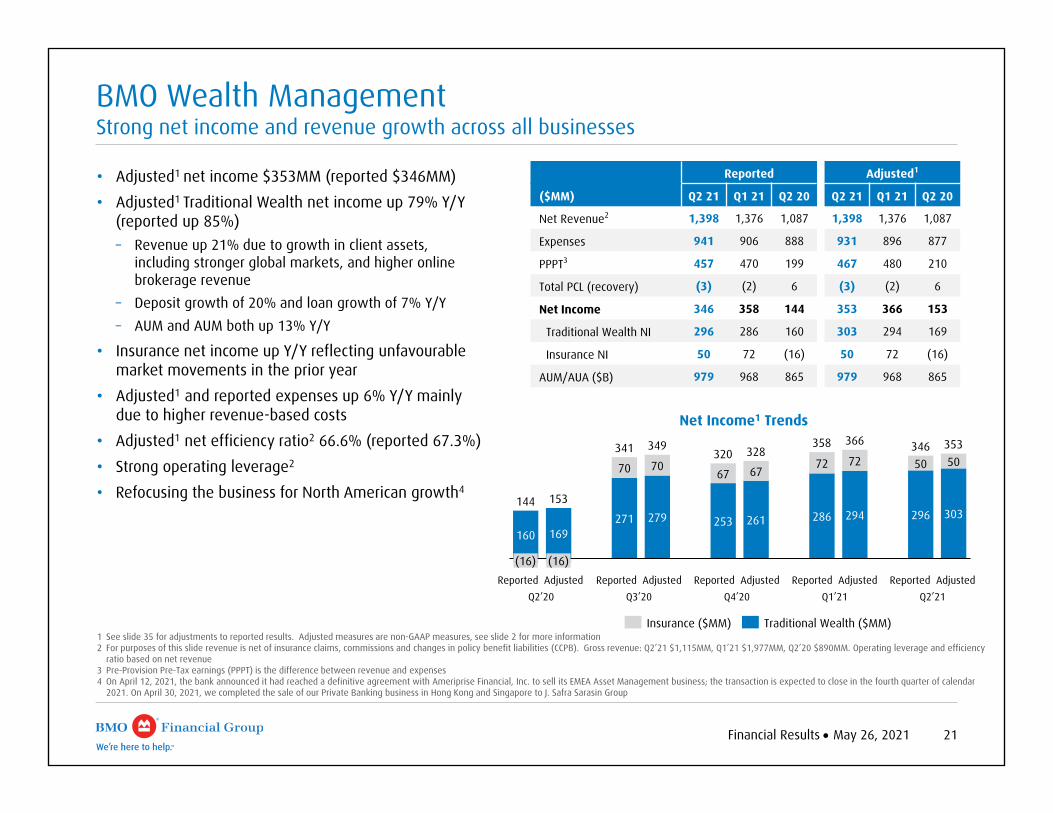
• Adjusted1 net income $353MM (reported $346MM)• Adjusted1 Traditional Wealth net income up 79% Y/Y
(reported up 85%)– Revenue up 21% due to growth in client assets,
including stronger global markets, and higher online brokerage revenue
– Deposit growth of 20% and loan growth of 7% Y/Y– AUM and AUM both up 13% Y/Y
• Insurance net income up Y/Y reflecting unfavourable market movements in the prior year
• Adjusted1 and reported expenses up 6% Y/Y mainly due to higher revenue-based costs
• Adjusted1 net efficiency ratio2 66.6% (reported 67.3%)• Strong operating leverage2
• Refocusing the business for North American growth4
BMO Wealth ManagementStrong net income and revenue growth across all businesses
Reported Adjusted1
($MM) Q2 21 Q1 21 Q2 20 Q2 21 Q1 21 Q2 20
Net Revenue2 1,398 1,376 1,087 1,398 1,376 1,087
Expenses 941 906 888 931 896 877
PPPT3 457 470 199 467 480 210
Total PCL (recovery) (3) (2) 6 (3) (2) 6
Net Income 346 358 144 353 366 153
Traditional Wealth NI 296 286 160 303 294 169
Insurance NI 50 72 (16) 50 72 (16)
AUM/AUA ($B) 979 968 865 979 968 865
22Financial Results May 26, 2021
1 See slide 35 for adjustments to reported results. Adjusted measures are non-GAAP measures, see slide 2 for more information2 Pre-Provision Pre-Tax earnings (PPPT) is the difference between revenue and expenses
(74)
426 379
483 563
(68)
435 387
489 570
Q2'20 Q3'20 Q4'20 Q1'21 Q2'21Reported Net Income ($MM) Adjusted Net Income ($MM)
Net Income1 Trends
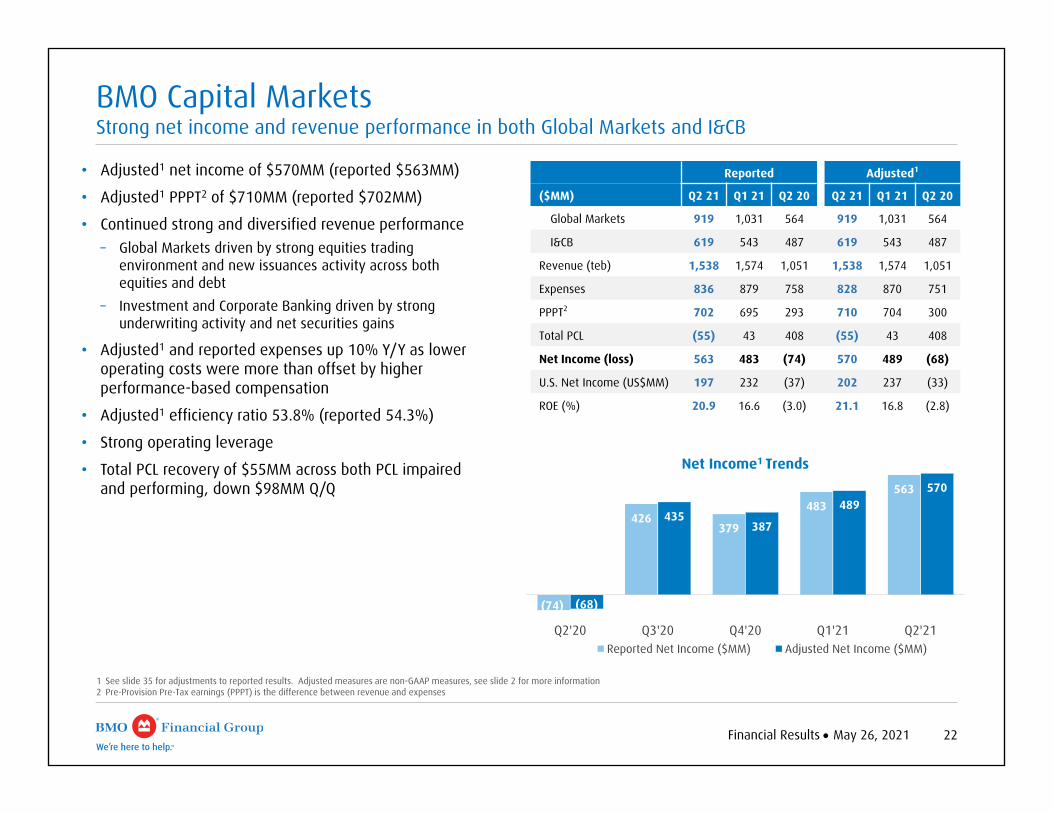
BMO Capital MarketsStrong net income and revenue performance in both Global Markets and I&CB
• Adjusted1 net income of $570MM (reported $563MM)
• Adjusted1 PPPT2 of $710MM (reported $702MM)
• Continued strong and diversified revenue performance– Global Markets driven by strong equities trading
environment and new issuances activity across both equities and debt
– Investment and Corporate Banking driven by strong underwriting activity and net securities gains
• Adjusted1 and reported expenses up 10% Y/Y as lower operating costs were more than offset by higher performance-based compensation
• Adjusted1 efficiency ratio 53.8% (reported 54.3%)
• Strong operating leverage
• Total PCL recovery of $55MM across both PCL impaired and performing, down $98MM Q/Q
Reported Adjusted1
($MM) Q2 21 Q1 21 Q2 20 Q2 21 Q1 21 Q2 20
Global Markets 919 1,031 564 919 1,031 564
I&CB 619 543 487 619 543 487
Revenue (teb) 1,538 1,574 1,051 1,538 1,574 1,051
Expenses 836 879 758 828 870 751
PPPT2 702 695 293 710 704 300
Total PCL (55) 43 408 (55) 43 408
Net Income (loss) 563 483 (74) 570 489 (68)
U.S. Net Income (US$MM) 197 232 (37) 202 237 (33)
ROE (%) 20.9 16.6 (3.0) 21.1 16.8 (2.8)
23Financial Results May 26, 2021
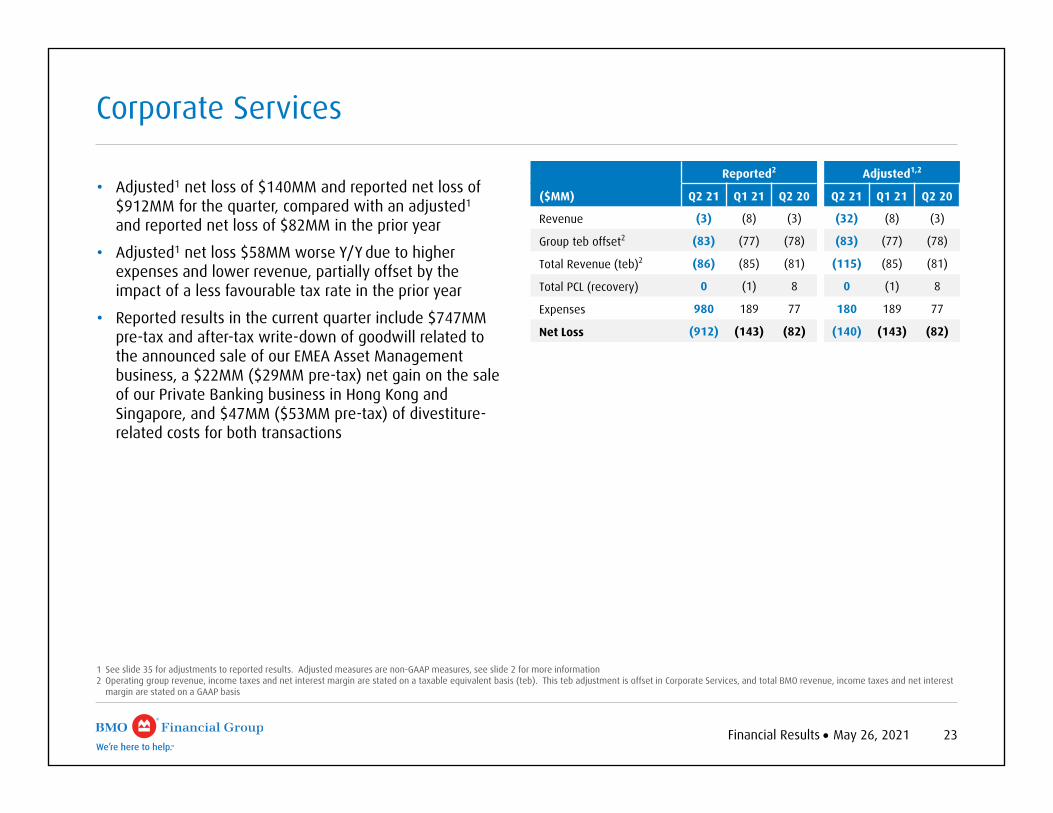
• Adjusted1 net loss of $140MM and reported net loss of $912MM for the quarter, compared with an adjusted1
and reported net loss of $82MM in the prior year
• Adjusted1 net loss $58MM worse Y/Y due to higher expenses and lower revenue, partially offset by the impact of a less favourable tax rate in the prior year
• Reported results in the current quarter include $747MM pre-tax and after-tax write-down of goodwill related to the announced sale of our EMEA Asset Management business, a $22MM ($29MM pre-tax) net gain on the sale of our Private Banking business in Hong Kong and Singapore, and $47MM ($53MM pre-tax) of divestiture-related costs for both transactions
Corporate Services
1 See slide 35 for adjustments to reported results. Adjusted measures are non-GAAP measures, see slide 2 for more information2 Operating group revenue, income taxes and net interest margin are stated on a taxable equivalent basis (teb). This teb adjustment is offset in Corporate Services, and total BMO revenue, income taxes and net interest
margin are stated on a GAAP basis
Reported2 Adjusted1,2
($MM) Q2 21 Q1 21 Q2 20 Q2 21 Q1 21 Q2 20
Revenue (3) (8) (3) (32) (8) (3)
Group teb offset2 (83) (77) (78) (83) (77) (78)
Total Revenue (teb)2 (86) (85) (81) (115) (85) (81)
Total PCL (recovery) 0 (1) 8 0 (1) 8
Expenses 980 189 77 180 189 77
Net Loss (912) (143) (82) (140) (143) (82)
Risk ReviewFor the Quarter Ended April 30, 2021
Q2 21
Patrick CroninChief Risk Officer
Risk Review May 26, 2021 25
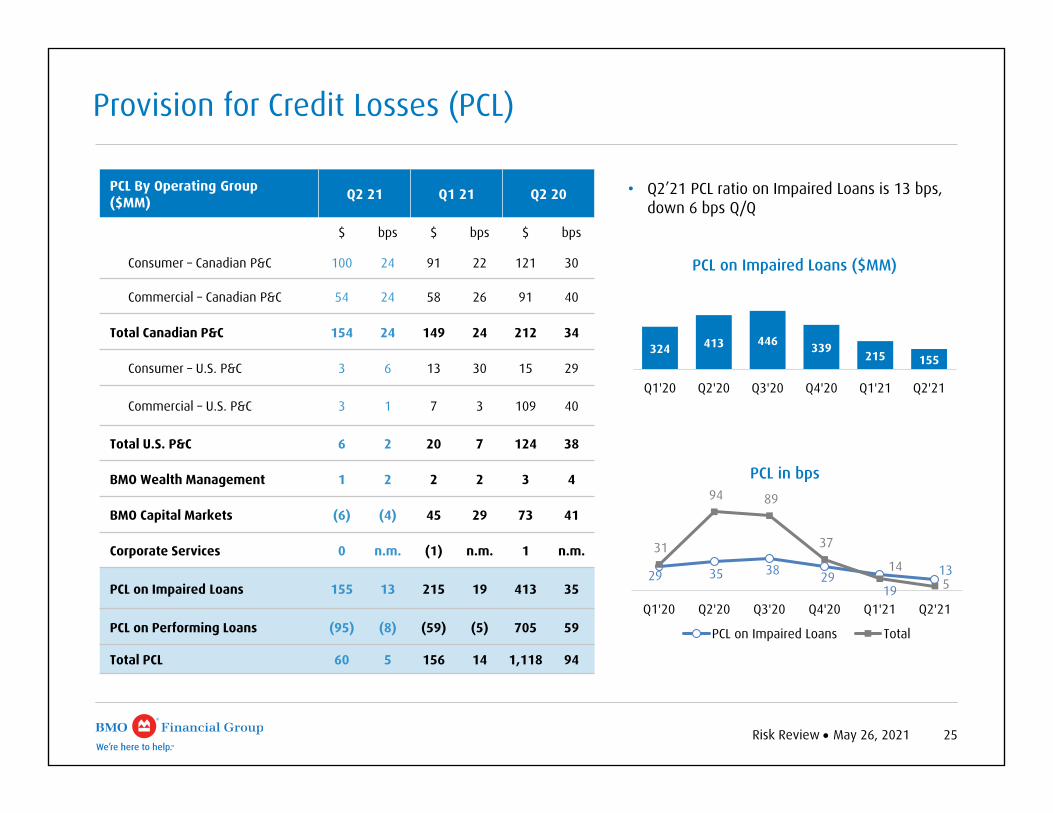
Provision for Credit Losses (PCL)
PCL By Operating Group($MM) Q2 21 Q1 21 Q2 20
$ bps $ bps $ bps
Consumer – Canadian P&C 100 24 91 22 121 30
Commercial – Canadian P&C 54 24 58 26 91 40
Total Canadian P&C 154 24 149 24 212 34
Consumer – U.S. P&C 3 6 13 30 15 29
Commercial – U.S. P&C 3 1 7 3 109 40
Total U.S. P&C 6 2 20 7 124 38
BMO Wealth Management 1 2 2 2 3 4
BMO Capital Markets (6) (4) 45 29 73 41
Corporate Services 0 n.m. (1) n.m. 1 n.m.
PCL on Impaired Loans 155 13 215 19 413 35
PCL on Performing Loans (95) (8) (59) (5) 705 59
Total PCL 60 5 156 14 1,118 94
• Q2’21 PCL ratio on Impaired Loans is 13 bps, down 6 bps Q/Q
324 413 446 339215 155
Q1'20 Q2'20 Q3'20 Q4'20 Q1'21 Q2'21
PCL on Impaired Loans ($MM)
29 35 38 2919
13
31
94 89
37
14 5
Q1'20 Q2'20 Q3'20 Q4'20 Q1'21 Q2'21
PCL in bps
PCL on Impaired Loans Total
Risk Review May 26, 2021 26
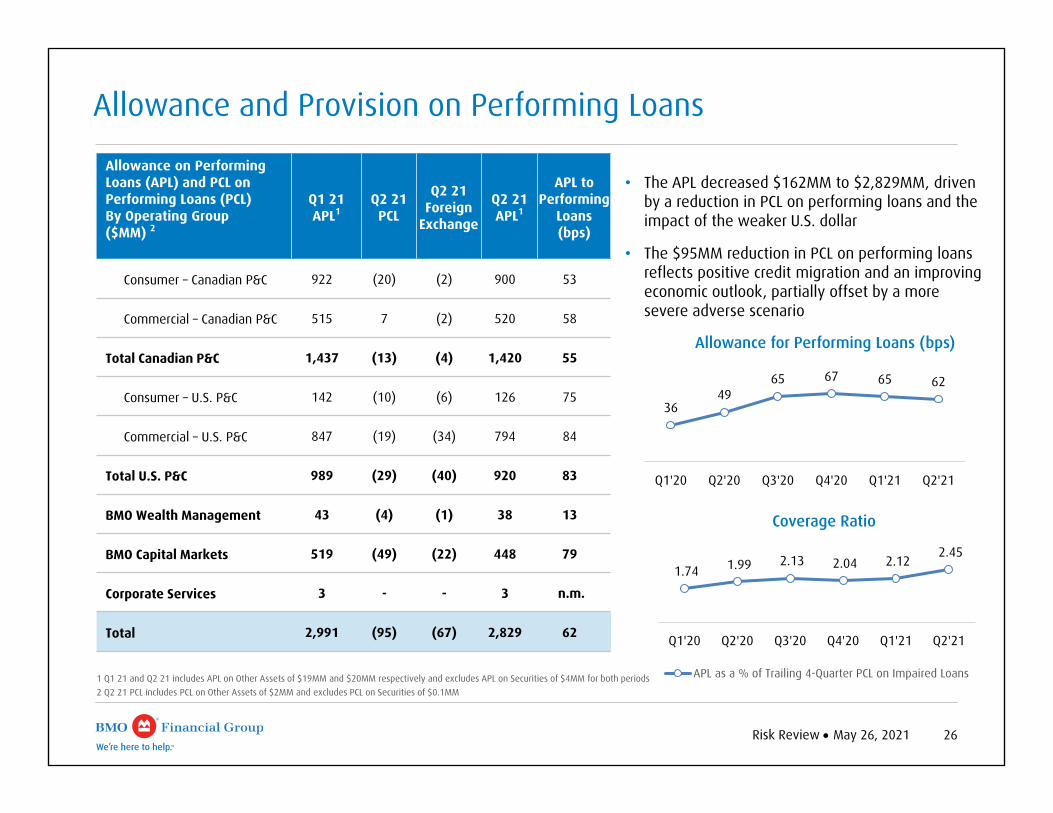
Allowance and Provision on Performing Loans
• The APL decreased $162MM to $2,829MM, driven by a reduction in PCL on performing loans and the impact of the weaker U.S. dollar
• The $95MM reduction in PCL on performing loans reflects positive credit migration and an improving economic outlook, partially offset by a more severe adverse scenario
Allowance on Performing Loans (APL) and PCL on Performing Loans (PCL)By Operating Group($MM) 2
Q1 21 APL1
Q2 21 PCL
Q2 21 Foreign
Exchange
Q2 21 APL1
APL to Performing
Loans (bps)
Consumer – Canadian P&C 922 (20) (2) 900 53
Commercial – Canadian P&C 515 7 (2) 520 58
Total Canadian P&C 1,437 (13) (4) 1,420 55
Consumer – U.S. P&C 142 (10) (6) 126 75
Commercial – U.S. P&C 847 (19) (34) 794 84
Total U.S. P&C 989 (29) (40) 920 83
BMO Wealth Management 43 (4) (1) 38 13
BMO Capital Markets 519 (49) (22) 448 79
Corporate Services 3 - - 3 n.m.
Total 2,991 (95) (67) 2,829 62
1 Q1 21 and Q2 21 includes APL on Other Assets of $19MM and $20MM respectively and excludes APL on Securities of $4MM for both periods2 Q2 21 PCL includes PCL on Other Assets of $2MM and excludes PCL on Securities of $0.1MM
1.74 1.99 2.13 2.04 2.12 2.45
Q1'20 Q2'20 Q3'20 Q4'20 Q1'21 Q2'21
Coverage Ratio
APL as a % of Trailing 4-Quarter PCL on Impaired Loans
3649
65 67 65 62
Q1'20 Q2'20 Q3'20 Q4'20 Q1'21 Q2'21
Allowance for Performing Loans (bps)

Risk Review May 26, 2021 27
Gross Impaired Loans and Formations
• Gross Impaired Loans (GIL) ratio 65 bps, down 9 bps Q/Q
1 Total Business and Government includes $42MM GIL from Other Countries2 Other Business and Government includes industry segments that are each <1% of total GIL
2,822 3,645 4,413 3,638 3,442 3,000
Q1'20 Q2'20 Q3'20 Q4'20 Q1'21 Q2'21
Gross Impaired Loans ($MM)
62 7494
78 74 65
Q1'20 Q2'20 Q3'20 Q4'20 Q1'21 Q2'21
GIL (bps)
By Industry($MM, as at Q2 21)
Formations Gross Impaired Loans
Canada & Other U.S. Total Canada &
Other1 U.S. Total
Consumer 190 29 219 449 325 774
Service Industries 25 9 34 173 297 470
Oil & Gas 0 0 0 78 253 331
Retail Trade 10 1 11 265 77 342
Agriculture 13 1 14 81 188 269
Manufacturing 46 3 49 179 65 244
Transportation 8 26 34 19 123 142
Financing Products 0 0 0 0 94 94
Wholesale Trade 2 12 14 24 65 89
Commercial Real Estate 9 13 22 42 35 77
Construction (non-real estate) 9 3 12 50 29 79
Mining 0 0 0 0 31 31
Financial 11 0 11 24 7 31
Other Business and Government2 4 1 5 21 6 27Total Business and Government 137 69 206 956 1,270 2,226
Total Bank 327 98 425 1,405 1,595 3,000
831 1,396
1,760
662 665 425
Q1'20 Q2'20 Q3'20 Q4'20 Q1'21 Q2'21
Formations ($MM)
Risk Review May 26, 2021 28
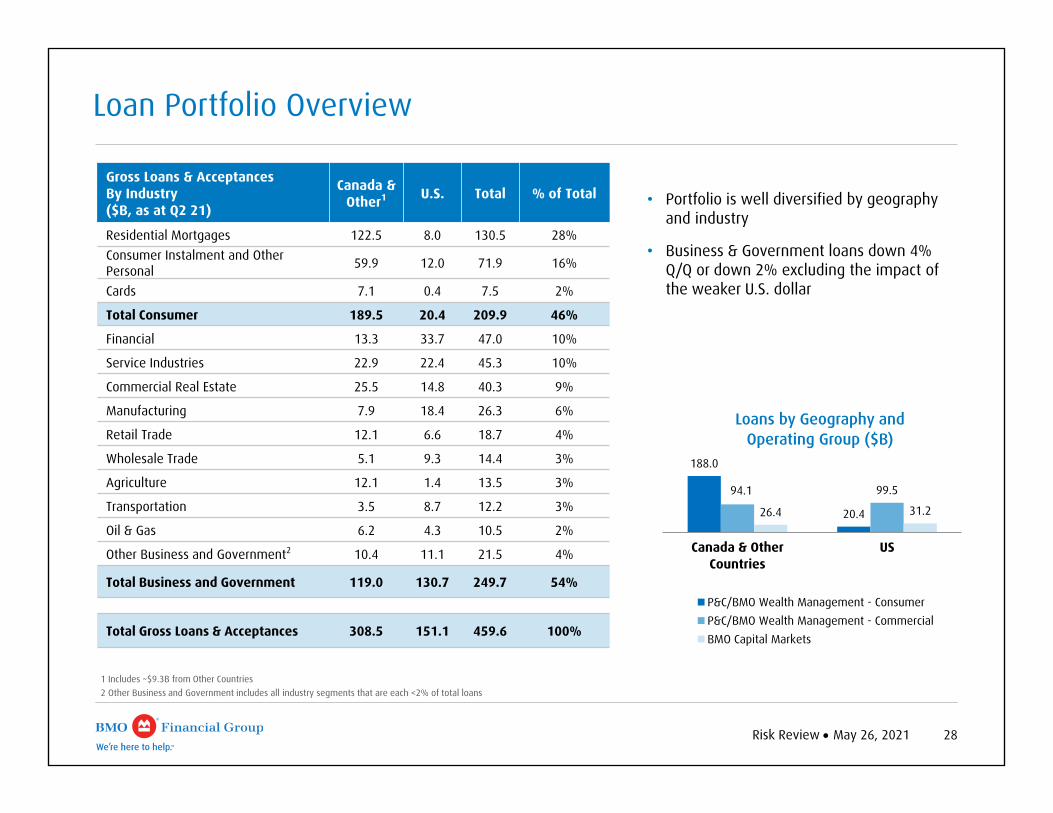
1 Includes ~$9.3B from Other Countries2 Other Business and Government includes all industry segments that are each <2% of total loans
• Portfolio is well diversified by geography and industry
• Business & Government loans down 4% Q/Q or down 2% excluding the impact of the weaker U.S. dollar
Loan Portfolio Overview
Gross Loans & Acceptances By Industry($B, as at Q2 21)
Canada & Other1 U.S. Total % of Total
Residential Mortgages 122.5 8.0 130.5 28%Consumer Instalment and Other Personal 59.9 12.0 71.9 16%
Cards 7.1 0.4 7.5 2%
Total Consumer 189.5 20.4 209.9 46%
Financial 13.3 33.7 47.0 10%
Service Industries 22.9 22.4 45.3 10%
Commercial Real Estate 25.5 14.8 40.3 9%
Manufacturing 7.9 18.4 26.3 6%
Retail Trade 12.1 6.6 18.7 4%
Wholesale Trade 5.1 9.3 14.4 3%
Agriculture 12.1 1.4 13.5 3%
Transportation 3.5 8.7 12.2 3%
Oil & Gas 6.2 4.3 10.5 2%
Other Business and Government2 10.4 11.1 21.5 4%
Total Business and Government 119.0 130.7 249.7 54%
Total Gross Loans & Acceptances 308.5 151.1 459.6 100%
188.0
20.4
94.1 99.5
26.4 31.2
Canada & OtherCountries
US
Loans by Geography and Operating Group ($B)
P&C/BMO Wealth Management - ConsumerP&C/BMO Wealth Management - CommercialBMO Capital Markets
Risk Review May 26, 2021 29
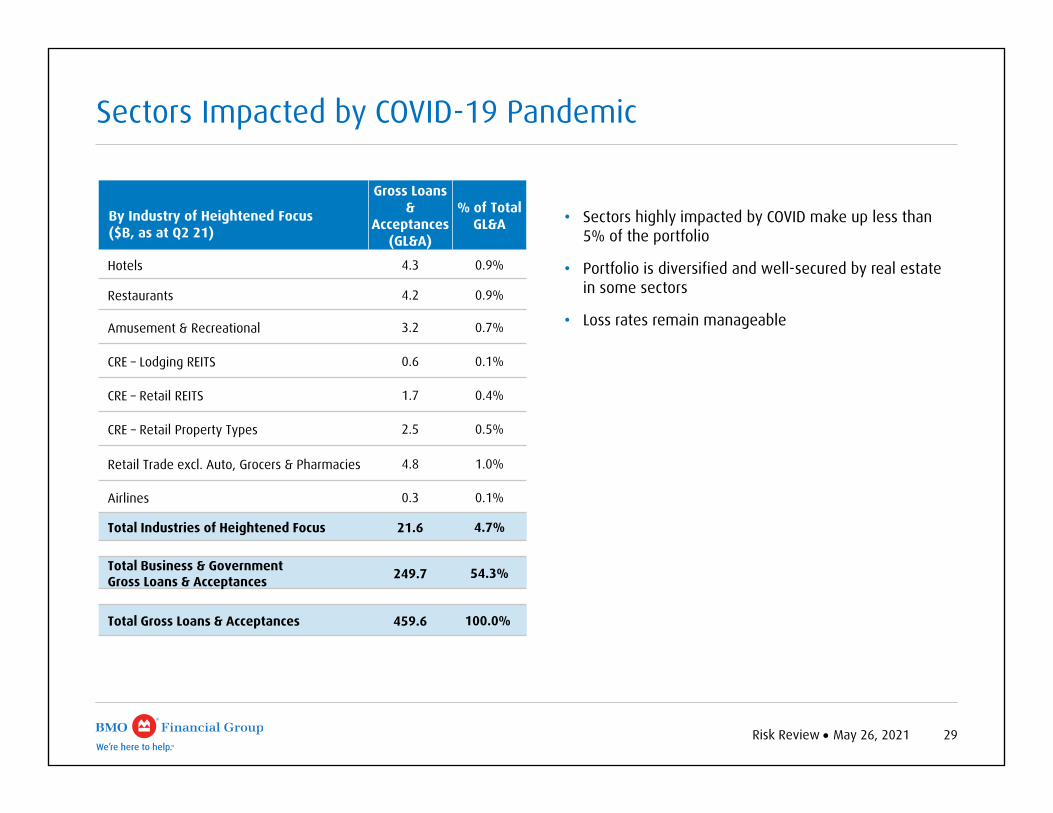
Sectors Impacted by COVID-19 Pandemic
By Industry of Heightened Focus($B, as at Q2 21)
Gross Loans &
Acceptances (GL&A)
% of Total GL&A
Hotels 4.3 0.9%
Restaurants 4.2 0.9%
Amusement & Recreational 3.2 0.7%
CRE – Lodging REITS 0.6 0.1%
CRE – Retail REITS 1.7 0.4%
CRE – Retail Property Types 2.5 0.5%
Retail Trade excl. Auto, Grocers & Pharmacies 4.8 1.0%
Airlines 0.3 0.1%
Total Industries of Heightened Focus 21.6 4.7%
Total Business & Government Gross Loans & Acceptances 249.7 54.3%
Total Gross Loans & Acceptances 459.6 100.0%
• Sectors highly impacted by COVID make up less than 5% of the portfolio
• Portfolio is diversified and well-secured by real estate in some sectors
• Loss rates remain manageable
Risk Review May 26, 2021 30
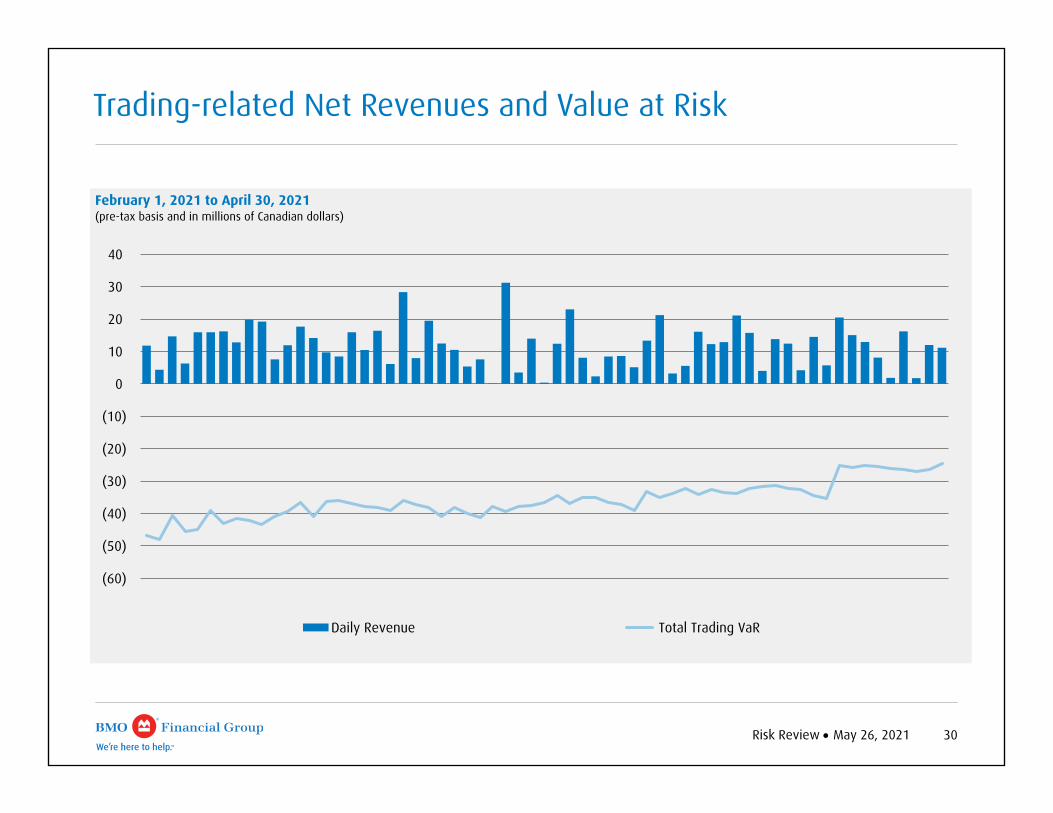
Trading-related Net Revenues and Value at Risk
(60)
(50)
(40)
(30)
(20)
(10)
0
10
20
30
40
February 1, 2021 to April 30, 2021(pre-tax basis and in millions of Canadian dollars)
Daily Revenue Total Trading VaR

Appendix
32Financial Results May 26, 2021
90.3 87.9 89.9
8.9 8.3 7.8
48.6 49.3 50.0
103.6 108.3 110.2
Q2'20Avg.
Q1'21Avg.
Q2'21Avg.
Residential Mortgages Consumer LoansCredit Cards Commercial Loans & Acceptances
73.5 89.9 93.4
123.6
130.1 129.4
Q2'20Avg.
Q1'21Avg.
Q2'21Avg.
Commercial Deposits Personal Deposits
Gross Loans & Acceptances ($B)
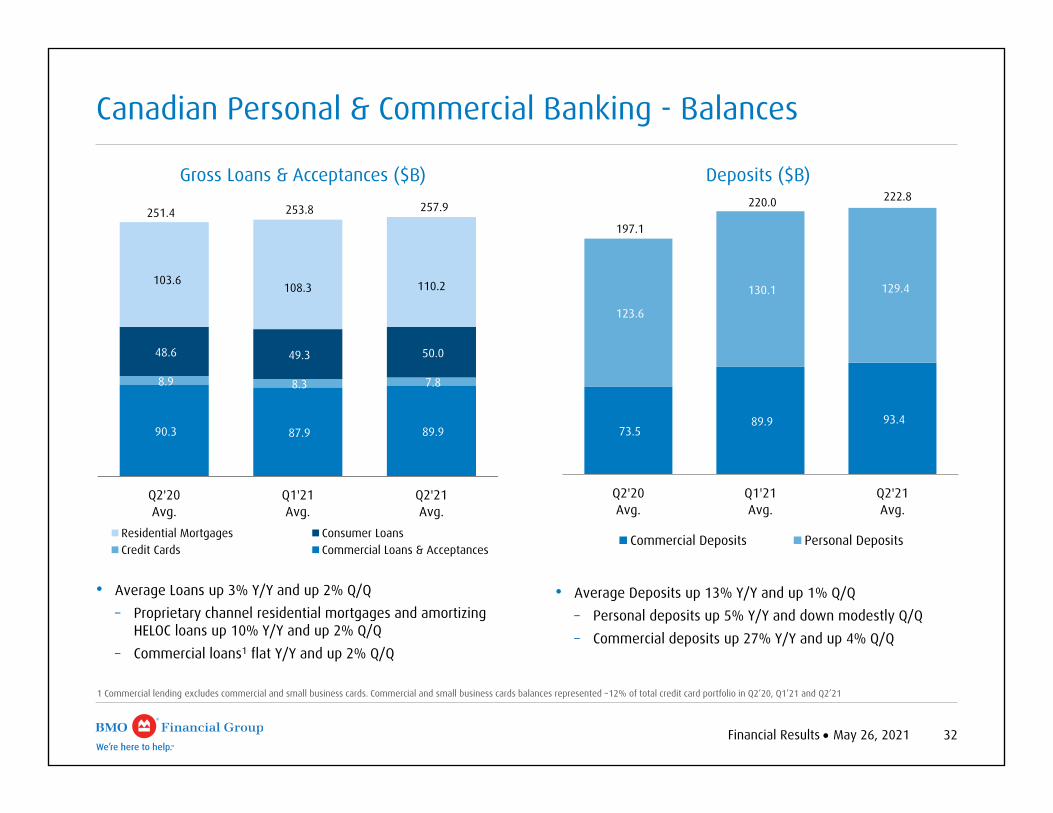
• Average Loans up 3% Y/Y and up 2% Q/Q – Proprietary channel residential mortgages and amortizing
HELOC loans up 10% Y/Y and up 2% Q/Q– Commercial loans1 flat Y/Y and up 2% Q/Q
• Average Deposits up 13% Y/Y and up 1% Q/Q – Personal deposits up 5% Y/Y and down modestly Q/Q– Commercial deposits up 27% Y/Y and up 4% Q/Q
197.1
222.8251.4 253.8 257.9
1 Commercial lending excludes commercial and small business cards. Commercial and small business cards balances represented ~12% of total credit card portfolio in Q2’20, Q1’21 and Q2’21
Deposits ($B)
Canadian Personal & Commercial Banking - Balances
220.0
33Financial Results May 26, 2021
78.4 76.5 78.3
10.5 8.9 8.6
7.5 8.0 8.5
Q2'20Avg.
Q1'21Avg.
Q2'21Avg.
Gross Loans & Acceptances (US$B)
Commercial Personal Mortgages Personal Other Loans
93.4196.4195.41
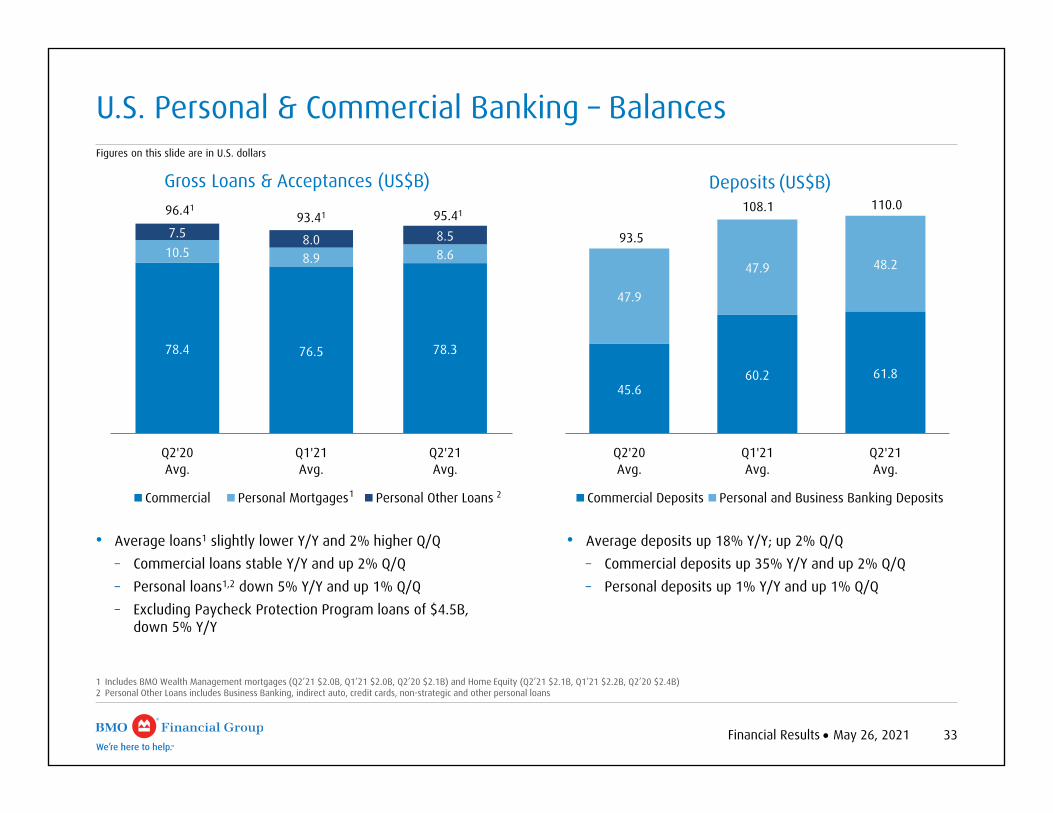
U.S. Personal & Commercial Banking – Balances
1 Includes BMO Wealth Management mortgages (Q2’21 $2.0B, Q1’21 $2.0B, Q2’20 $2.1B) and Home Equity (Q2’21 $2.1B, Q1’21 $2.2B, Q2’20 $2.4B)2 Personal Other Loans includes Business Banking, indirect auto, credit cards, non-strategic and other personal loans
• Average deposits up 18% Y/Y; up 2% Q/Q – Commercial deposits up 35% Y/Y and up 2% Q/Q– Personal deposits up 1% Y/Y and up 1% Q/Q
• Average loans1 slightly lower Y/Y and 2% higher Q/Q– Commercial loans stable Y/Y and up 2% Q/Q– Personal loans1,2 down 5% Y/Y and up 1% Q/Q– Excluding Paycheck Protection Program loans of $4.5B,
down 5% Y/Y
45.660.2 61.8
47.9
47.9 48.2
Q2'20Avg.
Q1'21Avg.
Q2'21Avg.
Deposits (US$B)
Commercial Deposits Personal and Business Banking Deposits
93.5
108.1 110.0
1 2
Figures on this slide are in U.S. dollars

Risk Review May 26, 2021 34
1 LTV is the ratio of outstanding mortgage balance or the HELOC authorization to the original property value indexed using Teranet data. Portfolio LTV is the combination of each individual mortgage or HELOC LTV weighted by the mortgage balance or HELOC authorization
$6.6
$25.2
$73.1
$19.4
$31.9
$4.6
45%31% 22%
51%16%
47%
42%
40%
53%
32% 59%
37%
13%
29%
25%
17%
25%
16%
Atlantic Quebec Ontario Alberta British Columbia All Other Canada
Residential-Secured Lending by Region ($160.8B)
HELOC
Uninsured Mortgages
Insured Mortgages
Canadian Residential-Secured Lending
• Total Canadian residential-secured lending portfolio at $160.8B, representing 35% of total loans
─ LTV1 on uninsured of 50%
─ 90-day delinquency rate for RESL remains good at 17 bps; loss rates for the trailing 4 quarter period were 1 bp
• Residential mortgage portfolio of $122.5B
─ 36% of portfolio insured
─ LTV1 on uninsured of 54%
─ 79% of the mortgage portfolio has an effective remaining amortization of 25 years or less
• HELOC portfolio of $38.2B outstanding of which 67% is amortizing
• GTA and GVA portfolios demonstrate better LTV1, delinquency rates and bureau scores compared to the national average
Avg. LTV1
UninsuredAtlantic Quebec Ontario Alberta British
ColumbiaAll Other Canada
Total Canada
Mortgage - Portfolio 57% 57% 53% 61% 50% 55% 54% - Origination 73% 74% 69% 73% 67% 73% 70%HELOC - Portfolio 46% 52% 44% 56% 44% 47% 47% - Origination 74% 74% 64% 66% 63% 71% 66%
35Financial Results May 26, 2021
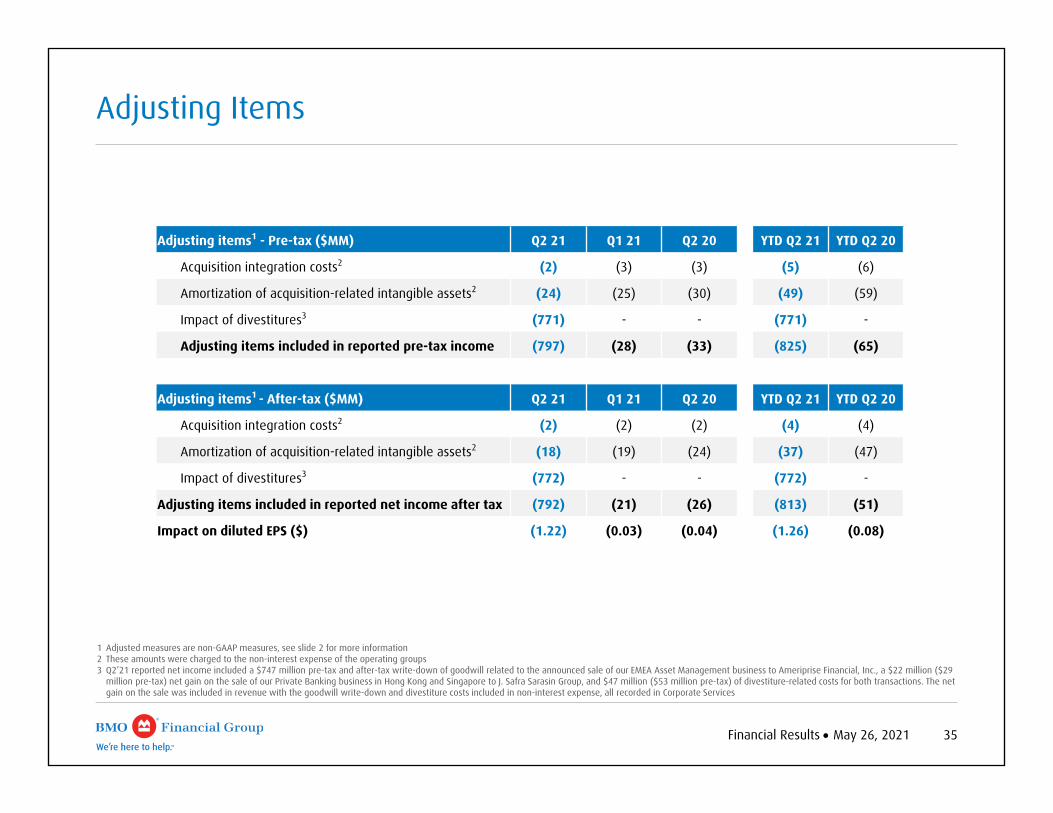
1 Adjusted measures are non-GAAP measures, see slide 2 for more information2 These amounts were charged to the non-interest expense of the operating groups 3 Q2’21 reported net income included a $747 million pre-tax and after-tax write-down of goodwill related to the announced sale of our EMEA Asset Management business to Ameriprise Financial, Inc., a $22 million ($29
million pre-tax) net gain on the sale of our Private Banking business in Hong Kong and Singapore to J. Safra Sarasin Group, and $47 million ($53 million pre-tax) of divestiture-related costs for both transactions. The net gain on the sale was included in revenue with the goodwill write-down and divestiture costs included in non-interest expense, all recorded in Corporate Services
Adjusting Items
Adjusting items1 - Pre-tax ($MM) Q2 21 Q1 21 Q2 20 YTD Q2 21 YTD Q2 20
Acquisition integration costs2 (2) (3) (3) (5) (6)
Amortization of acquisition-related intangible assets2 (24) (25) (30) (49) (59)
Impact of divestitures3 (771) - - (771) -
Adjusting items included in reported pre-tax income (797) (28) (33) (825) (65)
Adjusting items1 - After-tax ($MM) Q2 21 Q1 21 Q2 20 YTD Q2 21 YTD Q2 20
Acquisition integration costs2 (2) (2) (2) (4) (4)
Amortization of acquisition-related intangible assets2 (18) (19) (24) (37) (47)
Impact of divestitures3 (772) - - (772) -
Adjusting items included in reported net income after tax (792) (21) (26) (813) (51)
Impact on diluted EPS ($) (1.22) (0.03) (0.04) (1.26) (0.08)

Investor RelationsContact Informationbmo.com/investorrelationsE-mail: [email protected]
SUKHWINDER SINGHDirector, Investor [email protected]
BILL ANDERSONDirector, Investor [email protected]
BMO Financial Group