Embed Size (px)
Citation preview
Hydrological Summary for the United Kingdom
Jan
ua
ry 2
01
8
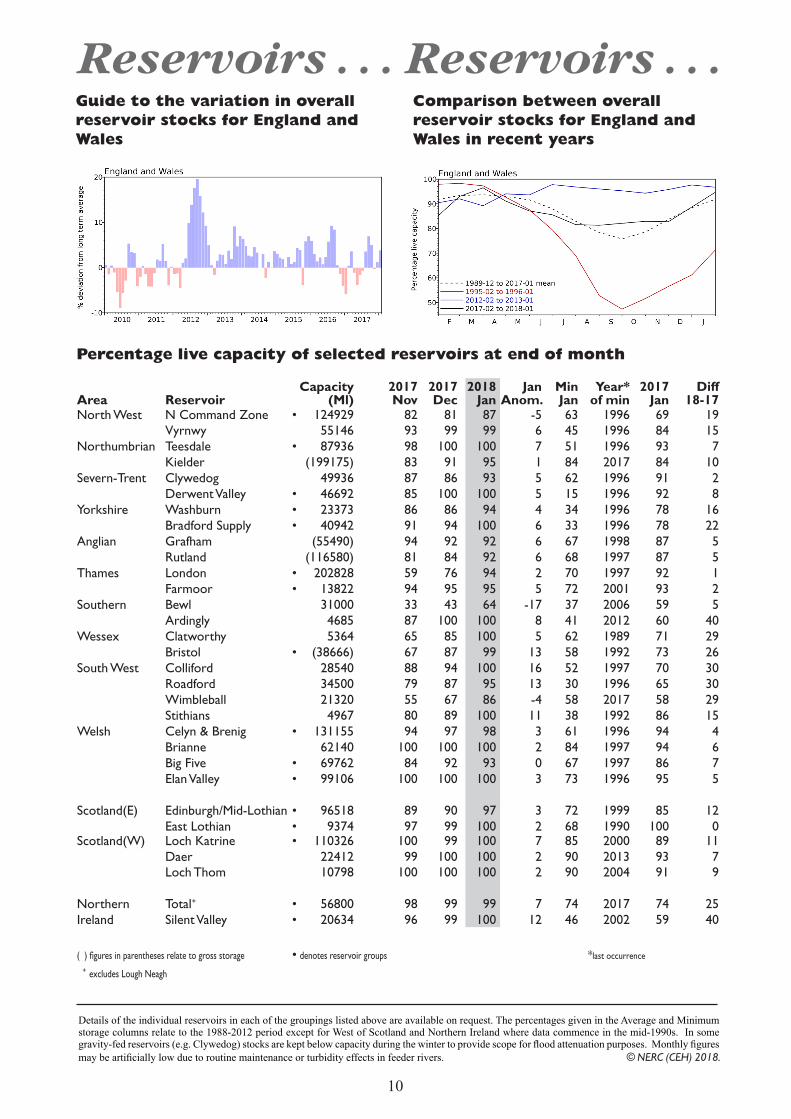
GeneralJanuary was a decidedly wintery month across the UK, interspersed with strong winds and snowfalls over higher ground. Although there were four named storms, January was only moderately wetter than average for the UK as a whole, reflecting the focus on wind for naming storms. However, it was wetter than average in Northern Ireland and substantially below average rainfall was recorded in regions of eastern Scotland. River flows were mostly in the normal range or above for January and new monthly maxima were established in Northern Ireland. Soil moisture deficits (SMDs) were eliminated in south-east England and the seasonal recovery of groundwater levels was well established with few exceptions. Levels were generally in the normal range, although below normal levels persist in parts of the Chalk. Stocks in most reservoirs increased relative to average, some substantially. Month-end stocks at Bewl increased by over 20% (but remained well below average for the time of year), and although a winter refill drought permit was granted in early January, it has not yet been implemented. Despite above average rainfall for winter so far (December-January) in the south-east of England, the delayed start to the recharge season from a below normal baseline means the likelihood of water resource pressures this summer has decreased, although in some areas above average rainfall is still required.
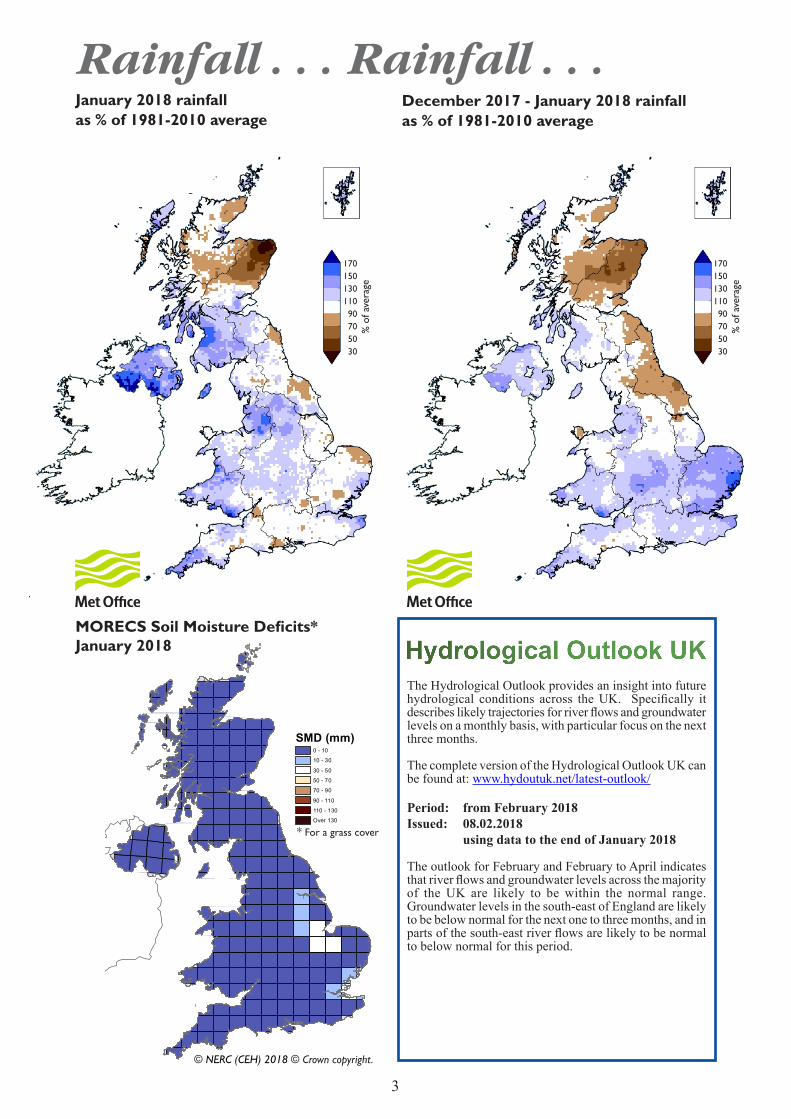
RainfallA period of high pressure brought calmer weather in the second week of January, sandwiched by unsettled periods as westerly frontal systems crossed the UK, bringing wintery, wet and windy conditions (including snow across higher ground). Although rainfall totals were not substantial for storms ‘Eleanor’ (2nd/3rd), ‘Fionn’ (16th) and ‘David’ (17th/18th, so named by MeteoFrance), strong gusts (e.g. 93mph on the 17th at Capel Curig, north Wales) and extensive snow falls (e.g. 38cm at Eskdalemuir on the 17th and 26cm at West Freugh on the 18th, both Dumfries and Galloway), were typical of these periods. In contrast, frontal systems on the 14th and 21st (the latter of which resulted in landslides in north Devon) and storm ‘Georgina’(23rd/24th) brought larger rainfall totals: 82mm at Skye Alltdearg House (Inverness-shire) on the 14th, 41mm at Gogerddan (mid-Wales) on the 21st, and 53mm at Kielder Castle (Northumberland) on the 23rd. In northern and western areas of the UK, transport disruption and school closures due to strong winds (and the resulting damage), snowfall and icy conditions were common throughout the month. For the UK overall, January rainfall was marginally above average (112%), although there were distinct regional differences. Above average rainfall was recorded across western parts of the UK with over 170% of average in southern parts of Northern Ireland (which, as a whole, recorded 147% of average and was the ninth wettest January on record, in a series from 1910). Conversely, less than 90% of January average rainfall was registered in parts of southern and eastern England and much of north-east Scotland with parts of Aberdeenshire receiving less than half and a small area less than a third. The winter so far (December-January) has been wetter than average across Northern Ireland, much of Wales and southern and central England, with Anglian region recording 130% of average over this period. In contrast, north-eastern Britain received below average rainfall with large parts of north-east Scotland receiving less than 70% of average; deficits in the Tay and regions of southern England extend back to last winter.
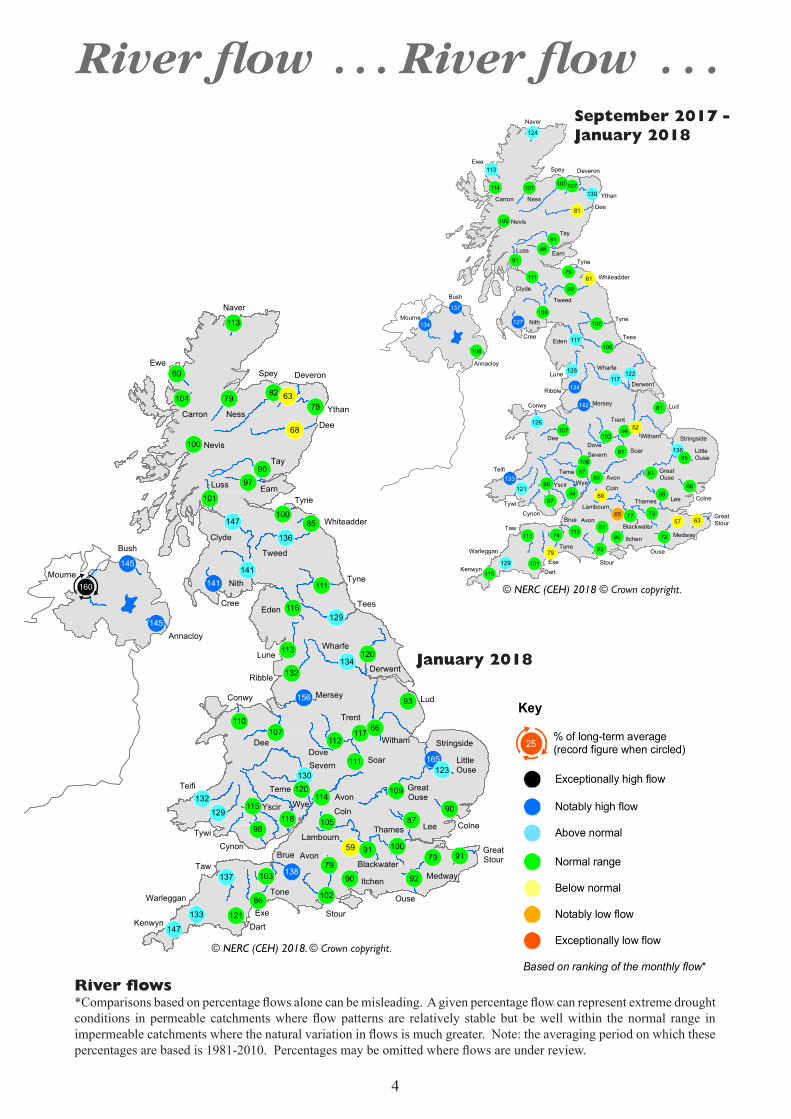
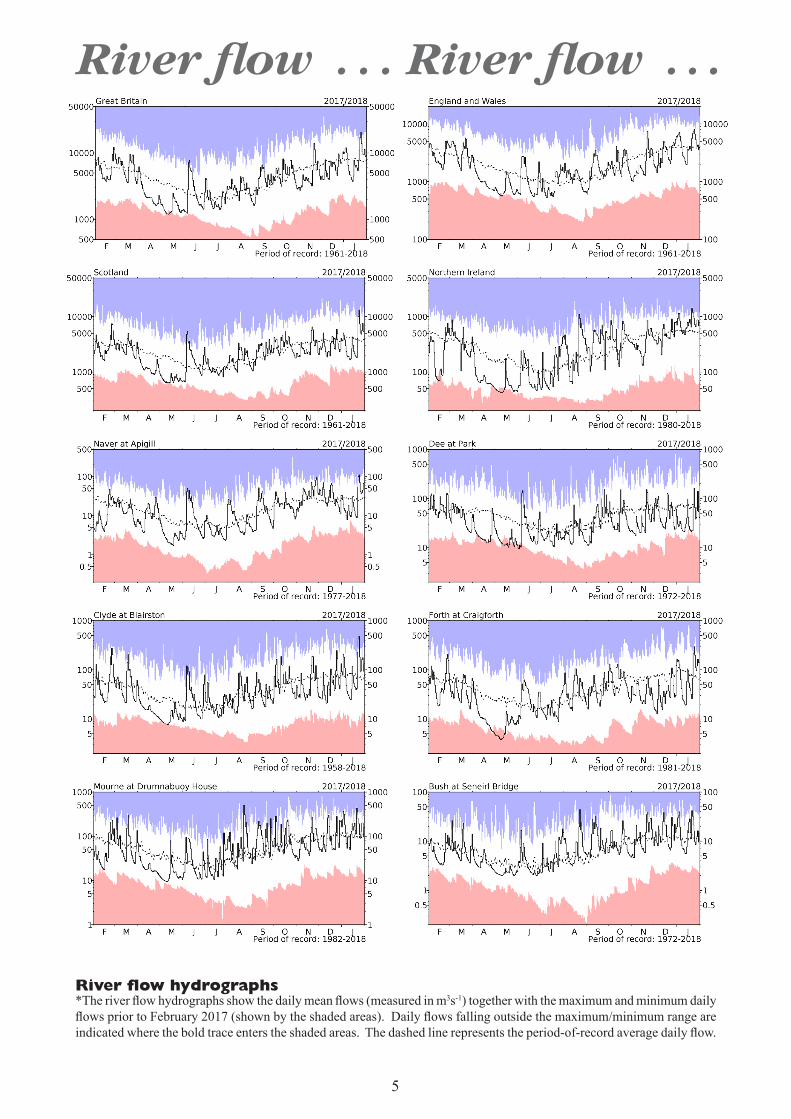
River flowsFollowing heavy rainfall at the end of December and flow responses to storm ‘Eleanor’ in early January, many catchments began 2018 with average to above average flows. The second highest January peak flow was recorded on the Stringside on the 1st (in a record from 1965). Thereafter, recessions commenced and flows fell below average in many catchments but were interrupted by moderate responses to rainfall brought by storm ‘Fionn’ in northern and western catchments and were halted by the heavy rainfall over the 21st-24th across much of the UK. As
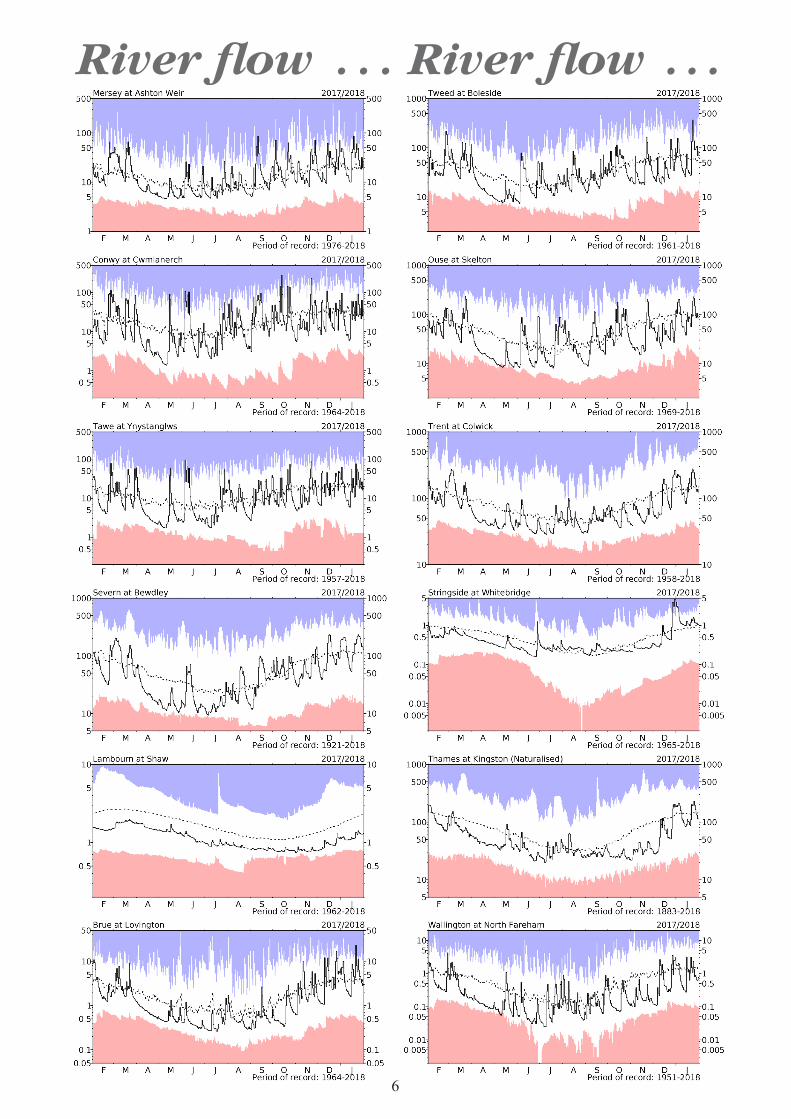
a result, most catchments ended January with average or above average flows. The third highest January daily flow was recorded on the Brue on the 21st (in a record since 1965), with flooding occurring in parts of Devon and Cornwall. New daily flow maxima were registered on the 23rd/24th in 13 catchments in Northern Ireland and northern Britain as well as in total UK outflows (in a series from 1961) and a new January peak flow maximum was registered on the Clyde (in a record approaching 60 years). For January, monthly mean flows were, for the most part, in the normal range or above. Some catchments recorded notably high flows; the Stringside and Mersey both recorded over 150% of the January average, and the Mourne registered its highest average January flow in a series from 1982. In contrast to recent months, few catchments recorded below normal flows – these were confined to the groundwater dominated Lambourn and more responsive catchments in north-east Scotland. The winter so far (December-January) showed a similar picture as January, but looking further back to the start of the autumn (September-January) and beyond, long-term river flow deficiencies are evident across southern and eastern catchments with several below normal for this five month period. In some catchments, river flows were more than 30% below average, reflecting the dry autumn, spring and previous winter.
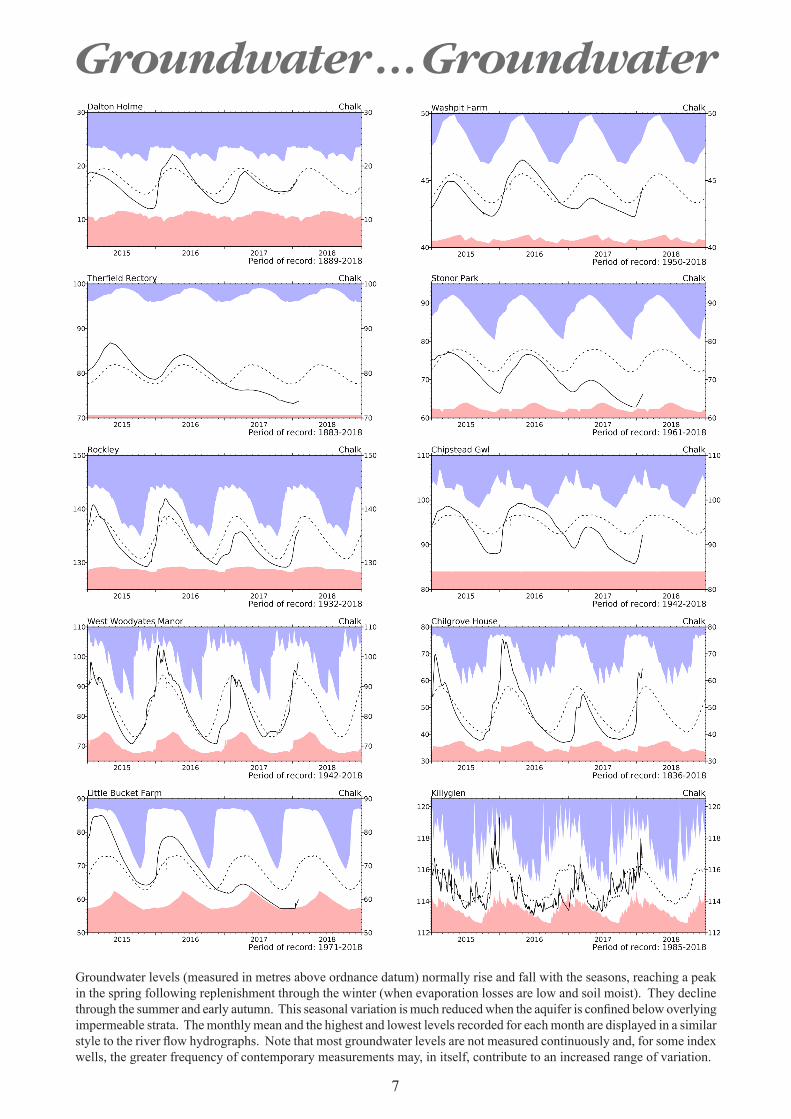
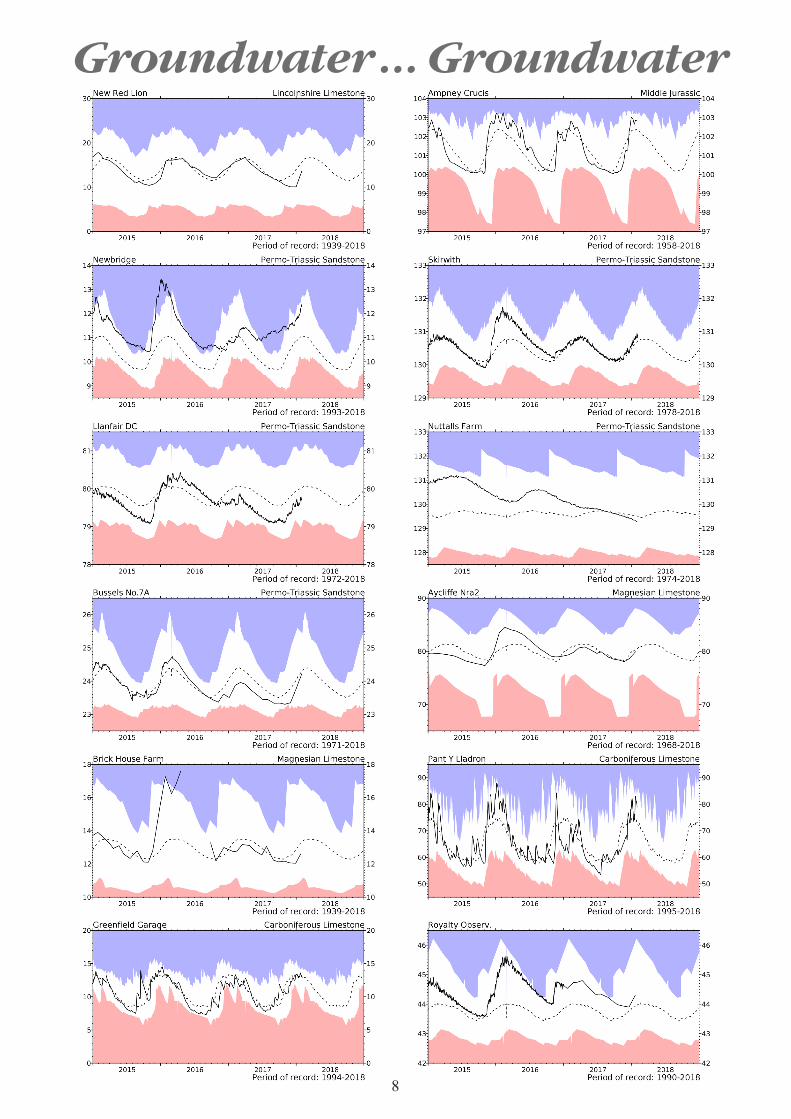
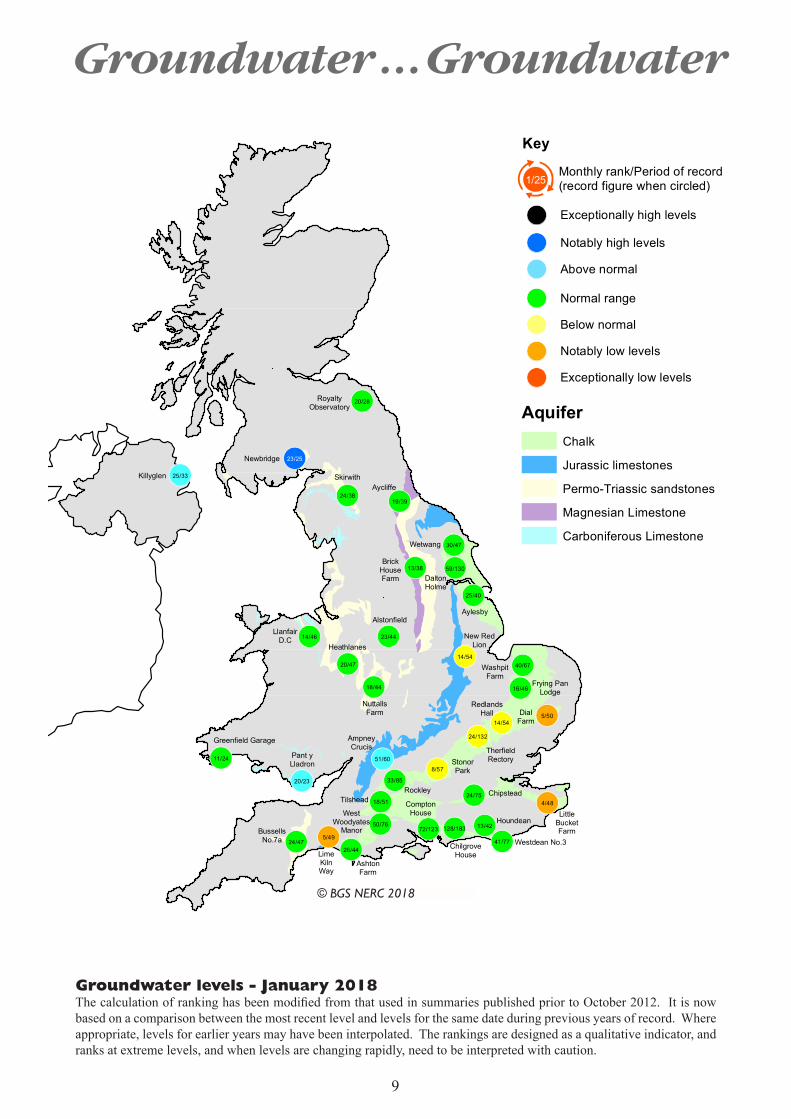
GroundwaterSMDs across the English Lowlands were eliminated in January and soils were wetter than average for the time of year. Groundwater levels accross the Chalk increased with substantial rises recorded at Chilgrove House, Compton House and Houndean Bottom. The majority of levels were within the normal range for the time of year, with the exception of Killyglen where levels are now above average. Levels remained below normal in the Chilterns, and notably low at Dial Farm and Little Bucket Farm (which was no longer dry). In the more rapidly responding Jurassic limestones, levels at Ampney Crucis fell during January but were above normal, whilst at New Red Lion levels rose but remained below average. In the Magnesian limestone levels rose and were in the normal range. Levels in the Upper Greensand at Lime Kiln Way rose, but remained notably low for the fourth consecutive month. In the Permo-Triassic sandstones, levels rose (with the exception of Nuttalls Farm) and were in the normal range, apart from Newbridge where levels are now notably high. In the Carboniferous Limestone, levels fell at Greenfield Garage, but rose at Pant y Lladron and Alstonefield, where they remained in the normal range or above. At Royalty Observatory, levels in the Fell Sandstone rose and remained in the normal range.
2
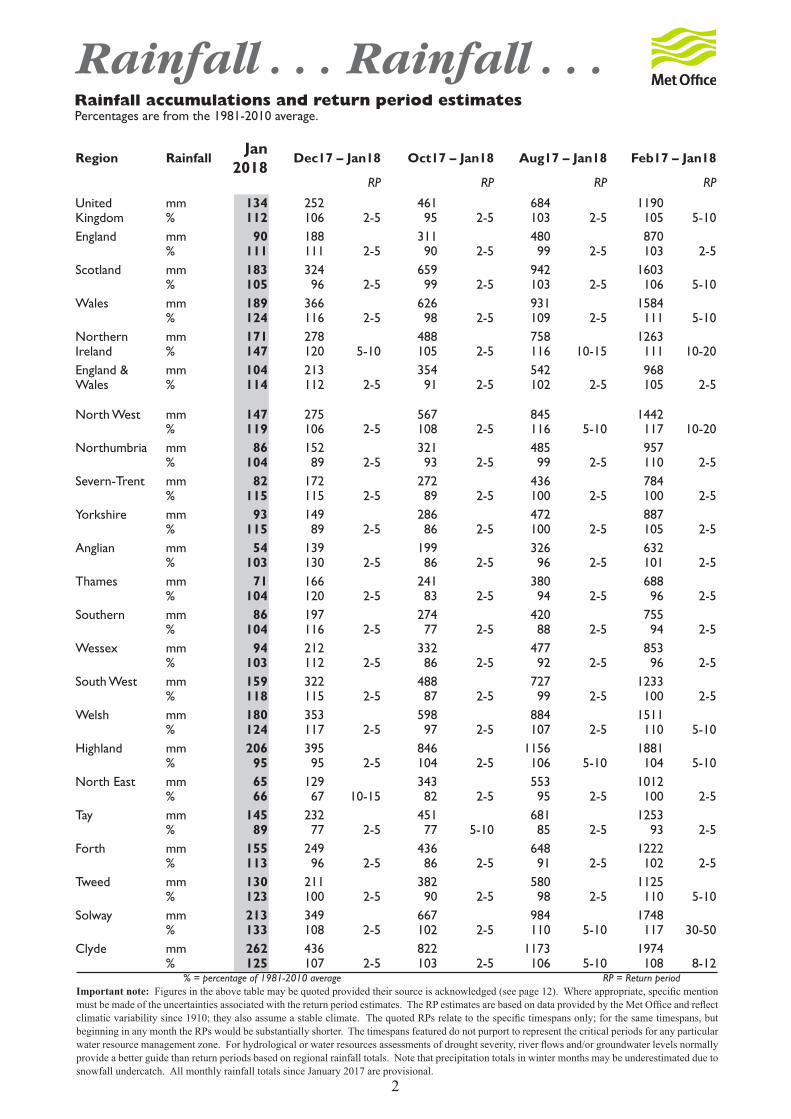
Rainfall . . . Rainfall . . . Rainfall accumulations and return period estimatesPercentages are from the 1981-2010 average.
Region RainfallJan
2018Dec17 – Jan18 Oct17 – Jan18 Aug17 – Jan18 Feb17 – Jan18
RP RP RP RP
United mm 134 252 461 684 1190Kingdom % 112 106 2-5 95 2-5 103 2-5 105 5-10England mm 90 188 311 480 870
% 111 111 2-5 90 2-5 99 2-5 103 2-5Scotland mm 183 324 659 942 1603
% 105 96 2-5 99 2-5 103 2-5 106 5-10Wales mm 189 366 626 931 1584
% 124 116 2-5 98 2-5 109 2-5 111 5-10Northern mm 171 278 488 758 1263Ireland % 147 120 5-10 105 2-5 116 10-15 111 10-20England & mm 104 213 354 542 968Wales % 114 112 2-5 91 2-5 102 2-5 105 2-5
North West mm 147 275 567 845 1442% 119 106 2-5 108 2-5 116 5-10 117 10-20
Northumbria mm 86 152 321 485 957% 104 89 2-5 93 2-5 99 2-5 110 2-5
Severn-Trent mm 82 172 272 436 784% 115 115 2-5 89 2-5 100 2-5 100 2-5
Yorkshire mm 93 149 286 472 887% 115 89 2-5 86 2-5 100 2-5 105 2-5
Anglian mm 54 139 199 326 632% 103 130 2-5 86 2-5 96 2-5 101 2-5
Thames mm 71 166 241 380 688% 104 120 2-5 83 2-5 94 2-5 96 2-5
Southern mm 86 197 274 420 755% 104 116 2-5 77 2-5 88 2-5 94 2-5
Wessex mm 94 212 332 477 853% 103 112 2-5 86 2-5 92 2-5 96 2-5
South West mm 159 322 488 727 1233% 118 115 2-5 87 2-5 99 2-5 100 2-5
Welsh mm 180 353 598 884 1511 % 124 117 2-5 97 2-5 107 2-5 110 5-10Highland mm 206 395 846 1156 1881
% 95 95 2-5 104 2-5 106 5-10 104 5-10North East mm 65 129 343 553 1012
% 66 67 10-15 82 2-5 95 2-5 100 2-5Tay mm 145 232 451 681 1253
% 89 77 2-5 77 5-10 85 2-5 93 2-5Forth mm 155 249 436 648 1222
% 113 96 2-5 86 2-5 91 2-5 102 2-5Tweed mm 130 211 382 580 1125
% 123 100 2-5 90 2-5 98 2-5 110 5-10Solway mm 213 349 667 984 1748
% 133 108 2-5 102 2-5 110 5-10 117 30-50Clyde mm 262 436 822 1173 1974
% 125 107 2-5 103 2-5 106 5-10 108 8-12 % = percentage of 1981-2010 average RP = Return periodImportant note: Figures in the above table may be quoted provided their source is acknowledged (see page 12). Where appropriate, specific mention must be made of the uncertainties associated with the return period estimates. The RP estimates are based on data provided by the Met Office and reflect climatic variability since 1910; they also assume a stable climate. The quoted RPs relate to the specific timespans only; for the same timespans, but beginning in any month the RPs would be substantially shorter. The timespans featured do not purport to represent the critical periods for any particular water resource management zone. For hydrological or water resources assessments of drought severity, river flows and/or groundwater levels normally provide a better guide than return periods based on regional rainfall totals. Note that precipitation totals in winter months may be underestimated due to snowfall undercatch. All monthly rainfall totals since January 2017 are provisional.
3
Rainfall . . . Rainfall . . .
The Hydrological Outlook provides an insight into future hydrological conditions across the UK. Specifically it describes likely trajectories for river flows and groundwater levels on a monthly basis, with particular focus on the next three months.
The complete version of the Hydrological Outlook UK can be found at: www.hydoutuk.net/latest-outlook/
Period: from February 2018Issued: 08.02.2018 using data to the end of January 2018
The outlook for February and February to April indicates that river flows and groundwater levels across the majority of the UK are likely to be within the normal range. Groundwater levels in the south-east of England are likely to be below normal for the next one to three months, and in parts of the south-east river flows are likely to be normal to below normal for this period.
January 2018 rainfallas % of 1981-2010 average
© NERC 2018. © Crown copyright.
SMD (mm)0 - 10
10 - 30
30 - 50
50 - 70
70 - 90
90 - 110
110 - 130
Over 130
December 2017 - January 2018 rainfallas % of 1981-2010 average
MORECS Soil Moisture Deficits*January 2018
* For a grass cover
© NERC (CEH) 2018 © Crown copyright.
17015013011090705030
% o
f ave
rage
% o
f ave
rage
17015013011090705030
!( !(!(!(
!(
!(!(
!(!(
!(
!(
!(
!(!(
!(!(!(
!(
!(
!(
!(!(
!(
!(
!(!(!( !(!(
!(!(
!(
!(!(
!(
!(!(
!(
!(!(
!(
!(
!(
!(
!(!(
!(
!(
!(!(
!(
!(
!(
!(
!(
!(
!(
!(
!( !(
!(!(!(!( !(
!(
65
79
6357
69
52
61
81
98
87
9487
91
74
66
81
85
89
83
67
77 73
69
7290
81
81
94
99
79
9188
108
107
111
114
100
108
113
101
113
106
115
102
106
100
107100101
121
126
126
117
124
113
136
129
122117
130
133
142
134
134 127
137
© NERC 2018. © Crown copyright.
Naver
Ness
SpeyEwe
Dee
Tay
Nevis
Tweed
Luss
Carron
Whiteadder
Clyde
Cree
Tyne
Derwent
WharfeLune
DeeDove
Trent
Lud
Soar
Witham
GreatOuse
Little Ouse
GreatStour
Stour
Itchen
Lambourn
Teifi
Yscir
Cynon
Teme
Severn
Coln
Tone
Taw
Exe
Avon
Ouse
Thames Colne
Warleggan
Kenwyn
Bush
Annacloy
Mourne
Lee
BlackwaterMedway
Wye
Ribble
Avon
Conwy
Stringside
Tyne
Deveron
Brue
Dart
Tywi
Ythan
Tees
Nith
Earn
Mersey
Eden
4
River flow . . . River flow . . .
River flows *Comparisons based on percentage flows alone can be misleading. A given percentage flow can represent extreme drought conditions in permeable catchments where flow patterns are relatively stable but be well within the normal range in impermeable catchments where the natural variation in flows is much greater. Note: the averaging period on which these percentages are based is 1981-2010. Percentages may be omitted where flows are under review.
Key
% of long-term average(record figure when circled)
Exceptionally low flow
Notably low flow
Exceptionally high flow
Below normal
Normal range
Notably high flow
Above normal
25
Based on ranking of the monthly flow*
January 2018
September 2017 -January 2018
!( !(!(!(
!(
!(!(
!(!(
!(
!(
!(
!(!(
!(!(!(
!(
!(
!(
!(!(
!(
!(
!(!(!( !(!(
!(!(
!(
!(!(
!(
!(!(
!(
!(!(
!(
!(
!(
!(
!(!(
!(
!(
!(!(
!(
!(
!(
!(
!(
!(
!(
!(
!(!(
!(!(!(!( !(
!(
J
59
68
63
98
90
90
86
7991
9179
87
9290
93
66
85
9097
82
7879
115
120
118
107110
113
116
132
113
104
100
101
121
103
109114
102
100
105
111
112117
120
111
100
132
129
147
141
123
137
130
147
133
134
129
136
145
156
141
145
138
165
160
© NERC 2018. © Crown copyright.
Naver
Ness
SpeyEwe
Dee
Tay
Nevis
Tweed
Luss
Carron
Whiteadder
Clyde
Cree
Tyne
Derwent
WharfeLune
DeeDove
Trent
Lud
Soar
Witham
GreatOuse
Little Ouse
GreatStour
Stour
Itchen
Lambourn
Teifi
Yscir
Cynon
Teme
Severn
Coln
Tone
Taw
Exe
Avon
Ouse
Thames Colne
Warleggan
Kenwyn
Bush
Annacloy
Mourne
Lee
BlackwaterMedway
Wye
Ribble
Avon
Conwy
Stringside
Tyne
Deveron
Brue
Dart
Tywi
Ythan
Tees
Nith
Earn
Mersey
Eden
© NERC (CEH) 2018 © Crown copyright.
© NERC (CEH) 2018. © Crown copyright.
5
River flow . . . River flow . . .
*The river flow hydrographs show the daily mean flows (measured in m3s-1) together with the maximum and minimum daily flows prior to February 2017 (shown by the shaded areas). Daily flows falling outside the maximum/minimum range are indicated where the bold trace enters the shaded areas. The dashed line represents the period-of-record average daily flow.
River flow hydrographs
River flow . . . River flow . . .
6
7
Groundwater . . . Groundwater
Groundwater levels (measured in metres above ordnance datum) normally rise and fall with the seasons, reaching a peak in the spring following replenishment through the winter (when evaporation losses are low and soil moist). They decline through the summer and early autumn. This seasonal variation is much reduced when the aquifer is confined below overlying impermeable strata. The monthly mean and the highest and lowest levels recorded for each month are displayed in a similar style to the river flow hydrographs. Note that most groundwater levels are not measured continuously and, for some index wells, the greater frequency of contemporary measurements may, in itself, contribute to an increased range of variation.
Groundwater . . . Groundwater
8
9
Groundwater . . . Groundwater
!(
!(!(
!(
!(!(!(
!(!(
!(!( !(!(!(!(
!(
!(
!(
!(
!(
!(!(!(
!(
!(!(
!(
!(!(
!(!(
!(
!(
!(
!(
Killyglen
Chipstead
Frying PanLodge
RoyaltyObservatory
Aylesby
BussellsNo.7a
Rockley
Wetwang
Houndean
Tilshead
Skirwith
LlanfairD.C
Westdean No.3
Newbridge
DialFarm
Heathlanes
Aycliffe
Alstonfield
AshtonFarm
StonorPark
New RedLion
WashpitFarm
DaltonHolme
NuttallsFarm
AmpneyCrucis
LimeKilnWay
ComptonHouse
Pant yLladron
ChilgroveHouse
BrickHouseFarm
Greenfield GarageTherfieldRectory
LittleBucketFarm
WestWoodyates
Manor
RedlandsHall 5/50
5/49
4/48
8/57
14/54
14/54
24/132
20/28
24/75
16/46
19/39
11/24
13/42
18/51
13/38
25/40
18/44
20/47
23/44
24/47
24/38
14/46
50/76
26/4441/77
33/85
40/67
30/47
72/123
59/130
128/183
20/23
51/60
25/33
23/25
Key
Monthly rank/Period of record(record figure when circled)J1/25
!( Exceptionally low levels!( Notably low levels
!( Exceptionally high levels
!( Below normal
!( Normal range
!( Notably high levels
!( Above normal
© NERC 2018.
AquiferChalk
Jurassic limestones
Permo-Triassic sandstones
Magnesian Limestone
Carboniferous Limestone
© BGS NERC 2018
Groundwater levels - January 2018The calculation of ranking has been modified from that used in summaries published prior to October 2012. It is now based on a comparison between the most recent level and levels for the same date during previous years of record. Where appropriate, levels for earlier years may have been interpolated. The rankings are designed as a qualitative indicator, and ranks at extreme levels, and when levels are changing rapidly, need to be interpreted with caution.
10
Reservoirs . . . Reservoirs . . .Guide to the variation in overall reservoir stocks for England andWales
Comparison between overall reservoir stocks for England and Wales in recent years
Area Reservoir
Capacity
(Ml)2017 Nov
2017Dec
2018Jan
Jan Anom.
Min Jan
Year* of min
2017Jan
Diff 18-17
North West N Command Zone • 124929 82 81 87 -5 63 1996 69 19 Vyrnwy 55146 93 99 99 6 45 1996 84 15Northumbrian Teesdale • 87936 98 100 100 7 51 1996 93 7 Kielder (199175) 83 91 95 1 84 2017 84 10Severn-Trent Clywedog 49936 87 86 93 5 62 1996 91 2 Derwent Valley • 46692 85 100 100 5 15 1996 92 8Yorkshire Washburn • 23373 86 86 94 4 34 1996 78 16 Bradford Supply • 40942 91 94 100 6 33 1996 78 22Anglian Grafham (55490) 94 92 92 6 67 1998 87 5 Rutland (116580) 81 84 92 6 68 1997 87 5Thames London • 202828 59 76 94 2 70 1997 92 1 Farmoor • 13822 94 95 95 5 72 2001 93 2Southern Bewl 31000 33 43 64 -17 37 2006 59 5
Ardingly 4685 87 100 100 8 41 2012 60 40Wessex Clatworthy 5364 65 85 100 5 62 1989 71 29 Bristol • (38666) 67 87 99 13 58 1992 73 26South West Colliford 28540 88 94 100 16 52 1997 70 30 Roadford 34500 79 87 95 13 30 1996 65 30 Wimbleball 21320 55 67 86 -4 58 2017 58 29 Stithians 4967 80 89 100 11 38 1992 86 15Welsh Celyn & Brenig • 131155 94 97 98 3 61 1996 94 4 Brianne 62140 100 100 100 2 84 1997 94 6 Big Five • 69762 84 92 93 0 67 1997 86 7 Elan Valley • 99106 100 100 100 3 73 1996 95 5
Scotland(E) Edinburgh/Mid-Lothian • 96518 89 90 97 3 72 1999 85 12 East Lothian • 9374 97 99 100 2 68 1990 100 0Scotland(W) Loch Katrine • 110326 100 99 100 7 85 2000 89 11
Daer 22412 99 100 100 2 90 2013 93 7 Loch Thom 10798 100 100 100 2 90 2004 91 9
Northern Total+ • 56800 98 99 99 7 74 2017 74 25Ireland Silent Valley • 20634 96 99 100 12 46 2002 59 40
( ) figures in parentheses relate to gross storage • denotes reservoir groups *last occurrence
+ excludes Lough Neagh
Details of the individual reservoirs in each of the groupings listed above are available on request. The percentages given in the Average and Minimum storage columns relate to the 1988-2012 period except for West of Scotland and Northern Ireland where data commence in the mid-1990s. In some gravity-fed reservoirs (e.g. Clywedog) stocks are kept below capacity during the winter to provide scope for flood attenuation purposes. Monthly figures may be artificially low due to routine maintenance or turbidity effects in feeder rivers. © NERC (CEH) 2018.
Percentage live capacity of selected reservoirs at end of month
11
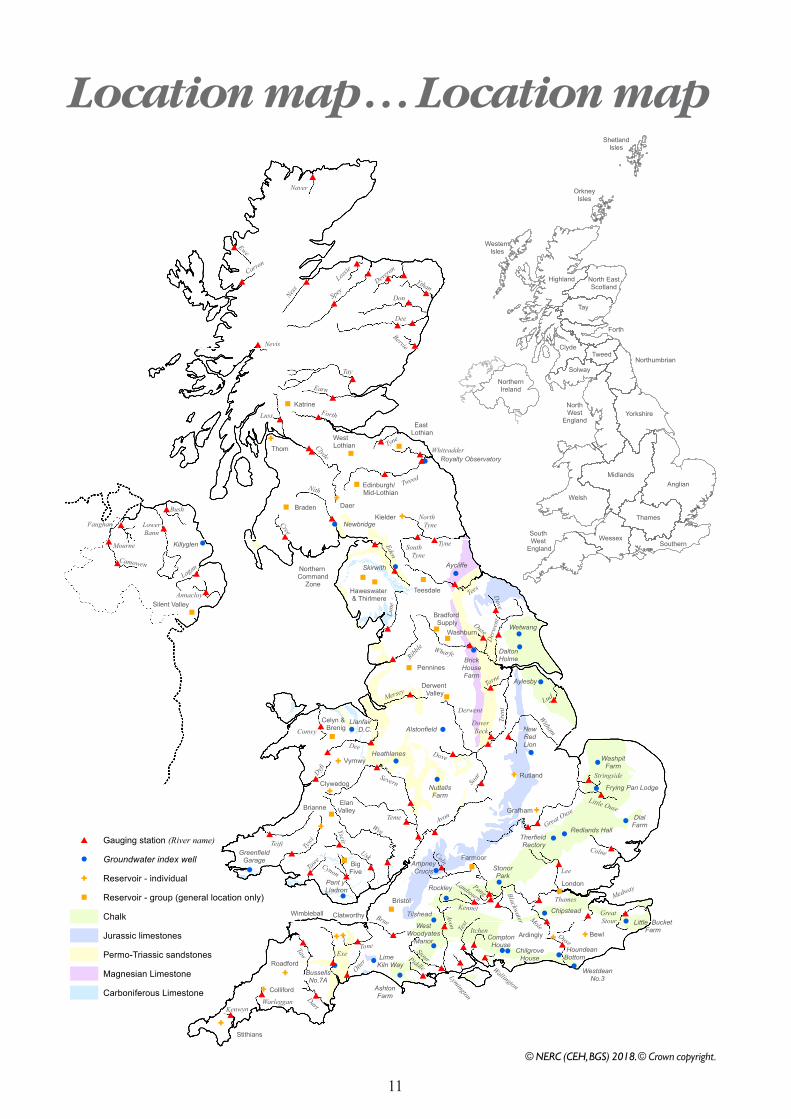
© NERC (CEH, BGS) 2018 © Crown copyright
Minor aquifers have been omitted
G
"
"
"
"
G
G
"
"
"
"
"
G
G
"
"
GG
"
GG
G
G
G
"
G
"
G
G
"
""
"
"
!
!
!
!
!
!!
!
!
!
!
!
!
!
!
!
!
!
!
!
!
!
!
!
!
!
!
!
!
!
!
!
!
!
!
#
#
#
#
#
#
#
#
#
#
#
#
#
#
##
#
##
#
#
#
#
#
#
#
#
#
#
#
#
#
#
#
##
#
#
#
#
#
#
#
#
#
#
#
#
#
#
#
#
##
##
#
# #
##
#
#
#
##
#
#
##
#
#
#
#
#
#
#
##
#
#
#
#
##
#
#
#
#
#
#
#
#
#
#
#
#
#
#
#
Tay
Earn
Ness SpeyDeve
ron
Don
Ewe
Naver
Carron
Nevis
Dee
Ythan
ForthLuss
Tyne
Clyde
Tweed
Whiteadder
Cree
Nith
South Tyne
EdenLu
ne
Ribble
Dove
Der
wentOuse
Wharfe
Conwy
Dee
Dyfi
TemeWyeYscir
UskCynon
Tawe
TywiTeifi
Torne
Tren
t
Soar
Lud
Witham
Stringside
Little Ouse
Great Ouse
Colne
Lee
Thames Medway
Great Stour
Ouse
Mole
Blackwater
Coln
LambournKennet
Wallington
ItchenTest
Avon
StourPiddle
Brue
Tone
Otter
Exe
TawDartWarleggan
Kenwyn
Avon
Severn
Dover Beck
Dove
Bervie
Camowen
LowerBann
Bush
Faughan
Mourne
Lagan
Annacloy
Lossie
Tees
Lymington
Tyne
North Tyne
Pang
Derwent
Mersey
Silent Valley
Katrine
Thom
East Lothian
Edinburgh/ Mid-Lothian
Daer
KielderBraden
Northern Command
Zone
Derwent Valley
Bradford Supply
Washburn
Rutland
Grafham
Farmoor
London
BewlArdingly
Bristol
Stithians
Colliford
Roadford
Wimbleball Clatworthy
BigFive
ElanValley
Clywedog
Vyrnwy
Brianne
Celyn & Brenig
Teesdale
Pennines
West Lothian
Haweswater & Thirlmere
Newbridge
AycliffeSkirwith
Wetwang
DaltonHolmeBrick
HouseFarm
WashpitFarm
DialFarm
Redlands HallTherfield Rectory
NewRedLion
Aylesby
Alstonfield
NuttallsFarm
Heathlanes
Llanfair D.C.
GreenfieldGarage
Pant y Lladron
StonorPark
AmpneyCrucis
Rockley
Little BucketFarm
Tilshead
WestWoodyates
Manor
Lime Kiln Way
AshtonFarm
BussellsNo.7A
HoundeanBottom
WestdeanNo.3
ChilgroveHouse
ComptonHouse
Killyglen
Royalty Observatory
Frying Pan Lodge
Chipstead
# Gauging station
! Groundwater index well
G Reservoir - individual
" Reservoir - group (general location only)
Chalk
Jurassic limestones
Permo-Triassic sandstones
Magnesian Limestone
Carboniferous Limestone
North EastScotland
Highland
Tay
Clyde
Forth
Tweed
SolwayNorthumbrian
NorthWest
EnglandYorkshire
MidlandsAnglian
Thames
SouthernWessex
South West
England
Welsh
NorthernIreland
OrkneyIsles
ShetlandIsles
WesternIsles
(River name)
© NERC (CEH, BGS) 2018. © Crown copyright.
Location map . . . Location map
12
NHMP
The National Hydrological Monitoring Programme (NHMP) was started in 1988 and is undertaken jointly by the Centre for Ecology & Hydrology (CEH) and the British Geological Survey (BGS). The NHMP aims to provide an authoritative voice on hydrological conditions throughout the UK, to place them in a historical context and, over time, identify and interpret any emerging hydrological trends. Hydrological analysis and interpretation within the Programme is based on the data holdings of the National River Flow Archive (NRFA; maintained by CEH) and National Groundwater Level Archive (NGLA; maintained by BGS), including rainfall, river flows, borehole levels, and reservoir stocks.
Data Sources
The NHMP depends on the active cooperation of many data suppliers. This cooperation is gratefully acknowledged.River flow and groundwater level data are provided by the Environment Agency (EA), Natural Resources Wales - Cyfoeth Naturiol Cymru (NRW), the Scottish Environment Protection Agency (SEPA) and, for Northern Ireland, the Rivers Agency and the Northern Ireland Environment Agency. In all cases the data are subject to revision following validation (high flow and low flow data in particular may be subject to significant revision).
Details of reservoir stocks are provided by the Water Service Companies, the EA, Scottish Water and Northern Ireland Water.
The Hydrological Summary and other NHMP outputs may also refer to and/or map soil moisture data for the UK. These data are provided by the Meteorological Office Rainfall and Evaporation Calculation System (MORECS). MORECS provides estimates of monthly soil moisture deficit in the form of averages over 40 x 40 km grid squares over Great Britain and Northern Ireland. The monthly time series of data extends back to 1961.
Rainfall data are provided by the Met Office. To allow better spatial differentiation the rainfall data for Britain are presented for the regional divisions of the precursor organisations of the EA, NRW and SEPA. The areal rainfall figures have been produced by the Met Office National Climate Information Centre (NCIC), and are based on 5km resolution gridded data from rain gauges. The majority of the full rain gauge network across the UK is operated by the EA, NRW, SEPA and Northern Ireland Water; supplementary rain gauges are operated by the Met Office. The Met Office NCIC monthly rainfall series extend back to 1910 and form the official source of UK areal
rainfall statistics which have been adopted by the NHMP. The gridding technique used is described in Perry MC and Hollis DM (2005) available at http://www.metoffice.gov.uk/climate/uk/about/methods
Long-term averages are based on the period 1981-2010 and are derived from the monthly areal series.
The regional figures for the current month in the hydrological summaries are based on a limited rain gauge network so these (and the associated return periods) should be regarded as a guide only.
The monthly rainfall figures are provided by the Met Office NCIC and are Crown Copyright and may not be passed on to, or published by, any unauthorised person or organisation.
For further details on rainfall or MORECS data, please contact the Met Office:
Tel: 0870 900 0100Email: [email protected]
Enquiries
Enquiries should be directed to the NHMP:
Tel: 01491 692599Email: [email protected]
A full catalogue of past Hydrological Summaries can be accessed and downloaded at:
http://nrfa.ceh.ac.uk/monthly-hydrological-summary-uk
Some of the features displayed on the maps contained in this report are based on the following data with permission of the controller of HMSO.
i. Ordnance Survey data. © Crown copyright and/or database right 2005. Licence no. 100017897.
ii. Land and Property Services data. © Crown copyright and database right, S&LA 145.
iii. Met Office rainfall data. © Crown copyright.
All rights reserved. Unauthorised reproduction infringes crown copyright and may lead to prosecution or civil proceedings.
Text and maps in this document are © NERC (CEH) 2018 unless otherwise stated and may not be reproduced without permission.
02/2018