Embed Size (px)
Citation preview
HP Operations Agent
for the Windows®, Linux, HP-UX, Solaris, and AIX operating systems
Software Version: 11.00
User Guide
Document Release Date: October2010Software Release Date: October 2010
Legal Notices
Warranty
The only warranties for HP products and services are set forth in the express warranty statements accompanying such products and services. Nothing herein should be construed as constituting an additional warranty. HP shall not be liable for technical or editorial errors or omissions contained herein.
The information contained herein is subject to change without notice.
Restricted Rights Legend
Confidential computer software. Valid license from HP required for possession, use or copying. Consistent with FAR 12.211 and 12.212, Commercial Computer Software, Computer Software Documentation, and Technical Data for Commercial Items are licensed to the U.S. Government under vendor's standard commercial license.
Copyright Notices
© Copyright 2010 Hewlett-Packard Development Company, L.P.
Trademark Notices
Intel® and Itanium® are trademarks of Intel Corporation in the U.S. and other countries.
Microsoft®, Windows®, Windows® XP and Windows Vista® are U.S. registered trademarks of Microsoft Corporation.
UNIX® is a registered trademark of The Open Group.
Acknowledgements
This product includes cryptographic software written by Eric Young ([email protected]).
This product includes software developed by the OpenSSL Project for use in the OpenSSL Toolkit (http://www.openssl.org/).
This product includes software written by Tim Hudson ([email protected]).
This product includes software developed by the Apache Software Foundation (http://www.apache.org/).
This product includes an interface of the 'zlib' general purpose compression library, which is Copyright © 1995-2002 Jean-loup Gailly and Mark Adler.
2

Documentation Updates
The title page of this document contains the following identifying information:
• Software Version number, which indicates the software version.
• Document Release Date, which changes each time the document is updated.
• Software Release Date, which indicates the release date of this version of the software.
To check for recent updates or to verify that you are using the most recent edition of a document, go to:
http://h20230.www2.hp.com/selfsolve/manuals
This site requires that you register for an HP Passport and sign in. To register for an HP Passport ID, go to:
http://h20229.www2.hp.com/passport-registration.html
Or click the New users - please register link on the HP Passport login page.
You will also receive updated or new editions if you subscribe to the appropriate product support service. Contact your HP sales representative for details.
3
Support
Visit the HP Software Support Online web site at:
www.hp.com/go/hpsoftwaresupport
This web site provides contact information and details about the products, services, and support that HP Software offers.
HP Software online support provides customer self-solve capabilities. It provides a fast and efficient way to access interactive technical support tools needed to manage your business. As a valued support customer, you can benefit by using the support web site to:
• Search for knowledge documents of interest
• Submit and track support cases and enhancement requests
• Download software patches
• Manage support contracts
• Look up HP support contacts
• Review information about available services
• Enter into discussions with other software customers
• Research and register for software training
Most of the support areas require that you register as an HP Passport user and sign in. Many also require a support contract. To register for an HP Passport user ID, go to:
http://h20229.www2.hp.com/passport-registration.html
To find more information about access levels, go to:
http://h20230.www2.hp.com/new_access_levels.jsp
4

Contents
1 Introduction . . . . . . . . . . . . . . . . . . . . . . . . . . . . . . . . . . . . . . . . . . . . . . . . . . . . . . . . . . . . . 15
Documentation Map. . . . . . . . . . . . . . . . . . . . . . . . . . . . . . . . . . . . . . . . . . . . . . . . . . . . . . . 16Related Documentation . . . . . . . . . . . . . . . . . . . . . . . . . . . . . . . . . . . . . . . . . . . . . . . . . . . . 17
2 Managing Data Collection. . . . . . . . . . . . . . . . . . . . . . . . . . . . . . . . . . . . . . . . . . . . . . . . 19logglob . . . . . . . . . . . . . . . . . . . . . . . . . . . . . . . . . . . . . . . . . . . . . . . . . . . . . . . . . . . . . . . 20logappl . . . . . . . . . . . . . . . . . . . . . . . . . . . . . . . . . . . . . . . . . . . . . . . . . . . . . . . . . . . . . . . 20logproc . . . . . . . . . . . . . . . . . . . . . . . . . . . . . . . . . . . . . . . . . . . . . . . . . . . . . . . . . . . . . . . 20logpcmd . . . . . . . . . . . . . . . . . . . . . . . . . . . . . . . . . . . . . . . . . . . . . . . . . . . . . . . . . . . . . . 20logdev. . . . . . . . . . . . . . . . . . . . . . . . . . . . . . . . . . . . . . . . . . . . . . . . . . . . . . . . . . . . . . . . 21logtran . . . . . . . . . . . . . . . . . . . . . . . . . . . . . . . . . . . . . . . . . . . . . . . . . . . . . . . . . . . . . . . 21logls . . . . . . . . . . . . . . . . . . . . . . . . . . . . . . . . . . . . . . . . . . . . . . . . . . . . . . . . . . . . . . . . . 21logindx . . . . . . . . . . . . . . . . . . . . . . . . . . . . . . . . . . . . . . . . . . . . . . . . . . . . . . . . . . . . . . . 21Modify the parm File . . . . . . . . . . . . . . . . . . . . . . . . . . . . . . . . . . . . . . . . . . . . . . . . . . . 22Logging Metrics Calculated with the Core-Based Normalization . . . . . . . . . . . . . . . . 41Stopping Data Collection . . . . . . . . . . . . . . . . . . . . . . . . . . . . . . . . . . . . . . . . . . . . . . . . 42Restarting Data Collection. . . . . . . . . . . . . . . . . . . . . . . . . . . . . . . . . . . . . . . . . . . . . . . 42Daylight Savings. . . . . . . . . . . . . . . . . . . . . . . . . . . . . . . . . . . . . . . . . . . . . . . . . . . . . . . 43Changing System Time Manually . . . . . . . . . . . . . . . . . . . . . . . . . . . . . . . . . . . . . . . . . 43Controlling Disk Space Used by Log Files . . . . . . . . . . . . . . . . . . . . . . . . . . . . . . . . . . 43Data Archiving . . . . . . . . . . . . . . . . . . . . . . . . . . . . . . . . . . . . . . . . . . . . . . . . . . . . . . . . 45
3 Working with the HP Operations Agent . . . . . . . . . . . . . . . . . . . . . . . . . . . . . . . . . . . . 47Persistence of Monitored Object. . . . . . . . . . . . . . . . . . . . . . . . . . . . . . . . . . . . . . . . . . . 50Change the Default User on Windows. . . . . . . . . . . . . . . . . . . . . . . . . . . . . . . . . . . . . . 55Change the Default User on UNIX/Linux . . . . . . . . . . . . . . . . . . . . . . . . . . . . . . . . . . . 58Change the Default User for Commands . . . . . . . . . . . . . . . . . . . . . . . . . . . . . . . . . . . 60
4 Using the Utility Program . . . . . . . . . . . . . . . . . . . . . . . . . . . . . . . . . . . . . . . . . . . . . . . . . 63
5
Example of Using Interactive and Batch Mode . . . . . . . . . . . . . . . . . . . . . . . . . . . . . . 64Example of Using the Command Line Interface. . . . . . . . . . . . . . . . . . . . . . . . . . . . . . 67Initial Values. . . . . . . . . . . . . . . . . . . . . . . . . . . . . . . . . . . . . . . . . . . . . . . . . . . . . . . . . . 68Initial Parm File Application Definitions . . . . . . . . . . . . . . . . . . . . . . . . . . . . . . . . . . . 69Chronological Detail . . . . . . . . . . . . . . . . . . . . . . . . . . . . . . . . . . . . . . . . . . . . . . . . . . . . 69Summaries . . . . . . . . . . . . . . . . . . . . . . . . . . . . . . . . . . . . . . . . . . . . . . . . . . . . . . . . . . . 71
5 Utility Commands. . . . . . . . . . . . . . . . . . . . . . . . . . . . . . . . . . . . . . . . . . . . . . . . . . . . . . . . 75
6 Using the Extract Program . . . . . . . . . . . . . . . . . . . . . . . . . . . . . . . . . . . . . . . . . . . . . . . . 95Syntax . . . . . . . . . . . . . . . . . . . . . . . . . . . . . . . . . . . . . . . . . . . . . . . . . . . . . . . . . . . . . . . 96How to Export Data . . . . . . . . . . . . . . . . . . . . . . . . . . . . . . . . . . . . . . . . . . . . . . . . . . . 101Sample Export Tasks . . . . . . . . . . . . . . . . . . . . . . . . . . . . . . . . . . . . . . . . . . . . . . . . . . 102Export Data Files . . . . . . . . . . . . . . . . . . . . . . . . . . . . . . . . . . . . . . . . . . . . . . . . . . . . . 103Export Template File Syntax . . . . . . . . . . . . . . . . . . . . . . . . . . . . . . . . . . . . . . . . . . . . 104Creating a Custom Graph or Report . . . . . . . . . . . . . . . . . . . . . . . . . . . . . . . . . . . . . . 106Output of Exported Files . . . . . . . . . . . . . . . . . . . . . . . . . . . . . . . . . . . . . . . . . . . . . . . 107Notes on ASCII and Datafile Formats. . . . . . . . . . . . . . . . . . . . . . . . . . . . . . . . . . . . . 108Notes on Binary Format . . . . . . . . . . . . . . . . . . . . . . . . . . . . . . . . . . . . . . . . . . . . . . . . 108
7 Extract Commands. . . . . . . . . . . . . . . . . . . . . . . . . . . . . . . . . . . . . . . . . . . . . . . . . . . . . . 115
weekdays . . . . . . . . . . . . . . . . . . . . . . . . . . . . . . . . . . . . . . . . . . . . . . . . . . . . . . . . . . . . . . 146weekly . . . . . . . . . . . . . . . . . . . . . . . . . . . . . . . . . . . . . . . . . . . . . . . . . . . . . . . . . . . . . . . . . 147yearly . . . . . . . . . . . . . . . . . . . . . . . . . . . . . . . . . . . . . . . . . . . . . . . . . . . . . . . . . . . . . . . . . 149
8 Using the cpsh Program . . . . . . . . . . . . . . . . . . . . . . . . . . . . . . . . . . . . . . . . . . . . . . . . . 151View Real-Time Metrics . . . . . . . . . . . . . . . . . . . . . . . . . . . . . . . . . . . . . . . . . . . . . . . . 152Modify a Metric Class . . . . . . . . . . . . . . . . . . . . . . . . . . . . . . . . . . . . . . . . . . . . . . . . . . 152View Metric Help . . . . . . . . . . . . . . . . . . . . . . . . . . . . . . . . . . . . . . . . . . . . . . . . . . . . . 153View Summarized Metric Data . . . . . . . . . . . . . . . . . . . . . . . . . . . . . . . . . . . . . . . . . . 153
9 Performance Alarms . . . . . . . . . . . . . . . . . . . . . . . . . . . . . . . . . . . . . . . . . . . . . . . . . . . . 155Alarm Generator. . . . . . . . . . . . . . . . . . . . . . . . . . . . . . . . . . . . . . . . . . . . . . . . . . . . . . 155Sending SNMP Traps to Network Node Manager . . . . . . . . . . . . . . . . . . . . . . . . . . . 156Sending Messages to Operations Manager . . . . . . . . . . . . . . . . . . . . . . . . . . . . . . . . . 156Executing Local Actions . . . . . . . . . . . . . . . . . . . . . . . . . . . . . . . . . . . . . . . . . . . . . . . . 157Errors in Processing Alarms . . . . . . . . . . . . . . . . . . . . . . . . . . . . . . . . . . . . . . . . . . . . 157
6
Analyzing Historical Data for Alarms . . . . . . . . . . . . . . . . . . . . . . . . . . . . . . . . . . . . . 158Alarm Definition Components. . . . . . . . . . . . . . . . . . . . . . . . . . . . . . . . . . . . . . . . . . . . . . 159Alarm Syntax Reference . . . . . . . . . . . . . . . . . . . . . . . . . . . . . . . . . . . . . . . . . . . . . . . . . . 160
Conventions. . . . . . . . . . . . . . . . . . . . . . . . . . . . . . . . . . . . . . . . . . . . . . . . . . . . . . . . . . 160Common Elements . . . . . . . . . . . . . . . . . . . . . . . . . . . . . . . . . . . . . . . . . . . . . . . . . . . . 160ALARM Statement . . . . . . . . . . . . . . . . . . . . . . . . . . . . . . . . . . . . . . . . . . . . . . . . . . . . 163ALERT Statement . . . . . . . . . . . . . . . . . . . . . . . . . . . . . . . . . . . . . . . . . . . . . . . . . . . . 167EXEC Statement. . . . . . . . . . . . . . . . . . . . . . . . . . . . . . . . . . . . . . . . . . . . . . . . . . . . . . 168PRINT Statement . . . . . . . . . . . . . . . . . . . . . . . . . . . . . . . . . . . . . . . . . . . . . . . . . . . . . 169IF Statement . . . . . . . . . . . . . . . . . . . . . . . . . . . . . . . . . . . . . . . . . . . . . . . . . . . . . . . . . 170LOOP Statement. . . . . . . . . . . . . . . . . . . . . . . . . . . . . . . . . . . . . . . . . . . . . . . . . . . . . . 171INCLUDE Statement . . . . . . . . . . . . . . . . . . . . . . . . . . . . . . . . . . . . . . . . . . . . . . . . . . 172USE Statement . . . . . . . . . . . . . . . . . . . . . . . . . . . . . . . . . . . . . . . . . . . . . . . . . . . . . . . 173VAR Statement . . . . . . . . . . . . . . . . . . . . . . . . . . . . . . . . . . . . . . . . . . . . . . . . . . . . . . . 174ALIAS Statement . . . . . . . . . . . . . . . . . . . . . . . . . . . . . . . . . . . . . . . . . . . . . . . . . . . . . 175SYMPTOM Statement . . . . . . . . . . . . . . . . . . . . . . . . . . . . . . . . . . . . . . . . . . . . . . . . . 176
Alarm Definition Examples. . . . . . . . . . . . . . . . . . . . . . . . . . . . . . . . . . . . . . . . . . . . . . . . 178Customizing Alarm Definitions. . . . . . . . . . . . . . . . . . . . . . . . . . . . . . . . . . . . . . . . . . . . . 180
10 Adviser for the RTMA Component . . . . . . . . . . . . . . . . . . . . . . . . . . . . . . . . . . . . . . . . 181Run the Adviser Script on Multiple Systems . . . . . . . . . . . . . . . . . . . . . . . . . . . . . . . 182Syntax Conventions . . . . . . . . . . . . . . . . . . . . . . . . . . . . . . . . . . . . . . . . . . . . . . . . . . . 183Comments . . . . . . . . . . . . . . . . . . . . . . . . . . . . . . . . . . . . . . . . . . . . . . . . . . . . . . . . . . . 183Conditions . . . . . . . . . . . . . . . . . . . . . . . . . . . . . . . . . . . . . . . . . . . . . . . . . . . . . . . . . . . 183Constants . . . . . . . . . . . . . . . . . . . . . . . . . . . . . . . . . . . . . . . . . . . . . . . . . . . . . . . . . . . 184Expressions . . . . . . . . . . . . . . . . . . . . . . . . . . . . . . . . . . . . . . . . . . . . . . . . . . . . . . . . . . 184Metric Names in Adviser Syntax . . . . . . . . . . . . . . . . . . . . . . . . . . . . . . . . . . . . . . . . . 184Printlist . . . . . . . . . . . . . . . . . . . . . . . . . . . . . . . . . . . . . . . . . . . . . . . . . . . . . . . . . . . . . 185Variables . . . . . . . . . . . . . . . . . . . . . . . . . . . . . . . . . . . . . . . . . . . . . . . . . . . . . . . . . . . . 186Adviser Syntax Statements . . . . . . . . . . . . . . . . . . . . . . . . . . . . . . . . . . . . . . . . . . . . . 186
11 Using the Performance Collection Component on Windows . . . . . . . . . . . . . . . . . 213Data Types and Classes . . . . . . . . . . . . . . . . . . . . . . . . . . . . . . . . . . . . . . . . . . . . . . . . 214
Extracting Log File Data . . . . . . . . . . . . . . . . . . . . . . . . . . . . . . . . . . . . . . . . . . . . . . . . . . 216File Attributes. . . . . . . . . . . . . . . . . . . . . . . . . . . . . . . . . . . . . . . . . . . . . . . . . . . . . . . . 218Export File Templates . . . . . . . . . . . . . . . . . . . . . . . . . . . . . . . . . . . . . . . . . . . . . . . . . 221
7

Default Export Files . . . . . . . . . . . . . . . . . . . . . . . . . . . . . . . . . . . . . . . . . . . . . . . . . . . 221Archiving Log File Data . . . . . . . . . . . . . . . . . . . . . . . . . . . . . . . . . . . . . . . . . . . . . . . . . . 229
Archival Periods . . . . . . . . . . . . . . . . . . . . . . . . . . . . . . . . . . . . . . . . . . . . . . . . . . . . . . 229Appending Archived Data . . . . . . . . . . . . . . . . . . . . . . . . . . . . . . . . . . . . . . . . . . . . . . 230Archiving Tips. . . . . . . . . . . . . . . . . . . . . . . . . . . . . . . . . . . . . . . . . . . . . . . . . . . . . . . . 230Range of Data to be Analyzed . . . . . . . . . . . . . . . . . . . . . . . . . . . . . . . . . . . . . . . . . . . 232Analysis Report. . . . . . . . . . . . . . . . . . . . . . . . . . . . . . . . . . . . . . . . . . . . . . . . . . . . . . . 232Data Sources File Format. . . . . . . . . . . . . . . . . . . . . . . . . . . . . . . . . . . . . . . . . . . . . . . 245Building a Performance Counter Collection . . . . . . . . . . . . . . . . . . . . . . . . . . . . . . . . 255Managing a Performance Counter Collection . . . . . . . . . . . . . . . . . . . . . . . . . . . . . . . 255Administering ECBM from the Command line. . . . . . . . . . . . . . . . . . . . . . . . . . . . . . 256
12 Overview of Data Source Integration . . . . . . . . . . . . . . . . . . . . . . . . . . . . . . . . . . . . . 259Creating the Class Specification . . . . . . . . . . . . . . . . . . . . . . . . . . . . . . . . . . . . . . . . . 260Collecting and Logging the Data . . . . . . . . . . . . . . . . . . . . . . . . . . . . . . . . . . . . . . . . . 260Using the Data . . . . . . . . . . . . . . . . . . . . . . . . . . . . . . . . . . . . . . . . . . . . . . . . . . . . . . . 261
13 Using Data Source Integration . . . . . . . . . . . . . . . . . . . . . . . . . . . . . . . . . . . . . . . . . . . 263
Defining the Log File Format . . . . . . . . . . . . . . . . . . . . . . . . . . . . . . . . . . . . . . . . . . . . . . 264How Log Files Are Organized . . . . . . . . . . . . . . . . . . . . . . . . . . . . . . . . . . . . . . . . . . . 264
Creating the Log File Set. . . . . . . . . . . . . . . . . . . . . . . . . . . . . . . . . . . . . . . . . . . . . . . . . . 266Testing the Class Specification File and the Logging Process (Optional) . . . . . . . . . 266
Logging Data to the Log File Set . . . . . . . . . . . . . . . . . . . . . . . . . . . . . . . . . . . . . . . . . . . 267Using the Logged Data . . . . . . . . . . . . . . . . . . . . . . . . . . . . . . . . . . . . . . . . . . . . . . . . . . . 268
14 DSI Class Specification Reference . . . . . . . . . . . . . . . . . . . . . . . . . . . . . . . . . . . . . . . . 269
Class Specification Syntax . . . . . . . . . . . . . . . . . . . . . . . . . . . . . . . . . . . . . . . . . . . . . . . . 270CLASS Description . . . . . . . . . . . . . . . . . . . . . . . . . . . . . . . . . . . . . . . . . . . . . . . . . . . . . . 271
CLASS . . . . . . . . . . . . . . . . . . . . . . . . . . . . . . . . . . . . . . . . . . . . . . . . . . . . . . . . . . . . . . 271LABEL. . . . . . . . . . . . . . . . . . . . . . . . . . . . . . . . . . . . . . . . . . . . . . . . . . . . . . . . . . . . . . 272INDEX BY, MAX INDEXES, AND ROLL BY . . . . . . . . . . . . . . . . . . . . . . . . . . . . . . . 272
Controlling Log File Size . . . . . . . . . . . . . . . . . . . . . . . . . . . . . . . . . . . . . . . . . . . . . . . . . . 277RECORDS PER HOUR . . . . . . . . . . . . . . . . . . . . . . . . . . . . . . . . . . . . . . . . . . . . . . . . . . . 279CAPACITY . . . . . . . . . . . . . . . . . . . . . . . . . . . . . . . . . . . . . . . . . . . . . . . . . . . . . . . . . . . . . 280Metrics Descriptions . . . . . . . . . . . . . . . . . . . . . . . . . . . . . . . . . . . . . . . . . . . . . . . . . . . . . 281
METRICS . . . . . . . . . . . . . . . . . . . . . . . . . . . . . . . . . . . . . . . . . . . . . . . . . . . . . . . . . . . 281
8

LABEL. . . . . . . . . . . . . . . . . . . . . . . . . . . . . . . . . . . . . . . . . . . . . . . . . . . . . . . . . . . . . . 282Summarization Method . . . . . . . . . . . . . . . . . . . . . . . . . . . . . . . . . . . . . . . . . . . . . . . . 283PRECISION . . . . . . . . . . . . . . . . . . . . . . . . . . . . . . . . . . . . . . . . . . . . . . . . . . . . . . . . . 283TYPE TEXT LENGTH . . . . . . . . . . . . . . . . . . . . . . . . . . . . . . . . . . . . . . . . . . . . . . . . . 284
Sample Class Specification . . . . . . . . . . . . . . . . . . . . . . . . . . . . . . . . . . . . . . . . . . . . . . . . 285
15 DSI Program Reference. . . . . . . . . . . . . . . . . . . . . . . . . . . . . . . . . . . . . . . . . . . . . . . . . . 287
sdlcomp Compiler. . . . . . . . . . . . . . . . . . . . . . . . . . . . . . . . . . . . . . . . . . . . . . . . . . . . . . . . 288Compiler Syntax . . . . . . . . . . . . . . . . . . . . . . . . . . . . . . . . . . . . . . . . . . . . . . . . . . . . . . 288Sample Compiler Output . . . . . . . . . . . . . . . . . . . . . . . . . . . . . . . . . . . . . . . . . . . . . . . 289
Configuration Files . . . . . . . . . . . . . . . . . . . . . . . . . . . . . . . . . . . . . . . . . . . . . . . . . . . . . . 291Defining Alarms for DSI Metrics . . . . . . . . . . . . . . . . . . . . . . . . . . . . . . . . . . . . . . . . . 291Alarm Processing . . . . . . . . . . . . . . . . . . . . . . . . . . . . . . . . . . . . . . . . . . . . . . . . . . . . . 291How dsilog Processes Data. . . . . . . . . . . . . . . . . . . . . . . . . . . . . . . . . . . . . . . . . . . . . . 295Testing the Logging Process with Sdlgendata . . . . . . . . . . . . . . . . . . . . . . . . . . . . . . 295
Creating a Format File . . . . . . . . . . . . . . . . . . . . . . . . . . . . . . . . . . . . . . . . . . . . . . . . . . . 298Changing a Class Specification . . . . . . . . . . . . . . . . . . . . . . . . . . . . . . . . . . . . . . . . . . . . . 300Exporting DSI Data . . . . . . . . . . . . . . . . . . . . . . . . . . . . . . . . . . . . . . . . . . . . . . . . . . . . . . 301
Example of Using Extract to Export DSI Log File Data . . . . . . . . . . . . . . . . . . . . . . 301Viewing Data in Performance Manager . . . . . . . . . . . . . . . . . . . . . . . . . . . . . . . . . . . 301
Managing Data With sdlutil . . . . . . . . . . . . . . . . . . . . . . . . . . . . . . . . . . . . . . . . . . . . . . . 302Syntax . . . . . . . . . . . . . . . . . . . . . . . . . . . . . . . . . . . . . . . . . . . . . . . . . . . . . . . . . . . . . . 302
16 Examples of Data Source Integration . . . . . . . . . . . . . . . . . . . . . . . . . . . . . . . . . . . . . 305
Writing a dsilog Script . . . . . . . . . . . . . . . . . . . . . . . . . . . . . . . . . . . . . . . . . . . . . . . . . . . . 306Logging vmstat Data . . . . . . . . . . . . . . . . . . . . . . . . . . . . . . . . . . . . . . . . . . . . . . . . . . . . . 307
Creating a Class Specification File . . . . . . . . . . . . . . . . . . . . . . . . . . . . . . . . . . . . . . . 307Compiling the Class Specification File . . . . . . . . . . . . . . . . . . . . . . . . . . . . . . . . . . . . 307Starting the dsilog Logging Process. . . . . . . . . . . . . . . . . . . . . . . . . . . . . . . . . . . . . . . 308Accessing the Data . . . . . . . . . . . . . . . . . . . . . . . . . . . . . . . . . . . . . . . . . . . . . . . . . . . . 308Creating a Class Specification File . . . . . . . . . . . . . . . . . . . . . . . . . . . . . . . . . . . . . . . 309Compiling the Class Specification File . . . . . . . . . . . . . . . . . . . . . . . . . . . . . . . . . . . . 311Starting the DSI Logging Process . . . . . . . . . . . . . . . . . . . . . . . . . . . . . . . . . . . . . . . . 312
Logging sar Data from Several Files . . . . . . . . . . . . . . . . . . . . . . . . . . . . . . . . . . . . . . . . 313Creating Class Specification Files . . . . . . . . . . . . . . . . . . . . . . . . . . . . . . . . . . . . . . . . 313Compiling the Class Specification Files . . . . . . . . . . . . . . . . . . . . . . . . . . . . . . . . . . . 317
9

Starting the DSI Logging Process . . . . . . . . . . . . . . . . . . . . . . . . . . . . . . . . . . . . . . . . 318Logging sar Data for Several Options. . . . . . . . . . . . . . . . . . . . . . . . . . . . . . . . . . . . . . . . 319Logging the Number of System Users . . . . . . . . . . . . . . . . . . . . . . . . . . . . . . . . . . . . . . . 325
17 Error Message . . . . . . . . . . . . . . . . . . . . . . . . . . . . . . . . . . . . . . . . . . . . . . . . . . . . . . . . . 327
General Error Messages . . . . . . . . . . . . . . . . . . . . . . . . . . . . . . . . . . . . . . . . . . . . . . . . . . 341
18 What is Transaction Tracking? . . . . . . . . . . . . . . . . . . . . . . . . . . . . . . . . . . . . . . . . . . . 343
Benefits of Transaction Tracking . . . . . . . . . . . . . . . . . . . . . . . . . . . . . . . . . . . . . . . . . . . 344Client View of Transaction Times . . . . . . . . . . . . . . . . . . . . . . . . . . . . . . . . . . . . . . . . 344Transaction Data . . . . . . . . . . . . . . . . . . . . . . . . . . . . . . . . . . . . . . . . . . . . . . . . . . . . . 344Service Level Objectives . . . . . . . . . . . . . . . . . . . . . . . . . . . . . . . . . . . . . . . . . . . . . . . . 345Requirements for Real Time Order Processing. . . . . . . . . . . . . . . . . . . . . . . . . . . . . . 345Preparing the Order Processing Application. . . . . . . . . . . . . . . . . . . . . . . . . . . . . . . . 346
Guidelines for Using ARM. . . . . . . . . . . . . . . . . . . . . . . . . . . . . . . . . . . . . . . . . . . . . . . . . 347
19 How Transaction Tracking Works . . . . . . . . . . . . . . . . . . . . . . . . . . . . . . . . . . . . . . . . 349
Support of ARM 2.0 . . . . . . . . . . . . . . . . . . . . . . . . . . . . . . . . . . . . . . . . . . . . . . . . . . . . . . 350arm_complete_transaction Call . . . . . . . . . . . . . . . . . . . . . . . . . . . . . . . . . . . . . . . . . . 351Sample ARM-Instrumented Applications . . . . . . . . . . . . . . . . . . . . . . . . . . . . . . . . . . 351Specifying Application and Transaction Names . . . . . . . . . . . . . . . . . . . . . . . . . . . . . 351
Transaction Tracking Daemon (ttd) . . . . . . . . . . . . . . . . . . . . . . . . . . . . . . . . . . . . . . . . . 353ARM API Call Status Returns . . . . . . . . . . . . . . . . . . . . . . . . . . . . . . . . . . . . . . . . . . . 353
Transaction Configuration File (ttd.conf) . . . . . . . . . . . . . . . . . . . . . . . . . . . . . . . . . . . . . 355Adding New Applications . . . . . . . . . . . . . . . . . . . . . . . . . . . . . . . . . . . . . . . . . . . . . . . 355Adding New Transactions . . . . . . . . . . . . . . . . . . . . . . . . . . . . . . . . . . . . . . . . . . . . . . 355Changing the Range or SLO Values . . . . . . . . . . . . . . . . . . . . . . . . . . . . . . . . . . . . . . 355Configuration File Keywords . . . . . . . . . . . . . . . . . . . . . . . . . . . . . . . . . . . . . . . . . . . . 356Configuration File Format . . . . . . . . . . . . . . . . . . . . . . . . . . . . . . . . . . . . . . . . . . . . . . 357Configuration File Examples . . . . . . . . . . . . . . . . . . . . . . . . . . . . . . . . . . . . . . . . . . . . 358Guidelines . . . . . . . . . . . . . . . . . . . . . . . . . . . . . . . . . . . . . . . . . . . . . . . . . . . . . . . . . . . 359Disk I/O Overhead . . . . . . . . . . . . . . . . . . . . . . . . . . . . . . . . . . . . . . . . . . . . . . . . . . . . 360CPU Overhead . . . . . . . . . . . . . . . . . . . . . . . . . . . . . . . . . . . . . . . . . . . . . . . . . . . . . . . 360Memory Overhead . . . . . . . . . . . . . . . . . . . . . . . . . . . . . . . . . . . . . . . . . . . . . . . . . . . . 360
20 Getting Started with Transactions. . . . . . . . . . . . . . . . . . . . . . . . . . . . . . . . . . . . . . . . . 363Before you start. . . . . . . . . . . . . . . . . . . . . . . . . . . . . . . . . . . . . . . . . . . . . . . . . . . . . . . 363
10

Defining Service Level Objectives . . . . . . . . . . . . . . . . . . . . . . . . . . . . . . . . . . . . . . . . 364Modifying the Parm File. . . . . . . . . . . . . . . . . . . . . . . . . . . . . . . . . . . . . . . . . . . . . . . . 364Collecting Transaction Data. . . . . . . . . . . . . . . . . . . . . . . . . . . . . . . . . . . . . . . . . . . . . 365Customizing the Configuration File (optional) . . . . . . . . . . . . . . . . . . . . . . . . . . . . . . 366
Alarms . . . . . . . . . . . . . . . . . . . . . . . . . . . . . . . . . . . . . . . . . . . . . . . . . . . . . . . . . . . . . . . . 368
21 Transaction Tracking Messages . . . . . . . . . . . . . . . . . . . . . . . . . . . . . . . . . . . . . . . . . . 369
22 Transaction Metrics . . . . . . . . . . . . . . . . . . . . . . . . . . . . . . . . . . . . . . . . . . . . . . . . . . . . . 371
23 Transaction Tracking Examples. . . . . . . . . . . . . . . . . . . . . . . . . . . . . . . . . . . . . . . . . . . 373Example 1 (for Order Processing Pseudocode Example) . . . . . . . . . . . . . . . . . . . . . . 375Example 2 . . . . . . . . . . . . . . . . . . . . . . . . . . . . . . . . . . . . . . . . . . . . . . . . . . . . . . . . . . . 375Example 3 . . . . . . . . . . . . . . . . . . . . . . . . . . . . . . . . . . . . . . . . . . . . . . . . . . . . . . . . . . . 375Example 4 . . . . . . . . . . . . . . . . . . . . . . . . . . . . . . . . . . . . . . . . . . . . . . . . . . . . . . . . . . . 376
24 Advanced Features. . . . . . . . . . . . . . . . . . . . . . . . . . . . . . . . . . . . . . . . . . . . . . . . . . . . . 377
25 Transaction Libraries . . . . . . . . . . . . . . . . . . . . . . . . . . . . . . . . . . . . . . . . . . . . . . . . . . . . 381
C Compiler Option Examples by Platform . . . . . . . . . . . . . . . . . . . . . . . . . . . . . . . . . . . . 386ARM NOP Library . . . . . . . . . . . . . . . . . . . . . . . . . . . . . . . . . . . . . . . . . . . . . . . . . . . . . . . 388
Examples . . . . . . . . . . . . . . . . . . . . . . . . . . . . . . . . . . . . . . . . . . . . . . . . . . . . . . . . . . . . 388Setting Up an Application (arm_init) . . . . . . . . . . . . . . . . . . . . . . . . . . . . . . . . . . . . . 388Setting Up a Transaction With UDMs . . . . . . . . . . . . . . . . . . . . . . . . . . . . . . . . . . . . 389Adding the Metrics . . . . . . . . . . . . . . . . . . . . . . . . . . . . . . . . . . . . . . . . . . . . . . . . . . . . 389Starting the Transaction Instance Using Correlators . . . . . . . . . . . . . . . . . . . . . . . . 390Starting the Transaction Instance Without Using Correlators . . . . . . . . . . . . . . . . . 391Updating Transaction Instance Data With UDMs . . . . . . . . . . . . . . . . . . . . . . . . . . . 392Updating Transaction Instance Data Without UDMs . . . . . . . . . . . . . . . . . . . . . . . . 392Stopping the Transaction Instance With a Metric Update . . . . . . . . . . . . . . . . . . . . 392Stopping the Transaction Instance Without a Metric Update . . . . . . . . . . . . . . . . . . 393Using Complete Transaction With UDMs: . . . . . . . . . . . . . . . . . . . . . . . . . . . . . . . . . 393Using Complete Transaction Without UDMs: . . . . . . . . . . . . . . . . . . . . . . . . . . . . . . 394
26 Logging and Tracing . . . . . . . . . . . . . . . . . . . . . . . . . . . . . . . . . . . . . . . . . . . . . . . . . . . . 395Configure the Logging Policy . . . . . . . . . . . . . . . . . . . . . . . . . . . . . . . . . . . . . . . . . . . . 396Identify the Application . . . . . . . . . . . . . . . . . . . . . . . . . . . . . . . . . . . . . . . . . . . . . . . . 396Set the Tracing Type . . . . . . . . . . . . . . . . . . . . . . . . . . . . . . . . . . . . . . . . . . . . . . . . . . 398
11
Introduction to the Trace Configuration File . . . . . . . . . . . . . . . . . . . . . . . . . . . . . . . 399Create the Configuration File . . . . . . . . . . . . . . . . . . . . . . . . . . . . . . . . . . . . . . . . . . . 401Enable the Tracing Mechanism . . . . . . . . . . . . . . . . . . . . . . . . . . . . . . . . . . . . . . . . . . 407View Trace Messages . . . . . . . . . . . . . . . . . . . . . . . . . . . . . . . . . . . . . . . . . . . . . . . . . . 408Filter Traces . . . . . . . . . . . . . . . . . . . . . . . . . . . . . . . . . . . . . . . . . . . . . . . . . . . . . . . . . 412
27 Troubleshooting . . . . . . . . . . . . . . . . . . . . . . . . . . . . . . . . . . . . . . . . . . . . . . . . . . . . . . . . 415
Index . . . . . . . . . . . . . . . . . . . . . . . . . . . . . . . . . . . . . . . . . . . . . . . . . . . . . . . . . . . . . . . . . . . . . 419
12

13

14

1 Introduction
The HP Operations agent helps you monitor a system by collecting metrics that indicate the health, performance, and availability of essential elements of the system. The embedded data collector of the HP Operations agent enables you to collect and log performance metrics of systems in your environment.
The HP Operations agent uses log files to store the collected metrics and provides you with a mechanism to generate alert messages when the collected metrics do not match with the preset threshold values. You can view the collected metric data with the help of data analysis tools like HP Reporter and HP Performance Manager. If you install and configure the agent to work with an HP Operations Manager (HPOM) management server, you can monitor health and performance of the agent node centrally from the HPOM console.
15
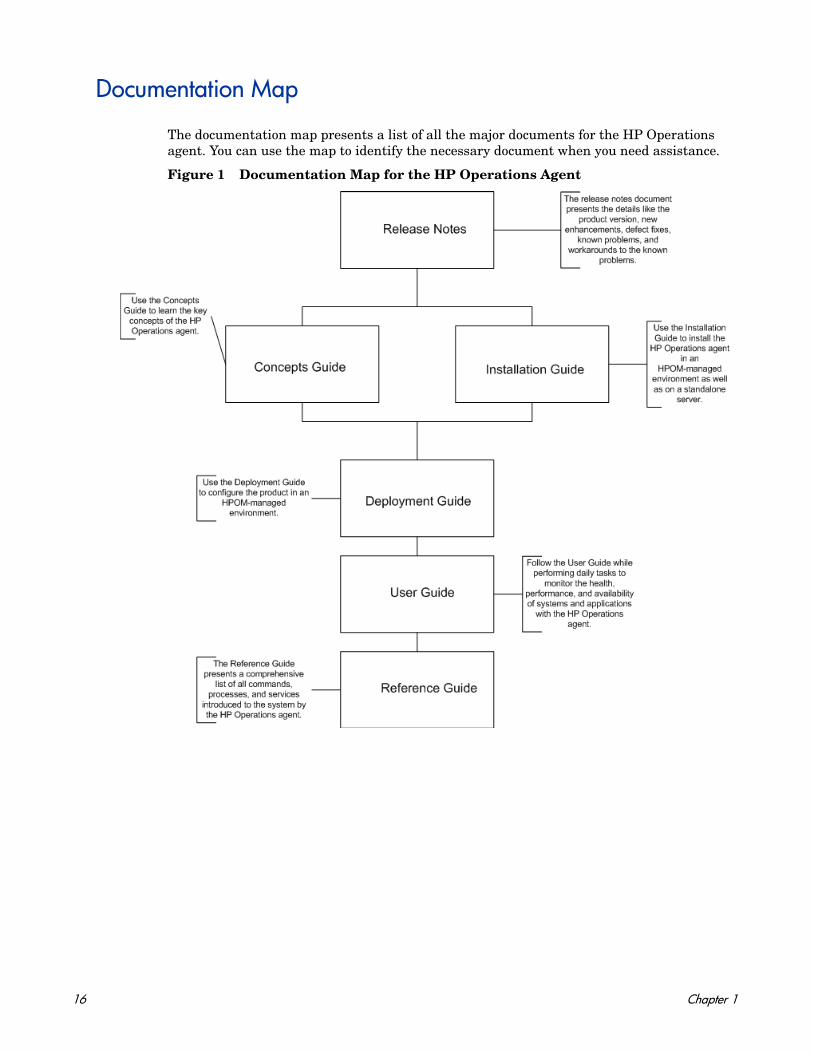
Documentation Map
The documentation map presents a list of all the major documents for the HP Operations agent. You can use the map to identify the necessary document when you need assistance.
Figure 1 Documentation Map for the HP Operations Agent
16 Chapter 1
Related Documentation
You can find all the user documentation for the HP Operations agent inside the paperdocs directory on the product media. To check for recent updates or to verify that you are using the most recent edition of a document, go to:
http://h20230.www2.hp.com/selfsolve/manuals
This site requires that you register for an HP Passport and sign in. To register for an HP Passport ID, go to:
http://h20229.www2.hp.com/passport-registration.html
Or click the New users - please register link on the HP Passport login page.
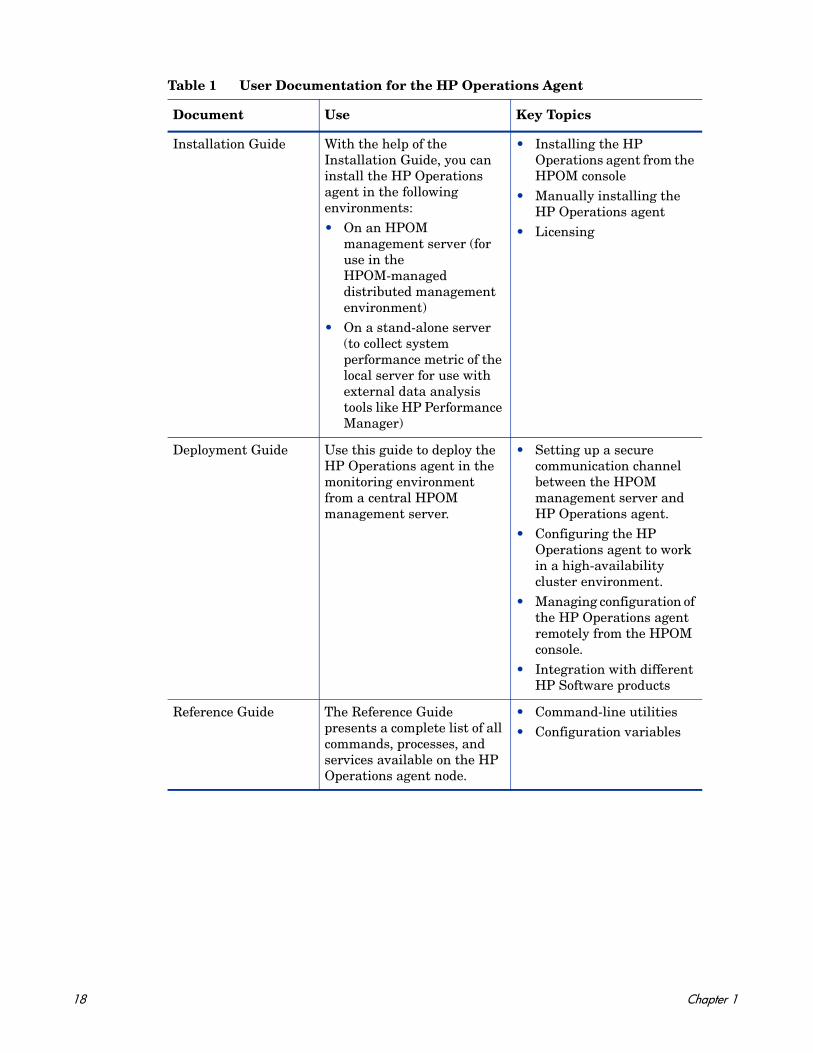
Table 1 User Documentation for the HP Operations Agent
Document Use Key Topics
Release Notes Refer to this document for information on the product version, new features, and known problems.
• New features• Enhancements• Fixes• Known issues and
limitations
Concepts Guide The Concepts Guide helps you understand the working mechanism of the HP Operations agent in different environments.
• Introduction to the HP Operations agent
• Major components of the HP Operations agent
Introduction 17
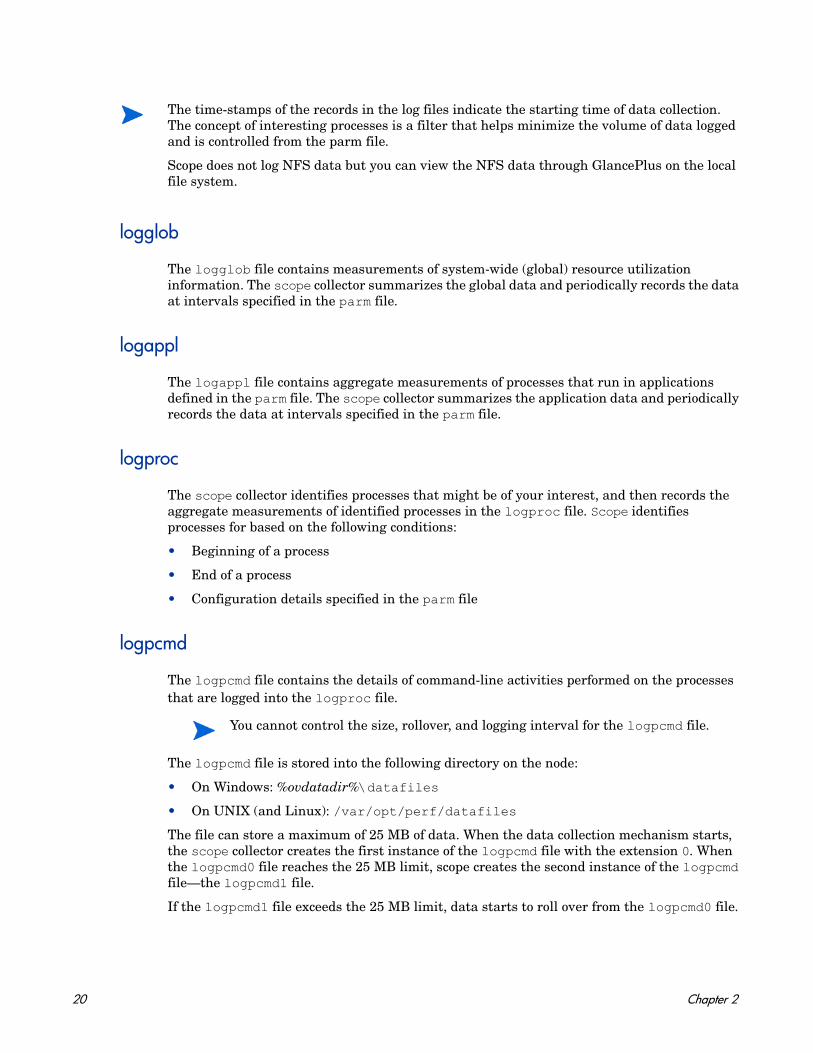
Installation Guide With the help of the Installation Guide, you can install the HP Operations agent in the following environments:• On an HPOM
management server (for use in the HPOM-managed distributed management environment)
• On a stand-alone server (to collect system performance metric of the local server for use with external data analysis tools like HP Performance Manager)
• Installing the HP Operations agent from the HPOM console
• Manually installing the HP Operations agent
• Licensing
Deployment Guide Use this guide to deploy the HP Operations agent in the monitoring environment from a central HPOM management server.
• Setting up a secure communication channel between the HPOM management server and HP Operations agent.
• Configuring the HP Operations agent to work in a high-availability cluster environment.
• Managing configuration of the HP Operations agent remotely from the HPOM console.
• Integration with different HP Software products
Reference Guide The Reference Guide presents a complete list of all commands, processes, and services available on the HP Operations agent node.
• Command-line utilities• Configuration variables
Table 1 User Documentation for the HP Operations Agent
Document Use Key Topics
18 Chapter 1

2 Managing Data Collection
The HP Operations agent provides you with a data collector to collect and log system performance data of the monitored system. The data collector program—scope—enables you to store the collected data on the system. You can view and analyze the stored data using HP Performance Manager or HP Reporter.
The scope collector enables you to perform the following tasks on the system:
• Gather metric data that indicates health and performance of the monitored system
• Log the collected metric data into different log files
The configuration parameter file—the parm file—enables you to configure the default data logging mechanism of the scope collector. By modifying parameters in the parm file, you can control the following properties of the scope collector:
• Data logging interval
• Types of data
• Size of log files
After installing the HP Operations agent on the node, you must configure the data collection mechanism of scope by modifying the parm file.
Collection Log Files
The scope data collector (scopeux on UNIX and Linux nodes; scopent on Windows nodes) collects and summarizes performance measurements of system-resource utilization and records the data into the following log files, depending on the data classes specified in the log line of the parm file:
• logglob
• logappl
• logproc
• logpcmd
• logdev
• logtran
• logls
• logindx
Scope does not log the NFS data, but you can view the NFS data through HP GlancePlus on the local file system.
19
logglob
The logglob file contains measurements of system-wide (global) resource utilization information. The scope collector summarizes the global data and periodically records the data at intervals specified in the parm file.
logappl
The logappl file contains aggregate measurements of processes that run in applications defined in the parm file. The scope collector summarizes the application data and periodically records the data at intervals specified in the parm file.
logproc
The scope collector identifies processes that might be of your interest, and then records the aggregate measurements of identified processes in the logproc file. Scope identifies processes for based on the following conditions:
• Beginning of a process
• End of a process
• Configuration details specified in the parm file
logpcmd
The logpcmd file contains the details of command-line activities performed on the processes that are logged into the logproc file.
The logpcmd file is stored into the following directory on the node:
• On Windows: %ovdatadir%\datafiles
• On UNIX (and Linux): /var/opt/perf/datafiles
The file can store a maximum of 25 MB of data. When the data collection mechanism starts, the scope collector creates the first instance of the logpcmd file with the extension 0. When the logpcmd0 file reaches the 25 MB limit, scope creates the second instance of the logpcmd file—the logpcmd1 file.
If the logpcmd1 file exceeds the 25 MB limit, data starts to roll over from the logpcmd0 file.
The time-stamps of the records in the log files indicate the starting time of data collection. The concept of interesting processes is a filter that helps minimize the volume of data logged and is controlled from the parm file.
Scope does not log NFS data but you can view the NFS data through GlancePlus on the local file system.
You cannot control the size, rollover, and logging interval for the logpcmd file.
20 Chapter 2

logdev
The logdev file contains measurements of individual device performance. The scope collector summarizes the device data and periodically records the data at intervals specified in the parm file.
logtran
The logtran file contains measurements of ARM transaction data. The scope collector summarizes the transaction data and periodically records the data at intervals specified in the parm file. For more information on collecting transaction data, see What is Transaction Tracking? on page 343.
logls
The logls file contains information about the logical systems. The scope collector summarizes the logical system data and periodically records the data at intervals specified in the parm file.
The logls file is available only on the HP Operations agent for HPVM, Hyper-V Host, vSphere Management Assistant (vMA), Solaris global zones, and AIX-LPAR.
logindx
The logindx file contains information needed to access data in the other log files.
Scope Status
In addition to the log files, two other files are created when scope is started. They are the RUN file that resides in the /var/opt/perf/datafiles/ directory and the status.scope file that resides in the /var/opt/perf/ directory.
The RUN file is created to indicate that the scope process is running. Removing this file causes scope to terminate.
The /var/opt/perf/status.scope file serves as a status/error log for the scope process. New information is appended to this file each time the scope collector is started, stopped, or when a warning or error is encountered. To view the most recent status and error information from scope, use the perfstat -t command.
parm File
The parm file is a text file containing the instructions that tell scope to log specific performance measurements.
During fresh installation, the HP Operations agent places the default parm file into two different directories:
Managing Data Collection 21

• On Windows:
— %ovinstalldir%\newconfig
— %ovdatadir%
• On HP-UX, Solaris, and Linux:
— /opt/perf/newconfig
— /var/opt/perf
• On AIX:
— /usr/lpp/perf/newconfig
— /var/opt/perf
The data collection mechanism of scope is controlled by the settings in the parm file located into the %ovdatadir% (for Windows) or /var/opt/perf (for UNIX or Linux) directory.
If you want to modify the default collection mechanism, you must modify the settings in the parm file that is located into the %ovdatadir% (for Windows) or /var/opt/perf (for UNIX or Linux) directory.
When you upgrade the HP Operations agent on a node (from an older version of the HP Performance Agent), the upgrade process updates the copy of the parm file available in the newconfig directory. The parm file that resides into the other directory remains unaffected and continues to govern the data collection mechanism on the node. This method, in effect, enables you to retain the configured data collection mechanism even after upgrade of the product. You can, any time after the product upgrade, compare the existing configuration settings of the parm file with the new version of the parm file available in the newconfig directory, and then make necessary changes.
The parm file is set up to collect an average amount of log file data. The maximum amount depends on your system. See the description of the parameter size in Parameter Descriptions on page 26.
Modify the parm File
You can modify the parm file using any word processor or editor that can save a file in the ASCII format.
When you modify the parm file, or create a new one, the following rules and conventions apply:
• Any parameter you specify overrides the default values. See the parm file available in the newconfig directory for the default values.
• The order in which the parameters are specified into the parm file is not important.
• If you specify a parameter more than once, the last instance of the parameter takes effect.
• The file, user, group, cmd, argv1, and or parameters must follow the application statement that they define.
• Application parameters must be listed in order so that a process will be aggregated into the application when it is first matched.
• You can use uppercase letters, lowercase letters, or a combination of both for all commands and parameter statements.
On Windows, the parm file exists with the extension .mwc (parm.mwc).
22 Chapter 2

• You can use blank spaces or commas to separate key words in each statement.
• You can comment parameters in the parm file. Any line starting with a comment code (/*) or pound sign (#) is ignored.
After modifying the parm file, you must restart the Performance Collection Component component for the changes to take effect. To restart the Performance Collection Component, run the following command:
On Windows
%ovinstalldir%bin\ovpacmd REFRESH COL
On HP-UX, Linux, or Solaris
/opt/perf/bin/ovpa -restart scope
On AIX
/usr/lpp/perf/bin/ovpa -restart scope
parm File Parameters
Scope is controlled by specific parameters in the collection parameters (parm) file that do the following:
• Set maximum amount of disk space for the raw scope log files.
• Specify data types to be logged.
• Specify the interval at which data should be logged.
• Specify attributes of processes and metrics to be logged.
• Define types of performance data to be collected and logged.
• Specify the user-definable sets of applications that should be monitored. An application can be one or more programs that are monitored as a group.
• Specify when scope should perform daily log file maintenance activities so that they do not impact system availability.
You can modify these parameters to configure scope to log performance data that match the requirements of the monitored system (see Modify the parm File on page 22).
The parm file parameters listed in Table 2 on page 24 are used by scope. Some of these parameters are for specific systems as indicated in the table. For detailed descriptions of these parameters, see Parameter Descriptions on page 26 and Application Definition Parameters on page 35.
Managing Data Collection 23
Table 2 parm File Parameters Used by scope
Parameter Values or Options
id system ID
log • global
• application [=prm] [=all]([=prm] on HP-UX only)
• process
• device=disk,lvm,cpu,filesystem,all(lvm on HP-UX only,)
• transaction=correlator,resource (resource on HP-UX only)
• logicalsystem(For Solaris, logical system is supported on Solaris 10 operating environment or later)
In AIX, logical system is supported on LPAR on AIX 5L V5.3 ML3 and later and WPAR on AIX 6.1 TL2 Global environment only.
For enabling lpar logging,logicalsystems=lparlogicalsystems
For enabling wpar logging,logicalsystems=wpar
For enabling both lpar and wpar logging,logicalsystems=lpar,wparlogicalsystems=wpar,lparlogicalsystems=all
mainttime hh:mm (24-hour time format)
scopetransactions onoff
subprocinterval value in seconds (not on HP-UX)
javaarg
NOTE: Only on UNIX/Linux.
truefalse
procthreshold
(same as threshold)cpu=percentdisk=rate (not on Linux or Windows)memory=nn (values in MBs)nonewnokilledshortlived
appthreshold cpu=percent
diskthreshold util=rate
24 Chapter 2
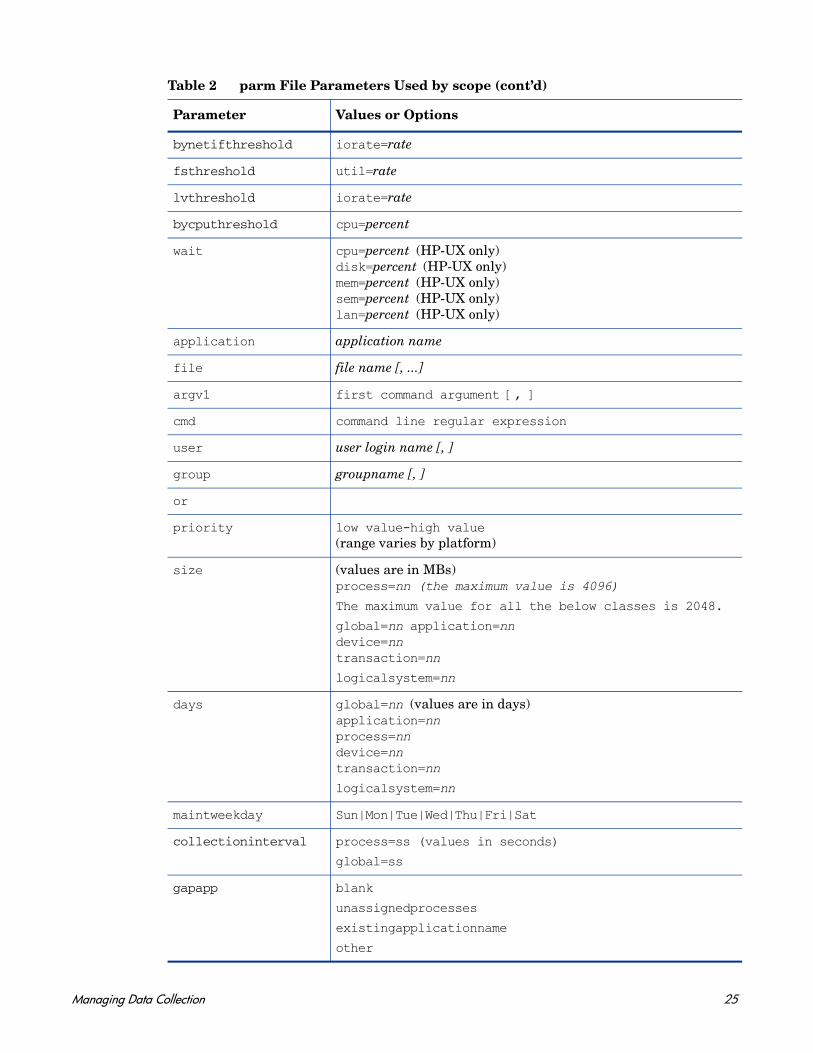
bynetifthreshold iorate=rate
fsthreshold util=rate
lvthreshold iorate=rate
bycputhreshold cpu=percent
wait cpu=percent (HP-UX only)disk=percent (HP-UX only)mem=percent (HP-UX only)sem=percent (HP-UX only)lan=percent (HP-UX only)
application application name
file file name [, ...]
argv1 first command argument [, ]
cmd command line regular expression
user user login name [, ]
group groupname [, ]
or
priority low value-high value(range varies by platform)
size (values are in MBs)process=nn (the maximum value is 4096)
The maximum value for all the below classes is 2048.
global=nn application=nndevice=nntransaction=nn
logicalsystem=nn
days global=nn (values are in days)application=nnprocess=nndevice=nntransaction=nn
logicalsystem=nn
maintweekday Sun|Mon|Tue|Wed|Thu|Fri|Sat
collectioninterval process=ss (values in seconds)
global=ss
gapapp blank
unassignedprocesses
existingapplicationname
other
Table 2 parm File Parameters Used by scope (cont’d)
Parameter Values or Options
Managing Data Collection 25

Parameter Descriptions
Following are descriptions of each of the parm file parameters.
• ID
• Log
• Thresholds
• scopetransactions
• subprocinterval
• gapapp
• wait
• Size
• Mainttime
• Days
• Maintweekday
• javaarg
• Flush
• zone_app
• proccmd
• ignore_mt
Flush ss(values in seconds)
0 (disables data flush)
zone_app true
false
(only on Solaris 10 and above)
proccmd
NOTE: Only on UNIX/Linux.
0 (disables logging of process commands)
nnnn (refers to the numeric value of the length of a process command. Maximum value is 1024)
ignore_mt true(CPU metrics of global class report values normalized against the active number of cores in the system)
false(CPU metrics of global class report values normalized against active number of CPU threads in the system)
ineffective(multithreading is turned off)
Table 2 parm File Parameters Used by scope (cont’d)
Parameter Values or Options
26 Chapter 2
ID
The system ID value is a string of characters that identifies your system. The default ID assigned is the system’s hostname. If you want to modify the default ID assigned, make sure all the systems have unique ID strings. This identifier is included in the log files to identify the system on which the data was collected. You can specify a maximum of 39 characters.
Log
The log parameter specifies data types to be collected by scope.
• log global enables scope to record global records to the logglob file. You must have global data records to view and analyze performance data on your system. Global metrics are not affected by logging options or values of application or process data.
• log application enables scope to record active application records to the logappl file. By default, scope logs only the applications that have active processes during an interval.
— log application=all in the parm file enables scope to log all applications to the logappl file at every interval, regardless of whether the applications are active or not.
The application=all option may be desirable in specific circumstances in relation to the use of application alarms. For example, you can generate alarm when an application becomes inactive (APP_ALIVE_PROC).
If you enable this option, the log file logappl grows in size at a faster rate since all applications are logged at every interval. You can use the utility program’s scan function to monitor the utilization of the scope log files.
— On HP-UX only, you can specify the parameter log application=prm to enable scope to record active Process Resource Manager (PRM) groups to the logappl file. If you specify this parameter, scope will not record user-defined application sets listed in the parm file. In addition, all application metrics collected will reflect a PRM context and will be grouped by the APP_NAME_PRM_GROUPNAME metric.
Application logging options do not affect global or process data.
• log process enables scope to record information about interesting processes to the logproc file. A process may become interesting when it is first created, when it ends, and when it exceeds a threshold specified in the parm file for an application. Process threshold logging options have no effect on global or application data.
• log device=disk,lvm, cpu, filesystem enables scope to record information about individual disks, logical volumes (HP-UX only), CPUs, and file systems to the logdev file.
By default, only disks, volumes, and interfaces that had I/O generated through them during an interval are logged. netif (logical LAN device) records and disk records (on HP-UX) are always logged regardless of the selected log device options.
For example, to request logging of records for individual disks, logical volumes, CPUs, network interfaces, but not individual file systems, use the following setting:
log device=disk,lvm,cpu.
— When filesystem is specified, all mounted local file systems are logged at every interval, regardless of the activity.
Do not use lvm if the monitored system does not run with the HP-UX operating system.
Managing Data Collection 27

— log device=all in the parm file enables scope to log all disk, logical volume, CPU, and network interface devices to the logdev file at every interval, regardless of whether the devices are active or not.
If you enable this option, the logdev file grows in size at a faster rate since all devices are logged at every interval. Use the utility program’s scan function to monitor log file utilization and sizing.
• log transaction enables scope to record ARM transaction records to the logtran file. To enable scope to collect data, a process that is instrumented with the Application Response Measurement (ARM) API must be running on your system. (For more information, see What is Transaction Tracking? on page 343.)
The default values for the log transaction parameter are no resource and no correlator.
To enable resource data collection (HP-UX only) or correlator data collection, specify log transaction=resource or log transaction=correlator. Both can be logged by specifying log transaction=resource, correlator.
• log logicalsystems enables scope to record information about the logical systems to the logls file. Data for logical systems is summarized periodically at intervals specified in the parm file.
On AIX 6.1 TL2, BYLS logging for LPAR and WPAR can be configured by using the logicalsystems parameter in the parm file. See Table 2 on page 24.
The log files are created automatically irrespective of logging options. If a particular type of logging is disabled, the corresponding log file will not removed automatically from the monitored system.
If you specify log without options, scope logs only the global and process data.
Thresholds
The threshold parameters enable scope to record only critical information into the log files and filter out unnecessary, non-critical details of the system.
The following parameters specify the thresholds for different classes of metrics. When the threshold value specified is exceeded for a particular instance of a class of data, a record for that instance is logged by scope.
You can specify lower values for the threshold, to enable scope to log more data or you can specify higher values for the threshold, to enable scope to log lesser data so that you have fewer records logged on average. Listed below are the threshold parameter available:
• Procthreshold
• appthreshold
• diskthreshold
• bynetifthreshold
• fsthreshold
• lvthreshold
• bycputhreshold
28 Chapter 2
Procthreshold
The procthreshold parameter is used to set activity levels to specify criteria for interesting processes. To use this parameter, you must enable process logging. procthreshold affects only processes that are logged and do not affect other classes of data.
You must specify threshold options on the same parameter line (separated by commas).
procthreshold Options for Process Data cpu Sets the percentage of CPU utilization that a process must exceed to
become “interesting” and be logged.The value percent is a real number indicating overall CPU use. For example, cpu=7.5 indicates that a process is logged if it exceeds 7.5 percent of CPU utilization in a 1-minute sample.
disk (Not available on Linux or Windows.) Sets the rate of physical disk I/O per second that a process must exceed to become “interesting” and be logged.The value is a real number. For example, disk=8.0 indicates that a process will be logged if the average physical disk I/O rate exceeds 8 KBs per second.
memory Sets the memory threshold that a process must exceed to become “interesting” and be logged.The value is in megabyte units and is accurate to the nearest 100 KB. If set, the memory threshold is compared with the value of the PROC_MEM_VIRT metric. Each process that exceeds the memory threshold will be logged, similarly to the disk and CPU process logging thresholds.
nonew Disables logging of new processes if they have not exceeded any threshold. If not specified, all new processes are logged. On HP-UX, if shortlived is not specified, then only new processes that lasted more than one second are logged.
nokilled Disables logging of exited processes if they did not exceed any threshold. If not specified, all killed (exited) processes are logged. On HP-UX, if shortlived is not specified, then only killed processes greater than one second are logged.
shortlived Enables logging of processes that ran for less than one second in an interval. (This often significantly increases the number of processes logged.) If scope finds threshold shortlived in the parm file, it logs shortlived processes, regardless of the cpu or disk threshold, as long as the nonew and nokilled options are removed. The default is no shortlived processes will be logged. (Do not specify shortlived in the threshold parameter if you do not want shortlived processes logged.)
process procthreshold specifies the thresholds for the PROCESS class. The default values are as follows:• Processes that used more than 10% of a processor's worth of cpu during
the last interval • Processes had a virtual memory set size over 900 MB• Processes had an average physical disk I/O rate greater than 5 KB per
second
Managing Data Collection 29

appthreshold
The appthreshold parameter is used to specify threshold values for the APPLICATION data class (APP_CPU_TOTAL_UTIL metric). The threshold criteria is based on the percentage of CPU utilization that an application must exceed for the application to be recorded in the log files.
The default setting in the parm file enables scope to record applications that use more than 0% of CPU.
diskthreshold
The diskthreshold parameter is used to specify the threshold values for DISK class. The threshold criteria for DISK class is based on the percentage of time duration, a disk performs I/Os (BYDSK_UTIL metric).
The default setting in the parm file enables scope to record the details of disks that are busy performing I/Os for more than 10% of the time duration.
bynetifthreshold
The bynetifthreshold parameter specifies the thresholds for the NETIF class. Netif data class threshold criteria is based on the number of packets transferred by the network interface per second (BYNETIF_PACKET_RATE metric).
The default setting in the parm file enables scope to record the details of network interfaces that transfer more than 60 packets per second. If the value for this parameter is not specified or if the parameter is commented out, scope logs the details of all the network interfaces that are not idle.
fsthreshold
The fsthreshold parameter specifies the thresholds for FILESYSTEM class. The file system data class threshold criteria is based on the percentage of disk space utilized by the filesystems (FS_SPACE_UTIL metric).
The default setting in the parm file enables scope to record the details of filesystems that utilize more than 70% of disk space.
lvthreshold
The lvthreshold specifies the thresholds for the LOGICALVOLUME class. Logical volume data class threshold values are based on I/Os per second (LV_READ_RATE + LV_WRITE_RATE).
The default setting in the parm file enables scope to record the details of logical volumes that have more than 35 I/Os per second.
bycputhreshold
The bycputhreshold parameter specifies the thresholds for CPU class. CPU data class thresholds criteria is based on percentage of time the cpu was busy (BYCPU_CPU_TOTAL_UTIL).
The default setting in the parm file enables scope to record the details of CPUs that are busy more than 90% of the time.
scopetransactions
The scope collector itself is instrumented with ARM (Application Response Measurement) API calls to log its own transactions. The scopetransactions flag determines whether or not scope transactions will be logged. The default is scopetransactions=on; scope will log two transactions: Scope_Get_Process_Metrics and Scope_Get_Global_Metrics. If you do not
30 Chapter 2
want these scope transactions to be logged, specify scopetransactions=off. A third transaction, Scope_Log_Headers, will always be logged; it is not affected by scopetransactions=off.
For more information about ARM, see What is Transaction Tracking? on page 343.
subprocinterval
The subprocinterval parameter, if specified, overrides the default that scope uses to sample process data. Process data and global data are logged periodically at intervals specified in the parm file. However, scope probes its instrumentation every few seconds to catch short-term activities. This instrumentation sampling interval is 5 seconds by default. The process data logging interval must be an even multiple of the subprocinterval. For more information, see Configure Data Logging Intervals on page 39.
On some systems with thousands of active threads or processes, the subprocinterval should be made longer to reduce overall scope overhead. On other systems with many short-lived processes that you may wish to log, setting the subprocinterval lower could be considered, although the effect on scope overhead should be monitored closely in this case. This setting must take values that are factors of the process logging interval as specified in the parm file.
gapapp
The gapapp parameter in the parm file controls the modification of application class of data to account for any difference between the global (system-wide) data and the sum of application data.
Application data is derived from process-level instrumentation. Typically there is difference between the global metrics and the sum of applications. In systems which have high process creation rates the difference will be significant. You can choose from the following options:
• If gapapp is blank, an application named gapapp will be added to the application list.
• If gapapp = UnassignedProcesses, an application by the name UnassignedProcesses will be added to the application list.
• If gapapp = ExistingApplicationName (or) gapapp = other, The difference to the global values will be added to the specified application instead of being logged separately and adding a new entry to the application list.
wait
You can use the wait parameter (HP-UX only) to capture details of processes which wait for system resources. You can specify the value of the wait parameter in percentage. When a process waits for system resources: cpu, disk, mem, sem, and lan for a percentage of interval greater than the value specified for the wait parameter then the details of that process are logged in the logproc file.
See parm File Parameters Used by scope for values and options.
For example, if process logging interval is defined as 60 seconds and the wait parameter for the CPU is set to 50%, any process waiting for CPU for more than or equal to 30 seconds is captured in the logproc file.
Lower values for the subprocinterval will decrease the gap between global metrics and the sum of applications on all operating systems other than HP-UX.
Managing Data Collection 31
Size
The size parameter is used to set the maximum size (in megabytes) of any raw log file. You cannot set the size to be less than one megabyte.
The scope collector reads these specifications when it is initiated. If any of these log files achieve their maximum size during collection, they will continue to grow until mainttime, when they will be rolled back automatically. During a roll back, the oldest 25 percent of the data is removed from the log file. Raw log files are designed to only hold a maximum of one year's worth of data if not limited by the size parameter. See Log File Contents Summary on page 73 and Log File Empty Space Summary on page 74 in the Utility Scan Report Details section in Chapter 3.
If the size specification in the parm file is changed, scope detects it during startup. If the maximum log file size is decreased to the point where existing data does not fit, an automatic resize will take place during the scope startup. If the existing data fits within the new maximum size specified, no action is taken.
The resize command creates the new file scopelog in the directory set by TMPDIR environment variable before deleting the original log file. See How to Use It.
Any changes you make to the maximum size of a log file take effect at the time specified in the mainttime parameter.
Mainttime
Log files are rolled back if necessary by scope only at a specific time each day. The default time can be changed using the mainttime parameter. For example, setting mainttime=8:30, causes log file maintenance to be done at 8:30 am each day.
We suggest setting mainttime to a time when the system is at its lowest utilization.
Days
The days parameter specifies the maximum number of days of data, any raw data log file can store at a given point of time. The value for this parameter must be in the range of 1 to 365. This parameter enables scope data collector to maintain log files.
During data collection, if the number of days of data in the log file reaches the days specified in the days parameter, data collection will continue till the day specified in the maintweekday parameter is met. Once maintweekday is reached, the log file will be rolled back automatically at maintime. During the roll back, data collected after days parameter reached its maximum value will be removed from the log file.
Regardless of the size parameters, the maximum size of the scope log files will be limited also by the amount of data stored over one year. Raw scope log files cannot contain more than one year of data, so if logs extend back that long, the data older than one year will be overwritten. See extract on page 125 for information about how to create archival log files if more than a year of data is desired.
Log file maintenance only rolls out data older than one day, so if a log file such as logproc grows very quickly and reaches its limit within 24 hours, its size can exceed the configured size limit.
When the log files are rolled back during data collection, if the value specified in the size parameter is reached on a specific day before the days parameter, then the size parameter overrides the days parameter.
32 Chapter 2

Example, if "size global=20" and "days global=40" is used in parm file, and if the log files reaches maximum size 20 MB before 40 days of data being logged in log file, then the log file roll back is done based on the size parameter.
Maintweekday
The maintweekday parameter specifies the day of the week when the log file roll back happens if the days parameter is met. The roll back will happen at maintime.
Example, if “maintweekday=Mon” is used in parm file, the log file roll back is done once the value specified in the days parameter is met on “Monday” at maintime. It is recommended that the value for maintweekday should be set to a day in the week when the system utilization is low.
Example, if “daysglobal=30”, “application=20”, “process=30”, “device=20”, “transaction=10”, “maintweekday=Wed” and if the log file reaches the number of days specified in the days parameter, data collection will continue till the day specified in the maintweekday. Once maintweekday is reached, log file roll back will happen removing the exceeded number of days of data from the start of the log file. This maintenance will be done at maintime.
javaarg
The javaarg parameter is a flag that can be set to true or false. It ONLY affects the value of the proc_proc_argv1 metric.
When javaarg is set to false or is not defined in the parm file, the proc_proc_argv1 metric is always set to the value of the first argument in the command string for the process.
When javaarg is set to true, the proc_proc_argv1 metric is overridden, for java processes only, with the class or jar specification if that can be found in the command string. In other words, for processes whose file names are java or jre, the proc_proc_argv1 metric is overridden with the first argument without a leading dash not following a -classpath or a -cp, assuming the data can be found in the argument list provided by the OS.
While this sounds complex, it is very plain when you have java processes running on your system: set javaarg=true and the proc_proc_argv1 metric is logged with the class or jar name. This can be very useful if you want to define applications specific to java. When the class name is in proc_proc_argv1, then you can use the argv1= application qualifier to define your application by class name.
Flush
The flush parameter specifies the data logging intervals (in seconds) at which all instances of application and device data will be logged. The flush intervals must be in the range 300-32700 and be an even multiple of 300.
The default value of flush interval is 3600 seconds for all instances of application and device data.
The maintweekday parameter is an optional parameter. If maintweekday parameter is specified in the parm file, it should be used along with the days parameter. This parameter will not be considered, if it is not used with days parameter in the parm file. If maintweekday is not specified in the parm file though days parameter is specified, then the default value is “maintweekday=Sun”.
This parameter is valid only on UNIX/Linux.
Managing Data Collection 33
You can disable the flush parameter by specifying the value as 0 (zero). If the flush parameter is set to 0, scope will not log application and the device data which does not meet the thresholds specified in the parm file.
zone_app
The zone_app flag allows Performance Collection Component to collect Solaris zones specific data. The zone_app flag, when set to true, will affect the collection of all application class (APP_*) metrics. All the user-defined application sets listed in parm file will be ignored and the application metrics will be collected based on zones running on the Performance Collection Component installed machines.
For example, consider a Solaris machine running with two non-global zones: “zone1” and “zone2”. Performance Collection Component will ignore parm file application sets and will create three applications, named "global", "zone1", and "zone2". The performance measurement for each application will be based on the measurement values obtained from the processes running under respective zones. Example, APP_CPU_TOTAL_UTIL metric for zone "zone1" will be calculated based on the cpu utilization values for all the processes running in zone1.
When zone_app flag is not enabled or when Performance Collection Component is running on Solaris 9 or lower version, APP_LS_ID metric will report a Not Available (na) value. Application grouping will be done based on the user-defined application sets listed in parm file.
proccmd
The proccmd parameter enables logging of process commands into HP Operations agent data store. You can specify the length of the process command as a numeric value in this parameter. The maximum numeric value is 1024. By default, the value for this parameter is set to 0 and the logging of process commands is disabled.
ignore_mt
If you set this parameter to true, the Performance Collection Component logs all the CPU-related metrics of the Global class after normalizing the metric values against the number of active cores on the monitored system.
When this parameter is set to false, the Performance Collection Component logs all the CPU-related metrics of the Global class after normalizing the metric values against the number of threads on the monitored system.
The Performance Collection Component ignores this parameter if the multithreading property is disabled on the system. As a result, the value of the GBL_IGNORE_MT metric is logged as true.
Zones are supported only on Solaris 10 and above versions.
This parameter is valid only on UNIX/Linux.
If you enable or disable Simultaneous Multi-Threading (SMT) on a Windows, Linux, or Solaris system, you must restart the system.
34 Chapter 2
Application Definition Parameters
The following parameters pertain to application definitions: application, file, user, group, cmd, argv1, and or.
The Performance Collection Component groups logically related processes together into an application to log the combined effect of the processes on computing resources such as memory and CPU.
An application can be a list of files (base program names), a list of commands, or a combination of these also qualified by user names, group names, or argument selections. All these application qualifiers can be used individually or in conjunction with each other. If, for example, cmd and user qualifiers are both used then a process must meet the specification of both the command string and the user name in order to belong to that application. Each qualifier is discussed in detail below.
Application
The application name defines an application or class that groups together multiple processes and reports on their combined activities.
• The application name is a string of up to 19 characters used to identify the application.
• Application names can be lowercase or uppercase and can contain letters, numbers, underscores, and embedded blanks. Do not use the same application name more than once in the parm file.
• An equal sign (=) is optional between the application keyword and the application name.
• The application parameter must precede any combination of file, user, group, cmd, argv1, and or parameters that refer to it, with all such parameters applying against the last application workload definition.
• Each parameter can be up to 170 characters long including the carriage return character, with no continuation characters permitted. If your list of files is longer than 170 characters, continue the list on the next line after another file, user, group, cmd or argv1 statement.
• You can define up to 998 applications. Performance Collection Component predefines an application named other. The other application collects all processes not captured by application statements in the parm file.
For example:
application Prog_Devfile vi,cc,ccom,pc,pascomp,dbx,xdb
application xyzfile xyz*,startxyz
You can have a maximum of 4096 file, user, group, argv1, and cmd specifications for all applications combined. The previous example includes nine file specifications. (xyz* counts as only one specification even though it can match more than one program file.)
If a program file is included in more than one application, it is logged in the first application that contains it.
In PRM mode (for HP-UX only), active PRM groups are logged and the user-defined application sets listed in the parm file are ignored.
Any process on the system belongs to only one application. No process is counted into two or more applications.
Managing Data Collection 35

The default parm file contains some sample applications that you can modify. The examples directory also contains other samples (in a file called parm_apps) you can copy into your parm file and modify as needed.
File
The file parameter specifies the program files that belong to an application. All interactive or background executions of these programs are included. It applies to the last application statement issued. An error is generated if no application statement is found.
The file name can be any of the following:
• A single UNIX program file such as vi.
• A group of UNIX program files (indicated with a wild card) such as xyz*. In this case, any program name that starts with the letters xyz is included. A file specification with wild cards counts as only one specification toward the maximum allowed.
The name in the file parameter is limited to 15 characters in length. An equal sign (=) is optional between the file parameter and the file name.
You can enter multiple file names on the same parameter line (separated by commas) or in separate file statements. File names cannot be qualified by a path name. The file specifications are compared to the specific metric PROC_PROC_NAME, which is set to a process’s argv[0] value (typically its base name). For example:
application = prog_devfile = vi,vim,gvim,make,gmake,lint*,cc*,gcc,ccom*,cfrontfile = cpp*,CC,cpass*,c++*file = xdb*,adb,pxdb*,dbx,xlC,ld,as,gprof,lex,yacc,are,nm,gencatfile = javac,java,jre,aCC,ctcom*,awk,gawk
application Mailfile = sendmail,mail*,*mail,elm,xmh
If you do not specify a file parameter, all programs that satisfy the other parameters qualify.
argv1
The argv1 parameter specifies the processes that are selected for the application by the value of the PROC_PROC_ARGV1 metric. This is normally the first argument of the command line, except when javaarg=true, when this is the class or jar name for java processes. This parameter uses the same pattern matching syntax used by parm parameters like file= and user=. Each selection criteria can have asterisks as a wildcard match character, and you can have more than one selection on one line separated by commas.
For example, the following application definition buckets all processes whose first argument in the command line is either -title, -fn, or -display:
application = xappsargv1 = -title,-fn,-display
The following application definition buckets a specific java application (when javaarg=true):
application = JavaCollectorargv1 = com.*Collector
The following shows how the argv1 parameter can be combined with the file parameter:
The asterisk (*) is the only wild card character supported for parm file application qualifiers except for the cmd qualifier (see below).
36 Chapter 2
application = sun-javafile = javaargv1 = com.sun*
cmd
The cmd parameter specifies processes for inclusion in an application by their command strings, which consists of the program executed and its arguments (parameters). Unlike other selection parameters, this parameter allows extensive use of wildcard characters besides the use of the asterisk character.
Similar to regular expressions, extensive pattern matching is allowed. For a complete description of the pattern criteria, see the UNIX man page for fnmatch. Unlike other parameters, you can have only one selection per line, however you can have multiple lines.
The following shows use of the cmd parameter:
application = newbiecmd = *java *[Hh]ello[Ww]orld*
User
The user parameter specifies which users (login names) belong to the application. The format is as below:
application <application_name>
file <file_name>
user [<Domain_Name>]\<User_Name
The domain name in the user parameter is optional. You must specify the domain name to specify the user names of a non-local system.
For example:
application test_app
file test
user TestDomain\TestUser
If you specify the user name without the domain name in the user parameter, the user names will be considered to be the user names of the local system.
For example:
application Prog_Dev
file vi,xb,abb,ld,lint
user ted,rebecca,test*
You can only use the wild card asterisk (*) to ensure the user names with a similar string of characters prefixed before the asterisk (*) and suffixed after the asterisk (*) belong to the application.If you do not specify a user parameter, all programs that satisfy the other parameters qualify.
The name in the user parameter is limited to 15 characters in length.
Group
The group parameter specifies which user group names belong to an application.
For example:
Managing Data Collection 37
application Prog_Dev_Group2file vi,xb,abb,ld,lintuser ted,rebecca,test* group lab, test
If you do not specify a group parameter, all programs that satisfy the other parameters qualify.
The name in the group parameter is limited to 15 characters in length.
Or
Use the or parameter to allow more than one application definition to apply to the same application. Within a single application definition, a process must match at least one of each category of parameters. Parameters separated by the or parameter are treated as independent definitions. If a process matches the conditions for any definition, it will belong to the application.
For example:
application = Prog_Dev_Group2user julieoruser mark file vi, store, dmp
This defines the application (Prog_Dev_Group2) that consists of any programs run by the user julie plus other programs (vi, store, dmp) if they are executed by the user mark.
Priority
You can restrict processes in an application to those belonging to a specified range by specifying values in the priority parameter.
For example:
application = swappingpriority 128-131
Processes can range in priority from -511 to 255, depending on which platform Performance Collection Component is running.The priority can be changed over the life of a process. The scheduler adjusts the priority of time-share processes. You can also change priorities programmatically or while executing.
Application Definition Examples
The following examples show application definitions.
application firstthreesvrscmd = *appserver* *-option[123]*application oursvrscmd = *appserver*user = xyz,abc
application othersvrs
The parm file is processed in the order entered and the first match of the qualifier will define the application to which a particular process belongs. Therefore, it is normal to have more specific application definitions prior to more general definitions.
38 Chapter 2
cmd = *appserver*cmd = *appsvr*orargv1 = -xyz
The following is an example of how several of the programs would be logged using the preceding parm file.
Configure Data Logging Intervals
The default collection intervals used by scope are 60 seconds for process data and 300 seconds for global and all other classes of data. You can override this using the collectioninterval parameter in the parm file. The values must satisfy the following conditions:
• The collection intervals for process data can be configured between 5 to 60 seconds in steps of 5 seconds. The collection intervals for process data must be a multiple of the subproc interval (see subprocinterval) and it must divide evenly into the global collection interval.
• The collection interval for global data can be configured to one of the following values: 15, 30, 60 and 300 seconds. The global collection interval must be greater than or equal to process interval, and a multiple of the process collection interval. The global collection interval applies to the global metrics and all non-process metric classes such as filesystem and application.
Example 1:
collectioninterval process=15, global=30subprocinterval = 5
In this example, the collection interval for process data is set to 15 seconds, global and all other classes of data to 30 seconds, and subprocinterval to 5 seconds:
The collection interval for process data is,
• is a valid value (this value is a multiple of 5)
• is a multiple of subprocinterval, 5 seconds (15%5 = 0)
• divides evenly into collection interval for global data, 30 seconds (30%15 = 0)
The collection interval for global data is,
Command String User Login Application
/opt/local/bin/appserver -xyz -option1
xyz firstthreesvrs
./appserver -option5 root othersvrs
./appserver -xyz -option2 -abc root firstthreesvrs
./appsvr -xyz -option2 -abc xyz othersvrs
./appclient -abc root other
./appserver -mno -option4 xyz oursvrs
appserver -option3 -jkl xyz firstthreesvrs
/tmp/bleh -xyz -option1 xyz othersvrs
Managing Data Collection 39

• is a valid value (this value can be 15, 30, 60 or 300)
• is a multiple of process interval 15 seconds (30%15 = 0)
Hence these values for the collection intervals are valid.
Example 2:
collectioninterval process=15, global=30subprocinterval = 10
In this example, the collection interval for process data is set to 15 seconds, global and all other classes of data to 30 seconds, and subprocinterval to 10 seconds:
The collection interval for process data is
• is a valid value (this value is a multiple of 5)
• is NOT a multiple of subprocinterval 10 seconds (15%10 != 0)
• divides evenly into global collection interval 30 seconds (30%15 = 0)
The collection interval for global data is 30 seconds
• is a valid value (this value can be 15, 30, 60 or 300)
• is a multiple of process interval 15 seconds (30%15 = 0)
Hence these values for the collection intervals are invalid.
Normalizing CPU Metrics on Hyper-Threading/Simultaneous Multi-Threading-Enabled Systems
On a system where hyper-threading/simultaneous multi-threading (HT/SMT) is enabled, the physical CPU supports two or more hardware threads. As a result, multiple software processes or threads can run on the hardware threads simultaneously. On a system with a multi-core processor, multiple threads can run simultaneously on individual cores.
The Performance Collection Component provides you with several CPU-related metrics, which help you analyze and understand the CPU utilization of the monitored system. By default, on all HT/SMT-enabled systems, the Performance Collection Component calculates the values of all CPU-related metrics by normalizing the gathered data against the number of available threads on the monitored system. When a single thread completely utilizes the entire CPU core, values calculated using the thread-based normalization do not always represent the true picture of the CPU utilization.
This version of the HP Operations agent introduces a new configuration parameter, ignore_mt, which enables you to configure the Performance Collection Component to log the CPU-related data that has been calculated using the core-based normalization. Metric values that are calculated with the core-based normalization present a more accurate status of the CPU utilization, and therefore, help you make more effective decisions while analyzing the system's performance.
For Performance Collection Component on VMware ESX Server, the logging interval for global data and all other classes of data other than process data, can be configured to 60 or 300 seconds.
40 Chapter 2

Logging Metrics Calculated with the Core-Based Normalization
On HP-UX, you can configure the Performance Collection Component to log all CPU-related metrics with core-based normalization. On other platforms, you can configure the Performance Collection Component to calculate the CPU-related metrics of the GLOBAL class using the core-based normalization before logging.
To configure the Performance Collection Component to use the core-based normalization for CPU-related metrics, follow these steps:
On HP-UX
1 Log on to the system with the root privileges.
2 Configure the parm file based on your requirement. Do not set the ignore_mt flag in the parm file.
3 Define alarm rules as necessary.
4 Run the following command:
midaemon –ignore_mt
5 Start the HP Operations agent using the following command:
opcagt –start
The Performance Collection Component starts logging all CPU-related metrics (for all classes) using the core-based normalization.
On other platforms
1 Log on to the system with the root or administrative privileges.
2 Configure the parm file based on your requirement. Set the ignore_mt flag in the parm file to true.
3 Define alarm rules as necessary.
4 Start the HP Operations agent using the following command:
On Windows
%ovinstalldir%bin\opcagt -start
On HP-UX, Linux, or Solaris
/opt/OV/bin/opcagt -start
On AIX
/usr/lpp/OV/bin/opcagt -start
The Performance Collection Component starts logging CPU-related metrics for the GLOBAL class using the core-based normalization.
Stopping and Restarting Data Collection
The scope collector and the other associated processes are designed to run continuously. The only time you should stop them are when any of the following occurs:
The value of the ignore_mt flag in the parm file on HP-UX has no effect on the operation of the Performance Collection Component.
Managing Data Collection 41

• You are updating Performance Collection Component software to a new release.
• You are adding or deleting transactions in the transaction configuration file, ttd.conf. (For more information, see What is Transaction Tracking? on page 343.)
• You are modifying distribution ranges or service level objectives (SLOs) in the transaction configuration file, ttd.conf. (For more information, see What is Transaction Tracking? on page 343.)
• You are changing the parm file and want the changes to take effect. Changes made to the parm file take effect only when scope is started.
• You are using the utility program's resize command to resize a Performance Collection Component log file.
• You are shutting down the system.
• You are adding the hardware or modifying the configuration changes. Changes made will take effect only when scope is started.
Stopping Data Collection
The ovpa and mwa script's stop option ensures that no data is lost when scope and other Performance Collection Component processes are stopped.
To manually stop data collection, type the following command:
• On Windows:
%ovinstalldir%bin\ovpacmd -stop
• On HP-UX, Linux, and Solaris:
/opt/perf/bin/ovpa -stop
• On AIX:
/usr/lpp/perf/bin/ovpa -stop
Restarting Data Collection
You have different options for restarting data collection after the Performance Collection Component processes have stopped or configuration files have been changed and you want these changes to take effect.
To start scope and the other Performance Collection Component processes after the system has been down, or after you have stopped them, use <InstallDir>/ovpa start if you are using coda. Here, InstallDir is the directory where Performance Collection Component is installed.
To restart scope and the other processes while they are running, use <InstallDir>/ovpa restart if you are using coda. Here, InstallDir is the directory where Performance Collection Component is installed. This stops the currently running processes and starts them again.
When you restart scope, the Performance Collection Component continues to use the same log files (logglob, logappl, logproc, logdev, logtran, logls, and logindx) used before stopping the program. New records are appended to the end of the existing files. If you want to
scope does not log NFS data but you can view the NFS data through GlancePlus on the local file system.
42 Chapter 2

collect data to a new set of files, and not retain any historical information, you should rename or archive, and remove all the scope log files together before you restart, because data is synchronized among the files.
Daylight Savings
During daylight savings, the system time is set back by one hour in relevant time zones. At this point, data collection stops for an hour until the system time synchronizes with the timestamp of the last logged record.
When daylight savings is turned off, the system time advances by one hour, and therefore, the timestamp of the next logged record advances by an hour. This introduces a one-hour gap after the last logged record even though data collection does not stop.
Changing System Time Manually
When the system time is set back manually, data collection stops and commands (like perfstat) do not work. These utilities hang when the system time is set back. To continue logging data and to get responses from all commands, perform the following steps:
1 Run the following command:
ovc -stop coda
2 Back up the coda.* files in the <DataDir>\datafiles\ directory and remove them.
3 Run the following command:
ovc -start coda
Effective Data Collection Management
Efficient analysis of performance depends on how easy it is to access the performance data you collect. This section discusses effective strategies for activities such as managing log files, data archiving, and system analysis to make the data collection process easier, more effective, and more useful.
Controlling Disk Space Used by Log Files
Performance Collection Component provides for automatic management of the log files it creates. You can configure this automatic process or use alternate manual processes for special purposes. The automatic log file management process works as follows:
The SEM_KEY_PATH entry in the ttd.conf configuration file is used for generating IPC keys for the semaphores used in ttd and the midaemon process on UNIX platforms. The default value used is /var/opt/perf/datafiles.You can change the value of SEM_KEY_PATH if midaemon or ttd does not respond because of sem id collisions.
Managing Data Collection 43
• Each log file has a configured maximum size. Default maximum sizes are provided when the Performance Collection Component is first installed. However, you can reconfigure these values.
• As each log file reaches its maximum size, a “roll back” is performed at mainttime by the scope data collector. During this roll back, the oldest 25 percent of the data in the log file is removed to make room for new data to be added.
Automatic log file maintenance is similar, but not identical, for data collected by scope and by the DSI logging process. For more information on DSI log file maintenance, see Overview of Data Source Integration on page 259.
Setting mainttime
Normally, scope will only perform log file roll backs at a specific time each day. This is to ensure that the operation is performed at off peak hours and does not impact normal system usage. The time the log files are examined for roll back is set by the mainttime parameter in the parm file.
Setting the Maximum Log File Size
Choosing a maximum log file size should be a balance between how much disk space is used and how much historical data is available for immediate analysis. Smaller log file sizes save disk space, but limit how much time can be graphed by tools such as Performance Manager. Some ways to reconfigure the scope log file sizes are discussed below.
scope logs different types of data into their own log files. This is to allow you to choose how much disk space you want to dedicate to each type independently. For example, global data is fairly compact, but you will often want to go back and graph data for a month at a time. This allows a good statistical base for trending and capacity planning exercises.
Process data can consume more disk space than global data because it is possible to have many interesting processes every minute. Also, the time-value of process data is not as high as for global data. It may be very important to know details about which process was running today and yesterday. You might occasionally need to know which processes were running last week. However, it is unlikely that knowing exactly which processes were run last month would be helpful.
A typical user might decide to keep the following data online:
• Three months of global data for trending purposes
• One month of process data for troubleshooting
• Three months of application data for trending and load balancing
• Two months of device data for disk load balancing
You can edit the parm file to set the size parameters for each different log file. The sizes are specified in megabytes. For example:
SIZE GLOBAL=10.0 PROCESS=30.0 APPLICATION=20.0 DEVICE=5.0
The number of megabytes required to hold a given number of days of data can vary by data type, system configuration, and system activity. The best way to determine how big to make the log files on your system is to collect data for a week or so, then use the utility program's resize command to change your log file size. The resize command scans the log files and determines how much data is being logged each day. It then converts from days to megabytes for you. This function also updates the parm file.
44 Chapter 2
Managing Your Resizing Processes
No additional activities are required once automatic log file maintenance is set up. As log files reach their configured maximum sizes, they will automatically be resized by scope.
scope rolls back log files at the mainttime specified in the parm file. If you edit the parm file and restart scope, the log files will not be rolled to the new sizes until the mainttime occurs. It is important to have scope running at the specified mainttime time or log files may never be rolled back.
Log files may exceed their configured maximum size during the time between maintenance times without causing an immediate roll back.
A log file will never be resized so that it holds less than one full day’s data. That means that the log file will be allowed to grow to hold at least one day's worth of data before it is rolled back. Normally this is not an issue, but if you set the parm file parameters to collect a large volume of process or application data or set the size to be too small, this can result in a log file significantly exceeding its configured maximum size before it is rolled back.
The scope checks the available disk space on the file system where the log files reside, periodically at intervals specified in the parm file for global data collection. If the available disk space falls below one megabyte, scope takes steps to ensure that it does not use any more available space by doing the following:
• Immediately performs the log file maintenance without waiting for the regular log file maintenance time. If any log files exceed their maximum sizes (and have more than one day's worth of data in them), they will be rolled back.
• If, following the log file maintenance, the available disk space is still not greater than one megabyte, scope writes an appropriate error message to its status.scope file and stops collecting data.
Data Archiving
Automatic log file management keeps the latest log file data available for analysis. Data from the raw log files are archived. Process data and global data are logged periodically at intervals specified in the parm file. For more information, see Configure Data Logging Intervals on page 39. To make room for new data, older data is removed when the log files reach their maximum sizes. If you want to maintain log file data for longer periods of time, you should institute a data archiving process. The exact process you choose depends on your needs. Here are a few possibilities:
• Size the raw log files to be very large and let automatic log file maintenance do the rest. This is the easiest archiving method, but it can consume large amounts of disk space after several months.
• Extract the data from the raw log files into extracted archive files before it is removed from the raw log files. Formulate a procedure for copying the archive files to long term storage such as tape until needed.
• Extract only a subset of the raw log files into extracted archive files. For example, you may not want to archive process data due to its high volume and low time-value.
• Some combination of the preceding techniques can be used.
We recommend the following procedures for data archiving:
• Size the raw log files to accommodate the amount of detail data you want to keep online.
• Once a week, copy the detailed raw data into files that will be moved to offline storage.
Managing Data Collection 45

Managing Your Archiving Processes
Resize your raw log files as described in the preceding section. Choose log file sizes that will hold at least two week’s worth of data (assuming the archival processing will only be done once a week).
Once a week, schedule a process that runs the extract program. The following example shows a script that would perform the weekly processing:
#extract -gapdt -xm
Each week during the month the data will be appended to the prior week's data. When a new month starts, extract creates a new archive log file and splits that week's data into the appropriate monthly archive log file. The log files are named rxmo followed by four digits for the year and two more digits for the month. (For example, data for December 1999 would be available in a file named rxmo199912.)
At the beginning of each month the previous month’s log file is completed and a new log file is started. Therefore, whenever more than one rxmo log file is present, it is safe to copy all but the latest one to offline storage until it is needed. When you need to access archived data, restore the desired archival file and access it using the extract or utility programs.
Depending on your system configuration and activity levels, the amount of disk space accumulated in one month may be large. If this is the case, you can break the detail archive file into smaller files by substituting the weekly command -xw in place of -xm as shown in the example.
Another alternative is to choose not to archive the detailed process data.
The detailed extraction discussed in the previous example preserves all of your collected performance data. If ever you need to investigate a situation in depth, these files can be restored to disk and analyzed.
You can use the extract program to combine data from multiple extracted files or to make a subset of the data for easier transport and analysis.
For example, you can combine data from several yearly extracted files in order to do multiple-year trending analysis.
Moving log files that were created on an HP Operations agent node to a system using an older version of the HP Performance Agent is not supported.
46 Chapter 2
3 Working with the HP Operations Agent
After configuring the data collection mechanism, if you want to use the agent in conjunction with HPOM, you can use different components of the Operations Monitoring Component by deploying HPOM policies on the node. For example, if you deploy a measurement threshold policy, the monitor agent component starts operating. Although you can provide most of the monitoring details in the HPOM policies, some components might still require additional configuration to be performed on the node.
Configuring the Monitor Agent
You can start and configure the monitor agent to monitor different sources. When you deploy a measurement threshold policy on a node, the monitor agent component starts operating. Based on the specification in the policies, the agent starts monitoring objects from the following types of sources:
• External: An external program that can send numeric values to the agent.
• Embedded Performance Component: The data available in the agent’s data store.
• MIB: Entries in the Management Information Base (MIB).
• Real Time Performance Management: Windows performance logs and alerts.
• Program: An external program that is started by HPOM and sends numeric values to the agent.
• WMI: The WMI database.
To use HPOM policies to monitor the objects from the above sources, see the following topics:
47
• For HPOM for Windows: The Event Policy Editors section in the HPOM for Windows Online Help.
• For HPOM on UNIX/Linux: The Implementing Message Policies section in the HPOM for UNIX 9.10 Concepts Guide.
Configure the Agent to Monitor MIB Objects
After you deploy the measurement threshold policies (with the Source type set to MIB) on the node, the monitor agent starts querying the MIB objects that can be accessed with the public community string. If you want to configure the monitor agent to use a non-default community string, follow these steps:
1 Log on to the node with the root or administrative privileges.
2 Go to the command prompt (shell).
3 Go to the following directory:
Windows:
%ovinstalldir%bin
HP-UX, Solaris, or Linux:
/opt/OV/bin
AIX:
/usr/lpp/OV/bin
4 Run the following command:
• To use a non-default community string:
ovconfchg -ns eaagt SNMP_COMMUNITY <community_string>
In this instance, <community_string> is the non-default community string of your choice.
• To use different community strings:
ovconfchg -ns eaagt SNMP_COMMUNITY_LIST <list_of_community_strings>
In this instance, <list_of_community_strings> is a comma-separated list of community strings of your choice. The HP Operations agent processes the list of community strings in the order you specified them with the above command.
48 Chapter 3

For example:
ovconfchg -ns eaagt SNMP_COMMUNITY_LIST “C1,C2,C3”
The HP Operations agent first tries to establish an SNMP session with the nodes and attempts to perform an SNMP Get operation for the OIDs using the community string C1. If the operation is not successful, the HP Operations agent performs the same operation with the community string C2, and so on.
Monitor Child OIDs
While creating a MIB measurement threshold policy, you must set the MIB ID field to the OID of a MIB object that you want to monitor. If you want to monitor the underlying child OIDs of the object, type the OID in the MIB ID field in the following format:
<parent_OID>.*
For example, if you want to monitor all the child OIDs of the object .1.3.6.1.2.1.2.2.1, you must specify .1.3.6.1.2.1.2.2.1.* in the MIB ID field.
You can also specify the position of the name or description of the child instances in the following format:
<parent_OID>.*:<n>
In this instance, <n> is the position of the name or description of the child instances.
For example, if you want to monitor all the child OIDs of the object .1.3.6.1.2.1.2.2.1 that are described by the second element in the MIB subtree for .1.3.6.1.2.1.2.2.1, you must specify .1.3.6.1.2.1.2.2.1.*:2 in the MIB ID field.
If the HP Operations agent fails to use all the community strings specified with SNMP_COMMUNITY_LIST, it tries to use the community string specified with SNMP_COMMUNITY. If the agent fails to get data with all the specified community string, it starts using the default community string public.
Working with the HP Operations Agent 49

Persistence of Monitored Object
This version of the HP Operations agent periodically stores the values of monitored objects and session variables to preserve the values in the event of an interruption or failure. However, you can configure the agent to not preserve the values of monitored objects and session variables.
To configure the agent to not preserve the monitored values, follow these steps:
1 Log on to the node with the necessary privileges.
2 In the command prompt, run the following command:
ovconfchg -ns eaagt set OPC_MON_SAVE_STATE FALSE
From now on, the agent stops preserving the values of monitored objects and session variables.
Configuring the Event Interceptor
By default, the event interceptor can collect SNMP traps originating from remote management stations or SNMP-enabled devices, and then can generate appropriate events based on the configuration. You can modify the default behavior of the event interceptor by configuring the following properties:
• SNMP_TRAP_PORT: The default port is 162. You can modify this value to any available port on the HP Operations agent node.
• SNMP_TRAP_FORWARD_DEST_LIST: With this property, you can set the address of the remote management station where you want to forward all the available SNMP traps. You can specify multiple system names (with port details) separated by commas.
• SNMP_TRAP_FORWARD_ENABLE: By default, this property is set to FALSE. By setting this property to TRUE, you can enable the event interceptor to forward the SNMP traps available on the HP Operations agent node to remote machines or management stations.
50 Chapter 3

• SNMP_TRAP_FORWARD_COMMUNITY: With this property, you can specify the community string of the source machines of the incoming traps and the target machine where you want to forward the SNMP traps. The community strings of the source machines must match with the community strings of the target machines.
• SNMP_TRAP_FORWARD_FILTER: With this property, you can filter the available SNMP traps by their OIDs and forward only select traps to the remote machine. The filtering mechanism takes effect with the wildcard (*) character. For example, if you set this property to 1.2.3.*.*.*, the event interceptor will forward all the SNMP traps with the OIDs that begin with 1.2.3. By default, all the available traps are forwarded when you enable the event interceptor to forward traps.
To modify the default behavior of the event interceptor, follow these steps:
1 Log on to the node with the necessary privileges.
2 In the command prompt, run the following commands:
• To modify the port number, run the following command:
ovconfchg -ns eaagt set SNMP_TRAP_PORT <port_number>
You must specify an integer value for <port_number>. Make sure the specified <port_number> is available for use.
• To enable the event interceptor to forward SNMP traps to remote machines, run the following command:
ovconfchg -ns eaagt set SNMP_TRAP_FORWARD_ENABLE TRUE
• If you enable the event interceptor to forward SNMP traps to a remote machine, run the following command to specify the details of the target machine:
ovconfchg -ns eaagt set SNMP_TRAP_FORWARD_DEST_LIST ”<machinename>:<port>”
<machinename> is the fully-qualified domain name of the machine where you want to forward the SNMP traps and <port> is the HTTPS port for the machine. If you want to specify multiple targets, separate the machine details with commas.
If the community string of the source machines do not match with the community string of the target machines, the trap forwarding function fails.
Working with the HP Operations Agent 51

• If you want to forward only select SNMP traps available on the node to the remote machine, run the following command:
ovconfchg -ns eaagt set SNMP_TRAP_FORWARD_FILTER ”<OID Filter>”
<OID Filter> is an OID with the wildcard characters. The event interceptor filters the traps that match the specified OID (with the wildcard characters) from the available traps, and then forwards them to the target machine.
Configuring the RTMA Component
The Real-Time Metric Access (RTMA) component provides you with real-time access to system performance metrics, locally or remotely. The perfd process, which is a part of the RTMA component, starts running on the node with the default configuration after you install the HP Operations agent. You can modify the configuration settings of the perfd process from the perfd.ini file, which is available into the following directory on the node:
• On Windows: %ovdatadir%
• On UNIX (and Linux): /var/opt/perf
Parameter Description Default Value
interval The frequency of data collection in seconds. This value must be a multiple or factor of 60.
10
port The port used by perfd. 5227
depth The time duration for which global metric values are retained in the perfd cache. This data is used for data summarization.
30
52 Chapter 3
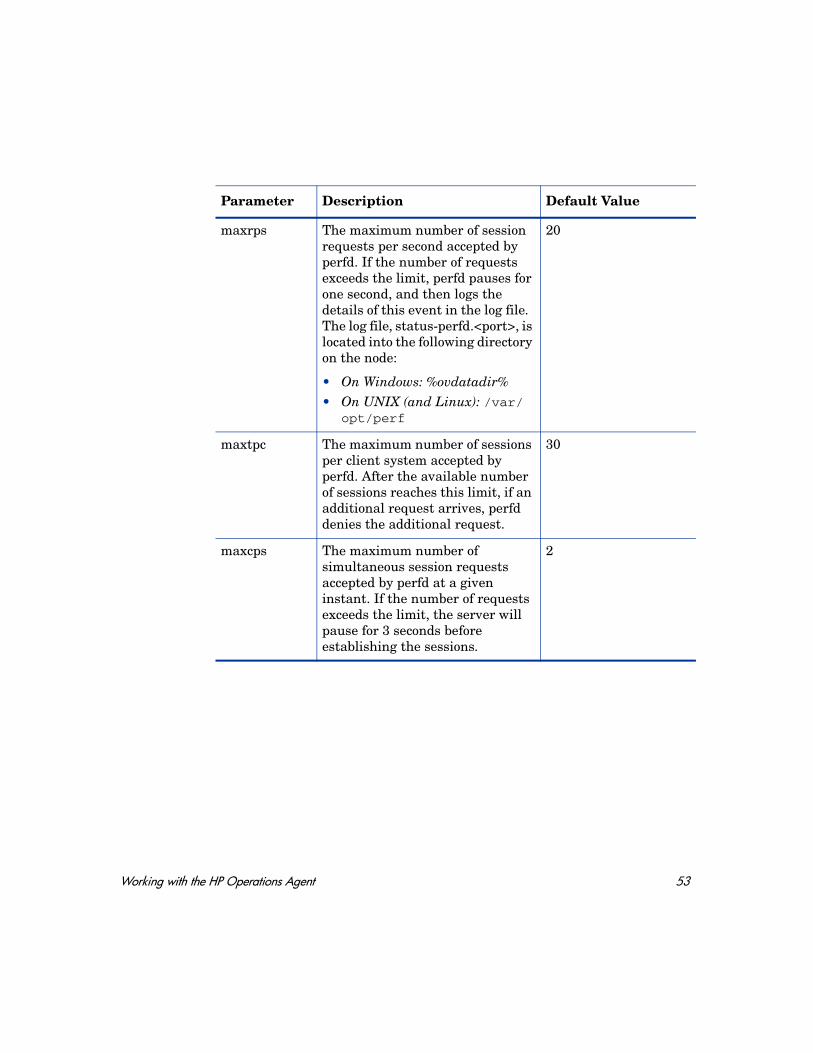
maxrps The maximum number of session requests per second accepted by perfd. If the number of requests exceeds the limit, perfd pauses for one second, and then logs the details of this event in the log file. The log file, status-perfd.<port>, is located into the following directory on the node:
• On Windows: %ovdatadir%• On UNIX (and Linux): /var/
opt/perf
20
maxtpc The maximum number of sessions per client system accepted by perfd. After the available number of sessions reaches this limit, if an additional request arrives, perfd denies the additional request.
30
maxcps The maximum number of simultaneous session requests accepted by perfd at a given instant. If the number of requests exceeds the limit, the server will pause for 3 seconds before establishing the sessions.
2
Parameter Description Default Value
Working with the HP Operations Agent 53
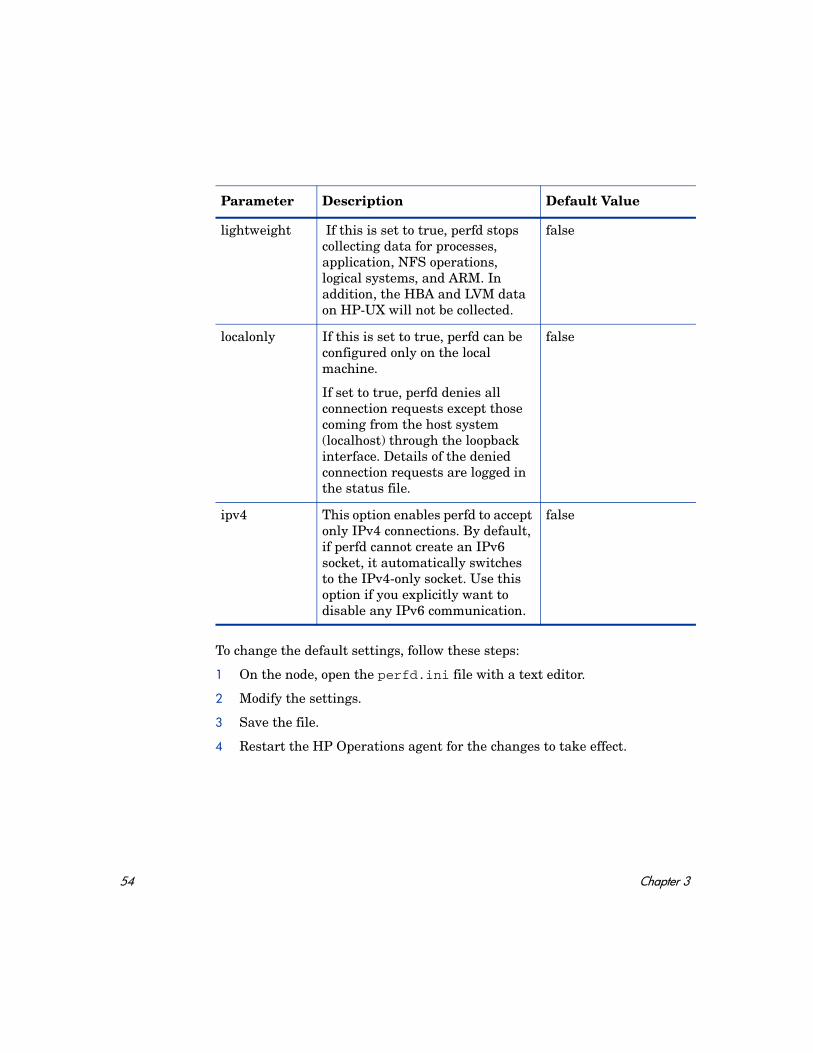
To change the default settings, follow these steps:
1 On the node, open the perfd.ini file with a text editor.
2 Modify the settings.
3 Save the file.
4 Restart the HP Operations agent for the changes to take effect.
lightweight If this is set to true, perfd stops collecting data for processes, application, NFS operations, logical systems, and ARM. In addition, the HBA and LVM data on HP-UX will not be collected.
false
localonly If this is set to true, perfd can be configured only on the local machine.
If set to true, perfd denies all connection requests except those coming from the host system (localhost) through the loopback interface. Details of the denied connection requests are logged in the status file.
false
ipv4 This option enables perfd to accept only IPv4 connections. By default, if perfd cannot create an IPv6 socket, it automatically switches to the IPv4-only socket. Use this option if you explicitly want to disable any IPv6 communication.
false
Parameter Description Default Value
54 Chapter 3

Configuring the Agent User
The HP Operations agent, after installation, starts running with the Local System account on Windows nodes and with the root account on the UNIX/Linux nodes. You can, however, configure the agent to run with a non-default account.
The agent starts automatic or operator-initiated commands under the user account that the agent itself is currently running under. However, you can configure the agent to start commands under a different user account.
Change the Default User on Windows
The agent user that you want to use on Windows must satisfy the following requirements:
• User rights to run the agent:
— Log on as a service
— Manage auditing and security log
• User rights to manage the node:
— Shut down the system
This enables the agent to shut down the system (for example, when a user starts the shutdown tool in the console).
— Debug programs
This enables the agent to collect information about processes, and to kill processes (for example, when a user starts the list processes or kill process tool in the console).
Although the Operations Monitoring Component can run under a non-root or non-privileged user, the Performance Collection Component must always run under a root or administrative user. If you configure the HP Operations agent to run under a user that does not have the root or administrative privileges, you will not be able to use the Performance Collection Component, and most importantly, you will not be able to collect any system performance data.
Working with the HP Operations Agent 55

• User rights to allow the agent to start commands and tools as a user other than the agent user:
— Act as part of the operating system.
— Adjust memory quotas for a process (also called Increase quotas in some versions of Windows)
— Replace a process-level token.
• Permissions for registry entries:
— HKEY_LOCAL_MACHINE/Software/Hewlett-Packard/OpenView
The user must have full control for this registry key and all child objects.
— HKEY_LOCAL_MACHINE/Software/Microsoft/WindowsNT/CurrentVersion/Perflib
The user must have permission to read this registry key for the agent to access performance data.
You may need to assign additional rights for the management tasks that you need to perform. For example:
• If you want be able to monitor a log file using a policy, the agent user must have permission to read that log file.
• If you want to be able to start a program using an automatic command, operator-initiated command, tool, or scheduled task, the agent user must have permission to start that program.
Additionally, you must set the parameter OPC_PROC_ALWAYS_INTERACTIVE=NEVER in the eaagt namespace. You can configure this parameter in the agent installation defaults or using ovconfchg or ovconfpar at a command prompt. After you set this parameter, processes that the agent starts do not have access to the default desktop. This setting applies to logfile encapsulator pre-processing and scripts that the monitor agent invokes.
• Some Smart Plug-ins may require additional configuration or user rights when the agent runs under a user account that does not have administrative rights. For more details, see the documentation for individual Smart Plug-ins.
To change the default agent user on Windows, follow these steps:
1 Optional. Create a new user for the agent to run under.
56 Chapter 3
2 Optional. Create a new group, and add the user as a member of this group.
3 On the node, open a command prompt, and type the following command:
cscript "%OvInstallDir%bin\ovswitchuser.vbs"-existinguser <DOMAIN\USER> -existinggroup <GROUP> -passwd <PASSWORD>
In this instance:
<DOMAIN\USER> is the domain and user name.
<GROUP> is the name of the group that the user belongs to, for example AgentGroup.
<PASSWORD> is the user’s password.
4 To restart the agent, run the following commands:
a ovc -kill
b ovc -start
The control service and agent processes now run as the user that you specified.
Configure the Agent User to Start or Stop Services and Processes
During its course of operation, the agent might need to start or stop services and processes (including agent’s own processes). You must configure the user, which has been configured to run the agent, to obtain the privileges to start or stop services and processes.
If you want the agent user to start or stop services on the Windows node, follow these steps:
1 Log on to the node with the administrative privileges.
2 Go to the directory %ovinstalldir%lbin\xpl.
3 Run the following command:
The command assigns the user rights required for basic agent functionality at group level, not to the individual user. Therefore, take care when you select the group to use. It is advisable to create a new group specifically for the agent user, and add the agent user as a member.
Working with the HP Operations Agent 57
ovsetscmpermissions.vbs -user <agent_user> -f
4 Restart the agent by running the following command:
• ovc -kill
• ovc -start
Change the Default User on UNIX/Linux
By default on nodes with a UNIX or Linux operating system, the agent runs under the root account. However, you can configure the agent to run under a different user account. For example, you may want the agent to run under an account with fewer permissions than the root account. Alternatively, you may want the agent to run under an account that has permission to access remote systems over the network.
You must test whether the user account has appropriate rights to run the agent and manage the node correctly. You may need to assign additional rights for the management tasks that you need to perform. For example:
• If you want to be able to monitor a log file using a policy, the agent user must have permission to read that log file.
• If you want to be able to start a program using an automatic command, operator-initiated command, tool, or scheduled task, the agent user must have permission to start that program.
• Some Smart Plug-ins may require additional configuration or user rights when the agent runs under an alternative user. For more details, see the documentation for individual Smart Plug-ins.
To change the default user on UNIX/Linux, follow these steps:
1 Optional. Create a new user for the agent to run under.
2 Optional. Create a new group, and then add the user as a member of this group.
3 On the node, log on as root and open a shell prompt.
4 Go to the following directory:
On HP-UX, Linux, or Solaris
/opt/OV/bin
On AIX
58 Chapter 3
/usr/lpp/OV/bin
5 Stop the agent by running the following command:
ovc -kill
6 Change the agent user by running the following command:
ovswitchuser.sh -existinguser <USER> -existinggroup <GROUP>
In this instance:
<USER> is the name of the user that the agent runs under.
<GROUP> is the name of the group that the user belongs to, for example AgentGroup. The command gives this group full control of all files in the agent data directory, and also full control of all installed packages. If you previously started the command and specified a different group, the command removes control of the files for the previous group.
The group ID flag is set on the agent's data directories. This flag means that the group that you specify will also own any new files and subdirectories in the agent's base directories.
7 The HP Operations agent includes communication brokers that listen for inbound connections from management servers on port 383 by default. However, on UNIX and Linux nodes, non-root users cannot open ports in the range 0 to 1023. Therefore, you must configure the communication broker on the node to listen on a different port (above 1023). You must also configure the management servers that connect to the node, so that their outbound connections are destined for the correct port.
You must configure communication broker ports by setting the PORTS parameter in the bbc.cb.ports name space. You can configure this parameter in the following ways:
• Configure the values in the agent installation defaults. This is recommended if you need to configure communication broker ports for large numbers of nodes. You must plan and configure the installation defaults before you create or migrate your nodes.
The command assigns the user rights required for basic agent functionality at group level, not to the individual user. Therefore, take care when you select the group to use. It is advisable to create a new group specifically for the agent user, and add the agent user as a member.
Working with the HP Operations Agent 59
• Use ovconfchg or ovconfpar at a command prompt.
The value must contain one or more host names or IP addresses and have the following format:
<host>:<port>[,<host>:<port>] ...
For example, to configure the communication broker port to 5000 on a node with the host name node1.emea.example.com, use the following command on the node itself, and also any management servers that open connections to it:
ovconfchg -ns bbc.cb.ports -set PORTS node1.domain.example.com:5000
8 To start the agent, run the following commands:
a su <USER>
b ovc -start
The control service and agent processes now run as the user that you specified.
Change the Default User for Commands
By default, the agent starts automatic or operator-initiated commands under the user account that the agent itself is currently running under. However, you can configure an HP Operations agent to start commands under a different user account. You do this by setting the OVO_STD_USER parameter in the eaagt name space on the nodes. You can configure this parameter in the following ways:
• Configure the values in the HP Operations agent installation defaults. This is recommended if you need to configure the user for large numbers of nodes. You must plan and configure the installation defaults before you create or migrate your nodes.
• Use ovconfchg or ovconfpar at a command prompt.
Specify the value of OVO_STD_USER in the format <user>/|<encrypted password>
• Replace <user> with the name of the user. For a domain user, specify the domain and user name, for example, EXAMPLE\AgentUser. For a local user, specify just the name, for example AgentUser.
60 Chapter 3

• Replace <encrypted password> with output from the command opcpwcrpt <password>. You can start this command from a command prompt on the management server.
It is also possible to use the OVO_STD_USER when you configure or launch a tool. Specify the user name $OVO_STD_USER and leave the password blank.
You must test whether the user account has appropriate rights to run commands and tools correctly.
If the agent fails to start a command or tool as the OVO_STD_USER, the agent may start the command or tool under the same user account that the agent is currently running under. This can happen, for example, if you specify an incorrect user or password.
Working with the HP Operations Agent 61

62 Chapter 3

4 Using the Utility Program
The utility program is a tool for managing and reporting information on log files, the collection parameters (parm) file, and the alarm definitions (alarmdef) file. You can use the utility program interactively or in batch mode to perform the following tasks.
• Scan raw or extracted log files and produce a report showing:
— dates and times covered
— times when the scope collector was not running
— changes in scope parameter settings
— changes in system configuration
— log file disk space
— effects of application and process settings in the collection parameters (parm) file
• Resize raw log files
• Check the parm file for syntax warnings or errors
• Check the alarmdef file for syntax warnings or errors
• Process log file data against alarm definitions to detect alarm conditions in historical data
This chapter covers the following topics:
• Running the Utility Program
• Using Interactive Mode
• using the Utility Command Line Interface
• Utility Scan Report Details
Detailed descriptions of the utility program’s commands are in Chapter 5, Utility Commands.
Running the Utility Program
There are three ways to run the utility program:
• Command line mode - You control the utility program using command options and arguments in the command line.
• Interactive mode - You supply interactive commands and parameters while executing the program with stdin set to an interactive terminal or workstation. If you are an experienced user, you can quickly specify only those commands required for a given task. If you are a new user, you may want to use the utility program’s guide command to get some assistance in using the commands. In guided mode, you are asked to
63
select from a list of options to perform a task. While in guided mode, the interactive commands that accomplish each task are listed as they are executed, so you can see how they are used. You can quit and re-enter guided mode at any time.
• Batch mode - You can run the program and redirect stdin to a file that contains interactive commands and parameters.
The syntax for the command line interface is similar to typical UNIX command line interfaces on other programs and is described in detail in this chapter.
For interactive and batch mode the command syntax is the same. Commands can be entered in any order; if a command has a parameter associated with it, the parameter must be entered immediately after the corresponding command.
There are two types of parameters - required (for which there are no defaults) and optional (for which defaults are provided). How utility handles these parameters depends on the mode in which it is running.
• In interactive mode, if an optional parameter is missing, the program displays the default argument and lets you either confirm it or override it. If a required parameter is missing, the program prompts you to enter the argument.
• In batch mode, if an optional parameter is missing, the program uses the default values. If a required parameter is missing, the program terminates.
Errors and missing data are handled differently for interactive mode than for command line and batch mode. You can supply additional data or correct mistakes in interactive mode, but not in command line and batch mode.
Using Interactive Mode
Using the utility program’s interactive mode requires you to issue a series of commands to execute a specific task.
For example, if you want to check a log file to see if alarm conditions exist in data that was logged during the current day, you issue the following commands after invoking the utility program:
checkdef /var/opt/perf/alarmdefdetail offstart today-1analyze
The checkdef command checks the alarm definitions syntax in the alarmdef file and then sets and saves the file name for use with the analyze command. The detail off command causes the analyze command to show only a summary of alarms. The start today-1 command specifies that only data logged yesterday is to be analyzed. The analyze command analyzes the raw log files in the default SCOPE data source against the alarmdef file.
Example of Using Interactive and Batch Mode
The following example shows the differences between how the utility program’s resize command works in batch mode and in interactive mode.
The resize command lets you set parameters for the following functions:
• Type of log file to be resized.
64 Chapter 4

• Size of the new file.
• Amount of empty space to be left in the file.
• An action specifying whether or not the resize is to be performed.
This example of the resize command resizes the global log file so that it contains a maximum of 120 days of data with empty space equal to 45 days. The command and its parameters are:
resize global days=120 empty=45 yes
The results are the same whether you enter this command interactively or from a batch job.
The first parameter–global–indicates the log file to be resized. If you do not supply this parameter, the consequent action for interactive and batch users would be the following:
• Batch users — the batch job would terminate because the logfile parameter has no default.
• Interactive users — you would be prompted to choose which type of log file to resize to complete the command.
The last parameter–yes–indicates that resizing will be performed unconditionally.
If you do not supply the yes parameter, the consequent action for interactive and batch users would be the following:
• Batch users — resizing would continue since yes is the default action.
• Interactive users — you would be prompted to supply the action before resizing takes place.
Utility Command Line Interface
In addition to the interactive and batch mode command syntax, command options and their associated arguments can be passed to the utility program through the command line interface. The command line interface fits into the typical UNIX environment by allowing the utility program to be easily invoked by shell scripts and allowing its input and output to be redirected to UNIX pipes.
For example, to use the command line equivalent of the example shown in the previous section "Using Interactive Mode" enter:
utility -xr global days=120 empty=45 yes
Command line options and arguments are listed in the following table. The referenced command descriptions can be found in Chapter 5, Utility Commands.
Before using the resize command in either batch mode or interactive mode, you must first stop data collection. For details, see Stopping and Restarting Data Collection on page 41 in Chapter 2.
Using the Utility Program 65
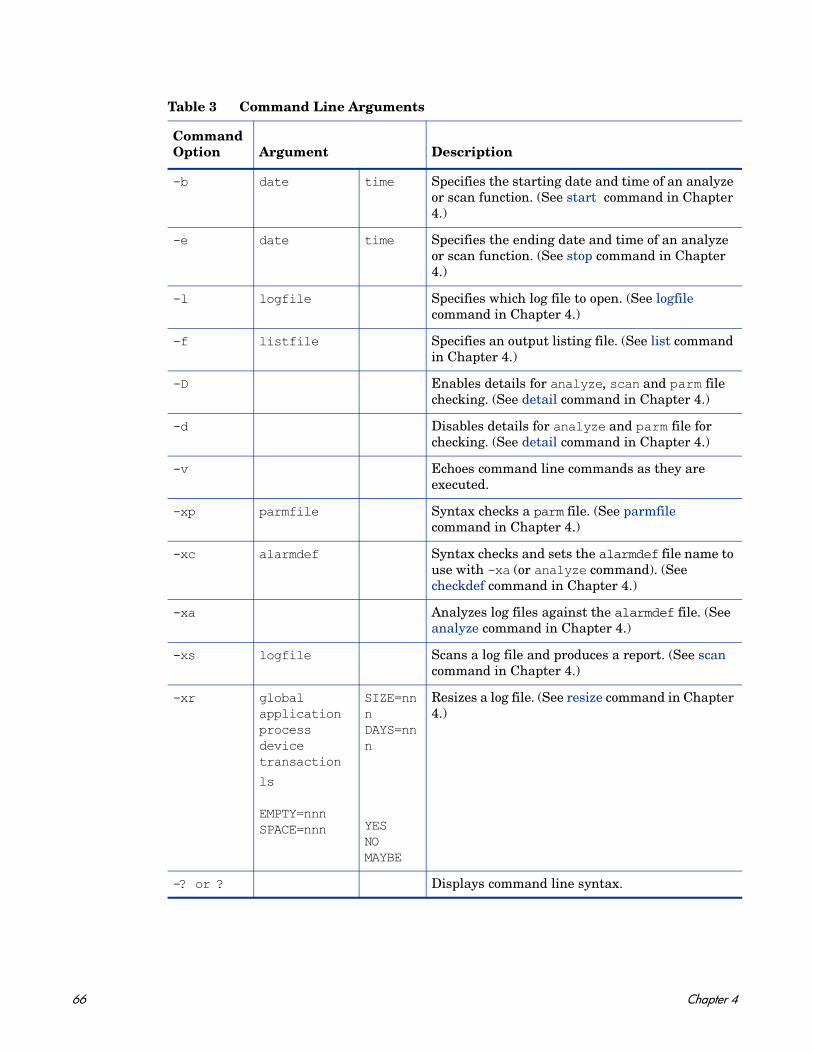
Table 3 Command Line Arguments
Command Option Argument Description
-b date time Specifies the starting date and time of an analyze or scan function. (See start command in Chapter 4.)
-e date time Specifies the ending date and time of an analyze or scan function. (See stop command in Chapter 4.)
-l logfile Specifies which log file to open. (See logfile command in Chapter 4.)
-f listfile Specifies an output listing file. (See list command in Chapter 4.)
-D Enables details for analyze, scan and parm file checking. (See detail command in Chapter 4.)
-d Disables details for analyze and parm file for checking. (See detail command in Chapter 4.)
-v Echoes command line commands as they are executed.
-xp parmfile Syntax checks a parm file. (See parmfile command in Chapter 4.)
-xc alarmdef Syntax checks and sets the alarmdef file name to use with -xa (or analyze command). (See checkdef command in Chapter 4.)
-xa Analyzes log files against the alarmdef file. (See analyze command in Chapter 4.)
-xs logfile Scans a log file and produces a report. (See scan command in Chapter 4.)
-xr globalapplicationprocessdevicetransaction
ls
EMPTY=nnnSPACE=nnn
SIZE=nnnDAYS=nnn
YESNOMAYBE
Resizes a log file. (See resize command in Chapter 4.)
-? or ? Displays command line syntax.
66 Chapter 4

Example of Using the Command Line Interface
The following situation applies when you enter command options and arguments on the command line:
Errors and missing data are handled exactly as in the corresponding batch mode command. That is, missing data is defaulted if possible and all errors cause the program to terminate immediately.
Echoing of commands and command results is disabled. Utility does not read from its stdin file. It terminates following the actions in the command line.
utility -xp -d -xs
Which translates into:
Utility Scan Report Details
The utility program's scan command reads a log file and writes a report on its contents. The report's contents depend on the commands issued prior to issuing the scan command. (For more information, see the description of the scan command in Chapter 5, Utility Commands.
The following table summarizes the information contained in all scan reports and in reports that are produced only when the detail on command is used (the default) with the scan command
-xp Syntax checks the default parm file.
-d Disables details in the scan report.
-xs Performs the scan operation. No log file was specified so the default log file is scanned.
Table 4 Information Contained in Scan Report
Initial Values
Initial parm file global information and system configuration information
Printed only if detail on is specified.
Initial parm file application definitions Printed only if detail on is specified.
Chronological Detail
parm file global changes Printed only if detail on is specified.
parm file application changes Printed only if detail on is specified.
Collector off-time notifications Printed only if detail on is specified.
Application-specific summary reports Printed only if detail on is specified.
Using the Utility Program 67

Scan Report Information
The information in a utility scan report is divided into three types:
• Initial values
• Chronological details
• Summaries
Initial Values
This section describes the following initial values:
• Initial parm file global information
• Initial parm file application definitions
Initial Parm File Global Information
To obtain this report, use the scan command with its default detail on.
This report lists the configuration settings of the parm file at the time of the earliest global record in the log file. Later global information change notifications are based on the values in this report. If no change notification exists for a particular parameter, it means that the parameter kept its original setting for the duration of the scan.
The following example shows a portion of a report listing the contents of the parm file.
06/03/99 15:28 System ID="Homer"scopeux/UX A.10.00 SAMPLE INTERVAL = 300,300,60 Seconds, Log version=DConfiguration: 9000/855, O/S A.10.00 CPUs=1Logging Global Process records Device= Disk FileSys recordsThresholds: CPU= 10.00%, Disk=10.0/sec, First=5.0 sec, Resp=30.0 sec,
Trans=100 Nonew=FALSE, Nokilled=FALSE, Shortlived=FALSE (<1 sec)HP-UX Parms: Buffer Cache Size = 16384KB, NPROC = 532Wait Thresholds: CPU=100.00%, Memory=100.00%Impede=100.00%Memory: Physical = 84.0 MB, Swap = 124304.0 MB, Available to users = 66.5 MB. There are 2 LAN interfaces: 0, 1.
Summaries
Process summary report Always printed if process data was scanned.
Collector coverage summary Always printed.
Log file contents summary Always printed. Includes space and dates covered.
Log file empty space summary Always printed.
Table 4 Information Contained in Scan Report
68 Chapter 4

06/03/99 15:28 There are 2 disk devices: Disk #1976 = "/dev/hdisk0" Disk #1987 = "/dev/hdisk1"
The date and time listed on the first line correspond to the first date and time in the global log file and indicate when scope was started. Data records may have been rolled out of the global log file so the date and time on this report do not necessarily indicate the first global record in the log file.
Initial Parm File Application Definitions
To obtain this report, use the scan command with its default detail on and have application data in the log file.
This report lists the name and definition of each application at the time the first application record is listed in the log file. Any application addition or deletion notifications you receive are based on this initial list of applications. For example:
06/01/99 08:39 Application(1) = "other"Comment=all processes not in user-defined applications
06/01/99 08:39 Application(2) = "Real_TimeSystem" Priority range = 0-127
06/01/99 08:39 Application(3) = "Prog_Development" File=vi,ed,sed,xdb,ld,lint,cc,ccom,pc,pascomp
Chronological Detail
This section describes the following chronological details:
• parm file global change notifications
• parm file application addition and deletion notifications
• scope off-time notifications
• Application-specific summary report
Parm File Global Change Notifications
To obtain this report, use the scan command with its default detail on.
This report is generated any time a record is found that scope started.
The following example shows the change notifications that occur when two new disk drives are added to the system.
During the scan, you are notified of applications that were added or deleted. Additions and deletions are determined by comparing the spelling and case of the old application names to the new set of logged application names. No attempt is made to detect a change in the definition of an application. If an application with a new name is detected, it is listed along with its new definition.The date and time on this record is the last time scope was started before logging the first application record currently in the log file.
Using the Utility Program 69
03/13/99 17:30 The number of disk drives changed from 9 to 1103/13/99 17:30 New disk device scsi-4 = "c4d0s*"03/13/99 17:30 New disk device scsi-3 = "c3d0s*"
Parm File Application Addition/Deletion Notifications
To obtain this report, use the scan command with its default detail on and have application data in the log file.
User-defined applications can be added or deleted each time scope is started. If an application name is found that does not match the last set of applications, an application addition, deletion, or change notification is printed. If the name of an application has not changed, it is not printed.
The following example shows that a new application was started.
03/13/99 17:30 Application 4 "Accounting_Users_1" was addedUser=ted,rebecca,test*,mark,gene
scope Off-Time Notifications
To obtain this report, use the scan command with its default detail on.
If an extracted file contains only summary information, times are rounded to the nearest hour. For example:
06/03/99 11:00 - 06/03/99 12:34 collector off (01:34:04)
The first date and time (06/03/99 11:00) indicates the last valid data record in the log file before scope was restarted. The second date and time (06/03/99 12:34) indicates when scope was restarted.
The last field (in parentheses) shows how long scope was not running. The format is ddd/hh:mm:ss, where ddd are days and hh:mm:ss are hours, minutes, and seconds. Zeros to the left are deleted.
In this example, scope was off on June 3, 1999 between 11:00 am and 12:34 pm. The summary information shows that data was not collected for one hour, 34 minutes, and four seconds.
Application-Specific Summary Report
To obtain this report, use the scan command with its default detail on and have application data in the log file.
This report can help you define applications. Use the report to identify applications that are accumulating either too many or too few system resources and those that could be consolidated with other applications. Applications that accumulate too many system resources might benefit by being split into multiple applications.
You should define applications in ways that help you make decisions about system performance tuning. It is unlikely that system resources will accumulate evenly across applications.
Application definitions are not checked for changes. They are listed when an application name is changed, but any change to an existing application's definition without an accompanying name change is not detected.
70 Chapter 4

The application-specific summary report is generated whenever the application definitions change to allow you to access the data of the application definitions before and after the change.
A final report is generated for all applications. This report covers only the time since the last report and not the entire time covered by the log file. For example:
PERCENT OF TOTALApplication Records CPU DISK TRANS------------------- --------- ------ ------- ------OTHER 22385 45.7% 20.9% 63.0%Resource_Sharing 7531 6.0% 2.2% 17.1%SPOOLING 13813 2.4% 0.3% 0.0%ON_LINE_COMPILES 13119 2.9% 1.7% 0.1%BATCH_COMPILES 8429 2.9% 0.1% 2.2%ORDER_ENTRY 387 0.1% 0.0% 0.0%ELECTRONIC_MAIL 6251 3.8% 1.3% 9.6%PROGRAM_DEVELOPMENT 3141 9.1% 2.4% 0.6%RESEARCH_DEPARMENT 3968 8.7% 2.0% 6.0%BILL_OF_MATERIALS 336 0.6% 1.5% 0.1%FINANCIALS 1080 5.0% 1.5% 0.5%MARKETING_DEPT 2712 12.9% 67.3% 0.0%GAMES 103 0.1% 0.0% 0.0%-------------------- --------- ------ ------ ------All user applications 73.1% 54.3% 79.1% 37.0%
Summaries
This section describes the following summaries:
• Process log reason summary
• Scan start and stop actual dates and times
• Application overall summary
• scope coverage summary
• Log file contents summary
• Log file empty space summary
Process Log Reason Summary
To obtain this report, you must have process data in the log file.
This report helps you set the interesting process thresholds for scope. The report lists every reason a process might be considered interesting and thus get logged, along with the total number of processes logged that satisfied each condition.
The following example shows a process log reason summary report:
Process Summary Report: 04/13/99 3:32 PM to 05/04/99 6:36 PMThere were 93.8 hours of process dataProcess records were logged for the following reasons:
Log Reason Records Percent Recs/hr--------------- ------- ------- -------New Processes 17619 53.9% 44.7
Using the Utility Program 71

Killed Processes 16047 49.1% 40.7CPU Threshold 3169 9.7% 8.0Disk Threshold 1093 3.3% 2.8
NOTE: A process can be logged for more than one reason at a time. Record counts and percentages will not add up to 100% of the process records.
If the detail on command is issued, this report is generated each time a threshold value is changed so you can evaluate the effects of that change. Each report covers the period since the last report. A final report, generated when the scan is finished, covers the time since the last report.
If the detail off command is issued, only one report is generated covering the entire scanned period.
You can reduce the amount of process data logged by scope by modifying the parm file's threshold parameter and raising the thresholds of the interest reasons that generate the most process log records. To increase the amount of data logged, lower the threshold for the area of interest.
In the previous example, you could decrease the amount of disk space used for the process data (at the expense of having less information logged) by raising the CPU threshold or setting the nonew threshold.
Scan Start and Stop
This summary report is printed if any valid data was scanned. It gives actual dates and times that the scan was started and stopped. For example:
Scan started on 03/03/99 12:40 PMScan stopped on 03/11/99 1:25 PM
Application Overall Summary
To obtain this report, you must have application data in the log file.
This report is an overall indicator of how much system activity is accumulated in user-defined applications, rather than in the other application. If a significant amount of a critical resource is not being captured by user applications, you might consider scanning the process data for processes that can be included in user applications.
For example:
OVERALL, USER DEFINED APPLICATIONS ACCOUNT FOR 82534 OUT OF 112355 RECORDS ( 73.5%) 218.2 OUT OF 619.4 CPU HOURS ( 35.2%) 24.4 OUT OF 31.8 M DISC IOS ( 76.8%) 0.2 OUT OF 0.6 M TRANS ( 27.3%)
Collector Coverage Summary
This report is printed if any valid global or application data was scanned. It indicates how well scope is being used to collect system activity. If the percentage of time scope was off is high, as in the example below, you should review your operational procedures for starting and stopping scope.
The total time covered was 108/16:14:51 out of 128/00:45:02Time lost when collector was off 19/08:30:11 15.12%The scopeux collector was started 45 times
72 Chapter 4

This report will be more complete if global detail data is included in the scan. If only summary data is available, you determine the time scope was stopped and started only to the nearest hour. (An appropriate warning message is printed with the report if this is the case.)
The total time covered is determined by accumulating all the interval times from the logged data.The "out of" time value is calculated by subtracting the starting date and time from the ending date and time. This should represent the total time that could have been logged. The "Time lost when collector was off" value is the total time less the covered time.
The formats for the three times mentioned are:
ddd/hh:mm:ss
where ddd are days and hh:mm:ss are hours, minutes, and seconds.
In the previous example, the total time collected was 108 days, 16 hours, 14 minutes, and 51 seconds.
Log File Contents Summary
The log file contents summary is printed if any valid data was scanned. It includes the log file space and the dates covered. This summary is helpful when you are resizing your log files with the resize command.
--------Total------- -----Each Full Day----- -------Dates-------- FullType Records MBytes Records MBytes Start Finish DaysGlobal 1376 0.27 288.9 0.057 05/23/99 to 05/28/99 4.8Application 6931 0.72 1455.0 0.152 05/23/99 to 05/28/99 4.8Process 7318 1.14 1533.6 0.239 05/23/99 to 05/28/99 4.8Disk 2748 0.07 567.6 0.014 05/23/99 to 05/28/99 4.8Transaction no data foundOverhead 0.29 ----- ------ ------ -----TOTAL 18373 2.49 3845.0 0.461
The columns are described as follows:
Column Explanation
Type The general type of data being logged. One special type, Overhead, exists:Overhead is the amount of disk space occupied (or reserved) by the log file versus the amount actually used by the scanned data records.If less than the entire log file was scanned, Overhead includes the data records that were not scanned. If the entire file was scanned, Overhead accounts for any inefficiencies in blocking the data into the file plus any file-access support structures. It is normal for extracted log files to have a higher overhead than raw log files since they have additional support structures for quicker positioning.
Total The total record count and disk space scanned for each type of data.
Each Full Day
The number of records and amount of disk space used for each 24-hour period that scope runs.
Dates The first and last valid dates for the data records of each data type scanned.
Full Day The number of full (24-hour) days of data scanned for this data type. Full Days may not be equal to the difference between the start and stop dates if scope coverage did not equal 100 percent of the scanned time.
Using the Utility Program 73

The TOTAL line (at the bottom of the listed data) gives you an idea of how much disk space is being used and how much data you can expect to accumulate each day.
Log File Empty Space Summary
This summary is printed for each log file scanned. For example:
The Global file is now 13.9% full with room for 61 more full daysThe Application file is now 15.1% full with room for 56 more full daysThe Process file is now 23.5% full with room for 32 more full daysThe Device file is now 1.4% full with room for 2896 more full days
The amount of room available for more data is calculated based on the following factors:
• The amount of unused space in the file
• The scanned value for the number of megabytes of data being logged on each 24-hour day
If the megabytes-scanned-per-day values appear unrealistically low, they are replaced with default values for this calculation.
If you scan an extracted file, you get a single report line because all data types share the same extracted file.
74 Chapter 4
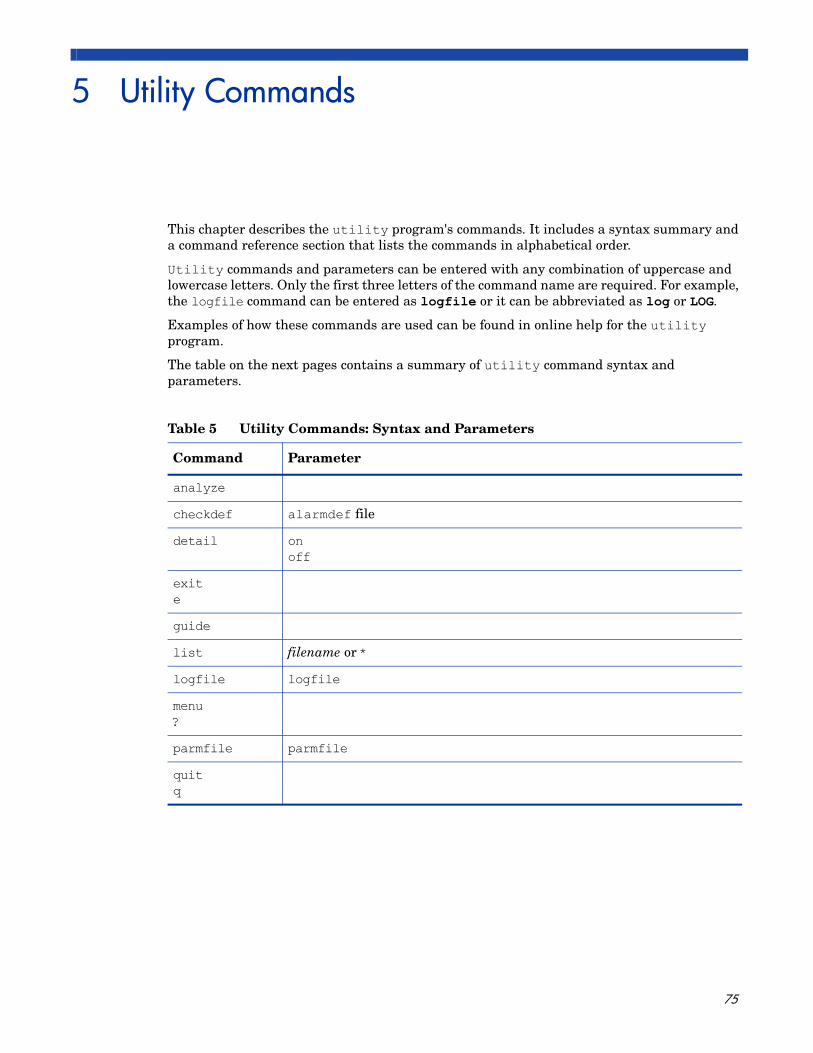
5 Utility Commands
This chapter describes the utility program's commands. It includes a syntax summary and a command reference section that lists the commands in alphabetical order.
Utility commands and parameters can be entered with any combination of uppercase and lowercase letters. Only the first three letters of the command name are required. For example, the logfile command can be entered as logfile or it can be abbreviated as log or LOG.
Examples of how these commands are used can be found in online help for the utility program.
The table on the next pages contains a summary of utility command syntax and parameters.
Table 5 Utility Commands: Syntax and Parameters
Command Parameter
analyze
checkdef alarmdef file
detail onoff
exite
guide
list filename or *
logfile logfile
menu?
parmfile parmfile
quitq
75
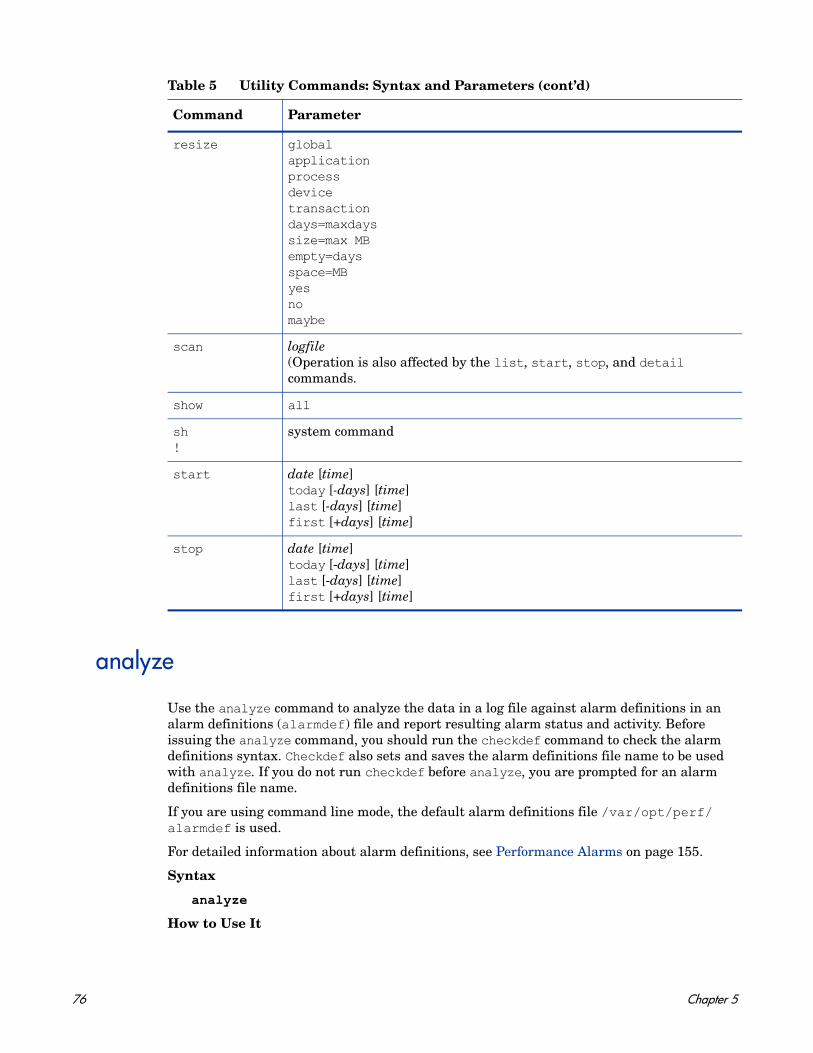
analyze
Use the analyze command to analyze the data in a log file against alarm definitions in an alarm definitions (alarmdef) file and report resulting alarm status and activity. Before issuing the analyze command, you should run the checkdef command to check the alarm definitions syntax. Checkdef also sets and saves the alarm definitions file name to be used with analyze. If you do not run checkdef before analyze, you are prompted for an alarm definitions file name.
If you are using command line mode, the default alarm definitions file /var/opt/perf/alarmdef is used.
For detailed information about alarm definitions, see Performance Alarms on page 155.
Syntax
analyze
How to Use It
resize globalapplicationprocessdevicetransactiondays=maxdayssize=max MBempty=daysspace=MByesnomaybe
scan logfile(Operation is also affected by the list, start, stop, and detail commands.
show all
sh!
system command
start date [time]today [-days] [time]last [-days] [time]first [+days] [time]
stop date [time]today [-days] [time]last [-days] [time]first [+days] [time]
Table 5 Utility Commands: Syntax and Parameters (cont’d)
Command Parameter
76 Chapter 5
When you issue the analyze command, it analyzes the log files specified in the data sources configuration file, datasources, against the alarm definitions in the alarmdef file.
The analyze command allows you to evaluate whether or not your alarm definitions are a good match against the historical data collected on your system. It also lets you decide if your alarm definitions will generate too many or too few alarms on your analysis workstation.
Also, you can perform data analysis with definitions (IF statements) set in the alarm definitions file because you can get information output by PRINT statements when conditions are met. For explanations of how to use the IF and PRINT statements in an alarm definition, see Chapter 9, Performance Alarms.
You can optionally run the start, stop, and detail commands with analyze to customize the analyze process. You specify these commands in the following order:
checkdefstartstopdetailanalyze
Use the start and stop commands if you want to analyze log file data that was collected during a specific period of time. (Descriptions of the start and stop commands appear later in this chapter.)
While the analyze command is executing, it lists alarm events such as alarm start, end, and repeat status plus any text in associated print statements. Also, any text in PRINT statements is listed as conditions (in IF statements) become true. EXEC statements are not executed but are listed so you can see what would have been executed. An alarm summary report shows a count of the number of alarms and the amount of time each alarm was active (on). The count includes alarm starts and repeats, but not alarm ends.
If you want to see the alarm summary report only, issue the detail off command. However, if you are using command line mode, detail off is the default so you need to specify -D to see the alarm events as well as the alarm summary.
Example
The checkdef command checks the alarm definitions syntax in the alarmdef file and saves the name of the alarmdef file for later use with the analyze command. The start today command specifies that only data logged today is to be analyzed. Lastly, the analyze command analyzes the log file in the default SCOPE data source specified in the datasources file against the alarm definitions in the alarmdef file.
utility>checkdef /var/opt/perf/alarmdefstart todayanalyze
To perform the above task using command line arguments, enter:
utility -xc -D -b today -xa
checkdef
Use the checkdef command to check the syntax of the alarm definitions in an alarm definitions file and report any warnings or errors that are found. This command also sets and saves the alarm definitions file name for use with the analyze command.
Utility Commands 77

For descriptions of the alarm definitions syntax and how to specify alarm definitions, see Chapter 9, Performance Alarms.
Syntax
checkdef [/directorypath/alarmdef]
Parameters
How to Use It
When you have determined that the alarm definitions are correct, you can process them against the data in a log file using the analyze command.
In batch mode, if no alarm definitions file is specified, the default alarmdef file is used.
In interactive mode, if no alarm definitions file is specified, you are prompted to specify one.
Example
The checkdef command checks the alarm definitions syntax in the alarmdef file and then saves the name of the alarmdef file for later use with the analyze command.
utility>checkdef /var/opt/perf/alarmdef
To perform the above task using command line arguments, enter:
utility -xc
detail
Use the detail command to control the level of detail printed in the analyze, parmfile, and scan reports.
The default is detail on in interactive and batch modes and detail off in command line mode.
Syntax
Parameters
alarmdef The name of any alarm definitions file. This can be a user-specified file or the default alarmdef file. If no directory path is specified, the current directory will be searched.
detail [on]
[off]
78 Chapter 5

How to Use It
For explanations of how to use the detail command with the analyze, scan, and parmfile commands, see the analyze, parmfile, and scan command descriptions in this chapter.
Examples
For examples of using the detail command, see the descriptions of the analyze, parmfile, and scan commands in this chapter.
exit
Use the exit command to terminate the utility program. The exit command is equivalent to the utility program’s quit command.
Syntax
exite
guide
Use the guide command to enter guided commands mode. The guided command interface leads you through the various utility commands and prompts you to perform the most common tasks that are available.
Syntax
guide
How to Use It
• To enter guided commands mode from utility’s interactive mode, type guide and press Return.
• To accept the default value for a parameter, press Return.
• To terminate guided commands mode and return to interactive mode, type q at the guide> prompt.
This command does not provide all possible combinations of parameter settings. It selects settings that should produce useful results for the majority of users.
on Prints the effective contents of the parm file as well as parm file errors. Prints complete analyze and scan reports.
off In the parm file report, application definitions are not printed. In the scan report, scope collection times, initial parm file global information, and application definitions are not printed. In the analyze report, alarm events and alarm actions are not printed.
Utility Commands 79
help
Use the help command to access the utility program's online help facility.
Syntax
help [keyword]
How to Use It
You can enter parameters to obtain information on utility commands and tasks, or on help itself. You can navigate to different topics by entering a key word. If more than one page of information is available, the display pauses and waits for you to press Return before continuing. Type q or quit to exit the help system and return to the utility program.
You can also request help on a specific topic. For example,
help tasks
or
help resize parmfile
When you use this form of the help command, you receive the help text for the specified topic and remain in the utility command entry context. Because you do not enter the help subsystem interactively, you do not have to type quit before entering the next utility command.
list
Use the list command to specify the output file for all utility reports. The contents of the report depend on which other commands are issued after the list command. For example, using the list command before the logfile, detail on, and scan commands produces the list file for a detailed summary report of a log file.
Syntax
list [filename]|*
where * sets the output back to stdout.
How to Use It
There are two ways to specify the list file for reports:
• Redirect stdout when invoking the utility program by typing:
utility > utilrept
• Or, use the list command when utility is running by typing:
list utilrept
In either case, user interactions and errors are printed to stderr, and reports go to the file specified.
The filename parameter in the list command must represent a valid filename to which you have write access. Existing files have the new output appended to the end of existing contents. If the file does not exist, it will be created.
To determine the current output file, issue the list command without parameters:
80 Chapter 5
If the output file is not stdout, most commands are echoed to the output file as they are entered.
Example
The list command produces a summary report on the extracted log file rxlog. The list utilrept command directs the scan report listing to a disk file. Detail off specifies less than full detail in the report. The scan command reads rxlog and produces the report.
The list * command sets the list device back to the default stdout. !lp utilrept sends the disk file to the system printer.
utility>logfile rxloglist utilreptdetail off scanlist *!lp utilrept
To perform the above task using command line arguments, enter:
utility -l rxlog -f utilrept -d -xs print utilrept
logfile
Use the logfile command to open a log file. For many utility program functions, a log file must be opened. You do this explicitly by issuing the logfile command or implicitly by issuing some other command. If you are in batch or command line mode and do not specify a log file name, the default /var/opt/perf/datafiles/logglob file is used. If you are in interactive mode and do not specify a log file name, you are prompted to provide one or accept the default /var/opt/perf/datafiles/logglob file.
Syntax
logfile [logfile]
How to Use It
You can specify the name of either a raw or extracted log file. If you specify an extracted log file name, all information is obtained from this single file. You do not need to specify any of the raw log files other than the global log file, logglob. Opening logglob gives you access to all of the data in the other logfiles.
Raw log files have the following names:
logglob global log file
logappl application log file
logproc process log file
logdev device log file
logtran transaction log file
logls logical systems log file
logindx index log file
Utility Commands 81

Once a log file is opened successfully, a report is printed or displayed showing the general content of the log file (or log files), as shown in the example on the next page.
82 Chapter 5
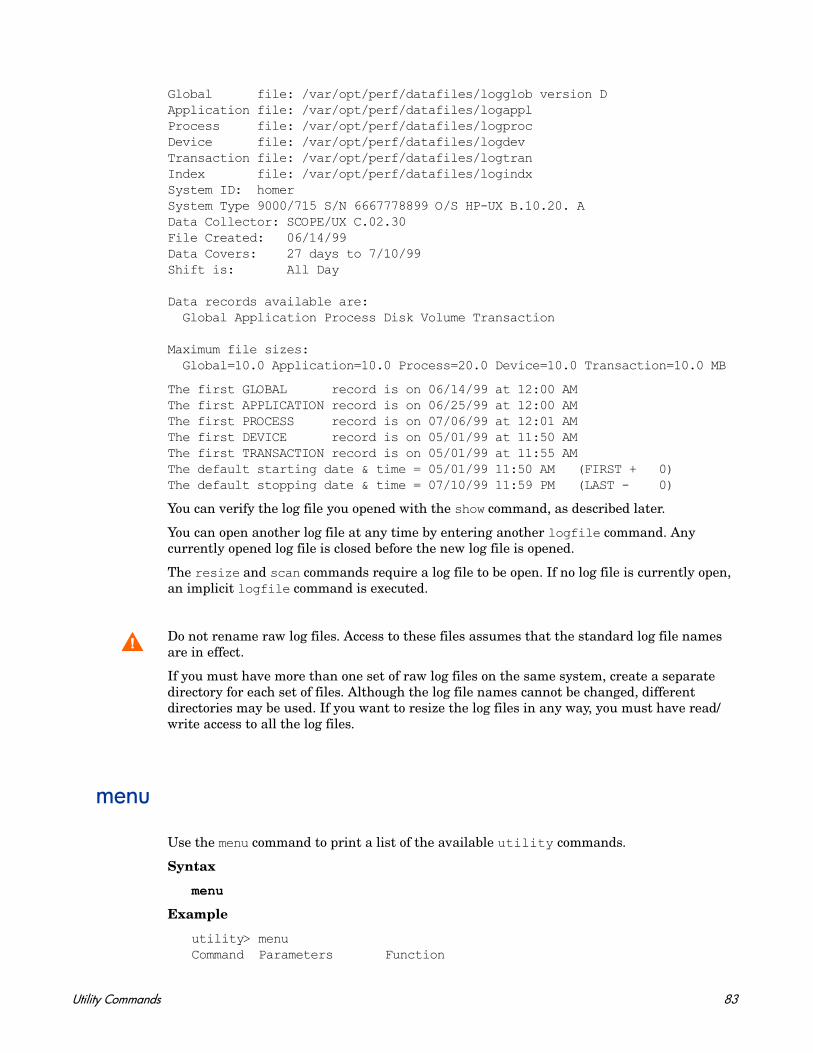
Global file: /var/opt/perf/datafiles/logglob version DApplication file: /var/opt/perf/datafiles/logapplProcess file: /var/opt/perf/datafiles/logprocDevice file: /var/opt/perf/datafiles/logdevTransaction file: /var/opt/perf/datafiles/logtranIndex file: /var/opt/perf/datafiles/logindxSystem ID: homerSystem Type 9000/715 S/N 6667778899 O/S HP-UX B.10.20. AData Collector: SCOPE/UX C.02.30File Created: 06/14/99Data Covers: 27 days to 7/10/99Shift is: All Day
Data records available are: Global Application Process Disk Volume Transaction
Maximum file sizes: Global=10.0 Application=10.0 Process=20.0 Device=10.0 Transaction=10.0 MB
The first GLOBAL record is on 06/14/99 at 12:00 AMThe first APPLICATION record is on 06/25/99 at 12:00 AMThe first PROCESS record is on 07/06/99 at 12:01 AMThe first DEVICE record is on 05/01/99 at 11:50 AMThe first TRANSACTION record is on 05/01/99 at 11:55 AM The default starting date & time = 05/01/99 11:50 AM (FIRST + 0)The default stopping date & time = 07/10/99 11:59 PM (LAST - 0)
You can verify the log file you opened with the show command, as described later.
You can open another log file at any time by entering another logfile command. Any currently opened log file is closed before the new log file is opened.
The resize and scan commands require a log file to be open. If no log file is currently open, an implicit logfile command is executed.
menu
Use the menu command to print a list of the available utility commands.
Syntax
menu
Example
utility> menuCommand Parameters Function
Do not rename raw log files. Access to these files assumes that the standard log file names are in effect.
If you must have more than one set of raw log files on the same system, create a separate directory for each set of files. Although the log file names cannot be changed, different directories may be used. If you want to resize the log files in any way, you must have read/write access to all the log files.
Utility Commands 83

HELP topic] Get information on commands and options GUIDE Enter guided commands mode for novice users LOGFILE [logname] Specify a log file to be processedLIST [filename|*] Specify the listing fileSTART [startdate time] Set starting date & time for SCAN or ANALYZESTOP [stopdate time] Set ending date & time for SCAN or ANALYZEDETAIL [ON|OFF] Set report detail for SCAN, PARMFILE, or ANALYZESHOW [ALL] Show the current program settingsPARMFILE [parmfile] Check parsing of a parameter fileSCAN [logname] Read the log file and produce a summary reportRESIZE [GLOB|APPL|PROC|DEV|TRAN] [DAYS=][EMPTY=] Resize raw log files CHECKDEF [alarmdef] Check parsing and set the alarmdef fileANALYZE Analyze the log file using the alarmdef file! or Sh [command] Execute a system commandMENU or ? List the commands menu (This listing)EXIT or Q Terminate the programutility>
parmfile
Use the parmfile command to view and syntax check the Performance Collection Component parm file settings that are used for data collection.
Syntax
parmfile [/directorypath/parmfile]
How to Use It
You can use the parmfile command to do any of the following:
• Examine the parm file for syntax warnings and review the resulting settings. All parameters are checked for correct syntax and errors are reported. After the syntax check is completed, only the applicable settings are reported.
• Find out how much room is left for defining applications.
• If detail on is specified, print the effective contents of the parm file plus any default settings that were not overridden, and print application definitions.
In batch mode, if no parm file name is specified, the default parm file is used.
In interactive mode, if no parm file name is supplied, you are prompted to supply one.
Example
The parmfile command checks the syntax of the current parm file and reports any warnings or errors. Detail on lists the logging parameter settings.
utility>detail onparmfile parm
To perform the above task using command line arguments, enter:
utility -xp -D
84 Chapter 5
quit
Use the quit command to terminate the utility program. The quit command is equivalent to the utility program’s exit command.
Syntax
quitq
resize
Use the resize command to manage the space in your raw log file set. This is the only program you should use to resize the raw log files in order to preserve coordination between the files and their internal control structures. If you use other tools you might remove or destroy the validity of these control structures.
The utility program cannot be used to resize extracted files. If you want to resize an extracted file, use the extract program to create a new extracted log file.
Syntax
resize [global ] [days=maxdays] [empty=days] [yes ] [application] [size=maxMB ] [space=MB ] [no ] [process ] [maybe] [device ] [transaction]
Parameters
log file type Specifies the type of raw data you want to resize: global, application, process, device, or transaction, which correspond to the raw log files logglob, logappl, logproc, logdev, and logtran. If you do not specify a data type and are running utility in batch mode, the batch job terminates. If you are running utility interactively, you are prompted to supply the data type based on those log files that currently exist.
days & size Specify the maximum size of the log file. The actual size depends on the amount of data in the file.
empty & space Specify the minimum amount of room required in the file after the resizing operation is complete. This value is used to determine if any of the data currently in the log file must be removed in the resizing process.
Utility Commands 85
You might expect that a log file would not fill up until the specified number of days after a resizing operation. You may want to use this feature of the resize command to minimize the number of times a log file must be resized by the scope collector because resizing can occur any time the file is filled. Using resize to force a certain amount of empty space in a log file causes the log file to be resized when you want it to be.
The days and empty values are entered in units of days; the size and space values are entered in units of megabytes. Days are converted to megabytes by using an average megabytes-per-day value for the log file. This conversion factor varies depending on the type of data being logged and the particular characteristics of your system.
More accurate average-megabytes-per-day conversion factors can be obtained if you issue the scan command on the existing log file before you issue the resize command. A scan measures the accumulation rates for your system. If no scan is done or if the measured conversion factor seems unreasonable, the resize command uses a default conversion factor for each type of data.
Default resizing parameters are shown in the following table.
yes Specifies that resizing should be unconditionally performed. This is the default action if utility is not running interactively. If no action is specified when utility is running interactively, you are prompted to supply the action.
no Specifies that resizing should not be performed. This parameter can be specified as an action if you want to see the resizing report but do not want to perform the resizing at that time.
maybe Specifies that utility should decide whether or not to resize the file. This parameter forces utility to make this decision based on the current amount of empty space in the log file (before any resizing) and the amount of space specified in the resize command. If the current log file contains at least as much empty space as specified, resizing does not occur. If the current log file contains less than the specified empty space, resizing occurs.
maybe(continued)
If the resizing can be made without removing any data from the log file (for example, increasing the maximum log file size, or reducing the maximum log file size without having to remove any existing data), resizing occurs. The maybe parameter is intended primarily for use by periodic batch executions. See the “Examples” subsection below for an explanation of how to use the resize command in this manner.
Table 6 Default Resizing Parameters
Parameter If Executed Interactively If Executed in Batch
log file type
You are prompted for each available log file type.
No default. This is a required parameter.
dayssize
The current file size. The current file size.
empty space The current amount of empty space or enough empty space to retain all data currently in the file, whichever is smaller.
The current amount of empty space or enough empty space to retain all data currently in the file, whichever is smaller.
86 Chapter 5
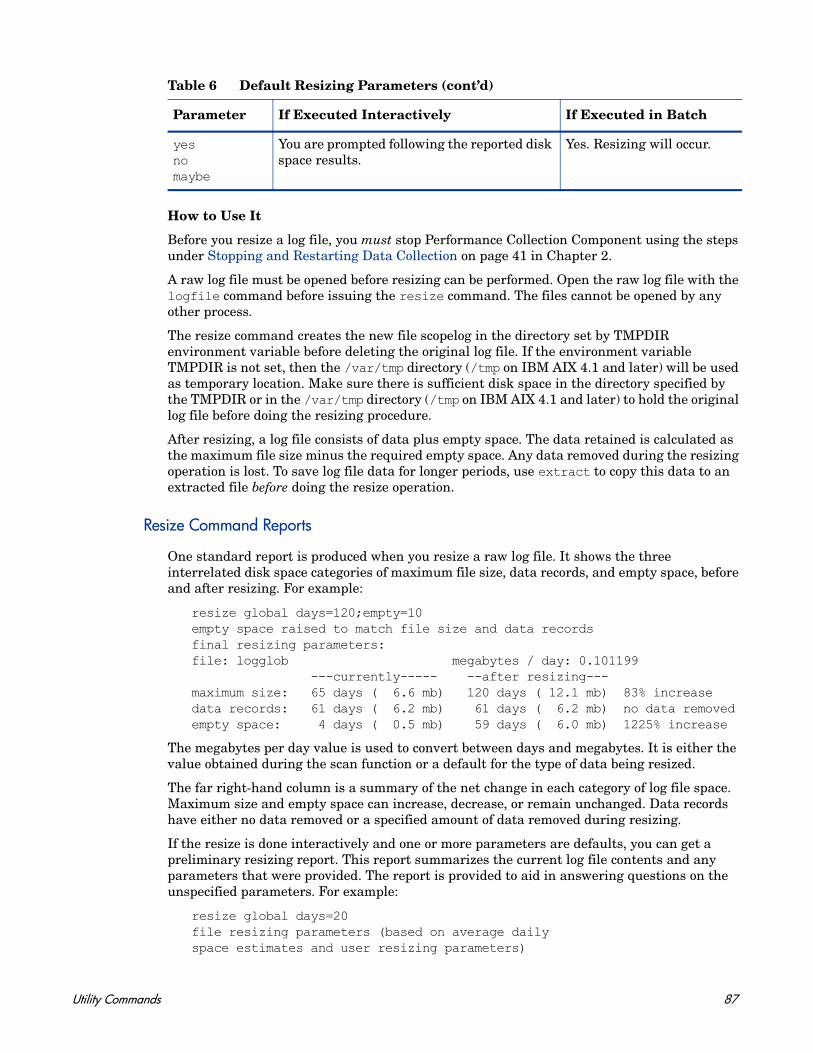
How to Use It
Before you resize a log file, you must stop Performance Collection Component using the steps under Stopping and Restarting Data Collection on page 41 in Chapter 2.
A raw log file must be opened before resizing can be performed. Open the raw log file with the logfile command before issuing the resize command. The files cannot be opened by any other process.
The resize command creates the new file scopelog in the directory set by TMPDIR environment variable before deleting the original log file. If the environment variable TMPDIR is not set, then the /var/tmp directory (/tmp on IBM AIX 4.1 and later) will be used as temporary location. Make sure there is sufficient disk space in the directory specified by the TMPDIR or in the /var/tmp directory (/tmp on IBM AIX 4.1 and later) to hold the original log file before doing the resizing procedure.
After resizing, a log file consists of data plus empty space. The data retained is calculated as the maximum file size minus the required empty space. Any data removed during the resizing operation is lost. To save log file data for longer periods, use extract to copy this data to an extracted file before doing the resize operation.
Resize Command Reports
One standard report is produced when you resize a raw log file. It shows the three interrelated disk space categories of maximum file size, data records, and empty space, before and after resizing. For example:
resize global days=120;empty=10empty space raised to match file size and data recordsfinal resizing parameters:file: logglob megabytes / day: 0.101199 ---currently----- --after resizing---maximum size: 65 days ( 6.6 mb) 120 days ( 12.1 mb) 83% increasedata records: 61 days ( 6.2 mb) 61 days ( 6.2 mb) no data removedempty space: 4 days ( 0.5 mb) 59 days ( 6.0 mb) 1225% increase
The megabytes per day value is used to convert between days and megabytes. It is either the value obtained during the scan function or a default for the type of data being resized.
The far right-hand column is a summary of the net change in each category of log file space. Maximum size and empty space can increase, decrease, or remain unchanged. Data records have either no data removed or a specified amount of data removed during resizing.
If the resize is done interactively and one or more parameters are defaults, you can get a preliminary resizing report. This report summarizes the current log file contents and any parameters that were provided. The report is provided to aid in answering questions on the unspecified parameters. For example:
resize global days=20file resizing parameters (based on average dailyspace estimates and user resizing parameters)
yesnomaybe
You are prompted following the reported disk space results.
Yes. Resizing will occur.
Table 6 Default Resizing Parameters (cont’d)
Parameter If Executed Interactively If Executed in Batch
Utility Commands 87

file: logglob megabytes / day: 0.101199 -----currently---- --after resizing--maximum size: 65 days ( 6.6 mb) 20 days ( 2.0 mb)data records: 61 days ( 6.2 mb) ??empty space: 4 days ( 0.5 mb) ??
In this example, you are prompted to supply the amount of empty space for the file before the final resizing report is given. If no action parameter is given for interactive resizing, you are prompted for whether or not to resize the log file immediately following the final resizing report.
Examples
The following commands are used to resize a raw process log file. The scan is performed before the resize to increase the accuracy of the number-of-days calculations.
logfile /var/opt/perf/datafiles/logglobdetail offscanresize process days=60 empty=30 yes
days=60 specifies holding a maximum of 60 days of data. empty=30 specifies that 30 days of this file are currently empty. That is, the file is resized with no more than 30 days of data in the file to leave room for 30 more days out of a total of 60 days of space. yes specifies that the resizing operation should take place regardless of current empty space.
The next example shows how you might use the resize command in batch mode to ensure that log files do not fill up during the upcoming week (forcing scope to resize them). You could schedule a cron script using the at command that specifies a minimum amount of space such as 7 days - or perhaps 10 days, just to be safe.
The following shell script accomplishes this:
echo detail off > utilinecho scan >> utilinecho resize global empty=10 maybe >> utilinecho resize application empty=10 maybe >> utilinecho resize process empty=10 maybe >> utilinecho resize device empty=10 maybe >> utilinecho quit >> utilinutility < utilin > utilout 2> utilerr
88 Chapter 5

Specifying maybe instead of yes avoids any resizing operations if 10 or more days of empty space currently exist in any log files. Note that the maximum file size defaults to the current maximum file size for each file. This allows the files to be resized to new maximum sizes without affecting this script.
scan
Use the scan command to read a log file and write a report on its contents. (For a detailed description of the report, see Utility Scan Report Details on page 67 in Chapter 3.
Syntax
scan
How to Use It
The scan command requires a log file to be opened. The log file scanned is the first of one of the following:
• The log file named in the scan command itself.
• The last log file opened by any previous command.
• The default log file.
In this case, interactive users are prompted to override the default log file name if desired.
The following commands affect the operation of the scan function:
For more information about the detail, list, start, and stop commands, see their descriptions in this chapter.
The scan command report consists of 12 sections. You can control which sections are included in the report by issuing the detail command prior to issuing scan.
detail Specifies the amount of detail in the report. The default, detail on, specifies full detail.
list Redirects the output to another file. The default is to list to the standard list device.
start Specifies the date and time of the first log file record you want to scan. The default is the beginning of the log file.
stop Specifies the date and time of the last log file record you want to scan. The default is the end of the log file.
Utility Commands 89
The following four sections are always printed (even if detail off is specified):
• Scan start and stop actual dates and times
• Collector coverage summary
• Log file contents summary
• Log file empty space summary
The following sections are printed if detail on (the default) is specified:
• Initial parm file global information and system configuration information
• Initial parm file application definitions
• parm file global changes
• parm file application addition/deletion notifications
• Collector off-time notifications
• Application-specific summary reports
The following section is always printed if application data was scanned (even if detail off is specified):
• Application overall summary
The following section is always printed if process data was scanned (even if detail off is specified):
• Process log reason summary
Example
The scan of the current default global log file starts with records logged from June 1, 1999 at 7:00 AM until the present date and time.
utility>logfile /var/opt/perf/datafiles/logglobdetail onstart 6/1/99 7:00 amscan
To perform the above task using command line arguments, enter:
utility -D -b 6/1/99 7:00 am -xs
sh
Use sh to enter a shell command without exiting utility by typing sh or an exclamation point (!) followed by a shell command.
Syntax
sh or ! [shell command]
Parameters
90 Chapter 5
How to Use It
Following the execution of the single command, you automatically return to utility. If you want to issue multiple shell commands without returning to utility after each one, you can start a new shell. For example,
sh ksh
or
!ksh
show
Use the show command to list the names of the files that are open and the status of the utility parameters that can be set.
Syntax
show [all]
Examples
Use show to produce a list that may look like this:
Logfile: /var/opt/perf/datafiles/logglob List: "stdout"Detail: ON for ANALYZE, PARMFILE and SCAN functionsThe default starting date & time = 10/08/99 08:17 AM (FIRST + 0)The default stopping date & time = 11/20/99 11:59 PM (LAST - 0)The default shift = 12:00 AM - 12:00 AM
Use show all to produce a more detailed list that may look like this:
Logfile: /var/opt/perf/datafiles/logglob Global file: /var/opt/perf/datafiles/logglob Application file: /var/opt/perf/datafiles/logappl Process file: /var/opt/perf/datafiles/logproc Device file: /var/opt/perf/datafiles/logdev Transaction file: /var/opt/perf/datafiles/logtran Index file: /var/opt/perf/datafiles/logindx System ID: homer System Type 9000/715 S/N 66677789 OS/ HP-UX B.10.20 A Data Collector: SCOPE/UX C.02.30 File created: 10/08/99 Data Covers: 44 days to 11/20/99 Shift is: All DayData records available are: Global Application Process Disk Volume Transaction
sh ls Executes the ls command and returns to utility.
!ls Same as above.
The default shift time is shown for information only. Shift time cannot be changed in utility.
Utility Commands 91
Maximum file sizes: Global=10.0 Application=10.0 Process=20.0 Device=10.0 Transaction 10.0 MBList "stdout"Detail ON for ANALYZE, PARMFILE and SCAN functionsThe default starting date & time = 10/08/99 11:50 AM (FIRST + 0)The default stopping date & time = 11/20/99 11:59 PM (LAST - 0)The default shift = 12:00 AM - 12:00 AM
start
Use the start command to specify the beginning of the subset of a log file that you want to scan or analyze. Start lets you start the scan or analyze process at data that was logged at a specific date and time.
The default starting date and time is set to the date and time of the first record of any type in a log file that has been currently opened with the logfile command.
Syntax
Parameters
How to Use It
start[date[today[last[first
[time]][-days][-days][+days]
[time]][time]][time]]
date The date format depends on the native language configured on the system being used. If you do not use native languages or have the default language set to C, the date format is mm/dd/yy (month/day/year) or 06/30/99 for June 30, 1999.
time The time format also depends on the native language being used. For C, the format is hh:mm am or hh:mm pm (hour:minute in 12-hour format with the am/pm suffix) such as 07:00 am for 7 o'clock in the morning. Twenty-four hour time is accepted in all languages. For example, 23:30 would be accepted for 11:30 pm.If the date or time is entered in an unacceptable format, an example in the correct format is shown.If no start time is given, a midnight (12 am) is assumed. A starting time of midnight for a given day starts at the beginning of that day (00:00 on a 24-hour clock).
today Specifies the current day. The parameter today-days specifies the number of days prior to today’s date. For example, today-1 indicates yesterday’s date and today-2 indicates the day before yesterday.
last Can be used to represent the last date contained in the log file. The parameter last-days specifies the number of days prior to the last date in the log file.
first Can be used to represent the first date contained in the log file. The parameter first+days specifies the number of days after the first date in the log file.
92 Chapter 5
The start command is useful if you have a very large log file and do not want to scan or analyze the entire file. You can also use it to specify a specific time period for which data is scanned. For example, you can scan a log file for data that was logged for a period beginning 14 days before the present date by specifying today-14.
You can use the stop command to further limit the log file records you want to scan.
If you are not sure whether native language support is installed on your system, you can force utility to use the C date and time formats by issuing the following statement before running utility:
LANG=C; export LANG
or in C Shell
setenv LANG C
Example
The scan of the default global log file starts with records logged from August 5, 1999 at 8:00 AM until the present date and time.
utility>logfile /var/opt/perf/datafiles/logglobdetail onstart 8/5/99 8:00 AMscan
To perform the above task using command line arguments, enter:
utility -D -b 8/5/99 8:00 am -xs
stop
Use the stop command to specify the end of a subset of a log file that you want to scan or analyze. Stop lets you terminate the scan or analyze process at data that was logged at a specific date and time.
The default stopping date and time is set to the date and time of the last record of any type in a log file that has been currently opened with the logfile command.
Syntax
Parameters
stop[date[today[last[first
[time]][-days][-days][+days]
[time]][time]][time]]
Utility Commands 93
How to Use It
The stop command is useful if you have a very large log file and do not want to scan the entire file. You can also use it to specify a specific time period for which data is scanned. For example, you can scan a log file for seven-days worth of data that was logged starting a month before the present date.
If you are not sure whether native language support is installed on your system, you can force utility to use the C date and time formats by issuing the following statement before running utility:
LANG=C; export LANG
or in C Shell
setenv LANG C
Example
The scan of 14 days worth of data starts with records logged from July 5, 1999 at 8:00 AM and stops at the last record logged July 18, 1999 at 11:59 pm.
utility>logfile /var/opt/perf/datafiles/logglobdetail onstart 7/5/99 8:00 amstop 7/18/99 11:59 pmscan
To perform the above task using command line arguments, enter:
utility -D -b 7/5/99 8:00 am -e 7/18/99 11:59pm -xs
date The date format depends on the native language configured on the system being used. If you do not use native languages or have the default language set to C, the date format is mm/dd/yy (month/day/year) or 06/30/99 for June 30, 1999.
time The time format also depends on the native language being used. For C, the format is hh:mm am or hh:mm pm (hour:minute in 12-hour format with the am/pm suffix) such as 07:00 am for 7 o'clock in the morning. Twenty-four hour time is accepted in all languages. For example, 23:30 would be accepted for 11:30 pm.If the date or time is entered in an unacceptable format, an example in the correct format is shown.If no stop time is given, one minute before midnight (11:59 pm) is assumed. A stopping time of midnight (12 am) for a given day stops at the end of that day (23:59 on a 24-hour clock).
today Specifies the current day. The parameter today-days specifies the number of days prior to today’s date. For example, today-1 indicates yesterday’s date and today-2, the day before yesterday.
last Can be used to represent the last date contained in the log file. The parameter last-days specifies the number of days prior to the last date in the log file.
first Can be used to represent the first date contained in the log file. The parameter first+days specifies the number of days after the first date in the log file.
94 Chapter 5
6 Using the Extract Program
The extract program has two main functions: it lets you extract data from raw log files and write it to extracted log files. Extract also lets you export log file data for use by analysis products such as spreadsheets.
The extract and export functions copy data from a log file; no data is removed.
Three types of log files are used by Performance Collection Component:
• scope log files, which contain data collected in Performance Collection Component by the scope collector.
• extracted log files, which contain data extracted from raw scope log files.
• DSI (data source integration) log files, which contain user-defined data collected by external sources such as applications and databases. The data is subsequently logged by Performance Collection Component’s DSI programs.
Use the extract program to perform the following tasks:
• Extract subsets of data from raw scope log files into an extracted log file format that is suitable for placing in archives, for transport between systems, and for analysis by Performance Manager. Data cannot be extracted from DSI log files.
• Manage archived log file data by extracting or exporting data from extracted format files, appending data to existing extracted log files, and organizing data by type, date, and shift (hour of day).
• Export data from raw or extracted scope log files and DSI log files into ASCII, binary, datafile, or WK1 (spreadsheet) formats suitable for reporting and analysis or for importing into spreadsheets or similar analysis packages.
Examples of how various tasks are performed and how extract commands are used can be found in online help for the extract program.
This chapter covers the following topics:
• Running the Extract Program
• Using Interactive Mode
• Extract Command Line Interface
• Overview of the Export Function
After the initial installation of Performance Collection Component, services must be started for file installation to complete, before extract will function.
• The extract function cannot produce summarized data. Summary data can only be produced by the export function.
• The maximum limits for the extract and export functions are as follows: — Output file from the extract function can not exceed 3.5 GB — Output file from the export function can not exceed 4GB.
95
Running the Extract Program
There are three ways to run the extract program:
Command line mode
You control the extract program using command options and arguments in the command line.
Interactive mode
You supply interactive commands and parameters while executing the program with stdin set to an interactive terminal or workstation.If you are an experienced user, you can quickly specify only those commands required for a given task. If you are a new user, you may want to specify guided mode to receive more assistance in using extract. In guided mode, you are asked to select from a list of options in order to perform a task. While in guided mode, the interactive commands that accomplish each task are listed as they are executed, so you can see how they are used. You can quit or re-enter guided mode at any time.
Batch mode
You can run the program and redirect stdin to a file that contains interactive commands and parameters.
Syntax
The syntax for the command line interface is similar to standard UNIX command line interfaces on other programs and is described in detail in this chapter.
For interactive and batch mode the command syntax is the same: a command followed by one or more parameters. Commands can be entered in any order; if a command has a parameter associated with it, the parameter must be entered immediately after the corresponding command.
There are two types of parameters - required (for which there are no defaults) and optional (for which defaults are provided). How the extract program handles these parameters depends on the mode in which it is running.
• In interactive mode, if an optional parameter is missing, the program displays the default parameter and lets you either confirm it or override it. If a required parameter is missing, the program prompts you to enter the parameter.
• In batch mode, if an optional parameter is missing, the program uses the default values. If a required parameter is missing, the program terminates.
Errors and missing data are handled differently for interactive mode than for command line and batch mode, because you can supply additional data or correct mistakes in interactive mode, but not in command line and batch mode.
Using Interactive Mode
Using the extract program’s interactive mode requires you to issue a series of commands to execute a specific task.
96 Chapter 6
For example, if you want to export application data collected starting May 15, 2003, from the default global log file, you issue the following commands after invoking the extract program
logfile /var/opt/perf/datafiles/logglobapplication detailstart 5/15/2003export
The logfile command opens /var/opt/perf/datafiles/logglob, the default global log file. The start command specifies that only data logged after 5/15/03 will be exported. The export command starts the exporting of the data.
Extract Command Line Interface
In addition to the interactive and batch mode command syntax, command options and arguments can be passed to the extract program through the command line interface. The command line interface fits into the typical UNIX environment by allowing the extract program to be easily invoked by shell scripts and allowing its input and output to be redirected into UNIX pipes.
For example, the command line equivalent of the example shown in the previous section Using Interactive Mode on page 96 is:
extract -l -a -b 5/15/02 -xp
In command line mode, the global log file /var/opt/perf/datafiles/logglob is the default; you do not have to specify it.
Command line options and arguments are listed in the following table. The referenced command descriptions can be found in Chapter 7, Extract Commands.
Table 7 Command Line Arguments
Command Option Argument Description
-b date time Specifies starting date and time of an extract or export function. (See start command in Chapter 6.)
-B UNIX start time
Specifies starting time in UNIX format for an extract or export function.
-e date time Specifies ending date and time of an extract or export function. (See stop command in Chapter 6.)
-E UNIX stop time
Specifies stopping time in UNIX format for an extract or export function.
-s time-time noweekends Specifies start and end time for specific periods excluding weekends. (See shift command in Chapter 6.)
-l logfile Specifies input log file. (See logfile command in Chapter 6.) /var/opt/perf/datafiles/logglob is the default.
Using the Extract Program 97
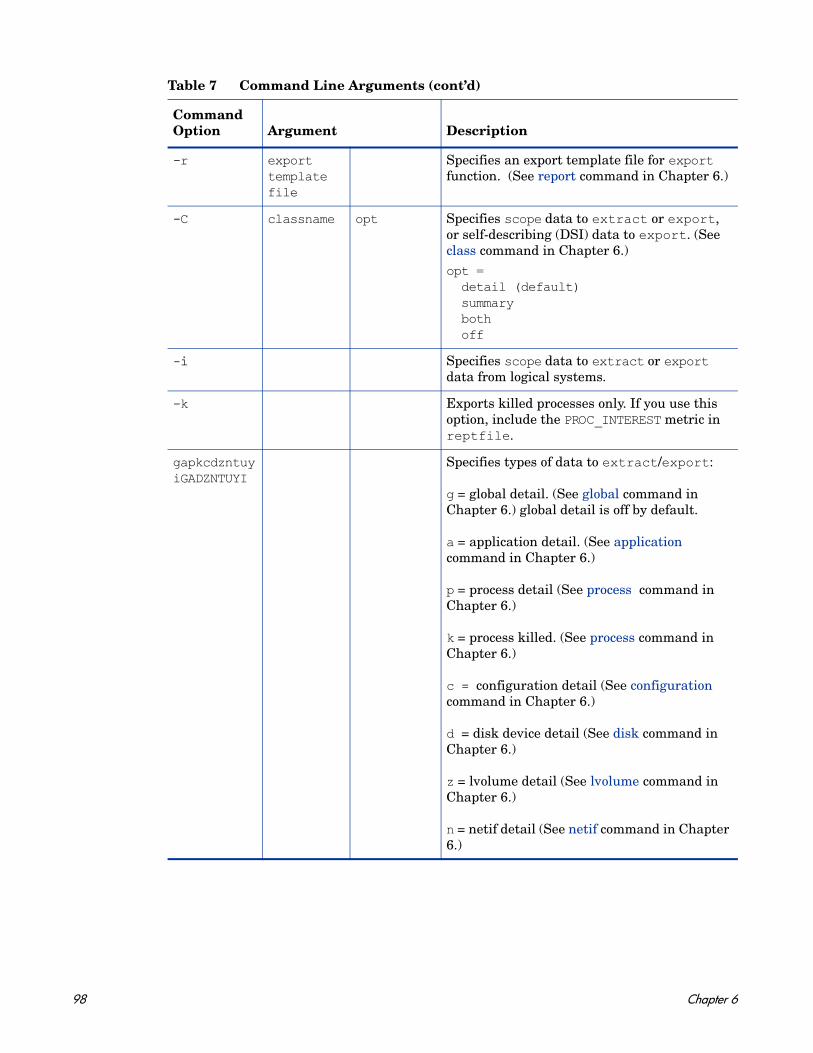
-r exporttemplatefile
Specifies an export template file for export function. (See report command in Chapter 6.)
-C classname opt Specifies scope data to extract or export, or self-describing (DSI) data to export. (See class command in Chapter 6.)opt = detail (default) summary both off
-i Specifies scope data to extract or export data from logical systems.
-k Exports killed processes only. If you use this option, include the PROC_INTEREST metric in reptfile.
gapkcdzntuyiGADZNTUYI
Specifies types of data to extract/export:
g = global detail. (See global command in Chapter 6.) global detail is off by default.
a = application detail. (See application command in Chapter 6.)
p = process detail (See process command in Chapter 6.)
k = process killed. (See process command in Chapter 6.)
c = configuration detail (See configuration command in Chapter 6.)
d = disk device detail (See disk command in Chapter 6.)
z = lvolume detail (See lvolume command in Chapter 6.)
n = netif detail (See netif command in Chapter 6.)
Table 7 Command Line Arguments (cont’d)
Command Option Argument Description
98 Chapter 6

gapkcdzntuyiGADZNTUYI(continued)
t = transaction detail
u = CPU detail
y = filesystem detaili = logical systems detail
NOTE: The following summary options are for export only; the extract function does not support data summarization.
G = global summary Global summary is off by default.
A = application summary
D = disk device summary (See disk command in Chapter 6.)
Z=lvolume summary (See lvolume command in Chapter 6.)
N = netif summary (See netif command in Chapter 6.)I = logical systems summary
gapkcdzntuyGADZNTUY(continued)
T = transaction summary
U = CPU summary (See cpu command in Chapter 6.)
Y = filesystem summary (See filesystem command in Chapter 6.)
-v Generates verbose output report formats.
-f filename ,new,append,purge
Sends extract or export data to a file. If no filename, sends data to default output files. (See output command in Chapter 6.)
-ut Shows date and time in UNIX format in exported DSI log file data.
-we 1.....7 Specifies days to exclude from export; 1=Sunday. (See weekdays command description.)
-xp xopt Exports data to external format files. (See export command in Chapter 6.)
Table 7 Command Line Arguments (cont’d)
Command Option Argument Description
Using the Extract Program 99
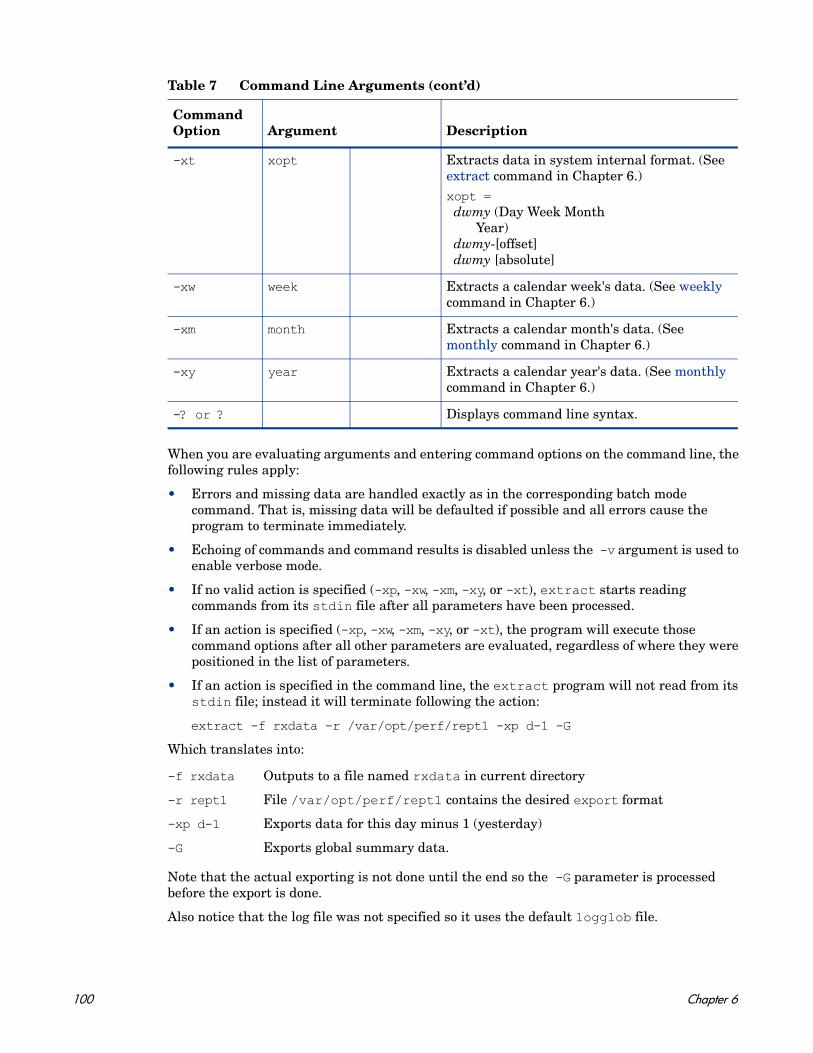
When you are evaluating arguments and entering command options on the command line, the following rules apply:
• Errors and missing data are handled exactly as in the corresponding batch mode command. That is, missing data will be defaulted if possible and all errors cause the program to terminate immediately.
• Echoing of commands and command results is disabled unless the -v argument is used to enable verbose mode.
• If no valid action is specified (-xp, -xw, -xm, -xy, or -xt), extract starts reading commands from its stdin file after all parameters have been processed.
• If an action is specified (-xp, -xw, -xm, -xy, or -xt), the program will execute those command options after all other parameters are evaluated, regardless of where they were positioned in the list of parameters.
• If an action is specified in the command line, the extract program will not read from its stdin file; instead it will terminate following the action:
extract -f rxdata -r /var/opt/perf/rept1 -xp d-1 -G
Which translates into:
Note that the actual exporting is not done until the end so the -G parameter is processed before the export is done.
Also notice that the log file was not specified so it uses the default logglob file.
-xt xopt Extracts data in system internal format. (See extract command in Chapter 6.)xopt = dwmy (Day Week Month Year) dwmy-[offset] dwmy [absolute]
-xw week Extracts a calendar week's data. (See weekly command in Chapter 6.)
-xm month Extracts a calendar month's data. (See monthly command in Chapter 6.)
-xy year Extracts a calendar year's data. (See monthly command in Chapter 6.)
-? or ? Displays command line syntax.
Table 7 Command Line Arguments (cont’d)
Command Option Argument Description
-f rxdata Outputs to a file named rxdata in current directory
-r rept1 File /var/opt/perf/rept1 contains the desired export format
-xp d-1 Exports data for this day minus 1 (yesterday)
-G Exports global summary data.
100 Chapter 6
Because an action was specified (-xp), once the export is finished the extract program terminates without reading from its stdin file. In addition, verbose mode was not set with the -v command option so all extraneous output to stdout is eliminated.
Overview of the Export Function
The extract program's export command converts Performance Collection Component raw, extracted, or DSI log file data into exported files. The export command writes files in any one of four possible formats: ASCII, datafile, binary, and WK1 (spreadsheet). Exported files can be used in a variety of ways, such as reports, custom graphics packages, databases, and user-written analysis programs.
How to Export Data
In the simplest form, you can export data by:
• specifying the default global log file, /var/opt/perf/datafiles/logglob, from which you want to export data
• specifying the default export template file, /var/opt/perf/reptfile, that defines the format of the exported data
• starting the export function.
The exported data is placed in a default output file named xfrdGLOBAL.asc in your current directory. The output file's ASCII format is suitable for printing.
If you want to export something other than this default set of data, you can use other commands and files in conjunction with the export command.
You can export the following types of data:
• You can specify which data items (metrics) are needed for each type of data.
• You can specify starting and ending dates for the time period in which the data was collected along with shift and weekend exclusion filters.
global 5-minute and hourly summaries
application 5-minute and hourly summaries
process One-minute details
disk device 5-minute and hourly summaries
lvolume 5-minute and hourly summaries
transaction 5-minute and hourly summaries
configuration One record containing parm file information, and system configuration information, for each time the data collector started.
any DSI class Intervals and summaries for DSI log files
netif 5-minute and hourly summaries
cpu 5-minute and hourly summaries
filesystem 5-minute and hourly summaries
Using the Extract Program 101

• You can specify the desired format for the exported data in an export template file. This file can be created using any text editor or word processor that lets you save a file in ASCII (text) format.
• You can also use the default export template file, /var/opt/perf/reptfile. This file specifies the following output format settings:
— ASCII file format
— a 0 (zero) for the missing value
— a blank space as the field separator
— 60-minute summaries
— column headings are included
— a recommended set of metrics for a given data type is included in the export
Sample Export Tasks
Two sample export template files, repthist and reptall, are furnished with Performance Collection Component. These files are located in the /var/opt/perf/ directory. You can use repthist and reptall to perform common export tasks or as a starting point for custom tasks, such as the task described next.
Generating a Printable CPU Report
The repthist export template file contains the specifications to generate a character graph of CPU and disk usage for the system over time. This graph consists of printable characters that can be printed on any device capable of 132 column printing. For example, you could use the following extract program commands to generate a graph of the last seven days and should produce approximately two pages (34 pages if 5-minute detail is specified instead of hourly summaries).
logfile /var/opt/perf/datafiles/logglobreport /var/opt/perf/repthist global summary start today-7export
The exported data is in an export file named xfrsGLOBAL.asc. To print it, type:
lp xfrsGLOBAL.asc
Producing a Customized Export File
If you want to create a totally new export template file, copy the export template file and customize it using the extract program's guide command. In guided mode, you copy the reptall file from the /var/opt/perf/ directory and read the scope or DSI log file specified to dynamically create the list of data types and metric names.
If you extracting or exporting data from log files which are created from a specific platform, it is recommended that you use the reptall file from the same platform. This is because the list of metric classes supported are different on different platforms.
102 Chapter 6

The reptall file contains every possible metric for each type of scope log file data so you need only uncomment those metrics that are of interest to you. This is easier than retyping the entire export template file.
Export Data Files
If you used the output command to specify the name of an output file prior to issuing the export command, all exported data will be written to this single file. If you are running the extract program interactively and want to export data directly to your workstation (standard output file), specify the extract command output stdout prior to issuing the export command.
If the output file is set to the default, the exported data is separated into as many as 14 different default output files depending on the type of data being exported.
The default export log file names are:
where ext= asc (ASCII), bin (binary), dat (datafile), or wk1 (spreadsheet).
xfrdGLOBAL.ext Global detail data file
xfrsGLOBAL.ext Global hourly summary data file
xfrdAPPLICATION.ext Application detail data file
xfrsAPPLICATION.ext Application hourly summary data file
xfrdPROCESS.ext Process detail data file
xfrdDISK.ext Disk device detail data file
xfrsDISK.ext Disk device hourly summary data file
xfrdVOLUME.ext Logical volume detail data file
xfrsVOLUME.ext Logical volume summary data file
xfrdNETIF.ext Netif detail data file
xfrsNETIF.ext Netif summary detail data file
xfrdCPU.ext CPU detail data file
xfrsCPU.ext CPU summary data file
xfrdFILESYSTEM.ext Filesystem detail data file
xfrsFILESYSTEM.ext Filesystem summary data file
xfrdTRANSACTION.ext Transaction detail data file
xfrsTRANSACTION.ext Transaction summary data file
xfrdCONFIGURATION.ext Configuration data file
No output file is created unless you specify the type and associated items that match the data in the export template file prior to issuing the export command.
Using the Extract Program 103
Export Template File Syntax
The export template file can contain all or some of the following information, depending on how you want your exported data to be formatted and what you want the export file to contain:
report "export file title"format [ASCII] [datafile] [binary] [WK1] or [spreadsheet]headings [on] [off]separator= "char"summary=valuemissing=valuelayout=single | multipleoutput=filenamedata type datatypeitems
Parameters
report Specifies the title for the export file. For more information, see the following section, Export File Title on page 106.
format Specifies the format for the exported data.
ASCII
ASCII (or text) format is best for copying files to a printer or terminal. It does not enclose fields with double quotes (").
Datafile
The datafile format is similar to ASCII format except that non-numerical fields are enclosed in double quotes. Because double quotes prevent strict column alignment, files in datafile format are not recommended for direct printing. The datafile format is the easiest format to import into most spreadsheets and graphics packages.
Binary
The binary format is more compact because numerical values are represented as binary integers. It is the most suitable format for input into user-written analysis programs because it needs the least conversion, and it maintains the highest metric accuracy. It is not suitable for direct printing.
WK1 (spreadsheet)
The WK1 (spreadsheet) format is compatible with Microsoft Excel and other spreadsheet and graphics programs.
104 Chapter 6

headings Specifies whether or not to include column headings for the metrics listed in the export file. If headings off is specified, no column headings are written to the file. The first record in the file is exported data. If headings on is specified, ASCII and datafile formats place the export title plus column headings for each column of metrics written before the first data records. Column headings in binary format files contain the description of the metrics in the file. WK1 formats always contain column headings.
separator Specifies the character that is printed between each field in ASCII or datafile formatted data. The default separator character is a blank space. Many programs prefer a comma as the field separator. You can specify the separator as any printing or nonprinting character.
summary Specifies the number of minutes for each summary interval. The value determines how much time is included in each record for summary records. The default interval is 60 minutes. The summary value can be set between 5 and 1440 minutes (1 day).
missing Specifies the data value to be used in place of missing data. The default value for missing data is zero. You can specify another value in order to differentiate missing from zero data. A data item may be missing if it was:
• not logged by a particular version of the scope collector
• not logged by scope because the instance (application, disk, transaction, netif) it belongs to was not active during the interval, or
• in the case of DSI log files, no data was provided to the dsilog program during an interval, resulting in “missing records”.
Missing records are, by default, excluded from exported data.
layout Specifies either single or multiple layouts (output per record output) for data types such as application, disk, transaction, lvolume, or netif. • Single layout writes one instance per record, for every application that
was active during the time interval. Example: One disk exported in one record.
• Multiple layout writes multiple instances in one record for each time interval, with part of that record reserved for each configured application. Example: All disks exported in one record.
output Specifies the name of the output file where the exported data will be written. output can be specified for each class or data type exported by placing output filename just after the line indicating the data type that starts the list of exported data items. Any valid file name can be specified for output.You can also specify the name interactively using the output command. Any name you specify overrides the default output file name.
data type Specifies one of the exportable data types: global, application, process, disk, transaction, lvolume, netif, configuration, or DSI class name. This starts a section of the export template file that lists the data items to be copied when this type of data is exported.
items Specifies the metrics to be included in the exported file. Metric names are listed, one per line, in the order you want them listed in the resulting file. You must specify the proper data type before listing items. The same export template file can include item lists for as many data types as you want. Each data type will be referenced only if you choose to export that type of data.
Using the Extract Program 105

The output and layout parameters can be used more than once within an export template file. For example:
data type global output=myglobal gbl_cpu_total_util
data type application output=myapp layout=multiple app_cpu_total_util
You can have more than one export template file on your system. Each one can define a set of exported file formats to suit a particular need. You use the report command to specify the export template file to be used with the export function.
Export File Title
The following items can be substituted in the export file title string:
For example, the string
report "!system_id data from !logfile on !date !time"
generates an export file title similar to
barkley data from logglob on 02/02/99 08:30 AM
Creating a Custom Graph or Report
Suppose you want to create a custom graph or report containing exported global and application data. You would do the following:
1 Determine which data items (metrics) are needed from each data type and in what format you will access them.
For this example, you want an ASCII file without headings and with fields separated by commas.
2 Create and save the following ASCII export template file in the /var/opt/perf/ directory. Name the file report1.
You cannot specify different layouts within a single data type. For example, you cannot specify data type disk once with layout = multiple and again with layout = single within the same export file.
!date The date the export function was performed.
!time The time the export function was performed.
!logfile The fully qualified name of the source log file.
!class The type of data requested.
!collector The name and version of the collector program. (Not valid with DSI log files.)
!system_id The identifier of the system that collected the data. (Not valid with DSI log files.)
106 Chapter 6
REPORT "sample export template file (report1)"FORMAT ASCIIHEADINGS OFF
DATA TYPE GLOBAL GBL_CPU_TOTAL_UTIL GBL_DISK_PHYS_IO_RATE
DATA TYPE APPLICATION APP_CPU_TOTAL_UTIL APP_DISK_PHYS_IO_RATE APP_ALIVE_PROCESSES
3 Run the extract program.
4 Issue the report command to specify the export template file you created.
report /var/opt/perf/report1
5 Specify global summary data and application summary data using the global and application commands.
global summaryapplication summary
6 Issue the export command to start the export.
export
7 Because you did not specify where the program should get the performance data from, you are prompted to do so. In this example, since the default log file is correct, just press Enter.
8 The output looks like this:
exporting global data ........50%......100%exporting application data .....50%......100%The exported file contains 31 days of data from 01/01/99 to 01/31/99 examined exporteddata type records records space----------------------- --------- --------- ---------global summaries 736 0.20 Mbapplication summaries 2560 0.71 Mb --------- 0.91 Mb
The two files you have just created — xfrsGLOBAL.asc and xfrsAPPLICATION.asc — contain the global and application summary data in the specified format.
Output of Exported Files
The contents of each exported file are:
export tittle line If export title and headings on were specified.
Names (application, netif, lvolume, or transaction)
If headings on was specified along with a multiple layout file.
Heading line1 If headings on was specified.
Heading line2 If headings on was specified.
first data record
Using the Extract Program 107
Report title and heading lines are not repeated in the file.
Notes on ASCII and Datafile Formats
The data in these format files is printable ASCII format. ASCII and datafile formats are identical except that in the latter, all non-numeric fields are enclosed with double quotes. Even the datafile header information is enclosed with double quotes.
The ASCII file format does not enclose fields with double quotes. Therefore, the data in ASCII files will be properly aligned when printed.
Numerical values are formatted based on their range and internal accuracy. Since all fields will not be the same length, be sure to specify the separator you want to use to start each field.
The user-specified separator character (or the default blank space) separates the individual fields in ASCII and datafile formats. Blank spaces, used as separators, can be visually more attractive if you plan to print the report. Other characters can be more useful as separators if you plan to read the export template file with another program.
Using the comma as a separator is acceptable to many applications, but some data items may contain commas that are not separators. These commas can confuse analysis programs. The date and time formats can contain different special characters based on the native language specified when you execute the extract program.
Notes on Binary Format
In binary format files, numerical values are written as 32-bit integers. This can save space by reducing the overall file size, but your program must be able to read binary files. We do not recommend copying a binary format file to a printer or a terminal.
In binary format, non-numerical data is written the same as it was in the ASCII format except separator characters are not used. To properly use a binary format file, you should use the record layout report printed by extract when you specify report reportfile,show. This report gives you the starting byte for each item specified.
second data record
...
last data record
To use a nonprinting special character as a separator, enter it into your export template file immediately following the first double quote in the separator parameter.
• Most spreadsheets accept files in datafile format using separator=",".• Many spreadsheet packages accept a maximum of 256 columns in a single sheet. Use care
when exporting multiple layout types of data because it is easy to generate more than 256 total items. You can use the output of the report reportfile, show command to determine if you are likely to see this problem.
• If you have a printer that supports underlining, you can create a more attractive printout by specifying ASCII format and the vertical bar character (separator=|) and then printing the file with underlining turned on.
108 Chapter 6

To maintain maximum precision and avoid nonstandard, binary floating-point representations, all numerical values are written as scaled, 32-bit integers. Some items might be multiplied by a constant before they are truncated into integer format.
For example, the number of seconds the CPU was used is multiplied by 1000 before being truncated. To convert the value in the exported file back to the actual number of seconds, divide it by 1000. For ease in conversion, specify headings on to write the scale factors to the exported file. The report title and special header records are written to binary format files to assist in programmatic interpretation.
Binary integers are written in the format that is native to the system on which the extract program is being run. For example, Intel systems write “little endian” integers while HP-UX, IBM AIX, and Sun systems write “big endian” integers. Use care when transporting binary exported files to systems that use different “"endians”.
Binary Header Record Layout
Each record in a binary format exported file contains a special 16-byte record header preceding any user-specified data. The report reportfile,show command includes the following four fields that make up this record header:
Binary Record Header Metrics
The Record ID metric uniquely identifies the type of data contained in the record. Current Record ID values are:
1 Global Data Record ( 5 minute detail record)101 Global Data Record (60 minute summary record) 2 Application Data Record ( 5 minute detail record)102 Application Data Record (60 minute summary record) 3 Process Data Record ( 1 minute detail record) 4 Configuration Data Record
Record Length Number of bytes in the record, including the 16 byte record header.
Record ID A number to identify the type of record (see below).
Date_Seconds Time since January 1, 1970 (in seconds).
Number_of_vars Number of repeating entries in this record.
-1 Title Record
-2 First header Record (Contains Item Numbers)
-3 Second header Record (Contains Item Scale Factors)
-4 Application Name Record (for Multiple Instance Application Files)
-5 Transaction Name Record (for Multiple Instance Transaction Files)
-7 Disk Device Name Record (for Multiple Instance Disk Device Files)
-8 Logical Volume Name Record (for Multiple Instance Lvolume Files)
-9 Netif Name Record (for Multiple Instance Netif Files)
-10 Filesystem Name Record (for Multiple Instance Netif Files)
-11 CPU Name Record (for Multiple Instance Netif Files)
Using the Extract Program 109
7 Disk Device Data Record ( 5 minute detail record)107 Disk Device Data Record (60 minute summary record) 8 Logical Volume Data Record ( 5 minute detail record)108 Logical Volume Data Record (60 minute summary record) 9 Filesystem Data Record ( 5 minute detail record)109 Filesystem Data Record (60 minute summary record) 11 Netif Data Record ( 5 minute detail record)111 Netif Data Record (60 minute summary record)12 Transaction Data Record ( 5 minute detail record)112 Transaction Data Record (60 minute summary record)13 CPU Data Record ( 5 minute detail record)113 CPU Data Record ( 60 minute summary record)ClassID +1,000,000 Class Data Record ( 5 minute detail record)ClassID +1,000,000+100 Class Data Record (60 minute summary record)
The Date_Seconds metric is identical to the user selectable Date_Seconds metric and is provided to ensure that records can be scanned easily for desired dates and times.
The Number_of_vars metric indicates how many groups of repeating fields are contained in the record. For single instance data types, this value is zero.
For Multiple Instance application records, the Number_of_vars metric is the number of applications configured. For Multiple Instance disk device records, the Number_of_vars metric is the number of disk devices configured. For all header records, this metric is the maximum number of repeating groups allowed.
Binary format files have special formats for the title and header records. These records contain the information needed to describe the contents of the file so that a program can properly interpret it. If headings off is specified, only data records will be in the file. If headings on is specified, the following records will precede all data records.
110 Chapter 6
Binary Header Records
Title Record This record (Record ID -1) is written whenever headings on, regardless of whether the user specified a report title. It contains information about the log file and its source.
First Header Record The first header record (Record ID -2) contains a list of unique item identification numbers corresponding to the items contained in the log file. The position of the item ID numbers can be used to determine the position and size of each exported item in the file.
Second Header Record The second header record (Record ID -3) contains a list of scale factors which correspond to the exported items. For more details, see the discussion of “Scale Factors” later in this section.
Application Name Record This record (Record ID -4) will only be present in application data files that utilize the Multiple Layout format. It lists the names of the applications that correspond to the groups of application metrics in the rest of the file.
Transaction Name Record
This record (Record ID -5) will only be present in transaction tracking data files that utilize the Multiple Layout format. It lists the names of the transactions that correspond to the groups of transaction metrics in the rest of the file.
Disk Device Name Record
This record (Record ID -7) will only be present in disk device data files that utilize the Multiple Layout format. It lists the names of disk devices that correspond to the groups of disk device metrics in the rest of the file.
Logical Volume Name Record
This record (Record ID -8) will only be present in logical volume data files that utilize the Multiple Layout format. It lists the names of logical volumes that correspond to the groups of logical volume metrics in the rest of the file.
Netif Name Record This record (Record ID -9) will only be present in netif (LAN) data files that utilize the Multiple Layout format. It lists the names of netif devices that correspond to the groups of netif device metrics in the rest of the file.
Filesystem Name Record This record (Record ID -12) will only be present in filesystem data files that utilize the Multiple Layout format. It lists the names of filesystems that correspond to the groups of filesystem metrics in the rest of the file.
Cpu Name Record This record (Record ID -13) will only be present in CPU data files that utilize the Multiple Layout format. It lists the names of CPUs that correspond to the groups of CPU metrics in the rest of the file.
Using the Extract Program 111

Binary Title Record
The Title Record for BINARY files contains information designed to assist programmatic interpretation of the exported file's contents. This record will be written to the exported file whenever headings on is specified.
The contents of the Binary Title Record are:
Record Length 4 byte Int Length of Title RecordRecord ID 4 byte Int -1Date_Seconds 4 byte Int Date exported file was createdNumber_of_vars 4 byte Int Maximum number of repeating variablesSize of Fixed Area 4 byte Int Bytes in nonvariable part of recordSize of Variable Entry 4 byte Int Bytes in each variable entryGMT Time Offset 4 byte Int Seconds offset from Greenwich Mean TimeDaylight Savings Time 4 byte Int =1 indicates Daylight Savings TimeSystem ID 40 Characters, System IdentificationCollector Version 16 Characters, Name & version of the data collectorLog File Name 72 Characters, Name of the source log fileReport Title 100 Characters, User specified report title
The Date_Seconds, GMT Time Offset, and Daylight Savings Time metrics in the Binary Title Record apply to the system and time when the export file was created. If this is not the same system that logged the data, these fields cannot properly reflect the data in the file.
Binary Item Identification Record
The first header record (record ID -2) in the binary file contains the unique item numbers for each item exported. Each Item ID is a 4-byte integer number that can be cross referenced using the rxitemid file supplied with this product. The Item ID fields are aligned with the data fields they represent in the rest of the file. All binary exported data items will occupy a multiple of 4 bytes in the exported file and each will start on a 4-byte boundary. If a data item requires more then 4 bytes of space, its corresponding item ID field will be zero filled on the left.
For example, the process metric Program requires 16 bytes. Its data and item ID records would be:
Header 1 (Item Id Record) ...| 0| 0| 0|12012|Process Data Record |Prog|ram_|name| _aaa|
Binary Scale Factor Record
The second header record (record ID -3) in the binary file contains the scale factors for each of the exported items. Numeric items are exported to binary files as 32-bit (4-byte) integers in order to minimize problems with the way in which different computer architectures implement floating point. Before being truncated to fit into the integer format, most items are multiplied by a fixed scale factor. This allows floating point numbers to be expressed as a fraction, using the scale factor as a denominator.
112 Chapter 6
Each scale factor is a 32-bit (4-byte) integer to match the majority of data items. Special values for the scale factors are used to indicate non-numeric and other special valued metrics.
Special Scale Factors
Non-numeric metrics, such as ASCII fields, have zero scale factors. A negative 1 scale factor should not occur, but if it does it indicates an internal error in the extract program and should be reported.
The DATE format is MPE CALENDAR format in the least significant 16 bits of the field (the 16 bits farthest right). The scale factor for date is 512. Scaling this as a 32-bit integer (dividing by 512) isolates the year as the integer part of the date and the day of the year (divided by 512) as the fractional part.
TIME is a 4-byte binary field (hour, minute, second, tenths of seconds). The scale factor for time is 65536. Dividing it by 65536 forms a number where the integer part is the (hour * 256) + minute.
It is easier to handle a Date_Seconds value in a binary file.
Application Name Record
When application data is exported in the Multiple Layout format, a special Application Name Record is written to identify the application groups. For binary format files, this record has record ID -4. It consists of the binary record 16-byte header and a 20-byte application name for each application which was defined at the starting date of the exported data.
If applications are added or deleted during the time covered in the data extraction, the Application Name Record is repeated with the new application names.
Transaction Name Record
When transaction data is exported in the Multiple Layout format, a special Transaction Name Record is written to identify the application-transaction name. For binary format files, this record has a record ID -5. It consists of the binary record 16-byte header and a 60-byte truncated application-transaction name for each transaction that was configured at the starting date of the exported data. If transactions are added during the time covered in the data extraction, the Transaction Name Record will be repeated with the new application-transaction name appended to the end of the original list. Transactions that are deleted after the start of the data extraction will not be removed from the Multiple Layout data record.
Disk Device Name Record
When disk device data is exported in the Multiple Layout format, a special Disk Device Name Record is written to identify the disk device name. For binary format files, this record has a record ID -7. It consists of the binary record 16-byte header and a 20-byte disk device name for each disk device that was configured at the starting date of the exported data.
If disk devices are added during the time covered in the data extraction, the Disk Device Name Record will be repeated with the new disk device name appended to the end of the original list. Disk devices that are deleted after the start of the data extraction will not be removed from the Multiple Layout data record.
Using the Extract Program 113

Logical Volume Name Record
When logical volume data is exported in the Multiple Layout format, a special Logical Volume Name Record is written to identify the logical volume name. For binary format files, this record has a record ID -8. It consists of the binary record 16-byte header and a 20-byte disk device name for each logical volume that was configured at the starting date of the exported data.
If logical volumes are added during the time covered in the data extraction, the Logical Volume Name Record will be repeated with the new logical volume name appended to the end of the original list. Logical volumes that are deleted after the start of the data extraction will not be removed from the Multiple Layout data record.
Netif Name Record
When netif data is exported in the Multiple Layout format, a special Netif Name Record is written to identify the netif device name. For binary format files, this record has a record ID -11. It consists of the binary record 16-byte header and a 20-byte netif device name for each netif device that was configured at the starting date of the exported data.
If netif devices are added during the time covered in the data extraction, the Netif Name Record will be repeated with the new device name appended to the end of the original list. Netif devices that are deleted after the start of the data extraction will not be removed from the Multiple Layout data record.
114 Chapter 6
7 Extract Commands
This chapter describes the extract program’s commands. It includes a table showing command syntax, a table of commands for extracting and exporting data, and a command reference section describing the commands in alphabetical order.
Commands and parameters for extract can be entered with any combination of uppercase and lowercase letters. Only the first three letters of the command's name are required, except for the weekdays and weekly commands that require you to enter the whole name. For example, the command application detail can be abbreviated as app det.
Examples of how these commands are used can be found in online help for the extract program.
The table on the following pages summarizes the syntax of the extract commands and their parameters.
The extract function cannot produce summarized data. Summary data can only be produced by the export function.
Table 8 Extract Commands: Syntax and Parameters
Command Parameter
application ondetailsummary (export only)both (export only)off (default)
class detail (default)summary (export only)both (export only)off
cpu detailsummary (export only)both (export only)off (default)
configuration ondetailoff (default)
disk ondetailsummary (export only)both (export only)off (default)
115
exite
export day[ddd] [-days]week [ww] [-weeks] month[mm] [-months] year [yy] [-years]
extract day[ddd] [-days]week [ww] [-weeks] month[mm] [-months] year [yy] [-years]
filesystem detailsummary (export only) both (export only)off (default)
global ondetail (default)summary (export only)both (export only)off
guide
help
list filename *
logfile logfile
lvolume ondetail summary (export only)both (export only) off (default)
menu
monthl
y yyymmmm
netif ondetail summary (export only)both (export only) off (default)
output outputfile ,new ,purgeboth ,append
Table 8 Extract Commands: Syntax and Parameters (cont’d)
Command Parameter
116 Chapter 7

process ondetail [app#[-#],...]off (default)killed
quitq
report [export template file], show
shift starttime - stoptime all day noweekends
sh!
shell command
show all
start date[time]today[-days][time]last[-days][time]first[+days][time]
stop date[time]today[-days][time]last[-days][time]first[+days][time]
transaction ondetail summary (export only)both (export only)off (default)
weekdays 1.....7
weekly yywwww
yearly yyyyyy
Table 8 Extract Commands: Syntax and Parameters (cont’d)
Command Parameter
Extract Commands 117

The following table lists the commands that are used for extracting and exporting data and the types of log files used (scope log files or DSI log files).
Table 9 Extract Commands: Extracting and Exporting Data
CommandExtract Data
Export Data
scope Log Files
DSI Log Files
application x x x
class x x x x
configuration x x
cpu x x x
disk x x x
export x x x
extract x x
filesystem x x x
global x x x
logfile x x x x
lvolume x x x
monthly x x
netif x x
output x x x x
process x x x
report x x x
shift x x x
start x x x x
stop x x x x
transaction x x x x
weekdays x x x
weekly x x
yearly x x
logicalsystems x x x
118 Chapter 7

application
Use the application command to specify the type of application data that is being extracted or exported.
The default is application off
Syntax
Parameters
Example
In this example, the application command causes detailed application log file data to be exported: The output export file contains the application metrics specified in the myrept export template file.
logfile /var/opt/perf/datafiles/logglobglobal offapplication detailreport /var/opt/perf/myreptexport
To perform the above task using command line arguments, enter:
extract -a -r /var/opt/perf/myrept -xp
application
[on][detail][summary][both][off]
on or detail Specifies that raw, 5-minute detail data should be extracted or exported.
summary(export only)
Specifies that data should be summarized by:• the number of minutes specified with the summary parameter in
the specified export template file (export only)• the default summary interval of one hour (export or extract)Summarization can significantly reduce the size of the resulting extracted or exported data, depending on the summarization interval used. For example, hourly summary data is about one-tenth the size of 5-minute detail data.
both(export only)
Specifies that detail data and summary data are to be extracted or exported.
off Specifies that no data of this type is to be extracted or exported.
If you are using Performance Manager, detail data must be included in an extracted file before drawing application graphs with points every 5 minutes.
Extract Commands 119

class
Use the class command to specify the class of DSI data to be exported, or scope data to be extracted or exported.
The default is class detail.
Syntax
Parameters
Examples
To export summary data in a DSI log file that contains a class named acctg_info, issue the following command:
class acctg_info summary
Once the log file is specified by the user and opened by the extract program, the acctg_info class is verified to exist in the log file and can subsequently be exported.
Other variations of this command are:
CLASS ACCTG_INFO SUMMARYclass ACCTG_INFO summaryclass acctg_info sum
Commands can be either uppercase or lowercase. Class names are always upshifted and then compared.
In the following example, summary data in a class named fin_info is exported.
extract>class fin_info summaryexport
To perform the above task using command line arguments, enter:
extract -l dsi.log -C fin_info summary -xp
[detail]
class [classname] [summary]
[both]
[off]
classname Name of a group similarly classified metrics.
detail For DSI log files, specifies how much detail data is exported according to the time set in DSI log file. For more information, see Overview of Data Source Integration on page 259.For scope log files, specifies that raw, 5-minute detail should be extracted or exported.
summarybothoff
See “Parameters” in the description of the command application on page 119. Summary and both can only be exported.
120 Chapter 7

configuration
Use the configuration command to specify whether or not to export system configuration information.
The default is configuration off.
Syntax
Parameters
All configuration information available in the log file is exported. Any begin, end, shift, start, stop or noweekends commands that are used with the configuration command are ignored.
Example
In this example, the configuration command causes system configuration information to be exported. The output export file contains the configuration metrics specified in the myrept export template file.
logfile /var/opt/perf/datafiles/logglobconfiguration onreport /var/opt/perf/myreptexport
To perform the above task using command line arguments, enter:
extract -c -r /var/opt/perf/myrept -xp
cpu
Use the cpu command to specify the summarization level of CPU.
The default is cpu off.
Syntax
Parameters
configuration[on][detail][off]
on or detail Specifies that all configuration records should be exported.
off Specifies that no configuration data is to be exported.
The configuration command affects only the export function. The extract function is not affected because it always extracts system configuration information.
cpu[detail][summary][both][off]
Extract Commands 121

Example
In this example, the cpu command causes CPU detail data that was collected starting July 26, 2001 to be exported. Because no export template file is specified, the default export template file, reptfile, is used. All disk metrics are included in the output file as specified by reptfile.
logfile /var/opt/perf/datafiles/logglobglobal offcpu detailstart 7/26/01export
To perform the above task using command line arguments, enter:
extract -u -b 7/26/01 -xp
disk
Use the disk command to specify the type of disk device data that is being extracted or exported.
The default is disk off.
Syntax
Parameters
Example
In this example, the disk command causes disk detail data that was collected starting July 5, 1999 to be exported. Because no export template file is specified, the default export template file, reptfile, is used. All disk metrics are included in the output file as specified by reptfile.
logfile /var/opt/perf/datafiles/logglobglobal offdisk detailstart 7/5/99export
detail Extracts or exports 5-minute detail records.
summary Exports summary records.
both Exports both detail and summary records.
off Extracts or exports no CPU data.
disk
[on][detail][summary][both][off]
on or detailsummarybothoff
See “Parameters” in the description of the application command at the beginning of this chapter. Summary and both can only be exported.
122 Chapter 7
To perform the above task using command line arguments, enter:
extract -D -b 7/5/99 -xp
exit
Use the exit command to terminate the extract program. The exit command is equivalent to the extract program’s quit command.
Syntax
exite
export
Use the export command to start the process of copying data into an exported file format.
Syntax
Parameters
Use one of the following parameters to export data for a particular interval.
If no parameters are used with the export command, the interval used for the exported data is set by the start and stop commands.
How to Use It
There are four ways to specify a particular interval (day, week, month, year).
• Current interval - Specify the parameter only. For example, month means the current month.
• Previous interval - Specify the parameter, a minus, and the number of intervals before the current one desired. For example, day-1 is yesterday, week-2 is two weeks prior to the current week.
export[day[week[month[year
[ddd] [yyddd] [-days]][ww] [yyww] [-weeks]][mm] [yymm] [-months]][yy] [yyyy] [-years]]
day Represents a single day
week Represents a single week, Monday through Sunday
month Represents a single month, first through last calendar day
year Represents a single year, first through last calendar day
Extract Commands 123

• Absolute interval - Specify the parameter and a positive number. The number indicates the absolute interval desired in the current year. For example, day 2 is January 2 of the current year.
• Absolute interval plus year - Specify the parameter and a large positive number. The number should consist of the last two digits of the year and the absolute interval number in that year. In this format the absolute day would have 5 digits (99002 means January 2, 1999) and all other parameters would have four digits (month 9904 means April of 1999).
If you have not previously specified a log file or an export template file, the logfile command uses the default global log file logglob and the report command uses the default export template file reptfile.
The settings or defaults for all other parameters are used. For details on their actions, see descriptions of the application, configuration, global, process, disk, lvolume, netif, CPU, filesystem, transaction, output, shift, start, and stop commands.
The export command creates up to 16 different default output files based on the types of data and level of summarization specified.
where ext = asc, dat, bin, or wk1
The default file names are created from the data type name. The prefix is either xfrd or xfrs depending if the data is detailed or summary data. The extension is the specified asc (ASCII), bin (binary), dat (datafile), or wk1 (spreadsheet) data format.
For example, classname = ACCTG_INFO would have export file names of:
xfrdGLOBAL.ext Global detail data file
xfrsGLOBAL.ext Global hourly summary data file
xfrdAPPLICATION.ext Application detail data file
xfrsAPPLICATION.ext Application hourly summary data file
xfrdPROCESS.ext Process detail data file
xfrdDISK.ext Disk device detail data file
xfrsDISK.ext Disk device summary data file
xfrdVOLUME.ext Logical volume detail data file
xfrsVOLUME.ext Logical volume summary data file
xfrdNETIF.ext Netif detail data file
xfrsNETIF.ext Netif summary data file
xfrdCPU.ext CPU detail data type
xfrsCPU.ext CPU summary data type
xfrdFILESYSTEM.ext Filesystem detail data type
xfrsFILESYSTEM.ext Filesystem summary data type
xfrdTRANSACTION.ext Transaction detail data file
xfrsTRANSACTION.ext Transaction summary data file
xfrdCONFIGURATION.ext Configuration detail data file
xfrdACCTG_INFO.wk1 detailed spreadsheet data for ACCT_INFO
xfrsACCTG_INFO.asc summarized ASCII data for ACCT_INFO
124 Chapter 7
For more information about exporting data, see Overview of the Export Function on page 101 in Chapter 5.
Example
In this example, the export command causes log file data collected yesterday from 8:00 am to 5 pm to be exported. Because no export template file is specified, the default export template file, reptfile, is used. All global metrics are included in the output file as specified by reptfile
logfile /var/opt/perf/datafiles/logglobstart today-1 8:00 amstop today-1 5:00 pmglobal bothexport
To perform the above task using command line arguments, enter:
extract -gG -b today-1 8:00 am -e today-1 5:00 pm -xp
extract
Use the extract command to start the process of copying data from raw log files into an extracted file format. Extracted files can be used for archiving or for analysis by analyzer programs such as Performance Manager. You can extract data from raw log files and from extracted files.
The extract command cannot be used to process data from DSI log files.
Syntax
Parameters
Use one of the following parameters to extract data for a particular interval:
If no parameters are used with the extract command, the interval used for data extraction is set by the start and stop commands.
How to Use It
There are four ways to specify a particular interval (day, week, month, year).
• Current interval - Specify the parameter only. For example, month means the current month.
extract[day[week[month[year
[ddd] [yyddd] [-days]][ww] [yyww] [-weeks]][mm] [yymm][-months]][yy] [yyyy] [-years]]
day Represents a single day
week Represents a single week, Monday through Sunday
month Represents a single month, first through last calendar day
year Represents a single year, first through last calendar day
Extract Commands 125
• Previous interval - Specify the parameter, a minus, and the number of intervals before the current one desired. For example, day-1 is yesterday, week-2 is two weeks prior to the current week.
• Absolute interval - Specify the parameter and a positive number. The number indicates the absolute interval desired in the current year. For example, day 2 is January 2 of the current year.
• Absolute interval plus year - Specify the parameter and a large positive number. The number should consist of the last two digits of the year and the absolute interval number in that year. In this format, the absolute day would have five digits (99002 means January 2, 1999) and all other parameters would have four digits (month 99904 means April of 1999).
The extract command starts data extraction. If not previously specified, the logfile and output commands assume the following defaults when the extract command is executed:
log file = /var/opt/perf/datafiles/loggloboutput file = rxlog,new
The settings or defaults for all other parameters are used. For details on their actions, see descriptions of the application, global, process, disk, lvolume, netif, CPU, filesystem, transaction, shift, start, and stop commands.
The size of an extracted log file cannot exceed 3.5 gigabytes.
Example
In the first example, data collected from March 1, 2000 to June 30, 2000 during the hours 8:00 am to 5:00 pm on weekdays is extracted. Only global and application detail data is extracted.
logfile /var/opt/perf/datafiles/logglobstart 03/01/00stop 06/30/00shift 8:00 am - 5:00 pm noweekendsglobal detailapplication detailextract
To perform the above task using command line arguments, enter:
extract -ga -b 03/01/00 -e 6/30/00 -s 8:00 am - 5:00 noweekends -xt
In the second example, a new extracted log file named rxjan00 is created. Any existing file that has this name is purged. All raw log file data collected from January 1, 2000 through January 31, 2000 is extracted:
logfile /var/opt/perf/datafiles/loggloboutput rxjan00,purgestart 01/01/00stop 01/31/00global detailapplication detailtransaction detailprocess detaildisk detaillvolume detailnetif detailfilesystem detailcpu detailextract
126 Chapter 7
To perform the above task using command line arguments, enter:
extract -f rxjan00,purge -gatpdznyu -b 01/01/00 -e 01/31/00 -xt
filesystem
Use this command to specify the summarization level of filesystem data to extract or export.
The default is filesystem off.
Syntax
Parameters
Example
In this example, the filesystem command causes filesystem detail data that was collected starting July 26, 2001 to be exported. Because no export template file is specified, the default export template file, reptfile, is used. All filesystem metrics are included in the output file as specified by reptfile.
logfile /var/opt/perf/datafiles/logglobglobal offfilesystem detailstart 7/26/01export
To perform the above task using command line arguments, enter:
extract -y -b 7/26/01 -xp
global
Use the global command to specify the amount of global data to be extracted or exported.
The default is global detail. (In command line mode, the default is global off.)
filesystem[detail][summary][both][off]
detail Extracts or exports 5-minute detail records.
summary Exports summary records.
both Exports both detail and summary records.
off Extracts or exports no filesystem data.
Extract Commands 127

Syntax
Parameters
How to Use It
Detail data must be extracted if you want to draw Performance Manager global graphs with points every 5 minutes.
Summarized data is graphed by Performance Manager more quickly since fewer data records are needed to produce a graph. If only global summaries are extracted, Performance Manager global graphs cannot be drawn with data points every 5 minutes.
The both option maintains the access speed gained with the hourly summary records while permitting you to draw Performance Manager global graphs with points every 5 minutes.
The off parameter is not recommended if you are using Performance Manager because you must have global data to properly understand overall system behavior. Performance Manager global graphs cannot be drawn unless the extracted file contains at least one type of global data.
Example
The global command is used here to specify that no global data is to be exported (global detail is the default). Only detailed transaction data is exported. The output export file contains the transaction metrics specified in the myrept export template file.
extract>logfile /var/opt/perf/datafiles/logglobglobal offtransaction detailreport /var/opt/perf/myreptexport
To perform the above task using command line arguments, enter:
extract -l -t -r /var/opt/perf/myrept -xp
guide
Use the guide command to enter guided commands mode. The guided command interface leads you through various extract commands and prompts you to perform some of the most common tasks that are available.
Syntax
guide
global
[on][detail][summary][both][off]
detail or onsummarybothoff
See “Parameters” in the description of the application command at the beginning of this chapter. Summary and both can only be exported.
128 Chapter 7
How to Use It
• To enter guided commands mode from extract‘s interactive mode, type guide.
• To accept the default value for a parameter, press Return.
• To terminate guided commands mode and return to interactive mode, type q at the guide> prompt.
This command does not provide all possible combinations of parameter settings. It selects settings that should produce useful results for the majority of users. You can obtain full control over extract‘s functions through extract‘s interactive command mode.
help
Use the help command to access online help.
Syntax
help [keyword]
How to Use It
You can enter parameters to obtain information on extract commands and tasks, or on help itself. You can navigate to different topics by entering a key word. If more than one page of information is available, the display pauses and waits for you to press Return before continuing. Type q or quit to exit the help system and return to the extract program.
You can also request help on a specific topic. For example,
help tasks
or
help resize parms
When you use this form of the help command, you receive the help text for the specified topic and remain in the extract command entry context. Because you do not enter the help subsystem interactively, you do not have to type quit before entering the next extract command.
list
Use the list command to specify the list file for all extract program reports.
Syntax
How to Use It
If you are exporting DSI log file data, we recommend using guided commands mode to create a customized export template file and export the data.
list [file][*]
Extract Commands 129

You can use list at any time while using extract to specify the list device. It uses a file name or list device name to output the user-specified settings. If the list file already exists, the output is appended to it.
The data that is sent to the list device is also displayed on your screen.
While extract is running, type:
list outfilename
To return the listing device to the user terminal, type:
list stdout
or
list *
To determine the current list device, type the list command without parameters as follows:
list
If the list file is not stdout, most commands are echoed to the list file as they are entered.
Example
The following example, the list device is set to mylist. The results of the next commands are printed to mylist and displayed on your screen.
extract>logfile /var/opt/perf/datafiles/loggloblist mylistglobal detailshift 8:00 AM - 5:00 PMextract
logfile
Use the logfile command to open a log file. You must open a log file for all extract program functions. You can do this explicitly by issuing the logfile command, or implicitly by issuing the extract command or export command. If you do not specify a log file name, the extract program prompts you for a log file name and displays the default global log file /var/opt/perf/datafiles/logglob. You can either accept the default or specify a different log file.
Syntax
logfile [logfile]
How to Use It
To open a log file, you can specify the name of either a raw or extracted log file. You cannot specify the name of a file created by the export command. If you specify an extracted log file name, all information is obtained from this single file. If you specify a raw log file name, you must specify the name of the global log file before you can access the raw log file. This is the only raw log file name you should specify.
If the log file is not in your current working directory, you must provide its path.
130 Chapter 7
The global log file and other raw log files must be in the same directory. They have the following names:
The general contents of the log file are displayed when the log file is opened.
Example
This is a typical listing of the default global log file.
Global file: /var/opt/perf/datafiles/logglob, version D Application file: /var/opt/perf/datafiles/logapplProcess file: /var/opt/perf/datafiles/logprocDevice file: /var/opt/perf/datafiles/logdevTransaction file: /var/opt/perf/datafiles/logdevIndex file: /var/opt/perf/datafiles/logindxSystem ID: homerSystem Type 9000/715/ S/N 2223334442 O/S HP-UX B.10.20 AData collector: SCOPE/UX C.02.30File Created: 10/08/99Data Covers: 44 days to 11/20/99Shift is: All DayData records available are: Global Application Process Disk Volume TransactionMaximum file sizes:Global=10.0 Application=10.0 Process=20.0 Device=10.0 Transaction=10.0 MBThe first GLOBAL record is on 10/08/99 at 08:17 AMThe first NETIF record is on 10/08/99 at 08:17 AMThe first APPLICATION record is on 11/17/99 at 12:15 PMThe first PROCESS record is on 10/08/99 at 08:17 AMThe first DEVICE record is on 10/31/99 at 10:45 AMThe Transaction data file is emptyThe default starting date & time = 10/08/99 11:50 AM (LAST -30)The default stopping date & time = 11/20/99 11:59 PM (LAST -0)
lvolume
Use the lvolume command to specify the type of logical volume data that is being extracted or exported. (This command is used only on HP-UX systems.)
The default is lvolume off.
Syntax
loggloblogappllogproclogdevlogtranlogindx
global log fileapplication log fileprocess log filedevice log filetransaction log fileindex log file
Do not rename raw log files! When accessing these files, the program assumes that the standard log file names are in effect. If you must rename log files to place log files from multiple systems on the same system for analysis, you should first extract the data and then rename the extracted log files.
Extract Commands 131
Parameters
Example
In this example, a new extracted log file named rx899 is created and any existing file that has that name is purged. All logical volume data collected from August 1 through August 31 is extracted.
logfile /var/opt/perf/datafiles/loggloboutput rx899,purgestart 08/01/99stop 08/31/99global detaillvolume detailmonth 9908
To perform the above task using command line arguments, enter:
extract -f rx899,purge -gz -xm 9908
menu
Use the menu command to print a list of the available extract commands.
Syntax
menu
Example
Command Parameters Function
HELP [topic] Get information on commands and options
GUIDE Enter guided commands mode for novice users
LOGFILE [logname] Specify a log file to be processed
LIST [filename|*] Specify the listing file
OUTPUT [filename] [,NEW/PURGE/APPEND] Specify a destination file
REPORT [filename][,SHOW] Specify an Export Format file for EXPORT"
GLOBAL [DETAIL/SUMMARY/BOTH/OFF] Extract GLOBAL records
APPLICATION [DETAIL/SUMMARY/BOTH/OFF] Extract APPLICATION records
PROCESS [DETAIL/OFF/KILLED][APP=] Extract PROCESS records
lvolume
[on][detail][summary][both][off]
on or detailsummarybothoff
See “Parameters” in the description of the application command at the beginning of this chapter. Summary and both can only be exported.
132 Chapter 7

DISK [DETAIL/SUMMARY/BOTH/OFF] Extract DISK DEVICE records
LVOLUME [DETAIL/SUMMARY/BOTH/OFF] Extract Logical VOLUME records
NETIF [DETAIL/SUMMARY/BOTH/OFF] Extract Logical NETIF records
CPU [DETAIL/SUMMARY/BOTH/OFF] Extract CPU records
FILESYSTEM [DETAIL/SUMMARY/BOTH/OFF] Extract FILESYSTEM records
CONFIG [DETAIL/OFF] Export CONFIGURATION records
CLASS classname[DETAIL/SUMMARY/BOTH/OFF] Export classname records
TRANSACTION [DETAIL/SUMMARY/BOTH/OFF] Extract TRANSACTION records
START [startdate time] Specify a starting date and time for SCAN
STOP [stopdate time] Specify an ending date and time for SCAN
SHIFT [starttime - stoptime] [NOWEEKENDS] Specify daily shift times
SHOW [ALL] Show the current program settings
EXPORT [d/w/m/y][-offset] Copy log file records to HOST format files
EXTRACT [d/w/m/y][-offset] Copy selected records to output (or append) file
WEEKLY [ww/yyww] Extract one calendar week's data with auto file names
MONTHLY [mm/yymm] Extract one calendar month's data with auto file names
YEARLY [yy/yyyy] Extract one calendar year's data with auto file names
WEEKDAYS [1...7] Set days to exclude from export 1=Sunday ! or SH [command] Execute a system command
MENU or ? List the command menu (this listing)
EXIT or Q Terminate the program
monthly
Use the monthly command to specify data extraction based on a calendar month. During execution, this command sets the start and stop dates to the proper dates, based on the month and year of the data extracted.
The name of the output file consists of the letters rxmo followed by the four digits of the year and the two-digit number of the month being extracted. For example, data extracted in March 1999 would be output to a file named rxmo199903.
Syntax
Parameters
monthly [yymm][mm]
Extract Commands 133
If you do not specify the log file before executing the monthly command, the default logglob file is used.
How to Use It
Use the monthly command when you are extracting data for archiving on a monthly basis.
The type of data extracted and summarized follows the normal rules for the extract command and can be set before executing the monthly command. These settings are honored unless a monthly output file already exists. If it does, data is appended to it based on the type of data that was originally specified.
The monthly command has a feature that opens the previous month's extracted file and checks to see if it is filled--whether it contains data extracted up to the last day of the month. If not, the monthly command appends data to this file to complete the previous month's extraction.
For example, a monthly command is executed on May 7, 1999. This creates a log file named rxmo199905 containing data from May 1 through the current date (May 7).
On June 4, 1999, another monthly command is executed. Before the rxmo199906 file is created for the current month, the rxmo199905 file from the previous month is opened and checked. When it is found to be incomplete, data is appended to it to complete the extraction through May 31, 1999. Then, the rxmo199906 file is created to hold data from June 1, 1999 to the current date (June 4).
As long as you execute the monthly command at least once a month, this feature will complete each month's file before creating the next month's file. When you see two adjacent monthly files--for example, rxmo199905 (May) and rxmo199906 (June)--you can assume that the first file is complete for that month and it can be archived and purged.
Example
In this example, detail application data logged during May 1999 is extracted.
logfile /var/opt/perf/datafiles/logglobglobal offapplication detailmonthly 9905
To perform the above task using command line arguments, enter:
extract -a -xm 9905
monthly Extracts data from the current (default) month.
monthly mm Extracts data for a specific month from the current year’s data (where mm is a number from 01 to 12).
monthly yymm Extracts data for a specific month and year (where yymm is a single number consisting of the last two digits of the year and two-digit month number). For example, to extract data for February 1999, specify monthly 9902.
The monthly and extract month commands are similar in that they both extract one calendar month's data. The monthly command ignores the setting of the output command, using instead predefined output file names. It also attempts to append missing data to the previous month's extracted log file if it is still present on the system. The extract month command, on the other hand, uses the settings of the output command. It cannot append data to the previous month's extracted file since it does not know its name.
134 Chapter 7
netif
Use the netif command to specify the type of logical network interface (LAN) data to extract or export. Netif data is logged in the logdev file.
The default is netif off.
Syntax
Parameters
Example
In this example, netif detail data collected from March 1, 2000 to June 30, 2000 during the hours 8:00 am to 5:00 pm on weekdays is extracted.
logfile /var/opt/perf/datafiles/logglobstart 03/01/00stop 06/30/00shift 8:00 AM - 5:00 PM noweekendsnetif detailextract
To perform the above task using command line arguments, enter:
extract -n -b 03/01/00 -e 6/30/00 -s 8:00 am - 5:00 noweekends -xt
output
Use the output command to specify the name of an output file for the extract or export functions.
The optional second parameter specifies the action to be taken if an output file with the same name exists.
Syntax
Parameters
netif
[on][detail][summary][both][off]
on or detailsummarybothoff
See “Parameters” in the description of the application command at the beginning of this chapter. Summary and both can only be exported.
output [filename][,new][,purge][,append]
Extract Commands 135
How to Use It
If you do not specify an action in batch mode, the default action,new is used. In interactive mode, you are prompted to enter an action if a duplicate file is found.
If you do not specify an output file, default output files are created. The default output file names are:
For extract: rxlog
For export:
xfrdGLOBAL.ext xfrsGLOBAL.ext xfrdAPPLICATION.ext xfrsAPPLICATION.ext xfrdPROCESS.ext xfrdDISK.ext xfrsDISK.ext xfrdLVOLUME.extxfrsLVOLUME.extxfrdNETIF.extxfrsNETIF.extxfrdCPU.extxfrsCPU.extxfrdFILESYSTEM.extxfrsFILESYSTEM.extxfrdTRANSACTION.ext xfrsTRANSACTION.extxfrdCONFIGURATION.ext
where ext = asc (ASCII), dat (datafile), bin (binary), or wk1 (spreadsheet).
A special file name, stdout (or *), can be used with the export operation to direct the output to the stdout file (normally your terminal or workstation, although this can be redirected using shell commands).
output stdout
or
output *
To return the output to its default settings, type:
output default
or
output -
,new Specifies that the output file must be a new file. This is the default action in batch mode. If a file with the same name exists, the batch job terminates.
,purge Specifies that any existing file should be purged to make room for the new output file.
,append Specifies that an existing extracted file should have data appended to it. If no file exists with the output file name specified, a new file is created.
136 Chapter 7

Example
In this example, no output file is specified so the default output file, rxlog is used for the application summary data being extracted. The ,purge option specifies that any existing output file should be purged.
extract>logfile /var/opt/perf/datafiles/loggloboutput rxlog,purgeglobal offapplication detailextract month 9905
To perform the above task using command line arguments, enter:
extract -f rxlog,purge -a -xm 9905
process
Use the process command to specify whether or not to extract or export process data.
The default is process off.
Syntax
Parameters
You can override the default output file names for exported files using the output parameter in the export template file.You should not output extract operation files to stdout, because they are incompatible with ASCII devices. You should also not output binary or WK1 formats of the export operation to the stdout file for the same reason.Care should be taken to avoid appending extracted data to an existing exported data file and to avoid appending exported data to an existing extracted file. Attempts to append the wrong data type will result in an error condition.
[on]
process [detail] [application=#[-#] ,...]
[off]
[killed]
on Specifies that process data should be extracted or exported.
detail Specifying process detail is the same as specifying process on.
Extract Commands 137

Example
In this example, the process command specifies processes that terminated during an interval and belong to applications 1, 4, 6, 7, 8, or 10. Use the utility program’s scan command to find the application numbers for specific applications.
process killed applications=1,4,6-8,10
quit
Use the quit command to terminate the extract program. The quit command is equivalent to the extract program’s exit command.
Syntax
quit
q
report
Use the report command to specify the export template file to be used by the export function. If no export template file is specified, the default export template file, reptfile, is used. The export template file is used to specify various output format attributes used in the export function. It also specifies which metrics will be exported.
If you are in interactive mode and specify no export template file, all metrics for the data types requested will be exported in ASCII format.
Syntax
report [exporttemplatefile] [,show]
Parameters
off Specifies that process data should not be extracted or exported.
killed Specifies only processes that have an interest reason that includes killed. (Processes that terminated in the measurement interval.)
application Specifies only processes that belong to selected applications. An application can be entered as a single number or as a range of application numbers (7-9 means applications 7, 8, and 9). The application number is determined by the order of the application definition in the parm file when the data was collected. If you are specifying multiple applications, separate each one with a comma.
Process data can increase the size of an extracted log file significantly. If you plan to copy the log file to a workstation for analysis, you might want to limit the amount of process data extracted.
138 Chapter 7

How to Use It
When you issue this command, you are prompted by a message that asks whether or not you want to validate metrics in the export template with the previously specified log file. Validation ensures that the metrics specified in the export template file exist in the log file. This allows you to check for possible errors in the export template file. If no validation is performed, this action is deferred until you perform an export.
sh
Use sh to enter a shell command without exiting extract by typing sh or an exclamation point(!) followed by a UNIX shell command.
Syntax
sh or ! [shell command]
Parameters
How to Use It
Following the execution of the single command, you automatically return to extract. If you want to issue multiple shell commands without returning to extract after each one, you can start a new shell.
If you issue the sh command without the name of the shell command, you are prompted to supply it. For example,
sh
enter SYSTEM command: ls
shift
Use the shift command to limit data extraction to certain hours of the day corresponding to work shifts and to exclude weekends (Saturday and Sunday).
The default is shift all day to extract data for all day, every day including weekends.
,show Specifies that the field positions and starting columns should be listed for all metrics specified in the export template file. This listing can be used when export files are processed by other programs.
The ,show parameter of the report command discussed here is different from the show command discussed later.
sh ls Executes the ls command and returns to extract. The shell command is any system command.
!ls Same as above.
!ksh Starts a Korn shell. Does not return immediately to extract. Type exit or CTRL-d Return to return to the extract program.
Extract Commands 139

Syntax
Parameters
The starttime and stoptime parameters are entered in the same format as the time in the start command. Shifts that span midnight are permitted. If starttime is scheduled after the stoptime, the shift will start at the start time and proceed past midnight, ending at the stoptime of the next day.
Example
In this example, disk detail data collected between 10:00 am and 4:00 pm every day starting June 15, 1999 is extracted.
extract>logfile /var/opt/perf/datafiles/logglobglobal offdisk detailshift 10:00 am - 4:00 PMstart 6/15/99extract
To perform the above task using command line arguments, enter:
extract -d -b 6/15/99 -s 10:00 AM-4:00 PM -xt
show
Use the show command to list the names of the opened files and the status of the extract parameters that can be set.
Syntax
show [all]
Examples
Use show by itself to produce a list that may look like this:
Logfile: /var/opt/perf/datafiles/logglobOutput: DefaultReport: DefaultList: "stdout"
shift [starttime-stoptime][all day][noweekends]
all day Specifies the default shift of 12:00 am - 12:00 am (or 00:00 -00:00 on a 24-hour clock).
noweekends Specifies the exclusion of data which was logged on Saturdays and Sundays. If noweekends is entered in conjunction with a shift that spans midnight, the weekend will consist of those shifts that start on Saturday or Sunday.
The show command discussed here is different from the ,show parameter of the report command discussed earlier.
140 Chapter 7

The default starting date & time = 10/08/99 12:00 AM (LAST -30)The default stopping date & time = 11/20/99 11:59 PM (LAST -0)The default shift = 12:00 AM - 12:00 PMGLOBAL DETAIL records will be processedAPPLICATION. . . . . . . . . . NO records will be processedPROCESS . . . . . . . . . . . NO records will be processedDISK DEVICE. . . . . . . . . . NO records will be processedLVOLUME. . . . . . . . . . . . NO records will be processedTRANSACTION. . . . . . . . . . NO records will be processedNETIF . . . . . . . . . . . . .NO records will be processedCPU . . . . . . . . . . . . . .NO records will be processedFILESYSTEM. . . . . . . . . . .NO records will be processedConfiguration . . . . . . . . .NO records will be processedUse show all to produce a more detailed list that may look like this:Logfile: /var/opt/perf/datafiles/logglobGlobal file: /var/opt/perf/datafiles/logglob,version D Application file: /var/opt/perf/datafiles/logapplProcess file: /var/opt/perf/datafiles/logprocDevice file: /var/opt/perf/datafiles/logdevTransaction file: /var/opt/perf/datafiles/logdevIndex file: /var/opt/perf/datafiles/logindxSystem ID: homerSystem Type 9000/715/ S/N 2223334442 O/S HP-UX B.10.20 AData collector: SCOPE/UX C.02.30File Created: 10/08/99Data Covers: 44 days to 11/20/99Shift is: All DayData records available are: Global Application Process Disk Volume TransactionMaximum file sizes: Global=10.0 Application=10.0 Process=20.0 Device=10.0 Transaction=10.0 MBOutput: DefaultReport: DefaultList: "stdout"The default starting date & time = 10/08/99 11:50 AM (LAST -30)The default stopping date & time = 11/20/99 11:59 PM(LAST - 0)The default shift = 12:00 AM - 12:00 PMGLOBAL...........DETAIL...........records will be processedAPPLICATION....................NO records will be processedPROCESS........................NO records will be processedDISK DEVICE....................NO records will be processedLVOLUME........................NO records will be processedTRANSACTION....................NO records will be processedNETIF..........................NO records will be exportedCPU............................NO records will be processedFILESYSTEM.....................NO records will be processedConfiguration ..................NO records will be exportedExport Report Specifications: Interval = 3600, Separator = " " Missing data will not be displayed Headings will be displayed Date/time will be formatted Days to exclude: None
Extract Commands 141

start
Use the start command to set a starting date and time for the extract and export functions. The default starting date is the date 30 full days before the last date in the log file, or if less than 30 days are present, the date of the earliest record in the log file.
Syntax
Parameters
How to Use It
The following commands override the starting date set by the start command.
• weekly
• monthly
• yearly
• extract (If day, week, month, or year parameter is used)
• export (If day, week, month, or year parameter is used)
Example
In this example, the start command specifies June 5, 1999 8:00 am as the start time of the first interval to be extracted. The output command specifies an output file named myout.
logfile /var/opt/perf/datafiles/logglob
start [date [time]][today [-day][time]][last [-days][time]][first [+days][time]]
date The date format depends on the native language that is configured for your system. If you do not use native languages or you have set C as the default language, the data format is mm/dd/yy (month/day/year) such as 09/30/99 for September 30, 1999, for the extract or export function.
time The time format also depends on the native language used. For the C language, the format is hh:mm am or hh:mm pm (hour:minute in a 12-hour format with the am or pm suffix). For example, 07:00 am is 7 o'clock in the morning.Twenty-four hour time is accepted in all languages. For example, 23:30 would be accepted for 11:30 pm.If the format of the date or time is unacceptable, you are prompted with an example in the correct format.If no start time is given, midnight (12:00 am) is assumed. A starting time of midnight for a given day starts at the beginning of that day (00:00 on a 24-hour clock).
today Specifies the current day. The qualification of the parameter, such as today-days, specifies the number of days prior to today's date. For example, today-1 indicates yesterday's date and today-2, the day before yesterday.
last Can be used to represent the last date contained in the log file. The parameter last-days specifies the number of days prior to the last date in the log file.
first Can be used to represent the first date contained in the log file. The parameter first+days specifies the number of days after the first date in the log file.
142 Chapter 7

start 6/5/99 8:00 amoutput myoutglobal detailextract
To perform the above task using command line arguments, enter:
extract -g -b 06/05/99 8:00 AM -f myout -xt
stop
Use the stop command to terminate an extract or export function at a specified date and time.
The default stopping date and time is the last date and time recorded in the log file.
Syntax
Parameters
How to Use It
The following commands override the stopping date set by the stop command.
• weekly
start [date [time]][today [-day][time]][last [-days][time]][first [+days][time]]
date The date format depends on the native language that is configured for your system. If you do not use native languages or you have set C as the default language, the data format is mm/dd/yy (month/day/year) such as 09/30/99 for September 30, 1999, for the extract or export function.
time The time format also depends on the native language used. For the C language, the format is hh:mm am or hh:mm pm (hour:minute in a 12-hour format with the am or pm suffix). For example, 07:00 am is 7 o'clock in the morning.Twenty-four hour time is accepted in all languages. For example, 23:30 would be accepted for 11:30 pm.If the format of the date of time is unacceptable, you are prompted with an example in the correct format.If no stop time is given, one minute before midnight (11:59 pm) is assumed. A stopping time of midnight (12:00 am) for a given day stops at the end of that day (23:59 on a 24-hour clock).
today Specifies the current day. The qualification of the parameter, such as today-days, specifies the number of days prior to today's date. For example, today-1 indicates yesterday's date and today-2 the day before yesterday.
last Can be used to represent the last date contained in the log file. The parameter last-days specifies the number of days prior to the last date in the log file.
first Can be used to represent the first date contained in the log file. The parameter first+days specifies the number of days after the first date in the log file.
Extract Commands 143
• monthly
• yearly
• extract (If day, week, month, or year parameter is used)
• export (If day, week, month, or year parameter is used)
Example
In this example, the stop command specifies June 5, 1999 5:00 pm as the stopping time of the last interval to be extracted. The output command specifies an output file named myout.
extract>logfile /var/opt/perf/datafiles/logglobstart 6/5/99 8:00 AMstop 6/5/99 5:00 PMoutput myoutglobal detailextract
To perform the above task using command line arguments, enter:
extract -g -b 6/5/99 8:00 AM -e 6/5/99 5:00 PM -f myout -xt
transaction
Use the transaction command to specify the type of transaction data that is being extracted or exported.
Syntax
Parameters
Example
A new extracted log file called rxmay99 is created on June 1, 1999. Any existing file that has this name is purged. All raw transaction log file data collected from May 1, 1999 to May 31, 1999 is extracted.
extract>logfile /var/opt/perf/datafiles/loggloboutput rxmay99,purgeglobal detailtransaction detailmonth 9905
To perform the above task using command line arguments, enter:
transaction
[on][detail][summary][both][off]
on or detailsummarybothoff
See “Parameters” in the description of the application command at the beginning of this chapter. Summary and both can only be exported.
144 Chapter 7

extract -gt -f rxmay99,purge -xm 9905
Extract Commands 145
weekdays
Use the weekdays command to exclude data for specific days from being exported (day 1 = Sunday).
Syntax
weekdays [1|2.....7]
How to Use It
If you want to export data from only certain days of the week, use this command to exclude the days from which you do not want data. Days have the following values:
Sunday =1Monday =2Tuesday =3Wednesday =4Thursday =5Friday =6Saturday =7
For example, if you want to export data that was logged only on Monday through Thursday, exclude data from Friday, Saturday, and Sunday from your export.
Example
In this example, any detailed global data logged on Tuesdays and Thursdays is excluded from the export. The output export file contains the global metrics specified in the myrept export template file.
extract>logfile /var/opt/perf/datafiles/logglobglobal detailreport myreptweekdays 35export
146 Chapter 7
weekly
Use the weekly command to specify data extraction based on a calendar week. A week is defined as seven days starting on Monday and ending on Sunday.
During execution, this command sets the start and stop dates to the proper dates, based on the week and year of the extracted data.
Syntax
Parameters
If you do not specify the log file before executing the weekly command, the default logglob file in the datafiles directory is used.
How to Use It
Use the weekly command when you are extracting data for archiving on a weekly basis.
The name of the output file consists of the letters rxwe followed by the last two digits of the year, and the two-digit week number for the week being extracted. For example, the 12th week of 1999 (from Monday, March 22 to Sunday, March 29) would be output to a file named rxwe9912.
The type of data extracted and summarized follow the normal rules for the extract command and can be set before executing the weekly command. These settings are honored unless a weekly output file already exists. If it does, data is appended to it, based on the type of data selected originally.
The weekly command has a feature that opens the previous week's extracted file and checks to see if it is filled--whether it contains data extracted up to the last day of the week. If not, the weekly command appends data to this file to complete the previous week's extraction.
For example, a weekly command is executed on Thursday, May 20, 1999. This creates a log file named rxwe199920 containing data from Monday, May 17 through the current date (May 20).
On Wednesday, May 26, 1999, another weekly command is executed. Before the rxwe199921 file is created for the current week, the rxwe199920 file from the previous week is opened and checked. When it is found to be incomplete, data is appended to it to complete the extraction through Sunday, May 23, 1999. Then, the rxwe199921 file is created to hold data from Monday, May 24, 1999 to the current date (May 26).
As long as you execute the weekly command at least once a week, this feature will complete each week's file before creating the next week's file. When you see two adjacent weekly files (for example, rxwe199920 and rxwe199921), you can assume that the first file is complete for that week, and it can be archived and purged.
weekly [yyww][ww]
weekly Extracts the current week's data (the default).
weekly ww Extracts data for a specific week from this year's data (where ww is any number from 01 to 53).
weekly yyww Extracts data for a specific week and year (where yyww is a single number consisting of the last two digits of the year and the two-digit week-of-the-year number). For example, the 20th week of 1999 would be weekly 9920.
Extract Commands 147
Example
In this example, the weekly command causes the current week’s data to be extracted and complete the previous week’s extracted file, if it is present.
extract>logfile /var/opt/perf/datafiles/logglobglobal detailapplication detailprocess detailweekly
To perform the above task using command line arguments, enter:
extract -gap -xw
The weeks are numbered based on their starting day. Thus, the first week of the year (week 01) is the week starting on the first Monday of that year. Any days before that Monday belong to the last week of the previous year. The weekly and extract week commands are similar in that they both extract one calendar week's data. The weekly command ignores the setting of the output command, using instead predefined output file names. It also attempts to append missing data to the previous week's extracted log file if it is still present on the system. The extract week command, on the other hand, uses the settings of the output command. It cannot append data to the previous week's extracted file because it does not know its name. The output file is named rxwe followed by the current year (yyyy) and week of the year (ww).
148 Chapter 7
yearly
Use the yearly command to specify data extraction based on a calendar year.
During execution, the command sets the start and stop dates to the proper dates, based on the year being extracted.
Syntax
Parameters
If you do not specify the log file before executing the yearly command, the default logglob file is used.
How to Use It
Use the yearly command when you are extracting data for archiving on a yearly basis.
The name of the output file consists of the letters rxyr followed by the four digits of the year being extracted. Thus, data from 1999 would be output to a file named rxyr1999.
The type of data extracted and summarized follow the normal rules for the extract command and can be set before executing the yearly command. These settings are honored unless a yearly output file already exists. If it does, data is appended to it, based upon the type of data selected originally.
The yearly command has a feature that opens the previous year's extracted file and checks to see if it is filled--whether it contains data extracted up to the last day of the year. If not, the yearly command appends data to this file to complete the previous year's extraction.
For example, a yearly command was executed on December 15, 1998. This created a log file named rxyr1998 containing data from January 1, 1998 to the current date (December 15).
On January 5, 1999, another yearly command is executed. Before the rxyr1999 file is created for the current year, the rxyr1998 file from the previous year is opened and checked. When it is found to be incomplete, data is appended to it to complete its extraction until December 31, 1998. Then, the rxyr1999 file is created to hold data from January 1, 1999 to the current date (January 5).
As long as you execute the yearly command at least once a year, this feature will complete each year's file before creating the next year's file. When you see two adjacent yearly files (for example, rxyr1998 and rxyr1999), you can assume that the first file is complete for that year, and it can be archived and purged.
The previous paragraph is true only if the raw log files are sized large enough to hold one full year of data. It would be more common to size the raw log files smaller and execute the yearly command more often (such as once a month).
yearly [yyyy][yy]
yearly Extracts the current year's data (the default).
yearly yy Extracts a specific year's data (where yy is a number from 00 to 99).The specifications 00 to 27 assume the years 2000 to 2027, whereas 71 to 99 assume the years 1971 to 1999.
yearly yyyy Extracts a specific year's data (where yyyy is the full-year numbered 1971 to 2027).
Extract Commands 149
Example
In this example, application and global detail data is appended to the existing yearly summary file (or creates it, if necessary). The output file is rxyryyyy (where yyyy represents the current year).
extract>logfile /var/opt/perf/datafiles/logglobglobal detailapplication detailprocess offyearly
To perform the above task using command line arguments, enter:
extract -ga -xy
The yearly and extract year commands are similar in that they both extract one calendar year's data. The yearly command ignores the setting of the output command, using instead predefined output file names. It also attempts to append missing data to the previous year's extracted log file if it is still present on the system. The extract year command, on the other hand, will use the settings of the output command. It cannot append data to the previous year's extracted file since it does not know its name.
150 Chapter 7
8 Using the cpsh Program
You can use the cpsh program only if you enable the HP Ops OS Inst to Realtime Inst LTU or Glance Pak Software LTU .
The cpsh program presents a new command-line prompt, which enables you to view the real-time metric data collected from the monitored system.
Using the Interactive Mode
You can use the cpsh program in the interactive mode. If you run cpsh command without any options, the cpsh program opens a new command prompt. At this prompt, you can perform different tasks to view the details of the real-time metrics.
To open the cpsh prompt, follow these steps:
1 Log on to a system (with the root/administrative privileges) where the HP Operations agent is installed.
2 Run the following command to open the cpsh prompt of the local system:
cpsh
Run the following command to open the cpsh prompt of a remote system:
cpsh -n <system_name>
where <system_name> is the fully-qualified domain name of the remote system.
or
cpsh -n <ip_address>
where <ip_address> is the IP address of the remote system.
The cpsh prompt opens.
3 To view the details of the available commands for use with the cpsh prompt, type help.
While opening the cpsh prompt of a remote system, make sure that the perfd process runs on the remote system.
To view metric data in a well-structured table format, run the cpsh command with the -t option.
For example:
cpsh -t
or
cpsh -n <system_name> -t
151

View Real-Time Metrics
You can view the real-time values of the available metrics from the cpsh prompt. Before you perform any operation at the cpsh prompt, you must set the metric context. The perfd daemon and associated utilities process the available data based on metric classes. Therefore, while using the cpsh utility to view real-time data, you must always set the metric class before performing any operations to view the available data.
To view the real-time values of the metrics of a metric class, follow these steps:
1 At the cpsh prompt, type class <metric_class>.
2 list of currently set metrics for the given class, type list. The list of all default metrics for the specified metric class appears.
3 To view values of the metrics that belong to the specified class, type push at the cpsh prompt. The cpsh program displays real-time values of the metrics in a tabular format.
4 To go back to the cpsh prompt, press Ctrl+C.
Modify a Metric Class
You can add additional available metrics to the list of default metrics for a metric class. To add or delete a metrics from a metric class at the cpsh prompt, follow these steps:
1 Open the cpsh prompt.
2 At the cpsh prompt, type class <metric_class>.
3 Type list. The list of all default metrics for the specified metric class appears.
4 To delete a metric, follow these steps:
a At the cpsh prompt, type delete <metric_name>.
b Type list. The list of metrics for the specified metric class does not include the deleted metric.
5 To add a metric to the metric class, follow these steps:
a At the cpsh prompt, type add <metric_name>.
b Type list. The list of metrics for the specified metric class includes the newly added metric.
View All the Available Metrics
To view all the available metrics that belong to a metric class, follow these steps:
1 Open the cpsh prompt.
2 At the cpsh prompt, type class <metric_class>.
3 Type list all. The list of all available metrics that belong to the specified metric class appears.
Organize a Metric Class
You can reorganize a metric class without performing sequential add and delete operation on the class. To reorganize a metric class to include the metrics of your choice, follow these steps:
1 Open the cpsh prompt.
152 Chapter 8

2 At the cpsh prompt, type class <metric_class>.
3 Type init <metric_name> <metric_name> <metric_name> ....
The specified metric class incorporates only the metrics specified with the init command.
View Metric Help
You can view the description of every real-time metric from the cpsh prompt. To view the metric description, follow these steps:
1 Open the cpsh prompt.
2 Type class <metric_class>.
3 Type help <metric_name> at the cpsh prompt. The details description of the metric appears.
View Summarized Metric Data
For the metrics of the GLOBAL and TABLE classes, you can view summarized data from the cpsh prompt. To view the summarized data, follow these steps:
1 Open the cpsh prompt.
2 At the cpsh prompt, type class gbl or class tbl.
3 Type summ <interval>. In this instance, <interval> is the summarization interval specified in seconds. <interval> must be a multiple of collection interval of perfd server to which cpsh is connected
The cpsh utility displays the following measurements of the values of metrics that belong to the selected metric class:
• Maximum
• Minimum
• Average
• Standard deviation
Using the cpsh Program 153

154 Chapter 8
9 Performance Alarms
You can use the Performance Collection Component to define alarms. These alarms notify you when scope or DSI metrics meet or exceed conditions that you have defined.
To define alarms, you must specify conditions on each monitored system that, when met, trigger an alert or action. You can define alarms in the alarm definitions text file, alarmdef.
As data is logged by scope or other collectors, it is compared to the alarm definitions to determine if a condition is met. When this occurs, an alert or action is triggered.
With the real-time alarm generator, you can perform the following tasks:
• Send alert notifications to the HPOM console
• Create an SNMP trap when an alert notification is generated
• Forward the SNMP trap to an SNMP trap listener
• Perform local actions on the monitored systems
You can analyze historical log file data against the alarm definitions and report the results using the utility program's analyze command.
Processing Alarms
As performance data is collected by the Performance Collection Component, the collected data is compared to the alarm conditions defined in the alarmdef file to determine whether the conditions were met. When a condition is met, an alarm is generated and the actions defined for alarms (ALERTs, PRINTs, and EXECs) are performed.
As data is collected in the log files, it is compared to the alarm definitions in the alarmdef file. When an alarm condition is met, the actions defined in the alarm definition are carried out. However, if data is not logged into the log files (for instance, when the threshold parameters are set to a high value), alarms are not generated even if the alarm conditions in the alarmdef file are met. See Thresholds on page 28 for the thresholds of different classes of metrics.
Actions defined in the alarm definition can include:
• local actions performed by using UNIX commands
• messages sent to Network Node Manager, and Operations Manager
Alarm Generator
The Performance Collection Component alarm generator handles the communication of alarm notifications. The alarm generator consists of the alarm generator server (perfalarm), the alarm generator database (agdb), and the utility program agsysdb.
155

The agdb contains a list of SNMP nodes. The agsysdb program is used for displaying and changing the actions taken by alarm events.
When you start up Performance Collection Component, perfalarm starts and reads the agdb at startup to determine where and whether to send alarm notifications. It also checks to see if an Operations Manager agent is on the system.
Use the following command line option to see a list showing where alert notifications are being sent:
agsysdb -l
Sending SNMP Traps to Network Node Manager
To send SNMP traps to Network Node Manager, you must add your system name to agdb in Performance Collection Component using the command:
agsysdb -add systemname
Every ALERT generated will cause an SNMP trap to be sent to the system you defined. The trap text will contain the same message as the ALERT.
To stop sending SNMP traps to a system, you must delete the system name from agdb using the command:
agsysdb -delete systemname
Sending Messages to Operations Manager
You can have alert notifications sent to Operations Manager if there is an Operations Manager agent on the same system as Performance Collection Component. The Operations Manager agent communicates with the central Operations Manager system.
By default, if the Operations Manager agent is running on the Performance Collection Component system, the alarm generator does not execute local actions that are defined in any alarms in the EXEC statement. Instead, it sends a message to Operations Manager’s event browser. If the Operations Manager agent is not running on the Performance Collection Component system, the alarm generator does not try to send alert notifications to Operations Manager and local actions are executed.
You can change the default to stop sending information to Operations Manager, even though an Operations Manager agent is running on the Performance Collection Component system, using the command:
agsysdb -ovo OFF
To send Performance Collection Component traps to another node, add the following entries to /etc/services file.
snmp-trap 162/tcp # SNMPTRAP
snmp-trap 162/udp # SNMPTRAP
In this instance, 162 specifies port number. If you want Performance Collection Component to send traps to another node, it checks the /etc/services file for the snmp-trap string. If this entry is not available, the traps will not be sent to another node.
156 Chapter 9

Executing Local Actions
Without an Operations Manager agent running on the Performance Collection Component system, local actions in EXEC statements will be executed.
You can change the default to turn off local actions as follows:
agsysdb -actions off
If you want local actions to always execute even if the Operations Manager agent is running, type:
agsysdb -actions always
The following table lists the settings for sending information to Operations Manager and for executing local actions:
Errors in Processing Alarms
The last error that occurred when sending an alarm is logged in agdb. To view the contents of agdb, type:
agsysdb -l
The following information is displayed:
PA alarming status:
OVO messages : on Last Error : noneExec Actions : onAnalysis system: <hostname>, Key=<ip address>PerfView : no Last Error : <error number>SNMP : yes Last Error : <error number>
Table 10 Settings for sending information to Operations Manager and executing local actions
FlagsOperations Manager Agent Running
Operations Manager Agent Not Running
Operations Manager Flag
off No alert notifications sent to Operations Manager.
No alert notifications sent to Operations Manager.
on Alert notifications sent to Operations Manager.
No alert notifications sent to Operations Manager.
Local Actions Flag
off No local actions executed. No local actions executed.
always Local actions executed even if Operations Manager agent is running.
Local actions executed.
on Local actions sent to Operations Manager.
Local actions executed.
Performance Alarms 157

Analyzing Historical Data for Alarms
You can use the utility program's analyze command to find alarm conditions in log file data (see Chapter 5, Utility Commands). This is different from the processing of real-time alarms explained earlier because you are comparing historical data in the log file to the alarm definitions in the alarmdef file to determine what alarm conditions would have been triggered.
Examples of Alarm Information in Historical Data
The following examples show what is reported when you analyze alarm conditions in historical data.
For the first example, START, END, and REPEAT statements have been defined in the alarm definition. An alarm-start event is listed every time an alarm has met all of its conditions for the specified duration. When these conditions are no longer satisfied, an alarm-end event is listed. If an alarm condition is satisfied for a period long enough to generate another alarm without having first ended, a repeat event is listed.
Each event listed shows the date and time, alarm number, and the alarm event. EXEC actions are not performed, but they are listed with any requested parameter substitutions in place.
05/10/99 11:15 ALARM [1] STARTCRITICAL: CPU test 99.97%05/10/99 11:20 ALARM [1] REPEATWARNING: CPU test 99.997%05/10/99 11:25 ALARM [1] ENDRESET: CPU test 22.86%EXEC: end.script
If you are using a color workstation, the following output is highlighted:
CRITICAL statements are
WARNING statements are CYANstatements are
The next example shows an alarm summary that is displayed after alarm events are listed. The first column lists the alarm number, the second column lists the number of times the alarm condition occurred, and the third column lists the total duration of the alarm condition.
Performance Alarm Summary:
Alarm Count Minutes 1 574 2865 2 0 0
Analysis coverage using "alarmdef":Start: 05/04/99 08:00 Stop: 05/06/99 23:59Total time analyzed: Days: 2 Hours: 15 Minutes: 59
158 Chapter 9
Alarm Definition Components
An alarm occurs when one or more of the conditions you define continues over a specified duration. The alarm definition can include an action to be performed at the start or end of the alarm.
A condition is a comparison between two or more items. The compared items can be metric names, constants, or variables. For example:
ALARM gbl_cpu_total_util > 95 FOR 5 MINUTES
An action can be specified to be performed when the alarm starts, ends, or repeats. The action can be one of the following:
• an ALERT, which sends a message to Operations Manager or an SNMP trap to Network Node Manager
• an EXEC, which performs a UNIX command, or
• a PRINT, which sends a message to stdout when processed using the utility program.
For example:
ALARM gbl_swap_space_util > 95 FOR 5 MINUTES START RED ALERT "Global swap space is nearly full" END RESET ALERT "End of global swap space full condition"
You can create more complex actions using Boolean logic, loops through multiple-instance data such as applications, and variables. (For more information, see the next section, Alarm Syntax Reference).
You can also use the INCLUDE statement to identify additional alarm definition files you want used. For example, you may want to break up your alarm definitions into smaller files.
Performance Alarms 159
Alarm Syntax Reference
This section describes the statements that are available in the alarm syntax. You may want to look at the alarmdef file for examples of how the syntax is used to create useful alarm definitions.
Alarm Syntax
ALARM condition [[AND,OR]condition] FOR duration [SECONDS, MINUTES] [TYPE="string"] [SERVICE="string"] [SEVERITY=integer] [START action] [REPEAT EVERY duration [SECONDS, MINUTES] action] [END action][RED, CRITICAL, ORANGE, MAJOR, YELLOW, MINOR, CYAN, WARNING, GREEN, NORMAL, RESET] ALERT messageEXEC "UNIX command"PRINT messageIF condition THEN action [ELSE action]{APPLICATION, PROCESS, DISK, LVOLUME, TRANSACTION, NETIF, CPU, FILESYSTEM} LOOP actionINCLUDE "filename"USE "data source name"[VAR] name = valueALIAS name = "replaced-name"SYMPTOM variable [ TYPE = {CPU, DISK, MEMORY, NETWORK}] RULE condition PROB probability [RULE condition PROB probability] . .
Conventions
• Braces ({ }) indicate that one of the choices is required.
• Brackets ([ ]) indicate an optional item.
• Items separated by commas within brackets or braces are options. Choose only one.
• Italics indicate a variable name that you replace.
• All syntax keywords are in uppercase.
Common Elements
The following elements are used in several statements in the alarm syntax and are described below.
• comments
• compound statements
160 Chapter 9
• conditions
• constants
• expressions
• metric names
• messages
Comments
You can precede comments either by double forward slashes (//) or the pound sign (#). In both cases, the comment ends at the end of the line. For example:
# any text or characters
or
// any text or characters
Compound Statements
Compound statements allow a list of statements to be executed as a single statement. A compound statement is a list of statements inside braces ({}). Use the compound statement with the IF statement, the LOOP statement, and the START, REPEAT, and END clauses of the ALARM statement. Compound statements cannot include ALARM and SYMPTOM statements.
{ statement statement}
In the example below, highest_cpu defines a variable. The highest_cpu value is saved and notifies you only when that highest_cpu value is exceeded by a higher highest_cpu value.
highest_cpu = highest_cpu IF gbl_cpu_total_util > highest_cpu THEN // Begin compound statement { highest_cpu = gbl_cpu_total_util ALERT "Our new high CPU value is ", highest_cpu, "%" } // End compound statement
Conditions
A condition is defined as a comparison between two items.
item1 {>, <, >=, <=, ==, !=}item2 [AND, OR[item3 {>, <, >=, <=, ==, !=}item4]]
where "==" means "equal", and "!=" means "not equal".
Conditions are used in the ALARM, IF, and SYMPTOM statements. An item can be a metric name, a numeric constant, an alphanumeric string enclosed in quotes, an alias, or a variable. When comparing alphanumeric items, only == or != can be used as operators.
Performance Alarms 161

Constants
Constants can be either numeric or alphanumeric. An alphanumeric constant must be enclosed in double quotes. For example:
345 345.2 "Time is"
Constants are useful in expressions and conditions. For example, you may want to compare a metric against a constant numeric value inside a condition to generate an alarm if it is too high, such as
gbl_cpu_total_util > 95
Expressions
Arithmetic expressions perform one or more arithmetic operations on two or more operands. You can use an expression anywhere you would use a numeric value. Legal arithmetic operators are:
+, -, *, /
Parentheses can be used to control which parts of an expression are evaluated first.
For example:
Iteration + 1gbl_cpu_total_util - gbl_cpu_user_mode_util( 100 - gbl_cpu_total_util ) / 100.0
Metric Names
When you specify a metric name in an alarm definition, the current value of the metric is substituted. Metric names must be typed exactly as they appear in the metric definition, except for case sensitivity. Metrics definitions can be found in the Performance Collection Component Dictionary of Operating Systems Performance Metrics.
It is recommended that you use fully-qualified metric names if the metrics are from a data source other than the SCOPE data source (such as DSI metrics).
The format for specifying a fully qualified metric is:
data_source:instance(class):metric_name
A global metric in the SCOPE data source requires no qualification. For example:
metric_1
An application metric, which is available for each application defined in the SCOPE data source, requires the application name. For example,
application_1:metric_1
For multi-instance data types such as application, process, disk, netif, transaction, lvolume, cpu, and filesystem, you must associate the metric with the data type name, except when using the LOOP statement. To do this, specify the data type name followed by a colon, and then the metric name. For example, other_apps:app_cpu_total_util specifies the total CPU utilization for the application other_apps.
162 Chapter 9
If you use an application name that has an embedded space, you must replace the space with an underscore (_). For example, application 1 must be changed to application_1. For more information on using names that contain special characters, or names where case is significant, see ALIAS Statement on page 175.
If you had a disk named “other” and an application named “other”, you would need to specify the class as well as the instance:
other (disk):metric_1
A global metric in an extracted log file (where scope_extract is the data source name) would be specified this way:
scope_extract:application_1:metric_1
A DSI metric would be specified this way:
dsi_data_source:dsi_class:metric_name
Messages
A message is the information sent by a PRINT or ALERT statement. It can consist of any combination of quoted alphanumeric strings, numeric constants, expressions, and variables. The elements in the message are separated by commas. For example:
RED ALERT "cpu utilization=", gbl_cpu_total_util
Numeric constants, metrics, and expressions can be formatted for width and number of decimals. Width specifies how wide the field should be formatted; decimals specifies how many decimal places to use. Numeric values are right-justified. The - (minus sign) specifies left-justification. Alphanumeric strings are always left-justified. For example:
metric names [|[-]width[|decimals]]gbl_cpu_total_util|6|2 formats as '100.00'(100.32 + 20)|6 formats as ' 120'gbl_cpu_total_util|-6|0 formats as '100 'gbl_cpu_total_util|10|2 formats as ' 99.13'gbl_cpu_total_util|10|4 formats as ' 99.1300'
ALARM Statement
The ALARM statement defines a condition or set of conditions and a duration for the conditions to be true. Within the ALARM statement, you can define actions to be performed when the alarm condition starts, repeats, and ends. Conditions or events that you might want to define as alarms include:
• when global swap space has been nearly full for 5 minutes
When specifying fully qualified multi-instance metrics and using aliases within aliases, if one of the aliases has a class identifier, we recommend you use the syntax shown in this example:
alias my_fs="/dev/vg01/lvol1(LVOLUME)"alarm my_fs:LV_SPACE_UTIL > 50 for 5 minutes
Any metric names containing special characters (such as asterisks) must be aliased before they are specified.
Performance Alarms 163

• when the memory paging rate has been too high for 1 interval
• when your CPU has been running at 75 percent utilization for the last ten minutes
Syntax
ALARM condition [[AND,OR]condition] FOR duration{SECONDS, MINUTES} [TYPE="string"] [SERVICE="string"] [SEVERITY=integer] [START action] [REPEAT EVERY duration {SECONDS, MINUTES} action] [END action]
• The ALARM statement must be a top-level statement. It cannot be nested within any other statement. However, you can include several ALARM conditions in a single ALARM statement. If the conditions are linked by AND, all conditions must be true to trigger the alarm. If they are linked by OR, any one condition will trigger the alarm.
• TYPE is a quoted string of up to 38 characters. If you are sending alarms, you can use TYPE to categorize alarms and to specify the name of a graph template to use.
• SERVICE is a quoted string of up to 200 characters. If you are using ServiceNavigator, which is being released with ITO 5.0, you can link your Performance Collection Component alarms with the services you defined in ServiceNavigator (see the HP Operations ServiceNavigator Concepts and Configuration Guide).
SERVICE="Service_id"
• SEVERITY is an integer from 0 to 32767.
• START, REPEAT, and END are keywords used to specify what action to take when alarm conditions are met, met again, or stop. You should always have at least one of START, REPEAT, or END in an ALARM statement. Each of these keywords is followed by an action.
• action – The action most often used with an ALARM START, REPEAT, or END is the ALERT statement. However, you can also use the EXEC statement to mail a message or run a batch file, or a PRINT statement if you are analyzing historical log files with the utility program. Any syntax statement is legal except another ALARM.
START, REPEAT, and END actions can be compound statements. For example, you can use compound statements to provide both an ALERT and an EXEC.
• Conditions – A condition is defined as a comparison between two items.
item1 {>, <, >=, <=, ==, !=}item2 [AND, OR[item3 {>, <, >=, <=, ==, !=}item4]]
where "==" means "equal", and "!=" means "not equal"
An item can be a metric name, a numeric constant, an alphanumeric string enclosed in quotes, an alias, or a variable. When comparing alphanumeric items, only == or != can be used as operators.
You can use compound conditions by specifying the “OR” and “AND” operator between subconditions. For example:
ALARM gbl_cpu_total_util > 90 AND gbl_pri_queue > 1 for 5 minutes
• You also can use compound conditions without specifying the “OR” and “AND” operator between subconditions. For example:
164 Chapter 9

ALARM gbl_cpu_total_util > 90gbl_cpu_sys_mode_util > 50 for 5 minutes
will cause an alarm when both conditions are true.
FOR duration SECONDS, MINUTES specifies the time period the condition must remain true to trigger an alarm.
Use caution when specifying durations of less than one minute, particularly when there are multiple data sources on the system. Performance can be seriously degraded if each data source must be polled for data at very small intervals. The duration must be a multiple of the longest collection interval of the metrics mentioned in the alarm condition.
For scope data, the duration is five minutes; however, the duration for process data is one minute. For DSI data, the duration is five seconds or longer.
• REPEAT EVERY duration SECONDS, MINUTES specifies the time period before the alarm is repeated.
How It Is Used
The alarm cycle begins on the first interval that all of the ANDed, or one of the ORed alarm conditions have been true for at least the specified duration. At that time, the alarm generator executes the START action, and on each subsequent interval checks the REPEAT condition. If enough time has transpired, the action for the REPEAT clause is executed. (This continues until one or more of the alarm conditions becomes false.) This completes the alarm cycle and the END statement is executed if there is one.
In order to be notified of the alarm, use the ALERT statement within the START and END statements. If you do not specify an END ALERT, the alarm generator automatically sends an alarm to Operations Manager and sends an SNMP trap to Network Node Manager.
Examples
The following ALARM example sends a red alert when the swap utilization is high for 5 minutes. It is similar to an alarm condition in the default alarmdef file. Do not add this example to your alarmdef file without removing the default alarm condition, or your subsequent alert messages may be confusing.
ALARM gbl_swap_space_util > 90 FOR 5 MINUTES START RED ALERT "swap utilization is very high " REPEAT EVERY 15 MINUTES RED ALERT "swap utilization is still very high " END RESET ALERT "End of swap utilization condition"
This ALARM example tests the metric gbl_swap_space_util to see if it is greater than 90. Depending on how you configured the alarm generator, the ALERT can be sent to Network Node Manager via an SNMP trap or as a message to Operations Manager.
The REPEAT statement checks for the gbl_swap_space_util condition every 15 minutes. As long as the metric remains greater than 90, the REPEAT statement will send the message “swap utilization is still very high” every 15 minutes.
When the gbl_swap_space_util condition goes below 90, the RESET ALERT statement with the “End of swap utilization condition” message is sent.
The following example defines a compound action within the ALARM statement. This example shows you how to cause a message to be mailed when an event occurs.
Performance Alarms 165

ALARM gbl_cpu_total_util > 90 FOR 5 MINUTES START { RED ALERT "Your CPU is busy." EXEC "echo 'cpu is too high'| mailx root" } END RESET ALERT "CPU no longer busy."
The ALERT can trigger an SNMP trap to be sent to Network Node Manager or a message to be sent to Operations Manager. The EXEC can trigger a mail message to be sent as a local action on your Performance Collection Component system, depending on how you configured your alarm generator.
By default, if the Operations Manager agent is running, the local action will not execute. Instead, it will be sent as a message to Operations Manager.
The following two examples show the use of multiple conditions. You can have more than one test condition in the ALARM statement. In this case, each statement must be true for the ALERT to be sent.
The following ALARM example tests the metric gbl_cpu_total_util and the metric gbl_cpu_sys_mode_util. If both conditions are true, the RED ALERT statement sends a red alert. When either test condition becomes false, the RESET is sent.
ALARM gbl_cpu_total_util > 90 AND gbl_cpu_sys_mode_util > 50 FOR 5 MINUTESSTART RED ALERT "CPU busy and Sys Mode CPU util is high."END RESET ALERT "The CPU alert is now over."
The next ALARM example tests the metric gbl_cpu_total_util and the metric gbl_cpu_sys_mode_util. If either condition is true, the RED ALERT statement sends a red alert.
ALARM gbl_cpu_total_util > 90 OR gbl_cpu_sys_mode_util > 50 FOR 10 MINUTES START RED ALERT "Either total CPU util or sys mode CPU high"
Do not use metrics that are logged at different intervals in the same alarm. For example, you should not loop on a process (logged at 1-minute intervals) based on the value of a global metric (logged at 5-minute intervals) in a statement like this:
IF global_metric THEN PROCESS LOOP...
The different intervals cannot be synchronized as you might expect, so results will not be valid.
For GlancePlus, use the process metrics inside a process loop in order to sent alarm for all the processes.
166 Chapter 9
ALERT Statement
The ALERT statement allows a message to be sent to Network Node Manager or Operations Manager. The ALERT statement is most often used as an action within an ALARM. It could also be used within an IF statement to send a message as soon as a condition is detected instead of after the duration has passed. If an ALERT is used outside of an ALARM or IF statement, the message will be sent at every interval.
Syntax
[RED, CRITICAL, ORANGE, MAJOR, YELLOW, MINOR, CYAN,WARNING, GREEN, NORMAL, RESET] ALERT message
• RED is synonymous with CRITICAL, ORANGE is synonymous with MAJOR, YELLOW is synonymous with MINOR, CYAN is synonymous with WARNING, and GREEN is synonymous with NORMAL. These keywords turn the alarm symbol to the color associated with the alarm condition.
• RESET — Sends a RESET ALERT with a message when the ALARM condition ends. If you have not defined a reset in the alarm definition, sends a RESET ALERT without a message when the ALARM condition ends.
• message — A combination of strings and numeric values used to create a message. Numeric values can be formatted with the parameters [|[-]width[|decimals]]. Width specifies how wide the field should be formatted; decimals specifies how many decimal places to use. Numeric values are right-justified. The - (minus sign) specifies left-justification. Alphanumeric strings are always left-justified.
How It Is Used
The ALERT can also trigger an SNMP trap to be sent to Network Node Manager or a message to be sent to Operations Manager, depending on how you configured your alarm generator. For alert messages sent to Operations Manager, the WARNINGS will be displayed in blue in the message browser.
Example
An typical ALERT statement is:
RED ALERT "CPU utilization = ", gbl_cpu_total_util
If you have Network Node Manager, this statement creates a critical severity alarm in the Alarm Browser window in Network Node Manager.
Performance Alarms 167

EXEC Statement
The EXEC statement allows you to specify a system (UNIX or Windows) command to be performed on the local system. For example, you could use the EXEC statement to send mail to an IT administrator each time a certain condition is met.
EXEC should be used within an ALARM or IF statement so the command is performed only when specified conditions are met. If an EXEC statement is used outside of an ALARM or IF statement, the action will be performed at unpredictable intervals.
Syntax
EXEC "system command"
system command — a command to be performed on the local system.
Do not use embedded double quotes (") in EXEC statements. Doing so causes perfalarm to fail to send the alarm to HPOM. Use embedded single (') quotes instead. For example:
EXEC "echo 'performance problem detected' "
EXEC "mkdir c:\\directory\\filename"
The syntax of the EXEC statement requires the path name of the file to be enclosed within double quotes. However, if a path name contains spaces, the path name must be enclosed within single quotes, which must be again enclosed within double quotes.
Example:
EXEC "'C:\\Program Files\\Mail Program\\SendMail.exe'"
If any arguments to the system command of the EXEC statement contains single quotes, the program must be enclosed within single quotes as the first pair of single quotes (') are converted into double quotes (") while you run the command with the EXEC statement.
Example:
EXEC "'echo' 'test execution'"
In the above example, echo is the program enclosed within single quotes as it contains an argument (in this case, test execution) with single quotes. Furthermore, as per the syntax of the EXEC statement, the entire string of the command must be enclosed in double quotes.
Do not use embedded double quotes (") in EXEC statements; perfalarm will fail to send the alarm to the HPOM. Use embedded single quotes (') instead.
For example:
EXEC "'echo' 'dialog performance problem'"
In the above example, echo is the program enclosed within single quotes as it contains an argument (in this case, dialog performance problem) with single quotes. Further, as per the syntax of the EXEC statement, the entire string of the command must be enclosed in double quotes.
168 Chapter 9
How It Is Used
The EXEC can trigger a local action on your local system, depending on how you configured your alarm generator. For example, you can turn local actions on or off. If you configured your alarm generator to send information to Operations Manager, local actions will not usually be performed.
Examples
In the following example, the EXEC statement performs the UNIX mailx command when the gbl_disk_util_peak metric exceeds 20.
IF gbl_disk_util_peak > 20 THEN EXEC "echo 'high disk utilization detected'| mailx root"
The next example shows the EXEC statement sending mail to the system administrator when the network packet rate exceeds 1000 per second average for 15 minutes.
ALARM gbl_net_packet_rate > 1000 for 15 minutes TYPE = "net busy" SEVERITY = 5 START { RED ALERT "network is busy" EXEC "echo 'network busy condition detected'| mailx root" } END RESET ALERT "NETWORK OK"
PRINT Statement
The PRINT statement allows you to print a message from the utility program using its analyze function. The alarm generator ignores the PRINT statement.
Syntax
PRINT message
• message — A combination of strings and numeric values that create a message. Numeric values can be formatted with the parameters [|[-]width[|decimals]]. Width specifies how wide the field should be formatted; decimals specifies how many decimal places to use. Alphanumeric components of a message must be enclosed in quotes. Numeric values are right-justified. The - (minus sign) specifies left-justification. Alphanumeric strings are always left-justified.
Be careful when using the EXEC statement with commands or scripts that have high overhead if it will be performed often.The alarm generator executes the command and waits until it completes before continuing. We recommend that you not specify commands that take a long time to complete.
Performance Alarms 169
Example
PRINT "The total time the CPU was not idle is", gbl_cpu_total_time |6|2, "seconds"
When executed, this statement prints a message such as the following:
The total time the CPU was not idle is 95.00 seconds
IF Statement
Use the IF statement to define a condition using IF-THEN logic. The IF statement should be used within the ALARM statement. However, it can be used by itself or any place in the alarmdef file where IF-THEN logic is needed.
If you specify an IF statement outside of an ALARM statement, you do not have control over how frequently it gets executed.
Syntax
IF condition THEN action [ELSE action]
• IF condition — A condition is defined as a comparison between two items.
item1 {>, <, >=, <=, ==, !=}item2 [AND, OR[item3 {>, <, >=, <=, ==, !=}item4]]
where "==" means "equal", and "!=" means "not equal".
An item can be a metric name, a numeric constant, an alphanumeric string enclosed in quotes, an alias, or a variable. When comparing alphanumeric strings, only == or != can be used as operators.
• action — Any action, or set a variable. (ALARM is not valid in this case.)
How It Is Used
The IF statement tests the condition. If the condition is true, the action after the THEN is executed. If the condition is false, the action depends on the optional ELSE clause. If an ELSE clause has been specified, the action following it is executed; otherwise the IF statement does nothing.
Example
In this example, a CPU bottleneck symptom is calculated and the resulting bottleneck probability is used to define cyan or red ALERTs. Depending on how you configured your alarm generator, the ALERT triggers an SNMP trap to Network Node Manager or the message “End of CPU Bottleneck Alert” to Operations Manager along with the percentage of CPU used.
SYMPTOM CPU_Bottleneck > type=CPU RULE gbl_cpu_total_util > 75 prob 25 RULE gbl_cpu_total_util > 85 prob 25 RULE gbl_cpu_total_util > 90 prob 25 RULE gbl_cpu_total_util > 4 prob 25 ALARM CPU_Bottleneck > 50 for 5 minutes TYPE="CPU" START
170 Chapter 9
IF CPU_Bottleneck > 90 then RED ALERT "CPU Bottleneck probability= ", CPU_Bottleneck, "%" ELSE CYAN ALERT "CPU Bottleneck probability= ", CPU_Bottleneck, "%" REPEAT every 10 minutes IF CPU_Bottleneck > 90 then RED ALERT "CPU Bottleneck probability= ", CPU_Bottleneck, "%" ELSE CYAN ALERT "CPU Bottleneck probability= ", CPU_Bottleneck, "%" END RESET ALERT "End of CPU Bottleneck Alert"
LOOP Statement
The LOOP statement goes through multiple-instance data types and performs the action defined for each instance.
Syntax
{APPLICATION, PROCESS, LVOLUME, DISK, CPU, FILESYSTEM, TRANSACTION, NETIF, LOGICAL} LOOP action
• APPLICATION, PROCESS, LVOLUME, DISK, CPU, FILESYSTEM, TRANSACTION, NETIF, LOGICAL — Performance Collection Component data types that contain multi-instance data.
• action — PRINT, EXEC, ALERT, set variables.
How It Is Used
As LOOP statements iterate through each instance of the data type, metric values change. For instance, the following LOOP statement prints the name of each application to stdout if you are using the utility program's analyze command.
APPLICATION LOOP PRINT app_name
A LOOP can be nested within another LOOP statement up to a maximum of five levels.
Do not use metrics that are logged at different intervals in the same statement. For instance, you should not loop on a process (logged at 1-minute intervals) based on the value of a global metric (logged at 5-minute intervals) in a statement like this:
IF global_metric THEN PROCESS LOOP ...
The different intervals cannot be synchronized as you might expect, so results will not be valid.
Performance Alarms 171

In order for the LOOP to execute, the LOOP statement must refer to one or more metrics of the same data type as the type defined in the LOOP statement.
Example
You can use the LOOP statement to cycle through all active applications.
The following example shows how to determine which application has the highest CPU at each interval.
highest_cpu = 0 APPLICATION loop IF app_cpu_total_util > highest_cpu THEN { highest_cpu = app_cpu_total_util big_app = app_name } ALERT "Application ", app_name, " has the highest cpu util at ",highest_cpu_util|5|2, "%" ALARM highest_cpu > 50 START RED ALERT big_app, " is the highest CPU user at ", highest_cpu, "%" REPEAT EVERY 15 minutes CYAN ALERT big_app, " is the highest CPU user at ", highest_cpu, "%" END RESET ALERT "No applications using excessive cpu"
INCLUDE Statement
Use the INCLUDE statement to include another alarm definitions file along with the default alarmdef file.
Syntax
INCLUDE "filename"
where filename is the name of another alarm definitions file. The file name must always be fully qualified.
How It Is Used
The INCLUDE statement could be used to separate logically distinct sets of alarm definitions into separate files.
Example
For example, if you have some alarm definitions in a separate file for your transaction metrics and it is named
trans_alarmdef1
You can include it by adding the following line to the alarm definitions in your alarmdef1 file:
INCLUDE "/var/opt/perf/trans_alarmdef1"
172 Chapter 9

USE Statement
You can add the USE statement to simplify the use of metric names in the alarmdef file when data sources other than the default SCOPE data source are referenced. This allows you to specify a metric name without having to include the data source name.
The data source name must be defined in the datasources file. The alarmdef file will fail its syntax check if an invalid or unavailable data source name is encountered.
Syntax
USE "datasourcename"
How It Is Used
As the alarm generator checks the alarmdef file for valid syntax, it builds an ordered search list of all data sources that are referenced in the file. Perfalarm sequentially adds entries to this data source search list as it encounters fully-qualified metric names or USE statements. This list is subsequently used to match metric names that are not fully qualified with the appropriate data source name. The USE statement provides a convenient way to add data sources to perfalarm's search list, which then allows for shortened metric names in the alarmdef file. For a discussion of metric name syntax, see Metric Names on page 162 earlier in this chapter.
Perfalarm's default behavior for matching metric names to a data source is to look first in the SCOPE data source for the metric name. This implied USE "SCOPE" statement is executed when perfalarm encounters the first metric name in the alarmdef file. This feature enables a default search path to the SCOPE data source so that SCOPE metrics can be referenced in the alarmdef file without the need to fully qualify them. This is shown in the following example on the next page.
ALARM gbl_cpu_total_util > 80 FOR 10 MINUTES START RED ALERT "CPU utilization too high"USE "ORACLE7"ALARM ActiveTransactions >= 95 FOR 5 MINUTES START RED ALERT "Nearing limit of transactions for ORACLE7"
When perfalarm checks the syntax of the alarmdef file containing the above statements, it encounters the metric "gbl_cpu_total_util" and then tries to find its data source. Perfalarm does not yet have any data sources in its search list of data sources, so it executes an implied USE "SCOPE" statement and then searches the SCOPE data source to find the metric name. A match is found and perfalarm continues checking the rest of the alarmdef file.
When perfalarm encounters the USE "ORACLE7" statement, it adds the ORACLE7 data source to the search list of data sources. When the "ActiveTransactions" metric name is encountered, perfalarm sequentially searches the list of data sources starting with the SCOPE data source. SCOPE does not contain that metric name, so the ORACLE7 data source is searched next and a match is found.
If perfalarm does not find a match in any data source for a metric name, an error message is printed and perfalarm terminates.
The appearance of a USE statement in the alarmdef file does not imply that all metric names that follow will be from the specified data source.
Performance Alarms 173

To change the default search behavior, a USE statement can be added to the beginning of the alarmdef file before any references to metric names. This will cause the data source specified in the USE statement to be added to the search list of data sources before the SCOPE data source. The data source(s) in the USE statement(s) will be searched before the SCOPE data source to find matches to the metrics names. This is shown in the following example.
Once a data source has been referenced with a USE statement, there is no way to change its order or to remove it from the search list.
USE "ORACLE7"ALARM gbl_cpu_total_util > 80 FOR 10 MINUTES START RED ALERT "CPU utilization too high"ALARM ActiveTransactions >= 95 FOR 5 MINUTES START RED ALERT "Nearing limit of transactions for ORACLE7"
In the example above, the order of the statements in the alarmdef file has changed. The USE "ORACLE7" statement is defined before any metric names are referenced, therefore the ORACLE7 data source is added as the first data source in the search list of data sources. The implied USE "SCOPE" statement is executed when perfalarm encounters the first metric name "gbl_cpu_total_util." Because the "gbl_cpu_total_util" metric name is not fully-qualified, perfalarm sequentially searches through the list of data sources starting with ORACLE7. ORACLE7 does not contain that metric name so the SCOPE data source is searched next and a match is found.
Perfalarm continues checking the rest of the alarmdef file. When perfalarm encounters the "ActiveTransactions" metric, it sequentially searches the list of data sources starting with ORACLE7. A match is found and perfalarm continues searching the rest of the alarmdef file. If perfalarm does not find a match in any data source for a metric name (that is not fully-qualified), an error message will be printed and perfalarm terminates.
Be careful how you use the USE statement when multiple data sources contain the same metric names. Perfalarm sequentially searches the list of data sources. If you are defining alarm conditions from different data sources that use the same metric names, you must qualify the metric names with their data source names to guarantee that the metric value is retrieved from the correct data source. This is shown in the following example where the metric names in the alarm statements each include their data sources.
ALARM ORACLE7:ActiveTransactions >= 95 FOR 5 MINUTES START RED ALERT "Nearing limit of transactions for ORACLE7"ALARM FINANCE:ActiveTransactions >= 95 FOR 5 MINUTES START RED ALERT "Nearing limit of transactions for FINANCE"
VAR Statement
The VAR statement allows you to define a variable and assign a value to it.
Syntax
[VAR] name = value
• name — Variable names must begin with a letter and can include letters, digits, and the underscore character. Variable names are not case-sensitive.
• value — If the value is an alphanumeric string, it must be enclosed in quotes.
174 Chapter 9

How It Is Used
VAR assigns a value to the user variable. If the variable did not previously exist, it is created.
Once defined, variables can be used anywhere in the alarmdef file.
Examples
You can define a variable by assigning something to it. The following example defines the numeric variable highest_CPU_value by assigning it a value of zero.
highest_CPU_value = 0
The next example defines the alphanumeric variable my_name by assigning it an empty string value.
my_name = ""
ALIAS Statement
The ALIAS statement allows you to substitute an alias if any part of a metric name (class, instance, or metric) has a case-sensitive name or a name that includes special characters. These are the only circumstances where the ALIAS statement should be used.
Syntax
ALIAS name = "replaced-name"
• name — The name must begin with a letter and can include letters, digits, and the underscore character.
• replaced-name — The name that must be replaced by the ALIAS statement to make it uniquely recognizable to the alarm generator.
How It Is Used
Because of the way the alarmdef file is processed, if any part of a metric name (class, instance, or metric name) can be identified uniquely only by recognizing uppercase and lowercase, you will need to create an alias. You will also need to create an alias for any name that includes special characters. For example, if you have applications called "BIG" and "big," you'll need to alias "big" to ensure that they are viewed as different applications. You must define the alias somewhere in the alarmdef file before the first instance of the name you want substituted.
Examples
Because you cannot use special characters or upper and lower case in the syntax, using the application name "AppA" and "appa" could cause errors because the processing would be unable to distinguish between the two. You would alias "AppA" to give it a uniquely recognizable name. For example:
ALIAS appa_uc = "AppA"ALERT "CPU alert for AppA.util is",appa_uc:app_cpu_total_util
If you are using an alias for an instance with a class identifier, include both the instance name and the class name in the alias. The following example shows the alias for the instance name 'other' and the class name 'APPLICATION.'
Performance Alarms 175

ALIAS my_app="other(APPLICATION)" ALERT my_app:app_cpu_total_util > 50 for 5 minutes
SYMPTOM Statement
A SYMPTOM provides a way to set a single variable value based on a set of conditions. Whenever any of the conditions is true, its probability value is added to the value of the SYMPTOM variable.
Syntax
SYMPTOM variable RULE condition PROB probability [RULE condition PROB probability] . . .
• The keywords SYMPTOM and RULE are used exclusively in the SYMPTOM statement and cannot be used in other syntax statements. The SYMPTOM statement must be a top-level statement and cannot be nested within any other statement. No other statements can follow SYMPTOM until all its corresponding RULE statements are finished.
• variable is a variable name that will be the name of this symptom. Variable names defined in the SYMPTOM statement can be used in other syntax statements, but the variable value should not be changed in those statements.
• RULE is an option of the SYMPTOM statement and cannot be used independently. You can use as many RULE options as needed within the SYMPTOM statement. The SYMPTOM variable is evaluated according to the rules at each interval.
• condition is defined as a comparison between two items.
item1 {>, <, >=, <=, ==, !=}item2[item3 {>, <, >=, <=, ==, !=}item4]
where "==" means "equal" and "!=" means "not equal".
An item can be a metric name, a numeric constant, an alphanumeric string enclosed in quotes, an alias, or a variable. When comparing alphanumeric items, only == or != can be used as operators.
• probability is a numeric constant. The probabilities for each true SYMPTOM RULE are added together to create a SYMPTOM value.
How It Is Used
The sum of all probabilities where the condition between measurement and value is true is the probability that the symptom is occurring.
Example
SYMPTOM CPU_Bottleneck RULE gbl_cpu_total_util > 75 PROB 25RULE gbl_cpu_total_util > 85 PROB 25RULE gbl_cpu_total_util > 90 PROB 25
176 Chapter 9

RULE gbl_run_queue > 3 PROB 50 IF CPU bottleneck > 50 THENCYAN ALERT "The CPU symptom is: ", CPU_bottleneck
Performance Alarms 177
Alarm Definition Examples
The following examples show typical uses of alarm definitions.
Example of a CPU Problem
Depending on how you configured the alarm generator, this example triggers an SNMP trap to Network Node Manager or a message to Operations Manager whenever CPU utilization exceeds 90 percent for 5 minutes and the CPU run queue exceeds 3 for 5 minutes.
ALARM gbl_cpu_total_util > 90 AND gbl_run_queue > 3 FOR 5 MINUTESSTART CYAN ALERT "CPU too high at", gbl_cpu_total_util, "%"REPEAT EVERY 20 MINUTES { RED ALERT "CPU still to high at ", gbl_cpu_total_util, "%" EXEC "/usr/bin/pager -n 555-3456"}END RESET ALERT "CPU at ", gbl_cpu_total_util, "% - RELAX"
If both conditions continue to hold true after 20 minutes, a critical severity alarm can be created in the Alarm Browser window of Network Node Manager. A program is then run to page the system administrator.
When either one of the alarm conditions fails to be true, the alarm symbol is deleted and a message is sent showing the global CPU utilization, the time the alert ended, and a note to RELAX.
Example of Swap Utilization
In this example, depending on how you configured the alarm generator, the ALERT can trigger an SNMP trap to be sent to Network Node Manager or a message to be sent to Operations Manager, whenever swap space utilization exceeds 95 percent for 5 minutes.
ALARM gbl_swap_space_util > 95 FOR 5 MINUTES START RED ALERT "GLOBAL SWAP space is nearly full " END RESET ALERT "End of GLOBAL SWAP full condition"
Example of Time-Based Alarms
You can specify a time interval during which alarm conditions can be active. For example, if you are running system maintenance jobs that are scheduled to run at regular intervals, you can specify alarm conditions for normal operating hours and a different set of alarm conditions for system maintenance hours.
In this example, the alarm will only be triggered during the day from 8:00AM to 5:00PM.
start_shift = "08:00"end_shift = "17:00"ALARM gbl_cpu_total_util > 80 TIME > start_shift TIME < end_shift for 10 minutes
178 Chapter 9

TYPE = "cpu" START CYAN ALERT "cpu too high at ", gbl_cpu_total_util, "%" REPEAT EVERY 10 minutes RED ALERT"cpu still too high at ", gbl_cpu_total_util, "%" END IF time == end_shift then { IF gbl_cpu_total_util > 80 then RESET ALERT "cpu still too high, but at the end of shift" ELSE RESET ALERT "cpu back to normal" ELSE
Example of Disk Instance Alarms
Alarms can be generated for a particular disk by identifying the specific disk instance name and corresponding metric name.
The following example of alarm syntax generates alarms for a specific disk instance. Aliasing is required when special characters are used in the disk instance.
ALIAS diskname=""ALARM diskname:bydsk_phys_read > 1000 for 5 minutesTYPE="Disk" START RED ALERT "Disk " REPEAT EVERY 10 MINUTES CYAN ALERT "Disk cyan alert" END RESET ALERT "Disk reset alert"
Performance Alarms 179
Customizing Alarm Definitions
You specify the conditions that generate alarms in the alarm definitions file alarmdef. When Performance Collection Component is first installed, the alarmdef file contains a set of default alarm definitions. You can use these default alarm definitions or customize them to suit your needs.
You can customize your alarmdef file as follows:
1 Revise your alarm definition(s) as necessary. You can look at examples of the alarm definition syntax elsewhere in this chapter.
2 Save the file.
3 Validate the alarm definitions using the Performance Collection Component utility program:
a Type utility
b At the prompt, type
checkdef
This checks the alarm syntax and displays errors or warnings if there any problems with the file.
4 In order for the new alarm definitions to take affect, type:
ovpa restart alarm
or
mwa restart alarm
This causes the alarm generator to stop, restart, and read the customized alarmdef file.
You can use a unique set of alarm definitions for each Performance Collection Component system, or you can choose to standardize monitoring of a group of systems by using the same set of alarm definitions across the group.
If the alarmdef file is very large, the Performance Collection Component alarm generator and utility programs may not work as expected. This problem may or may not occur based on the availability of system resources.
The best way to learn about performance alarms is to experiment with adding new alarm definitions or changing the default alarm definitions.
180 Chapter 9
10 Adviser for the RTMA Component
You can use the adviser feature only if you enable the HP Ops OS Inst to Realtime Inst LTU or Glance Pak Software LTU .
The adviser feature enables you to generate and view alarms when values of certain metrics, collected by the RTMA component, exceed (or fall below) the set threshold. The adviser script and padv utility build up the adviser feature. The adviser script helps you create the rules to generate alarms when the performance of the monitored system shows signs of degradation. The padv utility helps you run the adviser script on a system of your interest.
Alarms and Symptoms
Alarms enable you to highlight metric conditions. The adviser script enables you to define threshold values for metrics that are monitored by the RTMA component. When the metric value traverses beyond the set threshold, the RTMA component generates an alarm in the form of an alert message. This message is sent in the form of stdout to the padv utility.
An alarm can be triggered whenever conditions that you specify are met. Alarms are based on any period of time you specify, which can be one interval or longer.
A symptom is a combination of conditions that affects the performance your system.
By observing different metrics with corresponding thresholds and adding values to the probability that these metrics contribute to a bottleneck, the adviser calculates one value that represents the combined probability that a bottleneck is present.
Working of the Adviser Script
When you run the padv command, the HP Operations agent scans the script specified with the command and takes necessary actions. If you do not specify any script file with the padv command, the adviser utility retrieves necessary information from the following default script file:
• On Windows: %ovdatadir%\perf\perfd
• On UNIX and Linux: /var/opt/perf/perfd
If you want to run the script that includes operating system-specific diagnosis and actions, use the following default scripts:
This topic focuses on the adviser feature that can be used with the RTMA component. The GlancePlus software offers additional features that can be used with the adviser utility. For information on using the adviser feature with the GlancePlus software, see online help for GlancePlus.
181
• On Windows: %ovdatadir%\perf\perfd\os\<os_type>\adv
• On UNIX and Linux: /var/opt/perf/perfd/os/<os_type>/adv
In this instance, <os_type> is the type of operating system of node where you want to run the script.
As a result of running the adviser script, you can achieve the following:
• Print the system status based on generated alarms into a text file
• View the real-time status of the system in the command console from where you ran the padv command.
Using Adviser
To use the adviser component to monitor the real-time health of the system, follow these steps:
1 Configure the adviser script according to your requirements. Sample scripts are available into the following directory:
• On Windows: %ovinstalldir%\examples\adviser
• On UNIX or Linux: /opt/perf/examples/adviser
2 Identify the node where you want to run the script.
3 Make sure the perfd process runs on the identified system.
4 Run the following command:
padv -s <script_name> -n <system_name>
The adviser script starts running on the specified system and creates results based on the configuration of the script file.
Run the Adviser Script on Multiple Systems
You can use the mpadv command to run the adviser script on multiple systems. To use the mpadv command, follow these steps:
1 Identify the nodes where you want to run the script.
2 Create a text file listing the names of all the identified systems.
3 Save the text file on the local system.
4 Configure the adviser script according to your requirements. Sample scripts are available into the following directory:
• On Windows: %ovinstalldir%\examples\adviser
• On UNIX or Linux: /opt/perf/examples/adviser
5 Make sure the perfd process runs on the identified system.
6 Run the following command:
mpadv -l <system_list_text_file> -s <script_name>
The adviser script starts running on the systems specified in the <system_list_text_file> file and creates results based on the configuration of the script file.
182 Chapter 10
Adviser Syntax
The adviser syntax is a simple script language that enables you to set alarms and define symptom conditions.
A default syntax file— adviser.syntax— is provided in the following directory:
• On Windows: %ovdatadir%\perf
• On UNIX and Linux: /var/opt/perf
You can edit the syntax file to define your own alarms and symptoms.
Syntax Conventions
• Braces ({ }) indicate that one of the choices is required.
• Brackets ([ ]) indicate an optional item.
• Items separated by commas within brackets or braces are options. Choose only one.
• Italics indicate a variable name that you will replace.
• Adviser syntax keywords must always be written in the capital case.
Comments
Syntax:
# [any text or characters]
or
// [any text or characters]
You can precede comments either by double forward slashes (//) or the # sign. In both cases, the comment ends at the end of the line.
Conditions
A condition is defined as a comparison between two metric names, user variables, or numeric constants.
item1 {>, <, >=, <=, ==, !=} item2 [OR item3 \
{>, <, >=, <=, ==, !=} item4]
or:
item1 {>, <, >=, <=, ==, !=} item2 [AND item3 \
{>, <, >=, <=, ==, !=} item4]
("==" means "equal", and "!=" means "not equal".)
Conditions are used in the ALARM statement and the IF statement. They can be used to compare two numeric metrics, variables or constants, and they can also be used between two string metric names, user variables or string constants. For string conditions, only == or != can be used as operators.
Adviser for the RTMA Component 183
You can use compound conditions by specifying the OR or AND operator between subconditions.
Examples:
gbl_swap_space_reserved_util > 95
proc_proc_name == "test" OR proc_user_name == "tester"
proc_proc_name != "test" AND
proc_cpu_sys_mode_util > highest_proc_so_far
Constants
Constants can be either alphanumeric or numeric. An alphanumeric constant must be enclosed in double quotes. There are two kinds of numeric constants: integer and real. Integer constants may contain only digits and an optional sign indicator. Real constants may also include a decimal point.
Examples:
Expressions
Use expressions to evaluate numerical values. An expression can be used in a condition or an action.
An expression can contain:
• Numeric constants
• Numeric metric names
• Numeric variables
• An arithmetic combination of the above
• A combination of the above grouped together using parentheses
Examples:
Iteration + 1
3.1416
gbl_cpu_total_util - gbl_cpu_user_mode_util
( 100 - gbl_cpu_total_util ) / 100.0
Metric Names in Adviser Syntax
You can directly reference metrics anywhere in the Adviser syntax. You can use the following types of metrics in the Adviser syntax:
345 Numeric integer
345.2 Numeric real
“Time is” Alphanumeric literal
184 Chapter 10
• Global metrics (prefixed with gbl_ or tbl_)
• Application metrics (prefixed with app_)
• Process metrics (prefixed with proc_)
• Disk metrics (prefixed with bydsk_)
• By CPU metrics (prefixed with bycpu_)
• File system metrics (prefixed with fs_)
• Logical volume metrics (prefixed with lv_)
• Network interface metrics (prefixed with bynetif_)
• Swap metrics (prefixed with byswp_)
• ARM metrics (prefixed with tt_ or ttbin_)
• PRM metrics (prefixed with prm_)
• Locality Domain metrics (prefixed by ldom_)
You can only use process, logical volume, disk, file system, LAN, and swap metrics within the context of a LOOP statement.
Metrics can contain alphanumeric (for example, gbl_machine or app_name) or numeric data and can reflect several different kinds of measurement. For example, the metric ending of a metric name indicates what is being measured:
• a _util metric measures utilization in percentages
• a _rate metric measures units per second
• a _queue metric measures the number of processes or threads waiting for a resource
If you are unsure of the unit of measure for a specific metric, refer to the metric definition document.
You must associate an application metric with a specific application, except when using the LOOP statement. To do this, specify the application name followed by a colon, and then the metric name. For example, other_apps:app_cpu_total_util specifies the total CPU utilization for the application other_apps. Refer to the ALIAS statement description for more information on using application metrics in the syntax.
Application names, as defined by the parm file, may contain special characters and embedded blanks. To use these names in the syntax (where application names must match the form of a variable name), the names are made case-insensitive and embedded blanks are converted to underlines. This means that the application name defined as "Other Apps" may be referenced in the syntax as other_apps. For application names defined with special characters, you must use the ALIAS statement to specify an alternate name.
When explicitly qualified, application metrics may be referenced anywhere in the syntax. Unqualified application metrics may only be referenced within the context of the LOOP statement. This is an iterative statement which implicitly qualifies application or process metrics.
You can only reference process metrics within the context of a LOOP statement. There is no way to explicitly reference a process.
Printlist
The printlist is any combination of properly formatted expressions, Metric Names, user variables, or constants. See the examples for the proper formatting.
Adviser for the RTMA Component 185
Expression examples:
expression [|width[|decimals]]
Metric Names or User Variable examples:
metric names [|width[|decimals]]
or
user variables [|width[|decimals]]
The metric names or user variables must be alphanumeric.
Constant examples:
No formatting is necessary for constants.
Formatted Examples:
gbl_cpu_total_util|6|2 formats as '100.00'
(100.32 + 20)|6 formats as ' 120'
gbl_machine|5 formats as '7013/'
"User Label" formats as "User Label"
Variables
Variables must begin with a letter and can include letters, digits, and the underscore character. Variables are not case-sensitive.
Define a variable by assigning something to it. The following example defines the numeric variable highest_CPU_value by assigning it a value of zero.
highest_CPU_value = 0
The following example defines the alphanumeric variable my_name by assigning it a null string value.
my_name = ""
Adviser Syntax Statements
ALARM Statement
Use the ALARM statement to notify you when certain events, which you define, occur on your system. Using the ALARM statement, the adviser script can notify you through messages sent to the originating console of the padv command.
Syntax:
ALARM condition [FOR duration {SECONDS, MINUTES, INTERVALS}]
[condition [FOR duration {SECONDS, MINUTES, INTERVALS}] ] ...
[START statement]
186 Chapter 10

[REPEAT [EVERY duration [SECONDS, MINUTES, INTERVAL, INTERVALS]]
statement]
[END statement]
The ALARM statement must be a top-level statement. It cannot be nested within any other statement.
However, you can include several ALARM conditions in a single ALARM statement, in which case all conditions must be true for the alarm to trigger. And you can also use a COMPOUND Statement, which is executed at the appropriate time during the alarm cycle.
START, REPEAT, and END are ALARM statement keywords. Each of these keywords specifies a statement. You must have a START, REPEAT, or END in an ALARM statement, and they must be listed in correct order.
The alarm cycle begins on the first interval that all of the alarm conditions have been true for at least the specified duration. At that time, the adviser script executes the START statement, and on each subsequent interval checks the REPEAT condition. If enough time has transpired, the statement for the REPEAT clause is executed. This continues until one or more of the alarm conditions becomes false. This completes the alarm cycle and the END statement is executed.
If you omit the EVERY specification from the REPEAT statement, the adviser script executes the REPEAT statement at each interval.
ALARM Example: Typical ALARM Statement
The following ALARM example sets a red alert when the semaphore table is almost full. It is similar to a predefined Alarm in the default syntax. Do not add this to your syntax without removing the default, or your subsequent alert messages may be confusing.
ALARM tbl_sem_table_util > 90 FOR 1 MINUTE
START RED ALERT "Semaphore Table is nearly full"
REPEAT EVERY 30 SECONDS
RED ALERT "Semaphore Table still nearly full"
END RESET ALERT "End of Semaphore Table full condition"
This ALARM example tests the metric tbl_sem_table_util to see if it is greater than 90. If it is, the RED ALERT statement sends the message with the severity RED to the originating console of the padv command.
The REPEAT statement checks for the tbl_sem_table_util condition every 30 seconds. As long as the condition is greater than 90, the REPEAT tells the adviser to maintain a RED ALERT condition and sends the Semaphore Table still nearly full message to the originating console of the padv command.
When the tbl_sem_table_util condition goes below 90, the RESET ALERT statement displays the message End of Semaphore Table full condition in the originating console of the padv command.
Adviser for the RTMA Component 187
ALARM Example: Using Multiple Conditions
You can have more than one test condition in the ALARM statement. In this case, each statement must be true for the alarm button to activate. For example:
ALARM gbl_cpu_total_util > 90 FOR 2 MINUTES
gbl_cpu_sys_mode_util > 50 FOR 1 MINUTES
START RED ALERT
"The CPU is busy and System Mode CPU utilization is high."
END RESET ALERT "The CPU alert is now over."
This ALARM example tests the metric gbl_cpu_total_util and CPU_Bottleneck. If both conditions are true, the RED ALERT statement sets a critical alert. When either test condition becomes false, the RESET statement is executed.
ALARM Example: Swap Space
//GLOBAL SWAP ALARM
symp_swap_util = gbl_swap_space_used / gbl_swap_space_avail
ALARM symp_swap_util > 0.9
START
RED ALERT "GLOBAL SWAP space is nearly full"
END RESET ALERT "GLOBAL SWAP space crisis is over"
The new variable, symp_swap_util, represents swap utilization. The adviser script creates an alarm when the swap utilization exceeds 90%. On the next interval, if symp_swap_util falls below 90%, the alarm condition becomes false, and the ALARM is reset.
ALARM Example: Yellow Alert
ALARM Symp_Global_Cpu_Bottleneck > 50 FOR 2 MINUTES
START YELLOW ALERT "CPU Bottleneck probability= ",
Symp_Global_Cpu_Bottleneck, "% for the last 2 minutes"
REPEAT every 2 minutes
YELLOW ALERT "CPU Bottleneck probability= ",
Symp_Global_Cpu_Bottleneck, "% for the last 2 minutes"
END
RESET ALERT " CPU Bottleneck Yellow Alert over, probability=",
Symp_Global_Cpu_Bottleneck, "%"
The ALARM tests the SYMPTOM variable, which is defined in the SYMPTOM Statement Symp_Global_Cpu_Bottleneck. If the SYMPTOM variable is greater than 50 for two minutes, the ALARM notifies you with a YELLOW ALERT to the padv command console.
The ALARM repeats every 2 minutes until the ALARM condition is false. At that time, the END statement resets the ALERT.
188 Chapter 10
ALARM Example: CPU Problem
ALARM
gbl_cpu_total_util > 90 FOR 30 SECONDS
gbl_run_queue > 3 FOR 30 SECONDS
START YELLOW ALERT "CPU AT ", gbl_cpu_total_util,
"% at ", gbl_stattime
REPEAT EVERY 300 SECONDS {
RED ALERT "CPU AT ", gbl_cpu_total_util
exec "/usr/bin/pager -n 555-3456"
}
END ALERT "CPU at ", gbl_cpu_total_util, "% at ",
gbl_stattime, " - RELAX"
This example generates a yellow alert in the padv command console whenever CPU utilization exceeds 90% for 30 seconds and the CPU run queue exceeds 3 for 30 seconds.
If both conditions remain true, a red alert is generated and a program to page the system administrator is invoked.
ALERT Statement
The ALERT statement is used to place a message in padv command console. Whenever an ALARM detects a problem, it can run an ALERT statement to send a message with the specified severity to the padv command console.
You can use the ALERT statement in conjunction with an ALARM statement.
Syntax:
[(RED or CRITICAL), (YELLOW or WARNING), RESET] ALERT printlist
RED and YELLOW, are synonymous with CRITICAL and WARNING.
ALERT Example
An example an ALERT statement is:
RED ALERT "CPU utilization = ", gbl_cpu_total_util,
" at ", gbl_stattime
When you run this statement, a message is written in the padv command console that shows, for example:
CPU utilization = 85.6 at 14:43:10
Adviser for the RTMA Component 189
ALIAS Statement
Use the ALIAS statement to assign a variable to an application name that contains special characters or imbedded blanks.
Syntax:
ALIAS variable = "alias name"
ALIAS Example
Because you cannot use special characters or embedded blanks in the syntax, using the application name "other user root" in the PRINT statement below would have caused an error. Using ALIAS, you can still use "other user root" or other strings with blanks and special characters within the syntax.
ALIAS otherapp = "other user root"
PRINT "CPU for other root login processes is: ",
otherapp:app_cpu_total_util
ASSIGNMENT Statement
Use the ASSIGNMENT statement to assign a numeric or alphanumeric value, expression, to the user variable.
Syntax:
[VAR] variable = expression
[VAR] variable = alphaitem
[VAR] variable = alphaitem
ASSIGNMENT Examples
A user variable is determined to be numeric or alphanumeric at the first assignment. You cannot mix variables of different types in an assignment statement.
This example assigns an alphanumeric application name to a new user variable:
myapp_name = other:app_name
This example is incorrect because it assigns a numeric value to a user variable that was previously defined as alphanumeric (in example 1):
myapp_name = 14
This example assigns a numeric value to a new user variable:
highest_cpu = gbl_cpu_total_util
This example is incorrect because it assigns an alphanumeric literal to a user variable that was previously defined as numeric (in example 3):
highest_cpu = "Time is"
COMPOUND Statement
Use the COMPOUND statement with the IF statement, the LOOP statement, and the START, REPEAT, and END clauses of the ALARM statement. By using a COMPOUND statement, a list of statements can be executed.
190 Chapter 10

Syntax
{
statement
statement
}
Construct compound statements by grouping a list of statements inside braces ({}). The compound statement can then be treated as a single statement within the syntax.
Compound statements cannot include ALARM and SYMPTOM statements. (Compound is a type of statement and not a keyword.)
COMPOUND Example
highest_cpu = highest_cpu
IF gbl_cpu_total_util > highest_cpu THEN
// Begin compound statement
{
highest_cpu = gbl_cpu_total_util
PRINT "Our new high CPU value is ", highest_cpu, "%"
}
// End compound statement
In this example, highest_cpu = highest_cpu defines a variable called highest_cpu. The adviser script saves the highest_cpu value and notifies you only when that highest_cpu value is exceeded by a higher value.
In the example, if you replaced highest_cpu = highest_cpu with highest_cpu = 0, then the highest_cpu value would be reset to zero at each interval.
At every interval, you would be notified what the highest_cpu value is.
EXEC Statement
Use the EXEC statement to execute a UNIX command from within your Adviser syntax. You could use the EXEC command, for example, if you wanted to send a mail message to the MIS staff each time a certain condition is met.
Syntax
EXEC printlist
The resulting printlist is submitted to your operating system for execution.
Because the EXEC command you specify may execute once every update interval, be careful when using the EXEC statement with operating system commands or scripts that have high overhead.
EXEC Examples
In the following example, EXEC executes the UNIX mailx command at every interval.
EXEC "echo 'gpm mailed you a message' | mailx root"
Adviser for the RTMA Component 191

In the following example, EXEC executes the UNIX mailx command only when the gbl_disk_util_peak metric exceeds 20.
IF gbl_disk_util_peak > 20 THEN
EXEC "echo 'gpm detects high disk utilization' | mailx root"
IF Statement
Use the IF statement to test conditions you define in the adviser script syntax.
Syntax:
IF condition THEN statement [ELSE statement]
The IF statement tests the condition. If true, the statement after the THEN is executed. If the condition is false, then the action depends on the optional ELSE clause.
If an ELSE clause has been specified, the statement following it is executed. Otherwise, the IF statement does nothing. The statement can be a COMPOUND statement which tells the adviser script to execute multiple statements.
IF Example
IF gbl_cpu_total_util > 90 THEN
PRINT "The CPU is running hot at: ", gbl_cpu_total_util
ELSE IF gbl_cpu_total_util < 20 THEN
PRINT "The CPU is idling at: ", gbl_cpu_total_util
In this example, the IF statement is checking the condition (gbl_cpu_total_util > 90). If the condition is true, then "The CPU is running hot at: " is displayed in the padv command console along with the % of CPU used.
If the (gbl_cpu_total_util > 90) condition is false, ELSE IF goes to the next line and checks the condition (gbl_cpu_total_util < 20). If that condition is true, then "The CPU is idling at: " is displayed in the padv command console along with the % of CPU used.
LOOP Statement
Use LOOP statements to find information about your system. For example, you can find the process that uses the highest percentage of CPU or the swap area that is being utilized most. You find this information with the LOOP statement and with corresponding statements that use metric names for the system conditions on which you are gathering information.
Syntax:
{APPLICATION, APP, CPU, DISK, DISK_DETAIL, FILESYSTEM, FS, FS_DETAIL, LAN, LOGICALVOLUME, LV, LV_DETAIL, NETIF, NFS, NFS_BYSYS_OPS, NFS_OP, PRM, PRM_BYVG, PROCESS, PROC, PROC_FILE, PROC_REGION, PROC_SYSCALL, SWAP, SYSTEMCALL, SC, THREAD, TRANSACTION, TT, TTBIN, TT_CLIENT, TT_INSTANCE, TT_UDM, TT_RESOURCE, TT_INSTANCE_CLIENT, TT_INSTANCE_UDM, TT_CLIENT_UDM, LDOM, PROC_LDOM}
LOOP statement
A LOOP can be nested within other syntax statements, but you can only nest up to five levels. The statement may be a COMPOUND statement which contains a block of statements to be executed on each iteration of the loop. A BREAK statement allows the escape from a LOOP statement.
192 Chapter 10
If you have a LOOP statement in your syntax for collecting specific data and there is no corresponding metric data on your system, the adviser script skips that LOOP and continues to the next syntax statement or instruction. For example, if you have defined a LOGICAL VOLUME LOOP, but have no logical volumes on your system, the adviser script skips that LOGICAL VOLUME LOOP and continues to the next syntax statement.
Loops that do not exist on your platform generate a syntax error.
As LOOP statement iterates through each interval, the values for the metric used in the statement change. For example, the following LOOP statement executes the PRINT statement once for each active application on the system, causing the name of each application to be printed.
APP LOOP
PRINT app_name
On a threaded operating system such as HP_UX 11.23, the adviser script supports a THREAD LOOP. A thread loop can be nested inside a process loop in order to examine each thread for a particular process. If you do reference a PROC_ metric inside a thread loop, it could return unexpected results (thread information).
A thread loop can also exist outside a process loop. In this case, it examines all threads active on the system. You should not nest a process loop within a thread loop.
Because LOOP statements are initiated at each interval, use them with discretion due to possible performance implications. This caution is especially appropriate with regards to using nested LOOP statements.
APPLICATION LOOP Example
Use the APPLICATION LOOP statement to cycle through all active applications.
You can use global (gbl_), table (tbl_), or application (app_) metrics with the APPLICATION LOOP.
The following example uses an Application LOOP to find the application with the highest CPU for an interval.
big_app = ""
highest_cpu = 0
APPLICATION LOOP
IF (app_cpu_total_util > highest_cpu) THEN
{
highest_cpu = app_cpu_total_util
big_app = app_name
}
IF (highest_cpu > 20) THEN
YELLOW ALERT "The application ", big_app,
" is the highest CPU user at", highest_cpu, "%"
After finding the application, the adviser script writes a message to the padv command console with the app_name and CPU value, if the CPU value is greater than 20.
Adviser for the RTMA Component 193

CPU LOOP Example
Use the CPU LOOP statement to cycle through data about CPU use on your system. You can use global (gbl_), table (tbl_), or by CPU (bycpu_ metrics with the CPU LOOP.
This example prints CPU usage percentage for each CPU on your system.
Print "----------", glb_stattime, "----------"
CPU LOOP
PRINT "CPU # ", bycpu_id, " used ", bycpu_cpu_total_util, " % CPU"
On a system with two CPUs, the resulting output for two intervals:
----------10:52:01----------
CPU # 0 used 0.6 % CPU
CPU # 1 used 3.4 % CPU
----------10:52:11----------
CPU # 0 used 0.4 % CPU
CPU # 1 used 2.3 % CPU
DISK LOOP Example
Use the DISK LOOP statement to loop through your configured disk devices. When you use this LOOP, the adviser script checks for specific disk information that appears in the IO by Disk window. You can use global (gbl_), table (tbl_) or by disk metrics with the DISK LOOP.
This example prints the physical write rate for each disk on your system.
PRINT "---------------------", gbl_stattime, "--------------------"
DISK LOOP
PRINT bydsk_devname, " write rate: ", bydsk_phys_write_rate
On a system with three disks, the resulting output for two intervals:
---------------------11:00:23------------------------
/dev/hdisk0 write rate: 2.4
/dev/hdisk1 write rate: 0.0
/dev/cd0 write rate: 0.0
---------------------11:00:33------------------------
/dev/hdisk0 write rate: 0.0
/dev/hdisk1 write rate: 0.0
/dev/cd0 write rate: 0.0
194 Chapter 10

FILE SYSTEM LOOP Example
The FILE SYSTEM LOOP is designed to loop through configured file systems and allow the adviser script to report on information accessible in the IO By File System window. You can use global (gbl_), table (tbl_), or IO by file system (fs_) metrics with the FILE SYSTEM LOOP.
The following example reports the space utilized for each file system device on a system with three devices.
PRINT "-------------------", gbl_stattime, "----------------------"
FS LOOP
PRINT fs_devname, " is ", fs_space_util, "% full at ",
fs_max_size," megabytes"
The output for two intervals on a system with three file systems is:
---------------------11:11:28------------------------
/dev/hd4 is 77.9% full at 32 megabytes
/dev/hd2 is 94.9% full at 928 megabytes
/dev/hd9var is 93.9% full at 56 megabytes
---------------------11:11:38------------------------
/dev/hd4 is 77.9% full at 32 megabytes
/dev/hd2 is 94.9% full at 928 megabytes
/dev/hd9var is 93.6% full at 56 megabytes
NFS BY OPERATION LOOP Example
Use the NFS BY OPERATION LOOP to loop through NFS operations performed. When you use this LOOP, the adviser script checks for specific NFS operations. You can use either global (gbl_), table (tbl_), or by operation metrics with the NFS_OP LOOP.
The following example prints the server and client operations performed:
PRINT "--------------------", gbl_stattime, "---------------------"
NFS_OP LOOP
PRINT byop_server_count," server and ",byop_client_count,
" client ",byop_name," operations performed"
On a system performing no activity as an NFS server but with users doing directory listing on another NFS server, the resulting output is:
---------------------14:55:41------------------------
0 server and 0 client null operations performed
0 server and 2 client getattr operations performed
0 server and 0 client setattr operations performed
0 server and 0 client root operations performed
0 server and 886 client lookup operations performed
Adviser for the RTMA Component 195

0 server and 884 client readlink operations performed
0 server and 0 client read operations performed
0 server and 0 client writecache operations performed
0 server and 0 client write operations performed
0 server and 0 client create operations performed
0 server and 0 client remove operations performed
0 server and 0 client rename operations performed
0 server and 0 client link operations performed
0 server and 0 client symlink operations performed
0 server and 0 client mkdir operations performed
0 server and 0 client rmdir operations performed
0 server and 28 client readdir operations performed
0 server and 1 client statfs operations performed
NETWORK INTERFACE LOOP Example
Use the NETWORK INTERFACE LOOP to loop through configured LAN devices.
# This version will only work with hp-ux 11.x.If you want it to
# work for 10.20 you need to remove the "BYNETIF_QUEUE," string
# below as that metric is only available from 11.x glance.
# The following string variable should be changed to the interface
# of interest. For example:
# netif_to_examine = "lan0"
# If you want to see all interfaces, leave it an empty string (""):
# netif_to_examine = ""
# initialize variables:
headers_printed = headers_printed
netif loop {
# print information for the selected interface or if null then all:
IF (BYNETIF_NAME == netif_to_examine) or
(netif_to_examine == "") THEN
{
# print headers the first time through the loop:
IF headers_printed == 0 THEN
{
print "Time Interface InPkts OutPkts OutQ Colls Errs"
print " "
196 Chapter 10

headers_printed = 1
}
# print one line per interface reported:
print GBL_STATTIME, " ", BYNETIF_NAME|8,
BYNETIF_IN_PACKET, BYNETIF_OUT_PACKET,
BYNETIF_QUEUE, BYNETIF_COLLISION, BYNETIF_ERROR
# (note that some interface types do not report collisions or
# errors)
}
}
print " "
The resulting output:
Time Interface InPkts OutPkts OutQ Colls Errs
22:43:42 lan3 49 3 0 0 0
22:43:42 lan0 0 0 0 0 0
22:43:42 lan1 0 0 0 0 0
22:43:42 lan2 0 0 0 0 0
22:43:42 lo0 0 0 0 0 0
22:43:47 lan3 329 2 0 0 0
22:43:47 lan0 0 0 0 0 0
22:43:47 lan1 0 0 0 0 0
22:43:47 lan2 0 0 0 0 0
22:43:47 lo0 0 0 0 0 0
LOGICAL VOLUME Example
Use LOGICAL VOLUME loops to loop through your configured logical volumes. You can use either global (gbl_), table (tbl_), or logical volume metrics with the LOGICAL VOLUME LOOP.
PRINT "-----------------", gbl_stattime, "-------------------"
LV LOOP
PRINT "Volume ", lv_dirname, " was read at a rate of ",
lv_read_rate, " per second"
The resulting output for two intervals on a system with logical volumes:
----------------------------11:46:50------------------------------
Adviser for the RTMA Component 197

Volume /dev/vg00 was read at a rate of 0.0 per second
Volume /dev/vg00/group was read at a rate of 0.0 per second
Volume /dev/vg00/1vol3 was read at a rate of 314.3 per second
----------------------------11:47:00------------------------------
Volume /dev/vg00 was read at a rate of 0.0 per second
Volume /dev/vg00/group was read at a rate of 0.0 per second
Volume /dev/vg00/1vol3 was read at a rate of 70.6 per second
PRM LOOP Example
HP-UX only. Use the PRM LOOP to cycle through information found in the Process Resource Manager (PRM) groups. You can use global (gbl_), table (tbl_), or application metrics with the PRM LOOP.
The following PRM LOOP example checks for high run queue and any PRM groups exceeding their CPU entitlements.
IF gbl_run_queue > 3 THEN {
print " "
print "--- High run queue = ", gbl_run_queue, " at ", gbl_stattime,
" ---"
prm loop {
IF app_prm_state > 2 THEN
IF app_cpu_total_util > app_prm_cpu_entitlement THEN
print " Note PRM group ", app_name_prm_groupname,
" exceeds entitlement."
}
}
The output printed at each interval is:
--- High run queue = 3.4 at 15:53:29 ---
Note PRM group Testing exceeds entitlement.
PRM_BYVG LOOP Example
HP-UX only. Use the PRM_BYVG loop to loop through PRM groups for a volume group. (Note that PRM information is only available for volume groups that are specified in the PRM configuration file.) The PRM_BYVG loop must be nested within a LV loop. The following example displays disk resource usage statistics by PRM group.
PRM loop {
disk_state = app_prm_disk_state
}
198 Chapter 10

IF disk_state == 0 THEN{
print " Disk manager state: Not Installed"
}
else IF disk_state == 1 THEN {
print " Disk manager state: Reset"
}
else IF disk_state == 2 THEN {
print " Disk manager state: Disabled"
}
else IF disk_state == 3 THEN {
print " Disk manager state: Enabled"
lv loop {
IF lv_type == "G" THEN {
print " Volume Group: ", lv_dirname
print " % % KB"
print "PRM Group PRMID entitled achieved transferred"
print "---------------------------------------------------"
prm_byvg loop {
print prm_byvg_prm_groupname|13, prm_byvg_prm_groupid|5,
prm_byvg_group_entitlement|8, prm_byvg_group_util|8,
prm_byvg_transfer
}
print " "
}
}
}
The output at each interval is:
Adviser for the RTMA Component 199

Disk manager state: Enabled
Volume Group: /dev/vg00
% % KB
PRM Group PRMID entitled achieved transferred
---------------------------------------------------
PRM_SYS 0 0 100 8
OTHERS 1 50 0 0
tools 2 50 0 0
PROCESS LOOP Example
Use the PROCESS LOOP statement to cycle through all active processes. You can use either global (gbl_), table (tbl_), or process (proc_) metrics with the PROCESS LOOP. The following example uses a PROCESS LOOP to find the process with the highest CPU for an interval.
big_proc_id = 0
big_proc_name = ""
big_proc_cpu = 0
PROCESS LOOP
IF proc_cpu_total_util > big_proc_cpu THEN {
big_proc_cpu = proc_cpu_total_util
big_proc_name = proc_proc_name
big_proc_id = proc_proc_id
}
IF big_proc_cpu > 10 THEN
YELLOW ALERT "Possible loop, process ", big_proc_name,
" pid ", big_proc_id|6|0, " using ", big_proc_cpu, " % CPU"
SWAP LOOP Example
Use the SWAP LOOP to LOOP through the configured swap areas and allow the adviser script to report on information from the Swap Space window. You can use table (tbl_) or global (gbl_) or by swap (byswp_) metrics with the SWAP LOOP.
The following example reports on the swap space available on a system with two swap devices.
PRINT "-------------------", gbl_stattime, "----------------------"
SWAP LOOP
PRINT BYSWP_SWAP_SPACE_NAME, " has ", BYSWP_SWAP_SPACE_USED,
" used out of", BYSWP_SWAP_SPACE_AVAIL, " megabytes "
On a system with one swap area, the output printed for two intervals is:
200 Chapter 10
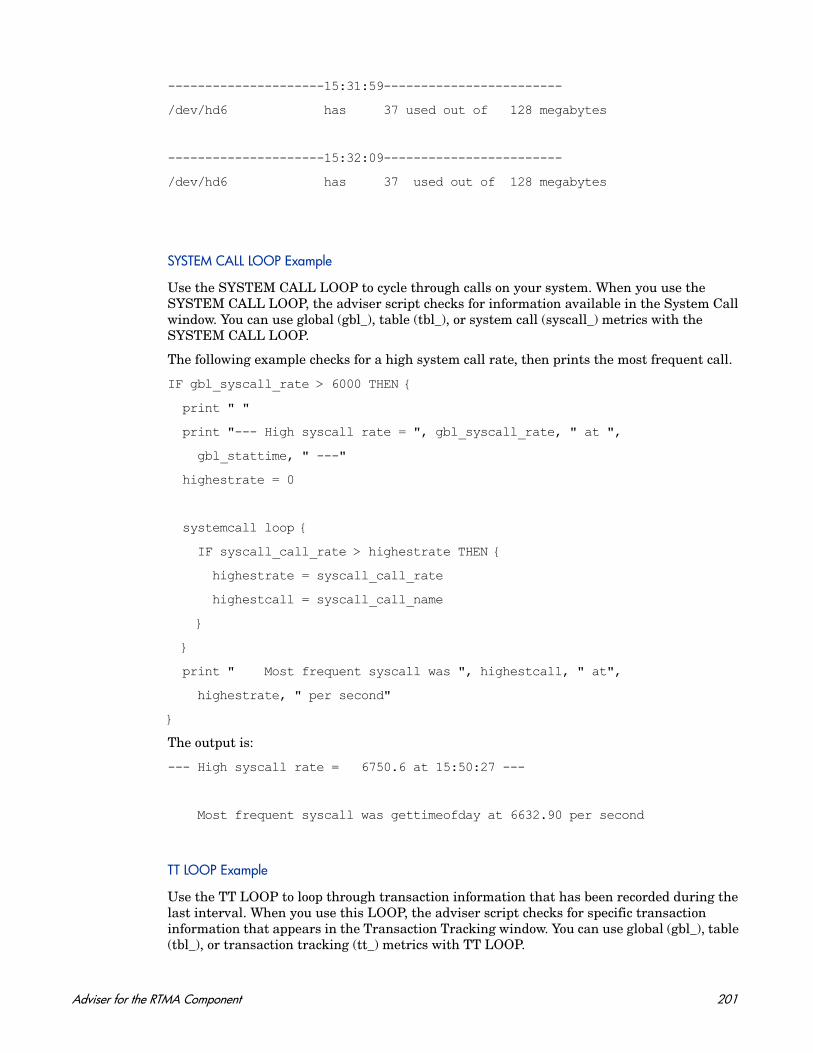
---------------------15:31:59------------------------
/dev/hd6 has 37 used out of 128 megabytes
---------------------15:32:09------------------------
/dev/hd6 has 37 used out of 128 megabytes
SYSTEM CALL LOOP Example
Use the SYSTEM CALL LOOP to cycle through calls on your system. When you use the SYSTEM CALL LOOP, the adviser script checks for information available in the System Call window. You can use global (gbl_), table (tbl_), or system call (syscall_) metrics with the SYSTEM CALL LOOP.
The following example checks for a high system call rate, then prints the most frequent call.
IF gbl_syscall_rate > 6000 THEN {
print " "
print "--- High syscall rate = ", gbl_syscall_rate, " at ",
gbl_stattime, " ---"
highestrate = 0
systemcall loop {
IF syscall_call_rate > highestrate THEN {
highestrate = syscall_call_rate
highestcall = syscall_call_name
}
}
print " Most frequent syscall was ", highestcall, " at",
highestrate, " per second"
}
The output is:
--- High syscall rate = 6750.6 at 15:50:27 ---
Most frequent syscall was gettimeofday at 6632.90 per second
TT LOOP Example
Use the TT LOOP to loop through transaction information that has been recorded during the last interval. When you use this LOOP, the adviser script checks for specific transaction information that appears in the Transaction Tracking window. You can use global (gbl_), table (tbl_), or transaction tracking (tt_) metrics with TT LOOP.
Adviser for the RTMA Component 201
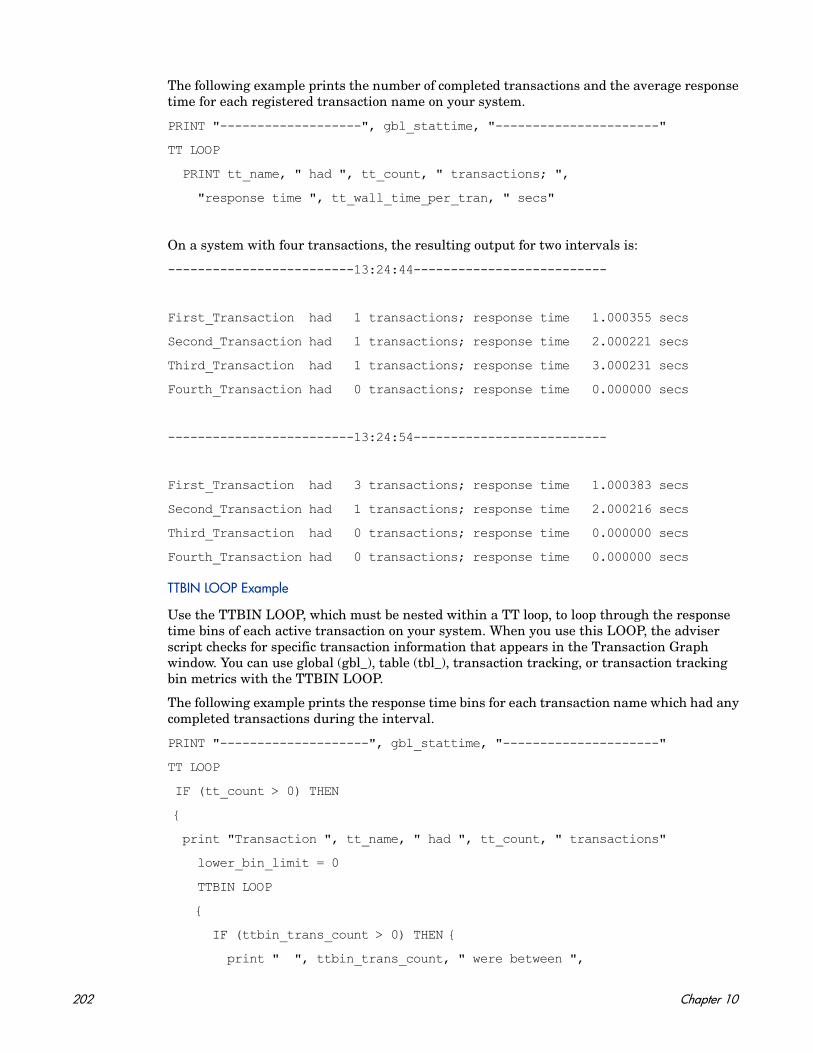
The following example prints the number of completed transactions and the average response time for each registered transaction name on your system.
PRINT "-------------------", gbl_stattime, "----------------------"
TT LOOP
PRINT tt_name, " had ", tt_count, " transactions; ",
"response time ", tt_wall_time_per_tran, " secs"
On a system with four transactions, the resulting output for two intervals is:
-------------------------13:24:44--------------------------
First_Transaction had 1 transactions; response time 1.000355 secs
Second_Transaction had 1 transactions; response time 2.000221 secs
Third_Transaction had 1 transactions; response time 3.000231 secs
Fourth_Transaction had 0 transactions; response time 0.000000 secs
-------------------------13:24:54--------------------------
First_Transaction had 3 transactions; response time 1.000383 secs
Second_Transaction had 1 transactions; response time 2.000216 secs
Third_Transaction had 0 transactions; response time 0.000000 secs
Fourth_Transaction had 0 transactions; response time 0.000000 secs
TTBIN LOOP Example
Use the TTBIN LOOP, which must be nested within a TT loop, to loop through the response time bins of each active transaction on your system. When you use this LOOP, the adviser script checks for specific transaction information that appears in the Transaction Graph window. You can use global (gbl_), table (tbl_), transaction tracking, or transaction tracking bin metrics with the TTBIN LOOP.
The following example prints the response time bins for each transaction name which had any completed transactions during the interval.
PRINT "--------------------", gbl_stattime, "---------------------"
TT LOOP
IF (tt_count > 0) THEN
{
print "Transaction ", tt_name, " had ", tt_count, " transactions"
lower_bin_limit = 0
TTBIN LOOP
{
IF (ttbin_trans_count > 0) THEN {
print " ", ttbin_trans_count, " were between ",
202 Chapter 10
lower_bin_limit, " and ", ttbin_upper_range, " seconds"
lower_bin_limit = ttbin_upper_range
}
}
}
On a system with four transactions, the printed output for two intervals is:
-------------------------13:46:31--------------------------
Transaction First_Transaction had 4 transactions
2 were between 1.00 and 2.000000 seconds
Transaction Second_Transaction had 1 transactions
1 were between 2.00 and 3.000000 seconds
Transaction Third_Transaction had 1 transactions
1 were between 3.00 and 5.000000 seconds
-------------------------13:46:41--------------------------
Transaction First_Transaction had 3 transactions
1 were between 1.00 and 2.000000 seconds
Transaction Second_Transaction had 1 transactions
1 were between 2.00 and 3.000000 seconds
Transaction Fourth_Transaction had 1 transactions
1 were between 3.00 and 5.000000 seconds
TT LOOP ARM Example
With ARM 2.0, the TT_CLIENT, TT_INSTANCE and TT_UDM loops can be nested within a TT LOOP. The TT_CLIENT loop lists the correlated transactions, the TT_INSTANCE loop lists up to 2048 transaction instances, and the TT_UDM loop lists user measurements for a given transaction. You can use global (gbl_), table (tbl_) or transaction tracking metrics with the TT LOOP.
The examples below show how multiple loops can be used to look at user measurements for any given transaction instance.
Example 1: Look for SLO Violations
# The following example loops through all transactions looking for
# SLO violations, then prints the UDM information for all
# instances:
print "---------------------", GBL_STATTIME, "--------------------"
Adviser for the RTMA Component 203
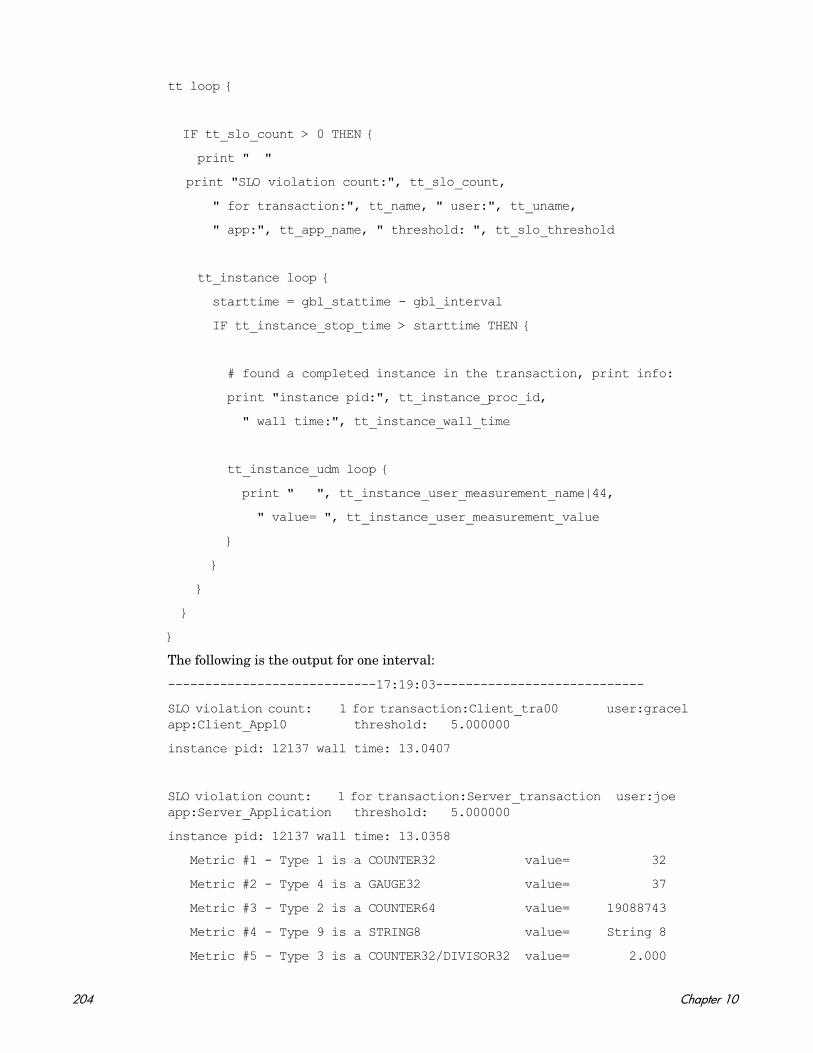
tt loop {
IF tt_slo_count > 0 THEN {
print " "
print "SLO violation count:", tt_slo_count,
" for transaction:", tt_name, " user:", tt_uname,
" app:", tt_app_name, " threshold: ", tt_slo_threshold
tt_instance loop {
starttime = gbl_stattime - gbl_interval
IF tt_instance_stop_time > starttime THEN {
# found a completed instance in the transaction, print info:
print "instance pid:", tt_instance_proc_id,
" wall time:", tt_instance_wall_time
tt_instance_udm loop {
print " ", tt_instance_user_measurement_name|44,
" value= ", tt_instance_user_measurement_value
}
}
}
}
}
The following is the output for one interval:
----------------------------17:19:03----------------------------
SLO violation count: 1 for transaction:Client_tra00 user:gracel app:Client_Appl0 threshold: 5.000000
instance pid: 12137 wall time: 13.0407
SLO violation count: 1 for transaction:Server_transaction user:joe app:Server_Application threshold: 5.000000
instance pid: 12137 wall time: 13.0358
Metric #1 - Type 1 is a COUNTER32 value= 32
Metric #2 - Type 4 is a GAUGE32 value= 37
Metric #3 - Type 2 is a COUNTER64 value= 19088743
Metric #4 - Type 9 is a STRING8 value= String 8
Metric #5 - Type 3 is a COUNTER32/DIVISOR32 value= 2.000
204 Chapter 10
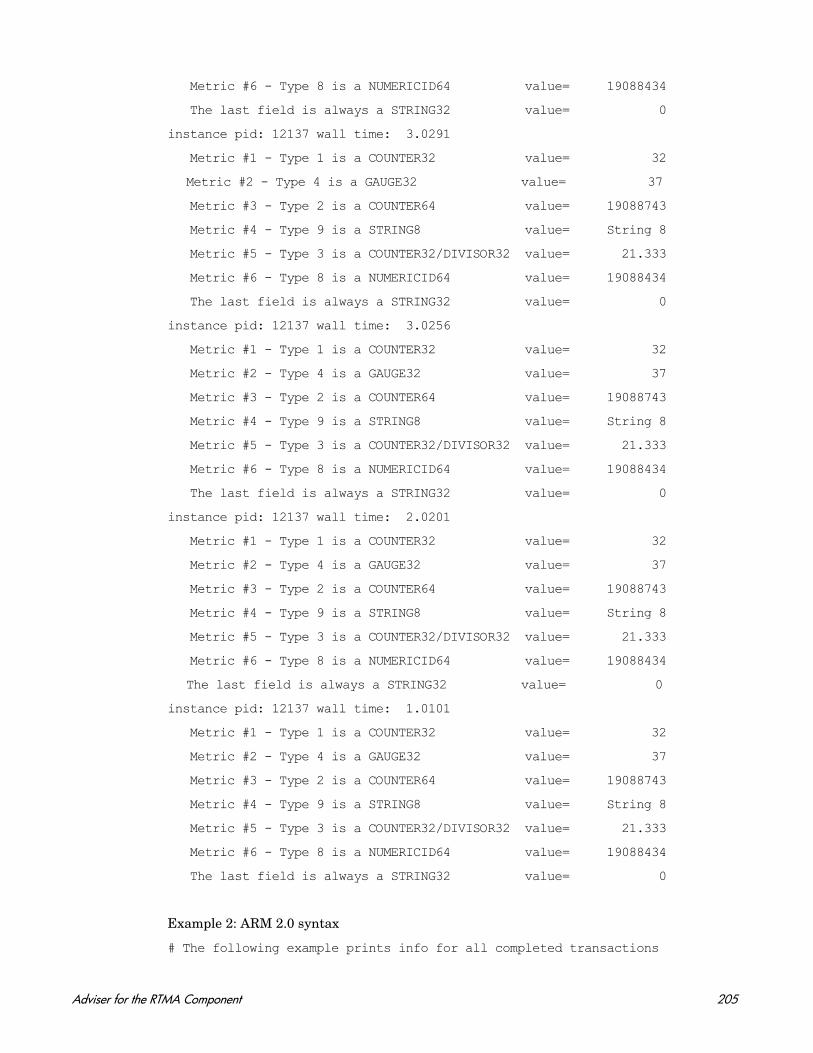
Metric #6 - Type 8 is a NUMERICID64 value= 19088434
The last field is always a STRING32 value= 0
instance pid: 12137 wall time: 3.0291
Metric #1 - Type 1 is a COUNTER32 value= 32
Metric #2 - Type 4 is a GAUGE32 value= 37
Metric #3 - Type 2 is a COUNTER64 value= 19088743
Metric #4 - Type 9 is a STRING8 value= String 8
Metric #5 - Type 3 is a COUNTER32/DIVISOR32 value= 21.333
Metric #6 - Type 8 is a NUMERICID64 value= 19088434
The last field is always a STRING32 value= 0
instance pid: 12137 wall time: 3.0256
Metric #1 - Type 1 is a COUNTER32 value= 32
Metric #2 - Type 4 is a GAUGE32 value= 37
Metric #3 - Type 2 is a COUNTER64 value= 19088743
Metric #4 - Type 9 is a STRING8 value= String 8
Metric #5 - Type 3 is a COUNTER32/DIVISOR32 value= 21.333
Metric #6 - Type 8 is a NUMERICID64 value= 19088434
The last field is always a STRING32 value= 0
instance pid: 12137 wall time: 2.0201
Metric #1 - Type 1 is a COUNTER32 value= 32
Metric #2 - Type 4 is a GAUGE32 value= 37
Metric #3 - Type 2 is a COUNTER64 value= 19088743
Metric #4 - Type 9 is a STRING8 value= String 8
Metric #5 - Type 3 is a COUNTER32/DIVISOR32 value= 21.333
Metric #6 - Type 8 is a NUMERICID64 value= 19088434
The last field is always a STRING32 value= 0
instance pid: 12137 wall time: 1.0101
Metric #1 - Type 1 is a COUNTER32 value= 32
Metric #2 - Type 4 is a GAUGE32 value= 37
Metric #3 - Type 2 is a COUNTER64 value= 19088743
Metric #4 - Type 9 is a STRING8 value= String 8
Metric #5 - Type 3 is a COUNTER32/DIVISOR32 value= 21.333
Metric #6 - Type 8 is a NUMERICID64 value= 19088434
The last field is always a STRING32 value= 0
Example 2: ARM 2.0 syntax
# The following example prints info for all completed transactions
Adviser for the RTMA Component 205
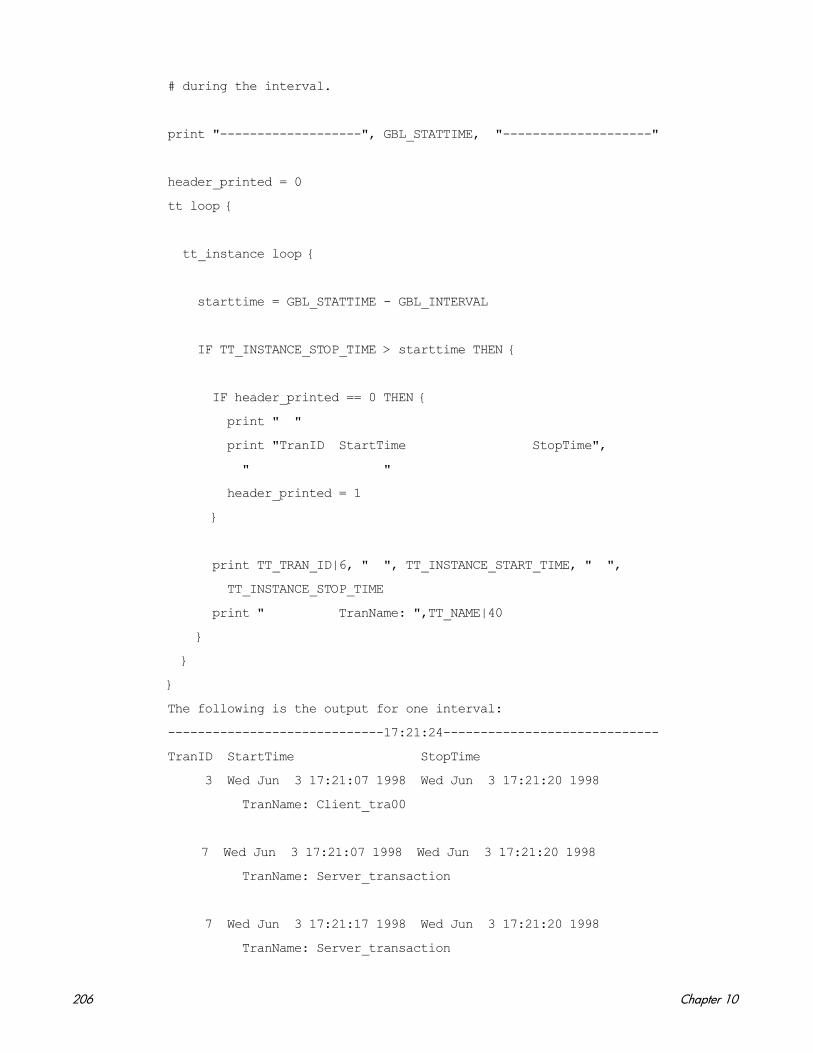
# during the interval.
print "-------------------", GBL_STATTIME, "--------------------"
header_printed = 0
tt loop {
tt_instance loop {
starttime = GBL_STATTIME - GBL_INTERVAL
IF TT_INSTANCE_STOP_TIME > starttime THEN {
IF header_printed == 0 THEN {
print " "
print "TranID StartTime StopTime",
" "
header_printed = 1
}
print TT_TRAN_ID|6, " ", TT_INSTANCE_START_TIME, " ",
TT_INSTANCE_STOP_TIME
print " TranName: ",TT_NAME|40
}
}
}
The following is the output for one interval:
-----------------------------17:21:24-----------------------------
TranID StartTime StopTime
3 Wed Jun 3 17:21:07 1998 Wed Jun 3 17:21:20 1998
TranName: Client_tra00
7 Wed Jun 3 17:21:07 1998 Wed Jun 3 17:21:20 1998
TranName: Server_transaction
7 Wed Jun 3 17:21:17 1998 Wed Jun 3 17:21:20 1998
TranName: Server_transaction
206 Chapter 10

7 Wed Jun 3 17:21:17 1998 Wed Jun 3 17:21:20 1998
TranName: Server_transaction
7 Wed Jun 3 17:21:18 1998 Wed Jun 3 17:21:20 1998
TranName: Server_transaction
7 Wed Jun 3 17:21:19 1998 Wed Jun 3 17:21:20 1998
TranName: Server_transaction
LDOM Loop Example
HP-UX 11iv2 and above only. Use the LDOM Loop statement to cycle through the data on the Locality Domain on your system. You can use global (gbl_), table (tbl_), or ldom (ldom_) metrics with the LDOM LOOP.
This example prints the LDOM memory usage for each Locality Domain on your system:
print " "
PRINT "----------------------", gbl_stattime, "-----------------------"
print "LDOM Phys Num Mem Mem Mem"
print " ID ID Active CPUs Type Avail Free Used %"
PRINT "-----------------------------------------------------"
LDOM LOOP
{
print LDOM_ID, " ", LDOM_PHYS_ID, " ", LDOM_ACTIVE, " ", LDOM_NUM_CPU, " ", LDOM_MEM_TYPE, " ", LDOM_MEM_AVAIL, " ", LDOM_MEM_FREE, " ", LDOM_MEM_UTIL
}
PRINT "-----------------------------------------------------"
On a system with three LDOMs, resulting output for two intervals.
----------------------03:30:27-----------------------
LDOM Phys Num Mem Mem Mem
ID ID Active CPUs Type Avail Free Used %
-----------------------------------------------------
0 0 1 4 LOCAL 0mb 0mb 0.0
1 2 1 4 LOCAL 0mb 0mb 0.0
na na 1 0 GLOBAL 8.0gb 5.5gb 30.5
-----------------------------------------------------
----------------------03:30:32-----------------------
LDOM Phys Num Mem Mem Mem
ID ID Active CPUs Type Avail Free Used %
Adviser for the RTMA Component 207

-----------------------------------------------------
0 0 1 4 LOCAL 0mb 0mb 0.0
1 2 1 4 LOCAL 0mb 0mb 0.0
na na 1 0 GLOBAL 8.0gb 5.5gb 30.5
-----------------------------------------------------
PROC_LDOM LOOP Example
HP-UX 11iv2 and above only. Use the PROC_LDOM loop to loop through the Locality Domains from which the process can obtain memory.
The PROC_LDOM loop must be nested within a PROCESS loop.
The following example displays the scopeux process that can obtain memory from different LDOMs:
print " "
PRINT "------------------------------------", gbl_stattime, "-------------------------------------"
print "Process LDOM LDOM RSS RSS RSS RSS LDOM"
print "Name ID Type Total Shared Private Weighted Mem %"
PRINT "---------------------------------------------------------------------------------"
PROCESS LOOP
{
if PROC_PROC_NAME == "scopeux" then
{
PROC_LDOM LOOP
{
print PROC_PROC_NAME," ",PROC_LDOM_ID," ", PROC_LDOM_TYPE," ", PROC_LDOM_TOTAL," ", PROC_LDOM_SHARED," ", PROC_LDOM_PRIVATE," ", PROC_LDOM_WEIGHTED," ", PROC_LDOM_PCT
}
}
}
PRINT "---------------------------------------------------------------------------------"
Output for two intervals on a system with three LDOMs filtered for the scopeux process:
------------------------------------04:53:50-------------------------------------
208 Chapter 10
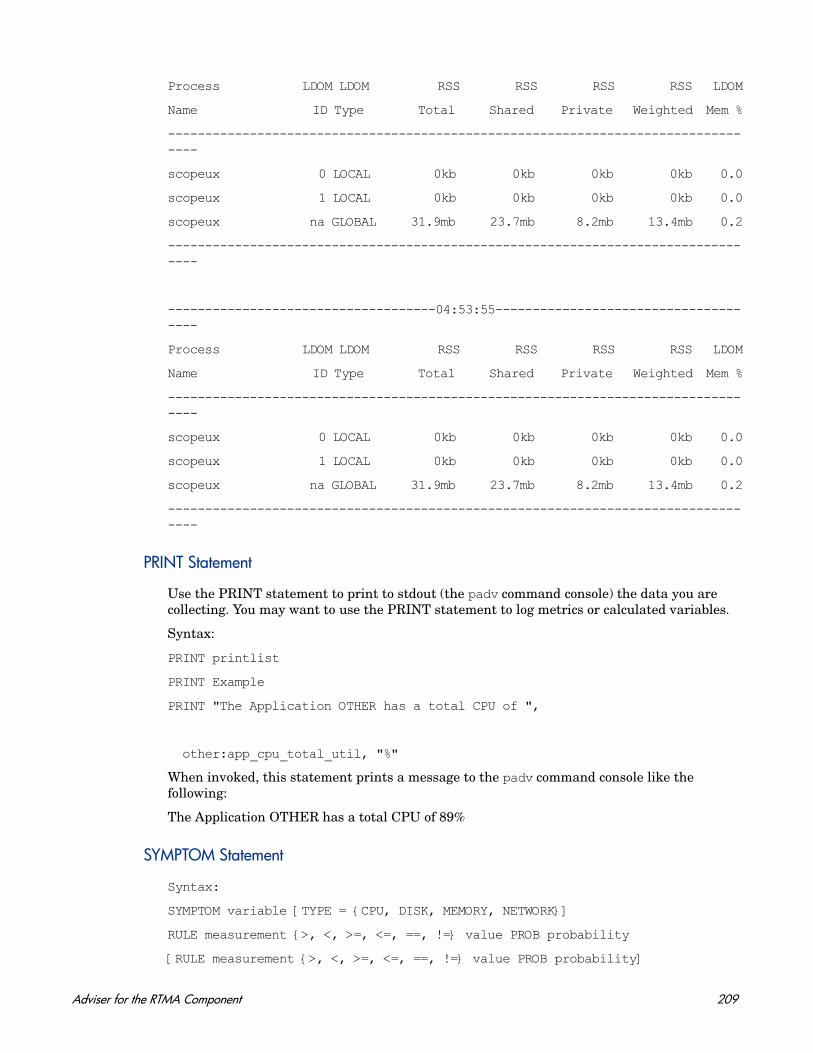
Process LDOM LDOM RSS RSS RSS RSS LDOM
Name ID Type Total Shared Private Weighted Mem %
---------------------------------------------------------------------------------
scopeux 0 LOCAL 0kb 0kb 0kb 0kb 0.0
scopeux 1 LOCAL 0kb 0kb 0kb 0kb 0.0
scopeux na GLOBAL 31.9mb 23.7mb 8.2mb 13.4mb 0.2
---------------------------------------------------------------------------------
------------------------------------04:53:55-------------------------------------
Process LDOM LDOM RSS RSS RSS RSS LDOM
Name ID Type Total Shared Private Weighted Mem %
---------------------------------------------------------------------------------
scopeux 0 LOCAL 0kb 0kb 0kb 0kb 0.0
scopeux 1 LOCAL 0kb 0kb 0kb 0kb 0.0
scopeux na GLOBAL 31.9mb 23.7mb 8.2mb 13.4mb 0.2
---------------------------------------------------------------------------------
PRINT Statement
Use the PRINT statement to print to stdout (the padv command console) the data you are collecting. You may want to use the PRINT statement to log metrics or calculated variables.
Syntax:
PRINT printlist
PRINT Example
PRINT "The Application OTHER has a total CPU of ",
other:app_cpu_total_util, "%"
When invoked, this statement prints a message to the padv command console like the following:
The Application OTHER has a total CPU of 89%
SYMPTOM Statement
Syntax:
SYMPTOM variable [TYPE = {CPU, DISK, MEMORY, NETWORK}]
RULE measurement {>, <, >=, <=, ==, !=} value PROB probability
[RULE measurement {>, <, >=, <=, ==, !=} value PROB probability]
Adviser for the RTMA Component 209

.
.
.
The keywords SYMPTOM and RULE are exclusive for the SYMPTOM statement and cannot be used in other syntax statements. The SYMPTOM statement must be a top-level statement and cannot be nested within any other statement.
variable is a variable name that will be the name of this symptom. Variable names defined in the SYMPTOM statement can be used in other syntax statements, but the variable value should not be changed in those statements.
RULE is an option of the SYMPTOM statement and cannot be used independently. You can use as many RULE options within the SYMPTOM statement as you need.
The SYMPTOM variable is evaluated according to the RULEs at each interval.
• Measurement is the name of a variable or metric that is evaluated as part of the RULE
• Value is a constant, variable, or metric that is compared to the measurement
• Probability is a numeric constant, variable, or metric
The probabilities for all true SYMPTOM RULEs are added together to create a SYMPTOM value. The SYMPTOM value then appears in the message in the padv command console.
The sum of all probabilities where the condition between measurement and value is true is the probability that the symptom is occurring.
SYMPTOM Example
Syntax:
SYMPTOM CPU_Bottleneck TYPE=CPU
RULE gbl_cpu_total_util > 50 PROB 25
RULE gbl_cpu_total_util > 85 PROB 25
RULE gbl_cpu_total_util > 90 PROB 25
RULE gbl_run_queue > 3 PROB 50
SYMPTOM CPU_Level TYPE=CPU
RULE gbl_cpu_sys_mode_util > 40 PROB 25
RULE gbl_cpu_sys_mode_util > 50 PROB 25
RULE gbl_cpu_sys_mode_util > 60 PROB 25
RULE gbl_cpu_sys_mode_util > 70 PROB 50
Whichever CPU symptom defined above has the highest total probability (PROB), is the symptom that determines the severity level of the message in the padv command console.
SYMPTOM Example: Global CPU Bottleneck
SYMPTOM Symp_Global_Cpu_Bottleneck TYPE=CPU
RULE gbl_cpu_total_util > 50 PROB 25
RULE gbl_cpu_total_util > 85 PROB 25
RULE gbl_cpu_total_util > 90 PROB 25
210 Chapter 10

RULE gbl_run_queue > 3 PROB 75
For example, if the CPU utilization (gbl_cpu_total_util) for the interval was 93% and the run queue was 2, then the first three rules would all be true so that 25 would be added to the probability three times. Since the fourth rule would not be true, 75 would not be added. Thus the Symp_Global_Cpu_Bottleneck variable would have a value of 75 (percent) that interval.
Adviser for the RTMA Component 211

212 Chapter 10
11 Using the Performance Collection Component on Windows
To access the Performance Collection Component graphical user interface click the HP Operations Agent Software icon in the following folder:
Start→Programs→HP→Operations Agent→ Performance Collection Component
Figure 2 Performance Collection Component Main Window
This chapter describes the following tasks that you perform using the Performance Collection Component graphical interface:
• Data Types and Classes
• Summarization Levels
• Ranges of Data to Extract or Export
• Extracting Log File Data and Exporting Log File Data
• Archiving Log File Data
• Resizing a Log File
213
• Scanning a Log File for information
• Analyzing a Log File
• Configuring Export Templates
• Configuring User Options
• Configuring Collection Parameters
• Configuring Alarm Definitions
• Checking Performance Collection Component Status
• Building Collections of Performance Counters
Before you start using Performance Collection Component for tasks that involve extracting, exporting, or archiving data, read the following sections. These sections discuss the selection of data types, summarization levels, and ranges of the data to be extracted, exported, or archived.
Data Types and Classes
The following types of scopent log file data can be selected for extraction or exporting:
Type of Data Type of Measurement
global system-wide, or global information
application processes in each user-defined application
configuration system configuration usage
process selected interesting processes
disk disk devices usage
filesystem logical disks usage
logicalsystem logical system usage
cpu CPU usage
netif network interface devices usage
transaction transaction tracking data
214 Chapter 11

DSI log file data can be selected for exporting according to class. Each class represents one source of incoming data and consists of a group of related data items (metrics) that are logged together.
Summarization Levels
To export data, you must specify the level of summarization you want – detail, summary, or both – when exporting log file data.
• Detail specifies that detail data from a 5-minute period is exported from all data types except process, from which detail data from a 1-minute period is exported.
• Summary specifies that data summarized over a 1-hour period is exported.
• Detail and summary together provide a maximum amount of exported data.
Summarization affects the size of the exported data. For example, hourly summary data is about one-tenth the size of 5-minute detail data.
Ranges of Data to Extract or Export
You can select specific data to extract or export depending on the date and time it was logged. For example, you might want data that was logged every day (Monday through Sunday) from 8:00 am to 8:00 pm during a 30-day period starting at a specific date.
If you do not specify a specific range of data to be exported, data is extracted or exported using the default starting date – the date 30 days before the last date in the log file. Or, if less than 30 days of data is present, the date of the earliest record in the log file.
You can also limit extraction or export to data that was logged during specific hours of the day that correspond to work shifts (such as 8:00 am to 5:00 pm) from Monday through Friday. If no shift is specified, the default is extraction or export of 24-hours’ worth of data for every day including weekends.
Using the Performance Collection Component on Windows 215

Extracting Log File Data
The data collector, scopent, continuously collects data and logs it into raw log files. You can extract specific data from the default global log file set, logglob, into extracted log files that can later be used for archiving or for analyzing by analysis programs such as HP Performance Manager. You can also extract data from existing extracted log files. You cannot extract DSI log file data.
When you specify logglob, all other raw log files in the log file set automatically open. For example, it is not necessary to open the logproc log file to extract process data; opening logglob enables you to access all data types in the raw log file set.
Figure 3 Extract Log File Data Dialog Box
216 Chapter 11

To Extract Log File Data
To extract log file data, perform the following steps:
1 Click Extract from the Logfile menu on the main window. The Extract Log File Data dialog box appears, showing the names of the currently active log file and the currently selected output file. You can easily specify a different log file and output file.
2 After selecting the type of data to be extracted, select the range of log file data to be extracted and shifts to include. Click the Extract Data button to start the extract process.
For step-by-step instructions for extracting log file data, choose Help Topics from the Help menu, select "How Do I…?," and then select "Extract log file data."
Exporting Log File Data
You can export specific data from raw or extracted scopent log files or from DSI log files into formatted export files that can be used by spreadsheets and other reporting tools.
The export function does not remove any data from the log file.
The following sections discuss:
• File attributes that you can specify for the exported data
• Export templates you can use to simplify the export task.
• Default export file
• Overview of the export task
When you display the Extract Log File Data or Export Log File Data dialog boxes after starting Performance Collection Component, the name of the default global log file, logglob, appears in the Log File box to indicate the currently active log file. Logglob remains active until you close Performance Collection Component or select a different log file. When you select a different log file, that file's name appears in the Log File box as the currently active log file.
Using the Performance Collection Component on Windows 217
Figure 4 Export Log File Data Dialog Box
File Attributes
You can assign various file attributes to your exported data, including file formats, values that represent missing data, field separators, column headings, number of minutes for summary intervals, layout, data types, and specific metrics to be included in the export file. These attributes can be saved in export template files or specified directly using the Make Quick Template dialog box. (For more information, see Making a Quick Export Template on page 224.)
218 Chapter 11

File Format
The output format for an exported file can be ASCII, datafile, binary, or WK1 (spreadsheet):
• ASCII format is printable character data, suitable for printed reports or post-processing by user-written programs or batch files.
• Datafile format is similar to ASCII except that all non-numeric items are enclosed in double quotes (" "). Datafile format is useful for transferring data to most spreadsheets and graphic packages.
• Binary format is not printable. It is more compact because numeric values are represented as binary integers. It is the most suitable format for input into user-written analysis programs because it needs the least conversion and maintains the highest metric accuracy.
• WK1 (spreadsheet) format is compatible with Microsoft Excel, and other spreadsheet, database, and graphing products.
Missing Value
An exported file can contain the data value that replaces data missing from the source log file. Missing data can occur when a metric is not available for certain versions of the scopent collector. In addition, the multiple layout export formats for applications, disks, and transactions reserve space in the output record for every application, disk, or transaction. If no data was logged for a particular entry during an interval, its data will be “missing”.
Field Separators
A field separator character can be inserted between each metric in ASCII and datafile format exported files. Separator characters can be printable or non-printable (such as a tab character).
The default separator character is a blank space, but many programs require a comma as a field separator.
Summary Minutes
The number of minutes for each summary interval can be specified. The number of minutes can range from five to 1440 minutes (one day).
Using the Performance Collection Component on Windows 219

Headings
Column headings can be included in exported files. The first record in the file is exported data (except in WK1 format files). However, if you include headings in the file, ASCII and datafile format files have the export file title (if specified) plus column headings for each column of metrics written before the first data records in the file. Headings in binary format files are written before the first record in the file and contain descriptions of the metrics.
WK1 files always contain headings.
Multiple Layout
You can specify multiple layouts (per record output) for multi-instance data types such as application or disk.
Single layout writes one record for every application or disk that was active during the time interval. Multiple layout writes one record for each time interval, with part of that record reserved for each configured application or disk.
Export File Title
You can specify the title for an export file. The title can contain literal strings as well as substitution keywords. The following items can be substituted in the export title string:
!date the date the export file is created
!time the time of day the export file is created
!logfile the name of the log file from which data is obtained
!collector the name and version of the collector program (either scopent or dsilog)
!class the type of data requested
!system_id the identifier of the system that collects the scopent raw or extracted log file data (not valid with DSI log file data)
220 Chapter 11

For example, you could type the following string:
export “!system_id data from !logfile on !date !time”
The string would generate a title similar to the following:
gemini data from logglob on 10/25/99 08:30 AM
Export File Templates
The export task uses export templates that define the file attributes for your exported file. The default file attributes are taken from the file <rpmtools>\data\reptfile.mwr that specifies:
• ASCII file format
• A 0 (zero) for the missing value
• A blank space as the field separator
• 60-minute summaries
• Headings are included
• A recommended set of metrics for a given data type or class is included in the export
You can either specify a different export template file or make ad hoc file attribute specifications (see Making a Quick Export Template on page 224).
You can also create customized export templates using the Configure Export Templates dialog box (see Configuring Export Templates on page 226 ).
Default Export Files
If you do not specify an output file to contain your exported data, the export task creates a default output file in your <disk drive>:\Program Files\HP\HP BTO Software\data\datafiles directory based on the data type and level of summarization you specified.
scopent Data
When you export scopent log file data, the following default file names are assigned to the exported files.
Using the Performance Collection Component on Windows 221

When the export task completes, you can view the contents of the output export file by clicking the Examine Data button in the Export Log File Data dialog box.
The default file names are created from the data type name. The prefix is either xfrd or xfrs depending on whether the data is detail or summary data. The extension (.ext) is the file format specified in the export template file: asc (ASCII), bin (binary), dat (datafile), or wk1 (spreadsheet).
For example:
xfrdNETIF.wk1 contains detailed data for the NETIF data type in spreadsheet format.
xfrdGLOBAL.ext global detail data
xfrsGLOBAL.ext global summary data
xfrdAPPLICATION.ext application detail data
xfrsAPPLICATION.ext application summary data
xfrdPROCESS.ext process detail data
xfrdDISK.ext disk device detail data
xfrsDISK.ext disk device summary data
xfrdCPU.ext CPU detail data
xfrsCPU.ext CPU summary data
xfrdFILESYSTEM.ext filesystem detail data
xfrsFILESYSTEM.ext filesystem summary data
xfrdNETIF.ext netif detail data
xfrsNETIF.ext netif summary data
xfrdTRANSACTION.ext transaction tracking detail data
xfrsTRANSACTION.ext transaction tracking summary data
xfrdCONFIGURATION.ext configuration detail data
xfrdLOGICAL.ext logical system detail data file
xfrsLOGICAL.ext logical system summary data file
222 Chapter 11
xfrsAPPLICATION.asc contains summarized data for the application data type in ASCII format.
DSI Data
When you export DSI log file data, the default file names are created from the class name. The prefix is either xfrd or xfrs, depending on whether the data is detail or summary data. The extension is the file format specified in the export template file: asc (ASCII), dat (datafile), or wk1 (spreadsheet).
For example:
xfrdACCTG.wk1 contains detailed data for the ACCTG class in spreadsheet format.
xfrsPERSONL.asc contains summarized data for the PERSONL class in ASCII format.
To Export Log File Data
To export log file data, perform the following steps:
1 Click Export from the Logfile menu on the main window. The Export Log File Data dialog box appears, showing the names of the currently active log file and the currently selected export template file. You can specify a different log file and export template file.
If you specify an output file, data from all selected data types or classes are placed in the same file. If you do not specify an output file, a default output file is created based on the data type or class and summarization level you specify. (See Default Export Files on page 221.)
2 After selecting the one or more types or class of data to be exported, select the range of log file data to be exported and shifts to include.
3 To override the file attributes specified in your default export template, or to select specific metrics to be included in your export file, click the Make Quick Template button.
4 After you complete the steps for making a quick template or select specific metrics for your export file, return to the Export Log File Data dialog box. Click the Export Data button to start the export process.
5 When the export finishes, you can view the contents of your export file by clicking the Examine Data button.
Using the Performance Collection Component on Windows 223

For step-by-step instructions for exporting log file data, choose Help Topics from the Help menu, select "How Do I…?," and then select "Export log file data."
Making a Quick Export Template
Use the Make Quick Template function in the Export Log File Data dialog box to select specific metrics to be included in your export file and to change any of the file attributes and metrics that are specified in the export template you selected for your export.
Figure 5 Make Quick Template Dialog Box
224 Chapter 11

To make a quick template, follow these steps:
1 Click the Make Quick Template button in the Export Log File Data dialog box. The Make Quick Template dialog box appears, showing the title of the export file selected for the export.
2 The boxes below Output File Attributes show the current settings for the export file, based on the file attributes set in the export template selected for the export. You can modify any of these settings.
3 To use a different export template file, click the Open button.
4 You also have the option of clearing all existing settings from the Make Quick Template dialog box and creating a totally new export template file by clicking the New button.
Selecting Metrics to Export
• After selecting the data type or class of the metrics to be exported, you can select the specific metrics that you want included in the export. Each data type or class has its own set of metrics that are listed under Available Metrics. The metrics listed under "Metrics to be exported" are the metrics specified by the current export template to include in the export. You can either use that list, remove metrics from the list, or select other available metrics to include in the export.
• If you select the application, disk, cpu, filesystem, netif, or transaction data types, select the Multiple Layout check box to generate multiple layouts (per record output), or leave it cleared to generate single layout.
Saving Your Selections
After making your selections, you can either:
• Proceed with the export using the selections you made to the file attributes and to the list of metrics to be exported but WITHOUT saving the changes to any template file.
Using the Performance Collection Component on Windows 225

• Save your selections to a new export template file that will be available for use in future exports. The original export template file remains unchanged.
For step-by-step instructions for making a quick export template, choose Help Topics from the Help menu, select "How Do I…?," and then select "Make a quick export template."
Configuring Export Templates
Use the Export Templates command from the Configure menu to customize an existing export template file or create a new export template file. Use the Configure Export Template dialog box to select new file attributes and specific metrics to be included in the template.
If you save your selections to a new export template file, you must include the .mwr file name extension when you specify the new template file name. For example, mytmplte.mwr
226 Chapter 11
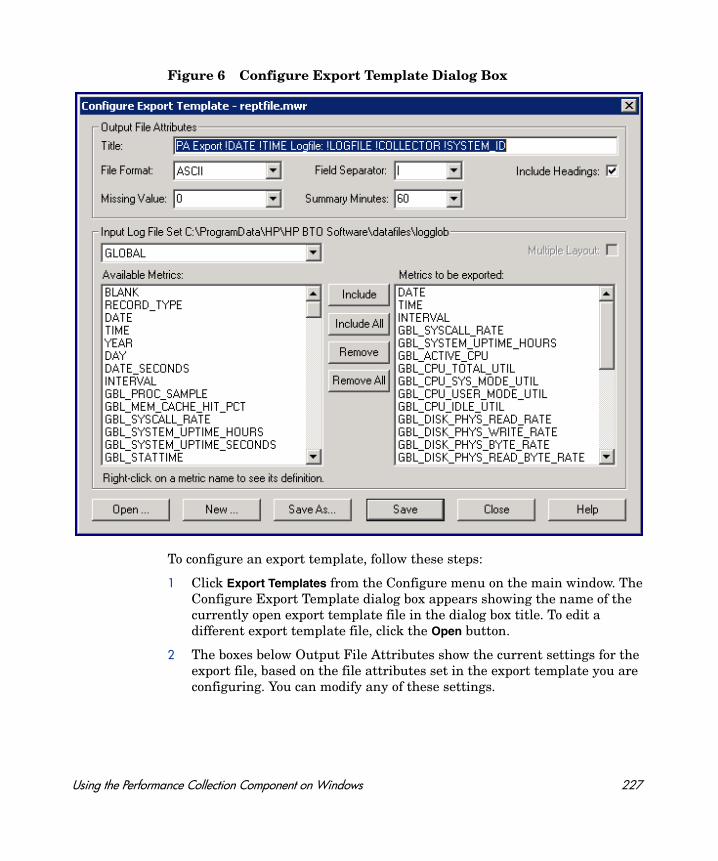
Figure 6 Configure Export Template Dialog Box
To configure an export template, follow these steps:
1 Click Export Templates from the Configure menu on the main window. The Configure Export Template dialog box appears showing the name of the currently open export template file in the dialog box title. To edit a different export template file, click the Open button.
2 The boxes below Output File Attributes show the current settings for the export file, based on the file attributes set in the export template you are configuring. You can modify any of these settings.
Using the Performance Collection Component on Windows 227

3 You can also clear all existing settings from the Configure Export Template dialog box and create a totally new export template file by clicking the New button.
Selecting Metrics for Export
• After selecting the data type or class of the metrics to be exported, you can select the specific metrics that you want included in the export. Each data type or class has its own set of metrics that are listed under Available Metrics. The metrics listed under "Metrics to be exported" are the metrics specified by the current export template to include in the export. You can use that list, remove metrics from the list, or select other available metrics to include in the export.
• If you select the application, disk, cpu, filesystem, netif, or transaction data types, select the Multiple Layout check box to generate multiple layouts (per record output), or leave it cleared to generate single layout.
Saving Your Selections
You have three choices for saving the template you edited:
• Save the changes to the current template file.
• Save the changes to a new template file, in which case the original template file remains unchanged.
• Cancel the changes to avoid making changes to any template file.
For step-by-step instructions for configuring an export template file, choose Help Topics from the Help menu, select "How Do I…?," and then select "Configure an export template file."
If you save your selections to a new export template file, you must include the .mwr file name extension when you specify the new file name.If you click the Close button after you make changes to the template file but before you saved them, you are prompted to either cancel or save your changes. Clicking the Cancel button returns you to the Configure Export Template dialog box.
228 Chapter 11

Archiving Log File Data
Use the Archive command from the Logfile menu to extract selected portions of scopent log file data for archiving and future data analysis.
For archival purposes, data can only be extracted from the raw log files. The extracted data is automatically placed in an archival output file in the <disk drive>:Program Files\HP\HP BTO Software\data\datafiles directory whose name reflects the selected archival period. These files can be copied to tape for offline storage and then deleted to release disk space.
Figure 7 Archive Log File Data Dialog Box
Archival Periods
You can select data to be extracted based on data logged during a specific weekly, monthly, or yearly period.
Using the Performance Collection Component on Windows 229
You can also limit extraction to data that was logged during specific hours of the day that correspond to work shifts and include or exclude weekends (Saturday and Sunday). If no shift is specified, the default is extraction of 24-hours’ worth of data for every day. By default, weekends are included.
Appending Archived Data
The archiving function has a special feature. Depending on which archival period you select – weekly, monthly, or yearly – the previous output file for that archival period is automatically checked to see if it contains data extracted up to the last day. If not, the data is appended to the file to complete the previous archival period’s extraction.
For example, on May 7, 1999, you begin archiving monthly data for May 1999. An output file named rxmo199905.mwe is created containing data from May 1 through the current date (May 7).
On June 4, 1999, another monthly archival period is invoked. Before the rxmo199906.mwe file is created for June, the rxmo199905.mwe file from the previous month is checked. When it is found to be incomplete, data is appended to it to complete the extraction through May 31, 1999. Then, the rxmo199906.mwe file is created to hold data from June 1, 1999, to the current date (June 4).
As long as another monthly (weekly, yearly) archival period is invoked at least once a month (week, year), this feature will complete each archival period’s file before creating the next archival period’s file.
Archiving Tips
Here are some suggestions for archiving your log file data:
• Once a month, specify the monthly archival period and extract all the detail data from your raw log files into a single extracted log file.
• If your system generates more than 64 MB of data each month, you may need to extract data on a weekly basis, or you can eliminate process detail data from the extraction.
• Extract global summary and application summary data on a yearly basis, which should minimize the disk space required. This archive file can then be used for long-term analysis of trends.
230 Chapter 11
To archive log file data, follow these steps:
1 Click Archive from the Logfile menu on the main window. The Archive Log File Data dialog box appears. The data to be archived is extracted from the raw log file set.
2 After selecting the type of data to be archived from the Available Data Types list, specify the archival period – Week, Month, or Year, and any shifts to include.
3 Click the Archive button to start the archiving process.
For step-by-step instructions for archiving log file data, choose Help Topics from the Help menu, select "How Do I…?," and then select "Archive log file data."
Analyzing a Log File
Use the Analyze Log File command from the Logfile menu to analyze data in the raw log file set against alarm definitions in an alarm definitions file, and report on any resulting alarm activity.
This task enables you to evaluate whether or not your alarm definitions are a good match against the historical data collected on your system. It also enables you to decide if your alarm definitions will generate too many or too few alarms on your analysis system.
The raw log files being analyzed are referenced in Performance Collection Component’s default data source, SCOPE. To analyze a different log file, place a USE statement in your alarm definitions file that specifies the name of the data source that references that log file.
Using the Performance Collection Component on Windows 231
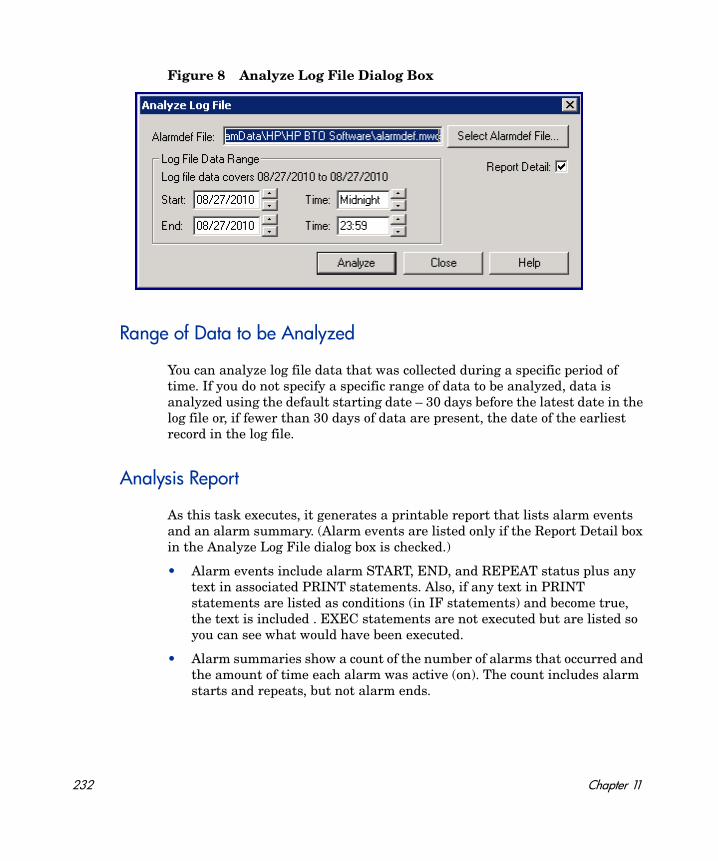
Figure 8 Analyze Log File Dialog Box
Range of Data to be Analyzed
You can analyze log file data that was collected during a specific period of time. If you do not specify a specific range of data to be analyzed, data is analyzed using the default starting date – 30 days before the latest date in the log file or, if fewer than 30 days of data are present, the date of the earliest record in the log file.
Analysis Report
As this task executes, it generates a printable report that lists alarm events and an alarm summary. (Alarm events are listed only if the Report Detail box in the Analyze Log File dialog box is checked.)
• Alarm events include alarm START, END, and REPEAT status plus any text in associated PRINT statements. Also, if any text in PRINT statements are listed as conditions (in IF statements) and become true, the text is included . EXEC statements are not executed but are listed so you can see what would have been executed.
• Alarm summaries show a count of the number of alarms that occurred and the amount of time each alarm was active (on). The count includes alarm starts and repeats, but not alarm ends.
232 Chapter 11
To analyze a log file, follow these steps:
1 Click Analyze from the Logfile menu in the main window. The Analyze Log File dialog box appears showing the name of the currently selected alarm definitions file.
2 To use a different alarm definitions file, click the Select Alarmdef File button.
3 Select the range of log file data to be analyzed.
4 Check the Report Detail box if you want to include alarm events in the analysis report. Otherwise, only the alarm summary is generated.
5 Click the Analyze button to start the analysis. The analysis results are displayed in a MeasureWare Agent Report Viewer window.
For step-by-step instructions for analyzing a log file, choose Help Topics from the Help menu, select "How Do I…?," and then select "Analyze a log file."
Scanning a Log File
Use the Scan Log File command from the Logfile menu to scan a scopent log file and create a report on its contents. You can either scan an entire log file or scan portions of a log file for data that was collected during a specific period of time.
The report produced by the scan consists of 12 sections. The following four sections of the report are always printed.
• Process summary report
• Collector coverage summary
• Log file contents summary
• Log file empty space summary
The following eight sections of the report are printed only if you select Report Detail in the Scan Log File dialog box.
• Initial parm file global information and system configuration information
• Initial parm file application definitions
• parm file global changes
Using the Performance Collection Component on Windows 233

• parm file application/change notifications
• Collector off-time notifications
• Application-specific summary reports
Figure 9 Scan Log File Dialog Box
To scan a log file, follow these steps:
1 Click Scan Log File from the Logfile menu on the main window. The Scan Log File dialog box appears with the name of the currently open log file highlighted.
2 To scan a different log file, click the Select Log File button.
3 To scan data that was logged during a specific time period, under Log File Data Range, select or type the dates and times for the beginning and end of that time period.
4 Check the Report Detail box if you want a complete scan report. Otherwise, only a subset of the report is generated.
5 To start the scan process, click the Scan button. The scan results are shown in a Performance Collection Component Report Viewer window.
For step-by-step instructions for scanning a log file, choose Help Topics from the Help menu, select "How Do I…?," and then select "Scan a log file."
234 Chapter 11

Resizing a Log File
Use the Resize Log File command from the Logfile menu to change the size of your raw scopent log files. You can resize using either the size in megabytes for the given file or the number of days of data the file should hold.
The maximum size of a raw log file is specified in the size parameter in the parm file. Resizing the log file gives you more control over how often the log file data is rolled back.
You can select any of the following types of data to resize: global, application, process, device, or transaction, which correspond to the raw log files logglob, logappl, logproc, logdev, and logtran. You then choose how the resize will be performed – in megabytes or by number of days. Depending on which type of resize you choose, the Log File Settings box in the Resize Log File dialog box shows the following:
• The Maximum Size fields show current file size, the new file size, and the change made by the resize.
• The Empty Space fields show the amount of room in the current file, the amount required in the file after the resizing process is complete, and the change. These values are used to determine if any of the data currently in the log file must be removed in the resizing process.
• The Data Records fields show the amount of data records contained in the current log file and the new amount of data records that will be in the resized log file.
Log file sizes are maintained in megabytes. Often it is more convenient to specify sizes in days rather than megabytes. If you select "Size in Days", all units on the dialog box will change to "days". The conversion from megabytes to days is based on a "megabytes-per-day" value for each type of data. Initially, estimated values are used for this conversion.
A more precise value can be obtained by clicking the Calibrate button. The calibrate function actually measures the existing log files for more precise megabytes-per-day values. If you are specifying size in megabytes, no conversion is needed and the calibrate function need not be used.
Using the Performance Collection Component on Windows 235
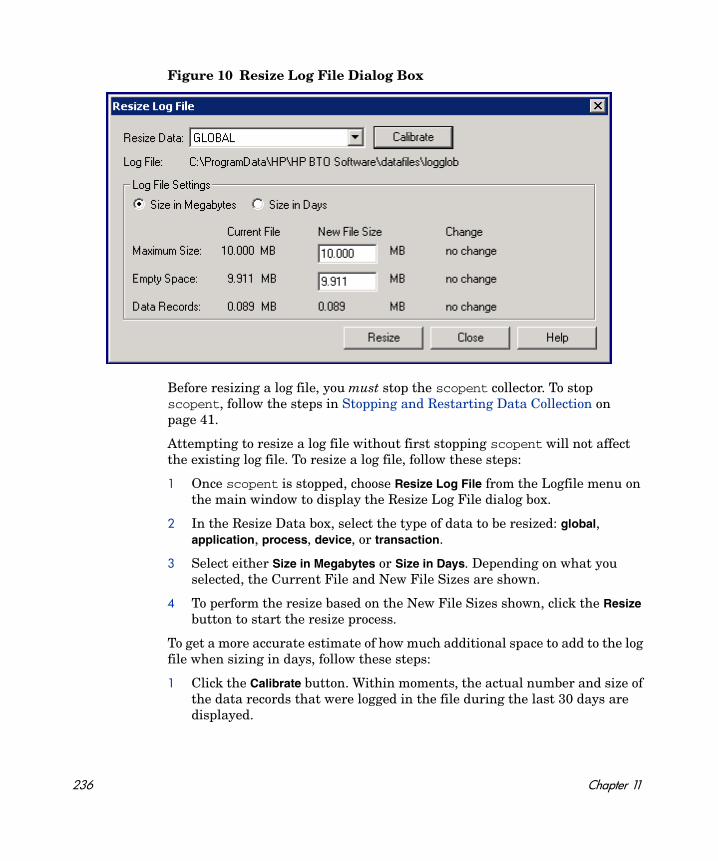
Figure 10 Resize Log File Dialog Box
Before resizing a log file, you must stop the scopent collector. To stop scopent, follow the steps in Stopping and Restarting Data Collection on page 41.
Attempting to resize a log file without first stopping scopent will not affect the existing log file. To resize a log file, follow these steps:
1 Once scopent is stopped, choose Resize Log File from the Logfile menu on the main window to display the Resize Log File dialog box.
2 In the Resize Data box, select the type of data to be resized: global, application, process, device, or transaction.
3 Select either Size in Megabytes or Size in Days. Depending on what you selected, the Current File and New File Sizes are shown.
4 To perform the resize based on the New File Sizes shown, click the Resize button to start the resize process.
To get a more accurate estimate of how much additional space to add to the log file when sizing in days, follow these steps:
1 Click the Calibrate button. Within moments, the actual number and size of the data records that were logged in the file during the last 30 days are displayed.
236 Chapter 11
2 Click the Close button to return to the Resize Log File dialog box. New Current File and New File Size values based on the calibration are shown, if sizing in days.
3 Click the Resize button to resize the log file.
4 Before performing another task, start scopent using the steps in Stopping and Restarting Data Collection on page 41.
For step-by-step instructions for resizing a log file, choose Help Topics from the Help menu, select "How Do I…?," and then select "Resize a log file."
Configuring User Options
Use the Options command from the Configure menu to control the display of the toolbar, status bar, dialog help tips, and Tip of the Day on your main window and while you are using Performance Collection Component.
You can also use the Options command to configure an editor or word processor for modifying the collection parameters and alarm definitions files and to select the type of status information you want to view when you choose the Status command from the Agent menu.
Using the Performance Collection Component on Windows 237
Figure 11 Configure Options Dialog Box
To configure user options, follow these steps:
1 Click the Options command from the Configure menu in the main window to display the Configure Options dialog box.
2 Select the Display Toolbar check box to display the toolbar in the main window.
3 Select the Display Status Bar check box to display current status at the bottom of each dialog box and in the main window.
4 Select the Display Dialog Help Tips check box to display help tips within dialog boxes.
5 Select the Display Tip of the Day check box to display the current day's tip when you open the Performance Collection Component main window.
238 Chapter 11

To configure, follow these steps:
1 Type the editor's directory path and file name in the Editor Command box, using the .exe file name extension (for example, C:\MSOffice\winword\winword.exe).
2 Click the Browse button to display the Select a Text Editor dialog box from which you can select your editor.
3 Click the Test button to make sure that the editor you selected is configured and then click OK.
To configure which agent status information you want to view, select one or more of the option boxes shown under Agent Status Contents, and then click OK.
For step-by-step instructions for configuring user options, choose Help Topics from the Help menu, select "How Do I…?," and then select "Configure user options."
Configuring Collection Parameters
Use the Collection Parameters command from the Configure menu to check the syntax of the parm file that is used by scopent for data collection. You can examine the parm file’s settings for syntax errors and warnings and to see how much room is available for defining applications.
If any warnings or errors are found and you want to correct them, or if you want to change or add parm file parameters, you can easily modify the parm file using the Edit Parm File function.
A detailed description of the parm file and its parameters can be found in Managing Data Collection on page 19.
Using the Performance Collection Component on Windows 239
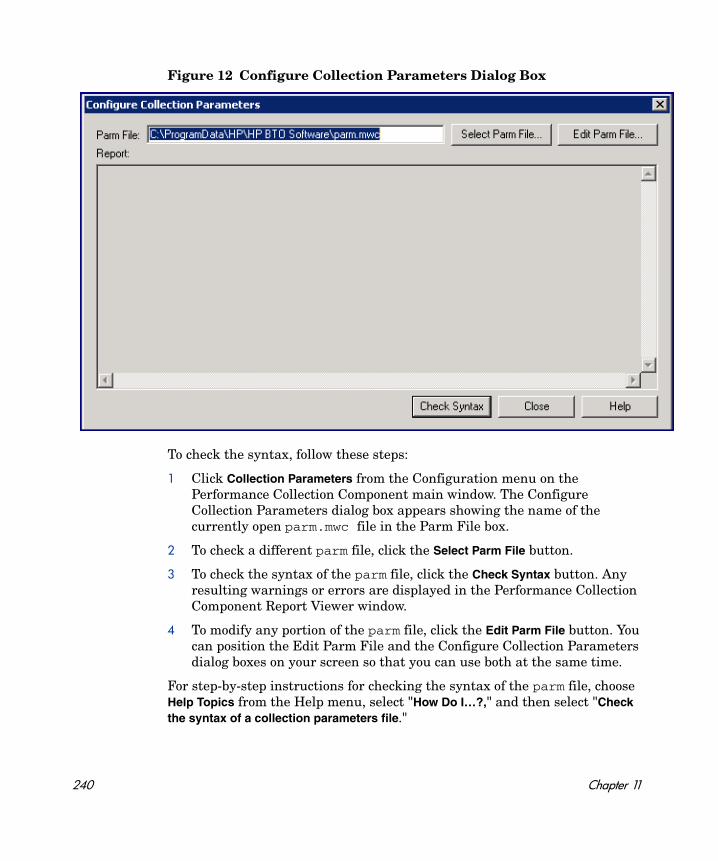
Figure 12 Configure Collection Parameters Dialog Box
To check the syntax, follow these steps:
1 Click Collection Parameters from the Configuration menu on the Performance Collection Component main window. The Configure Collection Parameters dialog box appears showing the name of the currently open parm.mwc file in the Parm File box.
2 To check a different parm file, click the Select Parm File button.
3 To check the syntax of the parm file, click the Check Syntax button. Any resulting warnings or errors are displayed in the Performance Collection Component Report Viewer window.
4 To modify any portion of the parm file, click the Edit Parm File button. You can position the Edit Parm File and the Configure Collection Parameters dialog boxes on your screen so that you can use both at the same time.
For step-by-step instructions for checking the syntax of the parm file, choose Help Topics from the Help menu, select "How Do I…?," and then select "Check the syntax of a collection parameters file."
240 Chapter 11
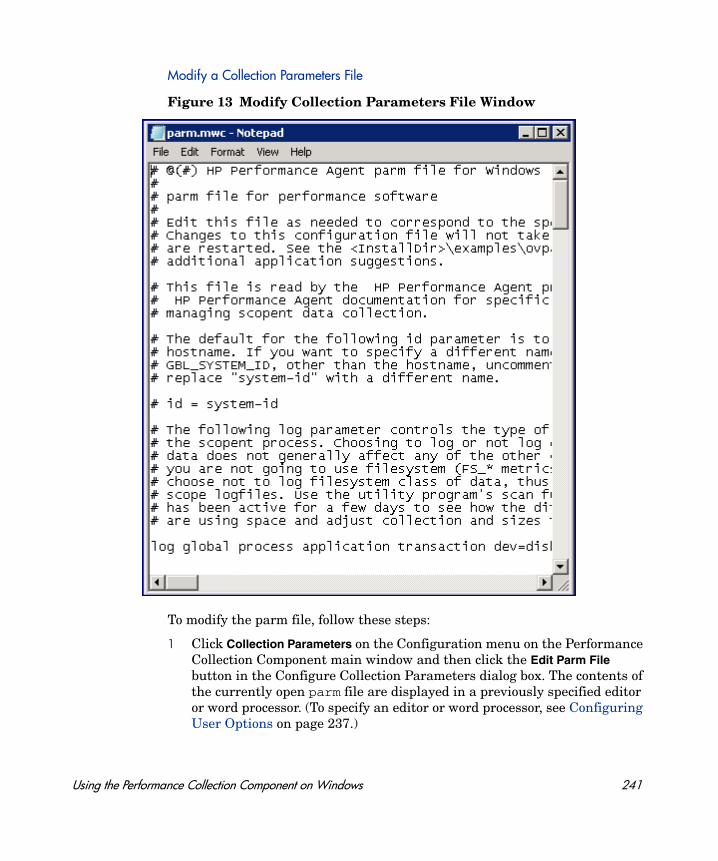
Modify a Collection Parameters File
Figure 13 Modify Collection Parameters File Window
To modify the parm file, follow these steps:
1 Click Collection Parameters on the Configuration menu on the Performance Collection Component main window and then click the Edit Parm File button in the Configure Collection Parameters dialog box. The contents of the currently open parm file are displayed in a previously specified editor or word processor. (To specify an editor or word processor, see Configuring User Options on page 237.)
Using the Performance Collection Component on Windows 241
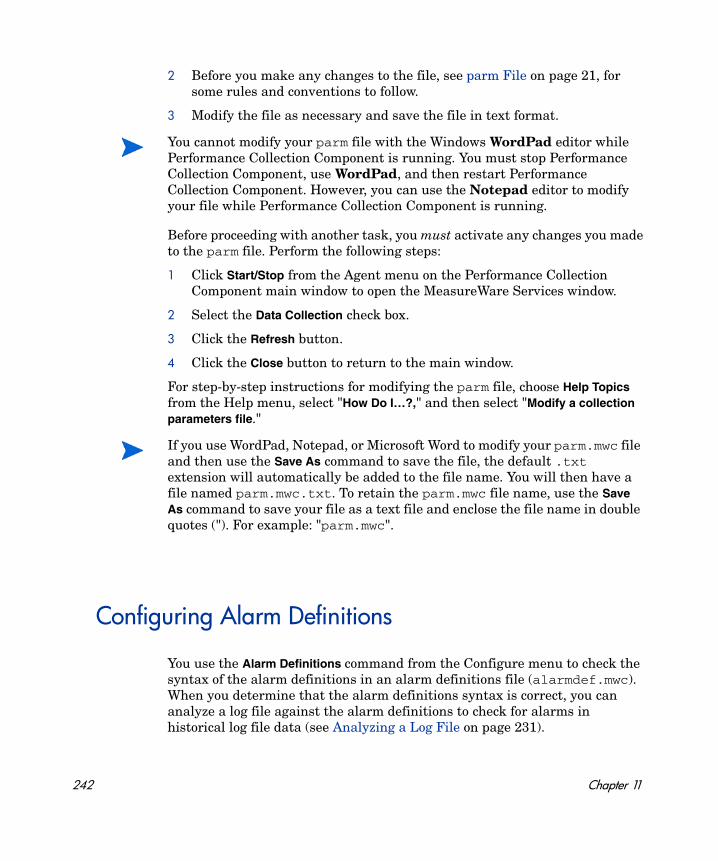
2 Before you make any changes to the file, see parm File on page 21, for some rules and conventions to follow.
3 Modify the file as necessary and save the file in text format.
Before proceeding with another task, you must activate any changes you made to the parm file. Perform the following steps:
1 Click Start/Stop from the Agent menu on the Performance Collection Component main window to open the MeasureWare Services window.
2 Select the Data Collection check box.
3 Click the Refresh button.
4 Click the Close button to return to the main window.
For step-by-step instructions for modifying the parm file, choose Help Topics from the Help menu, select "How Do I…?," and then select "Modify a collection parameters file."
Configuring Alarm Definitions
You use the Alarm Definitions command from the Configure menu to check the syntax of the alarm definitions in an alarm definitions file (alarmdef.mwc). When you determine that the alarm definitions syntax is correct, you can analyze a log file against the alarm definitions to check for alarms in historical log file data (see Analyzing a Log File on page 231).
You cannot modify your parm file with the Windows WordPad editor while Performance Collection Component is running. You must stop Performance Collection Component, use WordPad, and then restart Performance Collection Component. However, you can use the Notepad editor to modify your file while Performance Collection Component is running.
If you use WordPad, Notepad, or Microsoft Word to modify your parm.mwc file and then use the Save As command to save the file, the default .txt extension will automatically be added to the file name. You will then have a file named parm.mwc.txt. To retain the parm.mwc file name, use the Save As command to save your file as a text file and enclose the file name in double quotes ("). For example: "parm.mwc".
242 Chapter 11
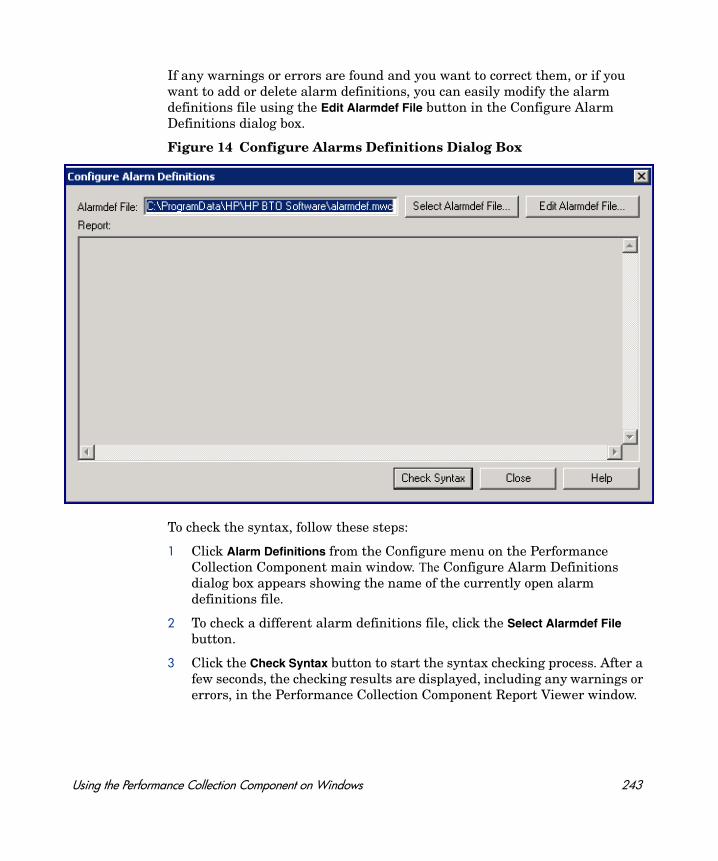
If any warnings or errors are found and you want to correct them, or if you want to add or delete alarm definitions, you can easily modify the alarm definitions file using the Edit Alarmdef File button in the Configure Alarm Definitions dialog box.
Figure 14 Configure Alarms Definitions Dialog Box
To check the syntax, follow these steps:
1 Click Alarm Definitions from the Configure menu on the Performance Collection Component main window. The Configure Alarm Definitions dialog box appears showing the name of the currently open alarm definitions file.
2 To check a different alarm definitions file, click the Select Alarmdef File button.
3 Click the Check Syntax button to start the syntax checking process. After a few seconds, the checking results are displayed, including any warnings or errors, in the Performance Collection Component Report Viewer window.
Using the Performance Collection Component on Windows 243

4 To modify any portion of the alarm definitions file, click the Edit Alarmdef File button.
For step-by-step instructions for checking the syntax of an alarm definitions file, choose Help Topics from the Help menu, select "How Do I…?," and then select "Checking the syntax of an alarm definitions file."
Modify an Alarm Definitions File
To modify the alarmdef file, follow these steps:
1 Click Alarm Definitions from the Configure menu on the Performance Collection Component main window and then click the Edit Alarmdef File button in the Configure Alarm Definitions dialog box. The contents of the currently open alarm definitions file are displayed in a previously specified editor or word processor. (To configure an editor or word processor, see Configuring User Options on page 237.)
2 Before you make any changes to the file, see the Alarm Syntax Reference on page 160, for detailed information about alarm definitions.
3 Modify the file as necessary and save it in text format.
Activate Changes
Before proceeding with another task, you must activate any changes you made to the alarm definitions file. Perform the following steps:
1 Click Start/Stop from the Agent menu on the Performance Collection Component main window to open the MeasureWare Services window.
2 Select the Alarm Definitions check box.
3 Click the Refresh button.
4 Click the Close button to return to the main window.
If you use WordPad, Notepad, or Microsoft Word to modify your alarm definitions file and then use the Save As command to save the file, the default.txt extension will automatically be added to the file name. You will then have a file named alarmdef.mwc.txt. To retain the alarmdef.mwc file name, use the Save As command to save your file as a text file and enclose the file name in double quotes ("). For example, "alarmdef.mwc".
244 Chapter 11
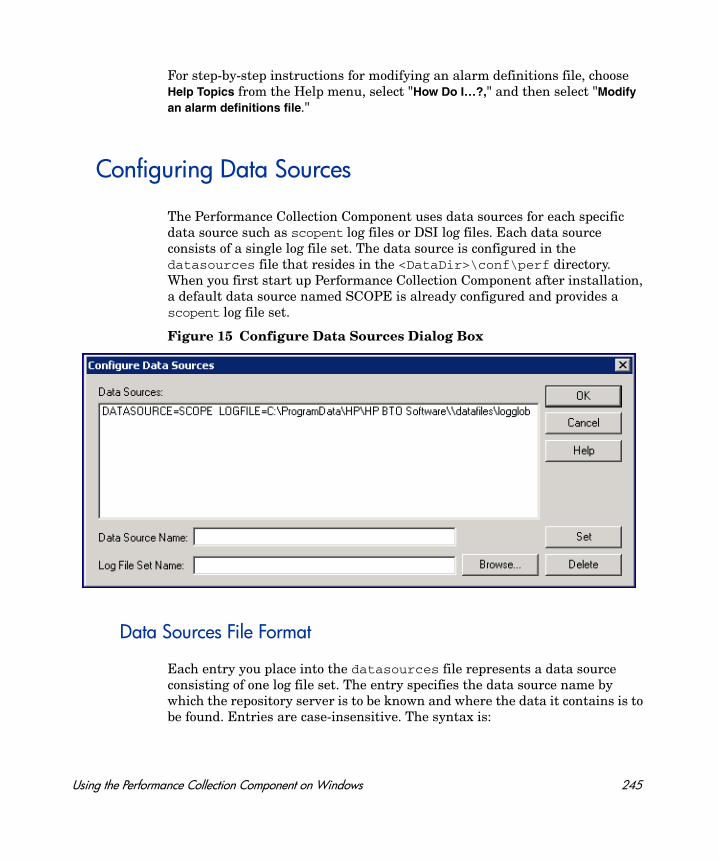
For step-by-step instructions for modifying an alarm definitions file, choose Help Topics from the Help menu, select "How Do I…?," and then select "Modify an alarm definitions file."
Configuring Data Sources
The Performance Collection Component uses data sources for each specific data source such as scopent log files or DSI log files. Each data source consists of a single log file set. The data source is configured in the datasources file that resides in the <DataDir>\conf\perf directory. When you first start up Performance Collection Component after installation, a default data source named SCOPE is already configured and provides a scopent log file set.
Figure 15 Configure Data Sources Dialog Box
Data Sources File Format
Each entry you place into the datasources file represents a data source consisting of one log file set. The entry specifies the data source name by which the repository server is to be known and where the data it contains is to be found. Entries are case-insensitive. The syntax is:
Using the Performance Collection Component on Windows 245

datasource=datasource_name logfile=logfile_set
• datasource is a keyword. datasource_name is the name used to identify the data source used in alarm definitions or analysis software. Data source names must be unique. The maximum length for the datasource_name is 64 characters.
• logfile is a keyword. logfile_set is the fully qualified name that identifies the log file set. It can be a raw log file set created by scopent, an extracted log file created by the extract task, or a DSI log file set. If you specify a log file path name that contains embedded blanks, you must place double quotes (") around the path name.
When specifying a scopent log file set, use only the logglob file name. You do not need to specify other raw log file names because they are accessed as a single log file set.
The same applies when specifying a DSI log file set. Specify only the name of the DSI root file. You do not need to specify any of the other files in the DSI log file set.
Configuring Data Sources from Remote Locations
The universal naming convention (UNC) is required when you specify a log file set that resides on a network share. At system start-up, the Performance Collection Component service is started automatically, and drive mappings for remotely connected file systems are not established until the user logs on. Therefore, any data source that uses a drive-mapped name to reference a log file on a remote system causes Coda to generate an invalid data source error. If you start the Performance Collection Component service after logging on, the data source is processed because the drive mappings are now established.
Here are three examples of data source entries:
Example 1:
The following example shows the default SCOPE data source residing on the default <disk drive>:\Program Files\HP\HP BTO Software\data\datafiles\directory.
datasource=SCOPE logfile="C:\Program Files\HP\HP BTO Software\data\datafiles\logglob"
246 Chapter 11
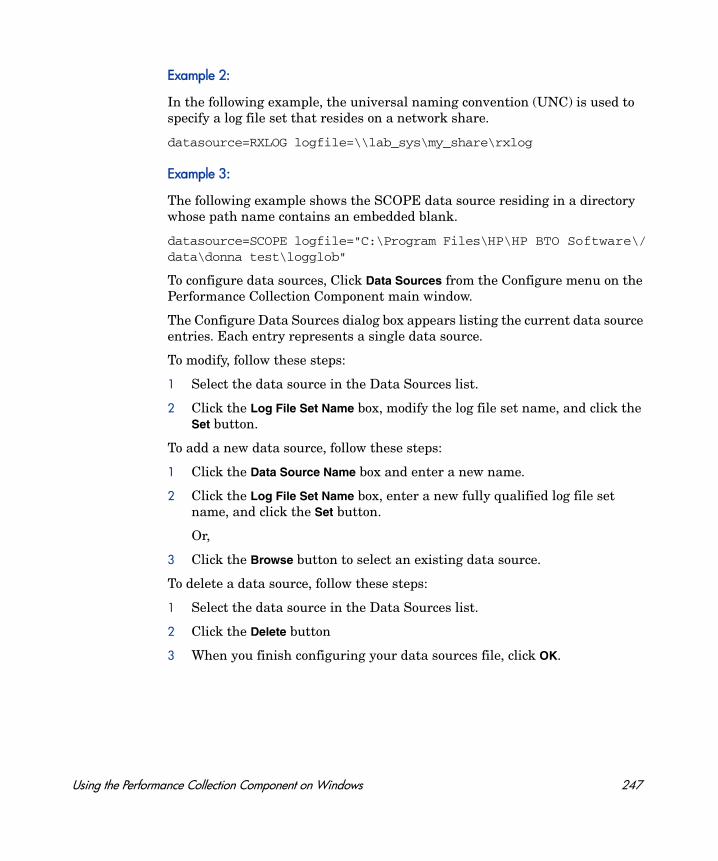
Example 2:
In the following example, the universal naming convention (UNC) is used to specify a log file set that resides on a network share.
datasource=RXLOG logfile=\\lab_sys\my_share\rxlog
Example 3:
The following example shows the SCOPE data source residing in a directory whose path name contains an embedded blank.
datasource=SCOPE logfile="C:\Program Files\HP\HP BTO Software\/data\donna test\logglob"
To configure data sources, Click Data Sources from the Configure menu on the Performance Collection Component main window.
The Configure Data Sources dialog box appears listing the current data source entries. Each entry represents a single data source.
To modify, follow these steps:
1 Select the data source in the Data Sources list.
2 Click the Log File Set Name box, modify the log file set name, and click the Set button.
To add a new data source, follow these steps:
1 Click the Data Source Name box and enter a new name.
2 Click the Log File Set Name box, enter a new fully qualified log file set name, and click the Set button.
Or,
3 Click the Browse button to select an existing data source.
To delete a data source, follow these steps:
1 Select the data source in the Data Sources list.
2 Click the Delete button
3 When you finish configuring your data sources file, click OK.
Using the Performance Collection Component on Windows 247
Activate the changes:
Before proceeding with another task, you must activate any changes you made to the data sources. Perform the following steps:
1 Choose Start/Stop from the Agent menu on the Performance Collection Component main window to open the MeasureWare Services window.
2 Click the Stop Services button to stop MeasureWare services.
3 When the Stop Services button appears dimmed, click the Start Services button.
4 Click the Close button to return to the main window.
For step-by-step instructions for modifying the data sources file, choose Help Topics from the Help menu, select "How Do I…?," and then select "Modify a data source file."
Configuring Transactions
You use the transaction configuration file, ttdconf.mwc, to customize collection of transaction data for an application. The file defines the transaction name, performance distribution range, and the service level objective you want to meet for each transaction. Optionally, you can define transactions that are specific to an application.
The default ttdconf.mwc file contains three entries. Two entries define transactions used by the Performance Collection Component scopent collector, and a third entry, tran=* registers all transactions in applications that were instrumented with Application Response Measurement (ARM) API function calls.
248 Chapter 11
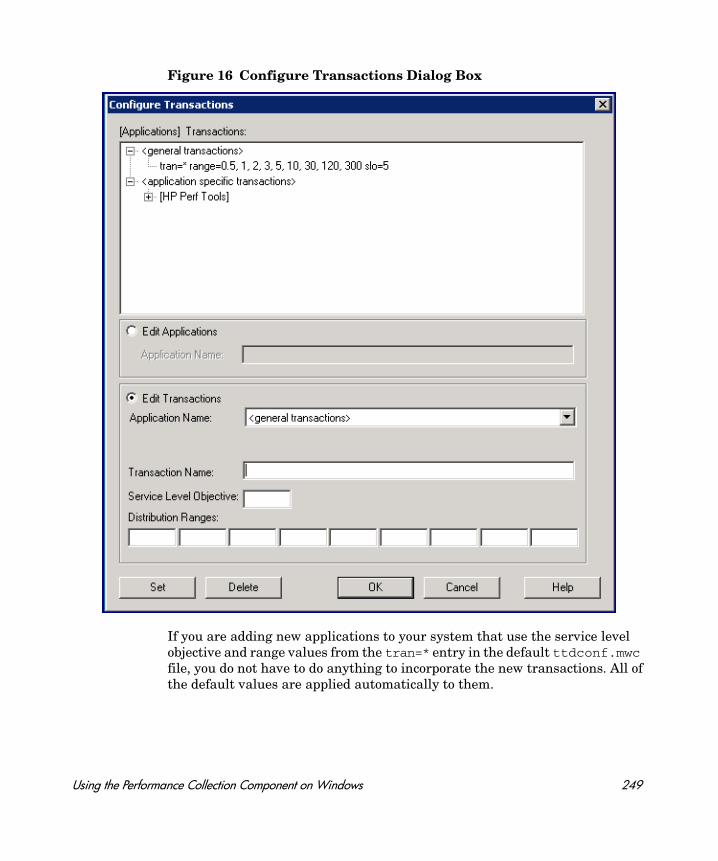
Figure 16 Configure Transactions Dialog Box
If you are adding new applications to your system that use the service level objective and range values from the tran=* entry in the default ttdconf.mwc file, you do not have to do anything to incorporate the new transactions. All of the default values are applied automatically to them.
Using the Performance Collection Component on Windows 249

However, if you are adding applications to your system that have transactions with their own unique service level objectives and distribution range values, you must add these transactions to the ttdconf.mwc file.
Before you make any changes to the file, see What is Transaction Tracking? on page 343 for descriptions of the configuration file format, transaction and application names, performance distribution ranges, and service level objectives. To configure, click Transactions from the Configure menu on the Performance Collection Component main window to display the Configure Transactions dialog box. Using this dialog box, you can perform the following tasks:
1 Add a general transaction
2 Add an application-specific transaction
3 Modify a transaction's performance distribution range or service level objective
4 Delete a transaction
For step-by-step instructions for performing these tasks, choose Help Topics from the Help menu, select "How Do I…?," and then select "Configure transactions."
Configuring Persistent DSI Collections
Use the Persistent DSI Collections command from the Configure menu to check the syntax or modify the DSI configuration file, dsiconf.mwc. The dsiconf.mwc file is used to configure continuous logging of data collections that were brought into Performance Collection Component from outside sources. For more information, see Overview of Data Source Integration on page 259.
The order of the entries in the ttdconf.mwc file is not relevant. Exact matches are sought first. If none are found, the longest match with a trailing asterisk (*) is used.
250 Chapter 11

Figure 17 Configure Persistent DSI Collections Dialog Box
To check the syntax of the DSI configuration file, follow these steps:
1 Click Persistent DSI Collections from the Configure menu on the Performance Collection Component main window. The Configure Persistent DSI Collections dialog box shows the name of the currently open dsiconf.mwc file.
2 To check a different dsiconf.mwc file, click the Select DSIconf File button.
3 To check the syntax of the file, click the Check Syntax button. Any resulting warnings or errors are displayed in the Performance Collection Component Report Viewer window.
4 To modify any portion of the file, click the Edit DSIconf File button. You can position the Edit DSIconf File and the Configure Persistent DSI Collections dialog boxes on your screen so that you can use both at the same time.
For step-by-step instructions for checking the syntax of the DSI configuration file, choose Help Topics from the Help menu, select "How Do I…?," and then select "Check the syntax of a DSI configuration file."
Using the Performance Collection Component on Windows 251
To modify a DSI configuration file, follow these steps:
1 Click Persistent DSI Collections from the Configure menu on the Performance Collection Component main window and then click the Edit DSIconf File button in the Configure Persistent DSI Collections dialog box. The contents of the currently open dsiconf.mwc file are displayed in a previously specified editor or word processor. (To specify an editor or word processor, see Configuring User Options on page 237.)
2 Before you make any changes to the file, see Using the Performance Collection Component on Windows on page 213 for rules and conventions to follow.
3 Modify the file as necessary and save the file in text format.
Before proceeding with another task, you must activate any changes you made to the dsiconf.mwc file. Perform the following steps:
1 Click Start/Stop from the Agent menu on the Performance Collection Component main window to open the MeasureWare Services window.
2 Select the Persistent DSI Collections check box.
3 Click the Refresh button.
4 Click the Close button to return to the main window.
For step-by-step instructions for modifying a DSI configuration file, choose Help Topics from the Help menu, select "How Do I…?," and then select "Modify a DSI configuration file."
If you use WordPad, Notepad, or Microsoft Word to modify your dsiconf.mwc file and then use the Save As command to save the file, the default .txt extension will automatically be added to the file name. You will then have a file named dsiconf.mwc.txt. To retain the dsiconf.mwc file name, use the Save As command to save your file as a text file and enclose the file name in double quotes ("). For example: "dsiconf.mwc"
252 Chapter 11

Checking Performance Collection Component Status
Use the Status command from the Agent menu to review the current status of Performance Collection Component processes. The information is generated by the perfstat program.
You can designate which specific information to include in the status report by choosing the Options command from the Configure menu display and selecting any of the following options in the Configure Options dialog box.
Running Processes
Background and foreground processes that are currently running for Performance Collection Component are listed. Any background processes that should be running but are not running are listed.
Datacomm Services
Datacomm services locate and communicate with the Performance Collection Component datacomm services. They show whether or not the alarm generator database server (agdbserver) process is running and responsive. If data communications are not enabled , this information may take more than 30 seconds to generate while it waits for datacomm services to respond.
System Services
The current status of Performance Collection Component System Services such as the Scope Collector, Transaction Manager, and Measurement Interface is shown.
System Configuration
System name, operating system version, and processor type.
File Version Numbers
Version numbers of Performance Collection Component files. Any critical files that are missing are noted.
Using the Performance Collection Component on Windows 253
Status File Latest Entries
The latest few entries from each performance tool status file.
Status File Warnings and Errors
Any lines from the performance tool status files that contain "Error" or "Warning" are listed. A very large listing can be produced in cases where warnings have been ignored for long periods of time.
To list the current status, click Status from the Agent menu on the Performance Collection Component main window. The Performance Collection Component Report Viewer displays the information you selected from the Configure Options dialog box.
To get a complete report of all status information, click Report from the Agent menu. The Performance Collection Component Report Viewer displays a complete list of all status information.
For step-by-step instructions for checking Performance Collection Component status, choose Help Topics from the Help menu, select "How Do I…?," and then select "Check status of Performance Collection Component processes."
You can also run the perfstat program from the Windows Command Prompt.
Building Collections of Performance Counters
Performance Collection Component provides access to Windows performance counters that are used to measure system, application, or device performance on your system. You use the Extended Collection Builder and Manager (ECBM) to select specific performance counters to build data collections.
254 Chapter 11

Building a Performance Counter Collection
To build a collection, choose Extended Collections from the Agent menu on the Performance Collection Component main window. The Extended Collection Builder and Manager window appears, showing a list of Windows objects in the left pane. For instructions on building collections, choose Help Topics from the Help menu in the Extended Collection Builder and Manager window.
After you build your collections of Windows performance counters, use the Extended Collection Manager pane at the bottom to register, start, and stop new and existing collections.
Managing a Performance Counter Collection
To manage your data collections, use the Extended Collection Manager pane at the bottom of the Extended Collection Builder and Manager. Initially, no collections appear because you must register a collection before you can start collecting data.
After you register or store the collection you created, the Extended Collection Manager pane shows a list of current collections. The Extended Collection Manager pane also displays the state of every collection and enables you to view information (properties) about the collection itself. For instructions on managing your collections, choose Help Topics from the Help menu in the Extended Collection Builder and Manager window.
Tips for Using Extended Collection Builder and Manager
• The <Installdir>\paperdocs\mwa\C\monxref.txt file contains a cross-reference of Performance Collection Component metrics to Windows performance counters and commands. Logging data through the Extended Collection Builder and Manager for metrics already collected by Performance Collection Component incurs additional system overhead.
• When you use the Extended Collection Builder to create collections, default metric names are assigned to Windows performance counters for internal use with the Performance Collection Component. These default names are generally not meaningful or easy to decipher. To make metric names more meaningful or match them to the metric names supplied by their source application, modify metric attributes by right-clicking or
Using the Performance Collection Component on Windows 255
double clicking the metric name after you drag it from left to right pane in the Extended Collection Builder and Manager window. (See the Extended Collection Builder and Manager online help for detailed instructions.)
• If you start 61 or more collections, the collections beyond 60 go into error states. This may cause problems with other collections.
• If you collect logical disk metrics from a system configured with Wolfpack, you must restart the collection in order to collect data for any new disk instances not present when the collection was registered.
• Successful deletion of collections requires restarting Performance Collection Component after deleting the collection. If Performance Collection Component is not restarted, you might get an error during the delete operation. This error typically means that some files were not successfully deleted. You may need to manually delete any files and directories that remain after you restart Performance Collection Component.
• Extended Collection Builder and Manager may report missing values for some metrics with cache counters. The problem may occur under some circumstances when a metric value gets an overflow. A message is also sent to the ECBM status file. You can resolve the problem by restarting the collection.
Explanations of Extended Collection Builder and Manager concepts, and instructions on creating and viewing data collections are available in the Extended Collection Builder and Manager online help. To view online help, from your desktop select Start → Programs → HP → Operations Agent→ Performance Collection Component → ECB-ECM Online Help. You can select Extended Collections from the Agent menu in the Performance Collection Component main window and select Help Topics from the Help menu in the Extended Collection Builder and Manager window. Online help is available by selecting the Help button in the dialog boxes that appear in the Extended Collection Builder and Manager.
Administering ECBM from the Command line
You can run the ECBM program from the <rpmtools>\bin directory using the Windows Command prompt.
Collections can be managed from the command line using the following command:
256 Chapter 11
\rpmtools\bin\mwcmcmd.exe
To display various options, type the following command:
\rpmtools\bin\mwcmcmd /?
To start the stopped collections, type the following command:
mwcmcmd start <collection_name(s)>
To start a new collection from a variable-instance policy, type the following command:
mwcmcmd start <policy_name> <collect_name> <instance(s)> [options]
The following options are available:
-i <sampling_interval> - change sampling interval (seconds)
-l <logfile_path_name> - change default log location
-a <alarm_file> - change the alarm definitions file
To stop the active collections, type the following command:
mwcmcmd stop <collection_name(s)>
The following is the command to register a policy file:
mwcmcmd register <policy_file> <collection/policy_name> [options]
The following options are available only when registering a fixed-instance policy file:
-i <sampling_interval> - change sampling interval (seconds)
-l <logfile_path_name> - change default log location
-a <alarm_file> - change the alarm definitions file
To delete a single collection:
mwcmcmd delete <collection/policy_name> [options]
The following options are only available when deleting a collection:
-p <archive_path> - archives logfiles to specified path
-r - restarts Performance agent
To delete multiple collections or policies:
Using the Performance Collection Component on Windows 257

mwcmcmd delete { <collection/policy_name(s)> | -c | -all }
-c - deletes ALL collections
-a - deletes ALL collections and policies
To list all registered collections and policies, type the following command:
mwcmcmd list
To list the properties of a collection or policy, type the following command:
mwcmcmd properties <collection/policy_name>
To list the variable-instance objects in a policy, type:
mwcmcmd objects <policy_name>
When deleting more than one policy/collection at a time, Performance Collection Component will be automatically restarted, and all associated logfiles will be deleted.
258 Chapter 11
12 Overview of Data Source Integration
The Data Source Integration (DSI) technology allows you to use the HP Operations agent to log data, define alarms, and access metrics from new sources of data beyond the metrics logged by the Performance Collection Component’s scope collector. Metrics can be acquired from data sources such as databases, LAN monitors, and end-user applications.
The data you log using DSI can be displayed in HP Performance Manager along with the standard performance metrics logged by the scope collector. DSI logged data can also be exported, using the Performance Collection Component extract program, for display in spreadsheets or similar analysis packages.
How DSI Works
The following diagram shows how DSI log files are created and used to log and manage data. DSI log files contain self-describing data that is collected outside of the Performance Collection Component scope collector. DSI processes are described in more detail on the next page.
259

Figure 18 Data Source Integration Process
Using DSI to log data consists of the following tasks:
Creating the Class Specification
You first create and compile a specification for each class of data you want to log. The specification describes the class of data as well as the individual metrics to be logged within the class. When you compile the specification using the DSI compiler, sdlcomp, a set of empty log files are created to accept data from the dsilog program. This process creates the log file set that contains a root file, a description file, and one or more data files.
Collecting and Logging the Data
Then you collect the data to be logged by starting up the process of interest. You can either pipe the output of the collection process to the dsilog program directly or from a file where the data was stored. dsilog processes the data according to the specification and writes it to the appropriate log file. dsilog allows you to specify the form and format of the incoming data.
The data that you feed into the DSI process should contain multiple data records. A record consists of the metric values contained in a single line. If you send data to DSI one record at a time, stop the process, and then send another record, dsilog can append but cannot summarize the data.
260 Chapter 12
Using the Data
You can use Performance Manager to display DSI log file data. Or you can use the Performance Collection Component extract program to export the data for use with other analysis tools. You can also configure alarms to occur when DSI metrics exceed defined conditions.
Overview of Data Source Integration 261

262 Chapter 12
13 Using Data Source Integration
This chapter is an overview of how you use DSI and contains the following information:
• Planning data collection
• Defining the log file format in the class specification file
• Creating the empty log file set
• Logging data to the log file set
• Using the logged data
For detailed reference information on DSI class specifications and DSI programs, see Chapter 14, DSI Class Specification Reference and Chapter 15, DSI Program Reference.
Planning Data Collection
Before creating the DSI class specification files and starting the logging process, you need to address the following topics:
• Understand your environment well enough to know what kinds of data would be useful in managing your computing resources.
• What data is available?
• Where is the data?
• How can you collect the data?
• What are the delimiters between data items? For proper processing by dsilog, metric values in the input stream must be separated by blanks (the default) or a user-defined delimiter.
• What is the frequency of collection
• How much space is required to maintain logs?
• What is the output of the program or process that you use to access the data?
• Which alarms do you want generated and under what conditions?
• What options do you have for logging with the class specification and the dsilog process?
263
Defining the Log File Format
Once you have a clear understanding of what kind of data you want to collect, create a class specification to define the data to be logged and to define the log file set that will contain the logged data. You enter the following information in the class specification:
• Data class name and ID number
• Label name (optional) that is a substitute for the class name. (For example, if a label name is present, it can be used in Performance Manager.)
• What you want to happen when old data is rolled out to make room for new data. See How Log Files Are Organized for more information.
• Metric names and other descriptive information, such as how many decimals to allow for metric values.
• How you want the data summarized if you want to log a limited number of records per hour.
Here is an example of a class specification:
CLASS VMSTAT_STATS = 10001LABEL "VMSTAT data"INDEX BY HOURMAX INDEXES 12ROLL BY HOURRECORDS PER HOUR 120;
METRICSRUN_Q_PROCS = 106LABEL "Procs in run q"PRECISION 0;
BLOCKED_PROCS = 107LABEL "Blocked Processes"PRECISION 0;
You can include one class or multiple classes in a class specification file. When you have completed the class specification file, name the file and then save it. When you run the DSI compiler, sdlcomp, you use this file to create the log file set. For more information about class specification and metric description syntax, see Chapter 14, DSI Class Specification Reference
How Log Files Are Organized
Log files are organized into classes. Each class, which represents one source of incoming data, consists of a group of data items, or metrics, that are logged together. Each record, or row, of data in a class represents one sample of the values for that group of metrics.
The data for classes is stored on disk in log files that are part of the log file set. The log file set contains a root file, a description file, and one or more log files. All the data from a class is always kept in a single data file. However, when you provide a log file set name to the sdlcomp compiler, you can store multiple classes together in a single log file set or in separate log file sets. The figure below illustrates how two classes can be stored in a single log file set.
264 Chapter 13

Because each class is created as a circular log file, you can set the storage capacity for each class separately, even if you have specified that multiple classes should be stored in a single log file set. When the storage capacity is reached, the class is “rolled”, which means the oldest records in the class are deleted to make room for new data.
You can specify actions, such as exporting the old data to an archive file, to be performed whenever the class is rolled.
Using Data Source Integration 265

Creating the Log File Set
The DSI compiler, sdlcomp, uses the class specification file to create or update an empty log file set. The log file set is then used to receive logged data from the dsilog program.
To create a log file set, complete the following tasks:
1 Run sdlcomp with the appropriate variables and options. For example,
sdlcomp [-maxclass value] specification_file [logfile_set[log file]] [options]
2 Check the output for errors and make changes as needed.
For more information about sdlcomp, see the Compiler Syntax in Chapter 15.
Testing the Class Specification File and the Logging Process (Optional)
DSI uses a program, sdlgendata, that allows you to test your class specification file against an incoming source of generated data. You can then examine the output of this process to verify that DSI can log the data according to your specifications. For more information about sdlgendata, see Testing the Logging Process with Sdlgendata in Chapter 15.
To test your class specification file for the logging process:
1 Feed the data that is generated by sdlgendata to the dsilog program. The syntax is:
sdlgendata logfile_set class | dsilog logfile_set class -vo
2 Check the output to see if your class specification file matches the format of your data collection process. If the sdlgendata program outputs something different from your program, you have either an error in your output format or an error in the class specification file.
3 Before you begin collecting real data, delete all log files from the testing process.
266 Chapter 13
Logging Data to the Log File Set
After you have created the log file set, and optionally tested it, update Performance Collection Component configuration files as needed, and then run the dsilog program to log incoming data.
1 Update the data source configuration file, datasources, to add the DSI log files as data sources for generating alarms.
2 Modify the alarm definitions file, alarmdef, if you want to alarm on specific DSI metrics. For more information, see Defining Alarms for DSI Metrics in Chapter 15.
3 Optionally, test the logging process by piping data (which may be generated by sdlgendata to match your class specification) to the dsilog program with the -vi option set.
4 Check the data to be sure it is being correctly logged.
5 After testing, remove the data that was tested.
6 Start the collection process from the command line.
7 Pipe the data from the collection process to dsilog (or some other way to get it to stdin) with the appropriate variables and options set. For example:
<program or process with variables>| dsilog logfile_set class
For more information about dsilog options, see dsilog Logging Process in Chapter 15.
The dsilog program is designed to receive a continuous stream of data. Therefore, it is important to structure scripts so that dsilog receives continuous input data. Do not write scripts that create a new dsilog process for new input data points. This can cause duplicate timestamps to be written to the dsilog file, and can cause problems for Performance Manager and perfalarm when reading the file. See Chapter 16, Examples of Data Source Integration, for examples of problematic and recommended scripts
Using Data Source Integration 267
Using the Logged Data
Once you have created the DSI log files, you can export the data using the Performance Collection Component's extract program. You can also configure alarms to occur when DSI metrics exceed defined conditions.
Here are ways to use logged DSI data:
• Export the data for use in reporting tools such as spreadsheets.
• Display exported DSI data using analysis tools such as in Performance Manager.
• Monitor alarms using HP Operations Manager or HP Network Node Manager.
You cannot create extracted log files from DSI log files.
268 Chapter 13
14 DSI Class Specification Reference
This chapter provides detailed reference information about:
• Class specifications
• Class specifications syntax
• Metrics descriptions in the class specifications
Class Specifications
For each source of incoming data, you must create a class specification file to describe the format for storing incoming data. To create the file, use the class specification language described in the next section, Class Specification Syntax. The class specification file contains:
• a class description, which assigns a name and numeric ID to the incoming data set, determines how much data will be stored, and specifies when to roll data to make room for new data.
• metric descriptions for each individual data item. A metric description names and describes a data item. It also specifies the summary level to apply to data (RECORDS PER HOUR) if more than one record arrives in the time interval that is configured for the class.
To generate the class specification file, use any editor or word processor that lets you save the file as an ASCII text file. You specify the name of the class specification file when you run sdlcomp to compile it. When the class specification is compiled, it automatically creates or updates a log file set for storage of the data.
The class specification allows you to determine how many records per hour will be stored for the class, and to specify a summarization method to be used if more records arrive than you want to store. For instance, if you have requested that 12 records per hour be stored (a record every five minutes) and records arrive every minute, you could have some of the data items averaged and others totaled to maintain a running count.
Avoid the use of class specification file names that conflict with these naming conventions, or sdlcomp will fail.
The DSI compiler, sdlcomp, creates files with the following names for a log file set (named logfile_set_name):
logfile_set_name and logfile_set_name.desc
sldcomp creates a file with the following default name for a class (named class_name):
logfile_set_name.class_name
269

Class Specification Syntax
Syntax statements shown in brackets [ ] are optional. Multiple statements shown in braces { } indicate that one of the statements must be chosen. Italicized words indicate a variable name or number you enter. Commas can be used to separate syntax statements for clarity anywhere except directly preceding the semicolon, which marks the end of the class specification and the end of each metric specification. Statements are not case-sensitive.
Comments start with # or //. Everything following a # or // on a line is ignored. Note the required semicolon after the class description and after each metric description. Detailed information about each part of the class specification and examples follow.
CLASS class_name = class_id_number[LABEL "class_label_name"]
[INDEX BY {HOUR | DAY | MONTH} MAX INDEXES number [[ROLL BY {HOUR | DAY | MONTH} [ACTION "action" ]
[ CAPACITY {maximum_record_number} ][ RECORDS PER HOUR number ];
METRICS
metric_name = metric_id_number[ LABEL "metric_label_name" ][ TOTALED | AVERAGED | SUMMARIZED BY metric_name ] [ MAXIMUM metric_maximum_number ][PRECISION {0 | 1 | 2 | 3 | 4 | 5} ][TYPE TEXT LENGTH "length"];
User-defined descriptions, such as metric_label_name or class_label_name, cannot be the same as any of the keyword elements of the DSI class specification syntax.
270 Chapter 14

CLASS Description
To create a class description, assign a name to a group of metrics from a specific data source, specify the capacity of the class, and designate how data in the class will be rolled when the capacity is exceeded.
You must begin the class description with the CLASS keyword. The final parameter in the class specification must be followed by a semicolon.
Syntax
CLASS class_name = class_id_number
[LABEL "class_label_name"]
[INDEX BY { HOUR | DAY | MONTH } MAX INDEXES number[[ ROLL BY { HOUR | DAY | MONTH } [ACTION "action"]
[ CAPACITY {maximum_record_number} ]
[ RECORDS PER HOUR number]
;
Default Settings
The default settings for the class description are:
LABEL (class_name)INDEX BY DAYMAX INDEXES 9RECORDS PER HOUR 12
To use the defaults, enter only the CLASS keyword with a class_name and numeric class_id_number.
CLASS
The class name and class ID identify a group of metrics from a specific data source.
Syntax
CLASS class_name = class_id_number
How to Use It
The class_name and class_ID_number must meet the following requirements:
• class_name is alphanumeric and can be up to 20 characters long. The name must start with an alphabetic character and can contain underscores (but no special characters).
• class_ID_number must be numeric and can be up to six digits long.
• Neither the class_name or the class_ID_number are case-sensitive.
DSI Class Specification Reference 271
• The class_name and class_ID_number must each be unique among all the classes you define and cannot be the same as any applications defined in the Performance Collection Component parm file. (For information about the parm file, see Chapter 2 of the HP Operations Agent for UNIX User's Manual.).
Example
CLASS VMSTAT_STATS = 10001;
LABEL
The class label identifies the class as a whole. It is used instead of the class name in Performance Manager.
Syntax
[ LABEL "class_label_name" ]
How To Use It
The class_label_name must meet the following requirements:
• It must be enclosed in double quotation marks.
• It can be up to 48 characters long.
• It cannot be the same as any of the keyword elements of the DSI class specification syntax, such as CAPACITY, ACTION and so on.
• If it contains a double quotation mark, precede it with a backslash (\). For example, you would enter "\"my\" data" if the label is "my" data.
• If no label is specified, the class_name is used as the default.
Example
CLASS VMSTAT_STATS = 10001
LABEL "VMSTAT data";
INDEX BY, MAX INDEXES, AND ROLL BY
INDEX BY, MAX INDEXES, and ROLL BY settings allow you to specify how to store data and when to discard it. With these settings you designate the blocks of data to store, the maximum number of blocks to store, and the size of the block of data to discard when data reaches its maximum index value.
Syntax
[NDEX BY {HOUR | DAY | MONTH} MAX INDEXES number][[ROLL BY {HOUR | DAY | MONTH} [ACTION "action"]]
How To Use It
INDEX BY settings allow blocks of data to be rolled out of the class when the class capacity is reached. The INDEX BY and RECORDS PER HOUR options can be used to indirectly set the capacity of the class as described later in Controlling Log File Size.
The INDEX BY setting cannot exceed the ROLL BY setting. For example, INDEX BY DAY does not work with ROLL BY HOUR, but INDEX BY HOUR does work with ROLL BY DAY.
If ROLL BY is not specified, the INDEX BY setting is used. When the capacity is reached, all the records logged in the oldest roll interval are freed for reuse.
272 Chapter 14

Any specified ACTION is performed before the data is discarded (rolled). This optional ACTION can be used to export the data to another location before it is removed from the class. For information about exporting data, see Chapter 15, DSI Program Reference.
Notes on Roll Actions
The UNIX command specified in the ACTION statement cannot be run in the background. Also, do not specify a command in the ACTION statement that will cause a long delay, because new data won’t be logged during the delay.
If the command is more than one line long, mark the start and end of each line with double quotation marks. Be sure to include spaces where necessary inside the quotation marks to ensure that the various command line options will remain separated when the lines are concatenated.
If the command contains a double quotation mark, precede it with a backslash (\).
The ACTION statement is limited to 199 characters or less.
Within the ACTION statement, you can use macros to define the time window of the data to be rolled out of the log file. These macros are expanded by dsilog. You can use $PT_START$ to specify the beginning of the block of data to be rolled out in UNIX time (seconds since 1/1/70 00:00:00) and $PT_END$ to specify the end of the data in UNIX time. These are particularly useful when combined with the extract program to export the data before it is overwritten.
If a macro is used, its expanded length is used against the 199-character limit.
Examples
The following examples may help to clarify the relationship between the INDEX BY, MAX INDEXES, and the ROLL BY clauses.
The following example indirectly sets the CAPACITY to 144 records (1*12*12).
CLASS VMSTAT_STATS = 10001LABEL "VMSTAT data"INDEX BY HOURMAX INDEXES 12RECORDS PER HOUR 12;
The following example indirectly sets the CAPACITY to 1440 records (1*12*120).
CLASS VMSTAT_STATS = 10001LABEL "VMSTAT data"INDEX BY HOURMAX INDEXES 12RECORDS PER HOUR 120;
The following example shows ROLL BY HOUR.
CLASS VMSTAT_STATS = 10001LABEL "VMSTAT data"INDEX BY HOURMAX INDEXES 12ROLL BY HOURRECORDS PER HOUR 120;
The following example causes all the data currently identified for rolling (excluding weekends) to be exported to a file called sys.sdl before the data is overwritten. Note that the last lines of the last example are enclosed in double quotation marks to indicate that they form a single command.
DSI Class Specification Reference 273

CLASS VMSTAT_STATS = 10001LABEL "VMSTAT data"INDEX BY HOURMAX INDEXES 12ROLL BY HOURACTION "extract -xp -l sdl_new -C SYS_STATS ""-B $PT_START$ -E $PT_END$ -f sys.sdl, purge -we 17 "RECORDS PER HOUR 120;
Other Examples
The suggested index settings below may help you to consider how much data you want to store.
The following table provides a detailed explanation of settings using ROLL BY
INDEX BY MAX INDEXESAmount of Data Stored
HOUR 72 3 days
HOUR 168 7 days
HOUR 744 31 days
DAY 365 1 year
MONTH 12 1 year
INDEX BYMAX INDEXES ROLL BY Meaning
DAY 9 DAY Nine days of data will be stored in the log file. Before logging day 10, day 1 is rolled out. These are the default values for index and max indexes.
HOUR 72 HOUR 72 hours (three days) of data will be stored in the log file. Before logging hour 73, hour 1 is rolled out. Thereafter, at the start of each succeeding hour, the “oldest” hour is rolled out.
HOUR 168 DAY 168 hours (seven days) of data will be stored in the log file. Before logging hour 169 (day 8), day 1 is rolled out. Thereafter, at the start of each succeeding day, the “oldest” day is rolled out.
274 Chapter 14

HOUR 744 MONTH 744 hours (31 days) of data will be stored in the log file. Before logging hour 745 (day 32), month 1 is rolled out. Thereafter, before logging hour 745, the “oldest” month is rolled out.
For example, dsilog is started on April 15 and logs data through May 16 (744 hours). Before logging hour 745 (the first hour of May 17), dsilog will roll out the data for the month of April (April 15 - 30).
INDEX BYMAX INDEXES ROLL BY Meaning
DSI Class Specification Reference 275

DAY 30 DAY 30 days of data will be stored in the log file. Before logging day 31, day 1 is rolled out. Thereafter, at the start of each succeeding day, the “oldest” month is rolled out.
For example, dsilog is started on April 1 and logs data all month, then the April 1st will be rolled out when May 1st (day 31) data is to be logged.
DAY 62 MONTH 62 days of data will be stored in the log file. Before logging day 63, month 1 is rolled out. Thereafter, before logging day 63 the “oldest” month is rolled out.
For example, if dsilog is started on March 1 and logs data for the months of March and April, there will be 61 days of data in the log file. Once dsilog logs May 1st data (the 62nd day), the log file will be full. Before dsilog can log the data for May 2nd, it will roll out the entire month of March.
MONTH 2 MONTH Two months of data will be stored in the log file. Before logging the third month, month 1 is rolled out. Thereafter, at the start of each succeeding month, the “oldest” month is rolled out.
For example, dsilog is started on January 1 and logs data for the months of January and February. Before dsilog can log the data for March, it will roll out the month of January.
INDEX BYMAX INDEXES ROLL BY Meaning
276 Chapter 14

Controlling Log File Size
You determine how much data is to be stored in each class and how much data to discard to make room for new data.
Class capacity is calculated from INDEX BY (hour, day, or month), RECORDS PER HOUR, and MAX INDEXES. The following examples show the results of different settings.
In this example, the class capacity is 288 (24 indexes * 12 records per hour).
INDEX BY HOURMAX INDEXES 24RECORDS PER HOUR 12
In this example, the class capacity is 504 (7 days * 24 hours per day * 3 records per hour).
INDEX BY DAYMAX INDEXES 7RECORDS PER HOUR 3
In this example, the class capacity is 14,880 (2 months * 31 days per month * 24 hours per day * 10 records per hour).
INDEX BY MONTHMAX INDEXES 2RECORDS PER HOUR 10
If you do not specify values for INDEX BY, RECORDS PER HOUR, and MAX INDEXES, DSI uses the defaults for the class descriptions. See “Default Settings” under CLASS Description earlier in this chapter.
The ROLL BY option lets you determine how much data to discard each time the class record capacity is reached. The setting for ROLL BY is constrained by the INDEX BY setting in that the ROLL BY unit (hour, day, month) cannot be smaller than the INDEX BY unit.
The following example illustrates how rolling occurs given the sample
INDEX BY DAYMAX INDEXES 6ROLL BY DAY
DSI Class Specification Reference 277

In the above example, the class capacity is limited to six days of data by the setting:
MAX INDEXES 6.
The deletion of data is set for a day's worth by the setting:
ROLL BY DAY.
When the seventh day's worth of data arrives, the oldest day's worth of data is discarded. Note that in the beginning of the logging process, no data is discarded. After the class fills up for the first time at the end of 7 days, the roll takes place once a day.
Example log
Day 2 - 21 records
Day 3 - 24 records
Day 4 - 21 records
Day 5 - 24 records
Day 6 - 21 records
Space is freed when datacollection reaches 6 days.On day 7, DSI rolls the oldestday’s worth of data, making room for day 7 data records.
278 Chapter 14
RECORDS PER HOUR
The RECORDS PER HOUR setting determines how many records are written to the log file every hour. The default number for RECORDS PER HOUR is 12 to match Performance Collection Component's measurement interval of data sampling once every five minutes (60 minutes/12 records = logging every five minutes).
The default number or the number you enter could require the logging process to summarize data before it becomes part of the log file. The method used for summarizing each data item is specified in the metric description. For more information, see Summarization Method later in this chapter.
Syntax
[RECORDS PER HOUR number]
How To Use It
The logging process uses this value to summarize incoming data to produce the number of records specified. For example, if data arrives every minute and you have set RECORDS PER HOUR to 6 (every 10 minutes), 10 data points are summarized to write each record to the class. Some common RECORDS PER HOUR settings are shown below:
RECORDS PER HOUR 6 --> 1 record/10 minutesRECORDS PER HOUR 12 --> 1 record/5 minutesRECORDS PER HOUR 60 --> 1 record/minuteRECORDS PER HOUR 120 --> 1 record/30 seconds
Notes
RECORDS PER HOUR can be overridden by the -s seconds option in dsilog. However, overriding the original setting could cause problems when Performance Manager graphs the data.
If dsilog receives no metric data for an entire logging interval, a missing data indicator is logged for that metric. DSI can be forced to use the last value logged with the -asyn option in dsilog. For a description of the -asyn option, see dsilog Logging Process in Chapter 15.
Example
In this example, a record will be written every 10 minutes.
CLASS VMSTAT_STATS = 10001LABEL "VMSTAT data"RECORDS PER HOUR 6;
DSI Class Specification Reference 279
CAPACITY
CAPACITY is the number of records to be stored in the class.
Syntax
[CAPACITY {maximum_record_number}]
How To Use It
Class capacity is derived from the setting in RECORDS PER HOUR, INDEX BY, and MAX INDEXES. The CAPACITY setting is ignored unless a capacity larger than the derived values of these other settings is specified. If this situation occurs, the MAX INDEXES setting is increased to provide the specified capacity.
Example
INDEX BY DAYMAX INDEXES 9RECORDS PER HOUR 12CAPACITY 3000
In the above example, the derived class capacity is 2,592 records (9 days * 24 hours per day * 12 records per hour).
Because 3000 is greater than 2592, sdlcomp increases MAX INDEXES to 11, resulting in the class capacity of 3168. After compilation, you can see the resulting MAX INDEXES and CAPACITY values by running sdlutil with the -decomp option.
280 Chapter 14
Metrics Descriptions
The metrics descriptions in the class specification file are used to define the individual data items for the class. The metrics description equates a metric name with a numeric identifier and specifies the method to be used when data must be summarized because more records per hour are arriving than you have specified with the RECORDS PER HOUR setting.
Note that there is a maximum limit of 100 metrics in the dsilog format file.
METRICS
metric_name = metric_id_number[LABEL "metric_label_name"][TOTALED | AVERAGED | SUMMARIZED BY metric_name][MAXIMUM metric_maximum_number][PRECISION { 0 | 1 | 2 | 3 | 4 | 5 }]TYPE TEXT LENGTH "length"
METRICS
The metric name and id number identify the metric being collected.
Syntax
METRICSmetric_name = metric_id_number
How To Use It
The metrics section must start with the METRICS keyword before the first metric definition. Each metric must have a metric name that meets the following requirements:
• Must not be longer than 20 characters.
• Must begin with an alphabetic character.
• Can contain only alphanumeric characters and underscores.
• Is not case-sensitive.
The metric also has a metric ID number that must not be longer than 6 characters.
The metric_name and metric_id_number must each be unique among all the metrics you define in the class. The combination class_name:metric_name must be unique for this system, and it cannot be the same as any application_name:metric_name.
Each metric description is separated from the next by a semicolon (;).
User-defined descriptions, such as the metric_label_name, cannot be the same as any of the keyword elements of the DSI class specification syntax.
For numeric metrics, you can specify the summarization method (TOTALED, AVERAGED, SUMMARIZED BY) and PRECISION. For text metrics, you can only specify the TYPE TEXT LENGTH.
DSI Class Specification Reference 281

You can reuse metric names from any other class whose data is stored in the same log file set if the definitions are identical as well (see How Log Files Are Organized in Chapter 13). To reuse a metric definition that has already been defined in another class in the same log file set, specify just the metric_name without the metric_id_number or any other specifications. If any of the options are to be set differently than the previously defined metric, the metric must be given a unique name and numeric identifier and redefined.
The order of the metric names in this section of the class specification determines the order of the fields when you export the logged data. If the order of incoming data is different than the order you list in this specification or if you do not want to log all the data in the incoming data stream, see Chapter 15, DSI Program Reference for information about how to map the metrics to the correct location.
A timestamp metric is automatically inserted as the first metric in each class. If you want the timestamp to appear in a different position in exported data, include the short form of the internally defined metric definition (DATE_TIME;) in the position you want it to appear. To omit the timestamp and use a UNIX timestamp (seconds since 1/1/70 00:00:00) that is part of the incoming data, choose the -timestamp option when starting the dsilog process.
The simplest metric description, which uses the metric name as the label and the defaults of AVERAGED, MAXIMUM 100, and PRECISION 3 decimal places, requires the following description:
METRICSmetric_name = metric_id_number
Example
VM;
VM is an example of reusing a metric definition that has already been defined in another class in the same log file set.
LABEL
The metric label identifies the metric in Performance Manager graphs and exported data.
Syntax
[LABEL "metric_label_name"]
How To Use It
Specify a text string, surrounded by double quotation marks, to label the metric in graphs and exported data. Up to 48 characters are allowed. If no label is specified, the metric name is used to identify the metric.
Notes
If the label contains a double quotation mark, precede it with a backslash (\). For example, you would enter "\"my\" data" if the label is “my” data.
The metric_label_name cannot be the same as any of the keyword elements of the DSI class specification syntax such as CAPACITY, ACTION and so on.
Example
You must compile each class using sdlcomp and then start logging the data for that class using the dsilog process, regardless of whether you have reused metric names.
282 Chapter 14
METRICSRUN_Q_PROCS = 106LABEL "Procs in run q";
Summarization Method
The summarization method determines how to summarize data if the number of records exceeds the number set in the RECORDS PER HOUR option of the CLASS section. For example, you would want to total a count of occurrences, but you would want to average a rate. The summarization method is only valid for numeric metrics.
Syntax
[{TOTALED | AVERAGED | SUMMARIZED BY metric_name}]
How To Use It
SUMMARIZED BY should be used when a metric is not being averaged over time, but over another metric in the class. For example, assume you have defined metrics TOTAL_ORDERS and LINES_PER_ORDER. If these metrics are given to the logging process every five minutes but records are being written only once each hour, to correctly summarize LINES_PER_ORDER to be (total lines / total orders), the logging process must perform the following calculation every five minutes:
• Multiply LINES_PER_ORDER * TOTAL_ORDERS at the end of each five-minute interval and maintain the result in an internal running count of total lines.
• Maintain the running count of TOTAL_ORDERS.
• At the end of the hour, divide total lines by TOTAL_ORDERS.
To specify this kind of calculation, you would specify LINES_PER_ORDER as SUMMARIZED BY TOTAL_ORDERS.
If no summarization method is specified, the metric defaults to AVERAGED.
Example
METRICSITEM_1_3 = 11203LABEL "TOTAL_ORDERS"TOTALED;ITEM_1_5 = 11205LABEL "LINES_PER_ORDER" SUMMARIZED BY ITEM_1_3;
PRECISION
PRECISION identifies the number of decimal places to be used for metric values. If PRECISION is not specified, it is calculated based on the MAXIMUM specified. If neither is specified, the default PRECISION value is 3. This setting is valid only for numeric metrics.
Syntax
[PRECISION{0|1|2|3|4|5}]
How To Use It
The PRECISION setting determines the largest value that can be logged. Use PRECISION 0 for whole numbers.
DSI Class Specification Reference 283
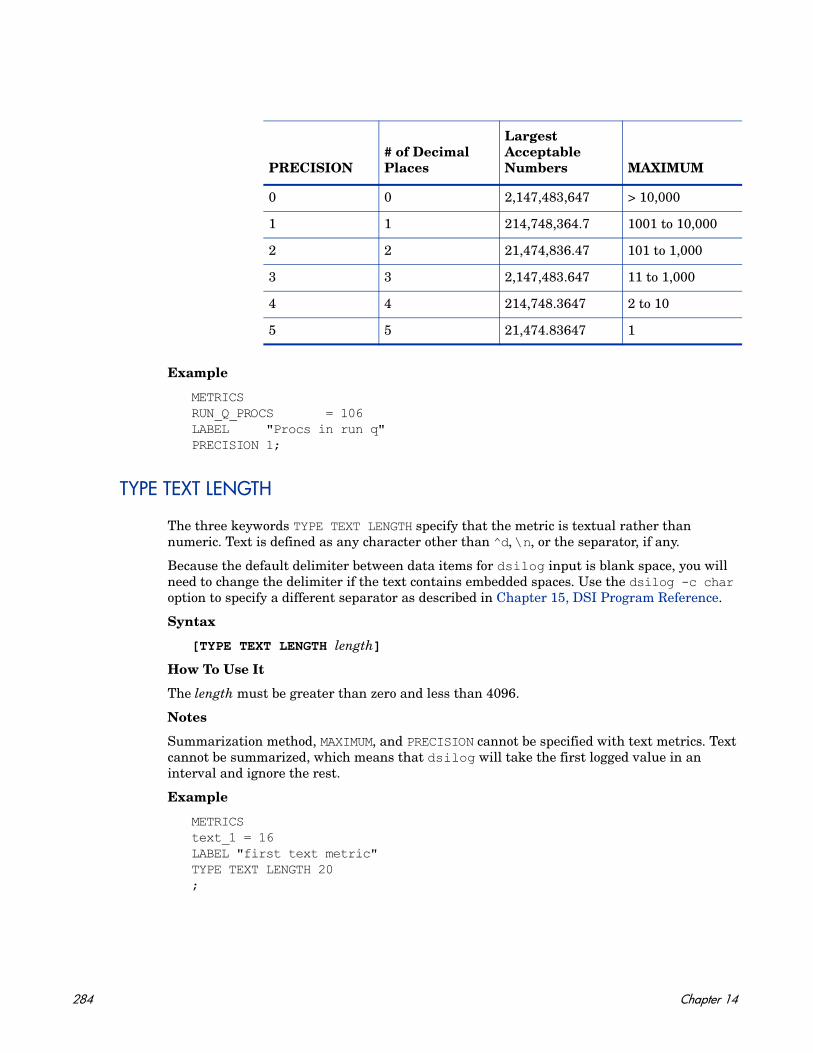
Example
METRICSRUN_Q_PROCS = 106LABEL "Procs in run q"PRECISION 1;
TYPE TEXT LENGTH
The three keywords TYPE TEXT LENGTH specify that the metric is textual rather than numeric. Text is defined as any character other than ^d, \n, or the separator, if any.
Because the default delimiter between data items for dsilog input is blank space, you will need to change the delimiter if the text contains embedded spaces. Use the dsilog -c char option to specify a different separator as described in Chapter 15, DSI Program Reference.
Syntax
[TYPE TEXT LENGTH length]
How To Use It
The length must be greater than zero and less than 4096.
Notes
Summarization method, MAXIMUM, and PRECISION cannot be specified with text metrics. Text cannot be summarized, which means that dsilog will take the first logged value in an interval and ignore the rest.
Example
METRICStext_1 = 16LABEL "first text metric"TYPE TEXT LENGTH 20;
PRECISION# of Decimal Places
Largest Acceptable Numbers MAXIMUM
0 0 2,147,483,647 > 10,000
1 1 214,748,364.7 1001 to 10,000
2 2 21,474,836.47 101 to 1,000
3 3 2,147,483.647 11 to 1,000
4 4 214,748.3647 2 to 10
5 5 21,474.83647 1
284 Chapter 14

Sample Class Specification
CLASS VMSTAT_STATS = 10001LABEL "VMSTAT data"INDEX BY HOURMAX INDEXES 12ROLL BY HOURRECORDS PER HOUR 120;
METRICS
RUN_Q_PROCS = 106LABEL "Procs in run q"PRECISION 0;
BLOCKED_PROCS = 107LABEL "Blocked Processes"PRECISION 0;
SWAPPED_PROCS = 108LABEL "Swapped Processes"PRECISION 0;
AVG_VIRT_PAGES = 201LABEL "Avg Virt Mem Pages"PRECISION 0;
FREE_LIST_SIZE = 202LABEL "Mem Free List Size"PRECISION 0;
PAGE_RECLAIMS = 303LABEL "Page Reclaims"PRECISION 0;
ADDR_TRANS_FAULTS = 304LABEL "Addr Trans Faults"PRECISION 0;
PAGES_PAGED_IN = 305LABEL "Pages Paged In"PRECISION 0;
PAGES_PAGED_OUT = 306LABEL "Pages Paged Out"PRECISION 0;
PAGES_FREED = 307LABEL "Pages Freed/Sec"PRECISION 0;
DSI Class Specification Reference 285

MEM_SHORTFALL = 308LABEL "Exp Mem Shortfall"PRECISION 0;
CLOCKED_PAGES = 309LABEL "Pages Scanned/Sec"PRECISION 0;
DEVICE_INTERRUPTS = 401LABEL "Device Interrupts"PRECISION 0;
SYSTEM_CALLS = 402LABEL "System Calls"PRECISION 0;
CONTEXT_SWITCHES = 403LABEL "Context Switches/Sec"PRECISION 0;
USER_CPU = 501LABEL "User CPU"PRECISION 0;
SYSTEM_CPU = 502LABEL "System CPU"PRECISION 0;
IDLE_CPU = 503LABEL "Idle CPU"PRECISION 0;
286 Chapter 14

15 DSI Program Reference
This chapter provides detailed reference information about:
• the sdlcomp compiler
• configuration files datasources and alarmdef
• the dsilog logging process
• exporting DSI data using the Performance Collection Component extract program
• the sdlutil data source management utility
287

sdlcomp Compiler
The sdlcomp compiler checks the class specification file for errors. If no errors are found, it adds the class and metric descriptions to the description file in the log file set you name. It also sets up the pointers in the log file set's root file to the log file to be used for data storage. If either the log file set or the log file does not exist, it is created by the compiler.
Compiler Syntax
sdlcomp [-maxclass value] specification_file [logfile_set[log file]] [options]
You can put the DSI files anywhere on your system by specifying a full path in the compiler command. However, once the path has been specified, DSI log files cannot be moved to different directories. (SDL62 is the associated class specification error message, described in SDL Error Messages in Chapter 17. The format used by DSI for the class specification error messages is the prefix SDL (Self Describing Logfile), followed by the message number.
Variables and Options Definitions
-maxclass value allows you to specify the maximum number of classes to be provided for when creating a new log file set. This option is ignored if it is used with the name of an existing log file set. Each additional class consumes about 500 bytes of disk space in overhead, whether the class is used or not. The default is 10 if -maxclass is not specified.
specification_file is the name of the file that contains the class specification. If it is not in the current directory, it must be fully qualified.
logfile_set is the name of the log file set this class should
log file is the log file in the set that will contain the data for this class. If no log file is named, a new log file is created for the class and is named automatically.
-verbose prints a detailed description of the compiler output to stdout.
-vers displays version information.
-? displays the syntax description.
-u allows you to log more than one record per second. Use this option to log unsummarized data only.
288 Chapter 15
Sample Compiler Output
Given the following command line:
->sdlcomp vmstat.spec sdl_new
the following code is sample output for a successful compile. Note that vmstat.spec is the sample specification file presented in the previous chapter.
sdlcompCheck class specification syntax.
CLASS VMSTAT_STATS = 10001LABEL "VMSTAT data"INDEX BY HOURMAX INDEXES 12ROLL BY HOURRECORDS PER HOUR 120;
METRICS
RUN_Q_PROCS = 106LABEL "Procs in run q"PRECISION 0;
BLOCKED_PROCS = 107LABEL "Blocked Processes"PRECISION 0;
SWAPPED_PROCS = 108LABEL "Swapped Processes"PRECISION 0;
AVG_VIRT_PAGES = 201LABEL "Avg Virt Mem Pages"PRECISION 0;
FREE_LIST_SIZE = 202LABEL "Mem Free List Size"PRECISION 0;
PAGE_RECLAIMS = 303LABEL "Page Reclaims"PRECISION 0;ADDR_TRANS_FAULTS = 304LABEL "Addr Trans Faults"PRECISION 0;
PAGES_PAGED_IN = 305LABEL "Pages Paged In"PRECISION 0;
PAGES_PAGED_OUT = 306LABEL "Pages Paged Out"PRECISION 0;
DSI Program Reference 289
PAGES_FREED = 307LABEL "Pages Freed/Sec"PRECISION 0;
MEM_SHORTFALL = 308LABEL "Exp Mem Shortfall"PRECISION 0;
CLOCKED_PAGES = 309LABEL "Pages Scanned/Sec"PRECISION 0;
DEVICE_INTERRUPTS = 401LABEL "Device Interrupts"PRECISION 0;
SYSTEM_CALLS = 402LABEL "System Calls"PRECISION 0;
CONTEXT_SWITCHES = 403LABEL "Context Switches/Sec"PRECISION 0;
USER_CPU = 501LABEL "User CPU"PRECISION 0;
SYSTEM_CPU = 502LABEL "System CPU"PRECISION 0;
IDLE_CPU = 503LABEL "Idle CPU"PRECISION 0;Note: Time stamp inserted as first metric by default.
Syntax check successful.
Update SDL sdl_new.Open SDL sdl_newAdd class VMSTAT_STATS.Check class VMSTAT_STATS.
Class VMSTAT_STATS successfully added to log file set.
For explanations of error messages and recovery, see Chapter 17, Error Message.
290 Chapter 15
Configuration Files
Before you start logging data, you may need to update two Performance Collection Component configuration files:
• /var/opt/OV/conf/perf/datasources
• /var/opt/perf/alarmdef — see the next section, Defining Alarms for DSI Metrics for information about using the alarmdef configuration file.
Defining Alarms for DSI Metrics
You can use Performance Collection Component to define alarms on DSI metrics. These alarms notify you when DSI metrics meet or exceed conditions that you have defined. To define alarms, you specify conditions that, when met or exceeded, trigger an alert notification or action. You define alarms for data logged through DSI the same way as for other Performance Collection Component metrics — in the alarmdef file on the Performance Collection Component system. The alarmdef file is located in the var/opt/perf/ configuration directory of Performance Collection Component.
Whenever you specify a DSI metric name in an alarm definition, it should be fully qualified; that is, preceded by the datasource_name, and the class_name as shown below:
datasource_name:class_name:metric_name
• datasource_name is the name you have used to configure the data source in the datasources file.
• class_name is the name you have used to identify the class in the class specification for the data source. You do not need to enter the class_name if the metric name is unique (not reused) in the class specification.
• metric_name is the data item from the class specification for the data source.
However, if you choose not to fully qualify a metric name, you need to include the USE statement in the alarmdef file to identify which data source to use. For more information about the USE statement, see Chapter 7, “Performance Alarms,” in the HP Operations Agent for UNIX User's Manual.
To activate the changes you made to the alarmdef file so that it can be read by the alarm generator, enter the ovpa restart alarm command in the command line.
For detailed information on the alarm definition syntax, how alarms are processed, and customizing alarm definitions, see Chapter 7 in the HP Operations Agent for UNIX User's Manual.
Alarm Processing
As data is logged by dsilog it is compared to the alarm definitions in the alarmdef file to determine if a condition is met or exceeded. When this occurs, an alert notification or action is triggered.
You can configure where you want alarm notifications sent and whether you want local actions performed. Alarm notifications can be sent to the central Performance Manager analysis system where you can draw graphs of metrics that characterize your system
DSI Program Reference 291
performance. SNMP traps can be sent to HP Network Node Manager. Local actions can be performed on the Performance Collection Component system. Alarm information can also be sent to Operations Manager.
dsilog Logging Process
The dsilog process requires that either devise your own program or use one that is already in existence for you to gain access to the data. You can then pipe this data into dsilog, which logs the data into the log file set. A separate logging process must be used for each class you define.
dsilog expects to receive data from stdin. To start the logging process, you could pipe the output of the process you are using to collect data to dsilog as shown in the following example.
vmstat 60 | dsilog logfile_set class
You can only have one pipe ( | ) in the command line. This is because with two pipes, UNIX buffering will hold up the output from the first command until 8000 characters have been written before continuing to the second command and piping out to the log file.
You could also use a fifo (named pipe). For example,
mkfifo -m 777 myfifodsilog logfile_set class -i myfifo &vmstat 60 > myfifo &
The & causes the process to run in the background.
Note that you may need to increase the values of the UNIX kernel parameters shmmni and nflocks if you are planning to run a large number of dsilog processes. Shmmni specifies the maximum number of shared memory segments; nflocks specifies the maximum number of file locks on a system. The default value for each is 200. Each active DSI log file set uses a shared memory segment (shmmni) and one or more file locks (nflocks). On HP-UX, you can change the settings for shmmni and nflocks using the System Administration and Maintenance utility (SAM).
Syntax
dsilog logfile_set class [options]
The dsilog parameters and options are described on the following pages.
292 Chapter 15
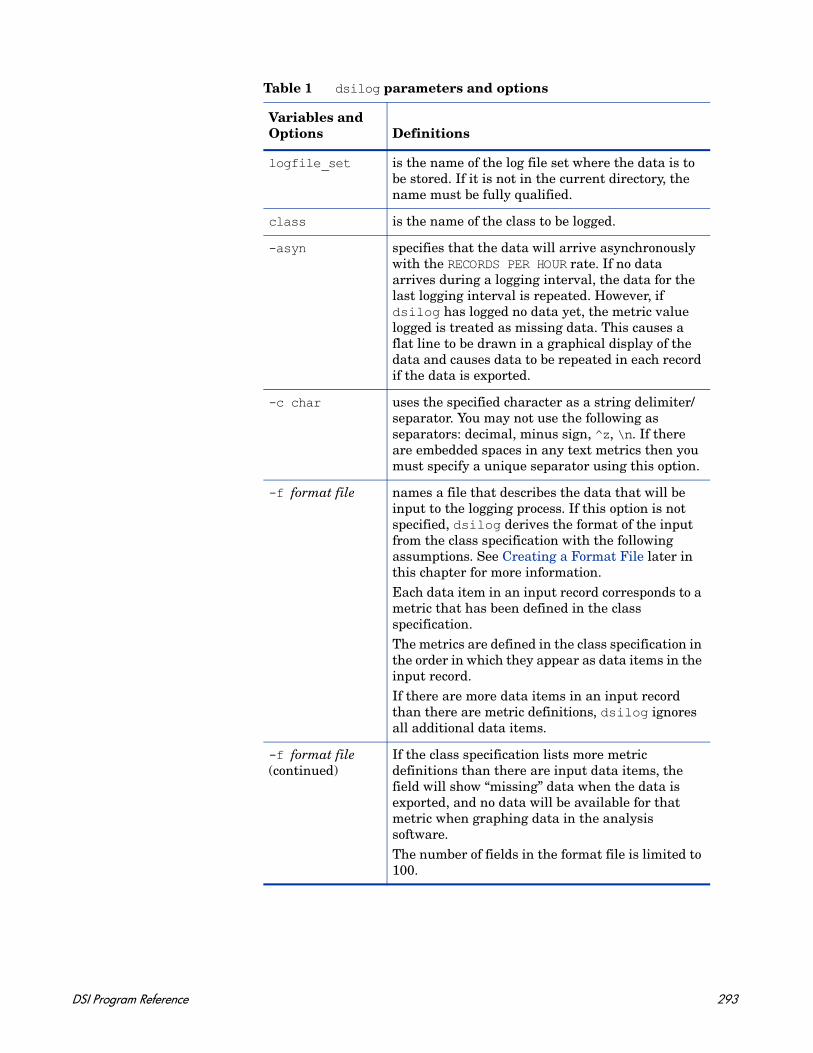
Table 1 dsilog parameters and options
Variables and Options Definitions
logfile_set is the name of the log file set where the data is to be stored. If it is not in the current directory, the name must be fully qualified.
class is the name of the class to be logged.
-asyn specifies that the data will arrive asynchronously with the RECORDS PER HOUR rate. If no data arrives during a logging interval, the data for the last logging interval is repeated. However, if dsilog has logged no data yet, the metric value logged is treated as missing data. This causes a flat line to be drawn in a graphical display of the data and causes data to be repeated in each record if the data is exported.
-c char uses the specified character as a string delimiter/separator. You may not use the following as separators: decimal, minus sign, ^z, \n. If there are embedded spaces in any text metrics then you must specify a unique separator using this option.
-f format file names a file that describes the data that will be input to the logging process. If this option is not specified, dsilog derives the format of the input from the class specification with the following assumptions. See Creating a Format File later in this chapter for more information.Each data item in an input record corresponds to a metric that has been defined in the class specification.The metrics are defined in the class specification in the order in which they appear as data items in the input record.If there are more data items in an input record than there are metric definitions, dsilog ignores all additional data items.
-f format file(continued)
If the class specification lists more metric definitions than there are input data items, the field will show “missing” data when the data is exported, and no data will be available for that metric when graphing data in the analysis software.The number of fields in the format file is limited to 100.
DSI Program Reference 293
-i fifoor ASCII file
indicates that the input should come from the fifo or ASCII file named. If this option is not used, input comes from stdin. If you use this method, start dsilog before starting your collection process. See man page mkfifo for more information about using a fifo. Also see Chapter 16, Examples of Data Source Integration for examples.
-s seconds is the number of seconds by which to summarize the data. The -s option overrides the summarization interval and the summarization rate defaults to RECORDS PER HOUR in the class specification. If present, this option overrides the value of RECORDS PER HOUR.
A zero (0) turns off summarization, which means that all incoming data is logged. Caution should be used with the -s 0 option because dsilog will timestamp the log data at the time the point arrived. This can cause problems for Performance Manager and perfalarm, which work best with timestamps at regular intervals. If the log file will be accessed by Performance Manager, use of the -s 0 option is discouraged.
-t prints everything that is logged to stdout in ASCII format.
-timestamp indicates that the logging process should not provide the timestamp, but use the one already provided in the input data. The timestamp in the incoming data must be in UNIX timestamp format (seconds since 1/1/70 00:00:00) and represent the local time.
-vi filters the input through dsilog and writes errors to stdout instead of the log file. It does not write the actual data logged to stdout (see the -vo option below). This can be used to check the validity of the input.
-vo filters the input through dsilog and writes the actual data logged and errors to stdout instead of the log file. This can be used to check the validity of the data summarization.
-vers displays version information
-? displays the syntax description.
Table 1 dsilog parameters and options
Variables and Options Definitions
294 Chapter 15

How dsilog Processes Data
The dsilog program scans each input data string, parsing delimited fields into individual numeric or text metrics. A key rule for predicting how the data will be processed is the validity of the input string. A valid input string requires that a delimiter be present between any specified metric types (numeric or text). A blank is the default delimiter, but a different delimiter can be specified with the dsilog -c char command line option.
You must include a new line character at the end of any record fed to DSI in order for DSI to interpret it properly.
Testing the Logging Process with Sdlgendata
Before you begin logging data, you can test the compiled log file set and the logging process using the sdlgendata program. sdlgendata discovers the metrics for a class (as described in the class specification) and generates data for each metric in a class.
Syntax
sdlgendata logfile_set class [options]
Sdlgendata parameters and options are explained below.
By piping sdlgendata output to dsilog with either the -vi or -vo options, you can verify the input (-vi) and verify the output (-vo) before you begin logging with your own process or program.
Table 2 Sdlgendata parameters and options
Variables and Options Definitions
logfile_set is the name of the log file set to generate data for.
class is the data class to generate data for.
-timestamp [number]
provides a timestamp with the data. If a negative number or no number is supplied, the current time is used for the timestamp. If a positive number is used, the time starts at 0 and is incremented by number for each new data record.
-wait number causes a wait of number seconds between records generated.
-cycle number recycles data after number cycles.
-vers displays version information.
-? displays the syntax description.
After you are finished testing, delete all log files created from the test. Otherwise, these files remain as part of the log file test.
DSI Program Reference 295
Use the following command to pipe data from sdlgendata to the logging process. The -vi option specifies that data is discarded and errors are written to stdout. Press CTRL+C or other interrupt control character to stop data generation.
sdlgendata logfile_set class -wait 5 | dsilog \logfile_set class -s 10 -vi
The previous command generates data that looks like this:
dsilog
I: 744996402 1.0000 2.0000 3.0000 4.0000 5.0000 6.0000 7.0000
I: 744996407 2.0000 3.0000 4.0000 5.0000 6.0000 7.0000 8.0000
I: 744996412 3.0000 4.0000 5.0000 6.0000 7.0000 8.0000 9.0000
I: 744996417 4.0000 5.0000 6.0000 7.0000 8.0000 9.0000 10.0000
I: 744996422 5.0000 6.0000 7.0000 8.0000 9.0000 10.0000 11.0000
I: 744996427 6.0000 7.0000 8.0000 9.0000 10.0000 11.0000 12.0000
I: 744996432 7.0000 8.0000 9.0000 10.000 11.000 12.0000 13.0000
I: 744996437 8.0000 9.0000 10.0000 11.0000 12.0000 13.0000 14.0000
You can also use the -vo option of dsilog to examine input and summarized output for your real data without actually logging it. The following command pipes vmstat at 5-second intervals to dsilog where it is summarized to 10 seconds.
->vmstat 5 | dsilog logfile_set class -s 10 -vo
dsilogI: 744997230 0.0000 0.0000 21.0000 2158.0000 1603.0000 2.0000 2.0000I: 744997235 0.0000 0.0000 24.0000 2341.0000 1514.0000 0.0000 0.0000interval markerL: 744997230 0.0000 0.0000 22.5000 2249.5000 1558.5000 1.0000 1.0000
I: 744997240 0.0000 0.0000 23.0000 2330.0000 1513.0000 0.0000 0.0000I: 744997245 0.0000 0.0000 20.0000 2326.0000 1513.0000 0.0000 0.0000interval markerL: 744997240 0.0000 0.0000 21.5000 2328.0000 1513.0000 0.0000 0.0000
I: 744997250 0.0000 0.0000 22.0000 2326.0000 1513.0000 0.0000 0.0000I: 744997255 0.0000 0.0000 22.0000 2303.0000 1513.0000 0.0000 0.0000interval markerL: 744997250 0.0000 0.0000 22.0000 2314.5000 1513.0000 0.0000 0.0000
I: 744997260 0.0000 0.0000 22.0000 2303.0000 1512.0000 0.0000 0.0000I: 744997265 0.0000 0.0000 28.0000 2917.0000 1089.0000 9.0000 33.0000interval markerL: 744997260 0.0000 0.0000 25.0000 2610.0000 1300.5000 4.5000 16.5000
I: 744997270 0.0000 0.0000 28.0000 2887.0000 1011.0000 3.0000 9.0000I: 744997275 0.0000 0.0000 27.0000 3128.0000 763.0000 8.0000 6.0000interval markerL: 744997270 0.0000 0.0000 27.5000 3007.5000 887.0000 5.5000 12.5000
296 Chapter 15

You can also use the dsilog -vo option to use a file of old data for testing, as long as the data contains its own UNIX timestamp (seconds since 1/1/70 00:00:00). To use a file of old data, enter a command like this:
dsilog -timestamp -vo <oldfile>
DSI Program Reference 297
Creating a Format File
Create a format file to map the data input to the class specification if:
• the data input contains data that is not included in the class specification.
• incoming data has metrics in a different order than you have specified in the class specification.
A format file is an ASCII text file that you can create with vi or any text editor. Use the -f option in dsilog to specify the fully qualified name of the format file.
Because the logging process works by searching for the first valid character after a delimiter (either a space by default or user-defined with the dsilog -c option) to start the next metric, the format file simply tells the logging process which fields to skip and what metric names to associate with fields not skipped.
$numeric tells the logging process to skip one numeric metric field and go to the next. $any tells the logging process to skip one text metric field and go to the next. Note that the format file is limited to 100 fields.
For example, if the incoming data stream contains this information:
ABC 987 654 123 456
and you want to log only the first numeric field into a metric named metric_1, the format file would look like this:
$any metric_1
This tells the logging process to log only the information in the first numeric field and discard the rest of the data. To log only the information in the third numeric field, the format file would look like this:
$any $numeric $numeric metric_1
To log all four numeric data items, in reverse order, the format file would look like this:
$any metric_4 metric_3 metric_2 metric_1
298 Chapter 15
If the incoming data stream contains the following information:
/users 15.9 3295 56.79% xdisk1 /dev/dsk/c0d0s*
and you want to log only the first text metric and the first two numeric fields into metric fields you name text_1, num_1, and num_2, respectively, the format file would look like this:
text_1 num_1 num_2
This tells the logging process to log only the information in the first three fields and discard the rest of the data.
To log all of the data, but discard the “%” following the third metric, the format file would look like this:
text_1 num_1 num_2 num_3 $any text_2 text_3
Since you are logging numeric fields and the “%” is considered to be a text field, you need to skip it to correctly log the text field that follows it.
To log the data items in a different order the format file would look like this:
text_3 num_2 num_1 num_3 $any text_2 text_1
Note that this will result in only the first six characters of text_3 being logged if text_1 is declared to be six characters long in the class specification. To log all of text_3 as the first value, change the class specification and alter the data stream to allow extra space.
DSI Program Reference 299
Changing a Class Specification
To change a class specification file, you must recreate the whole log file set as follows:
1 Stop the dsilog process.
2 Export the data from the existing log file using the UNIX timestamp option if you want to save it or integrate the old data with the new data you will be logging. See Exporting DSI Data later in this chapter for information on how to do this.
3 Run sdlutil to remove the log file set. See Managing Data With sdlutil later in this chapter for information on how to do this.
4 Update the class specification file.
5 Run sdlcomp to recompile the class specification.
6 Optionally, use the -i option in dsilog to integrate in the old data you exported in step 2. You may need to manipulate the data to line up with the new data using the -f format_file option
7 Run dsilog to start logging based on the new class specification.
8 As long as you have not changed the log file set name or location, you do not need to update the datasources file.
300 Chapter 15
Exporting DSI Data
To export the data from a DSI log file, use the Performance Collection Component extract program's export function. See Chapters 5 and 6 of the HP Operations Agent for UNIX User's Manual for details on how to use extract to export data. An example of exporting DSI data using command line arguments is provided on the following page.
There are several ways to find out what classes and metrics can be exported from the DSI log file. You can use sdlutil to list this information as described in Managing Data With sdlutil later in this chapter. Or you can use the extract guide command to create an export template file that lists the classes and metrics in the DSI log file. You can then use vi to edit, name, and save the file. The export template file is used to specify the export format, as described in Chapters 5 and 6 of the HP Operations Agent for UNIX User's Manual.
Example of Using Extract to Export DSI Log File Data
extract -xp -l logfile_set -C class [options]
You can use extract command line options to do the following:
• Specify an export output file.
• Set begin and end dates and times for the first and last intervals to export.
• Export data only between certain times (shifts).
• Exclude data for certain days of the week (such as weekends).
• Specify a separation character to put between metrics on reports.
• Choose whether or not to display headings and blank records for intervals when no data arrives and what the value displayed should be for missing or null data.
• Display exported date/time in UNIX format or date and time format.
• Set additional summarization levels.
Viewing Data in Performance Manager
In order to display data from a DSI log file in Performance Manager, you need to configure the DSI log file as an Performance Collection Component data source. Before you start logging data, configure the data source by adding it to the datasources file on the Performance Collection Component system.
You can centrally view, monitor, analyze, compare, and forecast trends in DSI data using Performance Manager. Performance Manager helps you identify current and potential problems. It provides the information you need to resolve problems before user productivity is affected.
You must be root or the creator of the log file to export DSI log file data.
DSI Program Reference 301
Managing Data With sdlutil
To manage the data from a DSI log file, use the sdlutil program to do any of the following tasks:
• list currently defined class and metric information to stdout. You can redirect output to a file.
• list complete statistics for classes to stdout.
• show metric descriptions for all metrics listed.
• list the files in a log file set.
• remove classes and data from a log file set.
• recreate a class specification from the information in the log file set.
• display version information.
Syntax
sdlutil logfile_set [option]
Variables and Options Definitions
logfile_set is the name of a log file set created by compiling a class specification.
-classes classlist provides a class description of all classes listed. If none are listed, all are provided. Separate the Items in the classlist with spaces.
-stats classlist provides complete statistics for all classes listed. If none are listed, all are provided. Separate the Items in the classlist with spaces.
-metrics metriclist provides metric descriptions for all metrics in the metriclist. If none are listed, all are provided. Separate the Items in the metriclist with spaces.
-id displays the shared memory segment ID used by the log file.
-files lists all the files in the log file set.
-rm all removes all classes and data as well as their data and shared memory ID from the log file.
302 Chapter 15
-decomp classlist recreates a class specification from the information in the log file set. The results are written to stdout and should be redirected to a file if you plan to make changes to the file and reuse it. Separate the Items in the classlist with spaces.
-vers displays version information.
-? displays the syntax description.
Variables and Options Definitions
DSI Program Reference 303

304 Chapter 15
16 Examples of Data Source Integration
Data source integration is a very powerful and very flexible technology. Implementation of DSI can range from simple and straightforward to very complex.
This chapter contains examples of using DSI for the following tasks:
• writing a dsilog script
• logging vmstat data
• logging sar data
• logging who word count
305

Writing a dsilog Script
The dsilog code is designed to receive a continuous stream of data rows as input. This stream of input is summarized by dsilog according to the specification directives for each class, and one summarized data row is logged per requested summarization interval. Performance Manager and perfalarm work best when the timestamps written in the log conform to the expected summarization rate (records per hour). This happens automatically when dsilog is allowed to do the summarization.
dsilog process for each arriving input row, which may cause problems with Performance Manager and perfalarm. This method is not recommended.
• Problematic dsilog script
• Recommended dsilog script
Example 1 - Problematic dsilog Script
In the following script, a new dsilog process is executed for each arriving input row.
while :
do
feed_one_data_row | dsilog sdlname classname
sleep 50
done
Example 2 - Recommended dsilog Script
In the following script, one dsilog process receives a continuous stream of input data. feed_one_data_row is written as a function, which provides a continuous data stream to a single dsilog process.
# Begin data feed function
feed_one_data_row()
{
while :
do
# Perform whatever operations necessary to produce one row
# of data for feed to a dsilog process
sleep 50
done
}
# End data feed function
# Script mainline code
feed_one_data_row | dsilog sdlname classname
306 Chapter 16

Logging vmstat Data
This example shows you how to set up data source integration using default settings to log the first two values reported by vmstat. You can either read this section as an overview of how the data source integration process works, or perform each task to create an equivalent DSI log file on your system.
The procedures needed to implement data source integration are:
• Creating a class specification file.
• Compiling the class specification file.
• Starting the dsilog logging process.
Creating a Class Specification File
The class specification file is a text file that you create to describe the class, or set of incoming data, as well as each individual number you intend to log as a metric within the class. The file can be created with the text editor of your choice. The file for this example of data source integration should be created in the /tmp/ directory.
The following example shows the class specification file required to describe the first two vmstat numbers for logging in a class called VMSTAT_STATS. Because only two metrics are defined in this class, the logging process ignores the remainder of each vmstat output record. Each line in the file is explained in the comment lines that follow it.
CLASS VMSTAT_STATS = 10001; # Assigns a unique name and number to vmstat class data. # The semicolon is required to terminate the class section # of the file.
METRICS # Indicates that everything that follows is a description # of a number (metric) to be logged.
RUN_Q_PROCS = 106; # Assigns a unique name and number to a single metric. # The semicolon is required to terminate each metric.
BLOCKED_PROCS = 107; # Assigns a unique name and number to another metric.# The semicolon is required to terminate each metric.
Compiling the Class Specification File
When you compile the class specification file using sdlcomp, the file is checked for syntax errors. If none are found, sdlcomp creates or updates a set of log files to hold the data for the class.
Use the file name you gave to the class specification file and then specify a name for logfile_set_name that makes it easy to remember what kind of data the log file contains. In the command and compiler output example below, /tmp/vmstat.spec is used as the file name and /tmp/VMSTAT_DATA is used for the log file set.
-> sdlcomp /tmp/vmstat.spec /tmp/VMSTAT_DATA
Examples of Data Source Integration 307

sdlcomp X.01.04Check class specification syntax.
CLASS VMSTAT_STATS = 10001;
METRICSRUN_Q_PROCS = 106;BLOCKED_PROCS = 107;
NOTE: Time stamp inserted as first metric by default.
Syntax check successful.
Update SDL VMSTAT_DATA.Shared memory ID used by vmstat_data=219
Class VMSTAT_STATS successfully added to log file set.
This example creates a log file set called VMSTAT_DATA in the /tmp/ directory, which includes a root file and description file in addition to the data file. The log file set is ready to accept logged data. If there are syntax errors in the class specification file, messages indicating the problems are displayed and the log file set is not created.
Starting the dsilog Logging Process
Now you can pipe the output of vmstat directly to the dsilog logging process. Use the following command:
vmstat 60 | dsilog /tmp/VMSTAT_DATA VMSTAT_STATS &
This command runs vmstat every 60 seconds and sends the output directly to the VMSTAT_STATS class in the VMSTAT_DATA log file set. The command runs in the background. You could also use remsh to feed vmstat in from a remote system.
Note that the following message is generated at the start of the logging process:
Metric null has invalid dataIgnore to end of line, metric value exceeds maximum
This message is a result of the header line in the vmstat output that dsilog cannot log. Although the message appears on the screen, dsilog continues to run and begins logging data with the first valid input line.
Accessing the Data
You can use the sdlutil program to report on the contents of the class:
sdlutil /tmp/VMSTAT_DATA -stats VMSTAT_STATS
You can use extract program command line arguments to export data from the class. For example:
extract -xp -l /tmp/VMSTAT_DATA -C VMSTAT_STATS -ut -f stdout
By default, data will be summarized and logged once every five minutes.
308 Chapter 16
Note that to export DSI data, you must be root or the creator of the log file.
Logging sar Data from One File
This example shows you how to set up several DSI data collections using the standard sar (system activity report) utility to provide the data.
When you use a system utility, it is important to understand exactly how that utility reports the data. For example, note the difference between the following two sar commands:
sar -u 1 1
HP-UX hpptc99 A.11.00 E 9000/855 04/10/99
10:53:15 %usr %sys %wio %idle 10:53:16 2 7 6 85
sar -u 5 2
HP-UX hpptc99 A.11.00 E 9000/855 04/10/99
10:53:31 %usr %sys %wio %idle 10:53:36 4 5 0 91 10:53:41 0 0 0 99
Average 2 2 0 95
As you can see, specifying an iteration value greater than 1 causes sar to display an average across the interval. This average may or may not be of interest but can affect your DSI class specification file and data conversion. You should be aware that the output of sar, or other system utilities, may be different when executed on different UNIX platforms. You should become very familiar with the utility you are planning to use before creating your DSI class specification file.
Our first example uses sar to monitor CPU utilization via the -u option of sar. If you look at the man page for sar, you will see that the -u option reports the portion of time running in user mode (%usr), running in system mode (%sys), idle with some process waiting for block I/O (%wio), and otherwise idle (%idle). Because we are more interested in monitoring CPU activity over a long period of time, we use the form of sar that does not show the average.
Creating a Class Specification File
The first task to complete is the creation of a DSI class specification file. The following is an example of a class specification that can be used to describe the incoming data:
# sar_u.spec## sar -u class definition for HP systems.## ==> 1 minute data; max 24 hours; indexed by hour; roll by day#
Examples of Data Source Integration 309
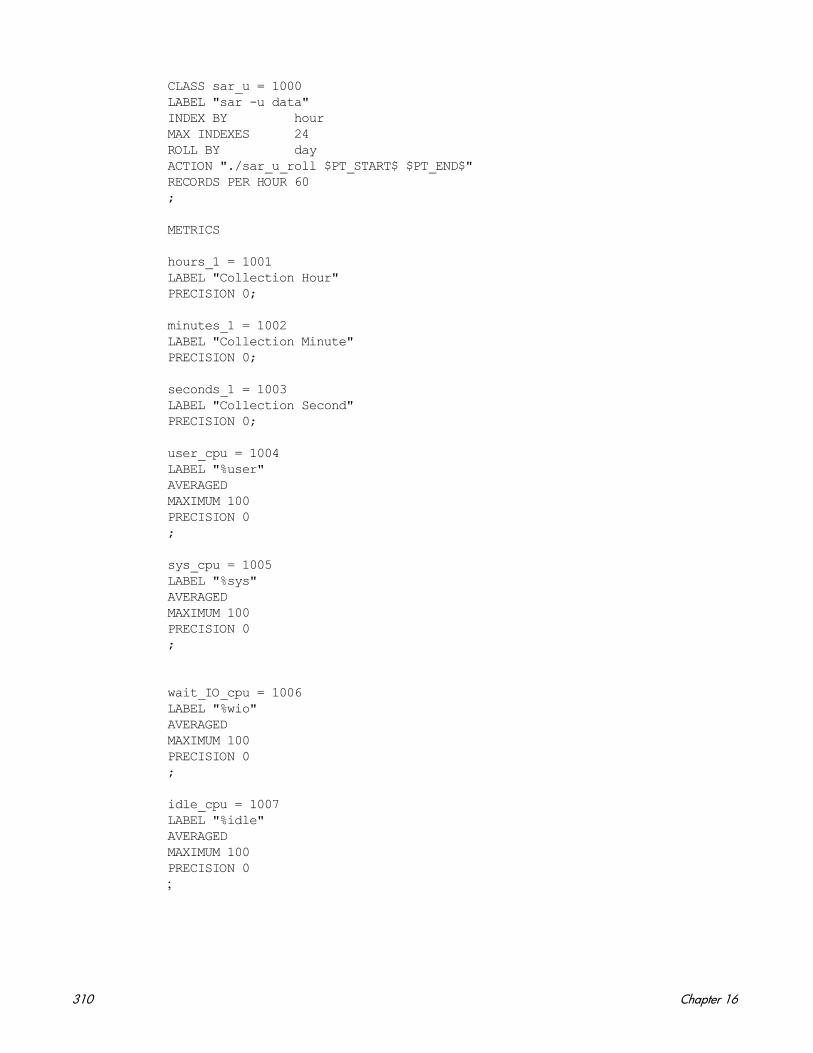
CLASS sar_u = 1000LABEL "sar -u data"INDEX BY hourMAX INDEXES 24ROLL BY dayACTION "./sar_u_roll $PT_START$ $PT_END$"RECORDS PER HOUR 60;
METRICS
hours_1 = 1001LABEL "Collection Hour"PRECISION 0;
minutes_1 = 1002LABEL "Collection Minute"PRECISION 0;
seconds_1 = 1003LABEL "Collection Second"PRECISION 0;
user_cpu = 1004LABEL "%user"AVERAGEDMAXIMUM 100PRECISION 0;
sys_cpu = 1005LABEL "%sys"AVERAGEDMAXIMUM 100PRECISION 0;
wait_IO_cpu = 1006LABEL "%wio"AVERAGEDMAXIMUM 100PRECISION 0;
idle_cpu = 1007LABEL "%idle"AVERAGEDMAXIMUM 100PRECISION 0;
310 Chapter 16

Compiling the Class Specification File
The next task is to compile the class specification file using the following command.
sdlcomp sar_u.spec sar_u_log
The output of the sar -u command is a system header line, a blank line, an option header line, and a data line consisting of a time stamp followed by the data we want to capture. The last line is the only line that is interesting. So, from the sar -u command, we need a mechanism to save only the last line of output and feed that data to DSI.
dsilog expects to receive data from stdin. To start the logging process, you could pipe output from the process you are using to dsilog. However, you can only have one pipe (|) in the command line. When two pipes are used, UNIX buffering retains the output from the first command until 8000 characters have been written before continuing to the second command and piping out to the log file. As a result, doing something like the following does not work:
sar -u 60 1 | tail -1 | dsilog
Therefore, we use a fifo as the input source for DSI. However, this is not without its problems.
Assume we were to use the following script:
#!/bin/ksh sar_u_feed
# sar_u_feed script that provides sar -u data to DSI via# a fifo(sar_u.fifo)
while : # (infinite loop)do
# specify a one minute interval using tail to extract the # last sar output record(contains the time stamp and data),# saving the data to a file.
/usr/bin/sar -u 60 1 2>/tmp/dsierr | tail -1 > /usr/tmp/sar_u_data
# Copy the sar data to the fifo that the dsilog process is # reading.
cat /usr/tmp/sar_u_data > ./sar_u.fifo
done
Unfortunately, this script will not produce the desired results if run as is. This is because the cat command opens the fifo, writes the data record, and then closes the fifo. The close indicates to dsilog that there is no more data to be written to the log, so dsilog writes this one data record and terminates. What is needed is a dummy process to “hold” the fifo open. Therefore, we need a dummy fifo and a process that opens the dummy fifo for input and the sar_u.fifo for output. This will hold the sar_u.fifo open, thereby preventing dsilog from terminating.
Examples of Data Source Integration 311
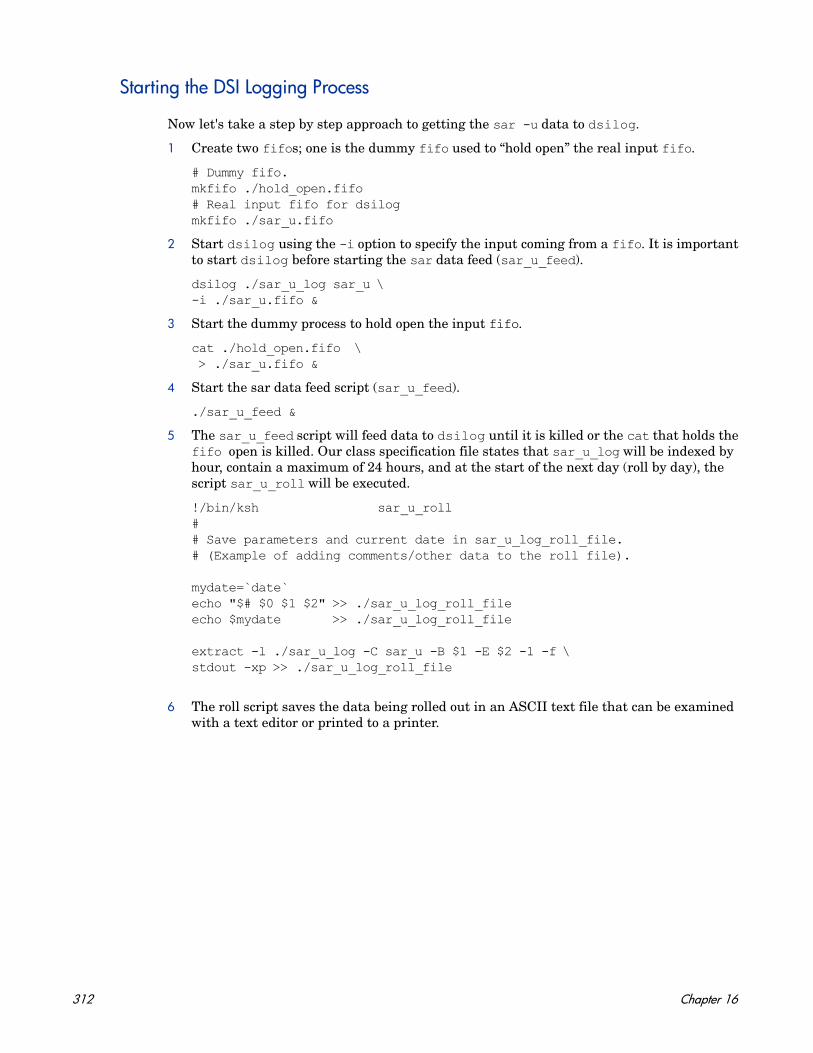
Starting the DSI Logging Process
Now let's take a step by step approach to getting the sar -u data to dsilog.
1 Create two fifos; one is the dummy fifo used to “hold open” the real input fifo.
# Dummy fifo.mkfifo ./hold_open.fifo# Real input fifo for dsilogmkfifo ./sar_u.fifo
2 Start dsilog using the -i option to specify the input coming from a fifo. It is important to start dsilog before starting the sar data feed (sar_u_feed).
dsilog ./sar_u_log sar_u \-i ./sar_u.fifo &
3 Start the dummy process to hold open the input fifo.
cat ./hold_open.fifo \ > ./sar_u.fifo &
4 Start the sar data feed script (sar_u_feed).
./sar_u_feed &
5 The sar_u_feed script will feed data to dsilog until it is killed or the cat that holds the fifo open is killed. Our class specification file states that sar_u_log will be indexed by hour, contain a maximum of 24 hours, and at the start of the next day (roll by day), the script sar_u_roll will be executed.
!/bin/ksh sar_u_roll## Save parameters and current date in sar_u_log_roll_file.# (Example of adding comments/other data to the roll file).
mydate=`date`echo "$# $0 $1 $2" >> ./sar_u_log_roll_fileecho $mydate >> ./sar_u_log_roll_file
extract -l ./sar_u_log -C sar_u -B $1 -E $2 -1 -f \ stdout -xp >> ./sar_u_log_roll_file
6 The roll script saves the data being rolled out in an ASCII text file that can be examined with a text editor or printed to a printer.
312 Chapter 16

Logging sar Data from Several Files
If you are interested in more than just CPU utilization, you can either have one class specification file that describes the data, or have a class specification file for each option and compile these into one log file set. The first example shows separate class specification files compiled into a single log file set.
In this example, we will monitor CPU utilization, buffer activity (sar -b), and system calls (sar -c). Logging data in this manner requires three class specification files, three dsilog processes, three dsilog input fifos, and three scripts to provide the sar data.
Creating Class Specification Files
The following are the class specification files for each of these options.
# sar_u_mc.spec## sar -u class definition for log files on HP systems.## ==> 1 minute data; max 24 hours; indexed by hour; roll by day#
CLASS sar_u = 1000LABEL "sar -u data"INDEX BY hourMAX INDEXES 24ROLL BY dayACTION "./sar_u_mc_roll $PT_START$ $PT_END$"RECORDS PER HOUR 60;
METRICS
hours_1 = 1001LABEL "Collection Hour"PRECISION 0;
minutes_1 = 1002LABEL "Collection Minute"PRECISION 0;
seconds_1 = 1003LABEL "Collection Second"PRECISION 0;user_cpu = 1004LABEL "%user"AVERAGEDMAXIMUM 100PRECISION 0;
Examples of Data Source Integration 313
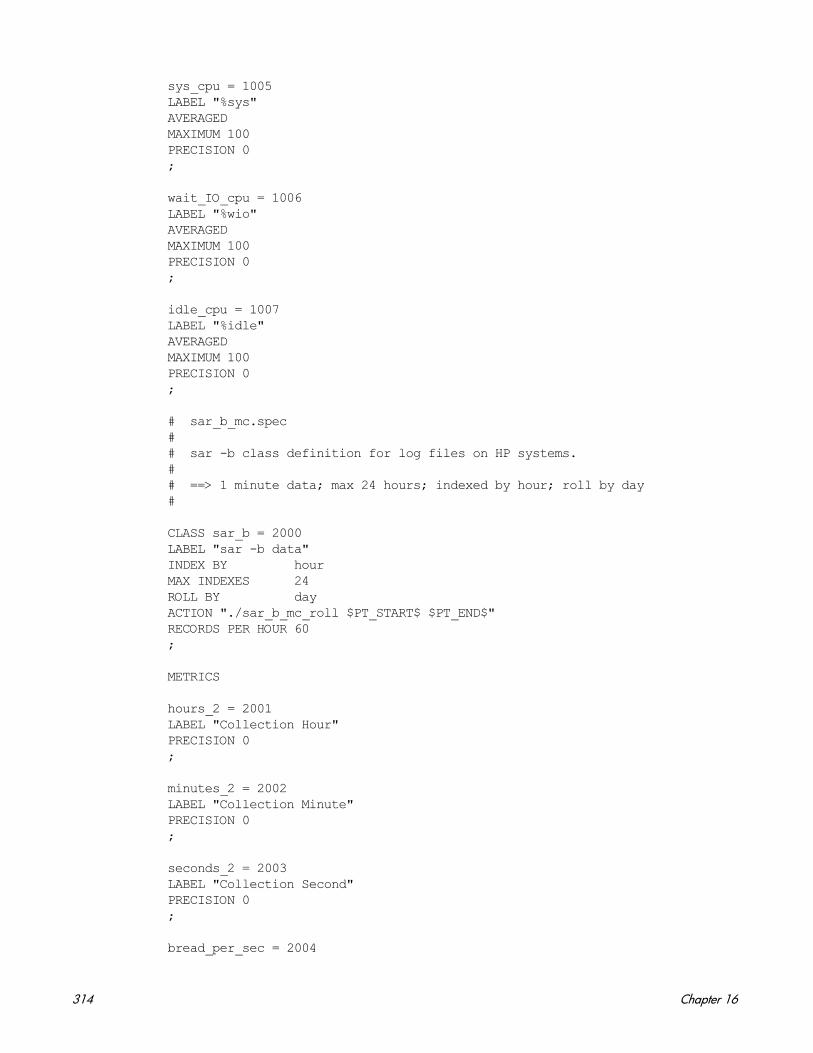
sys_cpu = 1005LABEL "%sys"AVERAGEDMAXIMUM 100PRECISION 0;
wait_IO_cpu = 1006LABEL "%wio"AVERAGEDMAXIMUM 100PRECISION 0;
idle_cpu = 1007LABEL "%idle"AVERAGEDMAXIMUM 100PRECISION 0;
# sar_b_mc.spec## sar -b class definition for log files on HP systems.## ==> 1 minute data; max 24 hours; indexed by hour; roll by day#
CLASS sar_b = 2000LABEL "sar -b data"INDEX BY hourMAX INDEXES 24ROLL BY dayACTION "./sar_b_mc_roll $PT_START$ $PT_END$"RECORDS PER HOUR 60;
METRICS
hours_2 = 2001LABEL "Collection Hour"PRECISION 0;
minutes_2 = 2002LABEL "Collection Minute"PRECISION 0;
seconds_2 = 2003LABEL "Collection Second"PRECISION 0;
bread_per_sec = 2004
314 Chapter 16
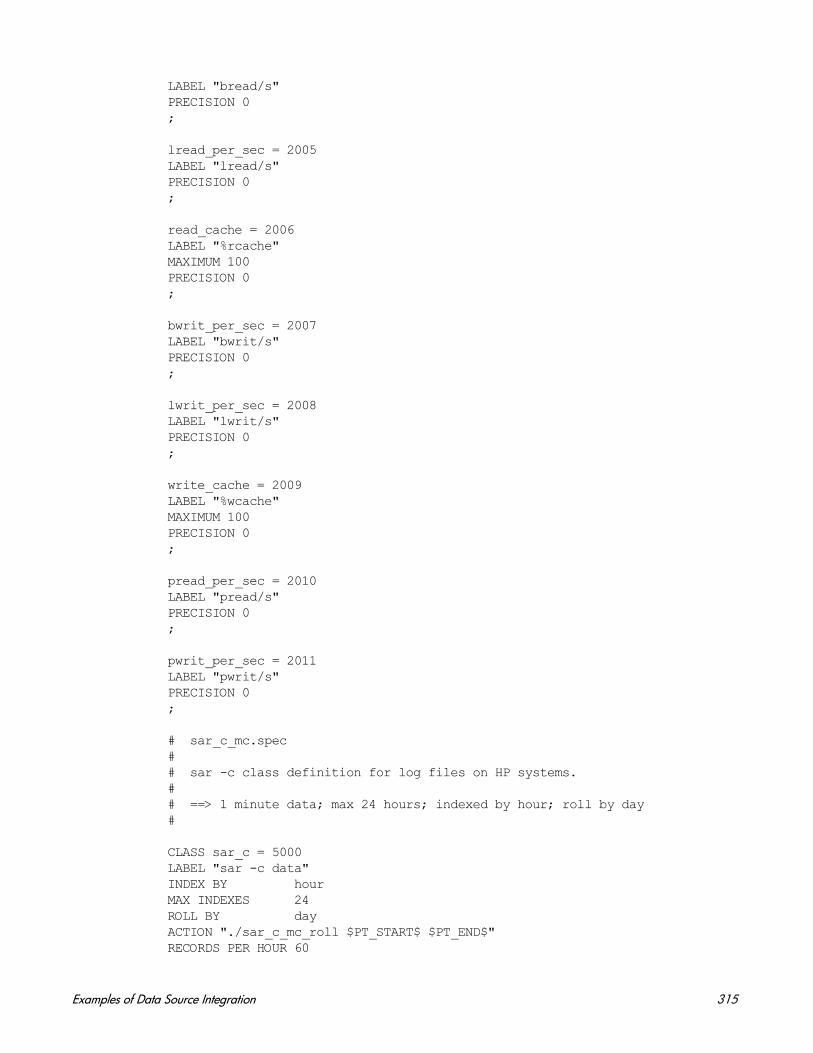
LABEL "bread/s"PRECISION 0;
lread_per_sec = 2005LABEL "lread/s"PRECISION 0;
read_cache = 2006LABEL "%rcache"MAXIMUM 100PRECISION 0;
bwrit_per_sec = 2007LABEL "bwrit/s"PRECISION 0;
lwrit_per_sec = 2008LABEL "lwrit/s"PRECISION 0;
write_cache = 2009LABEL "%wcache"MAXIMUM 100PRECISION 0;
pread_per_sec = 2010LABEL "pread/s"PRECISION 0;
pwrit_per_sec = 2011LABEL "pwrit/s"PRECISION 0;
# sar_c_mc.spec## sar -c class definition for log files on HP systems.## ==> 1 minute data; max 24 hours; indexed by hour; roll by day#
CLASS sar_c = 5000LABEL "sar -c data"INDEX BY hourMAX INDEXES 24ROLL BY dayACTION "./sar_c_mc_roll $PT_START$ $PT_END$"RECORDS PER HOUR 60
Examples of Data Source Integration 315

;
METRICS
hours_5 = 5001LABEL "Collection Hour"PRECISION 0;
minutes_5 = 5002LABEL "Collection Minute"PRECISION 0;
seconds_5 = 5003LABEL "Collection Second"PRECISION 0;
scall_per_sec = 5004LABEL "scall/s"PRECISION 0;
sread_per_sec = 5005LABEL "sread/s"PRECISION 0;
swrit_per_sec = 5006LABEL "swrit/s"PRECISION 0;
fork_per_sec = 5007LABEL "fork/s"PRECISION 2;
exec_per_sec = 5008LABEL "exec/s"PRECISION 2;
rchar_per_sec = 5009LABEL "rchar"PRECISION 0;
wchar_per_sec = 5010LABEL "wchar/s"PRECISION 0;
316 Chapter 16

The following are the two additional scripts that are needed to supply the sar data.
#!/bin/ksh
# sar_b_feed script that provides sar -b data to DSI via# a fifo (sar_b.fifo)
while : # (infinite loop)do
# specify a one minute interval using tail to extract the # last sar output record(contains the time stamp and data), # saving the data to a file.
/usr/bin/sar -b 60 1 2>/tmp/dsierr | tail -1 &> \/usr/tmp/sar_b_data
# Copy the sar data to the fifo that the dsilog process is reading.
cat /usr/tmp/sar_b_data > ./sar_b.fifo
done
#!/bin/ksh sar_c_feed
# sar_c_feed script that provides sar -c data to DSI via# a fifo(sar_c.fifo)
while : # (infinite loop)do
# specify a one minute interval using tail to extract the # last sar output record(contains the time stamp and data), # saving the data to a file.
/usr/bin/sar -c 60 1 2>/tmp/dsierr | tail -1 > /usr/tmp/sar_c_data
# Copy the sar data to the fifo that the dsilog process is reading.
cat /usr/tmp/sar_c_data > ./sar_c.fifo
done
Compiling the Class Specification Files
Compile the three specification files into one log file set:
sdlcomp ./sar_u_mc.spec sar_mc_logsdlcomp ./sar_b_mc.spec sar_mc_logsdlcomp ./sar_c_mc.spec sar_mc_log
Examples of Data Source Integration 317
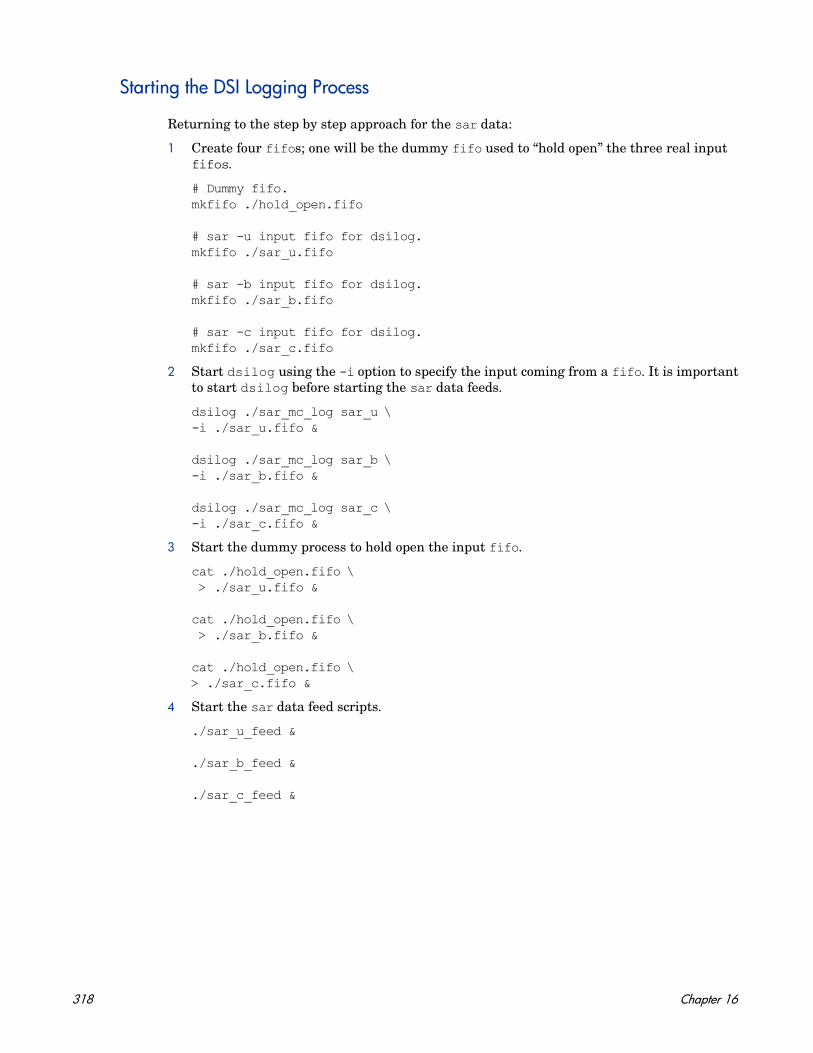
Starting the DSI Logging Process
Returning to the step by step approach for the sar data:
1 Create four fifos; one will be the dummy fifo used to “hold open” the three real input fifos.
# Dummy fifo.mkfifo ./hold_open.fifo
# sar -u input fifo for dsilog.mkfifo ./sar_u.fifo
# sar -b input fifo for dsilog.mkfifo ./sar_b.fifo
# sar -c input fifo for dsilog.mkfifo ./sar_c.fifo
2 Start dsilog using the -i option to specify the input coming from a fifo. It is important to start dsilog before starting the sar data feeds.
dsilog ./sar_mc_log sar_u \-i ./sar_u.fifo &
dsilog ./sar_mc_log sar_b \-i ./sar_b.fifo &
dsilog ./sar_mc_log sar_c \-i ./sar_c.fifo &
3 Start the dummy process to hold open the input fifo.
cat ./hold_open.fifo \ > ./sar_u.fifo &
cat ./hold_open.fifo \ > ./sar_b.fifo &
cat ./hold_open.fifo \> ./sar_c.fifo &
4 Start the sar data feed scripts.
./sar_u_feed &
./sar_b_feed &
./sar_c_feed &
318 Chapter 16

Logging sar Data for Several Options
The last example for using sar to supply data to DSI uses one specification file to define the data from several sar options (ubycwavm).
# sar_ubycwavm.spec## sar -ubycwavm class definition for HP systems.## ==> 1 minute data; max 24 hours; indexed by hour; roll by day#
CLASS sar_ubycwavm = 1000LABEL "sar -ubycwavm data"INDEX BY hourMAX INDEXES 24ROLL BY dayACTION "./sar_ubycwavm_roll $PT_START$ $PT_END$"RECORDS PER HOUR 60;
METRICShours = 1001LABEL "Collection Hour"PRECISION 0;
minutes = 1002LABEL "Collection Minute"PRECISION 0;
seconds = 1003LABEL "Collection Second"PRECISION 0;
user_cpu = 1004LABEL "%user"AVERAGEDMAXIMUM 100PRECISION 0;
sys_cpu = 1005LABEL "%sys"AVERAGEDMAXIMUM 100PRECISION 0;
wait_IO_cpu = 1006LABEL "%wio"AVERAGEDMAXIMUM 100PRECISION 0;
Examples of Data Source Integration 319
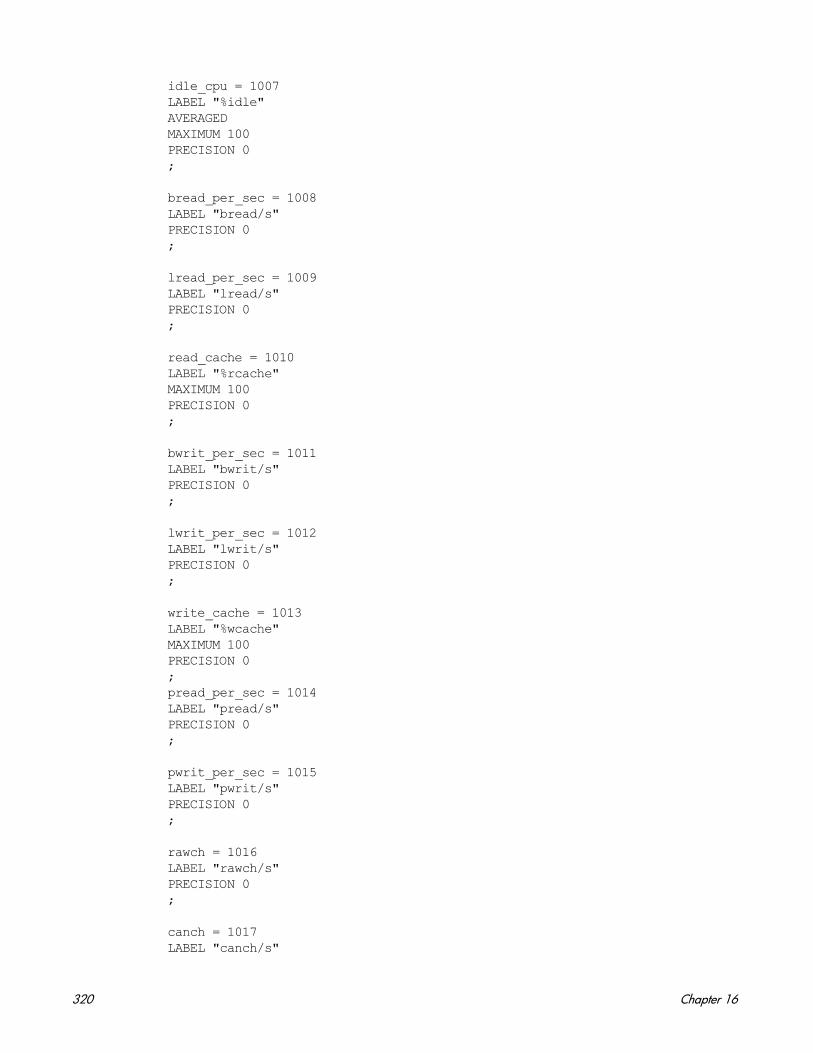
idle_cpu = 1007LABEL "%idle"AVERAGEDMAXIMUM 100PRECISION 0;
bread_per_sec = 1008LABEL "bread/s"PRECISION 0;
lread_per_sec = 1009LABEL "lread/s"PRECISION 0;
read_cache = 1010LABEL "%rcache"MAXIMUM 100PRECISION 0;
bwrit_per_sec = 1011LABEL "bwrit/s"PRECISION 0;
lwrit_per_sec = 1012LABEL "lwrit/s"PRECISION 0;
write_cache = 1013LABEL "%wcache"MAXIMUM 100PRECISION 0;pread_per_sec = 1014LABEL "pread/s"PRECISION 0;
pwrit_per_sec = 1015LABEL "pwrit/s"PRECISION 0;
rawch = 1016LABEL "rawch/s"PRECISION 0;
canch = 1017LABEL "canch/s"
320 Chapter 16

PRECISION 0;
outch = 1018LABEL "outch/s"PRECISION 0;
rcvin = 1019LABEL "rcvin/s"PRECISION 0;
xmtin = 1020LABEL "xmtin/s"PRECISION 0;
mdmin = 1021LABEL "mdmin/s"PRECISION 0;
scall_per_sec = 1022LABEL "scall/s"PRECISION 0;
sread_per_sec = 1023LABEL "sread/s"PRECISION 0;
swrit_per_sec = 1024LABEL "swrit/s"PRECISION 0;
fork_per_sec = 1025LABEL "fork/s"PRECISION 2;
exec_per_sec = 1026LABEL "exec/s"PRECISION 2;
rchar_per_sec = 1027LABEL "rchar/s"PRECISION 0;
wchar_per_sec = 1028LABEL "wchar/s"
Examples of Data Source Integration 321
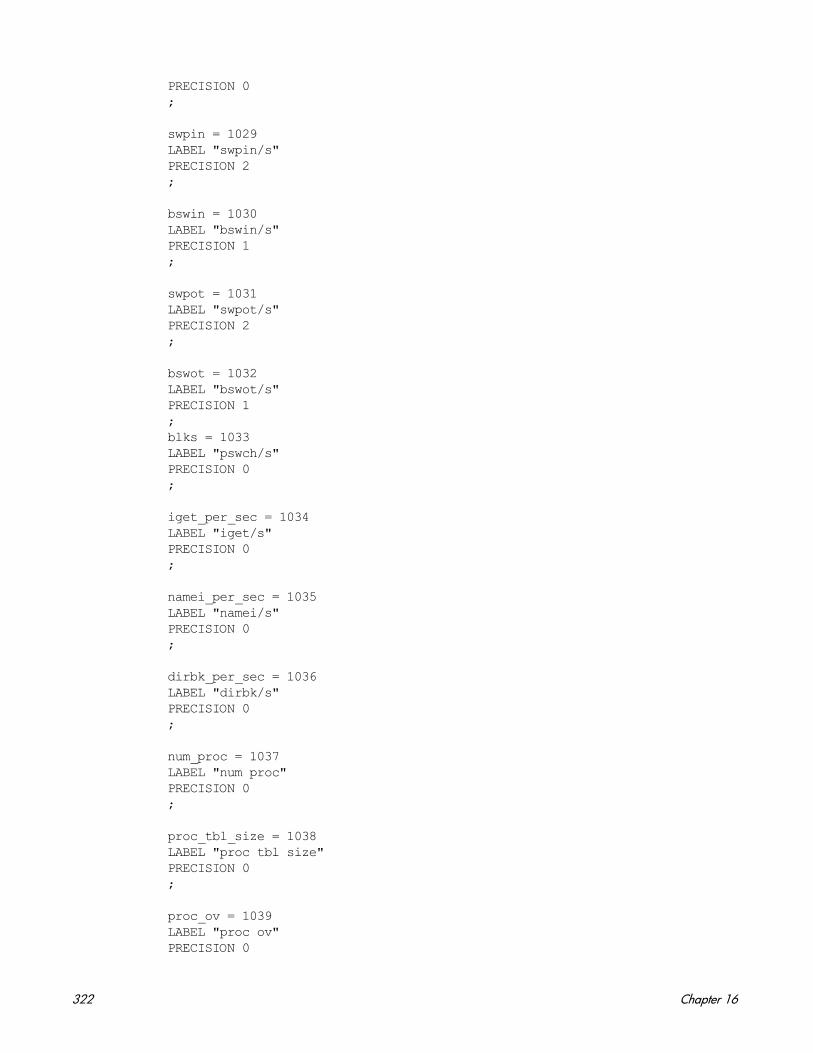
PRECISION 0;
swpin = 1029LABEL "swpin/s"PRECISION 2;
bswin = 1030LABEL "bswin/s"PRECISION 1;
swpot = 1031LABEL "swpot/s"PRECISION 2;
bswot = 1032LABEL "bswot/s"PRECISION 1;blks = 1033LABEL "pswch/s"PRECISION 0;
iget_per_sec = 1034LABEL "iget/s"PRECISION 0;
namei_per_sec = 1035LABEL "namei/s"PRECISION 0;
dirbk_per_sec = 1036LABEL "dirbk/s"PRECISION 0;
num_proc = 1037LABEL "num proc"PRECISION 0;
proc_tbl_size = 1038LABEL "proc tbl size"PRECISION 0;
proc_ov = 1039LABEL "proc ov"PRECISION 0
322 Chapter 16
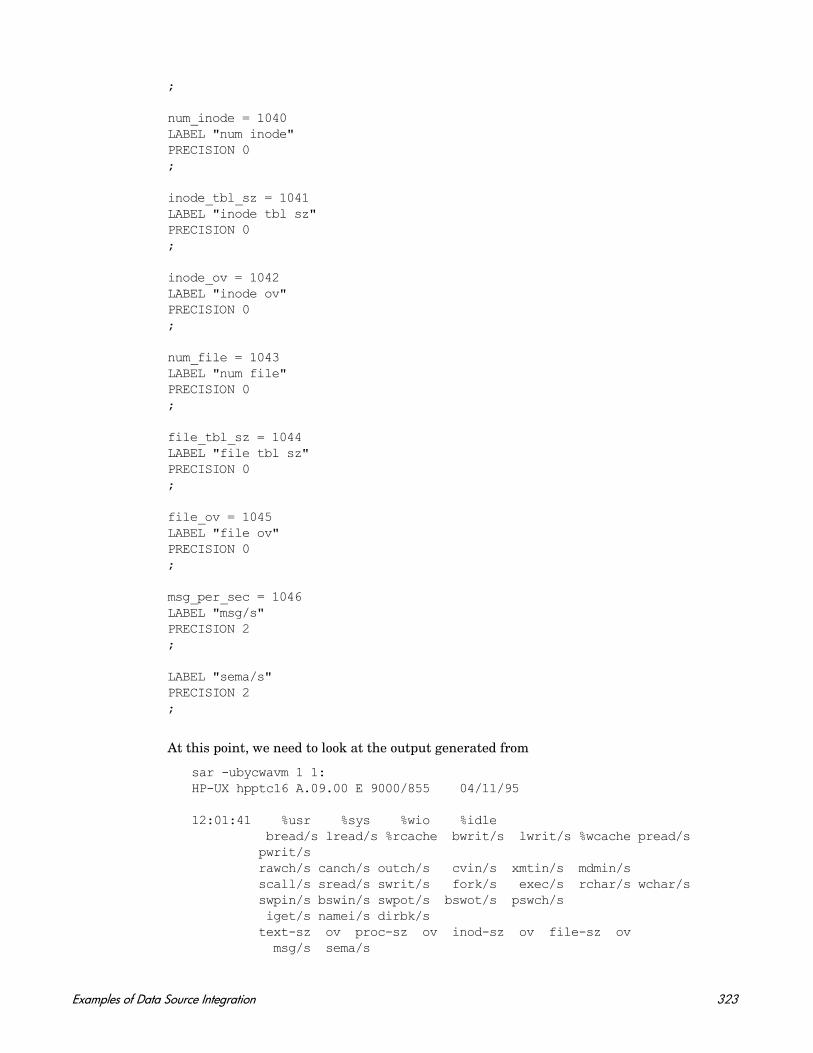
;
num_inode = 1040LABEL "num inode"PRECISION 0;
inode_tbl_sz = 1041LABEL "inode tbl sz"PRECISION 0;
inode_ov = 1042LABEL "inode ov"PRECISION 0;
num_file = 1043LABEL "num file"PRECISION 0;
file_tbl_sz = 1044LABEL "file tbl sz"PRECISION 0;
file_ov = 1045LABEL "file ov"PRECISION 0;
msg_per_sec = 1046LABEL "msg/s"PRECISION 2;
LABEL "sema/s"PRECISION 2;
At this point, we need to look at the output generated from
sar -ubycwavm 1 1:HP-UX hpptc16 A.09.00 E 9000/855 04/11/95
12:01:41 %usr %sys %wio %idle bread/s lread/s %rcache bwrit/s lwrit/s %wcache pread/s
pwrit/srawch/s canch/s outch/s cvin/s xmtin/s mdmin/s
scall/s sread/s swrit/s fork/s exec/s rchar/s wchar/s swpin/s bswin/s swpot/s bswot/s pswch/s iget/s namei/s dirbk/s text-sz ov proc-sz ov inod-sz ov file-sz ov msg/s sema/s
Examples of Data Source Integration 323
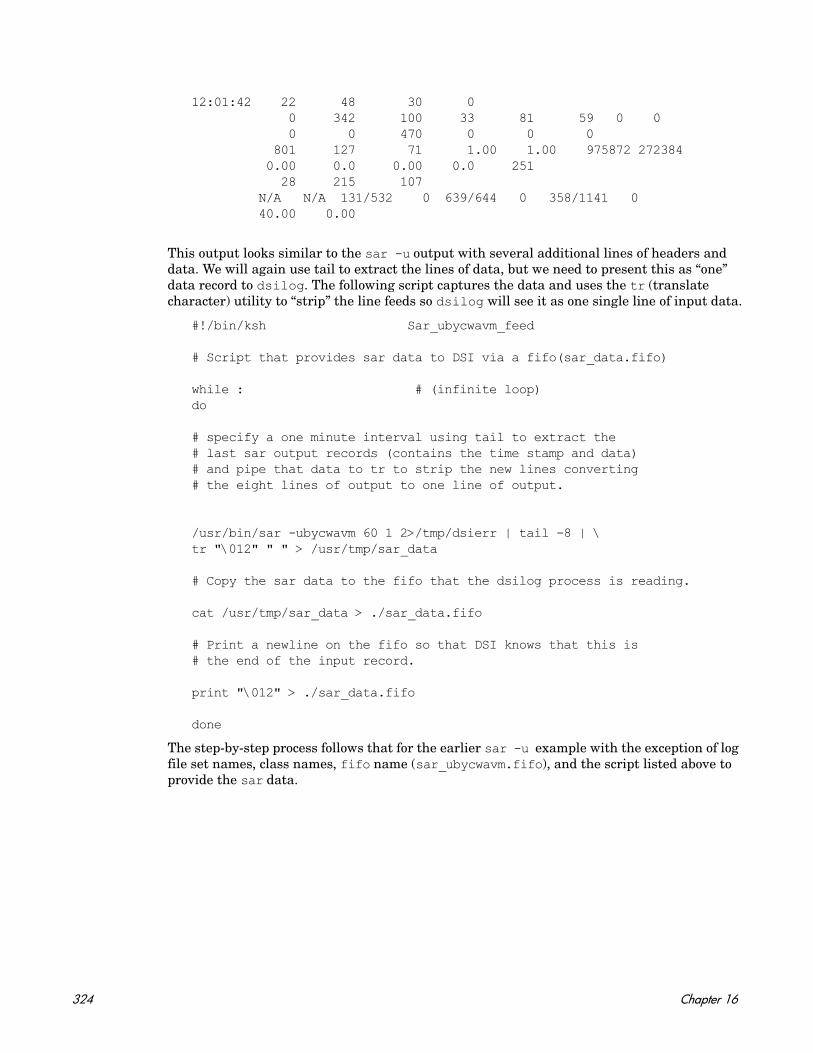
12:01:42 22 48 30 0 0 342 100 33 81 59 0 00 0 470 0 0 0
801 127 71 1.00 1.00 975872 2723840.00 0.0 0.00 0.0 251
28 215 107 N/A N/A 131/532 0 639/644 0 358/1141 0
40.00 0.00
This output looks similar to the sar -u output with several additional lines of headers and data. We will again use tail to extract the lines of data, but we need to present this as “one” data record to dsilog. The following script captures the data and uses the tr (translate character) utility to “strip” the line feeds so dsilog will see it as one single line of input data.
#!/bin/ksh Sar_ubycwavm_feed
# Script that provides sar data to DSI via a fifo(sar_data.fifo)
while : # (infinite loop)do
# specify a one minute interval using tail to extract the # last sar output records (contains the time stamp and data) # and pipe that data to tr to strip the new lines converting # the eight lines of output to one line of output.
/usr/bin/sar -ubycwavm 60 1 2>/tmp/dsierr | tail -8 | \tr "\012" " " > /usr/tmp/sar_data
# Copy the sar data to the fifo that the dsilog process is reading.
cat /usr/tmp/sar_data > ./sar_data.fifo
# Print a newline on the fifo so that DSI knows that this is # the end of the input record.
print "\012" > ./sar_data.fifo
done
The step-by-step process follows that for the earlier sar -u example with the exception of log file set names, class names, fifo name (sar_ubycwavm.fifo), and the script listed above to provide the sar data.
324 Chapter 16
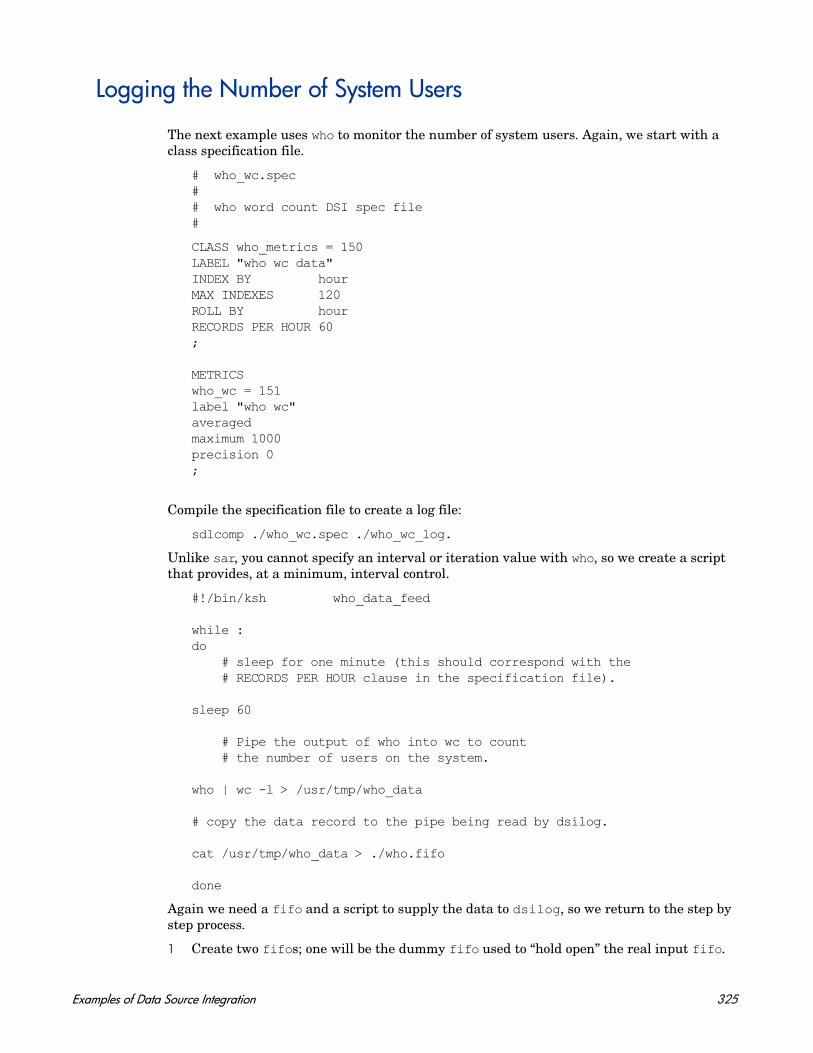
Logging the Number of System Users
The next example uses who to monitor the number of system users. Again, we start with a class specification file.
# who_wc.spec## who word count DSI spec file#
CLASS who_metrics = 150LABEL "who wc data"INDEX BY hourMAX INDEXES 120ROLL BY hourRECORDS PER HOUR 60;
METRICSwho_wc = 151label "who wc"averagedmaximum 1000precision 0;
Compile the specification file to create a log file:
sdlcomp ./who_wc.spec ./who_wc_log.
Unlike sar, you cannot specify an interval or iteration value with who, so we create a script that provides, at a minimum, interval control.
#!/bin/ksh who_data_feed
while :do # sleep for one minute (this should correspond with the # RECORDS PER HOUR clause in the specification file).
sleep 60
# Pipe the output of who into wc to count # the number of users on the system.
who | wc -l > /usr/tmp/who_data
# copy the data record to the pipe being read by dsilog.
cat /usr/tmp/who_data > ./who.fifo
done
Again we need a fifo and a script to supply the data to dsilog, so we return to the step by step process.
1 Create two fifos; one will be the dummy fifo used to “hold open” the real input fifo.
Examples of Data Source Integration 325
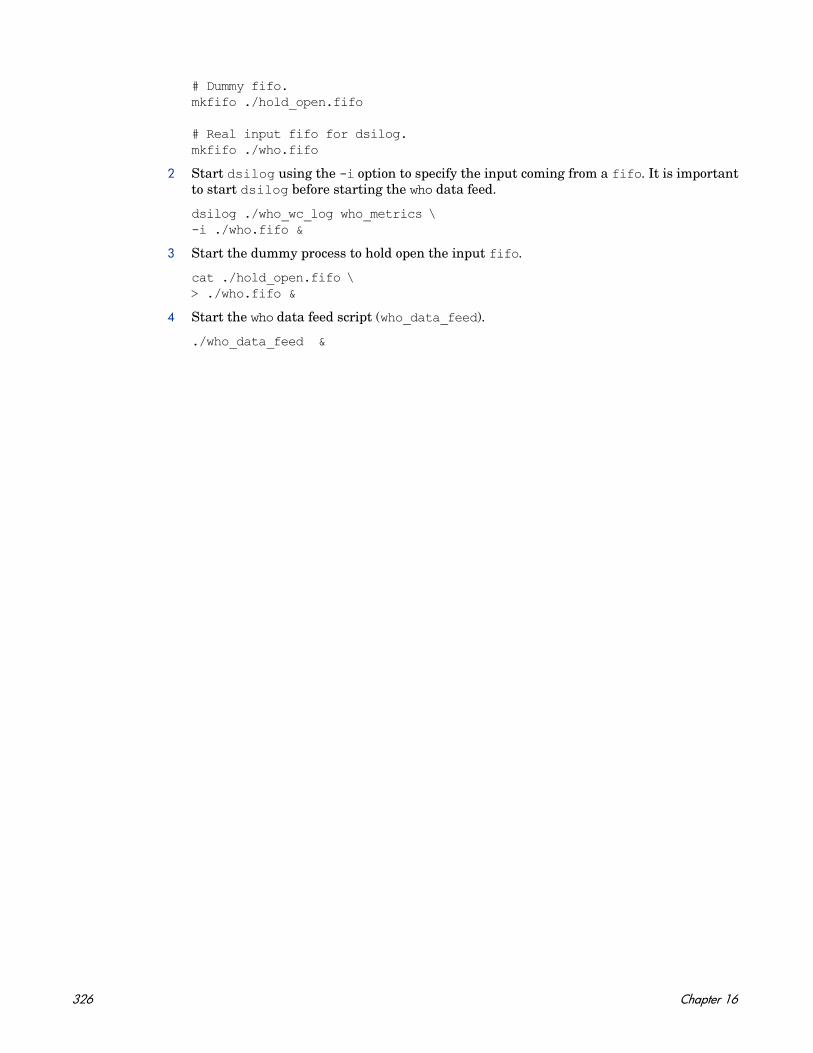
# Dummy fifo.mkfifo ./hold_open.fifo
# Real input fifo for dsilog.mkfifo ./who.fifo
2 Start dsilog using the -i option to specify the input coming from a fifo. It is important to start dsilog before starting the who data feed.
dsilog ./who_wc_log who_metrics \-i ./who.fifo &
3 Start the dummy process to hold open the input fifo.
cat ./hold_open.fifo \> ./who.fifo &
4 Start the who data feed script (who_data_feed).
./who_data_feed &
326 Chapter 16

17 Error Message
There are three types of DSI error messages: class specification, dsilog logging process, and general.
• Class specification error messages format consists of the prefix SDL, followed by the message number.
• dsilog logging process messages format consists of the prefix DSILOG, followed by the message number.
• General error messages can be generated by either of the above as well as other tasks. These messages have a minus sign (-) prefix and the message number.
DSI error messages are listed in this chapter. SDL and DSILOG error messages are listed in numeric order, along with the actions you take to recover from the error condition. General error messages are self-explanatory, so no recovery actions are given.
SDL Error Messages
SDL error messages are Self Describing Logfile class specification error messages, with the format, SDL<message number>.
Message SDL1
ERROR: Expected equal sign, “=”.
An “=” was expected here.
Action: See Class Specification Syntax in Chapter 14 for more information.
Message SDL2
ERROR: Expected semi-colon, “;”.
A semi-colon (;) marks the end of the class specification and the end of each metric specification. You may also see this message if an incorrect or misspelled word is found where a semi-colon should have been.
For example: If you enter
class xxxxx = 10 label "this is a test" metric 1000;
instead of
class xxxxx = 10 label "this is a test" capacity 1000;
you would see this error message and it would point to the word “metric.”
327
Action: See Class Specification Syntax in Chapter 14 for more information.
Message SDL3
ERROR: Precision must be one of {0, 1, 2, 3, 4, 5}
Precision determines the number of decimal places used when converting numbers internally to integers and back to numeric representations of the metric value.
Action: See PRECISION in Chapter 14 for more information.
Message SDL4
ERROR: Expected quoted string.
A string of text was expected.
Action: See Class Specification Syntax in Chapter 14 for more information.
Message SDL5
ERROR: Unterminated string.
The string must end in double quotes.
Action: See Class Specification Syntax in Chapter 14 for more information.
Message SDL6
NOTE: Time stamp inserted at first metric by default.
A timestamp metric is automatically inserted as the first metric in each class.
Action: See Class Specification Syntax in Chapter 14 for more information.
Message SDL7
ERROR: Expected metric description.
The metrics section must start with the METRICS keyword before the first metric definition.
Action: See Class Specification Syntax in Chapter 14 for more information.
Message SDL8
ERROR: Expected data class specification.
The class section of the class specification must start with the CLASS keyword.
Action: See Class Specification Syntax in Chapter 14 for more information.
Message SDL9
ERROR: Expected identifier.
An identifier for either the metric or class was expected. The identifier must start with an alphabetic character, can contain alphanumeric characters or underscores, and is not case-sensitive.
Action: See Class Specification Syntax in Chapter 14 for more information.
Message SDL10
ERROR: Expected positive integer.
328 Chapter 17
Number form is incorrect.
Action: Enter numbers as positive integers only.
Message SDL13
ERROR: Expected specification for maximum number of indexes.
The maximum number of indexes is required to calculate class capacity.
Action: See Class Specification Syntax in Chapter 14 for more information.
Message SDL14
ERROR: Syntax Error.
The syntax you entered is incorrect.
Action: Check the syntax and make corrections as needed. See Class Specification Syntax in Chapter 14 for more information.
Message SDL15
ERROR: Expected metric description.
A metric description is missing.
Action: Enter a metric description to define the individual data items for the class. See Class Specification Syntax in Chapter 14 for more information.
Message SDL16
ERROR: Expected metric type.
Each metric must have a metric_name and a numeric metric_id.
Action: See Metrics Descriptions in Chapter 14 for more information.
Message SDL17
ERROR: Time stamp metric attributes may not be changed.
A timestamp metric is automatically inserted as the first metric in each class. You can change the position of the timestamp, or eliminate it and use a UNIX timestamp.
Action: See Metrics Descriptions in Chapter 14 for more information.
Message SDL18
ERROR: Roll action limited to 199 characters.
The upper limit for ROLL BY action is 199 characters.
Action: See INDEX BY, MAX INDEXES, AND ROLL BY in Chapter 14 for more information.
Message SDL19
ERROR: Could not open specification file (file).
In the command line sdlcomp specification_file, the specification file could not be opened. The error follows in the next line as in:
$/usr/perf/bin/sdlcomp /xxxERROR: Could not open specification file /xxx.
Error Message 329

Action: Verify that the file is readable. If it is, verify the name of the file and that is was entered correctly.
MessageSDL20
ERROR: Metric descriptions not found.
Metric description is incorrectly formatted.
Action: Make sure you begin the metrics section of the class statement with the METRICS keyword. See Metrics Descriptions in Chapter 14 for more information.
Message SDL21
ERROR: Expected metric name to begin metric description.
Metric name may be missing or metric description is incorrectly formatted.
Action: Metric name may be missing or metric description is incorrectly formatted.
Message SDL24
ERROR: Expected MAX INDEXES specification.
A MAX INDEXES value is required when you specify INDEX BY.
Action: Enter the required value. See INDEX BY, MAX INDEXES, AND ROLL BY in Chapter 14 for more information.
Message SDL25
ERROR: Expected index SPAN specification.
A value is missing for INDEX BY.
Action: Enter a qualifier when you specify INDEX BY. See INDEX BY, MAX INDEXES, AND ROLL BY in Chapter 14 for more information.
Message SDL26
ERROR: Minimum must be zero.
The number must be zero or greater.
Message SDL27
Expected positive integer.
A positive value is missing.
Action: Enter numbers as positive integers only.
Message SDL29
ERROR: Summarization metric does not exist.
You used SUMMARIZED BY for the summarization method, but did not specify a metric_name.
Action: See Metrics Descriptions in Chapter 14 for more information.
Message SDL30
ERROR: Expected 'HOUR', 'DAY', or 'MONTH'.
A qualifier for the entry is missing.
330 Chapter 17

Action: You must enter one of these qualifiers. See INDEX BY, MAX INDEXES, AND ROLL BY in Chapter 14 for more information.
Message SDL33
ERROR: Class id number must be between 1 and 999999.
The class-id must be numeric and can contain up to 6 digits.
Action: Enter a class ID number for the class that does not exceed the six-digit maximum. See Class Specification Syntax in Chapter 14 for more information.
Message SDL35
ERROR: Found more than one index/capacity statement.
You can only have one INDEX BY or CAPACITY statement per CLASS section.
Action: Complete the entries according to the formatting restrictions in Class Specification Syntax in Chapter 14.
Message SDL36
ERROR: Found more than one metric type statement.
You can have only one METRICS keyword for each metric definition.
Action: See Metrics Descriptions in Chapter 14 for formatting information.
Message SDL37
ERROR: Found more than one metric maximum statement.
You can have only one MAXIMUM statement for each metric definition.
Action: See Metrics Descriptions in Chapter 14 for formatting information.
Message SDL39
ERROR: Found more than one metric summarization specification.
You can have only one summarization method (TOTALED, AVERAGED, or SUMMARIZED BY) for each metric definition.
Action: See Summarization Method in Chapter 14 for more information.
Message SDL40
ERROR: Found more than one label statement.
You can have only one LABEL for each metric or class definition.
Action: See Class Specification Syntax in Chapter 14 for more information.
Message SDL42
ERROR: Found more than one metric precision statement.
You can have only one PRECISION statement for each metric definition.
Action: See the PRECISION in Chapter 14 for more information.
Error Message 331

Message SDL44
ERROR: SCALE, MINIMUM, MAXIMUM, (summarization) are inconsistent with text metrics
These elements of the class specification syntax are only valid for numeric metrics.
Action: See Class Specification Syntax in Chapter 14 for more information.
Message SDL46
ERROR: Inappropriate summarization metric (!).
You cannot summarize by the timestamp metric.
Action: See Class Specification Syntax in Chapter 14 for more information.
Message SDL47
ERROR: Expected metric name.
Each METRICS statement must include a metric_name.
Action: See Metrics Descriptions in Chapter 14 for more information.
Message SDL47
ERROR: Expected metric name.
Each METRICS statement must include a metric_name.
Action: See Metrics Descriptions in Chapter 14 for more information.
Message SDL48
ERROR: Expected positive integer.
The CAPACITY statement requires a positive integer.
Action: See CAPACITY in Chapter 14 for more information.
Message SDL49
ERROR: Expected metric specification statement.
The METRICS keyword must precede the first metric definition.
Action: See Metrics Descriptions in Chapter 14 for more information.
Message SDL50
Object name too long.
The metric_name or class_name can only have up to 20 characters.
Action: See Class Specification Syntax in Chapter 14 for more information.
Message SDL51
ERROR: Label too long (max 20 chars).
The class_label or metric_label can only have up to 20 characters.
Action: See Class Specification Syntax in Chapter 14 for more information.
332 Chapter 17
Message SDL53
ERROR: Metric must be between 1 and 999999.
The metric_id can contain up to 6 digits only.
Action: See Metrics Descriptions in Chapter 14 for more information.
Message SDL54
ERROR: Found more than one collection rate statement.
You can have only one RECORDS PER HOUR statement for each class description.
Action: See RECORDS PER HOUR in Chapter 14 for more information.
Message SDL55
ERROR: Found more than one roll action statement.
You can have only one ROLL BY statement for each class specification.
Action: See INDEX BY, MAX INDEXES, AND ROLL BY in Chapter 14 for more information.
Message SDL56
ERROR: ROLL BY option cannot be specified without INDEX BY option.
The ROLL BY statement must be preceded by an INDEX BY statement.
Action: See INDEX BY, MAX INDEXES, AND ROLL BY in Chapter 14 for more information.
Message SDL57
ERROR: ROLL BY must specify time equal to or greater than INDEX BY.
Because the roll interval depends on the index interval to identify the data to discard, the ROLL BY time must be greater than or equal to the INDEX BY time.
Action: See INDEX BY, MAX INDEXES, AND ROLL BY in Chapter 14 for more information.
Message SDL58
ERROR: Metric cannot be used to summarize itself.
The SUMMARIZED BY metric cannot be the same as the metric_name.
Action: See Class Specification Syntax in Chapter 14 for more information.
Message SDL62
ERROR: Could not open SDL (name).
Explanatory messages follow this error. It could be a file system error as in:
$/usr/perf/bin/sdlutil xxxxx –classesERROR: Could not open SDL xxxxx.ERROR: Could not open log file set.
or it could be an internal error as in:
$/usr/perf/bin/sdlutil xxxxx –classesERROR: Could not open SDL xxxxx.ERROR: File is not SDL root file or thedescription file is not accessible.
Error Message 333
You might also see this error if the log file has been moved. Because the path name information is stored in the DSI log files, the log files cannot be moved to different directories.
Action: If the above description or the follow-up messages do not point to some obvious problem, use sdlutil to remove the log file set and rebuild it.
Message SDL63
ERROR: Some files in log file set (name) are missing.
The list of files that make up the log file set was checked and one or more files needed for successful operation were not found.
Action: Unless you know precisely what happened, the best action is to use sdlutil to remove the log file set and start over.
Message SDL66
ERROR: Could not open class (name).
An explanatory message will follow.
Action: Unless it is obvious what the problem is, use sdlutil to remove the log file set and start over.
Message SDL67
ERROR: Add class failure.
Explanatory messages will follow.
The compiler could not add the new class to the log file set.
Action: If all the correct classes in the log file set are accessible, specify a new or different log file set. If they are not, use sdlutil to remove the log file set and start over.
Message SDL72
ERROR: Could not open export files (name).
The file to which the exported data was supposed to be written couldn't be opened.
Action: Check to see if the export file path exists and what permissions it has.
Message SDL73
ERROR: Could not remove shared memory ID (name).
An explanatory message will follow.
Action: To remove the shared memory ID, you must either be the user who created the log file set or the root user. Use the UNIX command ipcrm -m id to remove the shared memory ID.
Message SDL74
ERROR: Not all files could be removed.
All the files in the log file set could not be removed.
Explanatory messages will follow.
Action: Do the following to list the files and shared memory ID:
sdlutil (logfile set) -filessdlutil (logfile set) -id
334 Chapter 17
To remove the files, use the UNIX command rm filename. To remove the shared memory ID, use the UNIX command ipcrm -m id. Note that the shared memory ID will only exist and need to be deleted if sdlutil did not properly delete it when the log file set was closed.
Message SDL80
ERROR: Summarization metric (metric) not found in class.
The SUMMARIZED BY metric was not previously defined in the METRIC section.
Action: See Metrics Descriptions in Chapter 14 for more information.
Message SDL81
ERROR: Metric id (id) already defined in SDL.
The metric_id only needs to be defined once. To reuse a metric definition that has already been defined in another class, specify just the metric_name without the metric_id or any other specifications.
Action: See METRICS in Chapter 14 for more information.
Message SDL82
ERROR: Metric name (name) already defined in SDL.
The metric_name only needs to be defined once. To reuse a metric definition that has already been defined in another class, specify just the metric_name without the metric_id or any other specifications.
Action: See METRICS in Chapter 14 for more information.
Message SDL83
ERROR: Class id (id) already defined in SDL.
The class_id only needs to be defined once. Check the spelling to be sure you have entered it correctly.
Action: See Class Specification Syntax in Chapter 14 for more information.
Message SDL84
ERROR: Class name (name) already defined in SDL.
The class_name only needs to be defined once. Check the spelling to be sure you have entered it correctly.
Action: See Class Specification Syntax in Chapter 14 for more information.
Message SDL85
ERROR: Must specify class to de-compile.
You must specify a class list when you use -decomp.
Action: See Managing Data With sdlutil in Chapter 15 for more information.
Message SDL87
ERROR: You must specify maximum number of classes with -maxclass.
When you use the -maxclass option, you must specify the maximum number of classes to be provided for when creating a new log file set.
Error Message 335
Action: See sdlcomp Compiler in Chapter 15 for more information.
Message SDL88
ERROR: Option \"!\" is not valid.
The command line entry is not valid.
Action: Check what you have entered to ensure that it follows the correct syntax.
Message SDL89
ERROR: Maximum number of classes (!) for -maxclass is not valid.
The -maxclass number must be greater than zero.
Action: See sdlcomp Compiler in Chapter 15 for more information.
Message SDL90
ERROR: -f option but no result file specified.
You must specify a format file when using the -f option.
Action: You must specify a format file when using the -f option.
Message SDL91
ERROR: No specification file named.
No name assigned to class specification file.
Action: You must enter a specification_file when using sdlcomp. See sdlcomp Compiler in Chapter 15 for more information.
Message SDL92
ERROR: No log file set named.
You must enter a logfile_set when using sdlcomp.
Action: See sdlcomp Compiler in Chapter 15 for more information.
Message SDL93
ERROR: Metric ID already defined in class.
The metric_id only needs to be defined once.
Action: To reuse a metric definition that has already been defined in another class, specify just the metric_name without the metric_id or any other specifications.
See Metrics Descriptions in Chapter 14 for more information.
Message SDL94
ERROR: Metric name already defined in class.
The metric-name only needs to be defined once.
Action: To reuse a metric definition that has already been defined in another class, specify just the metric_name without the metric_id or any other specifications. See Metrics Descriptions in Chapter 14 for more information.
336 Chapter 17
Message SDL95
ERROR: Text found after complete class specification.
The sdlcomp compiler found text it did not recognize as part of the class specification.
Action: Reenter the specification and try again.
Message SDL96
ERROR: Collection rate statement not valid.
The proper format is RECORDS PER HOUR (number). The keywords must be present in this order and cannot be abbreviated.
Action: Correct the keyword and follow the required the format.
Message SDL97
ERROR: Expecting integer between 1 and 2,147,483,647.
You must use a number in this range.
Action: Enter a number that falls within the range.
Message SDL98
ERROR: Action requires preceding ROLL BY statement.
The entry is out of order or is missing in the class specification file.
Action: The action specifies what will happen when the log file rolls. It is important to first know when it should roll. ROLL BY must precede ACTION.
For example:
class xxxxx = 10 index by month max indexes 12 action "ll *";
should have been:
class xxxxx = 10 index by month max indexes 12 roll by month action "ll *";
Message SDL99
ERROR: MAX INDEXES requires preceding INDEX BY statement.
The entry is out of order or is missing in the class specification file.
Action: To specify a maximum number of indexes, the program needs to know where you are doing an indexing by. The INDEX BY statement must precede MAX INDEXES.
For example:
class xxxxx = 10 max indexes 12 label "this is a test";
should have been:
Error Message 337
class xxxxx = 10 index by month max indexes 12 label "this is a test";
Message SDL100
WARNING: CAPACITY UNLIMITED not implemented, derived value used. (SDL-100)
Message SDL101
ERROR: Derived capacity too large. (SDL-101)
Message SDL102
ERROR: Text Length should not exceed 4096.
The maximum allowed length for the text metric is 4096.
Message SDL103
ERROR: RECORDS PER HOUR should not be greater than 3600 for logging summarized data.
Action: The RECORDS PER HOUR can be greater than 3600 only for unsummarized data. Use the -u option to compile.
DSILOG Error Messages
DSILOG error messages are dsilog logging process messages with the format,
DSILOG<message number>.
Message DSILOG1
ERROR: Self describing log file not specified.
Action: Correct the command line and try again.
Message DSILOG2
ERROR: Data class name not specified.
The data class must be the second parameter passed to dsilog.
Action: Correct the command line and try again.
Message DSILOG3
ERROR: Could not open data input file (name).
The file specified in the command line couldn't be opened. A UNIX file system error appears in the next line of the error message.
Message DSILOG4
ERROR: OpenClass (\"name\") failed.
338 Chapter 17
The class specified couldn't be opened. It may not be in the log file set specified, or its data file isn't accessible.
Action: Explanatory messages will follow giving either an internal error description or a file system error.
Message DSILOG5
ERROR: Open of root log file (name) failed.
The log file set root file couldn't be opened. The reason is shown in the explanatory messages.
Message DSILOG6
ERROR: Time stamp not defined in data class.
The class was built and no timestamp was included.
Action: Use sdlutil to remove the log file set and start over.
Message DSILOG7
ERROR: (Internal error) AddPoint ( ) failed.
dsilog tried to write a record to the data file and couldn't. Explanatory messages will follow.
Message DSILOG8
ERROR: Invalid command line parameter (name).
The parameter shown was either not recognized as a valid command line option, or it was out of place in the command line.
Action: Correct the command line parameter and try again.
Message DSILOG9
ERROR: Could not open format file (name).
The file directing the match of incoming metrics to those in the data class could not be found or was inaccessible. Explanatory messages will follow with the UNIX file system error.
Action: Check the class specification file to verify that it is present.
Message DSILOG10
ERROR: Illegal metric name (name).
The format file contained a metric name that was longer than the maximum metric name size or it did not otherwise conform to metric name syntax.
Action: Correct the metric name in the class specification and rerun dsilog.
Message DSILOG11
ERROR: Too many input metrics defined. Max 100.
Only 100 metrics can be specified in the format file
Action: The input should be reformatted externally to dsilog, or the data source should be split into two or more data sources.
Error Message 339

Message DSILOG12
ERROR: Could not find metric (name) in class.
The metric name found in the format file could not be found in the data class.
Action: Make corrections and try again.
Message DSILOG13
ERROR: Required time stamp not found in input specification.
The -timestamp command line option was used, but the format file did not specify where the timestamp could be found in the incoming data.
Action: Specify where the timestamp can be found.
Message DSILOG14
ERROR: (number) errors, collection aborted.
Serious errors were detected when setting up for collection.
Action: Correct the errors and retry. The -vi and -vo options can also be used to verify the data as it comes in and as it would be logged.
Message DSILOG15
ERROR: Self describing log file and data class not specified.
The command line must specify the log file set and the data class to log data to.
Action: Correct the command line entry and try again.
Message DSILOG16
ERROR: Self describing log file set root file (name) could not be accessed. error=(number).
Couldn't open the log file set root file.
Action: Check the explanatory messages that follow for the problem.
Message (unnumbered)
Metric null has invalid dataIgnore to end of line, metric value exceeds maximum
This warning message occurs when dsilog doesn’t log any data for a particular line of input. This happens when the input doesn’t fit the format expected by the DSI log files, such as when blank or header lines are present in the input or when a metric value exceeds the specified precision. In this case, the offending lines will be skipped (not logged). dsilog will resume logging data for the next valid input line.
Message DSILOG17
ERROR: Logfile set is created to log unsummarized data, could not log summarized data.
Action: If the set of log files are created using the -u option during compilation, use -s 0 option to log using dsilog. Using the option indicates that the data logged is unsummarized.
340 Chapter 17
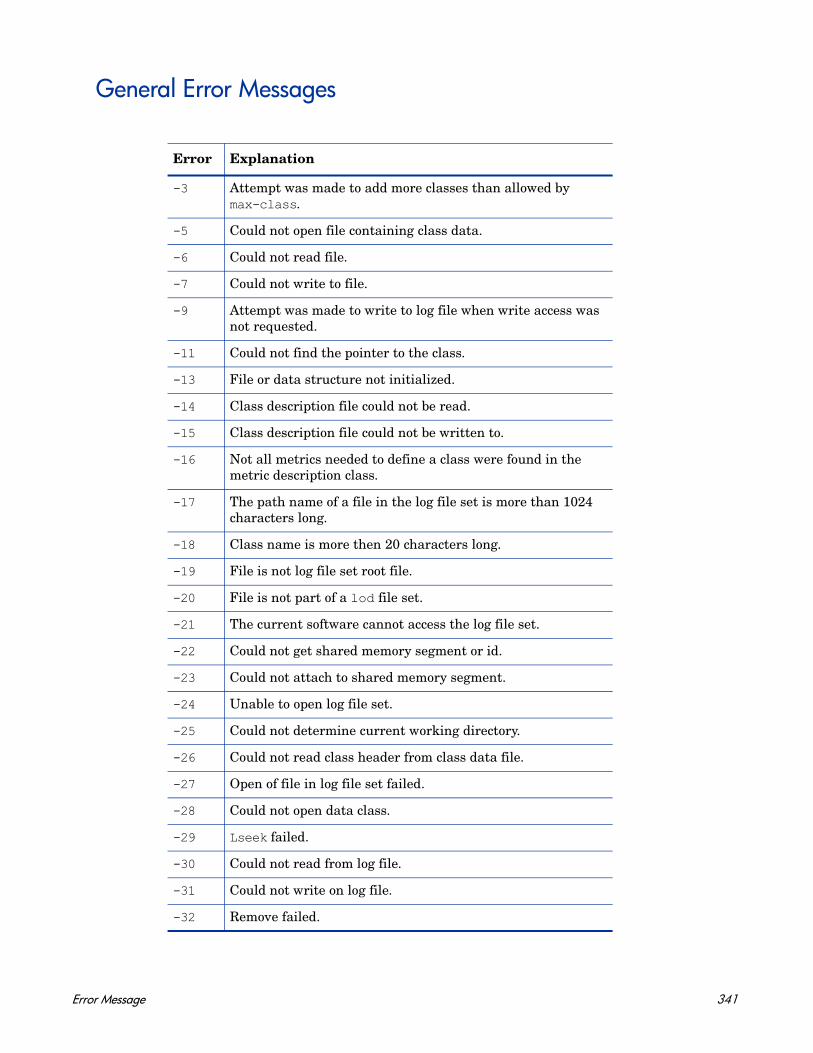
General Error Messages
Error Explanation
-3 Attempt was made to add more classes than allowed by max-class.
-5 Could not open file containing class data.
-6 Could not read file.
-7 Could not write to file.
-9 Attempt was made to write to log file when write access was not requested.
-11 Could not find the pointer to the class.
-13 File or data structure not initialized.
-14 Class description file could not be read.
-15 Class description file could not be written to.
-16 Not all metrics needed to define a class were found in the metric description class.
-17 The path name of a file in the log file set is more than 1024 characters long.
-18 Class name is more then 20 characters long.
-19 File is not log file set root file.
-20 File is not part of a lod file set.
-21 The current software cannot access the log file set.
-22 Could not get shared memory segment or id.
-23 Could not attach to shared memory segment.
-24 Unable to open log file set.
-25 Could not determine current working directory.
-26 Could not read class header from class data file.
-27 Open of file in log file set failed.
-28 Could not open data class.
-29 Lseek failed.
-30 Could not read from log file.
-31 Could not write on log file.
-32 Remove failed.
Error Message 341

-33 shmctl (REM_ID) failed.
-34 Log file set is incomplete: root or description file is missing.
-35 The target log file for adding a class is not in the current log file set.
Error Explanation
342 Chapter 17

18 What is Transaction Tracking?
This chapter describes:
• Improving Performance Management
• A Scenario: Real Time Order Processing
• Monitoring Transaction Data
Improving Performance Management
You can improve your ability to manage system performance with the transaction tracking capability of HP Operations Agent and HP GlancePlus.
As the number of distributed mission-critical business applications increases, application and system managers need more information to tell them how their distributed information technology (IT) is performing.
• Has your application stopped responding?
• Is the application response time unacceptable?
• Are your service level objectives (SLOs) being met?
The transaction tracking capabilities of Performance Collection Component and GlancePlus allow IT managers to build in end-to-end manageability of their client/server IT environment in business transaction terms. With Performance Collection Component, you can define what a business transaction is and capture transaction data that makes sense in the context of your business.
When your applications are instrumented with the standard Application Response Measurement (ARM) API calls, these products provide extensive transaction tracking and end-to-end management capabilities across multi-vendor platforms.
343

Benefits of Transaction Tracking
• Provides a client view of elapsed time from the beginning to the end of a transaction.
• Provides transaction data.
• Helps you manage service level agreements (SLAs).
These topics are discussed in more detail in the remainder of this section.
Client View of Transaction Times
Transaction tracking provides you with a client view of elapsed time from the beginning to the end of a transaction. When you use transaction tracking in your Information Technology (IT) environment, you see the following benefits:
• You can accurately track the number of times each transaction executes.
• You can see how long it takes for a transaction to complete, rather than approximating the time as happens now.
• You can correlate transaction times with system resource utilization.
• You can use your own business deliverable production data in system management applications, such as data used for capacity planning, performance management, accounting, and charge-back.
• You can accomplish application optimization and detailed performance troubleshooting based on a real unit of work (your transaction), rather than representing actual work with abstract definitions of system and network resources.
Transaction Data
When Application Response Measurement (ARM) API calls have been inserted in an application to mark the beginning and end of each business transaction, you can then use the following resource and performance monitoring tools to monitor transaction data:
• Performance Collection Component provides the registration functionality needed to log, report, and detect alarms on transaction data. Transaction data can be viewed in Performance Manager, Glance, or by exporting the data from Performance Collection Component log files into files that can be accessed by spreadsheet and other reporting tools.
• Performance Manager graphs performance data for short-term troubleshooting and for examining trends and long-term analysis.
• Glance displays detailed real time data for monitoring your systems and transactions moment by moment.
• Performance Manager, Glance, or the HP Operations Manager message browser allow you to monitor alarms on service level compliance.
Individual transaction metrics are described in Chapter 22, Transaction Metrics
344 Chapter 18
Service Level Objectives
Service level objectives (SLOs) are derived from the stated service levels required by business application users. SLOs are typically based on the development of the service level agreement (SLA). From SLOs come the actual metrics that Information Technology resource managers need to collect, monitor, store, and report on to determine if they are meeting the agreed upon service levels for the business application user.
An SLO can be as simple as monitoring the response time of a simple transaction or as complex as tracking system availability.
A Scenario: Real Time Order Processing
Imagine a successful television shopping channel that employs hundreds of telephone operators who take orders from viewers for various types of merchandise. Assume that this enterprise uses a computer program to enter the order information, check merchandise availability, and update the stock inventory. We can use this fictitious enterprise to illustrate how transaction tracking can help an organization meet customer commitments and SLOs.
Based upon the critical tasks, the customer satisfaction factor, the productivity factor, and the maximum response time, resource managers can determine the level of service they want to provide to their customers.
Chapter 23, Transaction Tracking Examples contains a pseudocode example of how ARM API calls can be inserted in a sample order processing application so that transaction data can be monitored with Performance Collection Component and Glance.
Requirements for Real Time Order Processing
To meet SLOs in the real time order processing example described above, resource managers must keep track of the length of time required to complete the following critical tasks:
• Enter order information
• Query merchandise availability
• Update stock inventory
The key customer satisfaction factor for customers is how quickly the operators can take their order.
The key productivity factor for the enterprise is the number of orders that operators can complete each hour.
To meet the customer satisfaction and productivity factors, the response times of the transactions that access the inventory database, adjust the inventory, and write the record back must be monitored for compliance to established SLOs. For example, resource managers may have established an SLO for this application that 90 percent of the transactions must be completed in five seconds or less.
What is Transaction Tracking? 345

Preparing the Order Processing Application
ARM API calls can be inserted into the order processing application to create transactions for inventory response and update inventory. Note that the ARM API calls must be inserted by application programmers prior to compiling the application. See Chapter 23, Transaction Tracking Examples for an example order processing program (written in pseudocode) that includes ARM API calls that define various transactions.
For more information on instrumenting applications with ARM API calls, see the Application Response Measurement 2.0 API Guide.
Monitoring Transaction Data
When an application that is instrumented with ARM API calls is installed and running on your system, you can monitor transaction data with Performance Collection Component, GlancePlus, or Performance Manager.
... with Performance Collection Component
Using Performance Collection Component, you can collect and log data for named transactions, monitor trends in your SLOs over time, and generate alarms when SLOs are exceeded. Once these trends have been identified, Information Technology costs can be allocated based on transaction volumes. Performance Collection Component alarms can be configured to activate a technician's pager, so that problems can be investigated and resolved immediately. For more information, see Chapter 24, Advanced Features.
Performance Collection Component is required for transaction data to be viewed in Performance Manager.
... with Performance Manager
Performance Manager receives alarms and transaction data from Performance Collection Component. For example, you can configure Performance Collection Component so that when an order processing application takes too long to check stock, Performance Manager receives an alarm and sends a warning to the resource manager's console as an alert of potential trouble.
In Performance Manager, you can select TRANSACTION from the Class List window for a data source, then graph transaction metrics for various transactions. For more information, see Performance Manager online help.
... with GlancePlus
Use GlancePlus to monitor up-to-the-second transaction response time and whether or not your transactions are performing within your established SLOs. GlancePlus helps you identify and resolve resource bottlenecks that may be impacting transaction performance. For more information, see the GlancePlus online help, which is accessible through the GlancePlus Help menu.
346 Chapter 18
Guidelines for Using ARM
Instrumenting applications with the ARM API requires some careful planning. In addition, managing the environment that has ARMed applications in it is easier if the features and limitations of ARM data collection are understood. Here is a list of areas that could cause some confusion if they are not fully understood.
1 In order to capture ARM metrics, ttd and midaemon must be running. For Performance Collection Component, the scope collector must be running to log ARM metrics. The ovpa start script starts all required processes. Likewise, Glance starts ttd and midaemon if they are not already active. (See Transaction Tracking Daemon (ttd) in Chapter 19.)
2 Re-read the transaction configuration file, ttd.conf, to capture any newly-defined transaction names. (See Transaction Configuration File (ttd.conf) in Chapter 19.)
3 Performance Collection Component, user applications, and ttd must be restarted to capture any new or modified transaction ranges and service level objectives (SLOs). (See Adding New Applications in Chapter 19.)
4 Strings in user-defined metrics are ignored by Performance Collection Component. Only the first six non-string user-defined metrics are logged. (See How Data Types Are Used in Chapter 24.)
5 Using dashes in the transaction name has limitations if you are specifying an alarm condition for that transaction. (See “... with Performance Collection Component” in the section Alarms in Chapter 20)
6 Performance Collection Component will only show the first 60 characters in the application name and transaction name. (See Specifying Application and Transaction Names in Chapter 19.)
7 Limit the number of unique transaction names that are instrumented. (See Limits on Unique Transactions in Chapter 20.)
8 Do not allow ARM API function calls to affect the execution of an application from an end-user perspective. (See ARM API Call Status Returns in Chapter 19.)
9 Use shared libraries for linking. (See the section C Compiler Option Examples by Platform on page 386)
What is Transaction Tracking? 347

348 Chapter 18
19 How Transaction Tracking Works
The following components of Performance Collection Component and GlancePlus work together to help you define and track transaction data from applications instrumented with Application Response Measurement (ARM) calls.
• The Measurement Interface daemon, midaemon, is a daemon process that monitors and reports transaction data to its shared memory segment where the information can be accessed and reported by Performance Collection Component, Performance Manager, and GlancePlus. On HP-UX systems, the midaemon also monitors system performance data.
• The transaction configuration file, /var/opt/perf/ttd.conf, is used to define transactions and identify the information to monitor for each transaction.
• The Transaction Tracking daemon, ttd, reads, registers, and synchronizes transaction definitions from the transaction configuration file, ttd.conf, with the midaemon.
349
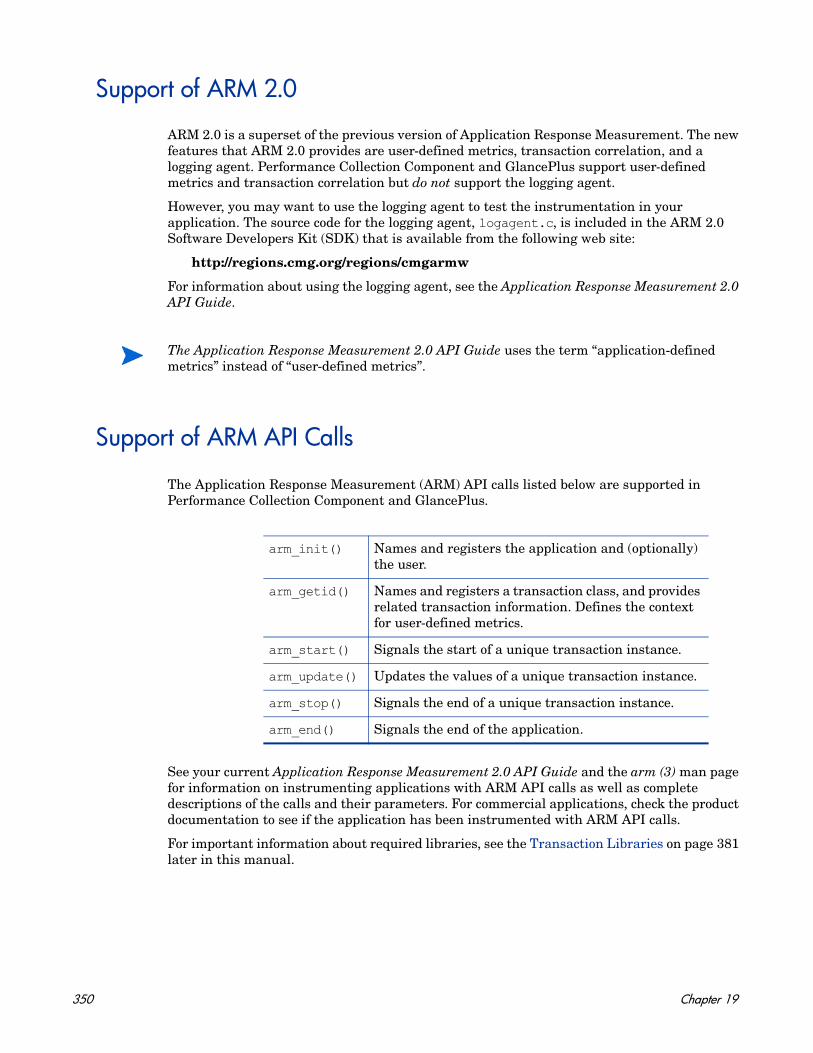
Support of ARM 2.0
ARM 2.0 is a superset of the previous version of Application Response Measurement. The new features that ARM 2.0 provides are user-defined metrics, transaction correlation, and a logging agent. Performance Collection Component and GlancePlus support user-defined metrics and transaction correlation but do not support the logging agent.
However, you may want to use the logging agent to test the instrumentation in your application. The source code for the logging agent, logagent.c, is included in the ARM 2.0 Software Developers Kit (SDK) that is available from the following web site:
http://regions.cmg.org/regions/cmgarmw
For information about using the logging agent, see the Application Response Measurement 2.0 API Guide.
Support of ARM API Calls
The Application Response Measurement (ARM) API calls listed below are supported in Performance Collection Component and GlancePlus.
See your current Application Response Measurement 2.0 API Guide and the arm (3) man page for information on instrumenting applications with ARM API calls as well as complete descriptions of the calls and their parameters. For commercial applications, check the product documentation to see if the application has been instrumented with ARM API calls.
For important information about required libraries, see the Transaction Libraries on page 381 later in this manual.
The Application Response Measurement 2.0 API Guide uses the term “application-defined metrics” instead of “user-defined metrics”.
arm_init() Names and registers the application and (optionally) the user.
arm_getid() Names and registers a transaction class, and provides related transaction information. Defines the context for user-defined metrics.
arm_start() Signals the start of a unique transaction instance.
arm_update() Updates the values of a unique transaction instance.
arm_stop() Signals the end of a unique transaction instance.
arm_end() Signals the end of the application.
350 Chapter 19
arm_complete_transaction Call
In addition to the ARM 2.0 API standard, the HP ARM agent supports the arm_complete_transaction call. This call, which is an HP-specific extension to the ARM standard, can be used to mark the end of a transaction that has completed when the start of the transaction could not be delimited by an arm_start call. The arm_complete_transaction call takes as a parameter the response time of the completed transaction instance.
In addition to signaling the end of a transaction instance, additional information about the transaction can be provided in the optional data buffer. See the arm (3) man page for more information on this optional data as well a complete description of this call and its parameters.
Sample ARM-Instrumented Applications
For examples of how ARM API calls are implemented, see the sample ARM-instrumented applications, armsample1.c, armsample2.c, armsample3.c, and armsample4.c, and their build script, Make.armsample, in the /<InstallDir>/examples/arm/ directory.
• armsample1.c shows the use of simple standard ARM API calls.
• armsample2.c also shows the use of simple standard ARM API calls. It is similar in structure to armsample1.c, but is interactive.
• armsample3.c provides examples of how to use the user-defined metrics and the transaction correlator, provided by version 2.0 of the ARM API. This example simulates a client/server application where both server and client perform a number of transactions. (Normally application client and server components would exist in separate programs, but they are put together for simplicity.)
The client procedure starts a transaction and requests an ARM correlator from its arm_start call. This correlator is saved by the client and passed to the server so that the server can use it when it calls arm_start. The performance tools running on the server can then use this correlator information to distinguish the different clients making use of the server.
Also shown in this program is the mechanism for passing user-defined metric values into the ARM API. This allows you to not only see the response times and service-level information in the performance tools, but also data which may be important to the application itself. For example, a transaction may be processing different size requests, and the size of the request could be a user-defined metric. When the response times are high, this user-defined metric could be used to see if long response times correspond to bigger size transaction instances.
• armsample4.c provides an example of using user-defined metrics in ARM calls. Different metric values can be passed through arm_start, arm_update, and arm_stop calls. Alternatively, arm_complete_transaction can be used where a tran cannot be delimited by start/stop calls.
Specifying Application and Transaction Names
Although ARM allows a maximum of 128 characters each for application and transaction names in the arm_init and arm_getid API calls, Performance Collection Component shows only a maximum of 60 characters. All characters beyond the first 60 will not be visible. However, GlancePlus allows you to view up to 128 characters.
How Transaction Tracking Works 351

Performance Collection Component applies certain limitations to how application and transaction names are shown in extracted or exported transaction data. These rules also apply to viewing application and transaction names in Performance Manager.
The application name always takes precedence over the transaction name. For example, if you are exporting transaction data that has a 65-character application name and a 40-character transaction name, only the application name is shown. The last five characters of the application name are not visible.
For another example, if an application name contains 32 characters and the transaction name has 40 characters, Performance Collection Component shows the entire application name but the transaction name appears truncated. A total of 60 characters are shown. Fifty-nine characters are allocated to the application and transaction names and one character is allocated to the underscore (_) that separates the two names. This is how the application name “WarehouseInventoryApplication” and the transaction name “CallFromWestCoastElectronicSupplier” would appear in Performance Collection Component or Performance Manager:
WarehouseInventoryApplication_CallFromWestCoastElectronicSup
The 60-character combination of application name and transaction name must be unique if the data is to be viewed with Performance Manager.
352 Chapter 19

Transaction Tracking Daemon (ttd)
The Transaction Tracking daemon, ttd, reads, registers, and synchronizes transaction definitions from ttd.conf with midaemon.
ttd is started when you start up Performance Collection Component's scope data collector with the ovpa start command. ttd runs in background mode when dispatched, and errors are written to the file /var/opt/perf/status.ttd.
midaemon must also be running to process the transactions and to collect performance metrics associated with these transactions (see next page).
Use the ovpa script to start Performance Collection Component processes to ensure that the processes are started in the correct order. ovpa stop will not shut down ttd. If ttd must be shut down for a reinstall of any performance software, use the command /<InstallDir>/bin/ttd -k. However, we do not recommend that you stop ttd, except when reinstalling Performance Collection Component.
If Performance Collection Component is not on your system, GlancePlus starts midaemon. midaemon then starts ttd if it is not running before midaemon starts processing any measurement data.
See the ttd man page for complete program options.
ARM API Call Status Returns
The ttd process must always be running in order to register transactions. If ttd is killed for any reason, while it is not running, arm_init or arm_getid calls will return a “failed” return code. If ttd is subsequently restarted, new arm_getid calls may re-register the same transaction IDs that are already being used by other programs, thus causing invalid data to be recorded.
When ttd is killed and restarted, ARM-instrumented applications may start getting a return value of -2 (TT_TTDNOTRUNNING) and an EPIPE errno error on ARM API calls. When your application initially starts, a client connection handle is created on any initial ARM API calls. This client handle allows your application to communicate with the ttd process. When ttd is killed, this connection is no longer valid and the next time your application attempts to use an ARM API call, you may get a return value of TT_TTDNOTRUNNING. This error reflects that the previous ttd process is no longer running even though there is another ttd process running. (Some of the ARM API call returns are explained in the arm (3) man page.)
To get around this error, you must restart your ARM-instrumented applications if ttd is killed. First, stop your ARMed applications. Next, restart ttd (using /<InstallDir>/bin/ovpa start or /<InstallDir>/bin/ttd), and then restart your applications. The restart of your application causes the creation of a new client connection handle between your application and the ttd process.
We strongly recommend that you do not stop ttd. If you must stop ttd, any ARM-instrumented applications that are running must also be stopped before you restart ttd and Performance Collection Component processes. ttd must be running to capture all arm_init and arm_getid calls being made on the system. If ttd is stopped and restarted, transaction IDs returned by these calls will be repeated, thus invalidating the ARM metrics
How Transaction Tracking Works 353

Some ARM API calls will not return an error if the midaemon has an error. For example, this would occur if the midaemon has run out of room in its shared memory segment. The performance metric GBL_TT_OVERFLOW_COUNT will be > 0. If an overflow condition occurs, you may want to shut down any performance tools that are running (except ttd) and restart the midaemon using the -smdvss option to specify more room in the shared memory segment. (For more information, see the midaemon man page.)
We recommend that your applications be written so that they continue to execute even if ARM errors occur. ARM status should not affect program execution.
The number of active client processes that can register transactions with ttd via the arm_getid call is limited to the maxfiles kernel parameter. This parameter controls the number of open files per process. Each client registration request results in ttd opening a socket (an open file) for the RPC connection. The socket is closed when the client application terminates. Therefore, this limit affects only the number of active clients that have registered a transaction via the arm_getid call. Once this limit is reached, ttd will return TT_TTDNOTRUNNING to a client's arm_getid request. The maxfiles kernel parameter can be increased to raise this limit above the number of active applications that will register transactions with ttd.
Measurement Interface Daemon (midaemon)
The Measurement Interface daemon, midaemon, is a low-overhead process that continuously collects system performance information. The midaemon must be running for Performance Collection Component to collect transaction data or for GlancePlus to report transaction data. It starts running when you run scope with the ovpa start command or when starting GlancePlus.
Performance Collection Component and GlancePlus require both the midaemon and ttd to be running so that transactions can be registered and tracked. The ovpa script starts and stops Performance Collection Component processing, including the mideamon, in the correct order. GlancePlus starts the mideamon, if it is not already running. The midaemon starts ttd, if it is not already running.
See the CPU Overhead section later in this manual for information on the midaemon CPU overhead.
See the midaemon man page for complete program options.
354 Chapter 19

Transaction Configuration File (ttd.conf)
The transaction configuration file, /var/opt/perf/ttd.conf, allows you to define the application name, transaction name, the performance distribution ranges, and the service level objective you want to meet for each transaction. The ttd reads ttd.conf to determine how to register each transaction.
Customization of ttd.conf is optional. The default configuration file that ships with Performance Collection Component causes all transactions instrumented in any application to be monitored.
If you are using a commercial application and don't know which transactions have been instrumented in the application, collect some data using the default ttd.conf file. Then look at the data to see which transactions are available. You can then customize the transaction data collection for that application by modifying ttd.conf.
Adding New Applications
If you add new ARMed applications to your system that use the default slo and range values from the tran=* line in your ttd.conf file, you don't need to do anything to incorporate these new transactions. (See the Configuration File Keywords section for descriptions of tran, range, and slo.) The new transactions will be picked up automatically. The slo and range values from the tran line in your ttd.conf file will be applied to the new transactions.
Adding New Transactions
After making additions to the ttd.conf file, you must perform the following steps to make the additions effective:
• Stop all applications.
• Execute the ttd -hup -mi command as root.
The above actions cause the ttd.conf file to be re-read and registers the new transactions, along with their slo and range values, with ttd and the midaemon. The re-read will not change the slo or range values for any transactions that were in the ttd.conf file prior to the re-read.
Changing the Range or SLO Values
If you need to change the SLO or range values of existing transactions in the ttd.conf file, you must do the following:
• Stop all ARMed applications.
• Stop the scope collector using ovpa stop.
• Stop any usage of Glance.
• Stop the ttd by issuing the command ttd -k.
• Once you have made your changes to the ttd.conf file:
• Restart scope using ovpa start.
• Restart your ARMed applications.
How Transaction Tracking Works 355

Configuration File Keywords
The /var/opt/perf/ttd.conf configuration file associates transaction names with transaction attributes that are defined by the keywords in Table 1.
These keywords are described in more detail below.
tran
Use tran to define your transaction name. This name must correspond to a transaction that is defined in the arm_getid API call in your instrumented application. You must use the tran keyword before you can specify the optional attributes range or slo. tran is the only required keyword within the configuration file. A trailing asterisk (*) in the transaction name causes a wild card pattern match to be performed when registration requests are made against this entry. Dashes can be used in a transaction name. However, spaces cannot be used in a transaction name.
The transaction name can contain a maximum of 128 characters. However, only the first 60 characters are visible in Performance Collection Component. GlancePlus can display 128 characters in specific screens.
The default ttd.conf file contains several entries. The first entries define transactions used by the Performance Collection Component data collector scope, which is instrumented with ARM API calls. The file also contains the entry tran=*, which registers all other transactions in applications instrumented with ARM API or Transaction Tracker API calls.
range
Use range to specify the transaction performance distribution ranges. Performance distribution ranges allow you to distinguish between transactions that take different lengths of time to complete and to see how many successful transactions of each length occurred. The ranges that you define appear in the GlancePlus Transaction Tracking window.
Each value entered for sec represents the upper limit in seconds for the transaction time for the range. The value may be an integer or real number with a maximum of six digits to the right of the decimal point. On HP-UX, this allows for a precision of one microsecond (.000001 seconds). On other platforms, however, the precision is ten milliseconds (0.01 seconds), so only the first two digits to the right of the decimal point are recognized.
A maximum of ten ranges are supported for each transaction you define. You can specify up to nine ranges. One range is reserved for an overflow range, which collects data for transactions that take longer than the largest user-defined range. If you specify more than nine ranges, the first nine ranges are used and the others are ignored.
Table 1 Configuration File Keywords
Keyword Syntax Usage
tran tran=transaction_name Required
slo slo=sec Optional
range range=sec [,sec,...] Optional
356 Chapter 19

If you specify fewer than nine ranges, the first unspecified range becomes the overflow range. Any remaining unspecified ranges are not used. The unspecified range metrics are reported as 0.000. The first corresponding unspecified count metric becomes the overflow count. Remaining unspecified count metrics are always zero (0).
Ranges must be defined in ascending order (see examples later in this chapter).
slo
Use slo to specify the service level objective (SLO) in seconds that you want to use to monitor your performance service level agreement (SLA).
As with the range keyword, the value may be an integer or real number, with a maximum of six digits to the right of the decimal point. On HP-UX, this allows for a precision of one microsecond (.000001 seconds). On other platforms, however, the precision is ten milliseconds (0.01 seconds), so only the first two digits to the right of the decimal point are recognized.
Note that even though transactions can be sorted with one microsecond precision on HP-UX, transaction times are displayed with 100 microsecond precision.
Configuration File Format
The ttd.conf file can contain two types of entries: general transactions and application-specific transactions.
General transactions should be defined in the ttd.conf file before any application is defined. These transactions will be associated with all the applications that are defined. The default ttd.conf file contains one general transaction entry and entries for the scope collector that is instrumented with ARM API calls.
tran=* range=0.5, 1, 2, 3, 5, 10, 30, 120, 300 slo=5.0
Optionally, each application can have its own set of transaction names. These transactions will be associated only with that application. The application name you specify must correspond to an application name defined in the arm_init API call in your instrumented application. Each group of application-specific entries must begin with the name of the application enclosed in brackets. For example:
[AccountRec]tran=acctOne range=0.01, 0.03, 0.05
The application name can contain a maximum of 128 characters. However, only the first 60 characters are visible in Performance Collection Component. Glance can display 128 characters in specific screens.
If there are transactions that have the same name as a “general” transaction, the transaction listed under the application will be used.
How Transaction Tracking Works 357

For example:
tran=abc range=0.01, 0.03, 0.05 slo=0.10tran=xyz range=0.02, 0.04, 0.06 slo=0.08tran=t* range=0.01, 0.02, 0.03
[AccountRec}tran=acctOne range=0.04, 0.06, 0.08tran=acctTwo range=0.1, 0.2tran=t* range=0.03, 0.5
[AccountPay]
[GenLedg]tran=GenLedgOne range=0.01
In the example above, the first three transactions apply to all of the three applications specified.
The application [AccountRec] has the following transactions: acctOne, acctTwo, abc, xyz, and t*. One of the entries in the general transaction set also has a wild card transaction named "t*". In this case, the "t*" transaction name for the AccountRec application will be used; the one in the general transaction set is ignored.
The application [AccountPay] has only transactions from the general transactions set.
The application [GenLedg] has transactions GenLedgOne, abc, xyz, and t*.
The ordering of transactions names makes no difference within the application.
For additional information about application and transaction names, see the section Specifying Application and Transaction Names in this chapter.
Configuration File Examples
Example 1
tran=* range=0.5,1,2,3,5,10,30,12,30 slo=5.0
The "*" entry is used as the default if none of the entries match a registered transaction name. These defaults can be changed on each system by modifying the "*" entry. If the "*" entry is missing, a default set of registration parameters are used that match the initial parameters assigned to the "*" entry above.
Example 2
[MANufactr]tran=MFG01 range=1,2,3,4,5,10 slo=3.0tran=MFG02 range=1,2.2,3.3,4.0,5.5,10 slo=4.5tran=MFG03tran=MFG04 range=1,2.2,3.3,4.0,5.5,10
Transactions for the MANufctr application, MFG01, MFG02, and MFG04, each use their own unique parameters. The MFG03 transaction does not need to track time distributions or service level objectives so it does not specify these parameters.
Example 3
358 Chapter 19
[Financial]tran=FIN01tran=FIN02 range=0.1,0.5,1,2,3,4,5,10,20 slo=1.0tran=FIN03 range=0.1,0.5,1,2,3,4,5,10,20 slo=2.0
Transactions for the Financial application, FIN02 and FIN03, each use their own unique parameters. The FIN01 transaction does not need to track time distributions or service level objectives so it does not specify these parameters.
Example 4
[PERSONL]tran=PERS* range=0.1,0.5,1,2,3,4,5,10,20 slo=1.0tran=PERS03 range=0.1,0.2,0.5,1,2,3,4,5,10,20 slo=0.8
The PERS03 transaction for the PERSONL application uses its own unique parameters while the remainder of the personnel transactions use a default set of parameters unique to the PERSONL application.
Example 5
[ACCOUNTS]tran=ACCT_* slo=1.0tran=ACCT_REC range=0.5,1,2,3,4,5,10,20 slo=2.0tran=ACCT_PAY range=0.5,1,2,3,4,5,10,20 slo=2.0
Transactions for the ACCOUNTS application, ACCT_REC and ACCT_PAY, each use their own unique parameters while the remainder of the accounting transactions use a default set of parameters unique to the accounting application. Only the accounts payable and receivable transactions need to track time distributions. The order of transaction names makes no difference within the application.
Overhead Considerations for Using ARM
The current versions of Performance Collection Component and GlancePlus contain modifications to their measurement interface that support additional data required for ARM 2.0. These modifications can result in increased overhead for performance management. You should be aware of overhead considerations when planning ARM instrumentation for your applications.
The overhead areas are discussed in the remainder of this chapter.
Guidelines
Here are some guidelines to follow when instrumenting your applications with the ARM API:
• The total number of separate transaction IDs should be limited to not more than 4,000. Generally, it is cheaper to have multiple instances of the same transaction than it is to have single instances of different transactions. Register only those transactions that will be actively monitored.
• Although the overhead for the arm_start and arm_stop API calls is very small, it can increase when there is a large volume of transaction instances. More than a few thousand arm_start and arm_stop calls per second on most systems can significantly impact overall performance.
How Transaction Tracking Works 359

• Request ARM correlators only when using ARM 2.0 functionality. (For more information about ARM correlators, see the “Advanced Topics” section in the Application Response Measurement 2.0 API Guide. The overhead for producing, moving, and monitoring correlator information is significantly higher than for monitoring transactions that are not instrumented to use the ARM 2.0 correlator functionality.
• Larger string sizes (applications registering lengthy transaction names, application names, and user-defined string metrics) will impose additional overhead.
Disk I/O Overhead
The performance management software does not impose a large disk overhead on the system. Glance generally does not log its data to disk. Performance Collection Component's collector daemon, scope, generates disk log files, but their size is not significantly impacted by ARM 2.0. The logtran scope log file is used to store ARM data.
CPU Overhead
A program instrumented with ARM calls will generally not run slower because of the ARM calls. This assumes that the rate of arm_getid calls is lower than one call per second, and the rate of arm_start and arm_stop calls is lower than a few thousand per second. More frequent calls to the ARM API should be avoided.
Most of the additional CPU overhead for supporting ARM is incurred inside of the performance tool programs and daemons themselves. The midaemon CPU overhead rises slightly but not more than two percent more than it was with ARM 1.0. If the midaemon has been requested to track per-transaction resource metrics, the overhead per transaction instance may be twice as high as it would be without tracking per-transaction resource metrics. (You can enable the tracking of per-transaction resource metrics by setting the log transaction=resource flag in the parm file.) In addition, Glance and scope CPU overhead will be slightly higher on a system with applications instrumented with ARM 2.0 calls. Only those applications that are instrumented with ARM 2.0 calls that make extensive use of correlators and/or user-defined metrics will have a significant performance impact on the midaemon, scope, or Glance.
An midaemon overflow condition can occur when usage exceeds the available default shared memory. This results in:
• No return codes from the ARM calls once the overflow condition occurs.
• Display of incorrect metrics, including blank process names.
• Errors being logged in status.mi (for example, “out of space”).
Memory Overhead
Programs that are making ARM API calls will not have a significant impact in their memory virtual set size, except for the space used to pass ARM 2.0 correlator and user-defined metric information. These buffers, which are explained in the Application Response Measurement 2.0 API Guide, should not be a significant portion of a process's memory requirements.
There is additional virtual set size overhead in the performance tools to support ARM 2.0. The midaemon process creates a shared memory segment where ARM data is kept internally for use by Performance Collection Component and GlancePlus. The size of this shared memory segment has grown, relative to the size on releases with ARM 1.0, to accommodate the
360 Chapter 19

potential for use by ARM 2.0. By default on most systems, this shared memory segment is approximately 11 megabytes in size. This segment is not all resident in physical memory unless it is required. Therefore, this should not be a significant impact on most systems that are not already memory-constrained. The memory overhead of midaemon can be tuned using special startup parameters (see the midaemon man page).
How Transaction Tracking Works 361

362 Chapter 19

20 Getting Started with Transactions
This chapter gives you the information you need to begin tracking transactions and your service level objectives. For detailed reference information, see Chapter 19, How Transaction Tracking Works. See Chapter 23, Transaction Tracking Examples for examples.
Before you start
Performance Collection Component provides the libarm.* shared library in the following locations:
If you do not have Performance Collection Component installed on your system and if libarm.* doesn’t exist in the path indicated above for your platform, see C Compiler Option Examples by Platform on page 386 at the end of this manual. See also “The ARM Shared Library (libarm)” section in the Application Response Measurement 2.0 API Guide for information on how to obtain it. For a description of libarm, see ARM Library (libarm) on page 381 at the end of this manual.
Setting Up Transaction Tracking
Follow the procedure below to set up transaction tracking for your application. These steps are described in more detail in the remainder of this section.
1 Define SLOs by determining what key transactions you want to monitor and the response level you expect (optional).
2 To monitor transactions in Performance Collection Component and Performance Manager, make sure that the Performance Collection Component parm file has transaction logging turned on. Then start or restart Performance Collection Component to read the updated parm file.
Editing the parm file is not required to see transactions in GlancePlus. However, ttd must be running in order to see transactions in GlancePlus. Starting GlancePlus will automatically start ttd.
3 Run the application that has been instrumented with ARM API calls that are described in this manual and the Application Response Measurement 2.0 API Guide.
Platform Path
IBM RS/6000 /usr/lpp/perf/lib/
Other UNIX platforms /opt/perf/lib/
363

4 Use Performance Collection Component or Performance Manager to look at the collected transaction data, or use GlancePlus to view current data. If the data isn’t visible in Performance Manager, close the data source and then reconnect to it.
5 Customize the configuration file, ttd.conf, to modify the way transaction data for the application is collected (optional).
6 After making additions to the ttd.conf file, you must perform the following steps to make the additions effective:
a Stop all ARMed applications.
b Execute the ttd -hup -mi command as root.
These actions re-read the ttd.conf file and registers new transactions along with their slo and range values with ttd and the midaemon. The re-read will not change the slo or range values for any transactions that were in the ttd.conf file prior to the re-read.
7 If you need to change the slo or range values of existing transactions in the ttd.conf file, do the following:
a Stop all ARMed applications.
b Stop the scope collector using ovpa stop.
c Stop all usage of Glance.
d Stop ttd using ttd -k.
Once you have made your changes:
a Restart scope using ovpa start.
b Start your ARMed applications.
Defining Service Level Objectives
Your first step in implementing transaction tracking is to determine the key transactions that are required to meet customer expectations and what level of transaction responsiveness is required. The level of responsiveness that is required becomes your service level objective (SLO). You define the service level objective in the configuration file, ttd.conf.
Defining service level objectives can be as simple as reviewing your Information Technology department's service level agreement (SLA) to see what transactions you need to monitor to meet your SLA. If you don't have an SLA, you may want to implement one. However, creating an SLA is not required in order to track transactions.
Modifying the Parm File
If necessary, modify the Performance Collection Component parm file to add transactions to the list of items to be logged for use with Performance Manager and Performance Collection Component. Include the transaction option in the parm file's log parameter as shown in the following example:
log global application process transaction device=disk
The default for the log transaction parameter is no resource and no correlator. To turn on resource data collection or correlator data collection, specify log transaction=resource or log transaction=correlator. Both can be logged by specifying log transaction=resource, correlator.
364 Chapter 20
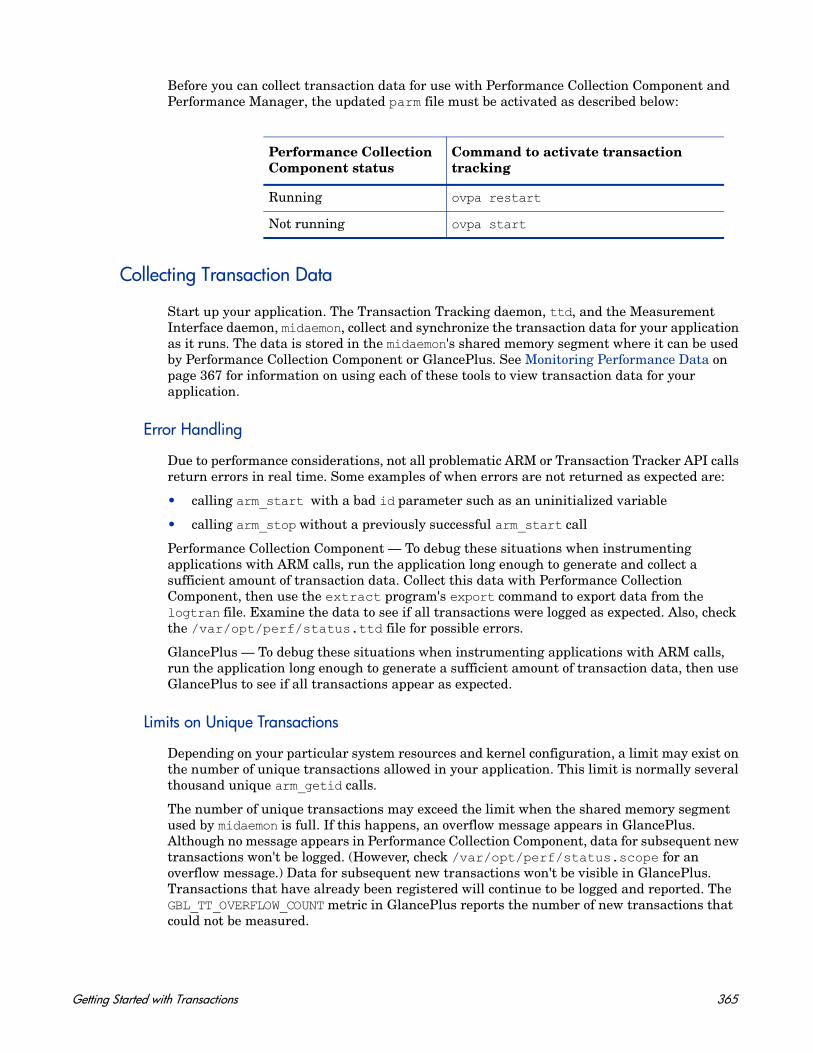
Before you can collect transaction data for use with Performance Collection Component and Performance Manager, the updated parm file must be activated as described below:
Collecting Transaction Data
Start up your application. The Transaction Tracking daemon, ttd, and the Measurement Interface daemon, midaemon, collect and synchronize the transaction data for your application as it runs. The data is stored in the midaemon's shared memory segment where it can be used by Performance Collection Component or GlancePlus. See Monitoring Performance Data on page 367 for information on using each of these tools to view transaction data for your application.
Error Handling
Due to performance considerations, not all problematic ARM or Transaction Tracker API calls return errors in real time. Some examples of when errors are not returned as expected are:
• calling arm_start with a bad id parameter such as an uninitialized variable
• calling arm_stop without a previously successful arm_start call
Performance Collection Component — To debug these situations when instrumenting applications with ARM calls, run the application long enough to generate and collect a sufficient amount of transaction data. Collect this data with Performance Collection Component, then use the extract program's export command to export data from the logtran file. Examine the data to see if all transactions were logged as expected. Also, check the /var/opt/perf/status.ttd file for possible errors.
GlancePlus — To debug these situations when instrumenting applications with ARM calls, run the application long enough to generate a sufficient amount of transaction data, then use GlancePlus to see if all transactions appear as expected.
Limits on Unique Transactions
Depending on your particular system resources and kernel configuration, a limit may exist on the number of unique transactions allowed in your application. This limit is normally several thousand unique arm_getid calls.
The number of unique transactions may exceed the limit when the shared memory segment used by midaemon is full. If this happens, an overflow message appears in GlancePlus. Although no message appears in Performance Collection Component, data for subsequent new transactions won't be logged. (However, check /var/opt/perf/status.scope for an overflow message.) Data for subsequent new transactions won't be visible in GlancePlus. Transactions that have already been registered will continue to be logged and reported. The GBL_TT_OVERFLOW_COUNT metric in GlancePlus reports the number of new transactions that could not be measured.
Performance Collection Component status
Command to activate transaction tracking
Running ovpa restart
Not running ovpa start
Getting Started with Transactions 365
This situation can be remedied by stopping and restarting the midaemon process using the -smdvss option to specify a larger shared memory segment size. The current shared memory segment size can be checked using the midaemon -sizes command. For more information on optimizing the midaemon for your system, see the midaemon man page.
Customizing the Configuration File (optional)
After viewing the transaction data from your application, you may want to customize the transaction configuration file, /var/opt/perf/ttd.conf, to modify the way transaction data for the application is collected. This is optional because the default configuration file, ttd.conf, will work with all transactions defined in the application. If you do decide to customize the ttd.conf file, complete this task on the same systems where you run your application. You must be logged on as root to modify ttd.conf.
See Chapter 19, How Transaction Tracking Works for information on the configuration file keywords – tran, range, and slo. Some examples of how each keyword is used are shown below:
tran=Example: tran=answeridtran=answerid*tran=*
range=Example: range=2.5,4.2,5.0,10.009
slo=Example: slo=4.2
Customize your configuration file to include all of your transactions and each associated attribute. Note that the use of the range or slo keyword must be preceded by the tran keyword. An example of a ttd.conf file is shown below.
tran=*tran=my_first_transaction slo=5.5
[answerid]tran=answerid1 range=2.5, 4.2, 5.0, 10.009 slo=4.2
[orderid]tran=orderid1 range=1.0, 1.5, 2.0, 2.5, 3.0, 3.5, 4.0
If you need to make additions to the ttd.conf file:
• Stop all ARMed applications.
• Execute the ttd -hup -mi command as root.
The above actions re-read the ttd.conf file and registers new transactions along with their slo and range values with ttd and the midaemon. The re-read will not change the slo or range value for any transactions that were in the ttd.conf file prior to the re-read,
If you need to change the slo or range values of existing transactions in the ttd.conf file, do the following:
1 Stop all ARMed applications.
2 Stop the scope collector using ovpa stop.
3 Stop all usage of Glance.
4 Stop ttd using ttd -k.
366 Chapter 20

Once you have made your changes:
1 Restart scope using ovpa start.
2 Start your ARMed applications.
Monitoring Performance Data
You can use the following resource and performance management products to monitor transaction data – Performance Collection Component, Performance Manager, and GlancePlus.
... with Performance Collection Component
By collecting and logging data for long periods of time, Performance Collection Component gives you the ability to analyze your system's performance over time and to perform detailed trend analysis. Data from Performance Collection Component can be viewed with Performance Manager Agent or exported for use with a variety of other performance monitoring, accounting, modeling, and planning tools.
With Performance Collection Component's extract program, data can be exported for use with spreadsheets and analysis programs. Data can also be extracted for archiving and analysis.
Performance Collection Component and ttd must be running in order to monitor transaction data in Performance Collection Component. Starting Performance Collection Component using the ovpa script ensures that the ttd and midaemon processes that are required to view transaction data in GlancePlus are started in the right order.
... with Performance Manager
Performance Manager imports Performance Collection Component data and gives you the ability to translate that data into a customized graphical or numerical format. Using Performance Manager, you can perform analysis of historical trends of transaction data and you can perform more accurate forecasting.
You can select TRANSACTION from the Class List window for a data source in Performance Manager, then graph transaction metrics for various transactions. For more information, see Performance Manager online help, which is accessible from the Performance Manager Help menu. If you don’t see the transactions you expect in Performance Manager, close the current data source and then reconnect to it.
... with GlancePlus
Monitoring systems with GlancePlus helps you identify resource bottlenecks and provides immediate performance information about the computer system. GlancePlus has a Transaction Tracking window that displays information about all transactions that you have defined and a Transaction Graph window that displays specific information about a single transaction. For example, you can see how each transaction is performing against the SLO that you have defined. For more information about how to use GlancePlus, see the online help that is accessible from the Help menu.
Getting Started with Transactions 367

Alarms
You can alarm on transaction data with the following resource and performance management products — Performance Collection Component, Performance Manager, and GlancePlus.
... with Performance Collection Component
In order to generate alarms with Performance Collection Component, you must define alarm conditions in its alarm definitions file, alarmdef. You can set up Performance Collection Component to notify you of an alarm condition in various ways, such as sending an email message or initiating a call to your pager.
To pass a syntax check for the alarmdef file, you must have data logged for that application name and transaction name in the log files, or have the names registered in the ttd.conf file.
There is a limitation when you define an alarm condition on a transaction that has a dash (–) in its name. To get around this limitation, use the ALIAS command in the alarmdef file to redefine the transaction name.
... with GlancePlus
You can configure the Adviser Syntax to alarm on transaction performance. For example, when an alarm condition is met, you can instruct GlancePlus to display information to stdout, execute a UNIX command (such as mailx), or turn the Alarm button on the main GlancePlus window yellow or red. For more information about alarms in GlancePlus, choose On This Window from the Help menu in the Edit Adviser Syntax window.
368 Chapter 20
21 Transaction Tracking Messages
The error codes listed in Table 2 are returned and can be used by the application developer when instrumenting an application with Application Response Measurement (ARM) or Transaction Tracker API calls:
When an application instrumented with ARM or Transaction Tracker API calls is running, return codes from any errors that occur will probably be from the Transaction Tracking daemon, ttd. The Measurement Interface daemon, midaemon, does not produce any error return codes.
If an midaemon error occurs, see the /var/opt/perf/status.mi file for more information.
Table 2 Error codes
Error Code Errno Value Meaning
-1 EINVAL Invalid arguments
-2 EPIPE ttd (registration daemon) not running
-3 ESRCH Transaction name not found in the ttd.conf file
-4 EOPNOTSUPP Operating system version not supported
369

370 Chapter 21

22 Transaction Metrics
The ARM agent provided as a shared component of both the GlancePlus and Performance Collection Component, produces many different transaction metrics. To see a complete list of the metrics and their descriptions:
• For installed GlancePlus metrics, use the GlancePlus online help or see the GlancePlus for HP-UX Dictionary of Performance Metrics located:
On UNIX/Linux under /<InstallDir>/paperdocs/gp/C/ as gp-metrics.txt.
InstallDir is the directory in which Performance Collection Component is installed.
• For installed Performance Collection Component metrics for specific platforms, see the platform’s HP Operations Agent Dictionary of Operating System Performance Metrics files located:
On UNIX/Linux under /<InstallDir>/paperdocs/ovpa/C/ as met<platform>.txt.
On Windows under %ovinstalldir%paperdocs\ovpa\C as met<platform>.txt.
371

372 Chapter 22
23 Transaction Tracking Examples
This chapter contains a pseudocode example of how an application might be instrumented with ARM API calls, so that the transactions defined in the application can be monitored with Performance Collection Component or GlancePlus. This pseudocode example corresponds with the real time order processing scenario described in Chapter 18, What is Transaction Tracking?
Several example transaction configuration files are included in this chapter, including one that corresponds with the real time order processing scenario.
Pseudocode for Real Time Order Processing
This pseudocode example includes the ARM API calls used to define transactions for the real time order processing scenario described in Chapter 18, What is Transaction Tracking? This routine would be processed each time an operator answered the phone to handle a customer order. The lines containing the ARM API calls are highlighted with bold text in this example.
routine answer calls(){****************************************************** Register the transactions if first time in ****************************************************** if (transactions not registered) { appl_id = arm_init("Order Processing Application","*", 0,0,0) answer_phone_id = arm_getid(appl_id,"answer_phone","1st tran",0,0,0) if (answer_phone_id < 0) REGISTER OF ANSWER_PHONE FAILED - TAKE APPROPRIATE ACTION order_id = arm_getid(appl_id,"order","2nd tran",0,0,0) if (order_id < 0) REGISTER OF ORDER FAILED - TAKE APPROPRIATE ACTION check_id = arm_getid(appl_id,"check_db","3rd tran",0,0,0) if (check_id < 0) REGISTER OF CHECK DB FAILED - TAKE APPROPRIATE ACTION update_id = arm_getid(appl_id,"update","4th tran",0,0,0) if (update_id < 0) REGISTER OF UPDATE FAILED - TAKE APPROPRIATE ACTION } if transactions not registered****************************************************** Main transaction processing loop***************************************************** while (answering calls) {
373
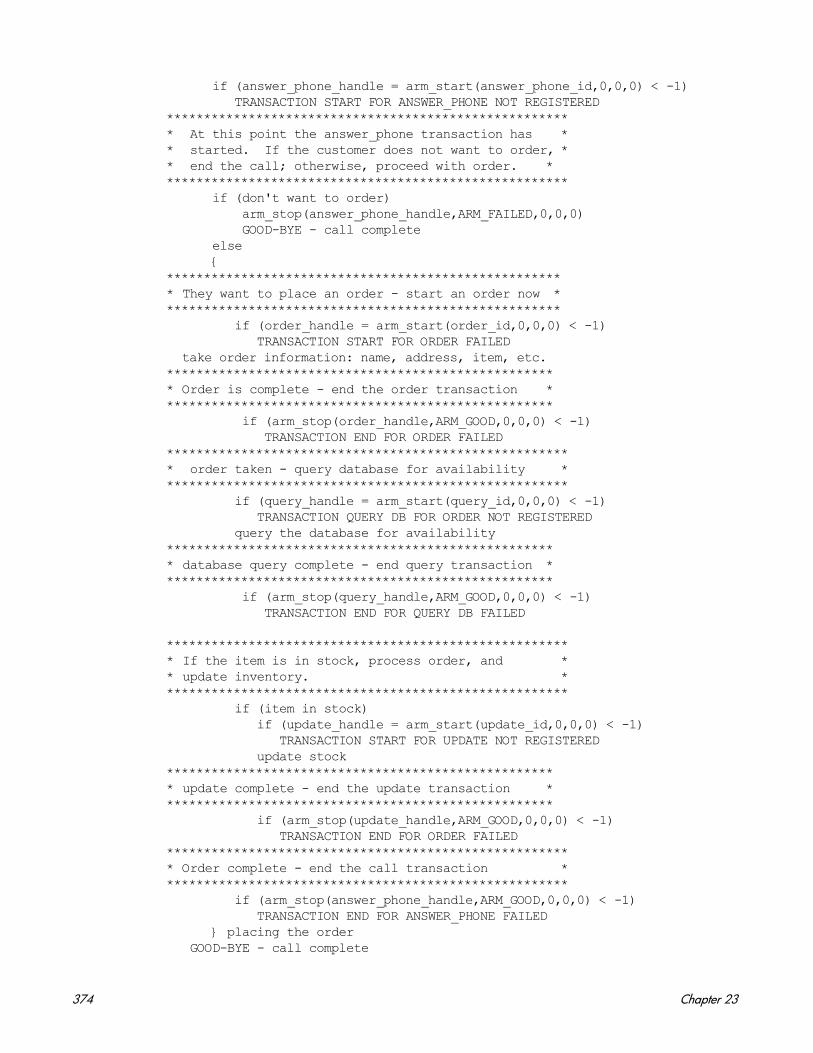
if (answer_phone_handle = arm_start(answer_phone_id,0,0,0) < -1) TRANSACTION START FOR ANSWER_PHONE NOT REGISTERED******************************************************* At this point the answer_phone transaction has ** started. If the customer does not want to order, ** end the call; otherwise, proceed with order. * ****************************************************** if (don't want to order) arm_stop(answer_phone_handle,ARM_FAILED,0,0,0) GOOD-BYE - call complete else {****************************************************** They want to place an order - start an order now ****************************************************** if (order_handle = arm_start(order_id,0,0,0) < -1) TRANSACTION START FOR ORDER FAILED take order information: name, address, item, etc.***************************************************** Order is complete - end the order transaction ***************************************************** if (arm_stop(order_handle,ARM_GOOD,0,0,0) < -1) TRANSACTION END FOR ORDER FAILED******************************************************* order taken - query database for availability ******************************************************* if (query_handle = arm_start(query_id,0,0,0) < -1) TRANSACTION QUERY DB FOR ORDER NOT REGISTERED query the database for availability***************************************************** database query complete - end query transaction ***************************************************** if (arm_stop(query_handle,ARM_GOOD,0,0,0) < -1) TRANSACTION END FOR QUERY DB FAILED
******************************************************* If the item is in stock, process order, and ** update inventory. ******************************************************* if (item in stock) if (update_handle = arm_start(update_id,0,0,0) < -1) TRANSACTION START FOR UPDATE NOT REGISTERED update stock***************************************************** update complete - end the update transaction ***************************************************** if (arm_stop(update_handle,ARM_GOOD,0,0,0) < -1) TRANSACTION END FOR ORDER FAILED******************************************************* Order complete - end the call transaction ******************************************************* if (arm_stop(answer_phone_handle,ARM_GOOD,0,0,0) < -1) TRANSACTION END FOR ANSWER_PHONE FAILED } placing the order GOOD-BYE - call complete
374 Chapter 23
sleep("waiting for next phone call...zzz...") } while answering calls arm_end(appl_id, 0,0,0)} routine answer calls
Configuration File Examples
This section contains some examples of the transaction configuration file, /var/opt/perf/ttd.conf. For more information on the ttd.conf file and the configuration file keywords, see Chapter 19, How Transaction Tracking Works
Example 1 (for Order Processing Pseudocode Example)
# The "*" entry below is used as the default if none of the # entries match a registered transaction name.
tran=* range=0.5,1,1.5,2,3,4,5,6,7 slo=1tran=answer_phone* range=0.5,1,1.5,2,3,4,5,6,7 slo=5tran=order* range=0.5,1,1.5,2,3,4,5,6,7 slo=5tran=query_db* range=0.5,1,1.5,2,3,4,5,6,7 slo=5
Example 2
# The "*" entry below is used as the default if none of the # entries match a registered transaction name.
tran=* range=1,2,3,4,5,6,7,8 slo=5
# The entry below is for the only transaction being # tracked in this application. The "*" has been inserted # at the end of the tran name to catch any possible numbered# transactions. For example "First_Transaction1",# "First_Transaction2", etc.
tran=First_Transaction* range=1,2.2,3.3,4.0,5.5,10 slo=5.5
Example 3
# The "*" entry below is used as the default if none of the # entries match a registered transaction name.
tran=*tran=Transaction_One range=1,10,20,30,40,50,60 slo=30
Transaction Tracking Examples 375

Example 4
tran=FactoryStor* range=0.05, 0.10, 0.15 slo=3
# The entries below shows the use of an application name. # Transactions are grouped under the application name. This# example also shows the use of less than 10 ranges and# optional use of "slo."
[Inventory]tran=In_Stock range=0.001, 0.004, 0.008tran=Out_Stock range=0.001, 0.005tran=Returns range=0.1, 0.3, 0.7
[Pers]tran=Acctg range=0.5, 0.10, slo=5tran=Time_Cards range=0.010, 0.020
376 Chapter 23
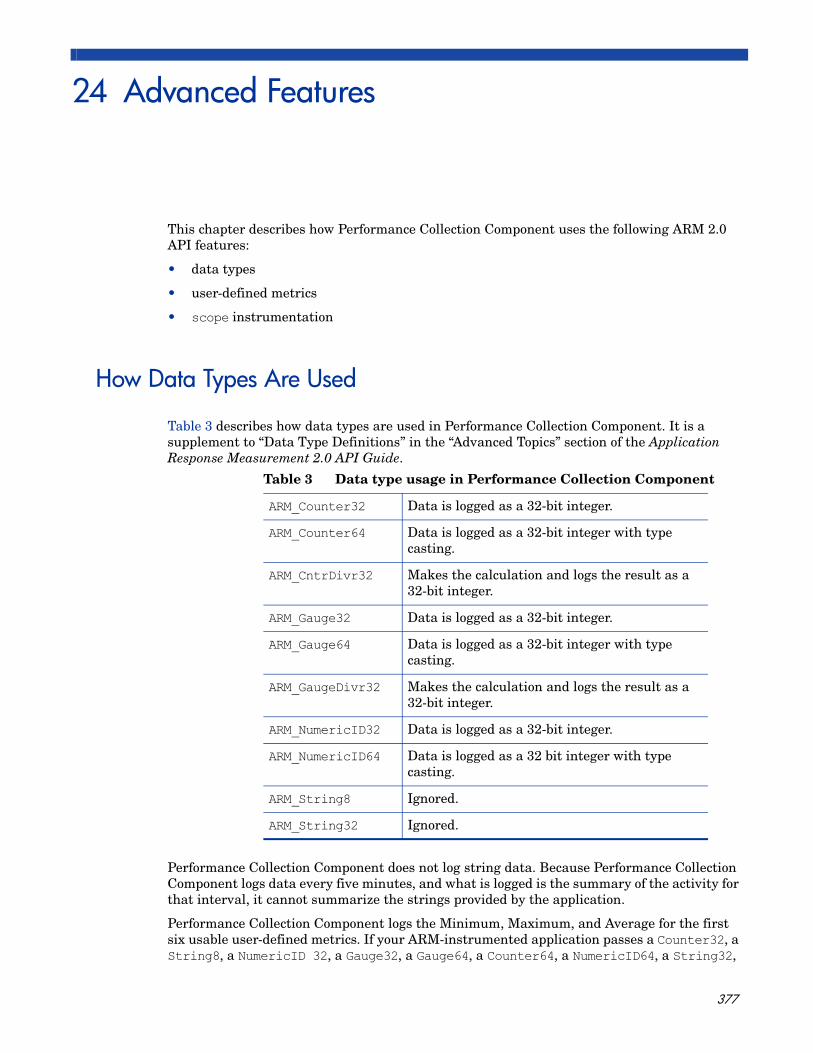
24 Advanced Features
This chapter describes how Performance Collection Component uses the following ARM 2.0 API features:
• data types
• user-defined metrics
• scope instrumentation
How Data Types Are Used
Table 3 describes how data types are used in Performance Collection Component. It is a supplement to “Data Type Definitions” in the “Advanced Topics” section of the Application Response Measurement 2.0 API Guide.
Performance Collection Component does not log string data. Because Performance Collection Component logs data every five minutes, and what is logged is the summary of the activity for that interval, it cannot summarize the strings provided by the application.
Performance Collection Component logs the Minimum, Maximum, and Average for the first six usable user-defined metrics. If your ARM-instrumented application passes a Counter32, a String8, a NumericID 32, a Gauge32, a Gauge64, a Counter64, a NumericID64, a String32,
Table 3 Data type usage in Performance Collection Component
ARM_Counter32 Data is logged as a 32-bit integer.
ARM_Counter64 Data is logged as a 32-bit integer with type casting.
ARM_CntrDivr32 Makes the calculation and logs the result as a 32-bit integer.
ARM_Gauge32 Data is logged as a 32-bit integer.
ARM_Gauge64 Data is logged as a 32-bit integer with type casting.
ARM_GaugeDivr32 Makes the calculation and logs the result as a 32-bit integer.
ARM_NumericID32 Data is logged as a 32-bit integer.
ARM_NumericID64 Data is logged as a 32 bit integer with type casting.
ARM_String8 Ignored.
ARM_String32 Ignored.
377

and a GaugeDivr32, Performance Collection Component logs the Min, Max, and Average over the five-minute interval for the Counter32, NumericID32, Gauge32, Gauge64, NumericID32 and NumericID64 as 32-bit integers. The String8 and String32 are ignored because strings cannot be summarized in Performance Collection Component. The GaugeDivr32 is also ignored because only the first six usable user-defined metrics are logged. (For more examples, see the next section, User-Defined Metrics.)
User-Defined Metrics
This section is a supplement to “Application-Defined Metrics” under “Advanced Topics” in the Application Response Measurement 2.0 API Guide. It contains some examples about how Performance Collection Component handles user-defined metrics (referred to as application-defined metrics in ARM). The examples in Table 4 show what is logged if your program passes the following data types.
Table 4 Examples of What is Logged with Specific Program Data Types
…what your program passes in …what is logged
EXAMPLE 1String8
Counter32
Gauge32
CntrDivr32
Counter32
Gauge32
CntrDivr32
EXAMPLE 2String32
NumericID32
NumericID64
NumericID32
NumericID64
378 Chapter 24
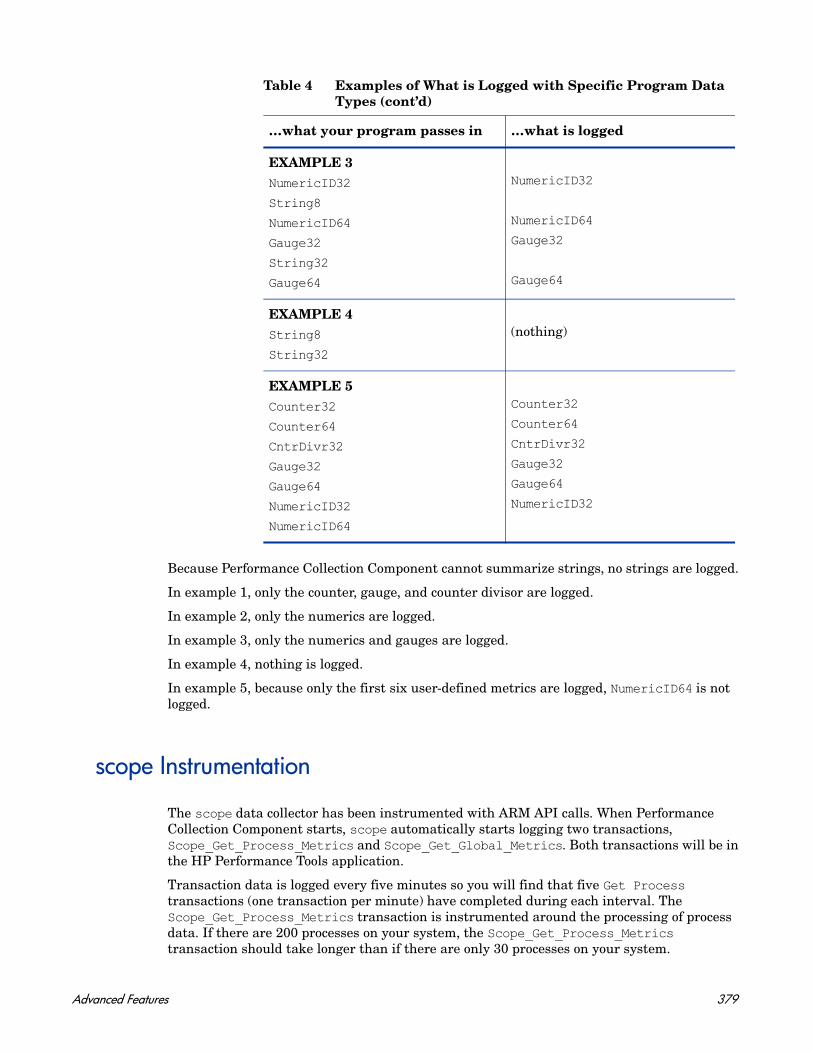
Because Performance Collection Component cannot summarize strings, no strings are logged.
In example 1, only the counter, gauge, and counter divisor are logged.
In example 2, only the numerics are logged.
In example 3, only the numerics and gauges are logged.
In example 4, nothing is logged.
In example 5, because only the first six user-defined metrics are logged, NumericID64 is not logged.
scope Instrumentation
The scope data collector has been instrumented with ARM API calls. When Performance Collection Component starts, scope automatically starts logging two transactions, Scope_Get_Process_Metrics and Scope_Get_Global_Metrics. Both transactions will be in the HP Performance Tools application.
Transaction data is logged every five minutes so you will find that five Get Process transactions (one transaction per minute) have completed during each interval. The Scope_Get_Process_Metrics transaction is instrumented around the processing of process data. If there are 200 processes on your system, the Scope_Get_Process_Metrics transaction should take longer than if there are only 30 processes on your system.
EXAMPLE 3NumericID32
String8
NumericID64
Gauge32
String32
Gauge64
NumericID32
NumericID64
Gauge32
Gauge64
EXAMPLE 4String8
String32
(nothing)
EXAMPLE 5Counter32
Counter64
CntrDivr32
Gauge32
Gauge64
NumericID32
NumericID64
Counter32
Counter64
CntrDivr32
Gauge32
Gauge64
NumericID32
Table 4 Examples of What is Logged with Specific Program Data Types (cont’d)
…what your program passes in …what is logged
Advanced Features 379

The Scope_Get_Global_Metrics transaction is instrumented around the gathering of all five-minute data, including global data. This includes global, application, disk, transaction, and other data types.
To stop the logging of process and global transactions data, remove or comment out the entries for the scope transactions in the ttd.conf file.
380 Chapter 24

25 Transaction Libraries
This appendix discusses:
• the Application Response Measurement library (libarm)
• C compiler option examples by platform
• the Application Response Measurement NOP library (libarmNOP)
• using Java wrappers
ARM Library (libarm)
With Performance Collection Component and GlancePlus, the environment is set up to make it easy to compile and use the ARM facility. The libraries needed for development are located in /opt/perf/lib/. See the next section in this appendix for specific information about compiling.
The library files listed in Table 5 exist on an HP-UX 11.11 and beyond Performance Collection Component and GlancePlus installation:
Table 5 HP-UX 11.11 and Beyond Performance Collection Component and GlancePlus Library Files
/opt/perf/lib/
libarm.0 HP-UX 10.X compatible shared library for ARM (not thread safe). If you execute a program on HP-UX 11 that was linked on 10.20 with -larm, the 11.0 loader will automatically reference this library.
libarm.1 HP-UX 11 compatible shared library (thread safe). This will be referenced by programs that were linked with -larm on HP-UX releases. If a program linked on 10.20 references this library, (for example, if it was not linked with -L /opt/perf/lib, it may abort with an error such as "/usr/lib/dld.sl: Unresolved symbol: _thread_once (code) from libtt.sl".
libarm.sl A symbolic link to libarm.1
libarmNOP.sl “No-operation” shared library for ARM (the API calls succeed but do nothing; used for testing and on systems that do not have Performance Collection Component installed.
381
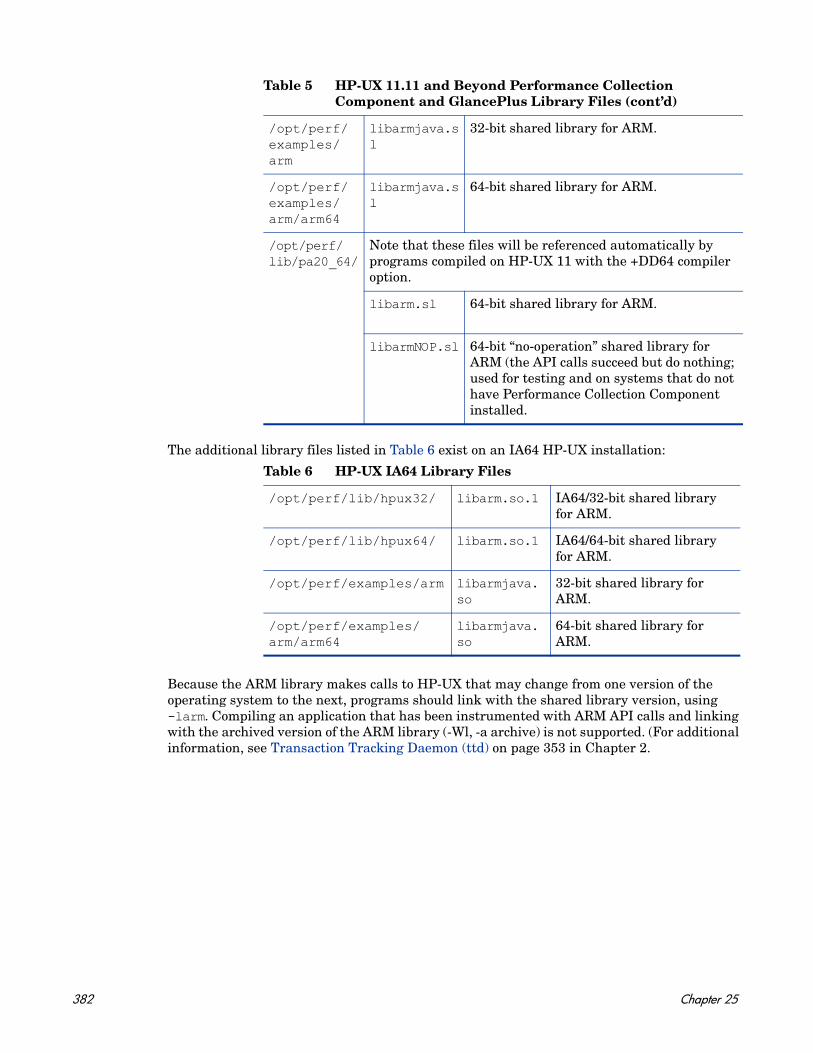
The additional library files listed in Table 6 exist on an IA64 HP-UX installation:
Because the ARM library makes calls to HP-UX that may change from one version of the operating system to the next, programs should link with the shared library version, using -larm. Compiling an application that has been instrumented with ARM API calls and linking with the archived version of the ARM library (-Wl, -a archive) is not supported. (For additional information, see Transaction Tracking Daemon (ttd) on page 353 in Chapter 2.
/opt/perf/examples/arm
libarmjava.sl
32-bit shared library for ARM.
/opt/perf/examples/arm/arm64
libarmjava.sl
64-bit shared library for ARM.
/opt/perf/lib/pa20_64/
Note that these files will be referenced automatically by programs compiled on HP-UX 11 with the +DD64 compiler option.
libarm.sl 64-bit shared library for ARM.
libarmNOP.sl 64-bit “no-operation” shared library for ARM (the API calls succeed but do nothing; used for testing and on systems that do not have Performance Collection Component installed.
Table 6 HP-UX IA64 Library Files
/opt/perf/lib/hpux32/ libarm.so.1 IA64/32-bit shared library for ARM.
/opt/perf/lib/hpux64/ libarm.so.1 IA64/64-bit shared library for ARM.
/opt/perf/examples/arm libarmjava.so
32-bit shared library for ARM.
/opt/perf/examples/arm/arm64
libarmjava.so
64-bit shared library for ARM.
Table 5 HP-UX 11.11 and Beyond Performance Collection Component and GlancePlus Library Files (cont’d)
382 Chapter 25
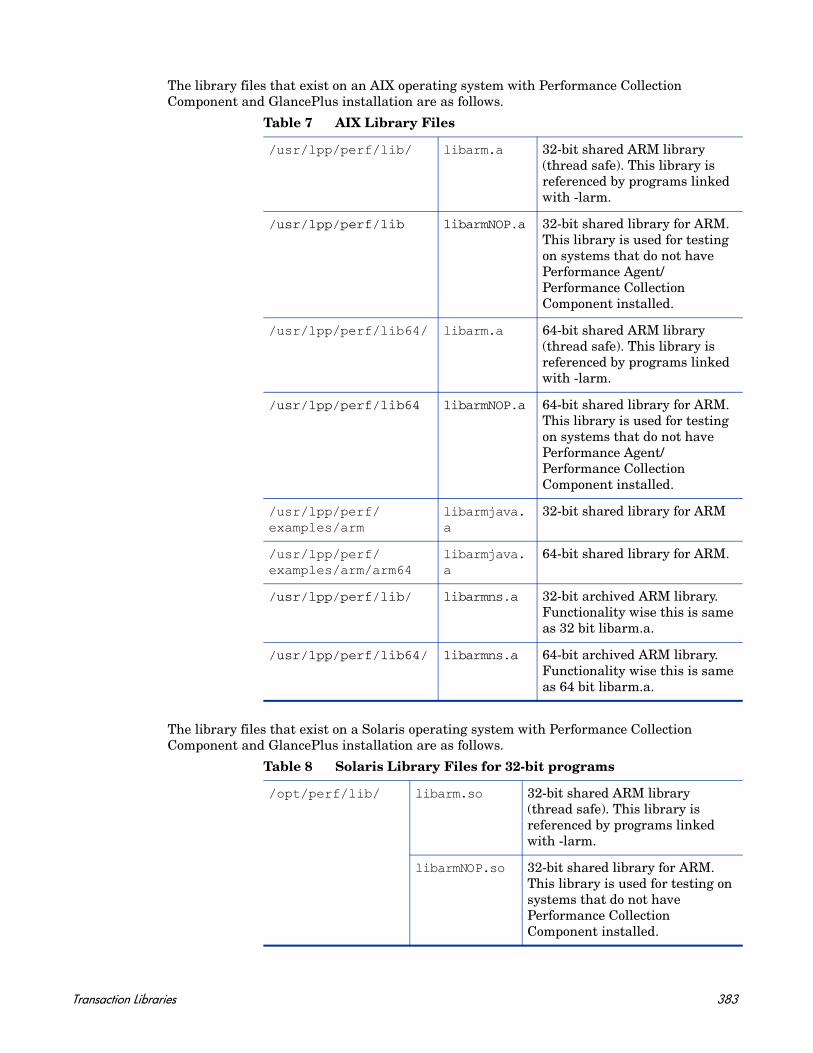
The library files that exist on an AIX operating system with Performance Collection Component and GlancePlus installation are as follows.
The library files that exist on a Solaris operating system with Performance Collection Component and GlancePlus installation are as follows.
Table 7 AIX Library Files
/usr/lpp/perf/lib/ libarm.a 32-bit shared ARM library (thread safe). This library is referenced by programs linked with -larm.
/usr/lpp/perf/lib libarmNOP.a 32-bit shared library for ARM. This library is used for testing on systems that do not have Performance Agent/Performance Collection Component installed.
/usr/lpp/perf/lib64/ libarm.a 64-bit shared ARM library (thread safe). This library is referenced by programs linked with -larm.
/usr/lpp/perf/lib64 libarmNOP.a 64-bit shared library for ARM. This library is used for testing on systems that do not have Performance Agent/Performance Collection Component installed.
/usr/lpp/perf/examples/arm
libarmjava.a
32-bit shared library for ARM
/usr/lpp/perf/examples/arm/arm64
libarmjava.a
64-bit shared library for ARM.
/usr/lpp/perf/lib/ libarmns.a 32-bit archived ARM library. Functionality wise this is same as 32 bit libarm.a.
/usr/lpp/perf/lib64/ libarmns.a 64-bit archived ARM library. Functionality wise this is same as 64 bit libarm.a.
Table 8 Solaris Library Files for 32-bit programs
/opt/perf/lib/ libarm.so 32-bit shared ARM library (thread safe). This library is referenced by programs linked with -larm.
libarmNOP.so 32-bit shared library for ARM. This library is used for testing on systems that do not have Performance Collection Component installed.
Transaction Libraries 383

Table 9 Solaris Library Files for Sparc 64-bit programs
/opt/perf/lib/sparc_64/
libarm.so 64-bit shared ARM library (thread safe). This library is referenced by programs linked with -larm.
libarmNOP.so 64-bit shared library for ARM This library is used for testing on systems that do not have Performance agent/Performance Collection Component installed.
/opt/perf/examples/arm
libarmjava.so
32-bit shared library for ARM.
/opt/perf/examples/arm/arm64
libarmjava.so
64-bit shared library for ARM.
Table 10 Solaris Library Files for x86 64-bit programs
/opt/perf/lib/x86_64/
libarm.so 64-bit shared ARM library (thread safe). This library is referenced by programs linked with -larm.
libarmNOP.so 64-bit shared library for ARM This library is used for testing on systems that do not have Performance agent installed.
/opt/perf/examples/arm
libarmjava.so
32-bit shared library for ARM.
/opt/perf/examples/arm/arm64
libarmjava.so
64-bit shared library for ARM.
You must compile 64-bit programs using -xarch=generic64 command-line parameter along with the other parameters provided for 32-bit programs.
384 Chapter 25
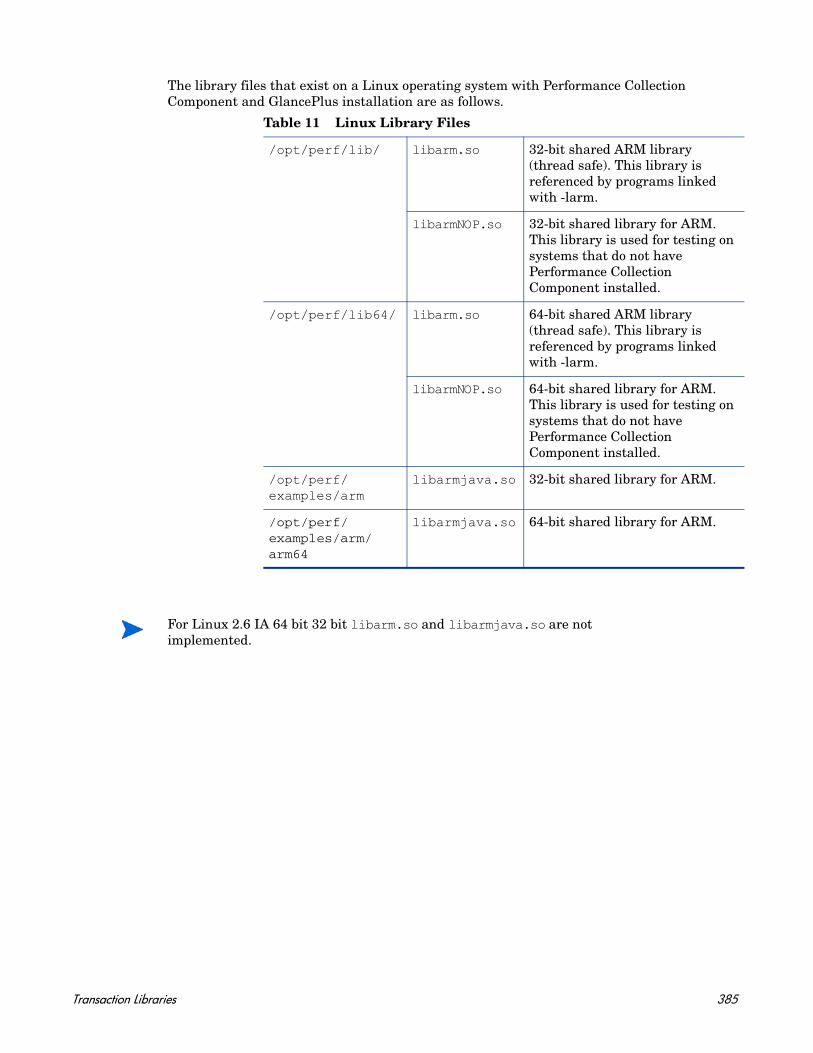
The library files that exist on a Linux operating system with Performance Collection Component and GlancePlus installation are as follows.
Table 11 Linux Library Files
/opt/perf/lib/ libarm.so 32-bit shared ARM library (thread safe). This library is referenced by programs linked with -larm.
libarmNOP.so 32-bit shared library for ARM. This library is used for testing on systems that do not have Performance Collection Component installed.
/opt/perf/lib64/ libarm.so 64-bit shared ARM library (thread safe). This library is referenced by programs linked with -larm.
libarmNOP.so 64-bit shared library for ARM. This library is used for testing on systems that do not have Performance Collection Component installed.
/opt/perf/examples/arm
libarmjava.so 32-bit shared library for ARM.
/opt/perf/examples/arm/arm64
libarmjava.so 64-bit shared library for ARM.
For Linux 2.6 IA 64 bit 32 bit libarm.so and libarmjava.so are not implemented.
Transaction Libraries 385

C Compiler Option Examples by Platform
The arm.h include file is located in /opt/perf/include/. For convenience, this file is accessible via a symbolic link from /usr/include/ as well. This means that you do not need to use “-I/opt/perf/include/” (although you may). Likewise, libarm resides in /opt/perf/lib/ but is linked from /usr/lib/. You should always use “-L/opt/perf/lib/” when building ARMed applications.
• For Linux:
The following example shows a compile command for a C program using the ARM API.
cc myfile.c -o myfile -I /opt/perf/include -L -Xlinker -rpath -Xlinker /opt/perf/lib
• For 64-bit programs on Linux:
cc –m64 myfile.c -o myfile -I /opt/perf/include –L -Xlinker -rpath -Xlinker /opt/perf/lib64
• For HP-UX:
For HP-UX releases 11.2x on IA64 platforms, change the -L parameter from -L/opt/perf/lib to -L/opt/perf/lib/hpux32 for 32-bit IA ARMed program compiles, and to -L/opt/perf/lib/hpux64 for 64-bit IA program compiles using ARM.
The following example shows a compile command for a C program using the ARM API.
cc myfile.c -o myfile -I /opt/perf/include -L /opt/perf/lib -larm
• For Sun Solaris:
The following example works for Performance Collection Component and GlancePlus on Sun Solaris:
cc myfile.c -o myfile -I /opt/perf/include -L /opt/perf/lib -larm -lnsl
• For 64-bit Sparc programs on Sun Solaris:
The following example works for Performance Collection Component and 64-bit programs on Sun Solaris:
cc -xarch=generic64 myfile.c -o myfile -I /opt/perf/include -L /opt/perf/lib/sparc_64 -larm -lnsl
• For 64-bit x86 programs on Sun Solaris:
The following example works for Performance agent and 64-bit programs on Sun Solaris:
cc -xarch=generic64 myfile.c -o myfile -I /opt/perf/include -L /opt/perf/lib/x86_64 -larm -lnsl
• For IBM AIX:
The file placement on IBM AIX differs from the other platforms (/usr/lpp/perf/ is used instead of /opt/perf/), therefore the example for IBM AIX is different from the examples of other platforms:
cc myfile.c -o myfile -I /usr/lpp/perf/include -L /usr/lpp/perf/lib -larm
• For 64-bit programs on IBM AIX:
The following example works for Performance agent and 64-bit programs on IBM AIX:
cc –q64 myfile.c -o myfile -I /usr/lpp/perf/include -L /usr/lpp/perf/lib64 –larm
386 Chapter 25

For C++ compilers, the -D_PROTOTYPES flag may need to be added to the compile command in order to reference the proper declarations in the arm.h file.
Transaction Libraries 387

ARM NOP Library
The “no-operation” library (named libarmNOP.* where * is sl, so, or a, depending on the OS platform) is shipped with Performance Collection Component and Glance. This shared library does nothing except return valid status for every ARM API call. This allows an application that has been instrumented with ARM to run on a system where Performance Collection Component or GlancePlus is not installed.
To run your ARM-instrumented application on a system where Performance Collection Component or GlancePlus is not installed, copy the NOP library and name it libarm.sl (libarm.so, or libarm.a depending on the platform) in the appropriate directory (typically, /<InstallDir>/lib/). When Performance Collection Component or GlancePlus is installed, it will overwrite this NOP library with the correct functional library (which is not removed as the other files are). This ensures that instrumented programs will not abort when Performance Collection Component or GlancePlus is removed from the system.
Using the Java Wrappers
The Java Native Interface (JNI) wrappers are functions created for your convenience to allow the Java applications to call the HP ARM2.0 API. These wrappers (armapi.jar) are included with the ARM sample programs located in the /<InstallDir>/examples/arm/ directory. InstallDir is the directory in which Performance Collection Component is installed.
Examples
Examples of the Java wrappers are located in the /<InstallDir>/examples/arm/ directory. This location also contains a README file, which explains the function of each wrapper.
Setting Up an Application (arm_init)
To set up a new application, make a new instance of ARMApplication and pass the name and the description for this API. Each application needs to be identified by a unique name. The ARMApplication class uses the C – function arm_init.
Syntax:
ARMApplication myApplication =new ARMApplication(“name”,”description”);
Setting Up a Transaction (arm_getid)
To set up a new transaction, you can choose whether or not you want to use user-defined metrics (UDMs). The Java wrappers use the C – function arm_getid.
388 Chapter 25
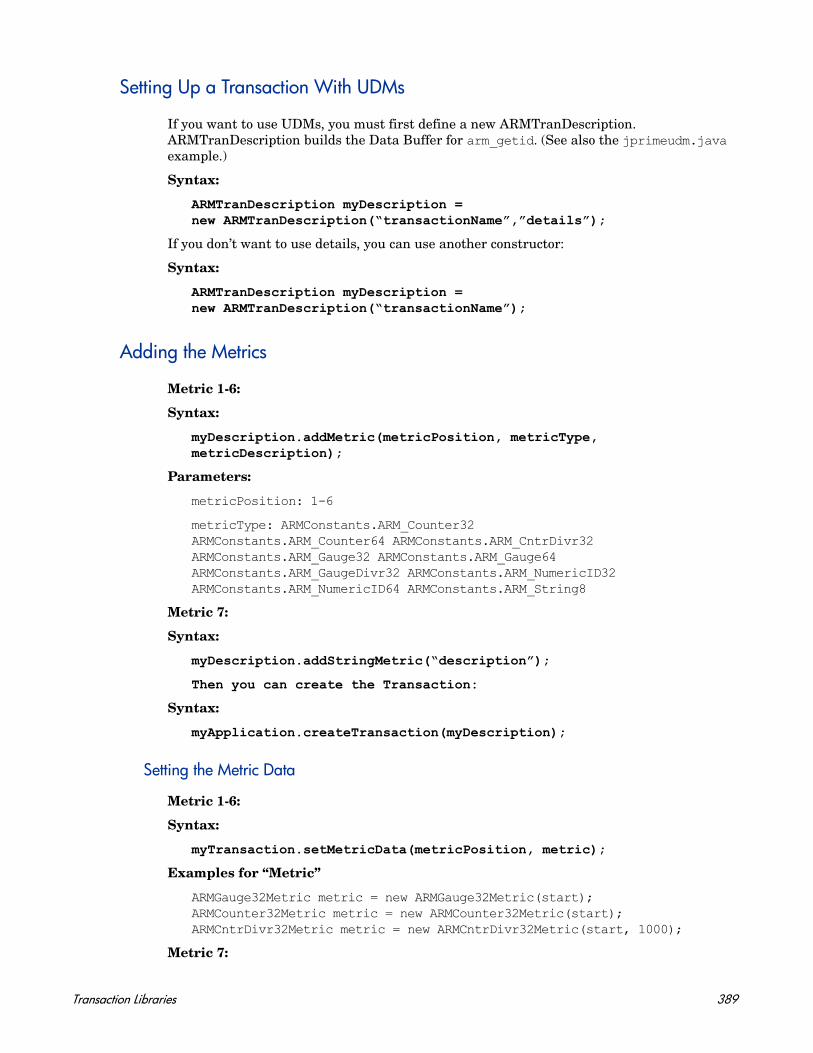
Setting Up a Transaction With UDMs
If you want to use UDMs, you must first define a new ARMTranDescription. ARMTranDescription builds the Data Buffer for arm_getid. (See also the jprimeudm.java example.)
Syntax:
ARMTranDescription myDescription =new ARMTranDescription(“transactionName”,”details”);
If you don’t want to use details, you can use another constructor:
Syntax:
ARMTranDescription myDescription =new ARMTranDescription(“transactionName”);
Adding the Metrics
Metric 1-6:
Syntax:
myDescription.addMetric(metricPosition, metricType, metricDescription);
Parameters:
metricPosition: 1-6
metricType: ARMConstants.ARM_Counter32ARMConstants.ARM_Counter64 ARMConstants.ARM_CntrDivr32 ARMConstants.ARM_Gauge32 ARMConstants.ARM_Gauge64 ARMConstants.ARM_GaugeDivr32 ARMConstants.ARM_NumericID32 ARMConstants.ARM_NumericID64 ARMConstants.ARM_String8
Metric 7:
Syntax:
myDescription.addStringMetric(“description”);
Then you can create the Transaction:
Syntax:
myApplication.createTransaction(myDescription);
Setting the Metric Data
Metric 1-6:
Syntax:
myTransaction.setMetricData(metricPosition, metric);
Examples for “Metric”
ARMGauge32Metric metric = new ARMGauge32Metric(start);ARMCounter32Metric metric = new ARMCounter32Metric(start);ARMCntrDivr32Metric metric = new ARMCntrDivr32Metric(start, 1000);
Metric 7:
Transaction Libraries 389

Syntax:
myTransaction.setStringMetricData(text);
Setting Up a Transaction Without UDMs
When you set up a transaction without UDMs, you can immediately create the new transaction. You can choose whether or not to specify details.
With Details
Syntax:
ARMTransaction myTransaction = myApplication.createTransaction(“Transactionname”,”details”;
Without Details
Syntax:
ARMTransaction myTransaction = myApplication.createTransaction(“Transactionname”);
Setting Up a Transaction Instance
To set up a new transaction instance, make a new instance of ARMTransactionInstance with the method createTransactionInstance() of ARMTransaction.
Syntax:
ARMTransactionInstance myTranInstance = myTransaction.createTransactionInstance();
Starting a Transaction Instance (arm_start)
To start a transaction instance, you can choose whether or not to use correlators. The following methods call the C – function arm_start with the relevant parameters.
Starting the Transaction Instance Using Correlators
When you use correlators, you must distinguish between getting and delivering a correlator.
Requesting a Correlator
If your transaction instance wants to request a correlator, the call is as follows (see also the jcorrelators.java example).
Syntax:
int status = myTranInstance.startTranWithCorrelator();
390 Chapter 25

Passing the Parent Correlator
If you already have a correlator from a previous transaction and you want to deliver it to your transaction, the syntax is as follows:
Syntax
int status = startTran(parent);
Parameter
parent is the delivered correlator. In the previous transaction, you can get the transaction instance correlator with the method getCorrelator().
Requesting and Passing the Parent Correlator
If you already have a correlator from a previous transaction and you want to deliver it to your transaction and request a correlator, the syntax is as follows:
Syntax:
int status = myTranInstance.startTranWithCorrelator(parent);
Parameter:
parent is the delivered correlator. In the previous transaction, you can get the transaction instance correlator with the method getCorrelator().
Retrieving the Correlator Information
You can retrieve the transaction instance correlator using the getCorrelator() method as follows:
Syntax:
ARMTranCorrelator parent = myTranInstance.getCorrelator();
Starting the Transaction Instance Without Using Correlators
When you do not use correlators, you can start your transaction instance as follows:
Syntax:
int status = myTranInstance.startTran();
startTran returns a unique handle to status, which is used for the update and stop.
Updating Transaction Instance Data
You can update the UDMs of your transaction instance any number of times between the start and stop. This part of the wrappers calls the C – function arm_update with the relevant parameters.
Transaction Libraries 391
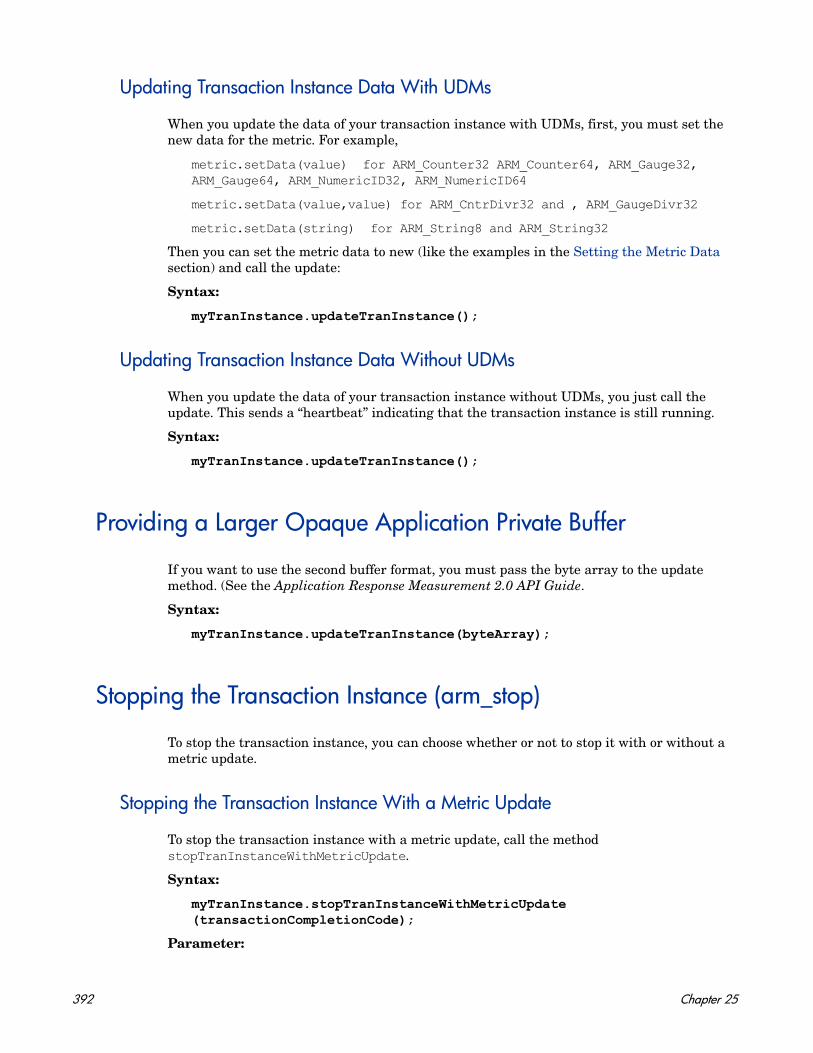
Updating Transaction Instance Data With UDMs
When you update the data of your transaction instance with UDMs, first, you must set the new data for the metric. For example,
metric.setData(value) for ARM_Counter32 ARM_Counter64, ARM_Gauge32, ARM_Gauge64, ARM_NumericID32, ARM_NumericID64
metric.setData(value,value) for ARM_CntrDivr32 and , ARM_GaugeDivr32
metric.setData(string) for ARM_String8 and ARM_String32
Then you can set the metric data to new (like the examples in the Setting the Metric Data section) and call the update:
Syntax:
myTranInstance.updateTranInstance();
Updating Transaction Instance Data Without UDMs
When you update the data of your transaction instance without UDMs, you just call the update. This sends a “heartbeat” indicating that the transaction instance is still running.
Syntax:
myTranInstance.updateTranInstance();
Providing a Larger Opaque Application Private Buffer
If you want to use the second buffer format, you must pass the byte array to the update method. (See the Application Response Measurement 2.0 API Guide.
Syntax:
myTranInstance.updateTranInstance(byteArray);
Stopping the Transaction Instance (arm_stop)
To stop the transaction instance, you can choose whether or not to stop it with or without a metric update.
Stopping the Transaction Instance With a Metric Update
To stop the transaction instance with a metric update, call the method stopTranInstanceWithMetricUpdate.
Syntax:
myTranInstance.stopTranInstanceWithMetricUpdate (transactionCompletionCode);
Parameter:
392 Chapter 25

The transaction Completion Code can be:
These methods use the C – function arm_stop with the requested parameters.
Stopping the Transaction Instance Without a Metric Update
To stop the transaction instance without a metric update, you can use the method stopTranInstance.
Syntax:
myTranInstance.stopTranInstance(transactionCompletionCode);
Using Complete Transaction
The Java wrappers can use the arm_complete_transaction call. This call can be used to mark the end of a transaction that has lasted for a specified number of nanoseconds. This enables the real time integration of transaction response times measured outside of the ARM agent.
In addition to signaling the end of a transaction instance, additional information about the transaction (UDMs) can be provided in the optional data buffer.
(See also the jcomplete.java example.)
Using Complete Transaction With UDMs:
Syntax:
myTranInstance.completeTranWithUserData(status,responseTime;
Parameters:
ARMConstants. ARM_GOOD. Use this value when the operation ran normally and as expected.
ARMConstants.ARM_ABORT. Use this value when there is a fundamental failure in the system.
ARMConstants.ARM_FAILED. Use this value in applications where the transaction worked properly, but no result was generated.
Transaction Libraries 393

Using Complete Transaction Without UDMs:
Syntax:
myTranInstance.completeTran(status,responseTime);
Further Documentation
For further information about the Java classes, see the doc folder in the /<InstallDir>/examples/arm/ directory, which includes html-documentation for every Java class. Start with index.htm.
status • ARMConstants. ARM_GOOD Use this value when the operation ran normally and as expected.
• ARMConstants.ARM_ABORT Use this value when there was a fundamental failure in the system.
• ARMConstants.ARM_FAILED Use this value in applications where the transaction worked properly, but no result was generated.
responseTime This is the response time of the transaction in nanoseconds.
394 Chapter 25
26 Logging and Tracing
You can diagnose and troubleshoot problems in the HP Operations agent by using the logging and tracing mechanisms. The HP Operations agent stores error, warning, and general messages in log files for easy analysis.
The tracing mechanism helps you trace specific problems in the agent’s operation; you can transfer the trace files generated by the tracing mechanism to HP Support for further analysis.
Logging
The HP Operations agent writes warning and error messages and informational notifications in the System.txt file on the node. The contents of the System.txt file reveal if the agent is functioning as expected. You can find the System.txt file in the following location:
On Windows
%ovdatadir%log
On UNIX/Linux
/var/opt/OV/log
In addition, the HP Operations agent adds the status details of the Performance Collection Component and coda in the following files:
On Windows
• %ovdatadir%\status.scope
• %ovdatadir%\status.perfalarm
• %ovdatadir%\status.ttd
• %ovdatadir%\status.mi
• %ovdatadir%\status.perfd-<port>
• %ovdatadir%\log\coda.txt
On UNIX/Linux
• /var/opt/perf/status.scope
• /var/opt/perf/status.perfalarm
• /var/opt/perf/status.ttd
• /var/opt/perf/status.mi
In this instance, <port> is the port used by perfd. By default, perfd uses the port 5227. To change the default port of perfd, see Configuring the RTMA Component on page 52.
395
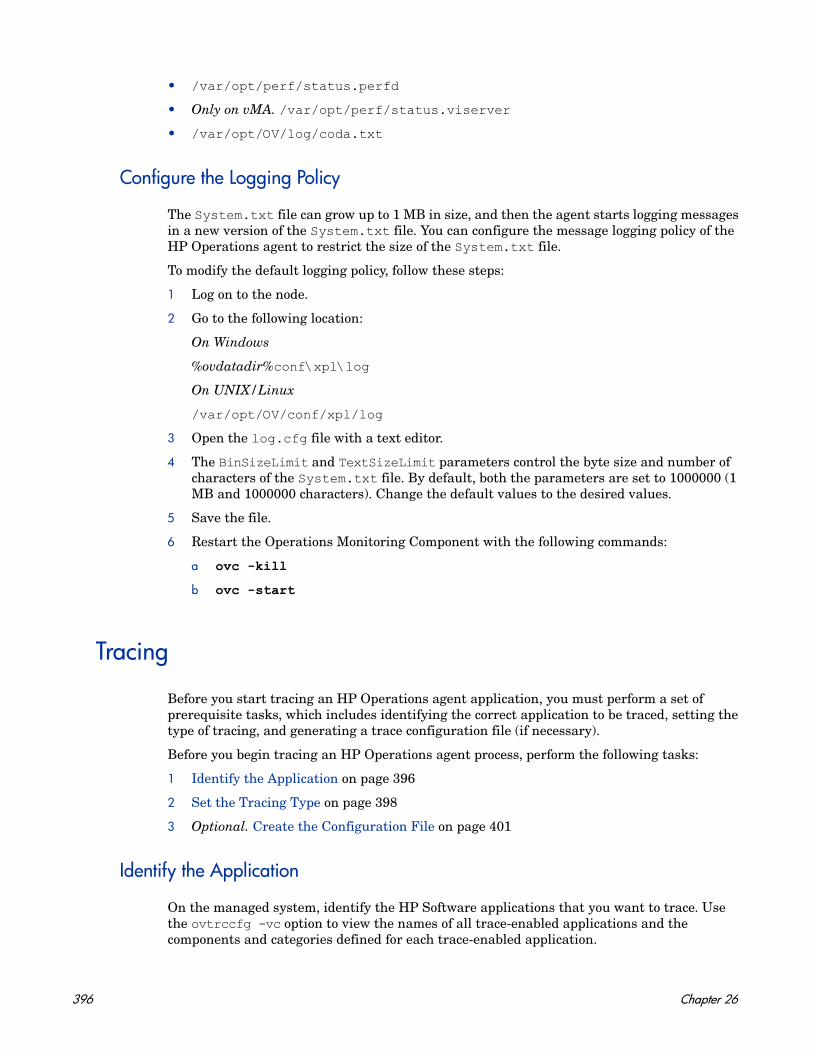
• /var/opt/perf/status.perfd
• Only on vMA. /var/opt/perf/status.viserver
• /var/opt/OV/log/coda.txt
Configure the Logging Policy
The System.txt file can grow up to 1 MB in size, and then the agent starts logging messages in a new version of the System.txt file. You can configure the message logging policy of the HP Operations agent to restrict the size of the System.txt file.
To modify the default logging policy, follow these steps:
1 Log on to the node.
2 Go to the following location:
On Windows
%ovdatadir%conf\xpl\log
On UNIX/Linux
/var/opt/OV/conf/xpl/log
3 Open the log.cfg file with a text editor.
4 The BinSizeLimit and TextSizeLimit parameters control the byte size and number of characters of the System.txt file. By default, both the parameters are set to 1000000 (1 MB and 1000000 characters). Change the default values to the desired values.
5 Save the file.
6 Restart the Operations Monitoring Component with the following commands:
a ovc -kill
b ovc -start
Tracing
Before you start tracing an HP Operations agent application, you must perform a set of prerequisite tasks, which includes identifying the correct application to be traced, setting the type of tracing, and generating a trace configuration file (if necessary).
Before you begin tracing an HP Operations agent process, perform the following tasks:
1 Identify the Application on page 396
2 Set the Tracing Type on page 398
3 Optional. Create the Configuration File on page 401
Identify the Application
On the managed system, identify the HP Software applications that you want to trace. Use the ovtrccfg -vc option to view the names of all trace-enabled applications and the components and categories defined for each trace-enabled application.
396 Chapter 26
Alternatively, you can use the ovtrcgui utility to view the list of trace-enabled applications. To use the ovtrcgui utility to view the list of trace-enabled applications, follow these steps:
1 Run the ovtrcgui.exe file from the %OvInstallDir%\support directory. The ovtrcgui window opens.
2 In the ovtrcgui window, click File → New → Trace Configuration. A new trace configuration editor opens.
Logging and Tracing 397

3 In the ovtrcgui window, click Edit → Add Application. Alternatively, right-click on the editor, and then click Add Application. The Add Application window opens.
The Add Application window presents a list of available trace-enabled applications.
Set the Tracing Type
Before you enable the tracing mechanism, decide and set the type of tracing that you want to configure with an application. To set the type of tracing, follow these steps:
Determine the type of tracing (static or dynamic) you want to configure, and then follow these steps:
1 Go to the location <data_dir>/conf/xpl/trc/
2 Locate the <application_name>.ini file. If the file is present, go to step step 3. If the <application_name>.ini file is not present, follow these steps:
• Create a new file with a text editor.
• Add the following properties to the file in the given order: DoTrace, UpdateTemplate, and DynamicTracing.
• Save the file.
3 Open the <application_name>.ini file with a text editor.
4 To enable the static tracing, make sure that the DoTrace property is set to ON and the DynamicTracing property is set to OFF.
Do not list the properties in a single line. List every property in a new line. For example:
DoTrace=
UpDateTemplate=
DynamicTracing=
398 Chapter 26
5 To enable the dynamic tracing, make sure that the DoTrace and DynamicTracing properties are set to ON.
6 Make sure that the UpdateTemplate property is set to ON.
7 Save the file.
For the dynamic trace configuration, you can enable the tracing mechanism even after the application starts. For the static trace configuration, you must enable the tracing mechanism before the application starts.
Introduction to the Trace Configuration File
Syntax
TCF Version <version_number>APP: "<application_name>"SINK: File "<file_name>" "maxfiles=[1..100];maxsize=[0..1000];"TRACE: "<component_name>" "<category_name>" <keyword_list>
Each line of the syntax is described in detail in the following sections.
TCF Version
The TCF version line specifies that this is a trace configuration file and also specifies the version number of the file. It is case-sensitive and must be specified exactly as shown below:
Syntax:
TCF Version <version_number>
Example:
TCF Version 1.1
APP
The application line defines the name of the application to be traced. It must start with APP followed by a colon (:) and a space and the application name should be in double quotes ("..."). Multiple applications can be specified for the trace. Repeat this pattern for each application that you want to trace.
Syntax:
APP: "<application_name>"
Example:
APP: "dbmanager"APP: "opcmsg"APP: "poller"
SINK
The sink line specifies the target file to which the trace output is directed. The target must be a file on the same machine. The line must begin with SINK: FILE. The arguments on the line should be separated by spaces.
The SINK: FILE line has two arguments.
The first argument is the name of the target file and must be in double quotes ("...").
Logging and Tracing 399

The second argument is additional sink type options. The options must be in double quotes ("..."), and each option must be followed by a semi-colon (;).
The options for the sink type File are:
• maxfiles=n
• maxsize=n
maxfiles
The maxfiles option is followed by an integer value between 1 and 100. This option enables you to specify the number of historic trace log files to be retained. Each time an application starts to trace to the file, a backup is made of the previous file (if any) by adding ".001" to the name and renaming the file. If there was a ".001" file already, then it is renamed to ".002" and so on. The same backup scheme is in effect if the current log file reaches the maximum size.
maxsize
The maxsize option is followed by an integer or float value between 0 and 1000 that specifies the maximum amount of disk space in megabytes (MB) to be used for each file.
If the last block of trace output written to the file makes the file larger than the specified maximum, then the next output will back up and close the current output file and a new output file to be created. A value of 0 is a special case that lets the file grow until you run out of disk space.
Syntax:
SINK: File "<file_name>" "maxfiles=[1..100];maxsize=[0..1000];"
Example:
SINK: File "C:\\TEMP\\Output.trc" "maxfiles=10;maxsize=100;"
TRACE
The trace line must begin with TRACE followed by a colon (:) and a space ( ). The arguments on the line must be separated by spaces.
The first argument is the trace component name and it must be in double quotes ("..."). Multiple components can be specified.
The second argument is the trace category name and it must also be in double quotes ("..."). Multiple components can be specified. If you are using one of the standard categories in the code, it is mapped to the string value which you specify here. For the exact mapping of standard category constants to string values, see the language-appropriate documentation (C++, Java).
Syntax:
TRACE: "<component_name>" "<category_name>" <keyword_list>
Example:
In an existing trace configuration file, you can observe the force option. This option is not supported with this version of the tracing utility and has no effect on the tracing mechanism. You can ignore this option while configuring the tracing mechanism.
Use the ovtrcmon or ovtrcgui tool to view the contents of the target file where the trace output was directed. Formatting is not orderly when the file is opened using standard text editors.
400 Chapter 26

TRACE: "database" "Parms" Error Info WarnTRACE: "xpl.io" "Trace" Info
You can use "*" as the component name, category name, or both. This is useful when using applications in the mode where they read their configuration information directly from a file.
When an application tries to determine the settings for component A and category B, it first looks to see if the configuration contains an explicit trace definition for this pair. If the trace definition is there, it uses these settings. If it is not, then it looks to see if there is a configuration for component A and category *. If there is, it uses these settings. If there is not, then it looks to see if there is a configuration for component * and category *. If there is, it uses those settings. If not, then the trace is not activated.
The remaining parameters are a variable list of keyword options. At least one of the keywords, Error, Info, or Warn, must be in the list. The supported keywords are:
Sample Trace Configuration Files
TCF Version 3.2APP: "dbmanager"SINK: File "C:\\TEMP\\Output.trc" "maxfiles=10;maxsize=100;"TRACE: "DbManager" "Parms" Error Info Warn Developer
Create the Configuration File
If you want to enable the tracing mechanism without the help of a configuration file, skip this section and go to Enabling Tracing and Viewing Trace Messages with the Command-Line Tools on page 406.
You can create the trace configuration file with the command-line tool ovtrccfg, with a text editor, or with the ovtrcgui utility (only on Windows nodes).
Using the Command-Line Tool
Run the following command to generate a trace configuration file:
ovtrccfg -app <application_name> [-cm <component_name>] [-sink <filename>] -gc <configuration_file_name>
The command creates the configuration file with the details of the applications and components that you want to trace.
Table 12 Trace Keywords
Keyword Description
Error Enable traces marked as errors.
Warn Enable traces marked as warnings.
Info Enable traces marked as information
Support Enables normal tracing. Trace output include Informational, Warnings, and Error messages. This option is recommended for troubleshooting problems. Tracing can be enabled for long duration as the overhead to capture trace output is minimal with this option.
Logging and Tracing 401

Using a Text Editor
If you want to manually create the configuration file with a text editor, follow these steps:
1 With a text editor, create a new file.
2 Specify the version number of the configuration file at the beginning in the following format:
TCF Version <version_number>
For example:
TCF Version 1.0
3 Specify the application that you want to trace in the following format:
APP <application_name>
For example:
APP “coda”
4 Specify the target location to store the trace files in the following format:
SINK: File “<filename>” “maxfiles=<max_files>;maxsize=<max_size>”
For example:
SINK: File "C:\\TEMP\\Output.trc" "maxfiles=10;maxsize=100;"
If you do not specify any value for the SINK parameter, the tracing mechanism starts placing the trace output files into the home directory of the traced application.
5 Specify the component and category that you want to trace in the following format:
TRACE: “<component_name>” “<category_name>” “<keyword_list>”
For example:
TRACE: "bbc.cb" "Parms" Error Info Warn
TRACE: "bbc.https.server" "Trace" Info
For more information on tracing keywords, see Trace Keywords on page 11.
6 Save the file with the tcf extension.
The trace file name must have the extension trc. Make sure to specify the complete path of the trace output file in the following format:
<drive>:\\<directory>\\<filename>
If you want to trace multiple components or category, add multiple TRACE statements with line breaks.
402 Chapter 26

Using the Tracing GUI
On the Windows nodes, you can use the tracing GUI (the ovtrcgui utility) to create the trace configuration file. To use this utility and create a trace configuration file, follow these steps:
1 Run the ovtrcgui.exe file from the %OvInstallDir%\support directory. The ovtrcgui window opens.
2 In the ovtrcgui window, click File → New → Trace Configuration. A new trace configuration editor opens.
Logging and Tracing 403

3 In the ovtrcgui window, click Edit → Add Application. Alternatively, right-click on the editor, and then click Add Application. The Add Application window opens.
4 Select the application that you want to trace, and then click OK. The Configuration for <application> window opens.
404 Chapter 26
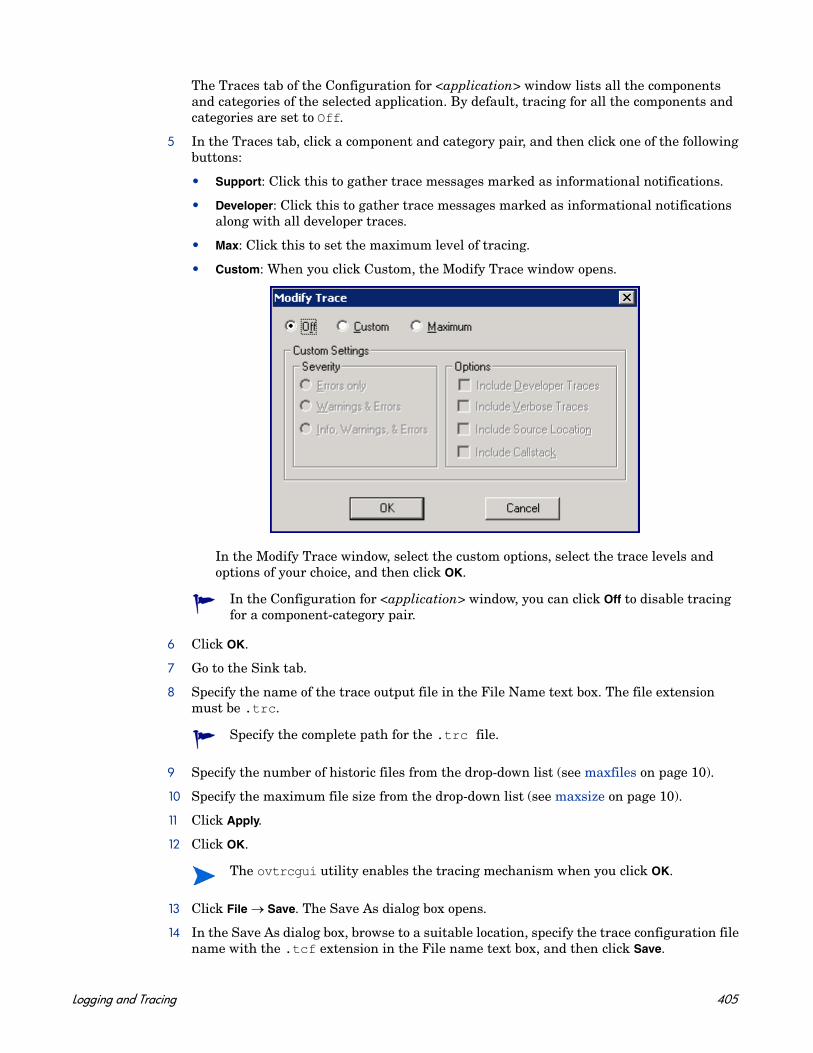
The Traces tab of the Configuration for <application> window lists all the components and categories of the selected application. By default, tracing for all the components and categories are set to Off.
5 In the Traces tab, click a component and category pair, and then click one of the following buttons:
• Support: Click this to gather trace messages marked as informational notifications.
• Developer: Click this to gather trace messages marked as informational notifications along with all developer traces.
• Max: Click this to set the maximum level of tracing.
• Custom: When you click Custom, the Modify Trace window opens.
In the Modify Trace window, select the custom options, select the trace levels and options of your choice, and then click OK.
6 Click OK.
7 Go to the Sink tab.
8 Specify the name of the trace output file in the File Name text box. The file extension must be .trc.
9 Specify the number of historic files from the drop-down list (see maxfiles on page 10).
10 Specify the maximum file size from the drop-down list (see maxsize on page 10).
11 Click Apply.
12 Click OK.
13 Click File → Save. The Save As dialog box opens.
14 In the Save As dialog box, browse to a suitable location, specify the trace configuration file name with the .tcf extension in the File name text box, and then click Save.
In the Configuration for <application> window, you can click Off to disable tracing for a component-category pair.
Specify the complete path for the .trc file.
The ovtrcgui utility enables the tracing mechanism when you click OK.
Logging and Tracing 405

The ovtrcgui utility saves the new trace configuration file into the specified location with the specified name and enables the tracing mechanism based on the configuration specified in the file. You can open the trace configuration file with the ovtrcgui utility and add new configuration details.
15 If you try to close the trace configuration editor or the ovtrcgui window, the following message appears:
16 If you click No, the tracing mechanism continues to trace the configured applications on the system. If you click Yes, the ovtrcgui utility immediately disables the tracing mechanism.
Enabling Tracing and Viewing Trace Messages with the Command-Line Tools
The procedure outlined below covers the general sequence of steps required to enable tracing. To enable the tracing mechanism, follow these steps:
1 Make a trace configuration request using ovtrccfg.
ovtrccfg -cf <configuration_file_name>
where <configuration_file_name> is the name of the trace configuration file created in Create the Configuration File on page 401.
2 If you configure the static tracing mechanism, start the application that you want to trace.
3 Run the application specific commands necessary to duplicate the problem that you want to trace. When the desired behavior has been duplicated, tracing can be stopped.
4 Make a trace monitor request using ovtrcmon.
To monitor trace messages, run one of the following commands or a similar command using additional ovtrcmon command options:
• To monitor trace messages from /opt/OV/bin/trace1.trc and direct trace messages to a file in the text format:
ovtrcmon -fromfile /opt/OV/bin/trace1.trc -tofile /tmp/traceout.txt
• To view trace messages from /opt/OV/bin/trace1.trc in the verbose format:
ovtrcmon -fromfile /opt/OV/bin/trace1.trc -verbose
If you do not want to use a trace configuration file, you can enable tracing with the following command:
ovtrccfg -app <application> [-cm <component>]
406 Chapter 26

• To view trace messages from /opt/OV/bin/trace1.trc in the verbose format and direct the trace message to a file:
ovtrcmon -fromfile /opt/OV/bin/trace1.trc -short > /tmp/traces.trc
5 To stop or disable tracing using ovtrccfg, run the following command:
ovtrccfg -off
6 Collect the trace configuration file and the trace output files. Evaluate the trace messages or package the files for transfer to HP Software Support Online for evaluation. There may be multiple versions of the trace output files on the system. The Maxfiles option allows the tracing mechanism to generate multiple trace output files. These files have the extension .trc and the suffix n (where n is an integer between 1 and 99999).
Enabling Tracing and Viewing Trace Messages with the Tracing GUI
On the Windows nodes, you can use the ovtrcgui utility to configure tracing and view the trace messages.
Enable the Tracing Mechanism
To enable the tracing mechanism with the ovtrcgui utility and without the help of a trace configuration file, follow these steps:
1 Follow step 1 on page 403 through step 6 on page 405 in Using the Tracing GUI on page 403.
2 Close the trace configuration editor.
3 Click No when prompted to save changes to Untitled.
The following message appears:
4 Click No. If you click Yes, the ovtrcgui utility immediately disables the tracing mechanism.
To enable the tracing mechanism with the ovtrcgui utility using a trace configuration file, go to the location on the local system where the trace configuration file is available, and then double-click on the trace configuration file. Alternatively, open the ovtrcgui utility, click File → Open, select the trace configuration file, and then click Open.
Logging and Tracing 407
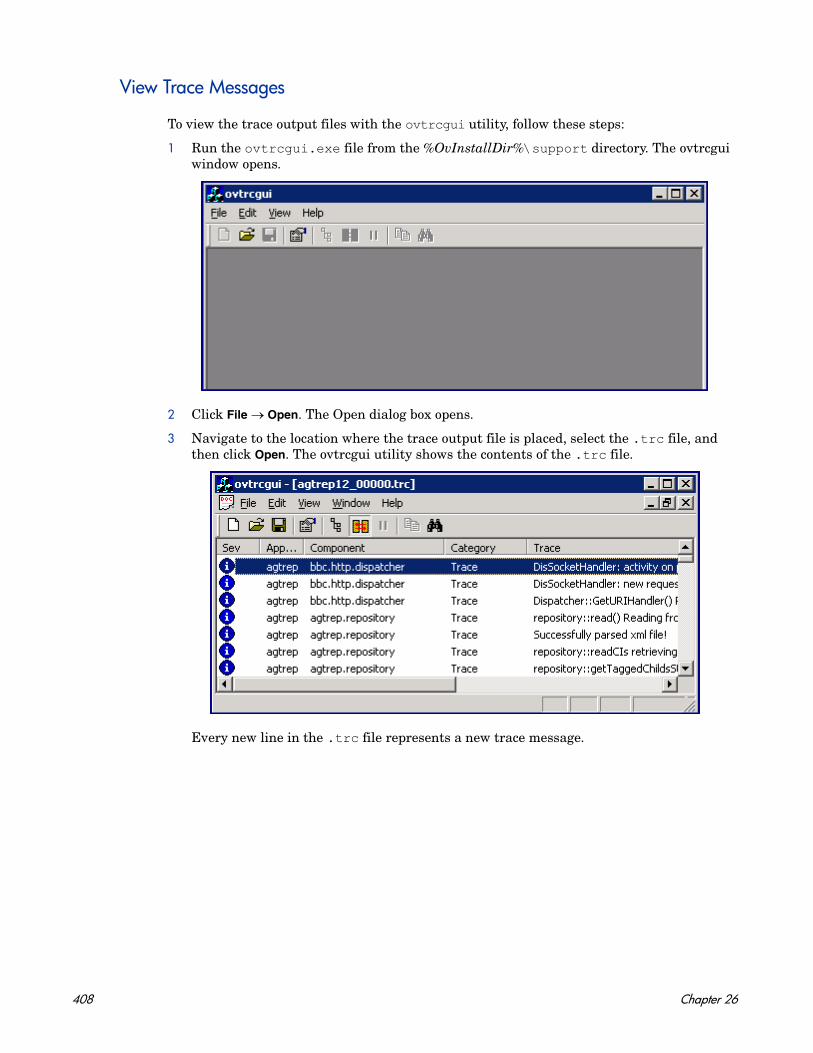
View Trace Messages
To view the trace output files with the ovtrcgui utility, follow these steps:
1 Run the ovtrcgui.exe file from the %OvInstallDir%\support directory. The ovtrcgui window opens.
2 Click File → Open. The Open dialog box opens.
3 Navigate to the location where the trace output file is placed, select the .trc file, and then click Open. The ovtrcgui utility shows the contents of the .trc file.
Every new line in the .trc file represents a new trace message.
408 Chapter 26

4 Double-click a trace message to view the details. The Trace Properties window opens.
The Trace Properties window presents the following details:
• Trace Info:
— Severity: The severity of the trace message.
— Count: The serial number for the message.
— Attributes: The attribute of the trace message.
— Component: Name of the component that issues the trace message.
— Category: An arbitrary name assigned by the traced application.
• Process Info:
— Machine: Hostname of the node.
— Application: Name of the traced application.
— PID: Process ID of the traced application.
— TID: Thread ID of the traced application.
• Time Info:
— Time: The local-equivalent time and date of the trace message.
— Tic count: A high-resolution elapsed time.
Logging and Tracing 409

— Tic difference:
• Location
— Source: Line number and file name of the source generating the trace.
— Stack: A description of the calling stack in the traced application.
5 Click Next to view the next trace message.
6 After viewing all the trace messages, click Cancel.
Use the Trace List View
By default, the ovtrcgui utility displays the trace messages for a trace file in the trace list view. The trace list view presents the trace messages in a tabular format.
The trace list view presents every trace message with the help of the following columns:
Table 13 Trace List View
Column Description
Severity Indicates the severity of the trace message. The view uses the following icons to display the severity of the messages:
• Info
• Warning
• Error
Application Displays the name of the traced application.
Component Displays the name of the component of the traced application that generated the trace message.
Category Displays the category of the trace message.
Trace Displays the trace message text.
410 Chapter 26

Use the Procedure Tree View
You can view the trace messages in a structured format in the procedure tree view. The procedure tree view sorts the messages based on the process IDs and thread IDs and presents the data in the form of a tree view.
You can expand the process IDs and thread IDs to view trace messages. To go back to the
trace list view, click .
Logging and Tracing 411
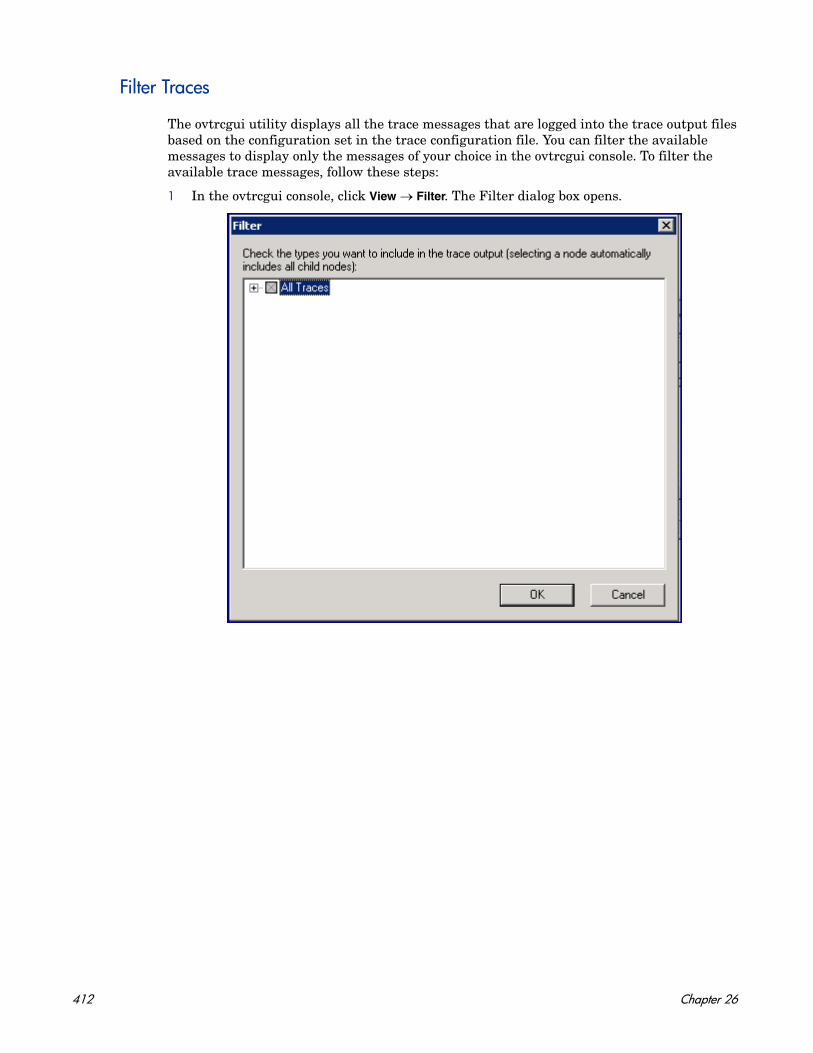
Filter Traces
The ovtrcgui utility displays all the trace messages that are logged into the trace output files based on the configuration set in the trace configuration file. You can filter the available messages to display only the messages of your choice in the ovtrcgui console. To filter the available trace messages, follow these steps:
1 In the ovtrcgui console, click View → Filter. The Filter dialog box opens.
412 Chapter 26
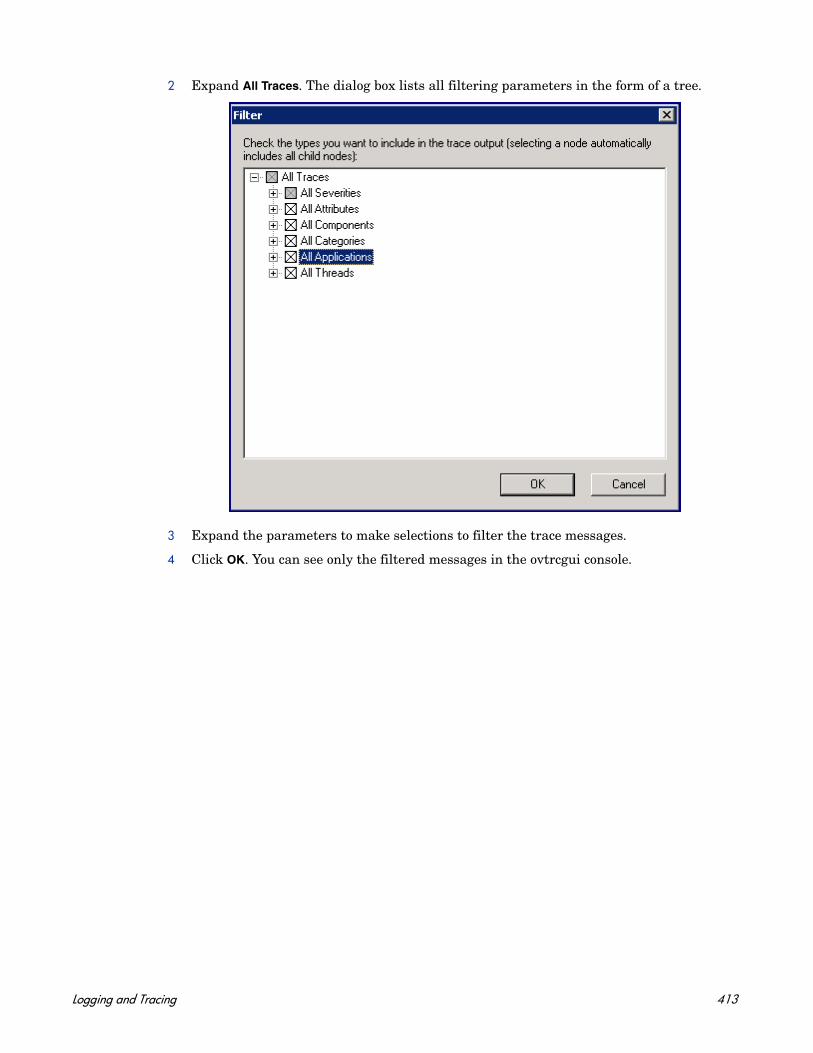
2 Expand All Traces. The dialog box lists all filtering parameters in the form of a tree.
3 Expand the parameters to make selections to filter the trace messages.
4 Click OK. You can see only the filtered messages in the ovtrcgui console.
Logging and Tracing 413

414 Chapter 26

27 Troubleshooting
This section describes the solutions or workarounds for the common problems encountered while working with the HP Operations agent 11.00. Areas covered in this section include:
• Operations Monitoring Component
• Performance Collection Component
• RTMA
Operations Monitoring Component
• Problem: On the Windows Server 2008 node, the opcmsga process does not function, and the ovc command shows the status of the opcmsga process as aborted.
Solution:
Set the OPC_RPC_ONLY variable to TRUE by running the following command:
ovconfchg -ns eaagt -set OPC_RPC_ONLY TRUE
• Problem: On Windows nodes, Perl scripts do not work from the policies.
Cause: Perl scripts available within the policies require the PATH configuration variable to include the directory where Perl (supplied with the HP Operations agent) is available.
Solution:
a Run the following command to set the PATH configuration variable to the Perl directory:
ovconfchg -ns ctrl.env -set PATH "%ovinstalldir%nonOV\perl\a\bin"
b Restart the agent by running the following commands:
— ovc -kill
— ovc -start
• Problem: Changes do not take effect after changing the variable values through the ovconfchg command.
Cause 1:
The variable requires the agent to be restarted.
Solution 1:
Restart the agent by running the following commands:
a ovc -kill
b ovc -start
Cause 2:
415
ConfigFile policies deployed on the node sets the variable to a certain value.
Solution:
If the deployed ConfigFile policies include commands to set the configuration variables to certain values, your changes through the ovconfchg command will not take effect. You must either remove the ConfigFile policies from the node, or modify the policies to include the commands that set the variables to the desired values.
Cause 3:
The profile or job file available on the node override your changes.
Solution:
Open the profile or job file on the node and make sure they do not include conflicting settings for the variables.
• Problem: After changing the value of the configuration variable SNMP_SESSION_MODE, the status of the opctrapi process is shown as Aborted by ovc.
Cause:
After you change the value of the configuration variable SNMP_SESSION_MODE, the HP Operations agent attempts to restart opctrapi. Occasionally, the process of restarting opctrapi fails.
Solution:
Restart opctrapi by running the following command:
ovc -start opctrapi
Performance Collection Component
• Problem: The following error appears in the status.midaemon file on the HP-UX 11.11 system:
mi_shared - MI initialization failed (status 28)
Cause: Large page size of the midaemon binary.
Solution: To resolve this, follow these steps:
a Log on to the system as the root user.
b Run the following command to stop the HP Operations agent:
/opt/OV/bin/opcagt -stop
c Run the following command to take a backup of midaemon:
cp /opt/perf/bin/midaemon /opt/perf/bin/midaemon.backup
d Run the following command to reduce the page size to 4K for the midaemon binary:
chatr +pi 4K /opt/perf/bin/midaemon
e Run the following command to start the HP Operations agent:
/opt/OV/bin/opcagt -start
• After installing the HP Operations agent, the following error message appears in the System.txt file if the tracing mechanism is enabled:
416 Chapter 27
Scope data source initialization failed
Solution: Ignore this error.
RTMA
• Problem: On the vSphere Management Assistant (vMA) node, the rtmd process does not function, and the ovc command shows the status of the rtmd process as aborted.
Cause: The rtmd process cannot resolve the hostname of the system to the IP address.
Solution:
a Log on to the node with the root privileges.
b From the /etc directory, open the hosts file with a text editor.
c Locate the line where the term localhost appears.
d Remove the # character from the beginning of the line.
e Save the file.
f Start all processes by running the following command:
ovc -restart
• Problem: The Diagnostic view of HP Performance Manager cannot access data.
Cause: The rtmd process is not running.
Solution: To check if the rtmd process is running on the HP Operations agent node, run ovc -status rtmd. To start the rtmd process, run ovc -start rtmd.
• Problem: The following error appears in the status.perfd file on the HP-UX 11.11 system:
mi_shared - MI initialization failed (status 28)
Cause: Large page size of the perfd binary.
Solution: To resolve this, follow these steps:
a Log on to the system as the root user.
b Run the following command to stop the HP Operations agent:
/opt/OV/bin/opcagt -stop
c Run the following command to take a backup of perfd:
cp /opt/perf/bin/perfd /opt/perf/bin/perfd.backup
d Run the following command to reduce the page size to 4K for the perfd binary:
chatr +pi 4K /opt/perf/bin/perfd
e Run the following command to start the HP Operations agent:
/opt/OV/bin/opcagt -start
Troubleshooting 417

418 Chapter 27

Index
Aaccessing DSI data, 301
accessing helpextract program, 129utility program, 80
action, 291
adding new applications, 355
adding new transactions, ttd.conf, 355, 366
agdb, 156
agdb database, 156
agdbserver, 156
agsysdb, 156
alarmgenerator, 291processing, 291
alarm conditions in historical log file data, 76, 158, 231, 233
alarmdefchanges, 291
alarmdef file, 76, 77, 173, 180, 291
alarm definitionDSI metric name in, 291
alarm definitionsapplication metrics, 162components, 159configuring, 242customizing, 180examples, 178file, 76, 231, 242metric names, 162modifying, 244syntax checking, 77
alarm generator, 156
alarming on transaction datawith GlancePlus, 367, 368with Performance agent, 368with Performance Manager, 367
alarm processing errors, 157
alarmsconfiguring, 292defining, 291local actions, 157sending messages to Operations
Manager, 156
ALARM statement, alarm syntax, 163
419

alarm syntax, 160ALARM statement, 163ALERT statement, 167ALIAS statement, 175comments, 161common elements, 160compound statements, 161conditions, 161, 164, 170constants, 162conventions, 160EXEC statement, 168expressions, 162IF statement, 170INCLUDE statement, 172LOOP statement, 171messages, 163metric names, 162PRINT statement, 169reference, 160SYMPTOM statement, 176USE statement, 173variables, 174VAR statement, 174
alert, 291
ALERT statement, alarm syntax, 167
ALIAS statement, alarm syntax, 175
analyze command, utility program, 76
analyzinghistorical log file data, 76, 158log files, 76, 158
analyzing datawith GlancePlus, 367with Performance Manager, 367
analyzing historical log file data, 231
analyzing log files, 231, 233
appending archived data, 230
application command, extract program, 119
application definition parameters, parm file, 35
application example, 345
application LOOP statement, alarm syntax, 172
application metrics, in alarm definitions, 162
application name parameter, parm file, 35
application name record, 113
Application Response Measurement2.0 features, 3502.0 logging agent, 3502.0 Software Developers Kit (SDK), 350benefits of, 344guidelines for using, 359library (libarm), 381no operation-library (libarmNOP), 388obtaining shared library for, 363overhead considerations, 359sample applications, 351
applicationsadding new, 355defined in ttd.conf, 357
archival periods, 229
archiving, appending data, 230
archiving log file data, 45, 133, 147, 149, 229, 231
archiving processes, managing, 46
archiving tips, 230
argv1 keyword, parm file, 36
arm.h include file, 386
ARM APIerror messages from, 369function calls, 346instrumenting scopeux, 379shared library, 363status returns, 353transaction tracking and, 349
420
ARM API callsarm_complete_transaction, 351arm_getid call, 388arm_init call, 388arm_start call, 390
ARM correlators, 360
ASCII format, export file, 104, 219
ASCII record format, 108
Bbinary format, export file, 104, 219
binary header record layout, 109
binary record format, 108
building collections of performance counters, 254
Ccapacity, 277
statement, 280
C compiler option examples by platform, 386
C functionarm_stop, 392
changingalarmdef file, 291class specifications, 300
changing range or SLO, ttd.conf, 355, 366
checkdef command, utility program, 77
checking Performance Agent status, 253
classcapacity, 277, 280definitions, 269description, 264description defaults, 271ID requirements, 271index interval, 272label, 272listing with sdlutil, 302name requirements, 271records per hour, 279roll interval, 272statement, 271syntax, 271
class command, extract program, 120
class specificationchanging, 300compiling, 307, 311, 317creating, 307, 309, 313metrics definition, 281recreate using sdlutil, 302testing, 295
cmd parameter, parm file, 37
collecting data with Performance agent, 367
collection parametersconfiguring, 239modifying, 241, 252
column headings, specifying in export files, 220
command abbreviationsextract, 115utility, 75
command line argumentsextract program, 97utility program, 65
command line interfaceextract program, 96, 97utility program, 63, 65
421

commandsextract program, 115perfstat, 21utility program, 75
comments, using in alarm syntax, 161
compiler output, sample, 289
compiling class specification, 307, 311, 317
components of transaction tracking, 349
compound actions in ALARM statement, 165
compound statements in alarm syntax, 161
conditionsalarm syntax, 161, 170in alarm syntax, 164
configuration command, extract program, 121
configurecommunity strings, 48monitor agent, 47
Configure Data Logging Intervals, 39
configuringalarm definitions file, 242collection parameters, 239export template files, 226, 227parm file, 239transactions, 248ttdconf.mwc file, 248
configuring alarms, 292
configuring tracing, 396
configuring user options, 237
constants, in alarm syntax, 162
controlling disk space used by log files, 43
conventions, alarm syntax, 160
correlator data collection, 364
cpu command, extract program, 121
cpu option, 29
CPU overhead, 360
creatingclass specification, 260log files, 264
creating custom graphs or reports, 106
customized export template files, 103, 226
customizing the ttd.conf file, 366
Ddata
accessing, 301collecting, 260exporting, 301logging, 260managing, 302
data collectionmanagement, 43stopping, 42
datafile format, export file, 104, 219
datafile record format, 108
data source integrationerror messages, 327examples of using DSI, 305how it works, 259overview, 259testing, 295
data sources, 173
data type parameter, export template file, 105
data types, 101, 214, 377
decimal places, metrics, 283
default export file names, 221
default log parameter, parm file, 364
422

defaultsclass description, 271class label, 272delimiters, 284, 295metrics, 282records per hour, 279separator, 284separators, 295summarization level, 279, 292
default ttd.conf file, 355, 356, 357
definingmeasurement ranges, 366service level objectives, 364, 366
delimiters, 284, 295
deploying an application, 365
detail command, utility program, 78
disk command, extract program, 122
disk device name record, 113
disk I/O, overhead, 360
disk option, 29
disk space used by log files, controlling, 43
displaying data in Performance Manager, 301
DSI. See also data source integration
dsiloginput to, 292logging process, 292, 308syntax, 292writing a script, 306
DSI log files, 125, 129
dsilog program, 267
DSI metrics in alarm definitions, 291
Eerror handling considerations, 365
error messages, 327from ARM API, 369from midaemon, 369
errors, alarm processing, 157
escape characters, 272, 273, 282
examining trends, 344
examplestransaction tracking, 373ttd.conf, 375
examples of using DSI, 305logging sar data for several options, 319logging sar data from one file, 309logging sar data from several files, 313logging the number of system users, 325logging vmstat data, 307writing a dsilog script, 306
excluding data from logging, 298
EXEC statement, alarm syntax, 168
executing an application, 365
executing local actions, 157
exit command, extract program, 123
exit command, utility program, 79
export command, extract program, 101, 123
export data types, 101
export default output files, 124
export fileASCII format, 219attributes, 218, 221binary format, 219datafile format, 219default file names, 221title, 106WK1 (spreadsheet) format, 219
export file title, 220
423

export functiondata files, 103export template files, 102export template file syntax, 104overview, 101process, 101sample tasks, 102using, 106
exporting DSI log file data, 129
exporting log file data, 123, 217, 223according to dates and times, 215
exporting logged data, 301, 308
exporting transaction data using Performance agent, 367
export template fileconfiguring, 226, 227data type, 105export file title, 106field separator, 219file format, 219format, 104headings, 105, 220items, 105layout, 105making a quick template, 224missing, 105missing value, 219multiple layout, 220output, 105parameters, 104report, 104separator, 105summary, 105summary minutes, 219syntax, 104
expressions, in alarm syntax, 162
Extended Collection Builder and Manager, 254tips for using, 255
extractusing with transaction data, 365
extract command, extract program, 125
extract commandsapplication, 119class, 120configuration, 121cpu, 121disk, 122exit, 123export, 101, 123extract, 125filesystem, 127global, 127guide, 128help, 129list, 129lvolume, 131menu, 132monthly, 133output, 135process, 137quit, 138report, 138sh, 139shift, 139show, 140start, 142stop, 143weekdays, 146weekly, 147yearly, 149
extracting log file data, 125, 216according to dates and times, 215
extracting transaction data using Performance agent, 367
424

extract program, 95, 301command line arguments, 97command line interface, 97commands, 115interactive versus batch, 96running, 96
Ffield separator parameter, export template
file, 219
fifo, 292
file attributes, export, 218
file format parameter, export template file, 219
file names, default export files, 221
file parameter, parm file, 36
filesalarmdef, 76, 77, 180, 291alarm definitions, 76, 231, 242collection parameters, 239export template, 102logappl, 27logdev, 27logglob, 27logproc, 27parm, 239reptall, 102reptfile, 102, 138reptfile.mwr, 221repthist, 102status.scope, 21ttdconf.mwc, 248
filesystem command, extract program, 127
Flush, 33
format file, 292, 298
format parameterexport template file, 104
Ggapapp, 31
GlancePlusalarming on transaction data, 367, 368analyzing transaction data, 367identifying performance bottlenecks, 346monitoring transaction data, 367support of Application Response
Measurement 2.0, 350viewing transaction data, 346
global command, extract program, 127
group parameter, parm file, 37
guide command, extract program, 128
guide command, utility program, 79
guided modeextract, 128utility, 79
guidelines for using ARM, 359
Hheadings parameter, export template file,
105, 220
help command, extract command, 129
help command, utility program, 80
HP Network Node Manager, 156
Iidentifying performance bottlenecks, 346
ID parameterparm file, 27
IF statement, alarm syntax, 170
INCLUDE statement, alarm syntax, 172
index interval, class, 272
input to dsilog, 292
425
interactive modeextract program, 96utility program, 64
interesting processes, 27, 44
items parameter, export template file, 105
Jjavaarg parameter, parm file, 33
Java wrappers, 388documentation, 394examples, 388setting up an application, 388setting up a transaction, 388starting a transaction instance, 390stopping a transaction instance, 392updating transaction instance data, 391using complete transaction, 393
Kkernel parameters, 292
keywordsrange, 356, 366slo, 357, 366tran, 356, 366
Llabel
class, 272metrics, 282
layout parameter, export template file, 105
length text metrics, 284
libarm, 363, 381
libarmNOP, 388
librariesusing libarm, 363
limits on unique transactions, 365
list command, extract program, 129
list command, utility program, 80
local actionsalarms, 169executing, 157
logappl file, 27PRM groups, 27
logdev file, 27
log filesize, controlling, 277
logfile command, utility program, 81
log file dataanalyzing for alarm conditions, 158, 231,
233archiving, 133, 147, 149, 229, 231exporting, 123, 217, 223extracting, 125, 216resizing, 235, 236scanning, 233, 234
log filesarchiving data, 45controlling disk space, 43DSI, 125, 259organization, 264resizing, 85rolling back, 44, 45scanning, 89setting maximum size, 32, 44
log file setsdefining, 264listing with sdlutil, 302naming, 269rolling, 277
logged data, exporting, 301
logging agent, Application Response Measurement 2.0, 350
logging datarun dsilog program, 267
426

logging process, 292, 308dsilog, 308testing, 295
logging transaction data, 346
logglob file, 27, 149
logical volume name record, 114
log parameter, parm file, 27
logproc file, 27
long-term analysis, 344
LOOP statement, alarm syntax, 171
lvolume command, extract program, 131
Mmaintenance time, parm file, 32
mainttime parameter, parm file, 32, 44
making a quick export template, 224
managing DSI data, 302
managing SLOs, 345
mapping incoming data to specification, 298
measurement, defining ranges, 366
Measurement Interface daemon, See midaemon, 349
memory option, 29
memory overhead, 360
menu commandextract program, 132utility program, 83
messages in alarm syntax, 163
metric names in alarm syntax, 162, 175
metrics, 371defaults, 282definition, 281description, 264id requirements, 281keyword, 281label, 282label requirements, 282listing with sdlutil, 302name requirements, 281order, 282precision, 283reusing name, 282summarization method, 283text, 284
metrics, selecting for export, 225, 228
metrics in alarm definitions, 291
MIB ID, 49
midaemon, 349, 365error messages, 369errors, 353memory overhead, 361resizing the midaemon shared memory
segment, 366shared memory segment, 353, 365
missing parameter, export template file, 105, 219
modify class specification file, 300
modifyingalarm definitions, 244collection parameters, 22, 241, 252parm file, 22, 241, 252
modifying the parm file, 364
monitoring transaction performance data, 346
monthly command, extract program, 133
multiple layout, specifying in export files, 220
427

multiple layout parameter, export template file, 220
mwa script, 42
Nnamed pipe, 292
naming a transaction, 356, 366
netif name record, 114
Network Node Manager, 291
nokilled option, 29
no operation library, 388
numeric format option, 298
numeric metrics, format file, 298
OOIDs, 49
Operations Manager, 156, 292
order of metrics, changing, 298
or parameter, parm file, 38
output command, extract program, 135
output parameter, export template file, 105
overflow conditions, 365
overheadconsiderations for using ARM, 359CPU, 360disk I/O, 360memory, 360
overviewdata source integration, 259
overview of transaction tracking, 349
ovpa restart, 365
ovpa start, 365
ovpa stop scope, 364
Pparameter
subprocinterval, 31
parm fileapplication definition parameters, 35configure data logging intervals, 39configuring, 239flush, 33gapapp, 31modifications for Performance Manager
and Performance agent, 364modifying, 22, 241, 252parameters, 26subprocinterval parameter, 31syntax check, 84
parm file application keywordsargv1, 36
parm file application parameterscmd, 37
parmfile command, utility program, 84
parm file parametersapplication name, 35file, 36group, 37ID, 27javaarg, 33log, 27mainttime, 32, 44or, 38priority, 38scopetransactions, 30size, 32
perfalarm, 156, 173
perflbd.mwc fileformat, 245
428
Performance Agentdata types, 214extract program, 95status checking, 253summarization levels, 215utility program, 63
Performance agentcollecting and logging data, 367exporting transaction data, 367extracting transaction data, 367modifying the parm file, 364restarting, 365starting, 365support of Application Response
Measurement 2.0, 350viewing transaction data, 346
performance counters, building collections of, 254
Performance Manageralarming on transaction data, 367, 368analyzing transaction data, 367displaying DSI data, 301viewing transaction data, 346
perfstat command, 21
piping data to dsilog, 292
precision, 283metrics, 283
PRINT statement, alarm syntax, 169
priority parameter, parm file, 38
PRM application logging mode, 35
PRM groupsAPP_NAME_PRM_GROUPNAME, 27
proccmd, 34
process command, extract program, 137
processing alarms, 291
Qquit command
extract program, 138utility program, 85
Rrange keyword, 356
ranges of data to export or extract, 215
raw log filesmanaging space, 85names, 81
record formatsASCII, 108binary, 108datafile, 108
records per hour, 279, 292
report command, extract program, 138
reporting alarm conditions in historical log file data, 232
reporting of log file contents, 233, 234
report parameter, export template file, 104
reptall file, 102
reptfile.mwr file, 221
reptfile file, 102, 138
repthist file, 102
resize commanddefault resizing parameters, 86reports, 87utility program, 64, 85
resizinglog files, 85tasks, 45
resizing log files, 235, 236
resizing the midaemon shared memory segment, 366
429
resource data collection, 364
reusing metric names, 282
rollaction, 273example of action, 273interval, 272
rolling back log files, 45
runningan application, 365extract program, 96ttd, 353utility program, 63
Ssample ARM-instrumented applications, 351
sample compiler output, 289
sarexample of logging sar data for several
options, 319example of logging sar data from one file,
309example of logging sar data from several
files, 313
scan command, utility program, 89
scanning a log file, 89
scanning transaction data with Performance Agent, 367
SCOPE default data source, 162, 173
scopetransactions parameter, parm file, 30
scopeux, 259instrumenting with ARM API calls, 379stopping, 42stopping and restarting, 353, 355
SDLprefix for class specification error
messages, 288
sdlcomp, 307compiler, 307
sdlcomp compiler, 264
sdlgendata, 295
sdlutil, 302, 308syntax, 302
sending alarm information, 291
sending alarm messages, 156, 167
sending SNMP traps, 156
separating metrics in export files, 219
separator, 284
separator parameter, export template file, 105
separators, 295
service level objectivesdefining, 364managing, 345
setting maximum size of log files, 44
setting up tracing, 396
shared libraries, 388
shared memory segment, midaemon, 353, 365
sh commandextract program, 139utility program, 90
shift command, extract program, 139
shortlived option, 29
show commandextract program, 140utility program, 91
size parameter, parm file, 32
slo keyword, 357
SLOsSee service level objectives, 345
430
SNMPnodes, 156traps, 156
SNMP_COMMUNITY, 48
SNMP_COMMUNITY_LIST, 48
SNMP traps, 291
start commandextract program, 142parameters, 92utility program, 92
startingPerformance agent, 365ttd, 353
starting logging process, 292
state persistence, 50
statistics, listing with sdlutil, 302
status.mi, 369
status.scope file, 21
status bar, displaying, 237
stop commandextract program, 143parameters, 93utility program, 93
stoppingapplications, 353data collection, 42scopeux, 42ttd, 353
stopping and restarting scopeux, 353, 355
summarization level, 292default, 279
summarization levels, 215
summarization method, 283
summarized by option, 283
summary minutes, specifying in export files, 219
summary parameter, export template file, 105, 219
support ofApplication Response Measurement 2.0,
350
SYMPTOM statement, alarm syntax, 176
syntaxdsilog, 292export, 301sdlutil, 302
Tterminating
extract program, 123, 138utility command, 85utility program, 79
testingclass specification, 295logging process, 295
text metricsformat file, 298specifying, 284
threshold parameter, parm filecpu option, 29disk option, 29memory option, 29nokilled option, 29nonew option, 29shortlived option, 29
timestamp, 282suppressing, 292
Tip of the Day, 237
toolbar, displaying, 237
ToolTips, displaying, 237
431
traceconfiguration files
application, 399sink, 399syntax version, 399trace, 400
tracingdynamic
enabling, 406setting up, 396
tran keyword, 356
transactionadding new to ttd.conf, 355data, 344metrics, 371naming, 366
Transaction configuration file, 355
transaction configuration file, See ttd.conf, 349
transaction metrics, 371
transaction name record, 113
transaction names, 356
transactions configuring, 248
Transaction Trackerinstrumenting an application, 346
transaction trackingbenefits of, 344components of, 349error handling, 365examples, 373limits on unique transactions, 365missing data, 365overview, 345setting up an application, 363startup, 353technical reference, 349viewing data, 346
Transaction Tracking registration daemon, See ttd, 349
troubleshooting sdlcomp, 290
ttd, 349, 365
ttd.conf, 349, 355adding new transactions, 355adding transactions, 366changing range or SLO, 355, 366customizing, 366default, 355, 356, 357, 366example, 375format, 357keywords, 356
ttdconf.mwc file, 248
UUNIX kernel parameters, 292
UNIX timestamp, 282
user-defined metrics, 378
user options, configuring, 237
USE statement, alarm syntax, 173
utilities, sdlutil, 302
432
utility commandsanalyze, 76checkdef, 77detail, 78exit, 79guide, 79help, 80list, 80logfile, 81menu, 83parmfile, 84quit, 85resize, 64, 85scan, 89sh, 90show, 91start, 92stop, 93
utility program, 63, 75, 158batch mode, 64batch mode example, 64command line arguments, 66command line interface, 63, 65entering shell commands, 90interactive mode, 64interactive program example, 64interactive versus batch, 63running, 63
utility scan reportapplication overall summary, 72application-specific summary report, 70collector coverage summary, 72initial parm file application definitions,
69initial parm file global information, 68log file contents summary, 73log file empty space summary, 74parm file application addition/deletion
notifications, 70parm file global change notifications, 69process log reason summary, 71scan start and stop, 72scopeux off-time notifications, 70
VVariable Data Logging, 39
variables, alarm syntax, 174
VAR statement, alarm syntax, 174
version information, displaying, 302
viewing transaction dataoverview, 346with GlancePlus, 346with Performance agent, 346with Performance Manager, 346
vmstatexample of logging vmstat data, 307
Wweekdays command, extract program, 146
weekly command, extract program, 147
who word count example, 325
WK1 (spreadsheet) format, export file, 219
WK1 format, export file, 104
433

writing a dsilog script, 306problematic dsilog script example, 306recommended dsilog script example, 306
Yyearly command, extract program, 149
Zzone_app, 34
434

We appreciate your feedback!
If an email client is configured on this system, by default an email window opens when you click on the bookmark “Comments”.
In case you do not have the email client configured, copy the information below to a web mail client, and send this email to [email protected]
Product name:
Document title:
Version number:
Feedback: