Embed Size (px)
Citation preview
`
ANNUAL FINANCIAL RESULTS FOR THE YEAR ENDED 31 DECEMBER 2015
ANNUAL FINANCIAL RESULTS for the year ended 31 December 2015
Accelerated growth – ACADEMIC EXCELLENCE
Introduction
Results
Financial highlights
Prospects
Questions
Introduction
Results
Financial highlights
Prospects
Questions

`
ANNUAL FINANCIAL RESULTS FOR THE YEAR ENDED 31 DECEMBER 2015
OUR BUSINESS MODEL OF VALUE
ATTRACT
AND RETAIN
BEST STAFF
› Competitive rewards
› Great people
to work with
OUTSTANDING
QUALITY
AND VALUE
› Dynamic improvement
› Great service
› Relevance
SUSTAINED
INCOME AND
MARKET
LEADERSHIP
› Rewards to
stakeholders
› Community
engagement
STRONG DEMAND
› Great reputation
› Career success
› Employer recognition
› Alumni success
SUPERIOR RETURNS
RELATIVE TO PEERS
› Efficiencies
INNOVATION
INVESTMENT
`
ANNUAL FINANCIAL RESULTS FOR THE YEAR ENDED 31 DECEMBER 2015
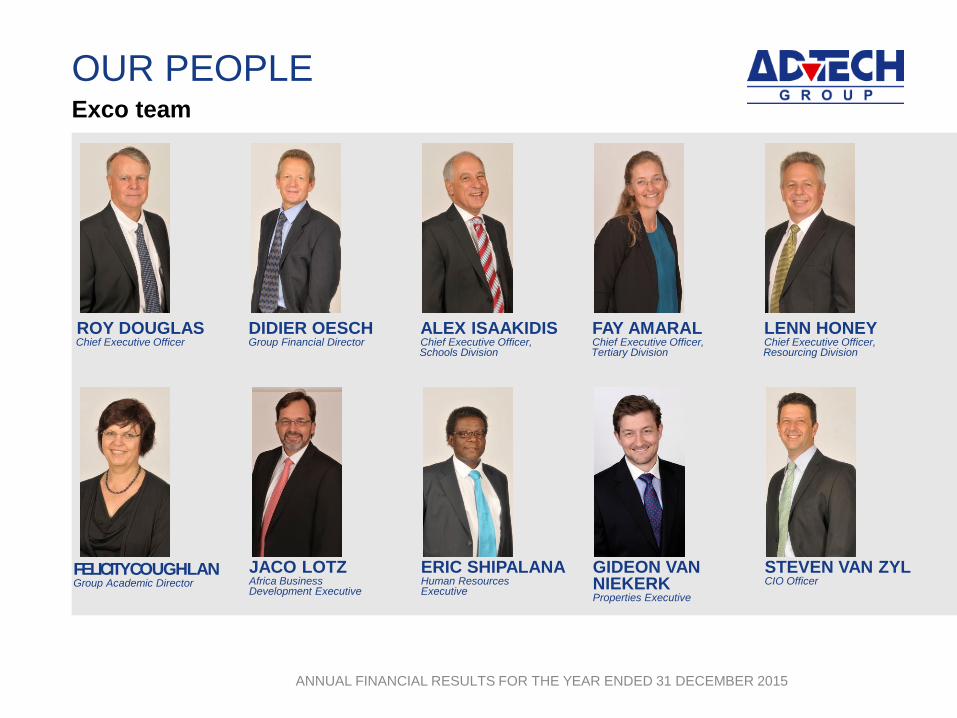
OUR PEOPLEExco team
ROY DOUGLASChief Executive Officer
DIDIER OESCHGroup Financial Director
ALEX ISAAKIDISChief Executive Officer,Schools Division
FAY AMARALChief Executive Officer,Tertiary Division
LENN HONEYChief Executive Officer,Resourcing Division
FELICITY COUGHLANGroup Academic Director
JACO LOTZAfrica BusinessDevelopment Executive
ERIC SHIPALANAHuman ResourcesExecutive
GIDEON VAN NIEKERKProperties Executive
STEVEN VAN ZYLCIO Officer
Introduction
Results
Financial highlights
Prospects
Questions

`
ANNUAL FINANCIAL RESULTS FOR THE YEAR ENDED 31 DECEMBER 2015
EXCELLENT RESULTSPerformance at a glance
HEADLINE EARNINGS PER SHARE
27%2014 : 7%
REVENUE
40%2014 : 9%
DIVIDENDS PER SHARE
29.5 cents2014 : 26.0
OPERATING PROFIT
75%2014 : 16%
`
ANNUAL FINANCIAL RESULTS FOR THE YEAR ENDED 31 DECEMBER 2015
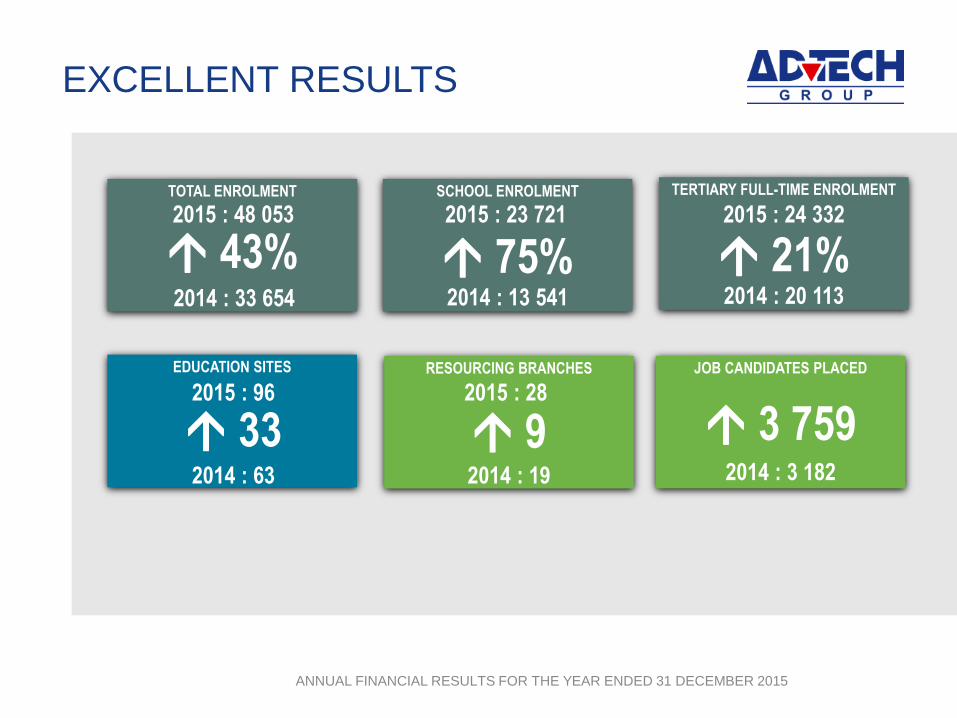
EXCELLENT RESULTS
TOTAL ENROLMENT
43%2014 : 33 654
TERTIARY FULL-TIME ENROLMENT
21%2014 : 20 113
SCHOOL ENROLMENT
75%2014 : 13 541
EDUCATION SITES RESOURCING BRANCHES
92014 : 19
JOB CANDIDATES PLACED
3 7592014 : 3 182
2015 : 48 053
2015 : 96
332014 : 63
2015 : 23 721 2015 : 24 332
2015 : 28
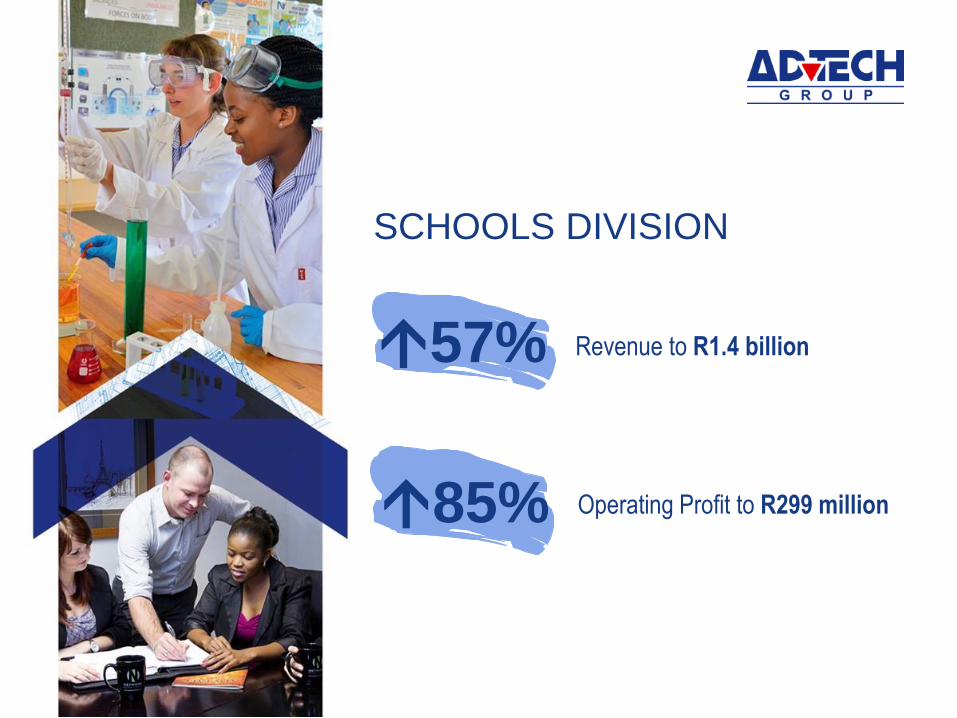
SCHOOLS DIVISION
57% Revenue to R1.4 billion
85% Operating Profit to R299 million
`
ANNUAL FINANCIAL RESULTS FOR THE YEAR ENDED 31 DECEMBER 2015
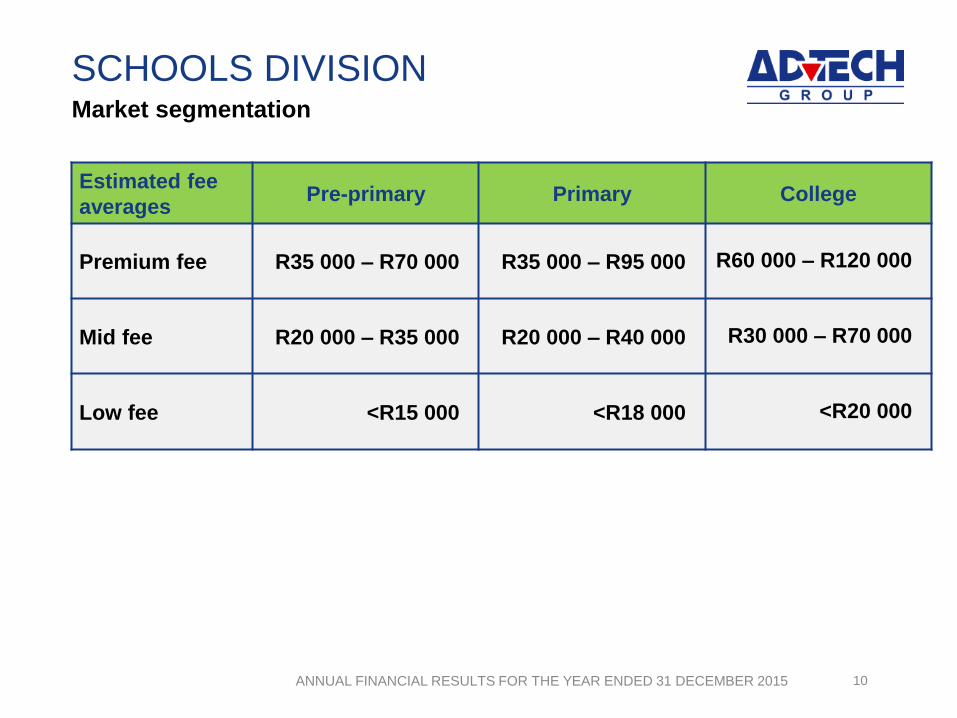
SCHOOLS DIVISION
10
Market segmentation
Estimated fee
averagesPre-primary Primary College
Premium fee R35 000 – R70 000 R35 000 – R95 000 R60 000 – R120 000
Mid fee R20 000 – R35 000 R20 000 – R40 000 R30 000 – R70 000
Low fee <R15 000 <R18 000 <R20 000

`
ANNUAL FINANCIAL RESULTS FOR THE YEAR ENDED 31 DECEMBER 2015
SCHOOLS DIVISION
11
Competitive environment
ADvTECH
brandsPre-primary Primary College
Premium fee • CrawfordSchools™
• Centurus Colleges
• Maragon Ruimsig and
Avianto
• Charterhouse
• Trinityhouse
• CrawfordSchools™
• Centurus Colleges
• Maragon Ruimsig and
Avianto
• Charterhouse
• Trinityhouse
• Abbotts College
• CrawfordSchools™
• Centurus Colleges
• Maragon Ruimsig
• Trinityhouse
Mid fee • Founders Hill College
• GIS
• Maragon Olympus
• Maragon Raslouw
• Kathstan College
• Summit College
• Junior Colleges
• Founders Hill College
• GIS
• Maragon Olympus
• Kathstan College
• Summit College
• Founders Hill College
• GIS
• Maragon Olympus
• Kathstan College
• Summit College
Low fee • Maragon Edendale • Maragon Edendale • Maragon Edendale
`
ANNUAL FINANCIAL RESULTS FOR THE YEAR ENDED 31 DECEMBER 2015
SCHOOLS DIVISION
12
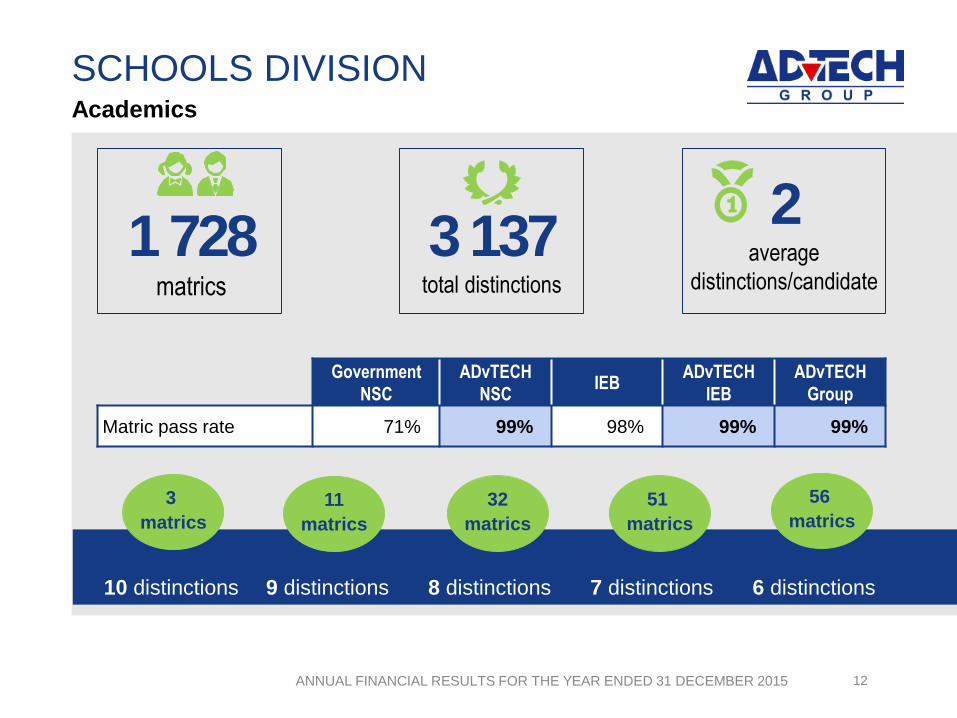
Academics
3 137total distinctions
2average
distinctions/candidate
1 728matrics
56
matrics
6 distinctions7 distinctions
51
matrics
8 distinctions
32
matrics
9 distinctions
11
matrics
10 distinctions
3
matrics
Government
NSC
ADvTECH
NSCIEB
ADvTECH
IEB
ADvTECH
Group
Matric pass rate 71% 99% 98% 99% 99%
`
ANNUAL FINANCIAL RESULTS FOR THE YEAR ENDED 31 DECEMBER 2015
SCHOOLS DIVISION
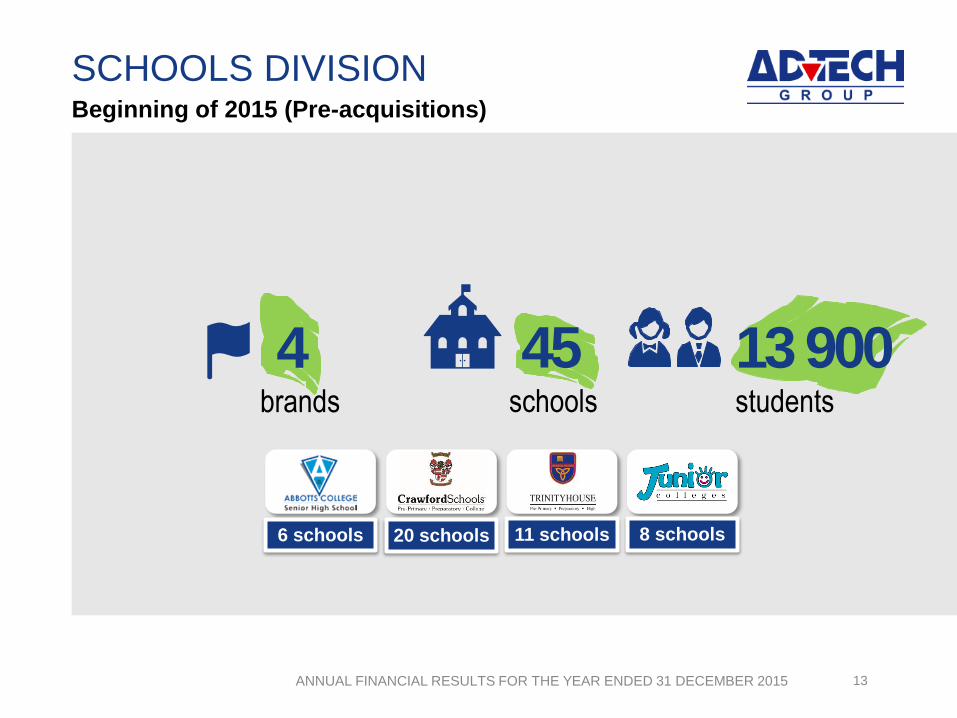
13
Beginning of 2015 (Pre-acquisitions)
4brands
6 schools 20 schools 11 schools 8 schools
45schools
13 900students
`
ANNUAL FINANCIAL RESULTS FOR THE YEAR ENDED 31 DECEMBER 2015
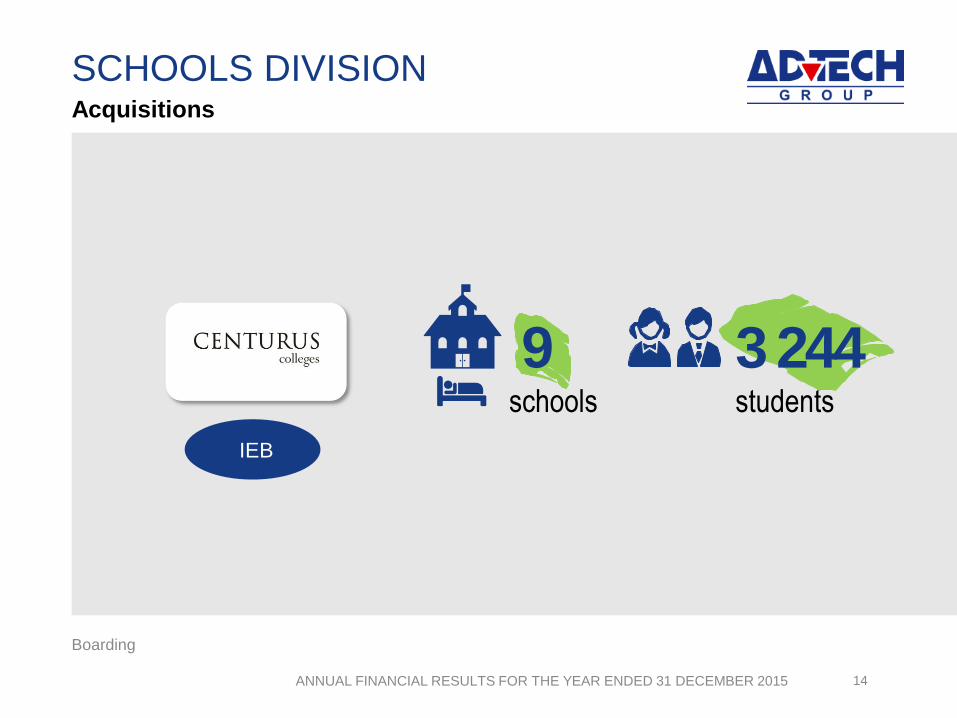
9schools
SCHOOLS DIVISION
14
Acquisitions
3 244students
IEB
Boarding
`
ANNUAL FINANCIAL RESULTS FOR THE YEAR ENDED 31 DECEMBER 2015
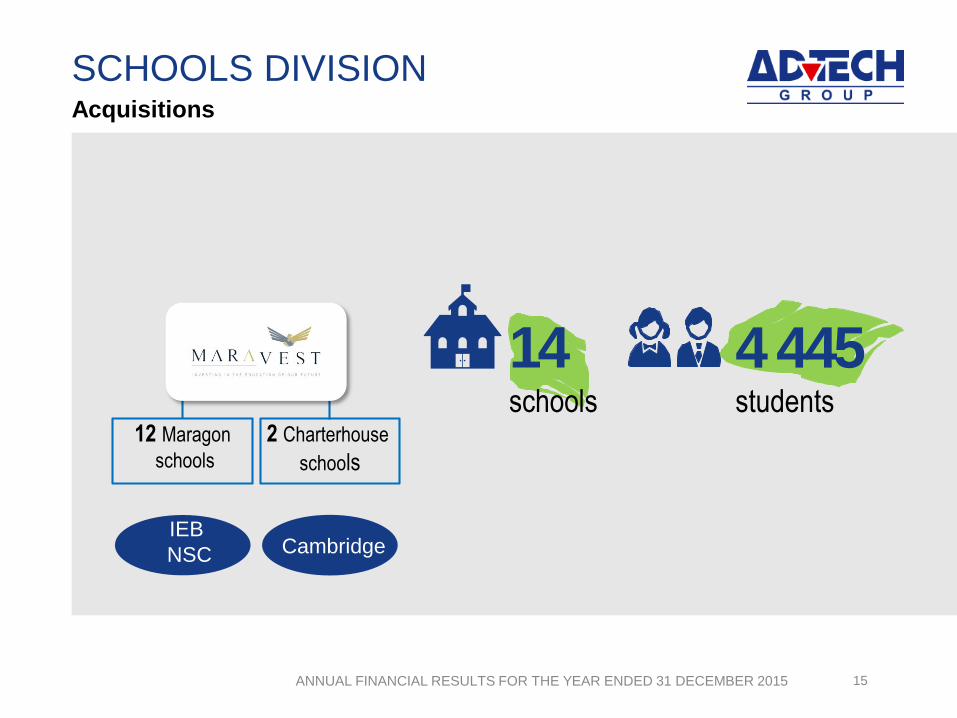
IEB
NSC
12 Maragon
schools
2 Charterhouse
schools
Cambridge
SCHOOLS DIVISION
15
Acquisitions
14schools
4 445students
`
ANNUAL FINANCIAL RESULTS FOR THE YEAR ENDED 31 DECEMBER 2015
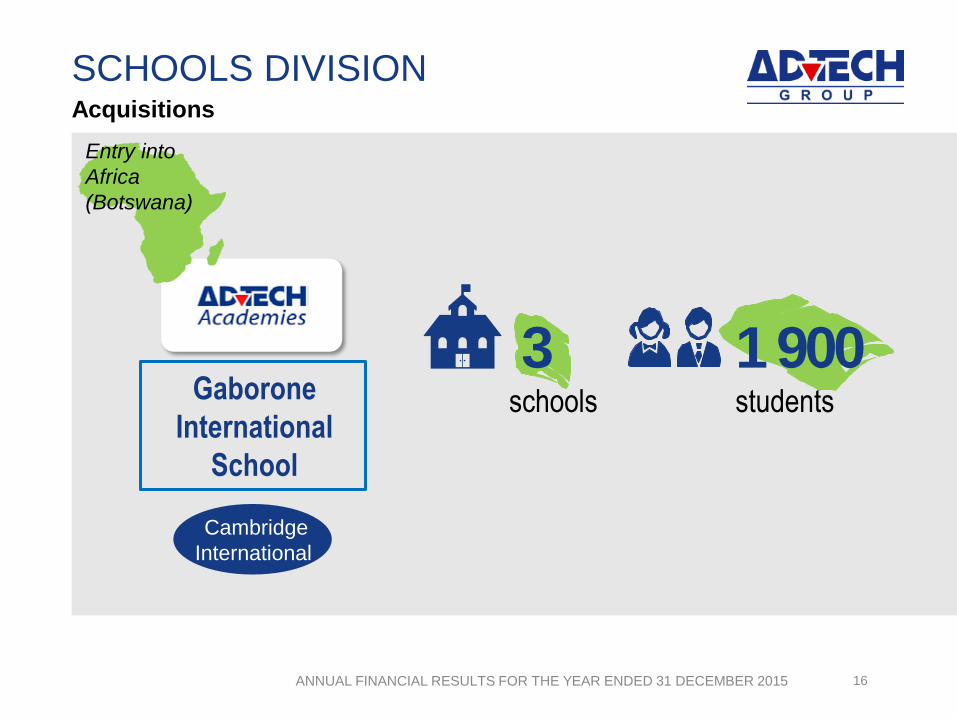
3schools
SCHOOLS DIVISION
16
Acquisitions
Gaborone
International
School
1 900students
Cambridge
International
Entry into
Africa
(Botswana)
`
ANNUAL FINANCIAL RESULTS FOR THE YEAR ENDED 31 DECEMBER 2015
3schools
SCHOOLS DIVISION
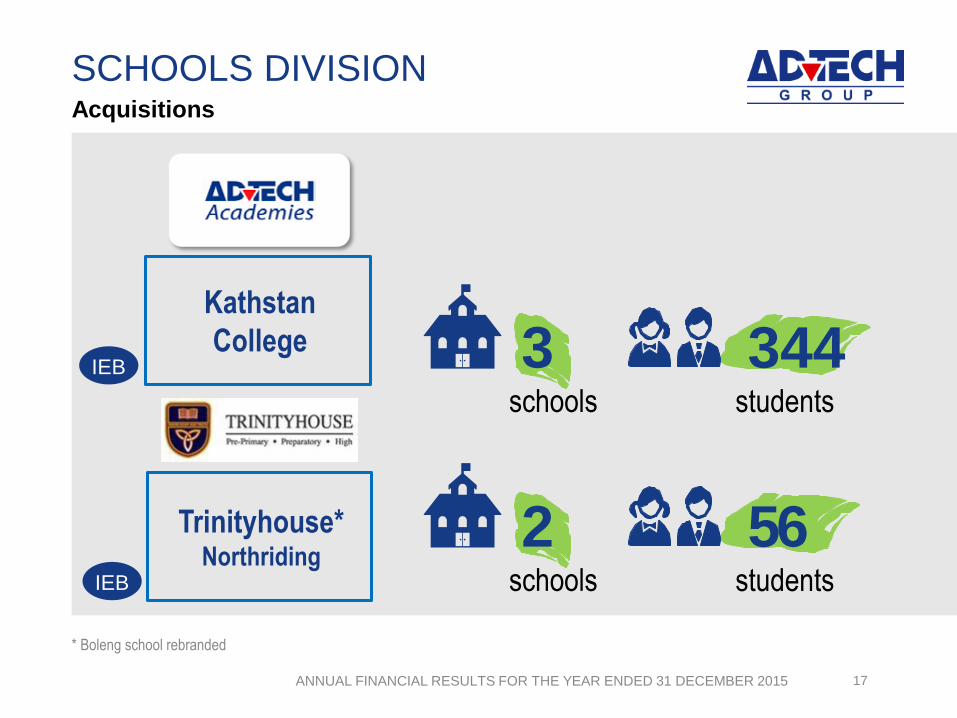
17
Acquisitions
Kathstan
College 344students
* Boleng school rebranded
IEB
2schools
Trinityhouse*Northriding
56studentsIEB
`
ANNUAL FINANCIAL RESULTS FOR THE YEAR ENDED 31 DECEMBER 2015
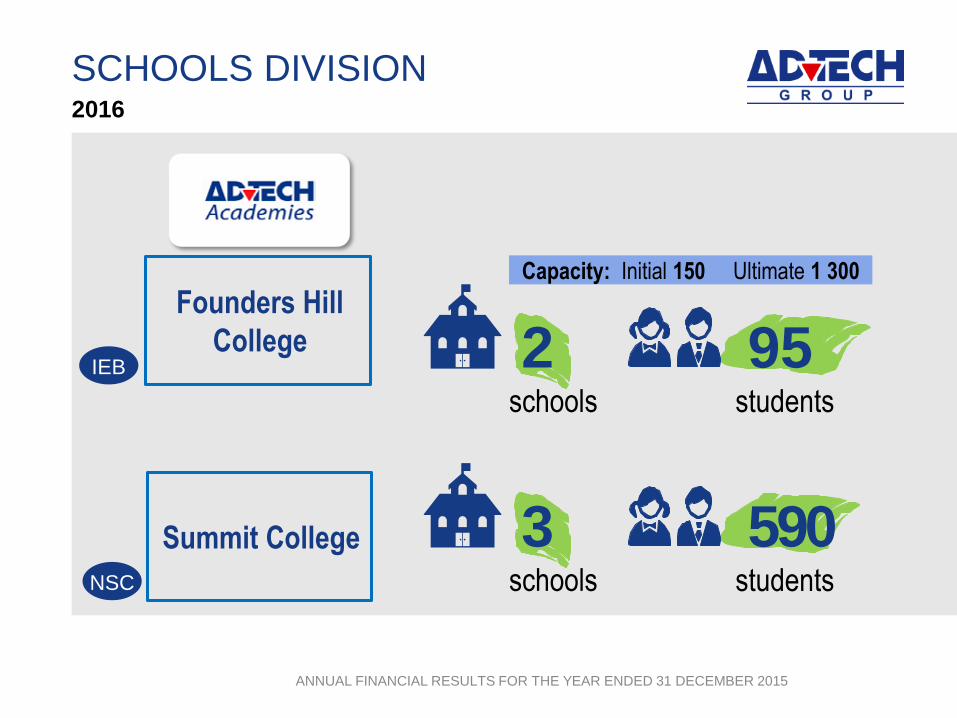
SCHOOLS DIVISION2016
Capacity: Initial 150 Ultimate 1 300
2schools
95students
3schools
590students
Founders Hill
College
Summit College
IEB
NSC
`
ANNUAL FINANCIAL RESULTS FOR THE YEAR ENDED 31 DECEMBER 2015
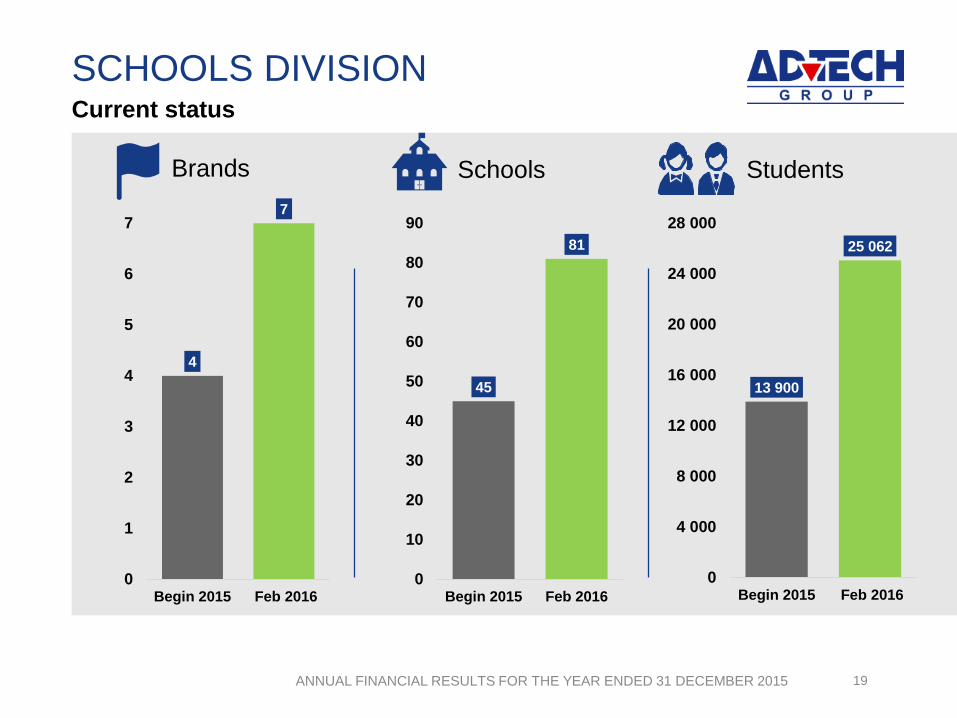
SCHOOLS DIVISION
19
Current status
4
7
0
1
2
3
4
5
6
7
Begin 2015 Feb 2016
Brands
45
81
0
10
20
30
40
50
60
70
80
90
Begin 2015 Feb 2016
Schools
13 900
25 062
0
4 000
8 000
12 000
16 000
20 000
24 000
28 000
Begin 2015 Feb 2016
Students
`
ANNUAL FINANCIAL RESULTS FOR THE YEAR ENDED 31 DECEMBER 2015
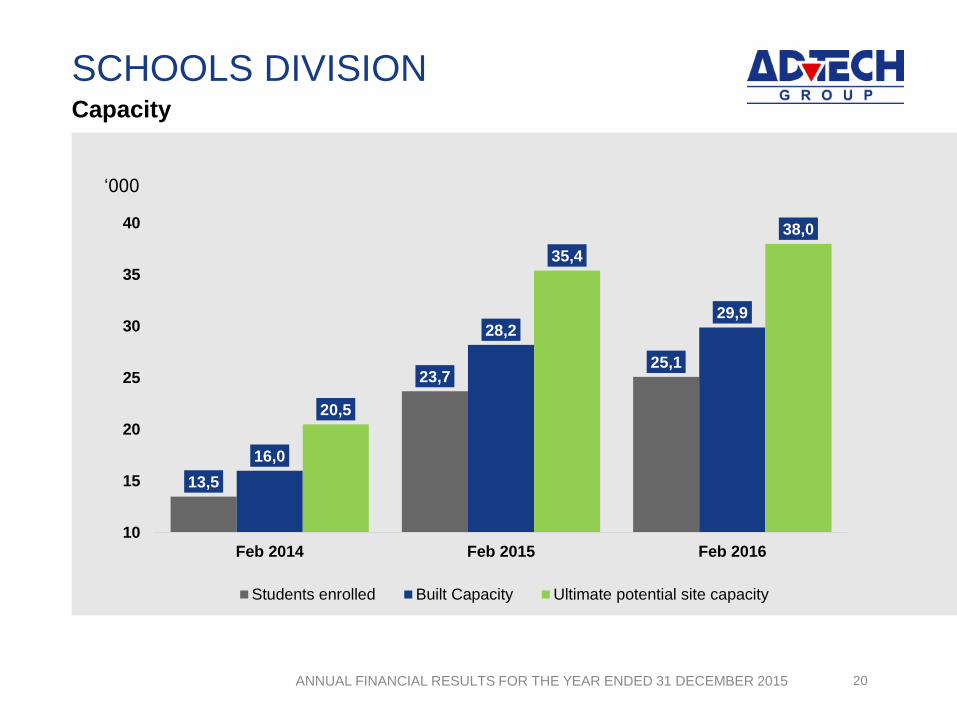
SCHOOLS DIVISION
20
Capacity
13,5
23,725,1
16,0
28,229,9
20,5
35,4
38,0
10
15
20
25
30
35
40
Feb 2014 Feb 2015 Feb 2016
Students enrolled Built Capacity Ultimate potential site capacity
‘000

`
ANNUAL FINANCIAL RESULTS FOR THE YEAR ENDED 31 DECEMBER 2015
SCHOOLS DIVISION
21
Growth targets
R650mEBIT
40 000enrolments
R3bnrevenue
2020
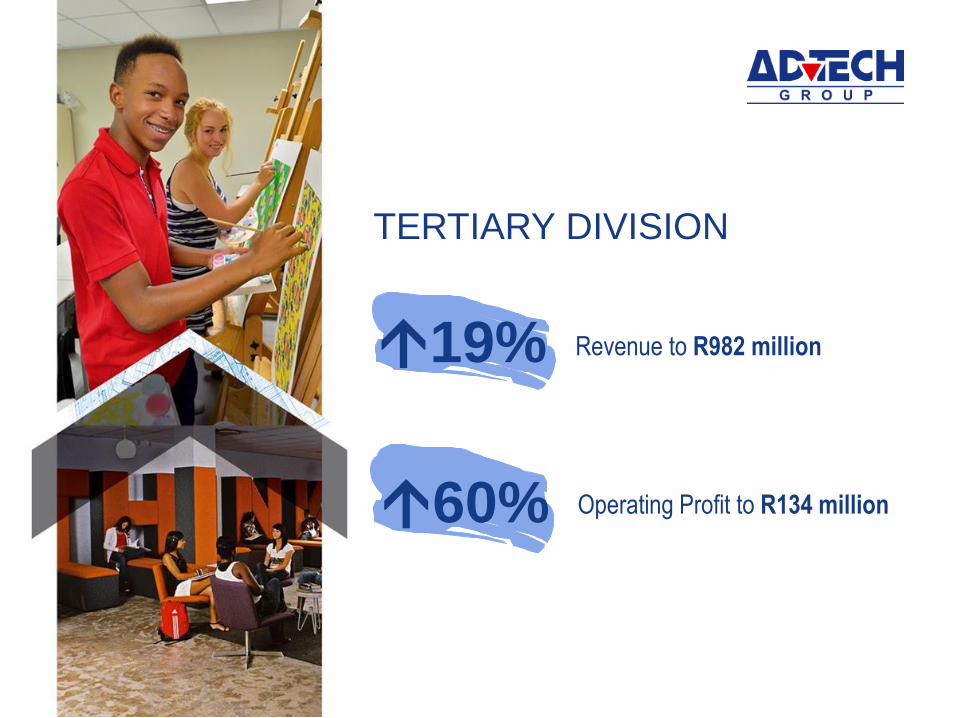
TERTIARY DIVISION
19% Revenue to R982 million
60% Operating Profit to R134 million
`
ANNUAL FINANCIAL RESULTS FOR THE YEAR ENDED 31 DECEMBER 2015
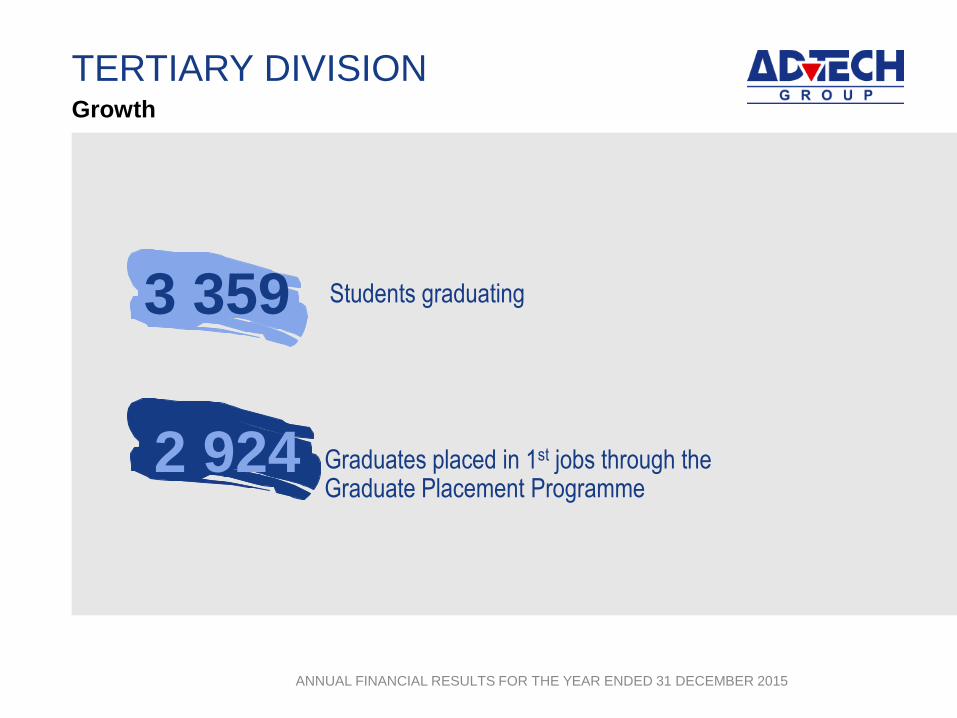
TERTIARY DIVISIONGrowth
3 359 Students graduating
2 924 Graduates placed in 1st jobs through the Graduate Placement Programme
`
ANNUAL FINANCIAL RESULTS FOR THE YEAR ENDED 31 DECEMBER 2015
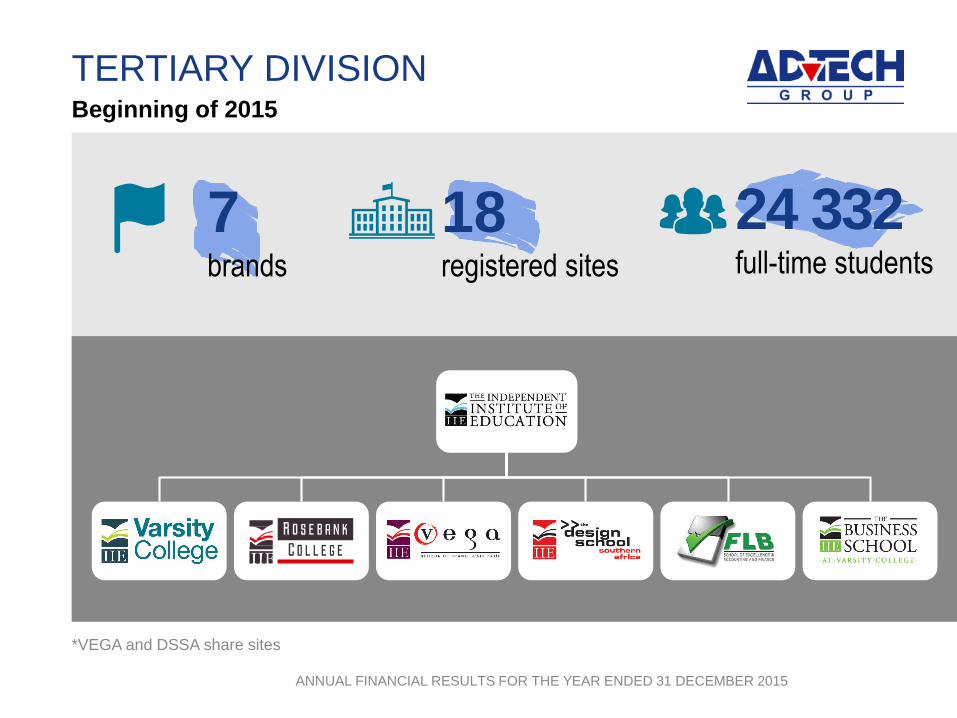
TERTIARY DIVISIONBeginning of 2015
*VEGA and DSSA share sites
18registered sites
24 332full-time students
7brands
`
ANNUAL FINANCIAL RESULTS FOR THE YEAR ENDED 31 DECEMBER 2015
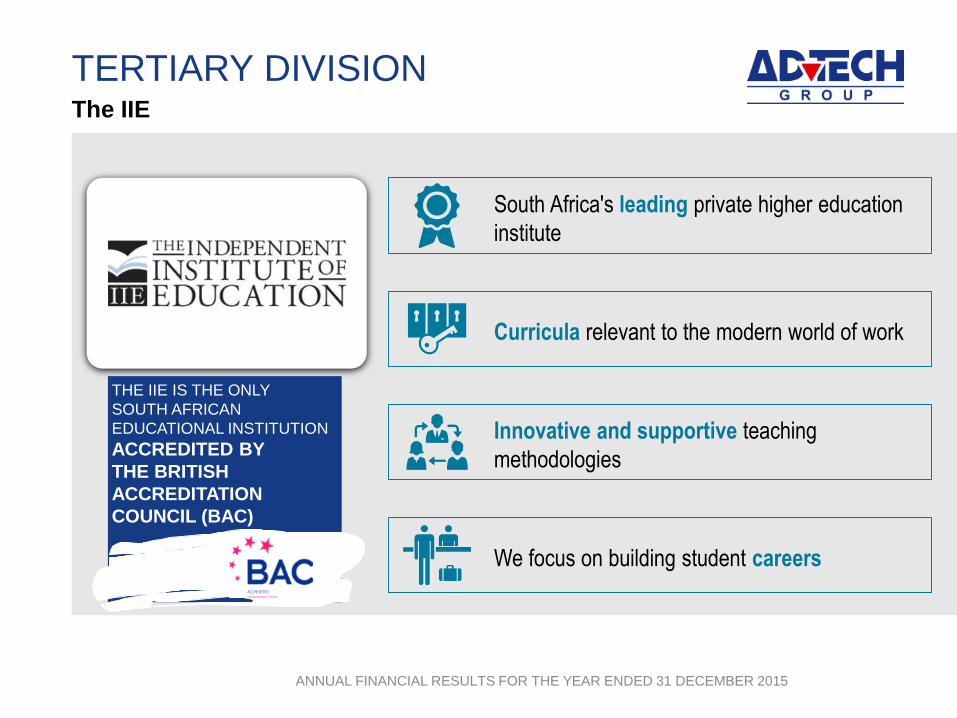
TERTIARY DIVISIONThe IIE
South Africa's leading private higher education
institute
Curricula relevant to the modern world of work
Innovative and supportive teaching
methodologies
We focus on building student careers
THE IIE IS THE ONLY
SOUTH AFRICAN
EDUCATIONAL INSTITUTION
ACCREDITED BY
THE BRITISH
ACCREDITATION
COUNCIL (BAC)
`
ANNUAL FINANCIAL RESULTS FOR THE YEAR ENDED 31 DECEMBER 2015
TERTIARY DIVISIONRosebank College
Affordable
Quality, high demand qualifications
Employability
`
ANNUAL FINANCIAL RESULTS FOR THE YEAR ENDED 31 DECEMBER 2015
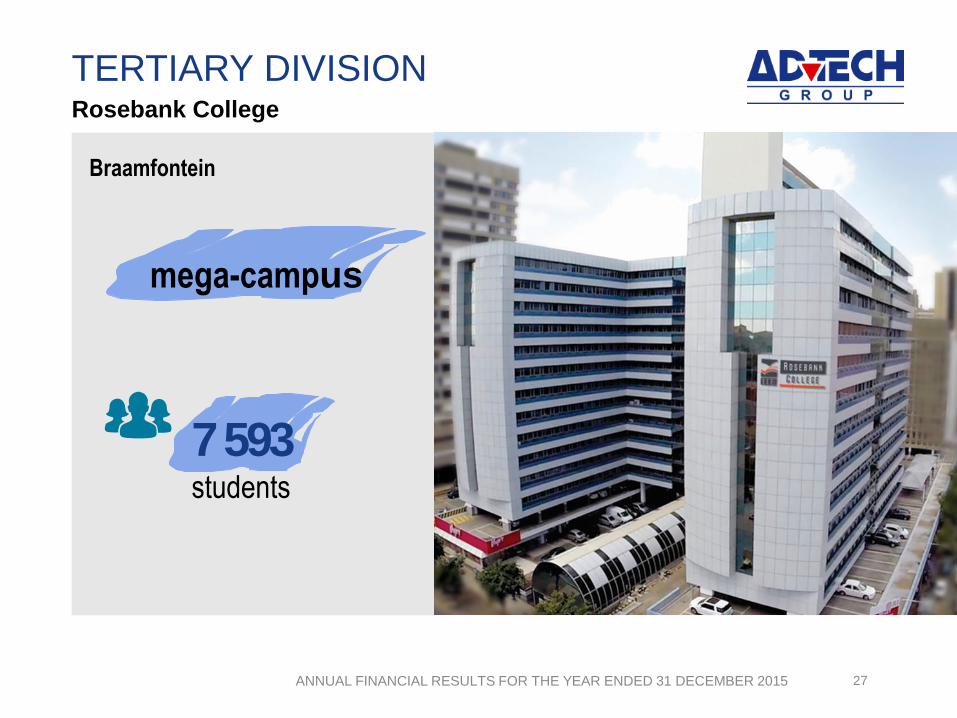
TERTIARY DIVISION
27
Rosebank College
7 593students
mega-campus
Braamfontein
`
ANNUAL FINANCIAL RESULTS FOR THE YEAR ENDED 31 DECEMBER 2015
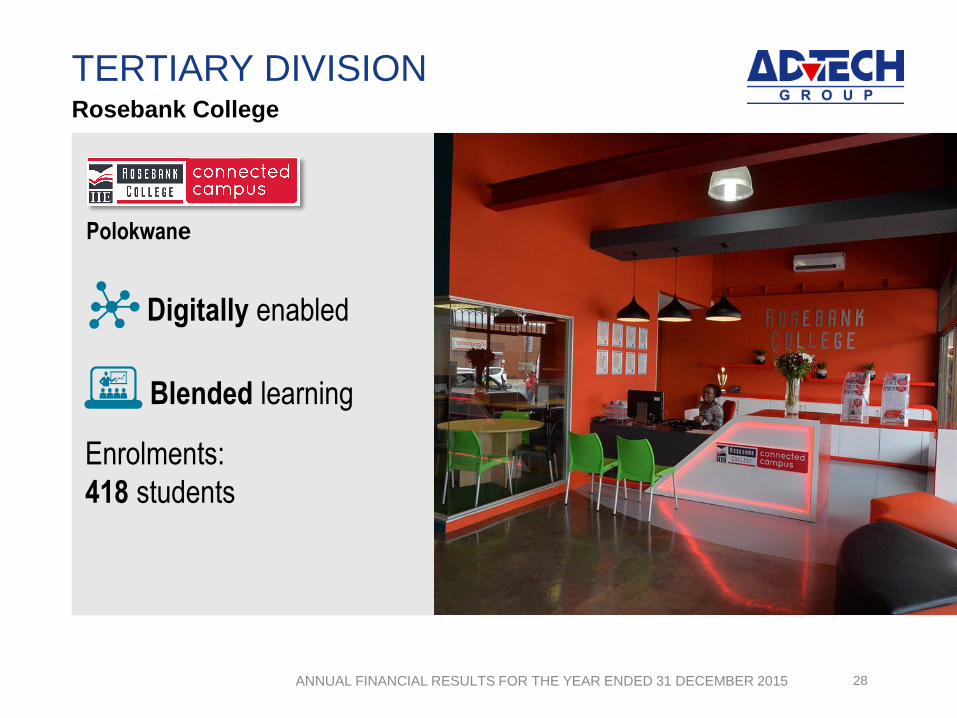
TERTIARY DIVISION
28
Rosebank College
Blended learning
Digitally enabled
Enrolments:
418 students
Polokwane
`
ANNUAL FINANCIAL RESULTS FOR THE YEAR ENDED 31 DECEMBER 2015
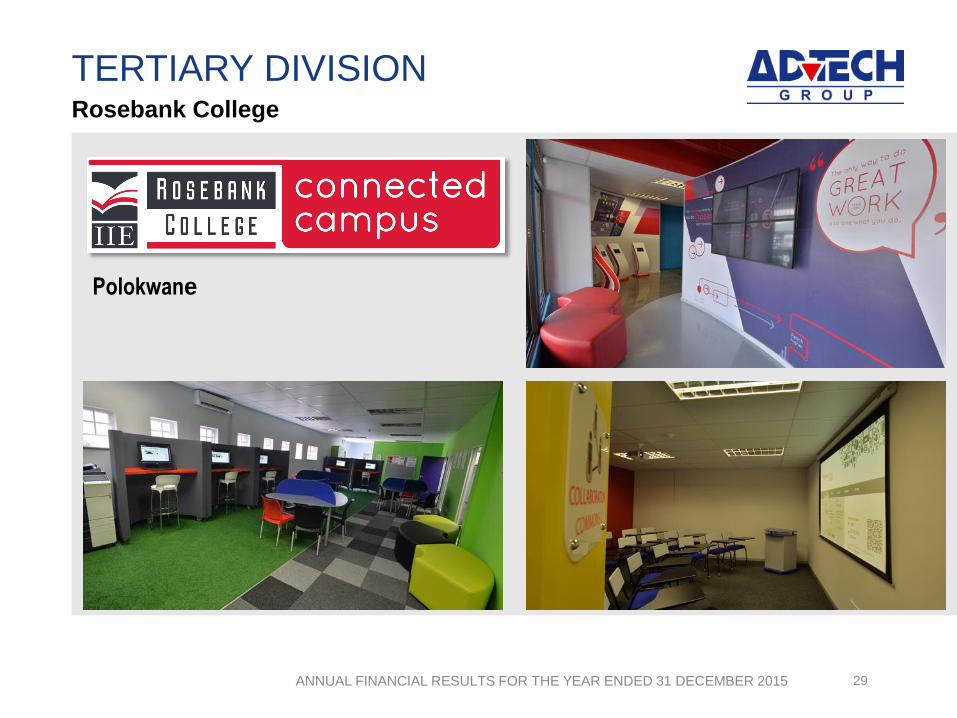
TERTIARY DIVISION
29
Rosebank College
Polokwane
`
ANNUAL FINANCIAL RESULTS FOR THE YEAR ENDED 31 DECEMBER 2015
TERTIARY DIVISIONVEGA
Able to solve complex challenges with
innovative and meaningful business, brand and
communication solutions
Qualifications in brand building, creative
communication, and media
Masters level
Vega’s mantra – wisdomwithmagic –
communicates its belief in creative
strategic thinking
`
ANNUAL FINANCIAL RESULTS FOR THE YEAR ENDED 31 DECEMBER 2015
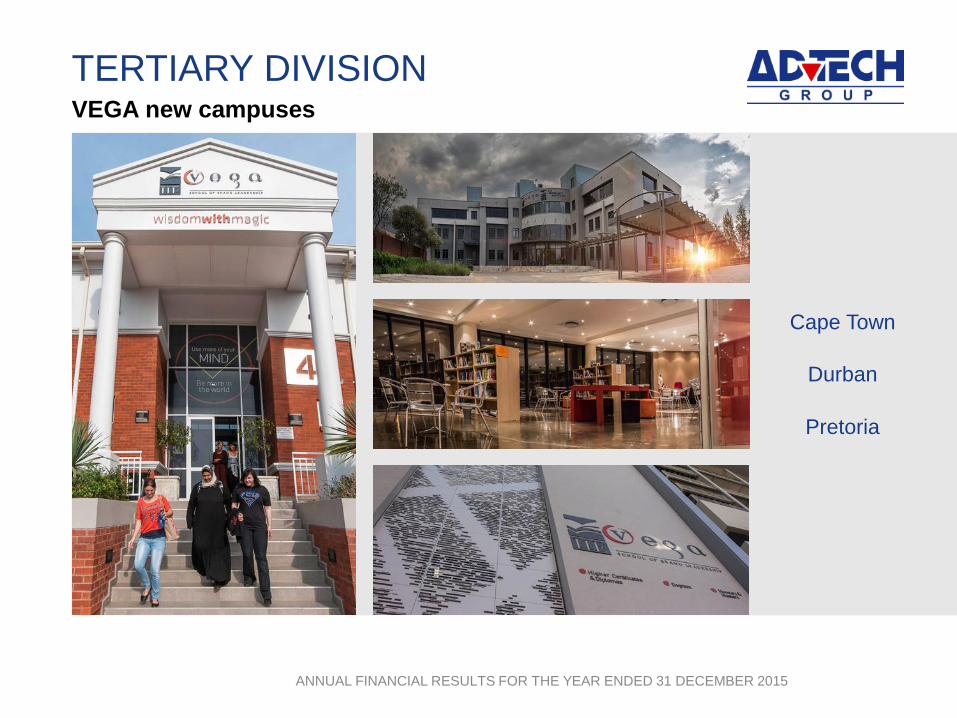
TERTIARY DIVISIONVEGA new campuses
Cape Town
Durban
Pretoria

`
ANNUAL FINANCIAL RESULTS FOR THE YEAR ENDED 31 DECEMBER 2015
TERTIARY DIVISIONVEGA
• D&AD – London, UK
Student exchange
• FONTYS University – Netherlands
• University of Art and Design in Offenbach - Germany
• TEDxVega
International agreements
• Loeries – 26 awards – Top honours
• Pendoring Awards – Silver
• Creative Brains – 1st and 2nd place
• Winner 2015 AdFocus Student of the Year Award
• Pencil Awards, D&AD New Blood Award
Awards won by students
`
ANNUAL FINANCIAL RESULTS FOR THE YEAR ENDED 31 DECEMBER 2015
TERTIARY DIVISIONVarsity College
Premium brand
Uniquely progressive approach to teaching,
learning and development
Student-centric approach
UNISA B.Ed.:
foundation, intermediate & senior
phase students
distinction rate of 54%
average of 3.4 distinctions per student
Faculties
• Humanities
• Commerce
• Social Sciences
• Information
Technology
`
ANNUAL FINANCIAL RESULTS FOR THE YEAR ENDED 31 DECEMBER 2015
TERTIARY DIVISIONBusiness School at Varsity College
Short learning programmes
Part-time study
Adult learning –
theory and practical application

`
ANNUAL FINANCIAL RESULTS FOR THE YEAR ENDED 31 DECEMBER 2015
TERTIARY DIVISIONForbes Lever Baker
Premier tuition support provider for the UNISA
accounting qualifications
Superb pass rate
95%pass rate for 2015
SAICA ITC board
exam achieved by
CTA students
FLB –
top Unisa CTA
level 2 student
in 2015
`
ANNUAL FINANCIAL RESULTS FOR THE YEAR ENDED 31 DECEMBER 2015
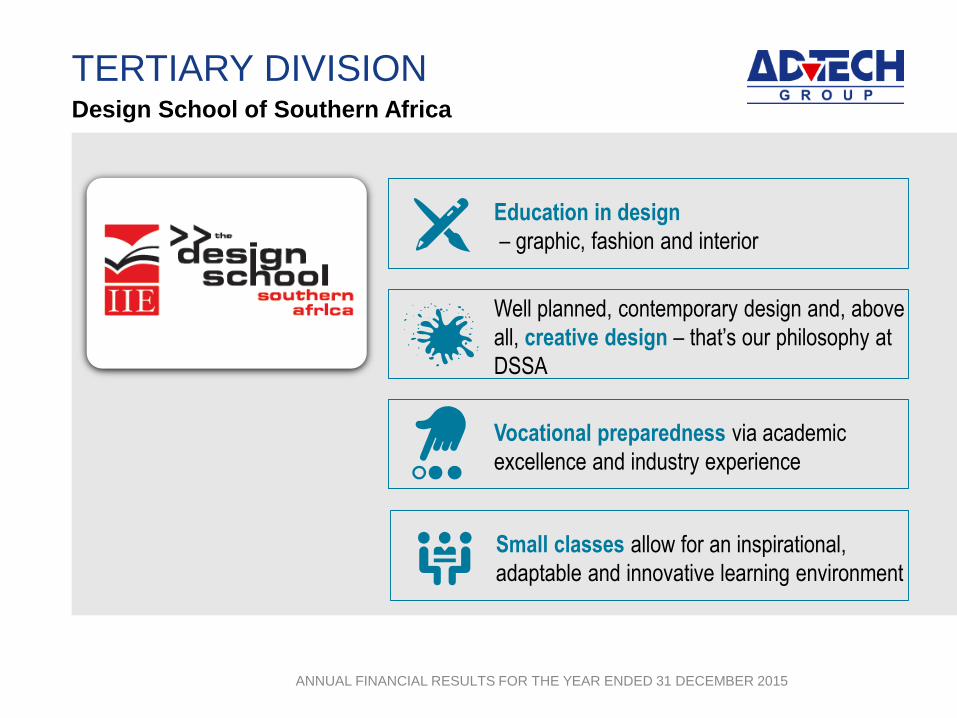
TERTIARY DIVISIONDesign School of Southern Africa
Vocational preparedness via academic
excellence and industry experience
Education in design
– graphic, fashion and interior
Well planned, contemporary design and, above
all, creative design – that’s our philosophy at
DSSA
Small classes allow for an inspirational,
adaptable and innovative learning environment
`
ANNUAL FINANCIAL RESULTS FOR THE YEAR ENDED 31 DECEMBER 2015
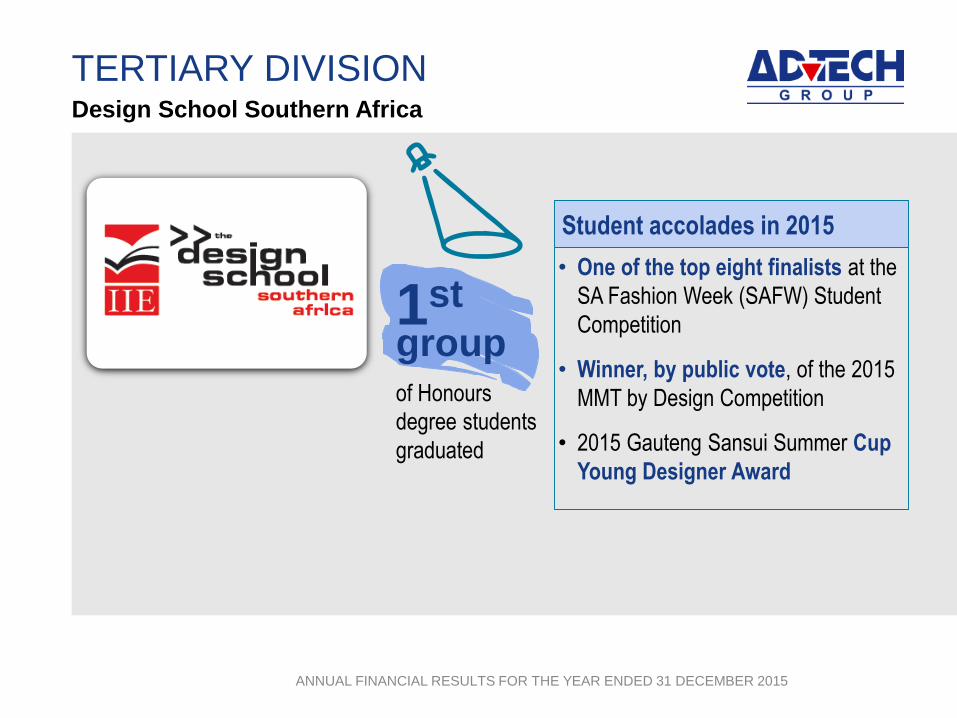
TERTIARY DIVISIONDesign School Southern Africa
1st
groupof Honours
degree students
graduated
• One of the top eight finalists at the
SA Fashion Week (SAFW) Student
Competition
• Winner, by public vote, of the 2015
MMT by Design Competition
• 2015 Gauteng Sansui Summer Cup
Young Designer Award
Student accolades in 2015
`
ANNUAL FINANCIAL RESULTS FOR THE YEAR ENDED 31 DECEMBER 2015
TERTIARY DIVISION
38
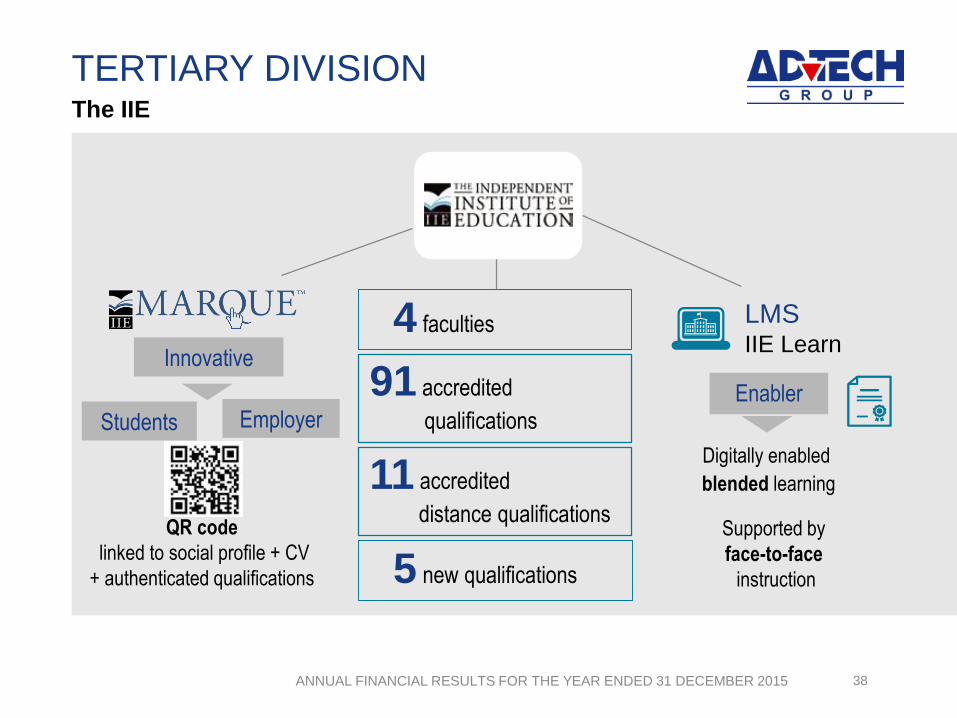
The IIE
Digitally enabled
blended learning
QR code
linked to social profile + CV
+ authenticated qualifications
LMSIIE Learn
Innovative
Enabler
Students Employer
Supported by
face-to-face
instruction
4 faculties
91 accredited
qualifications
11 accredited
distance qualifications
5 new qualifications
`
ANNUAL FINANCIAL RESULTS FOR THE YEAR ENDED 31 DECEMBER 2015
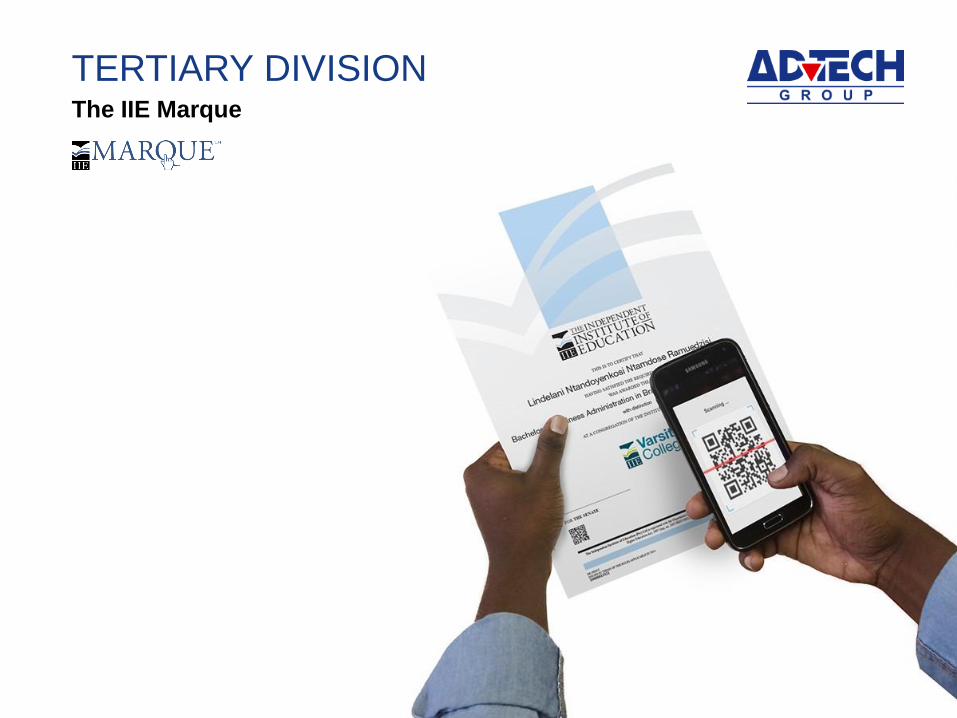
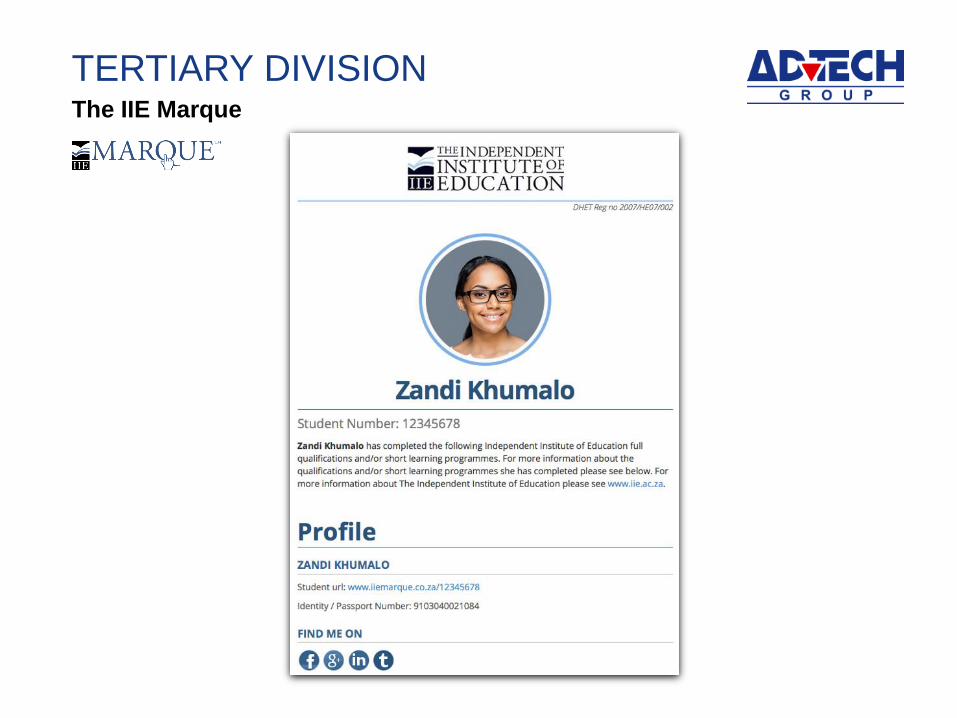
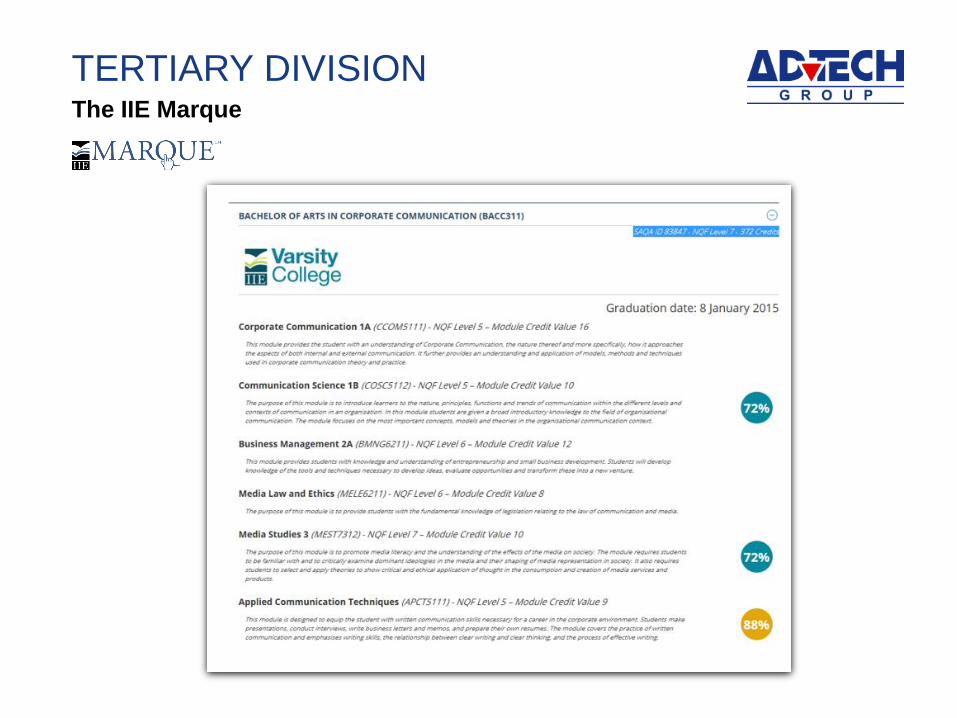
TERTIARY DIVISIONThe IIE Marque
`
ANNUAL FINANCIAL RESULTS FOR THE YEAR ENDED 31 DECEMBER 2015
TERTIARY DIVISIONThe IIE Marque
`
ANNUAL FINANCIAL RESULTS FOR THE YEAR ENDED 31 DECEMBER 2015
TERTIARY DIVISIONThe IIE Marque
`
ANNUAL FINANCIAL RESULTS FOR THE YEAR ENDED 31 DECEMBER 2015
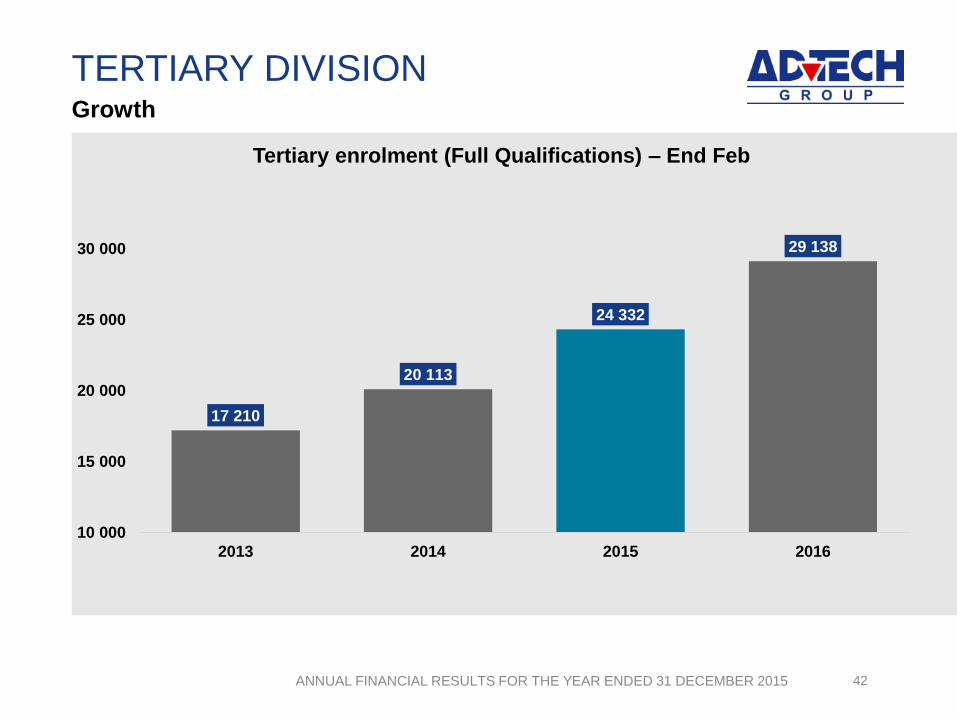
TERTIARY DIVISION
42
Growth
17 210
20 113
24 332
29 138
10 000
15 000
20 000
25 000
30 000
2013 2014 2015 2016
Tertiary enrolment (Full Qualifications) – End Feb
`
ANNUAL FINANCIAL RESULTS FOR THE YEAR ENDED 31 DECEMBER 2015
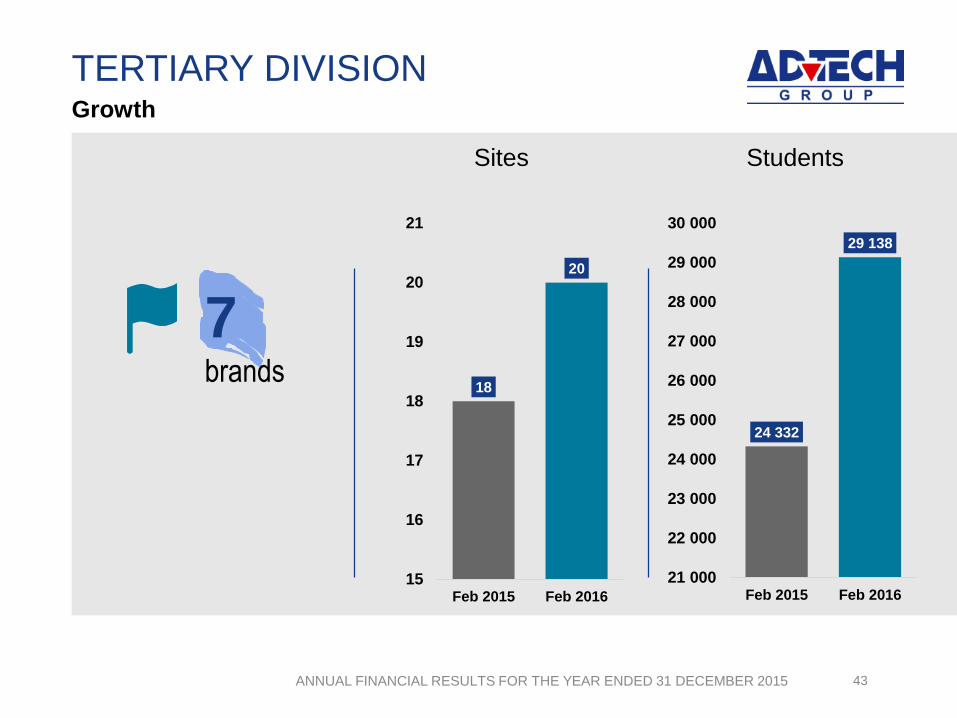
TERTIARY DIVISION
43
Growth
18
20
15
16
17
18
19
20
21
Feb 2015 Feb 2016
Sites
24 332
29 138
21 000
22 000
23 000
24 000
25 000
26 000
27 000
28 000
29 000
30 000
Feb 2015 Feb 2016
Students
7brands
`
ANNUAL FINANCIAL RESULTS FOR THE YEAR ENDED 31 DECEMBER 2015
TERTIARY DIVISION
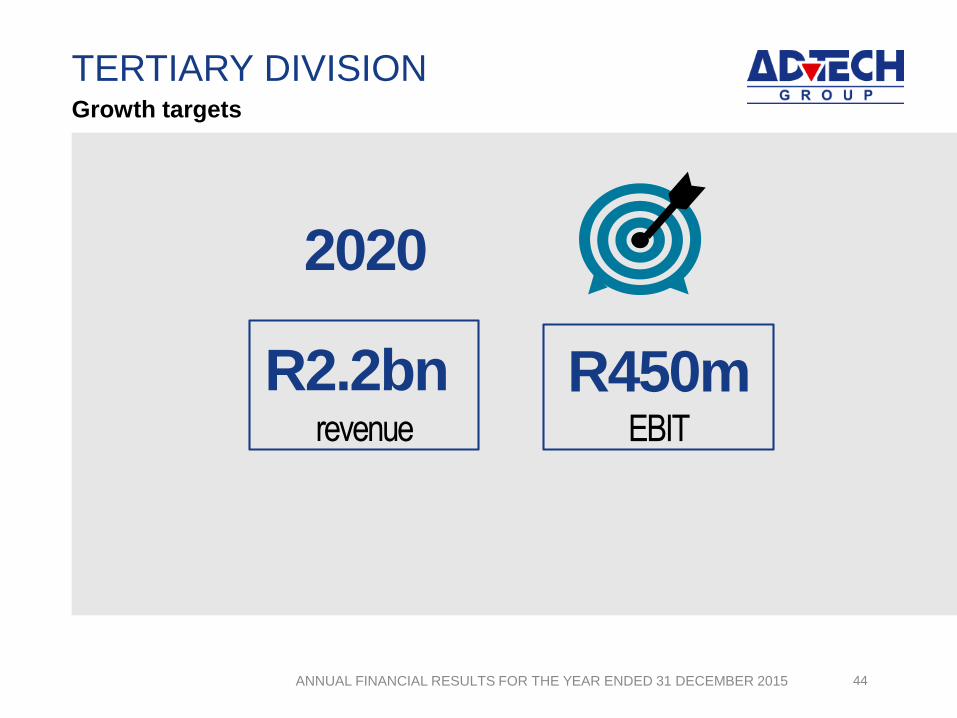
44
Growth targets
R450mEBIT
R2.2bnrevenue
2020
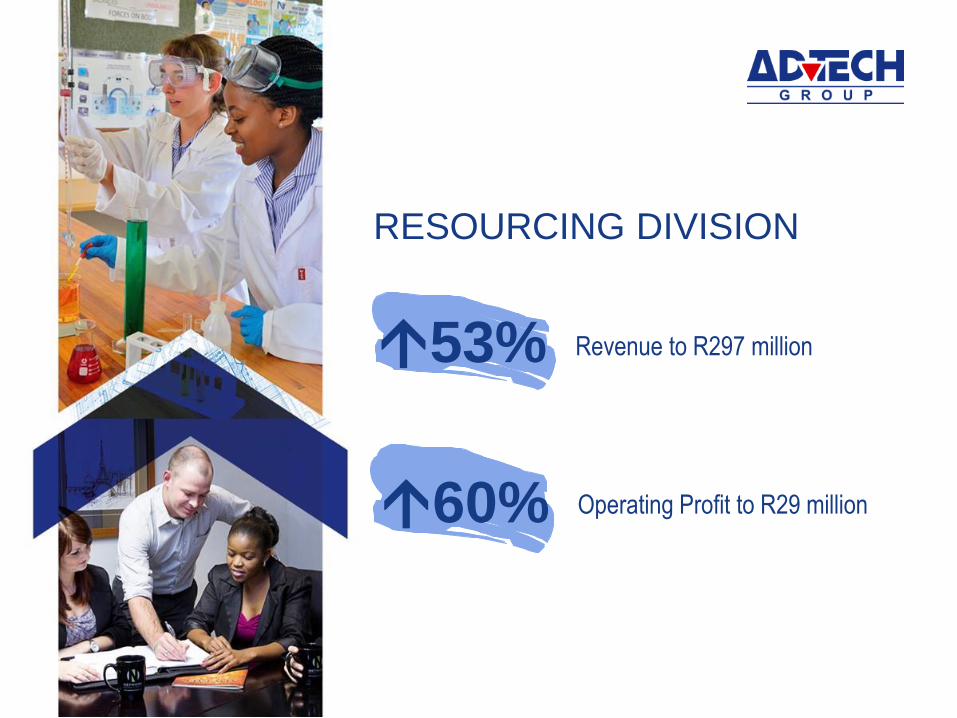
RESOURCING DIVISION
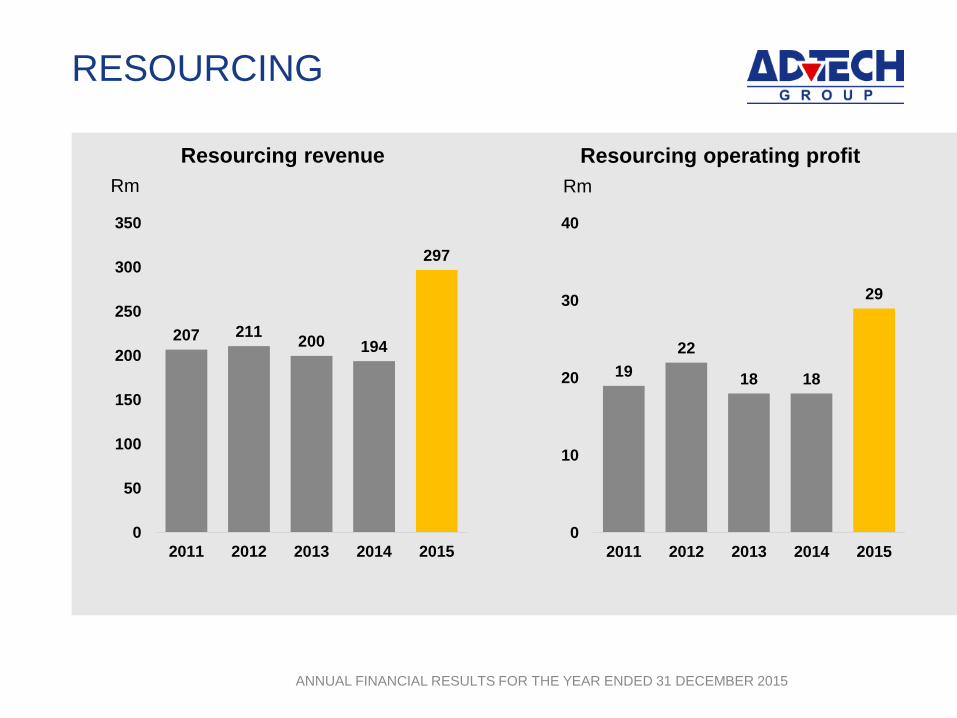
53% Revenue to R297 million
60% Operating Profit to R29 million
`
ANNUAL FINANCIAL RESULTS FOR THE YEAR ENDED 31 DECEMBER 2015
RESOURCING DIVISION
46
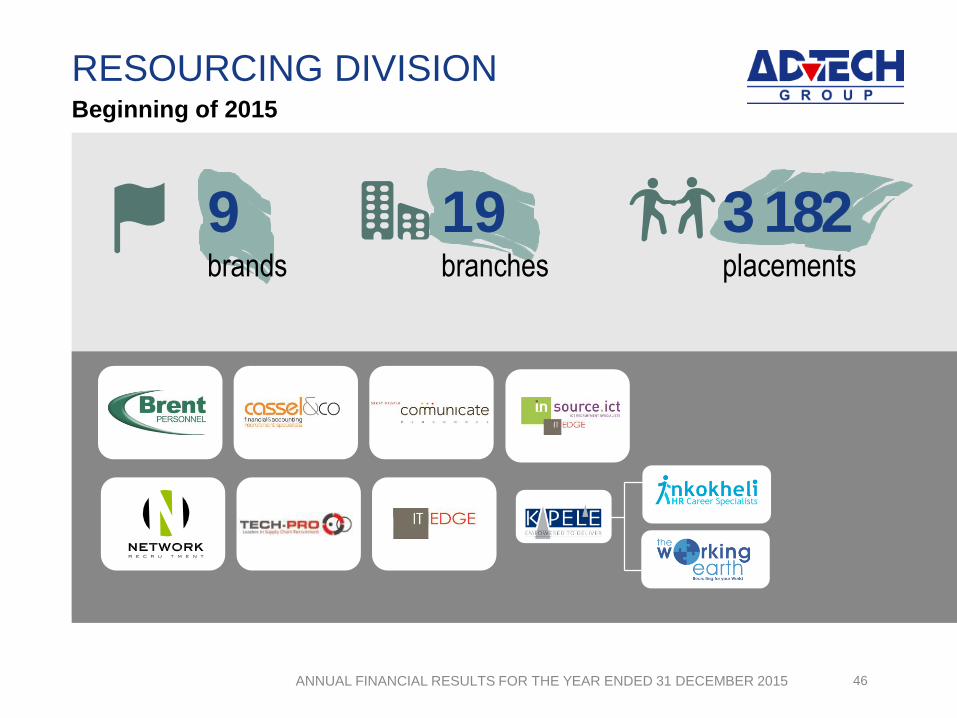
Beginning of 2015
19branches
3 182placements
9brands
`
ANNUAL FINANCIAL RESULTS FOR THE YEAR ENDED 31 DECEMBER 2015
RESOURCING DIVISION
47
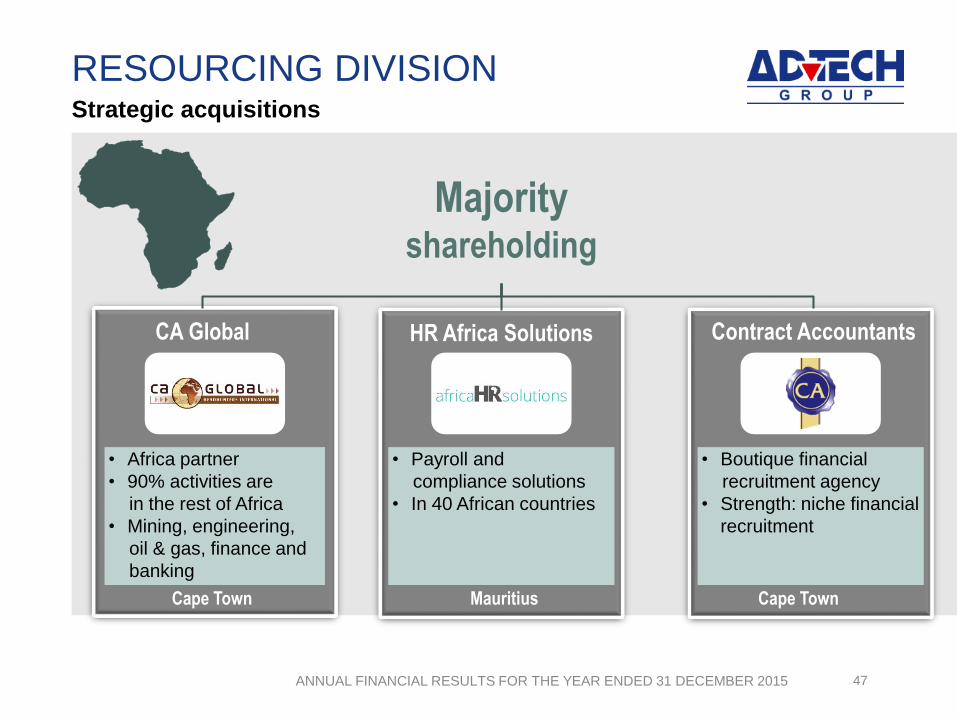
Strategic acquisitions
• Africa partner
• 90% activities are
in the rest of Africa
• Mining, engineering,
oil & gas, finance and
banking
• Payroll and
compliance solutions
• In 40 African countries
• Boutique financial
recruitment agency
• Strength: niche financial
recruitment
Majority shareholding
CA Global HR Africa Solutions Contract Accountants
Cape Town Mauritius Cape Town
`
ANNUAL FINANCIAL RESULTS FOR THE YEAR ENDED 31 DECEMBER 2015
RESOURCING DIVISION
48
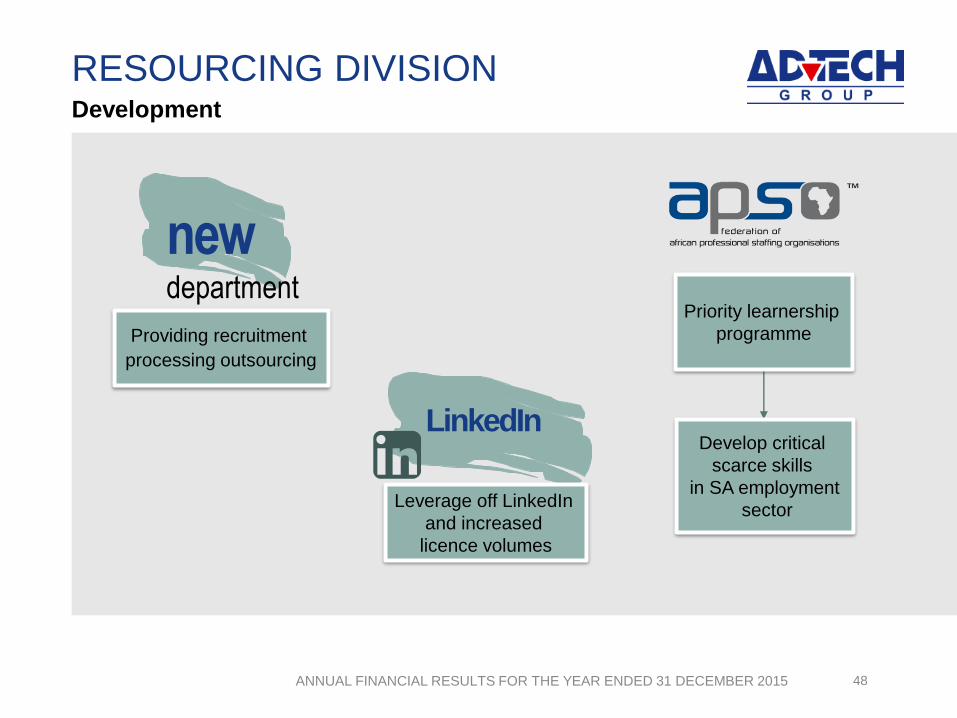
Development
newdepartment
Providing recruitment
processing outsourcing
Leverage off LinkedIn
and increased
licence volumes
Priority learnership
programme
Develop critical
scarce skills
in SA employment
sector
`
ANNUAL FINANCIAL RESULTS FOR THE YEAR ENDED 31 DECEMBER 2015
RESOURCING DIVISION
49
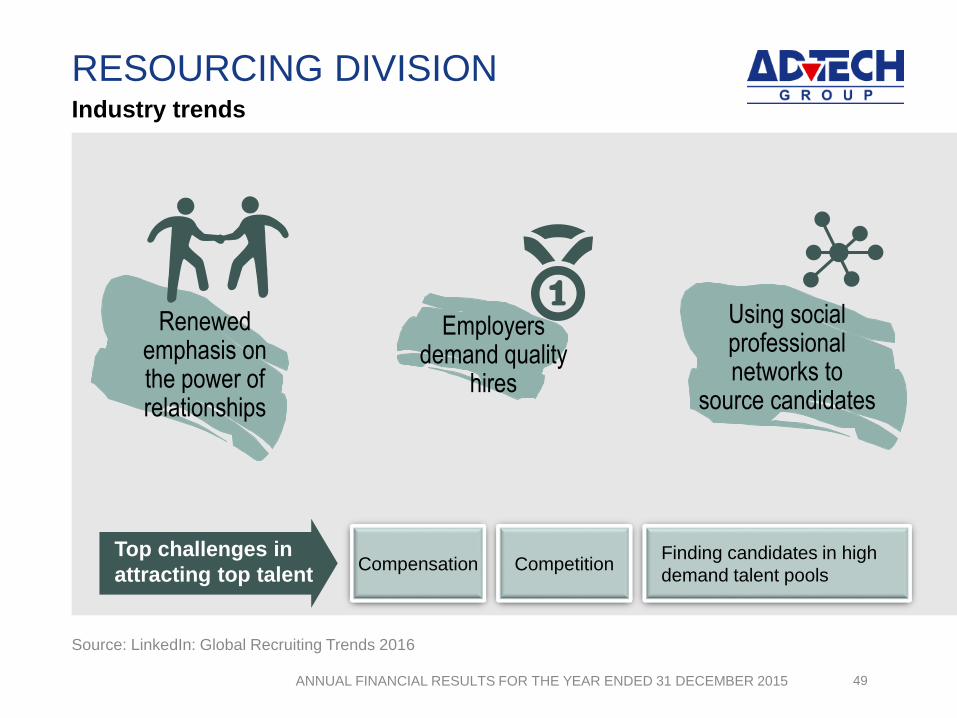
Industry trends
Renewed emphasis on the power of relationships
Employers demand quality
hires
Using social professional networks to
source candidates
Finding candidates in high
demand talent pools
Source: LinkedIn: Global Recruiting Trends 2016
CompensationTop challenges in
attracting top talentCompetition
`
ANNUAL FINANCIAL RESULTS FOR THE YEAR ENDED 31 DECEMBER 2015
RESOURCING DIVISION
50
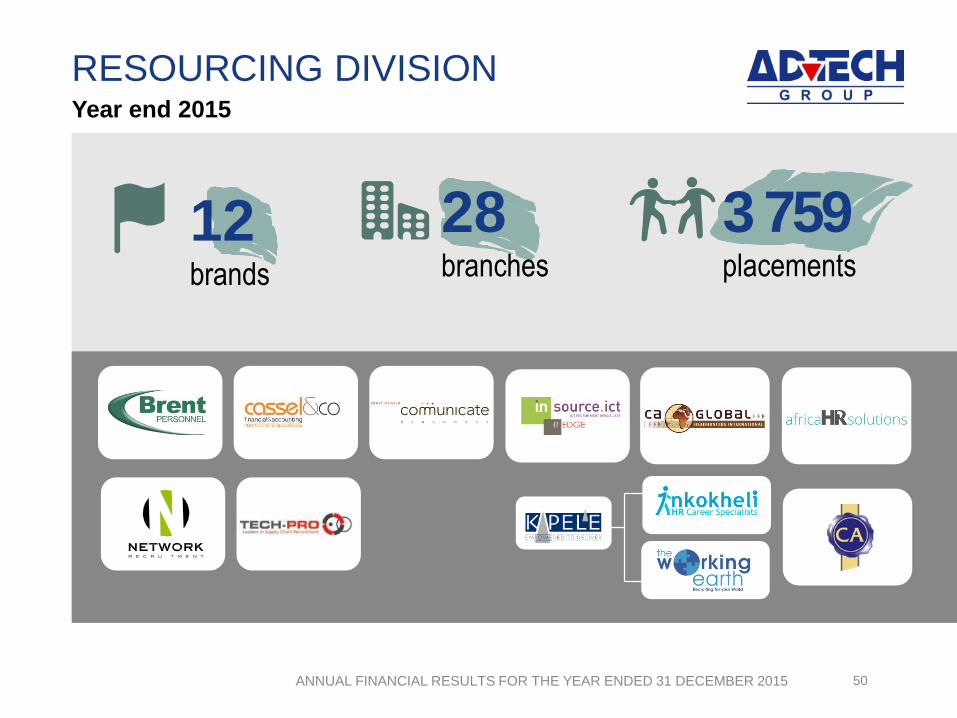
Year end 2015
28branches
12brands
3 759placements
OUR PEOPLE
`
ANNUAL FINANCIAL RESULTS FOR THE YEAR ENDED 31 DECEMBER 2015
OUR PEOPLE
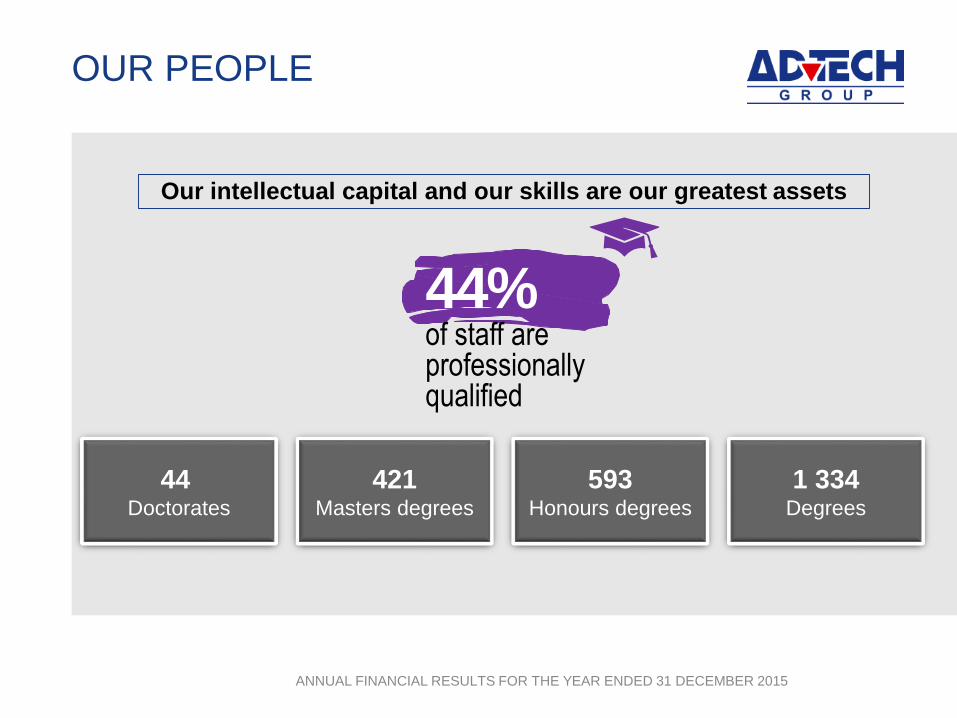
Our intellectual capital and our skills are our greatest assets
44%of staff are professionally qualified
44 Doctorates
421Masters degrees
593Honours degrees
1 334Degrees
`
ANNUAL FINANCIAL RESULTS FOR THE YEAR ENDED 31 DECEMBER 2015
OUR PEOPLE
Our intellectual capital and skills
are our greatest assets
`
ANNUAL FINANCIAL RESULTS FOR THE YEAR ENDED 31 DECEMBER 2015
OUR PEOPLE
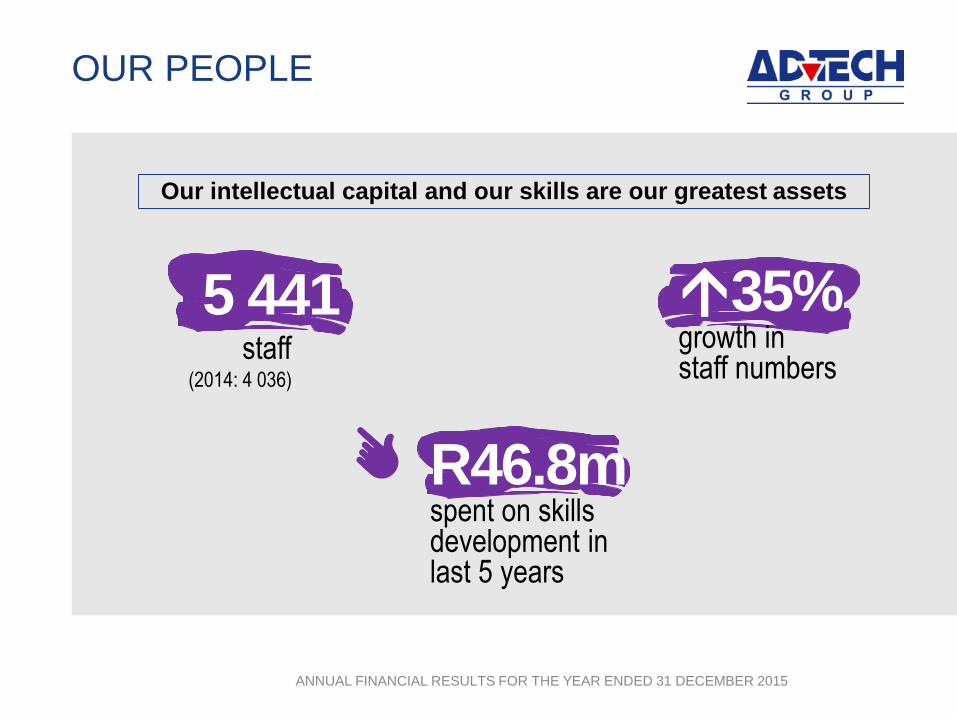
5 441staff
(2014: 4 036)
35%growth in staff numbers
R46.8mspent on skills development in last 5 years
Our intellectual capital and our skills are our greatest assets
`
ANNUAL FINANCIAL RESULTS FOR THE YEAR ENDED 31 DECEMBER 2015
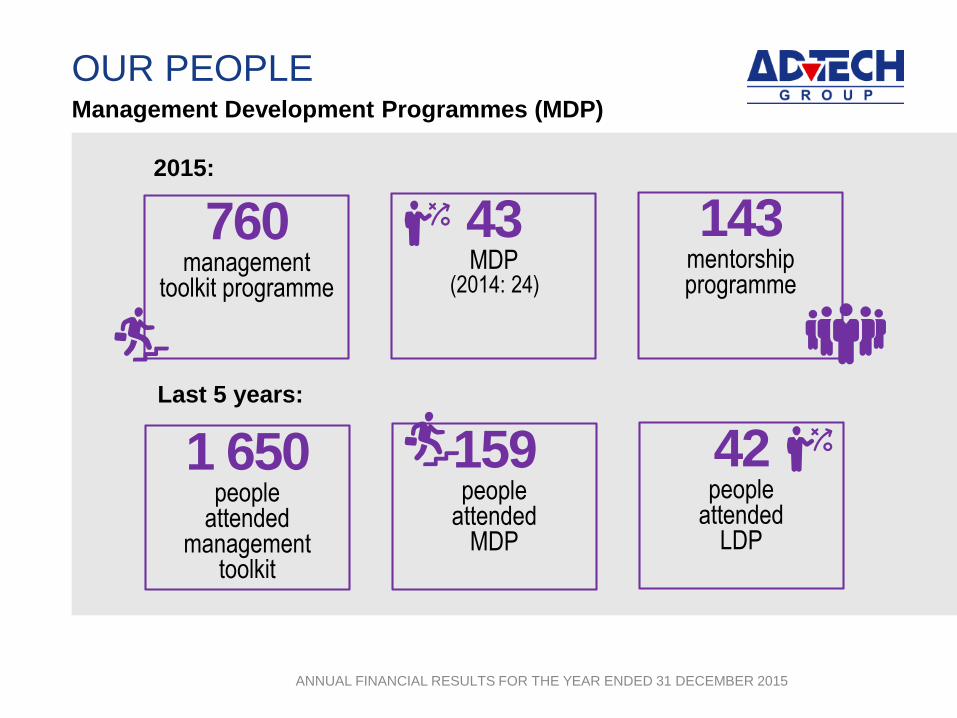
OUR PEOPLEManagement Development Programmes (MDP)
2015:
159people
attended MDP
42people
attended LDP
1 650people
attended management
toolkit
Last 5 years:
43MDP
(2014: 24)
143mentorship programme
760management
toolkit programme
Introduction
Results
Financial highlights
Prospects
Questions

`
ANNUAL FINANCIAL RESULTS FOR THE YEAR ENDED 31 DECEMBER 2015
FINANCIALSIncome statement
Rm2015 2014 % change
% change at mid-year
Revenue 2 708 1 932 40% 33%
Operating profit 448 256 75% 73%
Diluted normalised earnings
per share – cents53.9 42.3 27% 30%
`
ANNUAL FINANCIAL RESULTS FOR THE YEAR ENDED 31 DECEMBER 2015
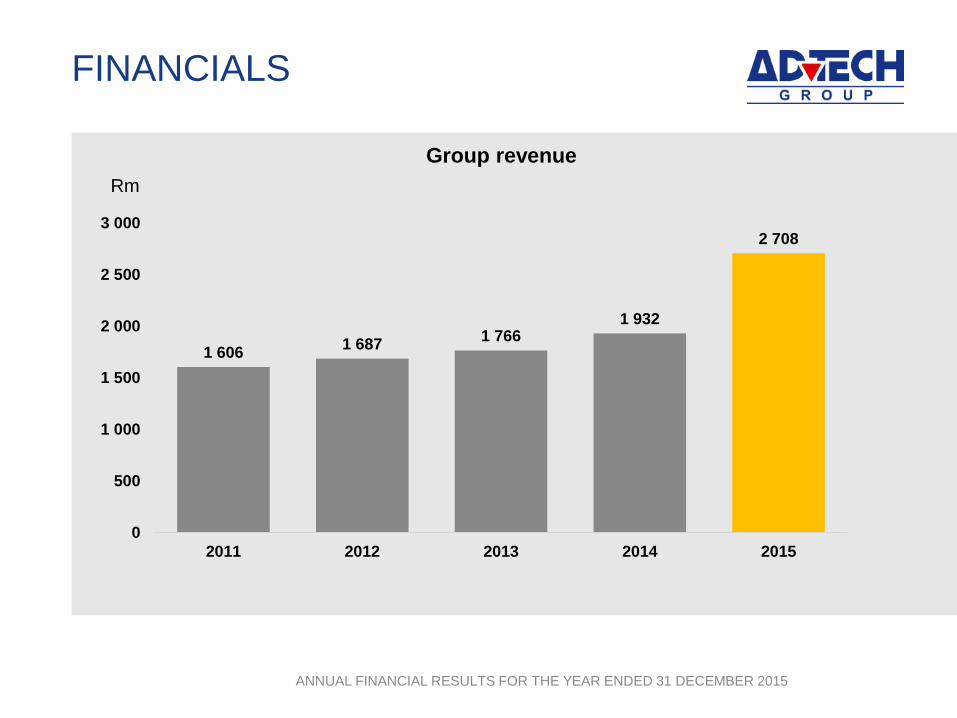
FINANCIALS
1 6061 687
1 7661 932
2 708
0
500
1 000
1 500
2 000
2 500
3 000
2011 2012 2013 2014 2015
Group revenue
Rm
`
ANNUAL FINANCIAL RESULTS FOR THE YEAR ENDED 31 DECEMBER 2015
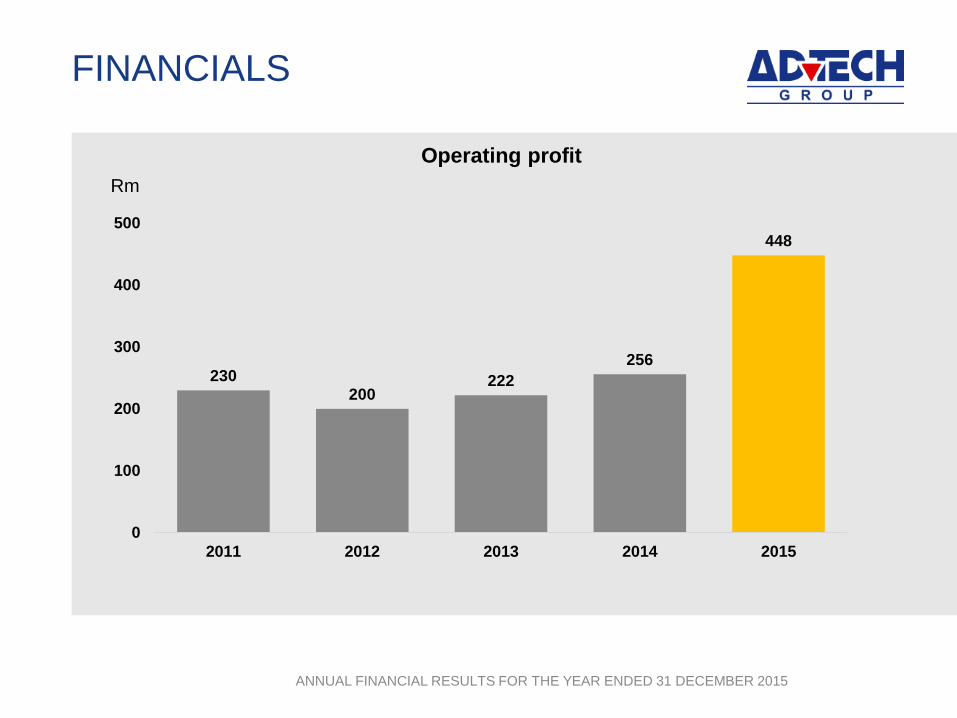
FINANCIALS
230200
222
256
448
0
100
200
300
400
500
2011 2012 2013 2014 2015
Operating profit
Rm
`
ANNUAL FINANCIAL RESULTS FOR THE YEAR ENDED 31 DECEMBER 2015
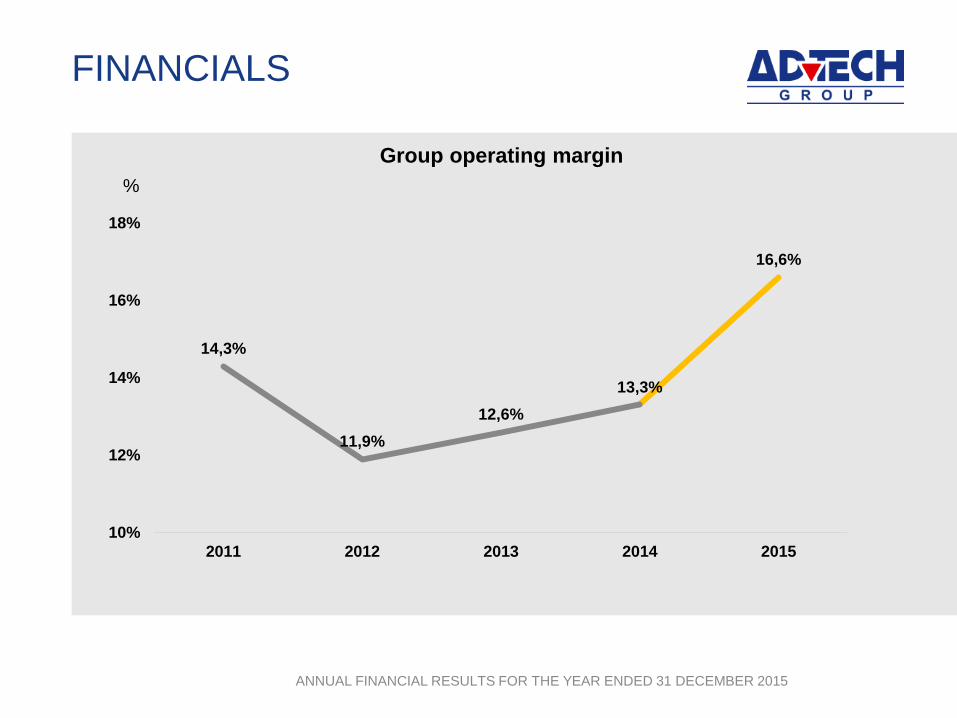
FINANCIALS
14,3%
11,9%
12,6%
13,3%
16,6%
10%
12%
14%
16%
18%
2011 2012 2013 2014 2015
Group operating margin
%
`
ANNUAL FINANCIAL RESULTS FOR THE YEAR ENDED 31 DECEMBER 2015
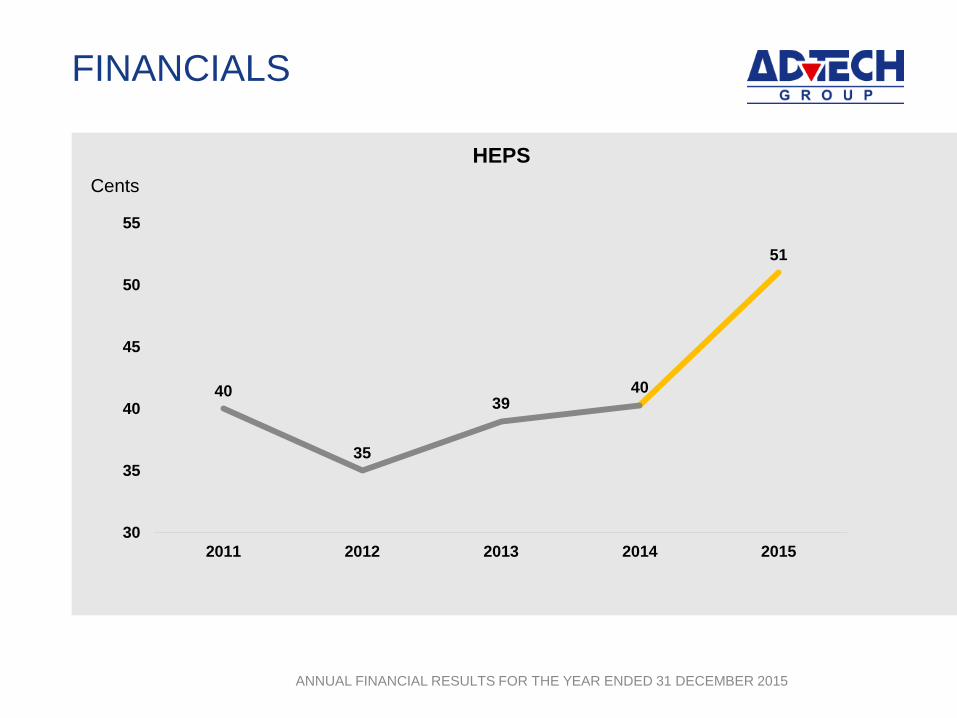
FINANCIALS
40
35
3940
51
30
35
40
45
50
55
2011 2012 2013 2014 2015
HEPS
Cents
`
ANNUAL FINANCIAL RESULTS FOR THE YEAR ENDED 31 DECEMBER 2015
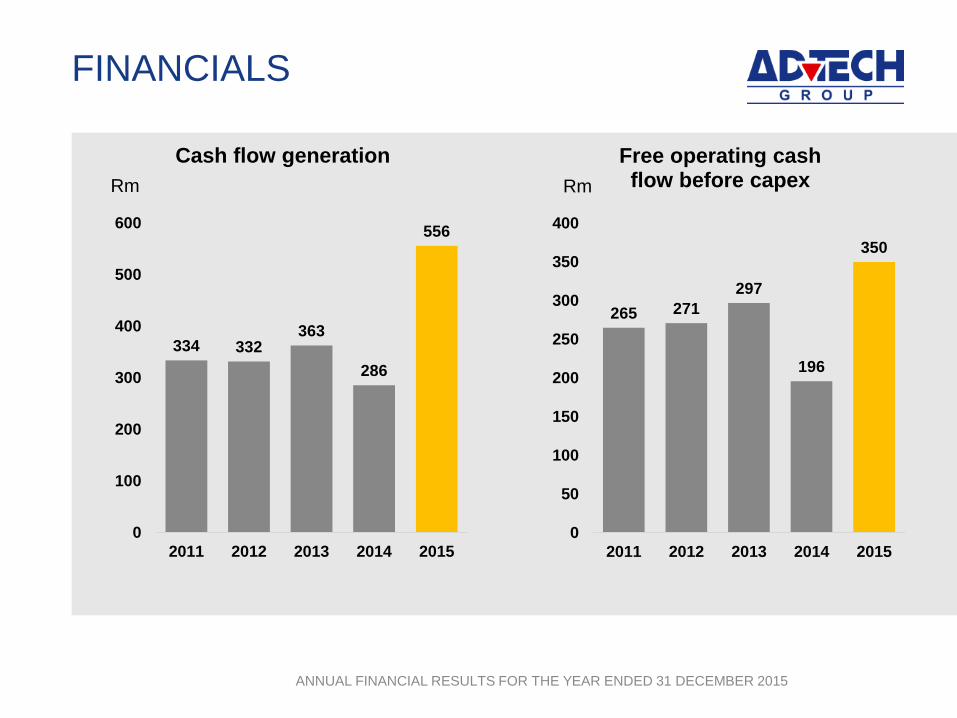
FINANCIALS
334 332363
286
556
0
100
200
300
400
500
600
2011 2012 2013 2014 2015
Cash flow generation
Rm
265 271
297
196
350
0
50
100
150
200
250
300
350
400
2011 2012 2013 2014 2015
Free operating cash flow before capexRm
`
ANNUAL FINANCIAL RESULTS FOR THE YEAR ENDED 31 DECEMBER 2015
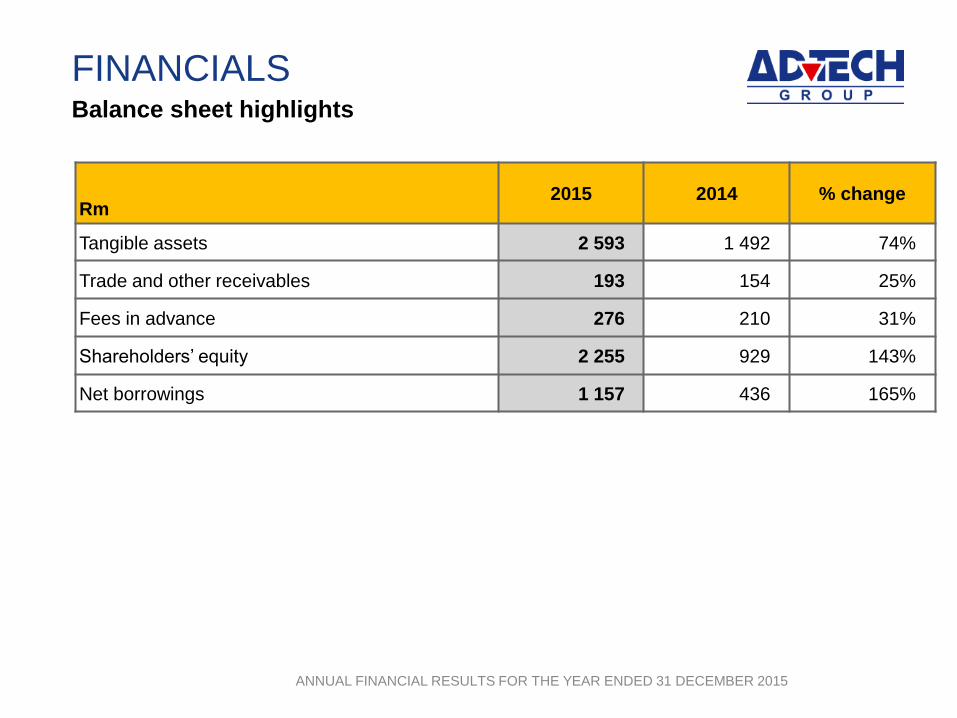
FINANCIALSBalance sheet highlights
Rm2015 2014 % change
Tangible assets 2 593 1 492 74%
Trade and other receivables 193 154 25%
Fees in advance 276 210 31%
Shareholders’ equity 2 255 929 143%
Net borrowings 1 157 436 165%
`
ANNUAL FINANCIAL RESULTS FOR THE YEAR ENDED 31 DECEMBER 2015
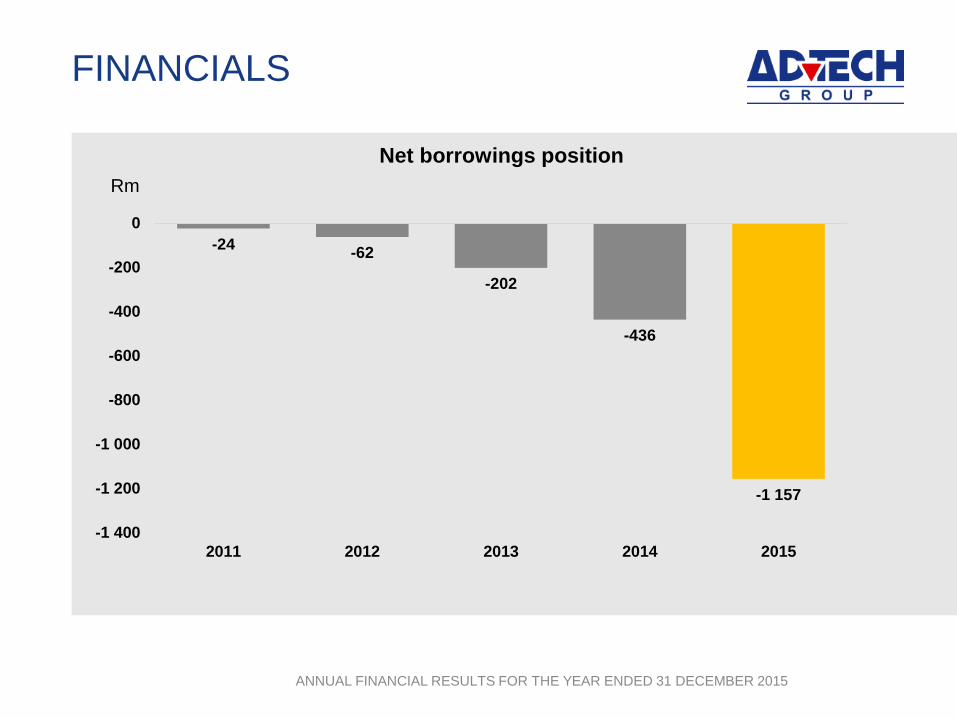
FINANCIALS
Rm
-24-62
-202
-436
-1 157
-1 400
-1 200
-1 000
-800
-600
-400
-200
0
2011 2012 2013 2014 2015
Net borrowings position
`
ANNUAL FINANCIAL RESULTS FOR THE YEAR ENDED 31 DECEMBER 2015
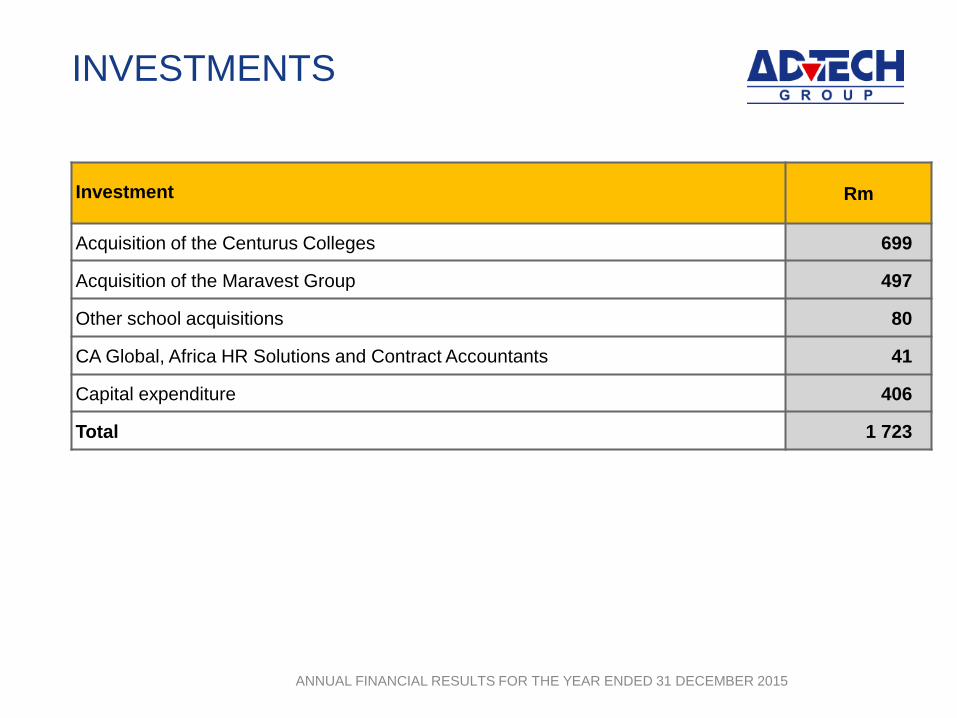
INVESTMENTS
Investment Rm
Acquisition of the Centurus Colleges 699
Acquisition of the Maravest Group 497
Other school acquisitions 80
CA Global, Africa HR Solutions and Contract Accountants 41
Capital expenditure 406
Total 1 723
`
ANNUAL FINANCIAL RESULTS FOR THE YEAR ENDED 31 DECEMBER 2015
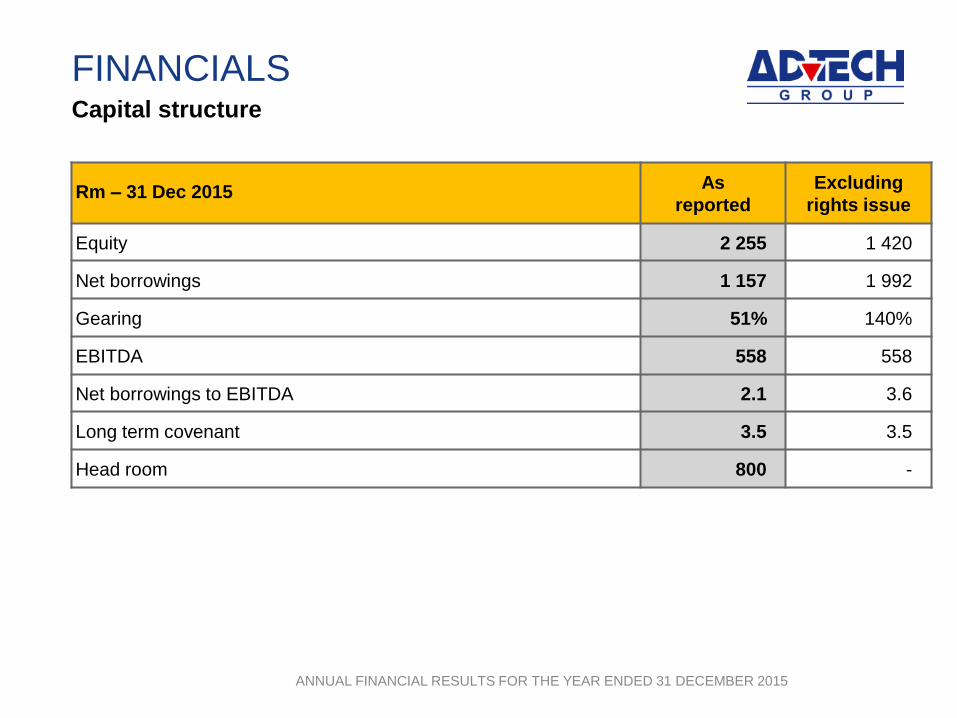
FINANCIALSCapital structure
Rm – 31 Dec 2015As
reported
Excluding
rights issue
Equity 2 255 1 420
Net borrowings 1 157 1 992
Gearing 51% 140%
EBITDA 558 558
Net borrowings to EBITDA 2.1 3.6
Long term covenant 3.5 3.5
Head room 800 -
`
ANNUAL FINANCIAL RESULTS FOR THE YEAR ENDED 31 DECEMBER 2015
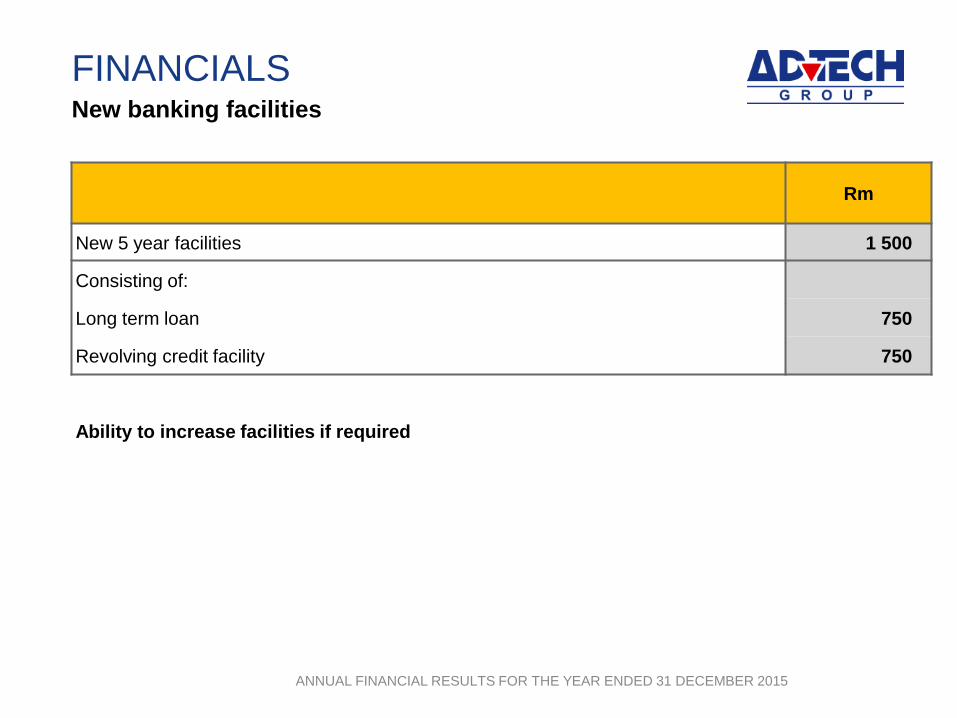
FINANCIALSNew banking facilities
Rm
New 5 year facilities 1 500
Consisting of:
Long term loan 750
Revolving credit facility 750
Ability to increase facilities if required
SEGMENTAL ANALYSIS
`
ANNUAL FINANCIAL RESULTS FOR THE YEAR ENDED 31 DECEMBER 2015
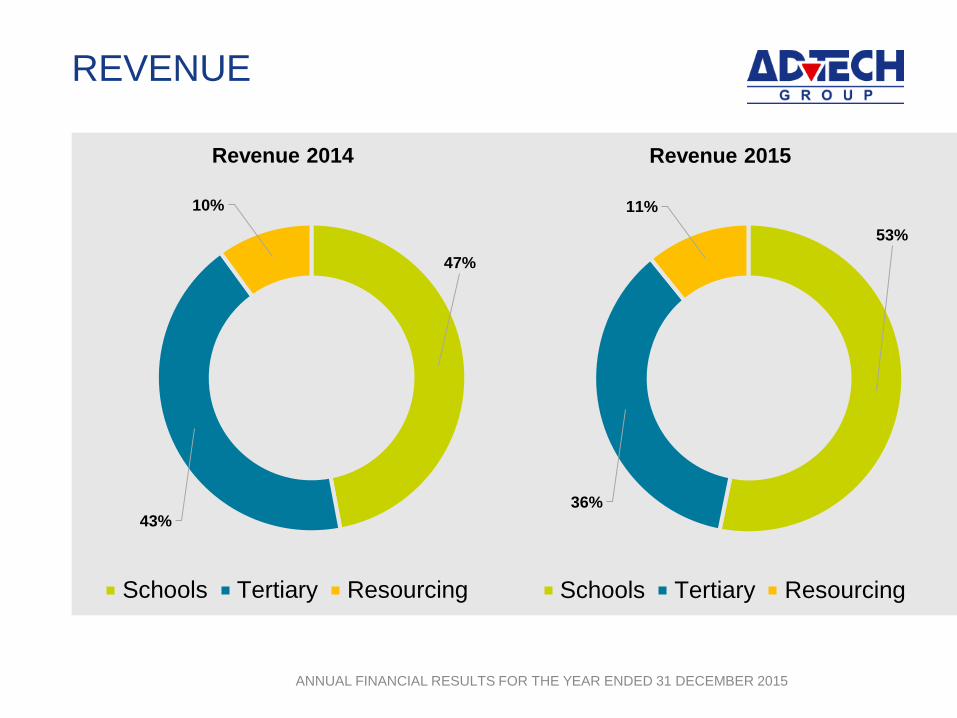
REVENUE
47%
43%
10%
Revenue 2014
Schools Tertiary Resourcing
53%
36%
11%
Revenue 2015
Schools Tertiary Resourcing

`
ANNUAL FINANCIAL RESULTS FOR THE YEAR ENDED 31 DECEMBER 2015
OPERATING PROFIT
61%
32%
7%
Operating profit 2014
Schools Tertiary Resourcing
65%
29%
6%
Operating profit 2015
Schools Tertiary Resourcing
`
ANNUAL FINANCIAL RESULTS FOR THE YEAR ENDED 31 DECEMBER 2015
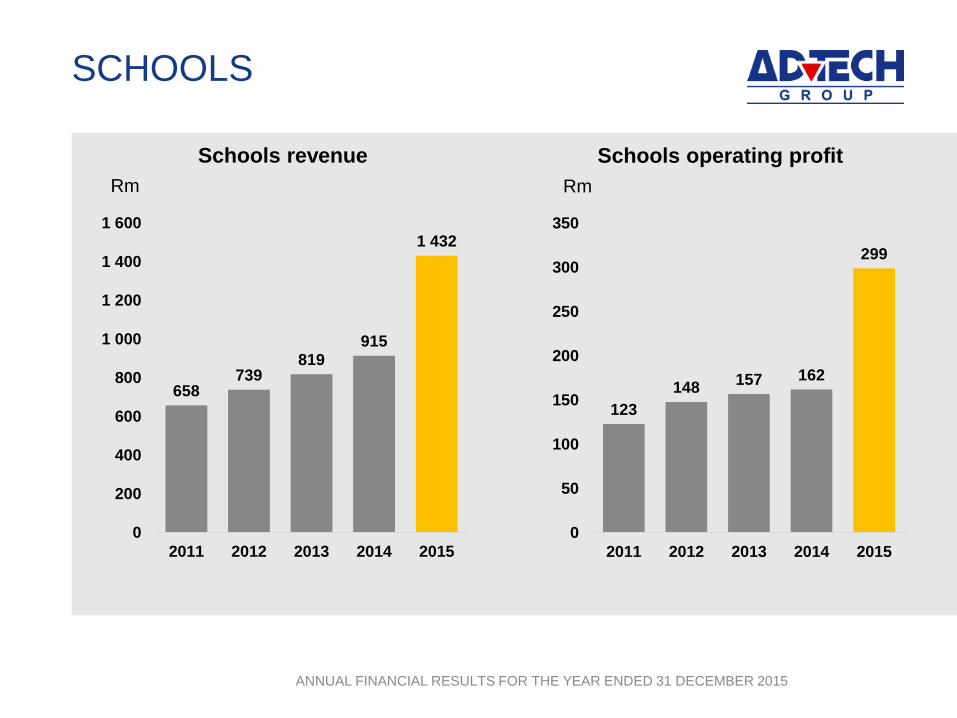
SCHOOLS
Rm
123
148157 162
299
0
50
100
150
200
250
300
350
2011 2012 2013 2014 2015
Schools operating profit
Rm
658739
819915
1 432
0
200
400
600
800
1 000
1 200
1 400
1 600
2011 2012 2013 2014 2015
Schools revenue
`
ANNUAL FINANCIAL RESULTS FOR THE YEAR ENDED 31 DECEMBER 2015
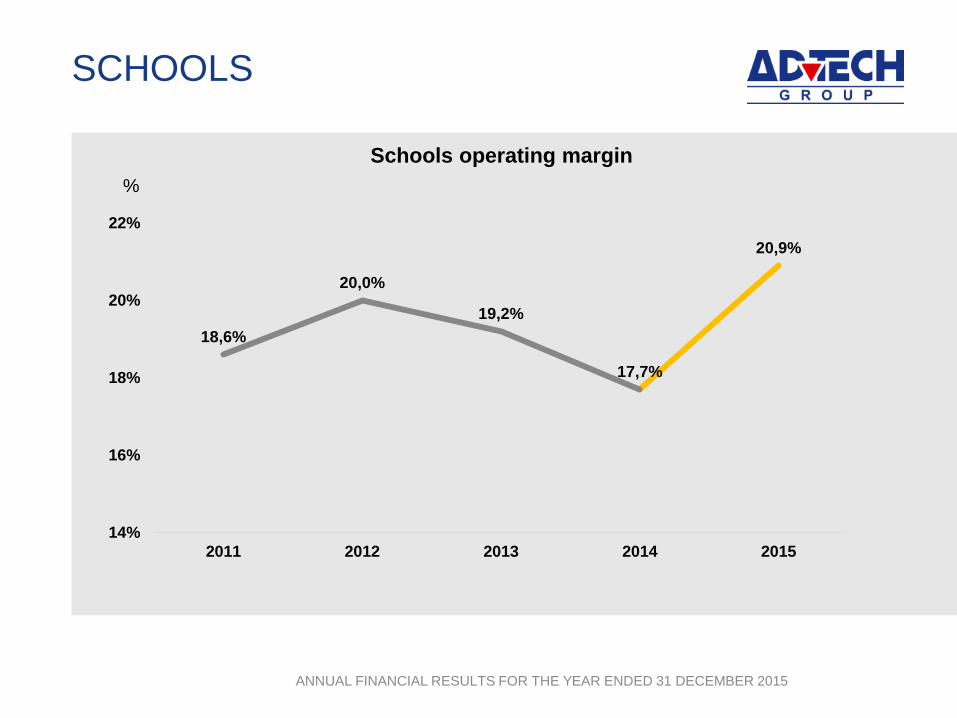
SCHOOLS
18,6%
20,0%
19,2%
17,7%
20,9%
14%
16%
18%
20%
22%
2011 2012 2013 2014 2015
Schools operating margin
%
`
ANNUAL FINANCIAL RESULTS FOR THE YEAR ENDED 31 DECEMBER 2015
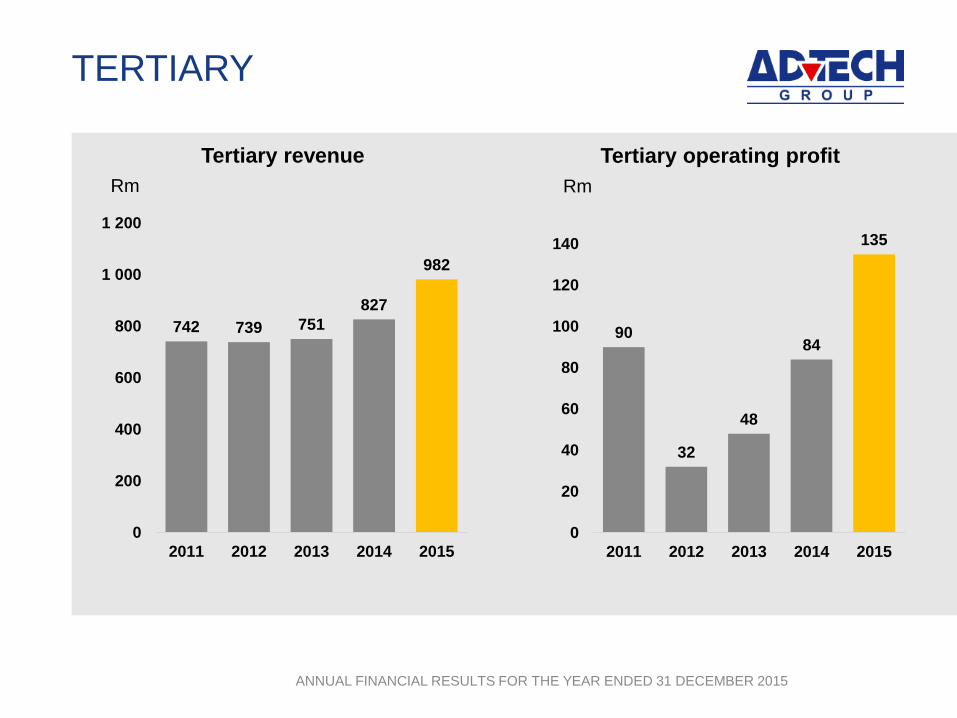
TERTIARY
Rm
90
32
48
84
135
0
20
40
60
80
100
120
140
2011 2012 2013 2014 2015
Tertiary operating profit
Rm
742 739 751
827
982
0
200
400
600
800
1 000
1 200
2011 2012 2013 2014 2015
Tertiary revenue

`
ANNUAL FINANCIAL RESULTS FOR THE YEAR ENDED 31 DECEMBER 2015
TERTIARY
12,2%
4,4%
6,4%
10,2%
13,7%
0%
2%
4%
6%
8%
10%
12%
14%
16%
2011 2012 2013 2014 2015
Tertiary operating margin
%
`
ANNUAL FINANCIAL RESULTS FOR THE YEAR ENDED 31 DECEMBER 2015
RESOURCING
Rm
19
22
18 18
29
0
10
20
30
40
2011 2012 2013 2014 2015
Resourcing operating profit
Rm
207 211200 194
297
0
50
100
150
200
250
300
350
2011 2012 2013 2014 2015
Resourcing revenue
`
ANNUAL FINANCIAL RESULTS FOR THE YEAR ENDED 31 DECEMBER 2015
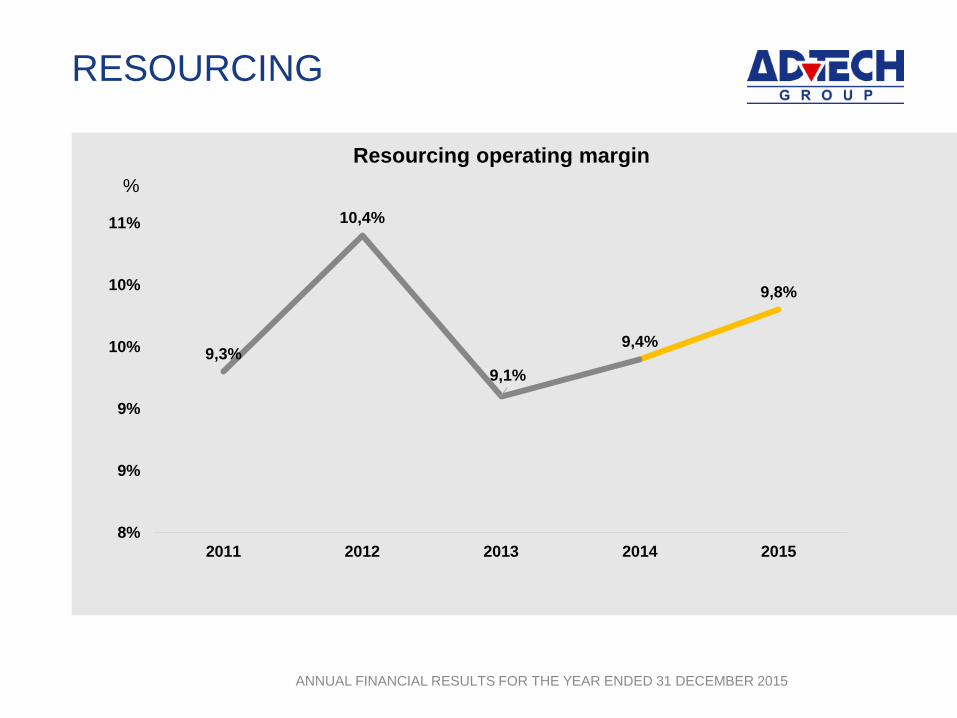
RESOURCING
9,3%
10,4%
9,1%
9,4%
9,8%
8%
9%
9%
10%
10%
11%
2011 2012 2013 2014 2015
Resourcing operating margin
%
Introduction
Results
Financial highlights
Prospects
Questions
`
ANNUAL FINANCIAL RESULTS FOR THE YEAR ENDED 31 DECEMBER 2015
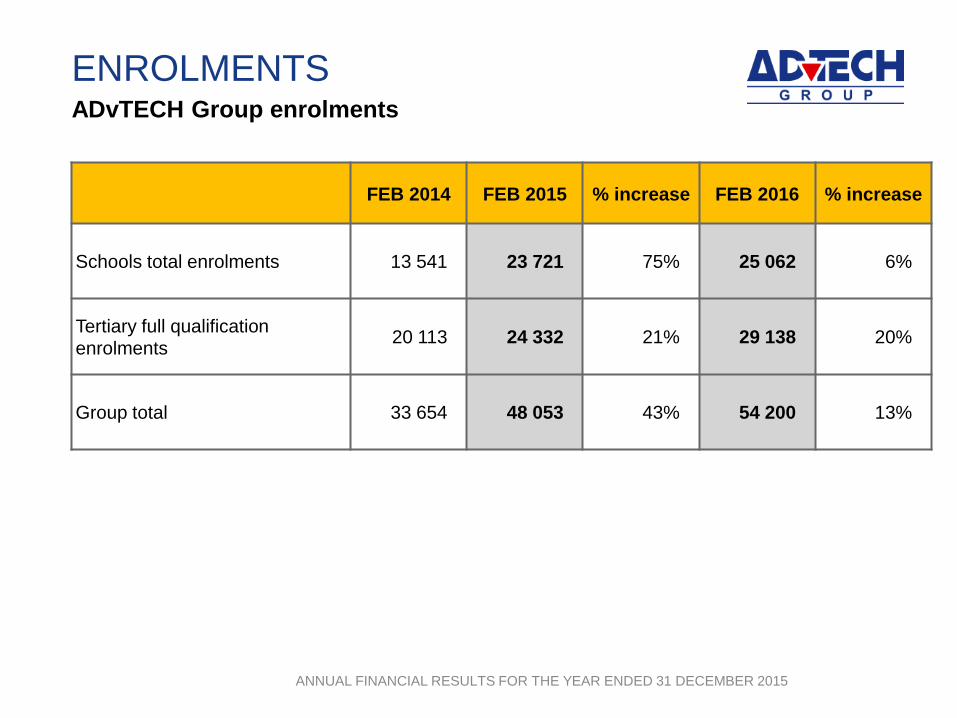
ENROLMENTSADvTECH Group enrolments
FEB 2014 FEB 2015 % increase FEB 2016 % increase
Schools total enrolments 13 541 23 721 75% 25 062 6%
Tertiary full qualification
enrolments20 113 24 332 21% 29 138 20%
Group total 33 654 48 053 43% 54 200 13%
`
ANNUAL FINANCIAL RESULTS FOR THE YEAR ENDED 31 DECEMBER 2015
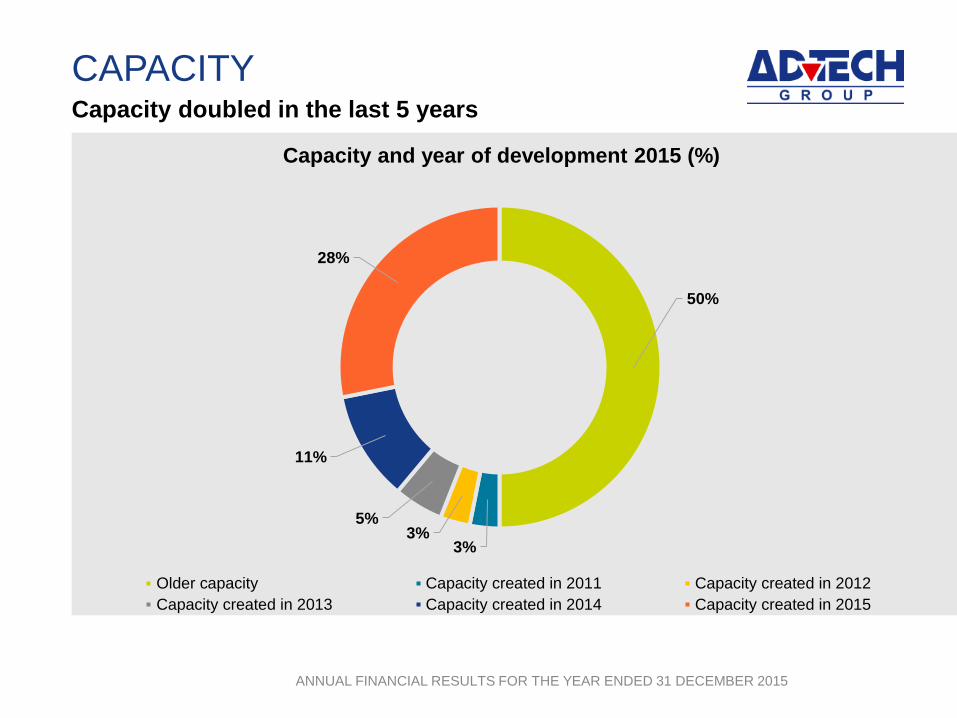
CAPACITY Capacity doubled in the last 5 years
50%
3%3%
5%
11%
28%
Capacity and year of development 2015 (%)
Older capacity Capacity created in 2011 Capacity created in 2012
Capacity created in 2013 Capacity created in 2014 Capacity created in 2015
`
ANNUAL FINANCIAL RESULTS FOR THE YEAR ENDED 31 DECEMBER 2015
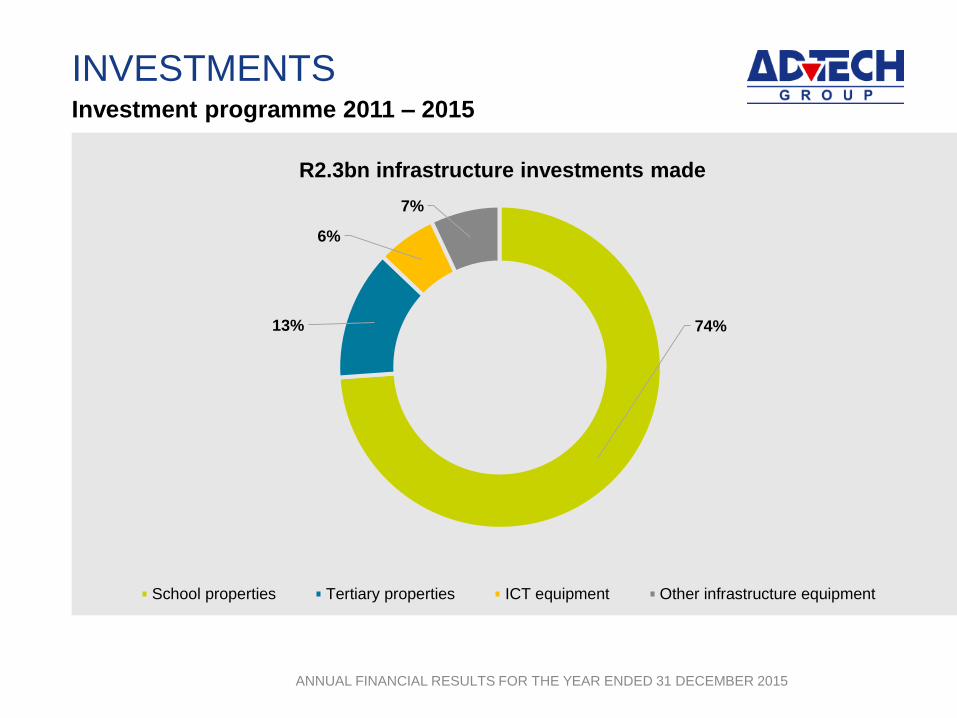
INVESTMENTSInvestment programme 2011 – 2015
74%13%
6%
7%
R2.3bn infrastructure investments made
School properties Tertiary properties ICT equipment Other infrastructure equipment
`
ANNUAL FINANCIAL RESULTS FOR THE YEAR ENDED 31 DECEMBER 2015
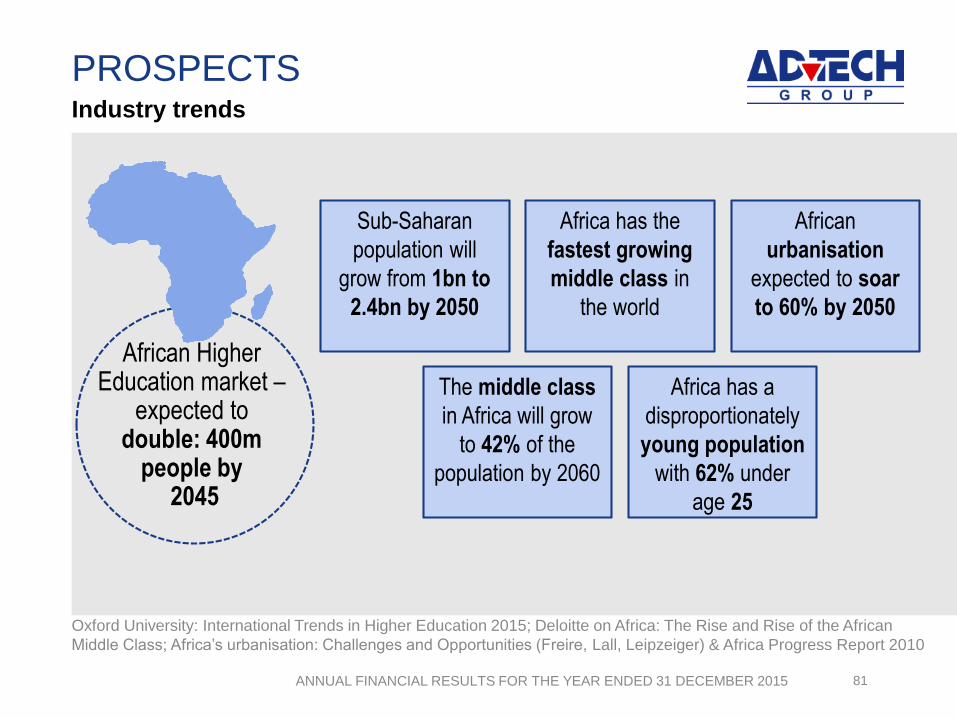
PROSPECTS
81
Industry trends
Oxford University: International Trends in Higher Education 2015; Deloitte on Africa: The Rise and Rise of the African
Middle Class; Africa’s urbanisation: Challenges and Opportunities (Freire, Lall, Leipzeiger) & Africa Progress Report 2010
African Higher Education market –
expected to double: 400m
people by 2045
The middle class
in Africa will grow
to 42% of the
population by 2060
Africa has a
disproportionately
young population
with 62% under
age 25
Sub-Saharan
population will
grow from 1bn to
2.4bn by 2050
Africa has the
fastest growing
middle class in
the world
African
urbanisation
expected to soar
to 60% by 2050
`
ANNUAL FINANCIAL RESULTS FOR THE YEAR ENDED 31 DECEMBER 2015 82
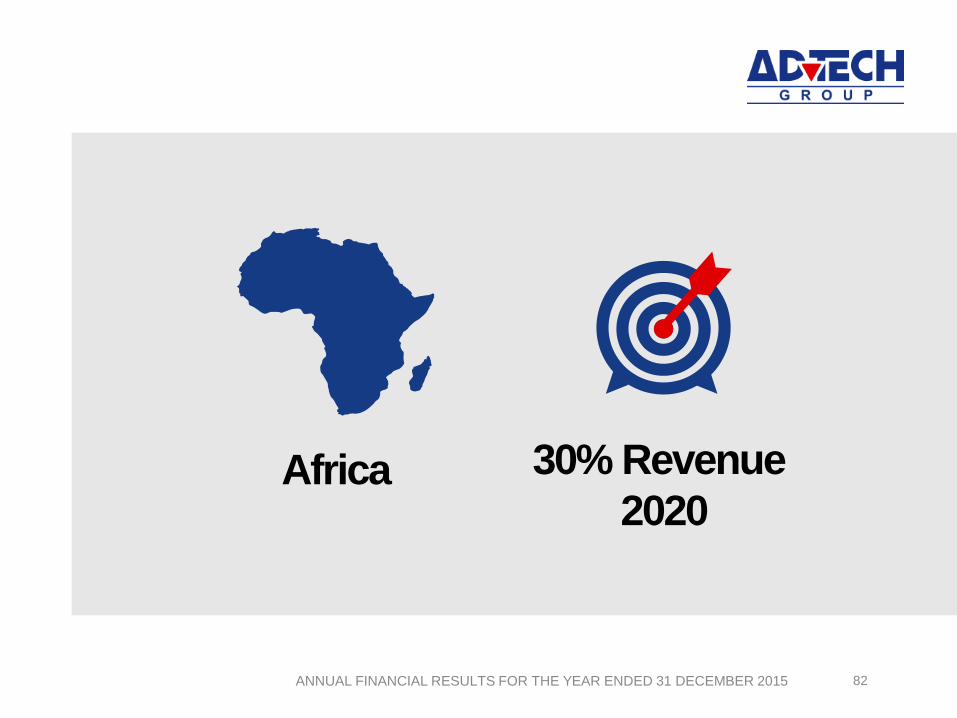
30% Revenue
2020Africa
`
ANNUAL FINANCIAL RESULTS FOR THE YEAR ENDED 31 DECEMBER 2015
PROSPECTS
Positive performance trends
Continued growth
Growth targets
`
ANNUAL FINANCIAL RESULTS FOR THE YEAR ENDED 31 DECEMBER 2015
PROSPECTS
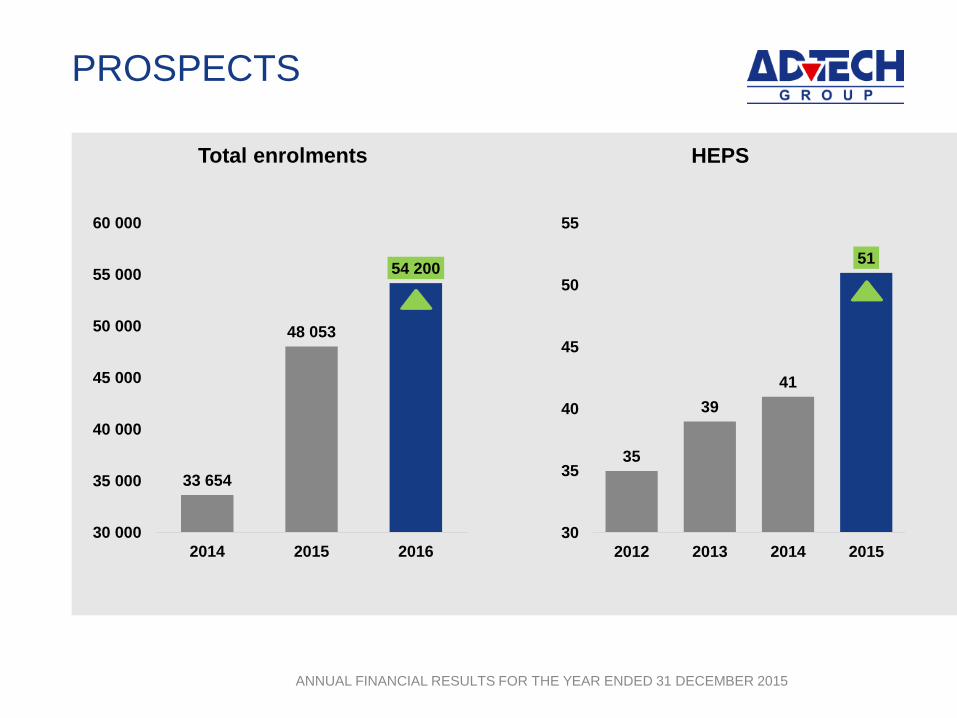
35
39
41
51
30
35
40
45
50
55
2012 2013 2014 2015
HEPS
33 654
48 053
54 200
30 000
35 000
40 000
45 000
50 000
55 000
60 000
2014 2015 2016
Total enrolments
`
ANNUAL FINANCIAL RESULTS FOR THE YEAR ENDED 31 DECEMBER 2015
PROSPECTS
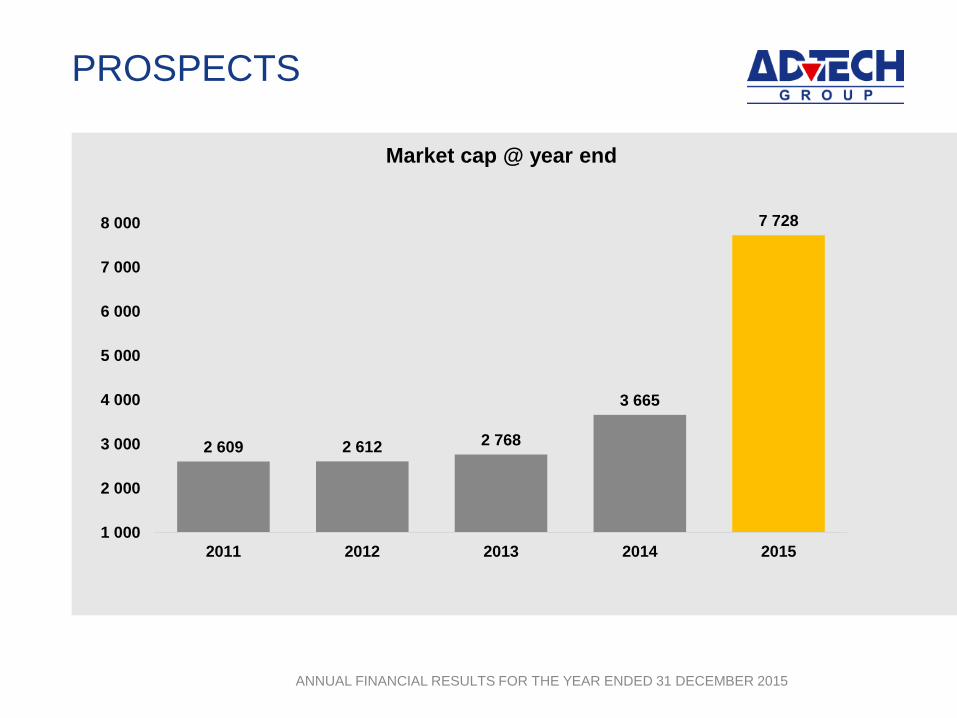
2 609 2 612 2 768
3 665
7 728
1 000
2 000
3 000
4 000
5 000
6 000
7 000
8 000
2011 2012 2013 2014 2015
Market cap @ year end
`
ANNUAL FINANCIAL RESULTS FOR THE YEAR ENDED 31 DECEMBER 2015
PROSPECTS
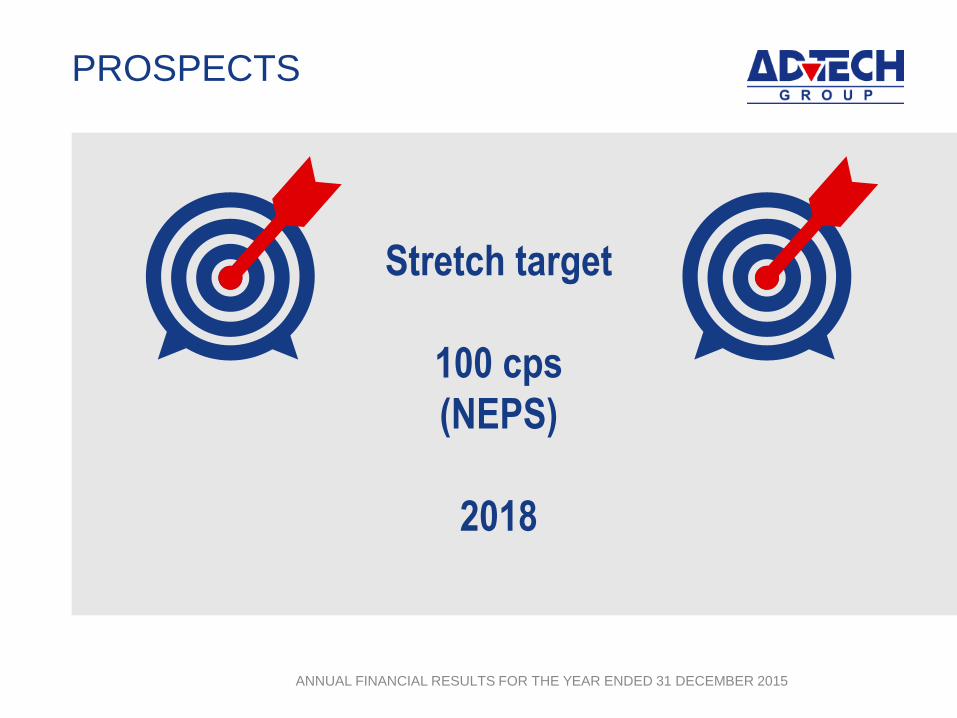
Stretch target
100 cps
(NEPS)
2018

Introduction
Results
Financial highlights
Prospects
Questions


![Three months ended December 31, Year ended December 31, … · 2016-01-27 · Three months ended December 31, Year ended December 31, 2015 2014 Change ~¦u]oo]}v 2015 2014 Change](https://img.pdfslide.net/doc/110x75/5f05bacd7e708231d41469d5/three-months-ended-december-31-year-ended-december-31-2016-01-27-three-months.jpg)