Embed Size (px)
Citation preview

Wulf-Peter SchmidtFord of Europe, Vehicle Environmental EngineeringSupervisor CO2/Sustainability & Tech. Spec. Vehicle Recycling
Ford of Europe’s Product Sustainability Index
Society
EconomyEnvironment
2
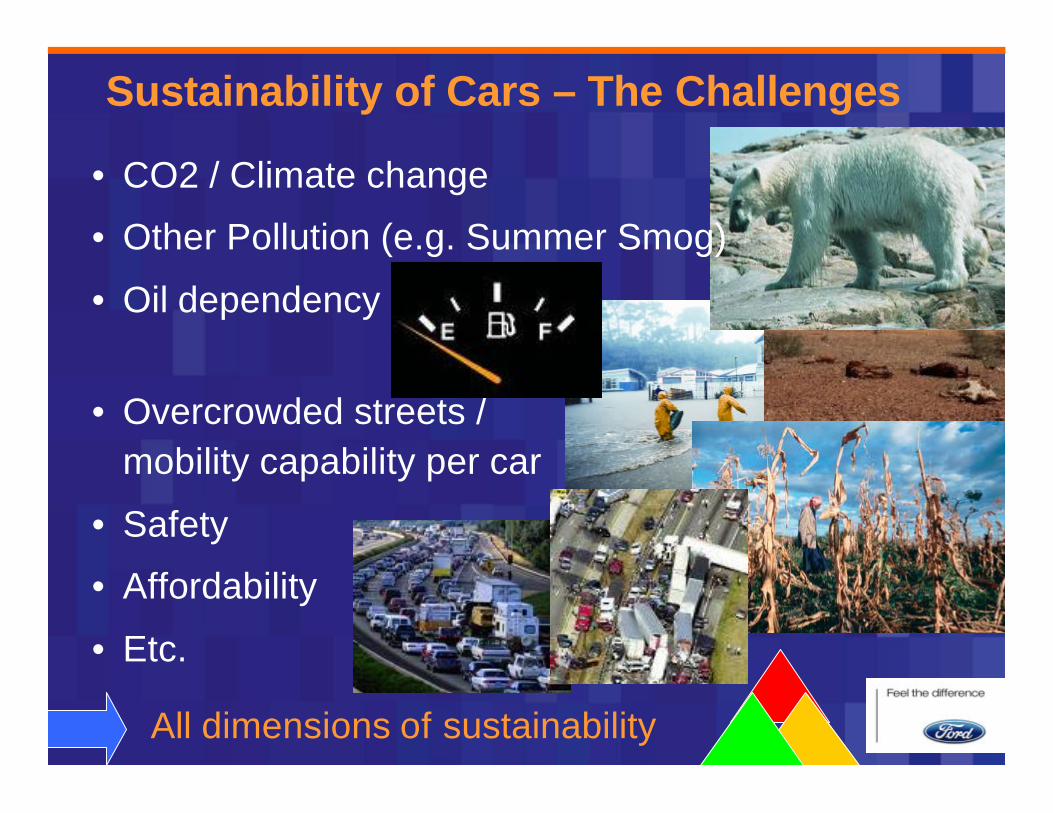
Sustainability of Cars – The Challenges
• CO2 / Climate change
• Other Pollution (e.g. Summer Smog)
• Oil dependency
• Overcrowded streets / mobility capability per car
• Safety
• Affordability
• Etc.
All dimensions of sustainability
3
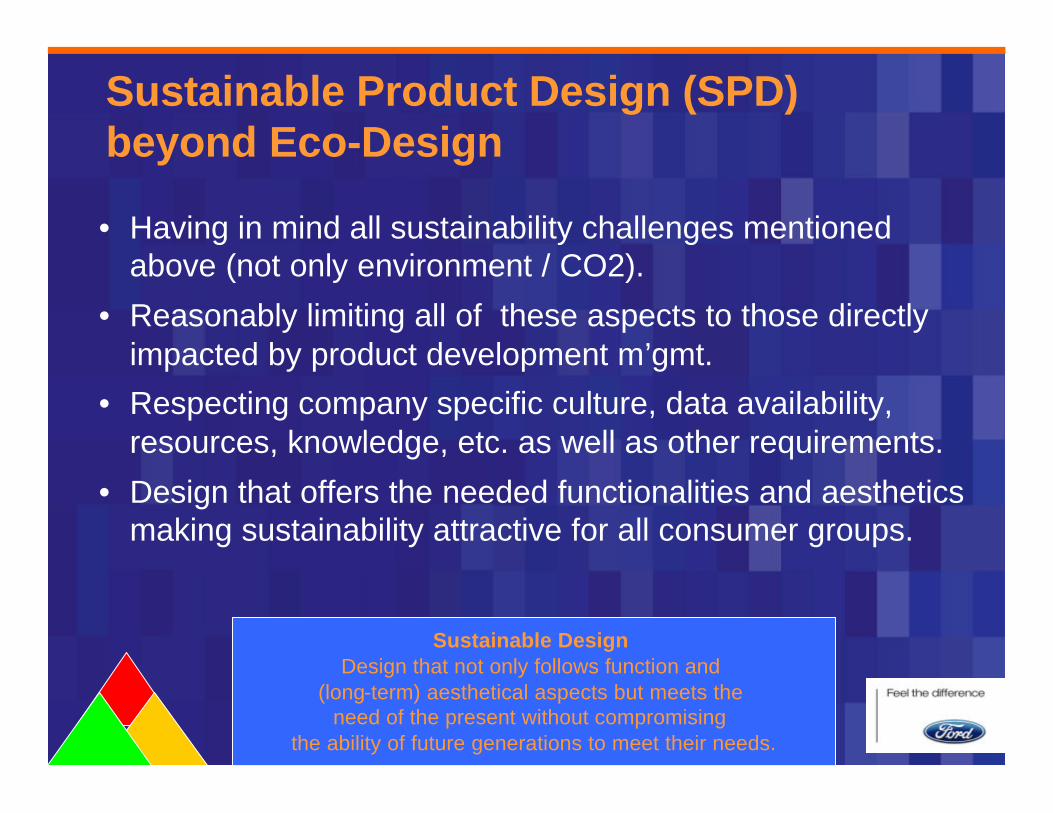
Sustainable Product Design (SPD) beyond Eco-Design
• Having in mind all sustainability challenges mentioned above (not only environment / CO2).
• Reasonably limiting all of these aspects to those directly impacted by product development m’gmt.
• Respecting company specific culture, data availability, resources, knowledge, etc. as well as other requirements.
• Design that offers the needed functionalities and aesthetics making sustainability attractive for all consumer groups.
Sustainable Design Design that not only follows function and
(long-term) aesthetical aspects but meets the need of the present without compromising
the ability of future generations to meet their needs.
4
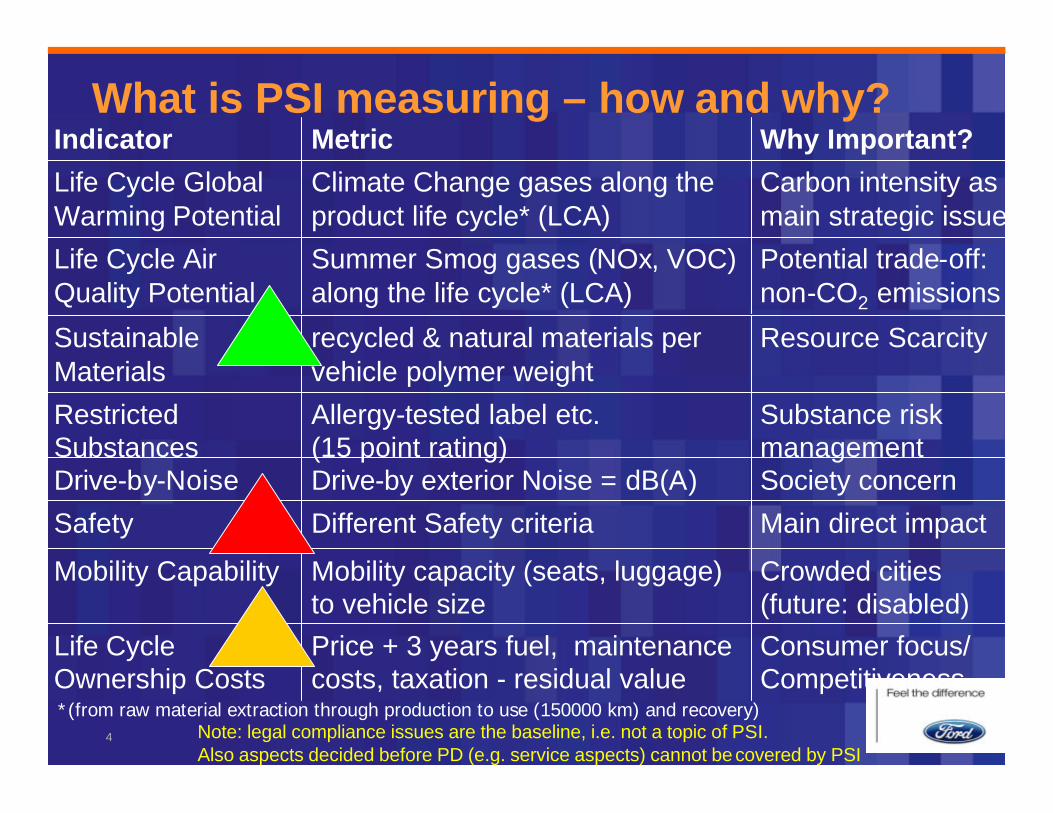
Potential trade-off: non-CO2 emissions
Summer Smog gases (NOx, VOC) along the life cycle* (LCA)
Life Cycle Air Quality Potential
Carbon intensity as main strategic issue
Climate Change gases along the product life cycle* (LCA)
Life Cycle Global Warming Potential
Why Important?MetricIndicator
*(from raw material extraction through production to use (150000 km) and recovery)
Substance risk management
Allergy-tested label etc. (15 point rating)
Restricted Substances
Resource Scarcityrecycled & natural materials per vehicle polymer weight
Sustainable Materials
Crowded cities (future: disabled)
Mobility capacity (seats, luggage) to vehicle size
Mobility Capability
Main direct impactDifferent Safety criteriaSafety
Society concernDrive-by exterior Noise = dB(A)Drive-by-Noise
Consumer focus/ Competitiveness
Price + 3 years fuel, maintenance costs, taxation - residual value
Life Cycle Ownership Costs
Note: legal compliance issues are the baseline, i.e. not a topic of PSI. Also aspects decided before PD (e.g. service aspects) cannot be covered by PSI
What is PSI measuring – how and why?
5
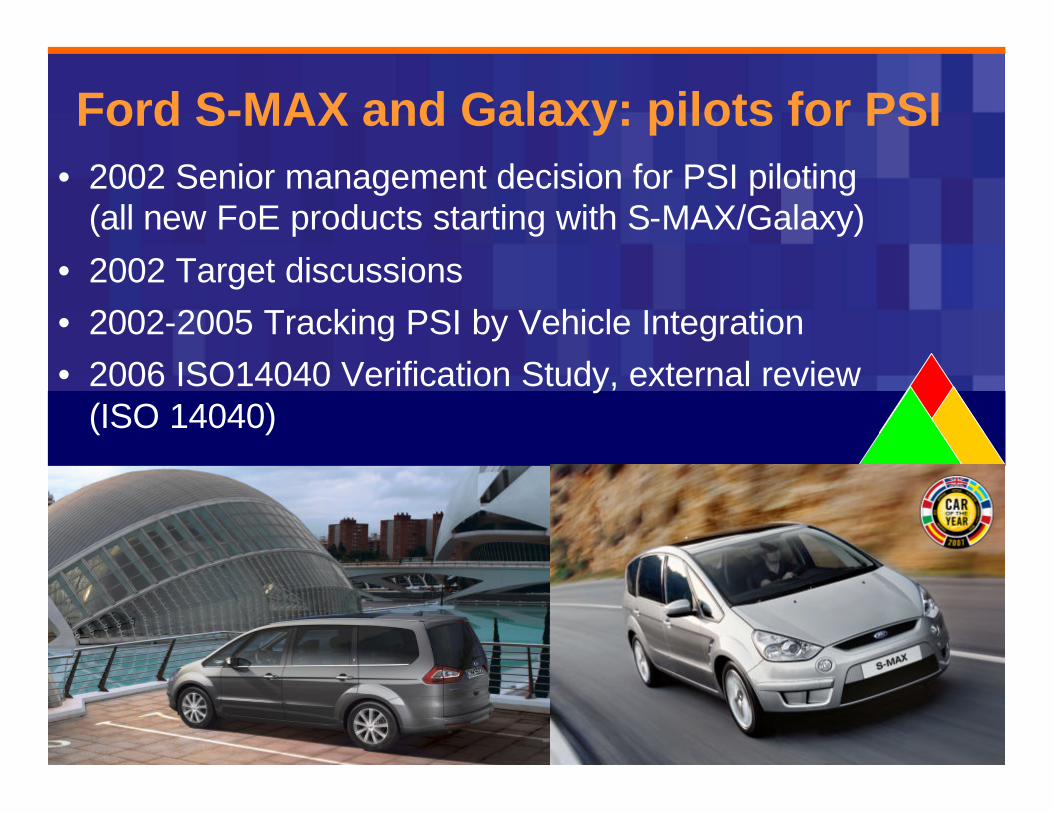
• 2002 Senior management decision for PSI piloting (all new FoE products starting with S-MAX/Galaxy)
• 2002 Target discussions• 2002-2005 Tracking PSI by Vehicle Integration• 2006 ISO14040 Verification Study, external review
(ISO 14040)
Ford S-MAX and Galaxy: pilots for PSI

6
Key: inside worseoutside betterPrior Ford Galaxy 1.9l TDINew Ford Galaxy 2.0 l TDCi with DPF80% theoretical best cross-industryB to V segment Europe
PSI – Example Galaxy dieselLife Cycle Global
Warming
Life Cycle Air Quality
Sustainable Materials
Restricted Substances
Drive-by-exterior Noise
Safety
Mobility Capability
Life Cycle Costof Ownership
20 40 60 80100
Improvements in all three dimensions(described area is getting bigger)
7
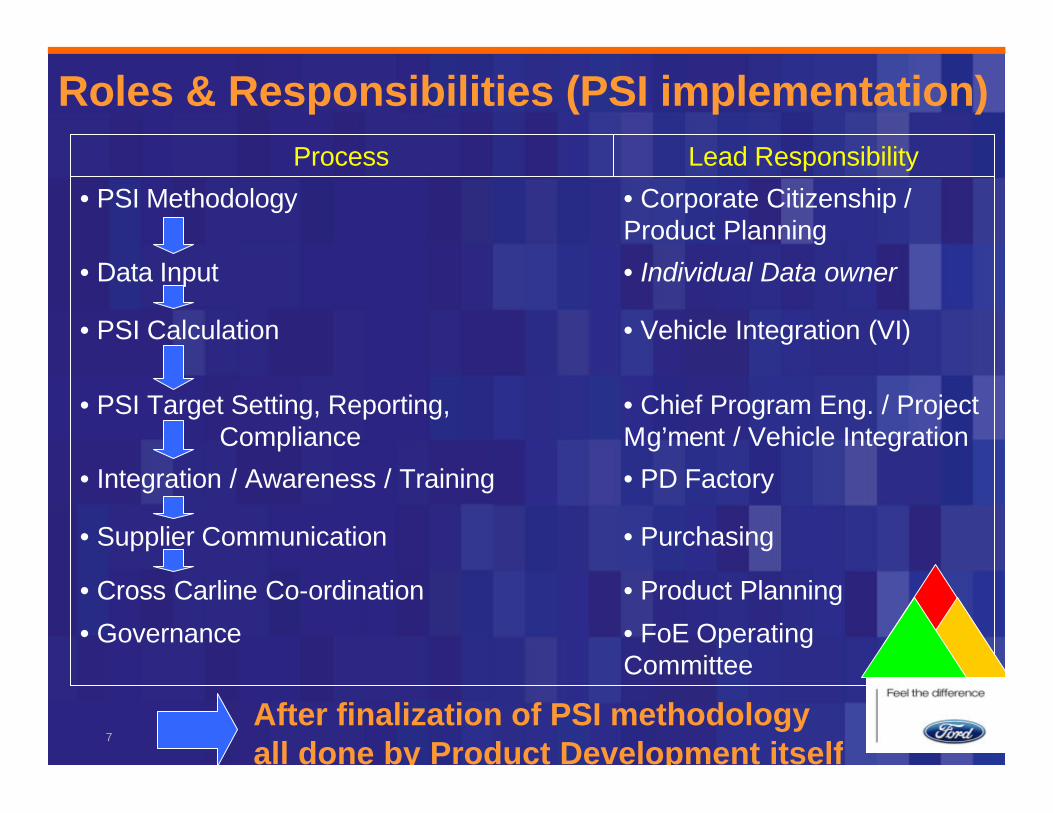
Roles & Responsibilities (PSI implementation)
• Product Planning• Cross Carline Co-ordination
• Purchasing• Supplier Communication
• PD Factory• Integration / Awareness / Training
• Chief Program Eng. / Project Mg’ment / Vehicle Integration
• PSI Target Setting, Reporting, Compliance
• FoE OperatingCommittee
• Governance
• Vehicle Integration (VI)• PSI Calculation
• Individual Data owner• Data Input
• Corporate Citizenship / Product Planning
• PSI Methodology
Lead ResponsibilityProcess
After finalization of PSI methodologyall done by Product Development itself
8
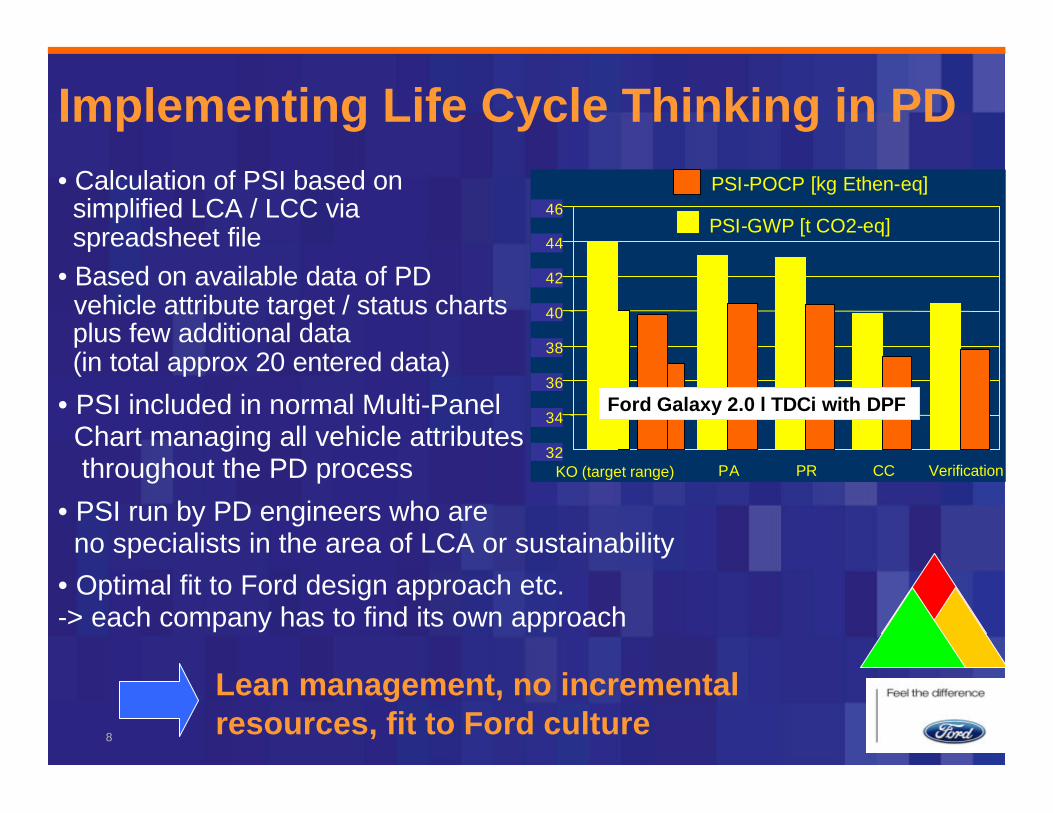
• Calculation of PSI based on simplified LCA / LCC via spreadsheet file
• Based on available data of PD vehicle attribute target / status charts plus few additional data (in total approx 20 entered data)
• PSI included in normal Multi-Panel Chart managing all vehicle attributes throughout the PD process
• PSI run by PD engineers who are no specialists in the area of LCA or sustainability
• Optimal fit to Ford design approach etc. -> each company has to find its own approach
32
34
36
38
40
42
44
46
KO (target range) PA PR CC Verification
PSI-GWP [t CO2-eq]
PSI-POCP [kg Ethen-eq]
Ford Galaxy 2.0 l TDCi with DPF
Implementing Life Cycle Thinking in PD
Lean management, no incrementalresources, fit to Ford culture

9
Product Sustainability Index Conclusions
• Making different corporate function accountable for their sustainability
• Ensure tailored approaches requiring no additional resources and no expert knowledge
• Implementation and application need to be done by affected corporate functions – making they feel owning the subject
• Voluntary approach superior to mandatory one (one-size-fits all, no competitive advantage)
10
Back-up
• Other answers to sustainability challenge
• Organisation of sustainability in Ford of Europe
• More PSI information
• Evolution of Dfx
11
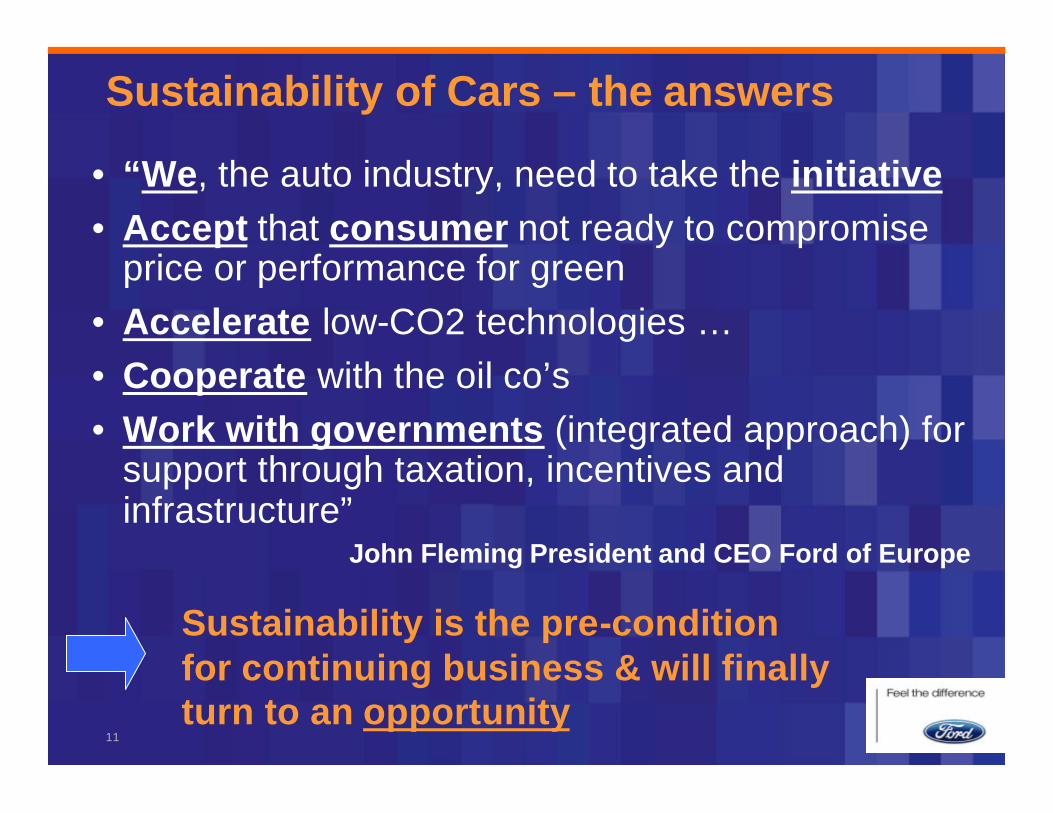
Sustainability of Cars – the answers
• “We, the auto industry, need to take the initiative• Accept that consumer not ready to compromise
price or performance for green• Accelerate low-CO2 technologies …• Cooperate with the oil co’s• Work with governments (integrated approach) for
support through taxation, incentives and infrastructure”
John Fleming President and CEO Ford of Europe
Sustainability is the pre-conditionfor continuing business & will finallyturn to an opportunity
12
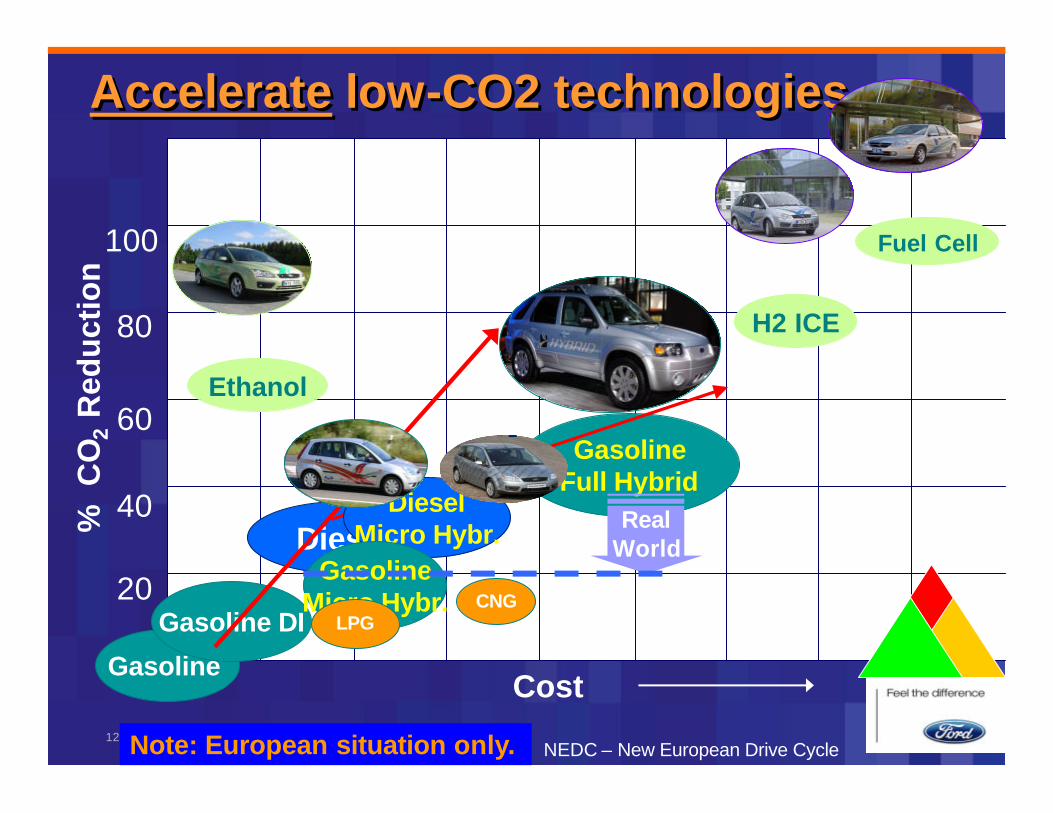
80
60
40
20
0
100
Cost
% C
O2
Red
uct
ion
Accelerate low-CO2 technologies …Accelerate low-CO2 technologies …
Gasoline
Fuel Cell
Ethanol
Gasoline DI
Diesel
H2 ICE
GasolineFull Hybrid
DieselMicro Hybr.
GasolineMicro Hybr.
RealWorld
CNGLPG
NEDC – New European Drive CycleNote: European situation only.
13
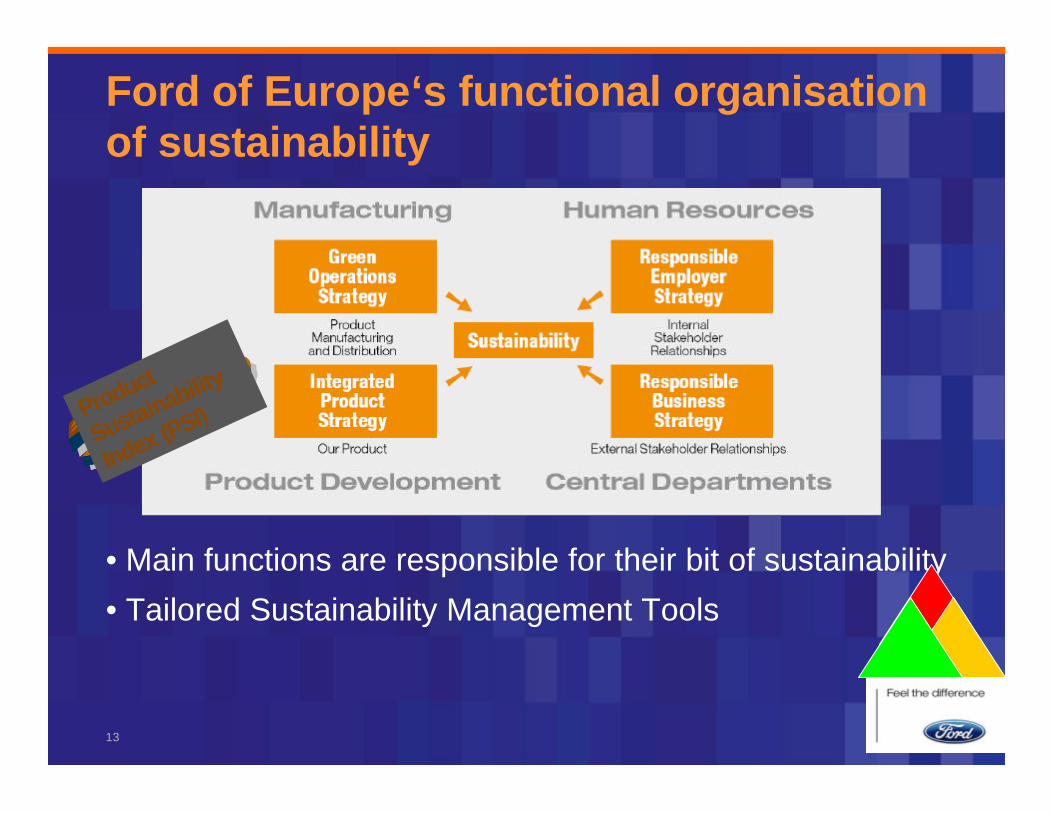
Ford of Europe‘s functional organisation of sustainability
• Main functions are responsible for their bit of sustainability
• Tailored Sustainability Management Tools
Product
Sustainability
Index (PSI)
14
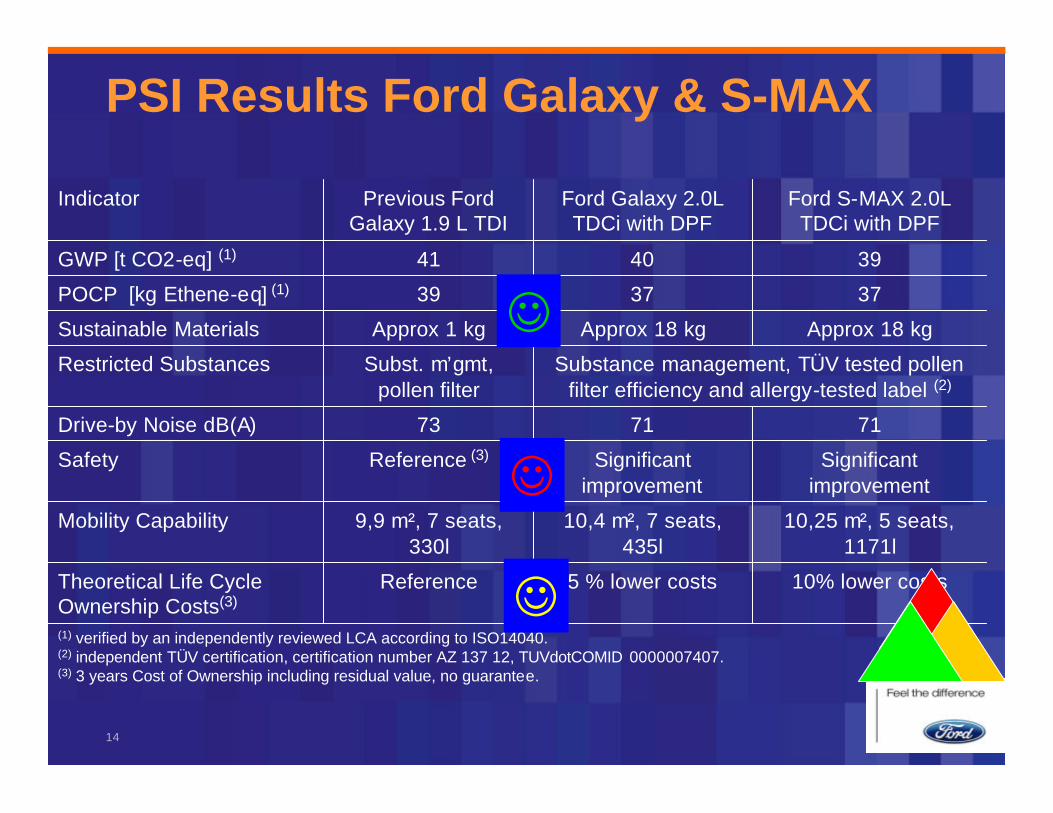
PSI Results Ford Galaxy & S-MAX
(1) verified by an independently reviewed LCA according to ISO14040. (2) independent TÜV certification, certification number AZ 137 12, TUVdotCOMID 0000007407.(3) 3 years Cost of Ownership including residual value, no guarantee.
10% lower costs5 % lower costsReferenceTheoretical Life Cycle Ownership Costs(3)
10,25 m², 5 seats, 1171l
10,4 m², 7 seats, 435l
9,9 m², 7 seats, 330l
Mobility Capability
Significant improvement
Significant improvement
Reference (3)Safety
717173Drive-by Noise dB(A)
Substance management, TÜV tested pollen filter efficiency and allergy-tested label (2)
Subst. m’gmt, pollen filter
Restricted Substances
Approx 18 kgApprox 18 kgApprox 1 kgSustainable Materials
373739POCP [kg Ethene-eq] (1)
394041GWP [t CO2-eq] (1)
Ford S-MAX 2.0L TDCi with DPF
Ford Galaxy 2.0L TDCi with DPF
Previous Ford Galaxy 1.9 L TDI
Indicator
☺
☺
☺
15
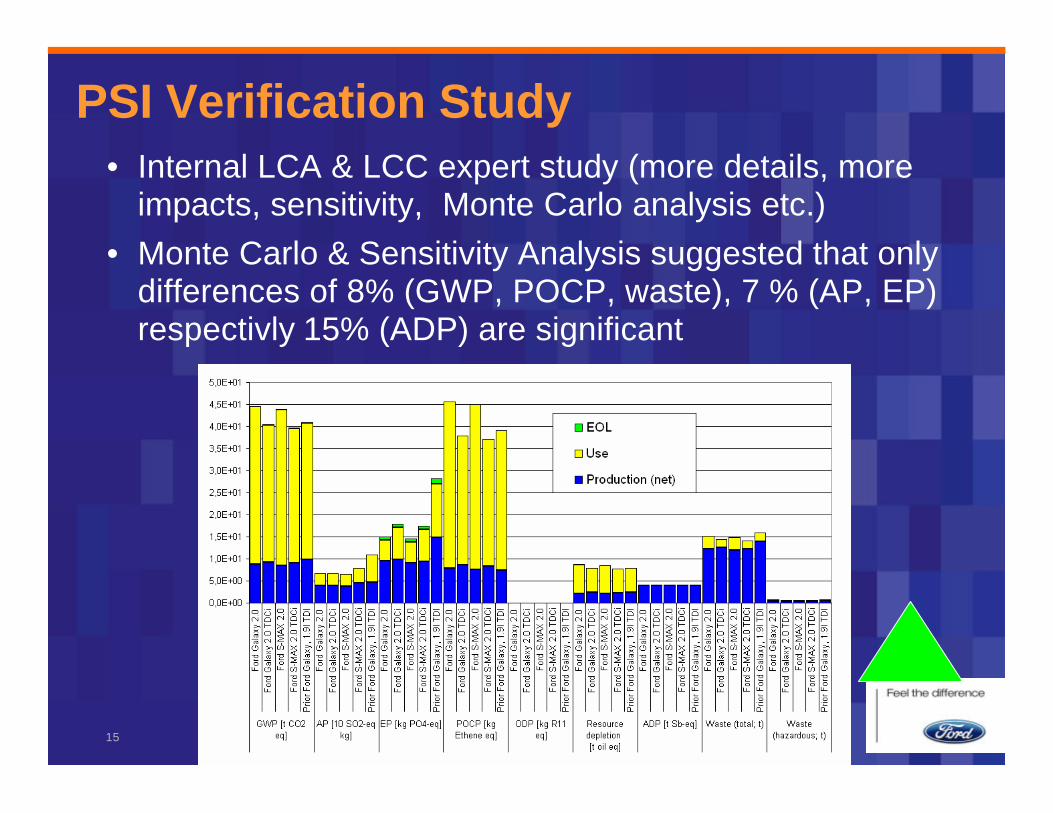
• Internal LCA & LCC expert study (more details, more impacts, sensitivity, Monte Carlo analysis etc.)
• Monte Carlo & Sensitivity Analysis suggested that only differences of 8% (GWP, POCP, waste), 7 % (AP, EP) respectivly 15% (ADP) are significant
PSI Verification Study
16
• Incremental work (tracking, calculation) due to PSI only 10 – 15 hours as perfectly fit to existing structures (voluntary not legally mandatory).
• Facilitated new insights for PD regarding costs along the life cycle (LCC) and trade-offs along the environmental life cycle (LCA).
• Incremental work of verification / expert study much higher (months, external costs etc.).
• Verification study was – as a once-off study - important to verify the simplified calculations.
• External review allowed sharing the experiencewith external world and to get scientific confidence by external, leading scientists.
PSI experiences
17
• Difference between results of non-LCA experts (PD) and expert study is below 2%
• Galaxy/S-MAX 2.0l diesel versions are environmentally superior* to gasoline versions in terms of GWP (beyond 82,000 km), POCP (beyond 37,000 km) as well as AP and EP (at any mileage),
• Galaxy 2.0l TDCi is environmentally superior* to the previous Galaxy 1.9l TDI in terms of POCP (beyond 450000 km), AP and EP (at any mileage) and total waste (mileage beyond 100,000 km).
• Diesel versions are economically preferable beyond 255000 km in 12 years for the assumed yearly fuel, insuranceand maintenance costs respectively around 200000km at 50% of those assumed in the main scenario.
* Difference > 8% for GWP, POCP
PSI Verification Study Conclusions (exerpt)
18
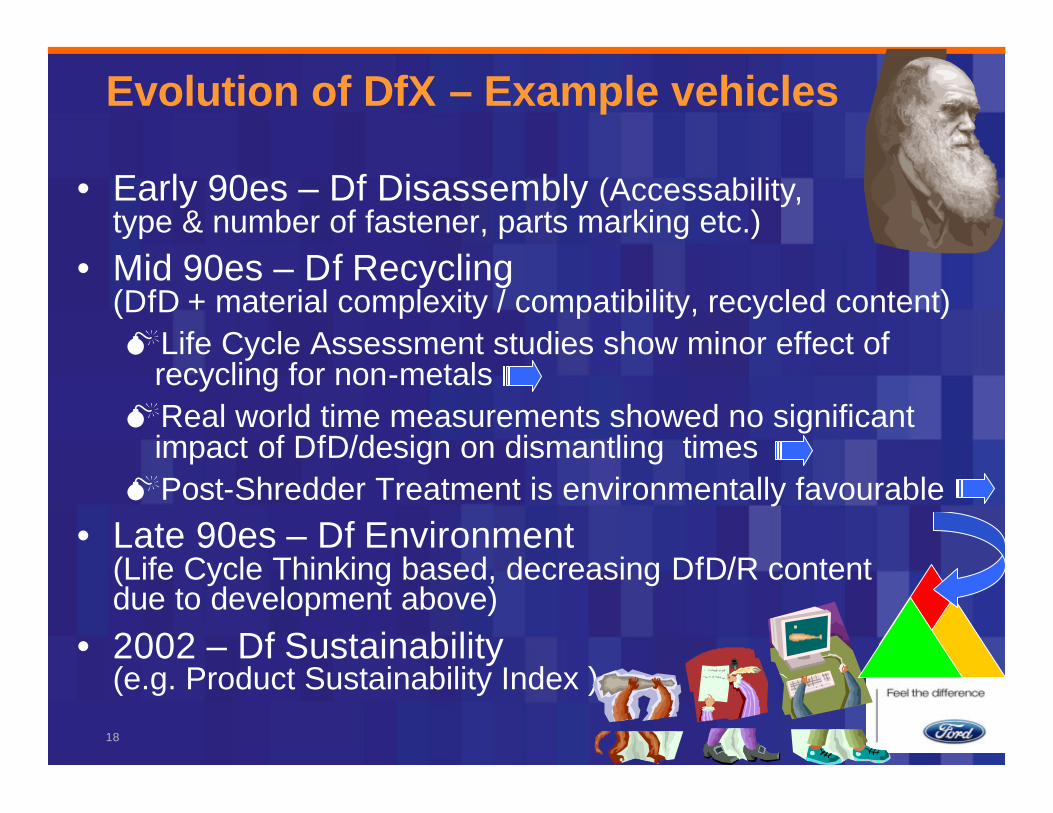
Evolution of DfX – Example vehicles
• Early 90es – Df Disassembly (Accessability, type & number of fastener, parts marking etc.)
• Mid 90es – Df Recycling (DfD + material complexity / compatibility, recycled content)MLife Cycle Assessment studies show minor effect of
recycling for non-metalsMReal world time measurements showed no significant
impact of DfD/design on dismantling timesMPost-Shredder Treatment is environmentally favourable
• Late 90es – Df Environment (Life Cycle Thinking based, decreasing DfD/R contentdue to development above)
• 2002 – Df Sustainability (e.g. Product Sustainability Index )

19
Sustainable Life Cycle Management- direct life cycle stakeholder
Role of end-of-lifeoperators
Role of Consumer
Role of Industry
Establishing sustainable recovery routes, social standards
Sustainable use / consumption, minimise consumption of energy & materials
DfE / cradle-to-cradle design, Sustainable design, environmental management, social standards
Own life cycle stage
Information to producers, sustainable supply of recovery products.
Directing products and materials to the appropriate collection / disposal / recovery facilities
Product information & training, sustainable dealer standards
Down-stream in the life cycle
Information to end-user
Purchasing sustainable products (e.g. fair trade)
accepting premium.
Sustainable Supply Chain Management (social & environmental minimum standards)
Up-stream in the life cycle
Shared Life Cycle Stakeholder Responsibilities
20
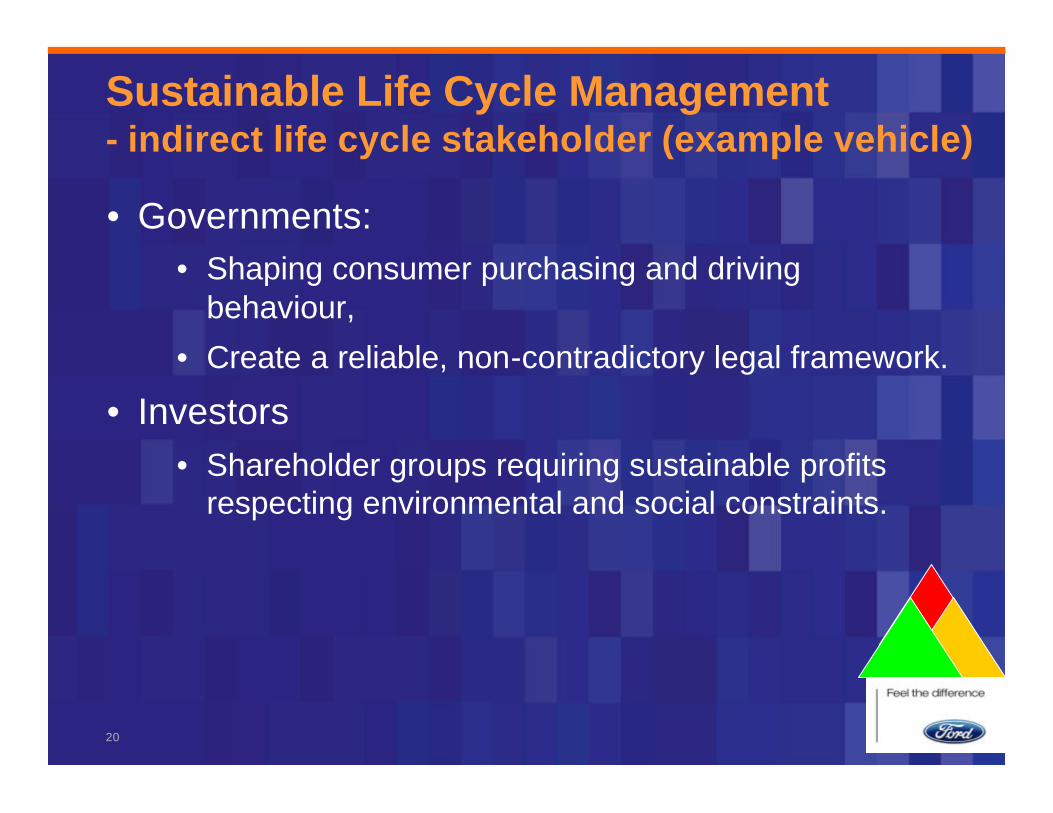
Sustainable Life Cycle Management- indirect life cycle stakeholder (example vehicle)
• Governments:• Shaping consumer purchasing and driving
behaviour,
• Create a reliable, non-contradictory legal framework.
• Investors• Shareholder groups requiring sustainable profits
respecting environmental and social constraints.
21
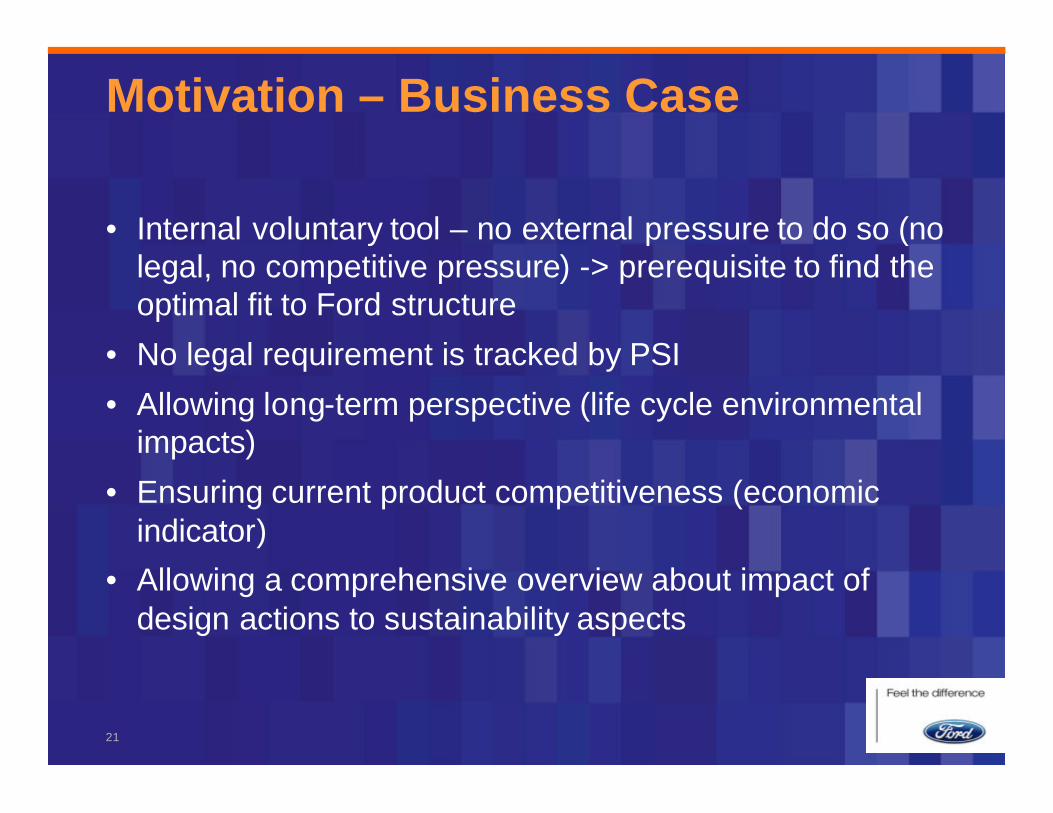
Motivation – Business Case
• Internal voluntary tool – no external pressure to do so (no legal, no competitive pressure) -> prerequisite to find theoptimal fit to Ford structure
• No legal requirement is tracked by PSI
• Allowing long-term perspective (life cycle environmental impacts)
• Ensuring current product competitiveness (economicindicator)
• Allowing a comprehensive overview about impact of design actions to sustainability aspects

22
What are the impacts of End-of-Life technology variation on the overall environmental profile ?
• Answer: No significant environmental difference between different EOL technologies
• Similar results for other environmental impacts & resource depletion
• Lightweighting is more important – but less then expected
Source: EU funded, ISO14040 reviewed LCA LIRECAR
900 kgScenario
750 kgScenario
Situation today (Metal recycling,organics/ceramics to landfilling)
Mechanical Recycling
Energy Recovery of organics,recycling of metals, landfillingof ceramics/glass1000 kg
Scenario
Glo
bal W
arm
ing
Pot
entia
l
0%
20%
40%
60%
80%
100%
MAX and MIN are representing therange of different vehicle scenarios
No significant
difference between EOL
options
23
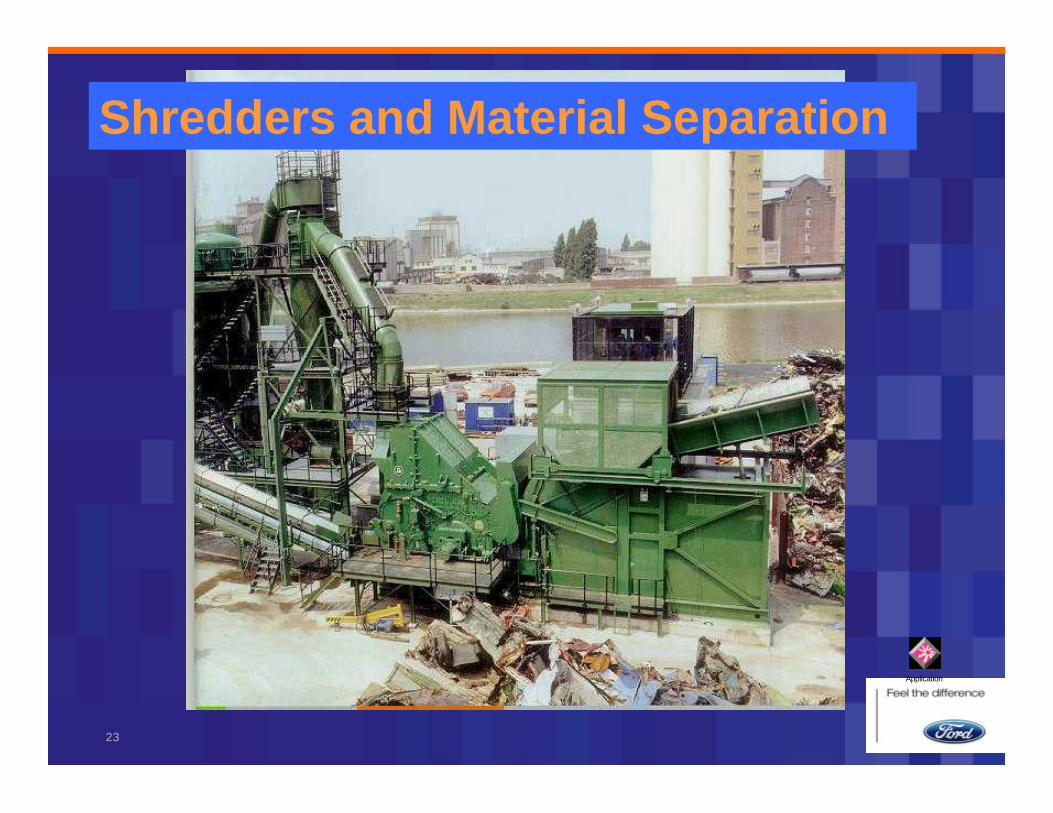
Shredders and Material Separation
Application
24
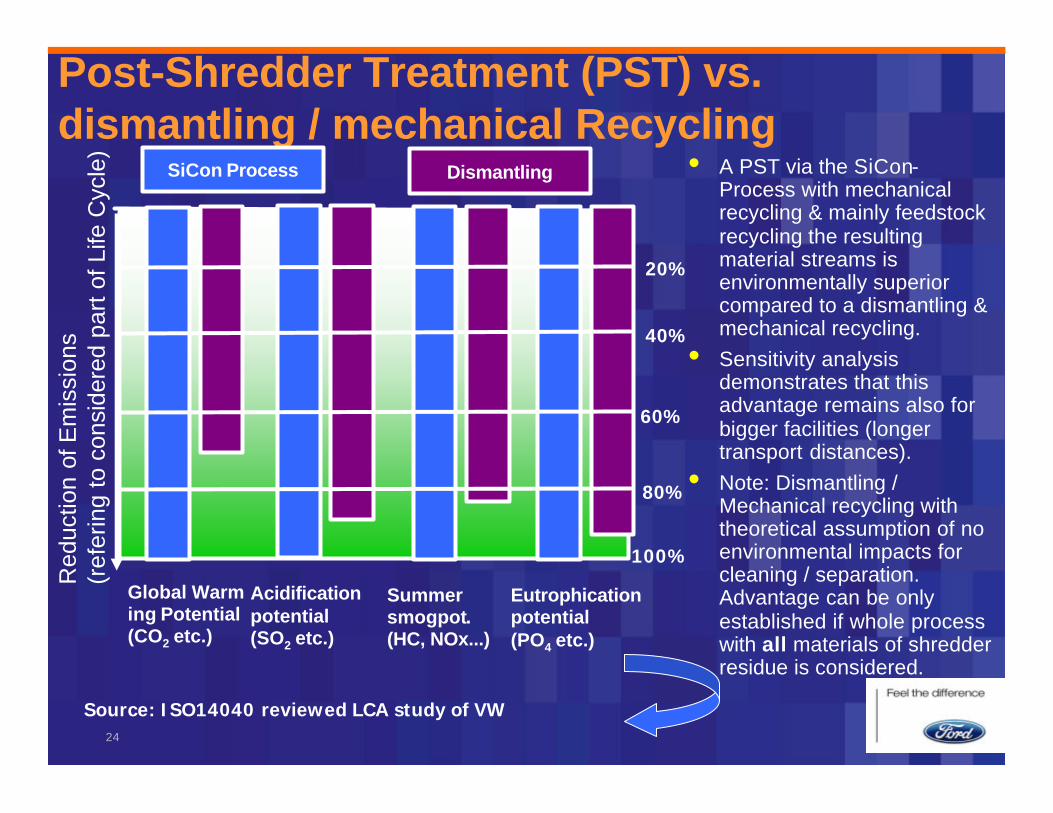
Post-Shredder Treatment (PST) vs. dismantling / mechanical Recycling
• A PST via the SiCon-Process with mechanical recycling & mainly feedstock recycling the resulting material streams is environmentally superior compared to a dismantling & mechanical recycling.
• Sensitivity analysis demonstrates that this advantage remains also for bigger facilities (longer transport distances).
• Note: Dismantling / Mechanical recycling with theoretical assumption of no environmental impacts for cleaning / separation.Advantage can be only established if whole process with all materials of shredder residue is considered.
Source: ISO14040 reviewed LCA study of VW
Red
uctio
nof
Em
issi
ons
(ref
erin
gto
con
side
red
part
of L
ife C
ycle
)
Global Warming Potential(CO2 etc.)
100%
80%
60%
40%
20%
Acidificationpotential(SO2 etc.)
Summersmogpot.(HC, NOx...)
Eutrophicationpotential(PO4 etc.)
SiCon Process Dismantling