Embed Size (px)
Citation preview
CITIZENS’ AWARENESS AND THEIR PERCEPTION OF
CORRUPTION
Who is not Who is not Who is not Who is not corruptcorruptcorruptcorrupt in in in in
Tanzania?Tanzania?Tanzania?Tanzania?
2008 2008 2008 2008 REPORT
Corruption Perception Surveys Report: TANZANIA 2008
ii
TABLE OF CONTENTS
List of Abbreviations v List of Tables viii List of Graphs Charts and Figures ix ACKNOWLEDGEMENTS x EXECUTIVE SUMMARY 1 CHAPTER ONE 8
1.0 INTRODUCTION 8 1.1 COUNTRY CORRUPTION/GOVERNANCE GENERAL OVERVIEW 9 1.2 PUBLIC DEMAND FOR GOOD GOVERNANCE AND ACCOUNTABILITY:
RATIONALE 13 1.3 MEASURING OF GOOD GOVERNANCE PERFORMANCE: VARIOUS
INDICATORS 13 Global governance performance indicators 13 National governance performance indicators 14 LGAs governance performance indicators 22
1.4 PROMOTION OF GOOD GOVERNANCE AND ANTI-CORRUPTION: EFFORTS AND TRENDS 23
Pre-colonial to colonial epoch 23 The post-independent epoch, 1961-1995 24 The period between 1995 and 2005 24 The period from 2005 onwards 25 The role of NSAs 28 Local Government Authorities (LGAs) 30 Corruption in the electoral process 32 Gender dimension of promoting governance and anti-corruption 33
1.5 OBJECTIVES OF THE CORRUPTION PERCEPTION SURVEYS 34 1.6 SIGNIFICANCE OF THE CORRUPTION PERCEPTION SURVEYS 34 1.7 METHODOLOGY 35 1.7.1 SAMPLE SIZE AND DESIGN 36
1.8 LIMITATION OF THE STUDY 39 1.9 ORGANIZATION OF THE REPORT 40 CHAPTER TWO 41
2.0 FACTORS INFLUENCING THE GOVERNANCE AND ANTI-CORRUPTION POLICY ENVIRONMENT IN TANZANIA 41 2.1 INTERNAL FACTORS 41
Distribution /balance of powers within state organs 41 The Legislature 42 Effectiveness of the legislature in performing its oversight functions 43 The Executive 47 The Judiciary 48
2.2 INFLUENCE OF NSAs ON GOVERNANCE AND ANTI-CORRUPTION
Corruption Perception Surveys Report: TANZANIA 2008
iii
POLICY 49 Civil society 49 Media 50 Corporate sector 53 Think tanks and high learning institutions 53
2.3 THE INFLUENCE OF POLITICAL PARTIES ON GOVERNANCE AND ANTI-CORRUPTION POLICY AGENDA 55 Ruling party 55 Opposition parties 56
2.4 EXTERNAL FACTORS 56 Influence of international financial institutions on anti-corruption policies 56 Influence of intergovernmental instruments on anti-corruption policies 58
2.5 VULNERABILITY OF LGAs ARCHITECTURE TO RESIST CORRUPTION 59 LGAs functional relationship with cooperative societies 62 Business licensing services 63 Poverty vis-à-vis ignorance and weak civic competence 63
CHAPTER THREE 65
3.0 SURVEY RESULTS 65 3.1 THE SAMPLE 65 3.2 SAMPLE DESCRIPTION 65 3.3 LEVEL OF AWARENESS OF CORRUPTION 71 3.4 DRIVING FORCES FOR CORRUPTION BEHAVIOUR AND ACTS 72
Regional level findings on driving forces for corruption 73 3.5 CORRUPTION ACTORS IN THE LGAs 76 3.6 RATIONALE FOR AND ANALYSIS OF CORRUPTION ACTORS 77 3.7 ANALYSIS OF MAGNITUDE OF CORRUPTION AS BASIS FOR
PERCEPTIONS 83 3.8 FORMS OF AND EXPERIENCES IN CORRUPTION 88
Means/forms of corruption transactions 91 3.9 ATTITUDE TOWARDS DEMAND FOR AND/OR SUPPLY OF CORRUPTION 92 3.10 SELECTIVE ASSESSMENT OF CURRENT ANTI-CORRUPTION POLICY
AND LEGAL MEASURES IN PRACTICE IN LGAs 94 Assessment of Government efforts to fight corruption in LGAs 96 Determining public support to anti-corruption policy in LGAs 97 Impediments against public determination to fight corruption 98 Recognition of inter-faith potential to fighting corruption 98
3. 11 DETERMINING LOWEST Vs. HIGHEST CORRUPTION PERCEPTION LGAs 98 Prelude to LGAs with lowest or highest corruption perception 99 Outcome of analysis of control question data 99 Iteration One 99 A: Household respondents’ corruption perception ranking 100 B: Key informant respondents’ corruption perception ranking 100
Corruption Perception Surveys Report: TANZANIA 2008
iv
C: Combined corruption perception ranking 101 Iteration Two 102 Household respondents’ corruption perception ranking 102 Key informant respondents’ corruption perception ranking 103 Combined respondents’ corruption perception ranking 103 Iteration Three 104 Iteration Four 105
3.12 STATISTICAL ANALYSIS AND DESCRIPTION OF THE FINDINGS 107 Statistics 107 Statistical explanation of the output 107 Conclusions 108 Statistical distribution 108
4.0 CHAPTER FOUR 110
POLICY RECOMMENDATIONS 110 To the Government 110 To Non State Actors 111 Surveys findings-based policy recommendations 111
SELECTED REFERENCES 115
ANNEX I: DATA TABLES 119
ANNEX II: CONTACTS OF CPS PARTNER/HOST-ORGANISATIONS 132
ANNEX III: LIST OF LGAS 134
ANNEX IV: CPS 2008 LGAs POPULATION 135
Corruption Perception Surveys Report: TANZANIA 2008
v
List f Abbreviations
ACET Association of Consulting Engineers Tanzania ATIP Accountability, Transparency and Integrity Project BEST Business Environment Strengthening for Tanzania CAG Controller and Auditor General CCM Chama Cha Mapinduzi CCT Christian Council of Tanzania CDD-Ghana Ghana Centre for Democratic Development CGG Campaign for Good Governance CHADEMA Chama cha Demokrasia na Maendeleo CHRGG Commission for Human Rights and Good Governance CoST Construction Sector Transparency Initiative CPI Corruption Perception Index CPI Transparency International’s Corruption Perception Index CPS Corruption Perception Surveys CSOs Civil Society Organisations CUF Civic United Front CWI Core Welfare Indicators CWIQ Core Welfare Indicator Questionnaire DECO Development Concern DED Executive Directors DfID Department for International Development (UK) DPP Director of Public Prosecution DPs Development Partners EAC East African Community EPA External Payment Arrears EPAs Economic Partnership Agreements ERB Engineers Registration Board EU European Union FCS Foundation for Civil Society FGDs Focus Group Discussion FIU Financial Intelligence Unit ForDIA Concern for Development Initiatives in Africa GBI Gender Budget Initiative GBS General Budget Support GBS General Budget Support GGCU Good Governance Coordination Unit HIV/AIDS Human Immune Virus/Acquired Immune Deficiency Syndrome IDASA Institute for Democracy in South Africa LEAT Lawyers Environmental Action team LGAs Local Government Authorities LGRP Local Government Reform Programme
Corruption Perception Surveys Report: TANZANIA 2008
vi
LGRP Local Government Reform Programme LHRC Legal and Human Rights Centre LSRP Legal Sector Reform Programme LSRP Legal Sector Reform Programme MCT Media Council of Tanzania MDAs Government Ministries Departments and Agencies MKUKUTA National Strategy for Growth and Reduction of Poverty NACSAP National Anti-Corruption Strategy and Action Plans NACSAP National Anti-Corruption Strategy and Action Plans NCCR-MAGEUZI National Convention for Construction and Reform-MAGEUZI NEC National Electoral Commission NGOs Non-Governmental Organizations NOLA National Organization for Legal Aid NSAs Non State Actors NSGRP National Strategy for Growth and Reduction of Poverty PAF Performance Assessment Framework PAF Performance Assessment Framework PCA Prevention of Corruption Act PCB Prevention of Corruption Bureau PCCB Prevention and Combating Corruption Bureau PCIAC Presidential Commission of Inquiry Against Corruption PETS Public Expenditure Tracking Surveys PFM Partnership Framework Memorandum PFMRP Public Finance Management Reform Programme PFMRP Public Finance Management Reform Programme PHDR Poverty and Human Development Report POP Political Opinion Polls PORIS African International Group of Political Risk Analysis PPRA Public Procurement Regulatory Act PSDA Participatory Service Delivery Assessment PSRP Public Sector Reform Programme PSRP Public Sector Reform Programme PSSS The Policy and Service Satisfaction Survey PTF Partnership for Transparency Fund RCS Report Card Surveys REDET Research and Education for Democracy in Tanzania REPOA Research on Poverty Alleviation SACST Strengthening Anti-Corruption Strategies in Tanzania SADC Southern Africa Development Communities SFO Serious Fraud Office’s TACECA Tanzania Civil Engineering Contractors Association TAMWA Tanzania Media Women’s Association
Corruption Perception Surveys Report: TANZANIA 2008
vii
TANESCO Tanzania Electric Supply Corporation TANGO Tanzania Non-Governmental Organization TBC Tanzania Broadcasting Corporation TCCIA Tanzania Chamber of Commerce, Industry and Agriculture TCDD Tanzania Coalition of Debt and Development TGNP Tanzania Gender Networking Programme TI Transparency International TLP Tanzania Labour Party TNBC Tanzania National Business Council TPSF Tanzania Private Sector Foundation UBI Urban Bribery Index UNCAC United Nations Convention Against Corruption UNDP United National Development Programme URT Government of the United Republic of Tanzania USAID United States Agency for International Development VEOs Village Executive Officers WACs Ward Aids Committees WBI World Bank Institute WDCs Ward Development Council WDP Women’s Dignity Project WEOs Ward Executive Officers WTO World Trading Organization
Corruption Perception Surveys Report: TANZANIA 2008
viii
List of Tables
Table 1.3: Distribution of PETS activities in Tanzania 16 Table 1.4/1: Summary of corruption cases during in the last five years 25 Table 1.4/2: May 2008 PAF update 27 Table 1.7.1/1: Surveyed LGAs, wards and villages/streets 38 Table 1.7.1/2: Key informants demographic characteristics 38 Table 1.7.1/3: Structure of focus groups 39 Table 3.2: Demographic characteristics of the sample 69 Table 3.4/1: Driving forces to corruption across LGAs 72 Table 3.4/2: The regional dimension of corruption driving forces in LGAs 74 Table 3.6: Overview of corruption actors’ perception ranking 79 Table 3.7: Perception on the extent corruption is shared amongst LGAs departments 84 Table 3.8/1: Cross tabulation of experience in paying corruption in LGAs 89 Table 3.8/2: Preference and choice of corruption transaction form 92 Table 3.11/1: LGAs which scored lowest or highest corruption perceptions 99 Table 3.11/2: Outcome of control question 100 Table 3.11/3: Outcome of control question with merged values 102 Table 3.11/4: List of first 5 LGAs with lowest or highest corruption perception 104 Table 3.11/5: Final LGAs with lowest/highest corruption perception 106 Table 3.12: statistics for measures of central tendency 107
Corruption Perception Surveys Report: TANZANIA 2008
ix
List of Graphs, Charts and Figures
Graph3.2/1: Age distribution of the sample 66 Graph 3.2/2: Literacy level of sample respondents 67 Graph3.2/3: Household occupation structure 68 Graph 3.2/4: Key informants work station distribution 68 Graph 3.2/5: Occupation structure of key informants 69 Graph 3.3: General level of public awareness of corruption 72 Graph 3.4/1: Perceived driving forces to corruption across LGAs 73 Graph 3.4/2: Driving forces for corruption: contending positions of ‘ordinary persons’ and ‘leaders’ 76 Graph 3.6/1: Households’ corruption perception ranking 80 Graph 3.6/2: Key informants’ corruption perception ranking 81 Graph 3.6/3: Overall corruption perception ranking 82 Graph 3.7/1: Key informant qualitative ranking on share of corruption in LGAs 86 Graph 3.7/2: Household qualitative ranking on share of corruption in LGAs 87 Graph 3.7/3: Overall qualitative ranking on share of corruption in LGAs 88 Graph 3.8/1 Confession to have or not paid corruption to access services 89 Graph 3.8/2: Final recipients of actually paid corruption by households 90 Pie chart 3.8: Share of corruption proceeds across LGAs ranks and file 91 Graph 3.8/3: Preference and choice of corruption transaction form 92 Pie chart 3.9: Extent of public confidence to report corruption grievances 94 Graph 3.10/1: Applicability of anti-corruption regulatory framework 95 Graph 3.10/2 Assessment of Government anti-corruption efforts in LGAs 97 Graph 3.12/1: Low corruption perception LGAs 109 Graph 3.12/2: High corruption perception LGAs 109
Corruption Perception Surveys Report: TANZANIA 2008
x
ACKNOWLEDGEMENTS
This report provides details of phase one of Corruption Perception Surveys (CPS) findings scheduled for systematic annual releases, three years consecutively, ending 2010.The Corruption Perception Survey Project and the subsequent report has traversed a long journey. Preparation and later planning activities started way back in January 2007, immediately after the Foundation for Civil Society (FCS) had released the initial project fund. Our first heartfelt gratitude, therefore, goes to the FCS for financing the CPS project. The technical support of Dr. Naimani from the Department of Statistics, University of Dar es Salaam, and that of Mr. Lutta Mutakyahwa from ROMME CENTRE, during CPS planning for implementation, were indeed invaluable, and to that we feel indebted to them for their expertise rendered in designing the sample and tools of analysis. Primarily, CPS anchors on broader stakeholders’ support, mobilisation of which was very crucial to make the survey a success. ForDIA mobilised CPS stakeholders across a broad range of State and Non-State Actors (NSAs), locally and nationally. Both, national and local level stakeholders have remained critical throughout the CPS implementation stages. Their input, networking and fieldwork support have contributed immensely towards the successful finalisation of this phase. We thank them all. On the same note, we would like to specifically mention the following national level CPS stakeholders as way of recognising their contribution at various stages towards CPS for their selfless support. the Good Governance Coordination Unit (GGCU), the Prevention and Combating of Corruption Bureau (PCCB), African International Group of Political Risk Analysis (PORIS), Economic and Social Research Foundation (ESRF), Tanzania Gender Networking Programme (TGNP), Tanzania Media Women’s Association (TAMWA), Association of Tanzania NGOs (TANGO) Tanzania Chamber of Commerce Industry and Agriculture (TCCIA), and HAKIELIMU. Moreover, on specific terms, we respectively appreciate the technical and networking support rendered by regional trainers-cum-coordinators and host-organisations in the regions of Lindi, Ruvuma, Shinyanga Mbeya, Ruvuma, Mtwara and Morogoro for facilitating training of host-organisations’ staff due to which the latter ably executed CPS fieldwork activities in LGAs. Specific thanks go to Mr. Audax Lukonge, Mr. Mike Nshangeki, Mr. Prince Bagenda, Mr. Venance A.M of UNGO-Morogoro, and the regional and district authorities of PCCB and offices of District Commissioners (DCs) and District Executive Directors (DED) in the LGAs that hosted phase one of CPS activities. Moreover, we recognise the good services rendered by Mr. Deus Mogella of the Department of Statistics of the Faculty of Arts and Social Sciences of the University of Dar es salaam for tirelessly analysing the CPS data, which was sometimes done under hard conditions. It is the quantitative data analysis, which enables us today (2008) to state with confidence about the status of governance and corruption in Tanzania. Last, by no means the least, we appreciate the good services
Corruption Perception Surveys Report: TANZANIA 2008
xi
rendered by two persons: Mr. Saifu Kiango for editing the first draft of this report, and Prof. Issa Kaboko Msoke of the Department of Sociology and Anthropology of Faculty of Arts and Social Sciences of the University of Dar es Salaam for technical editing of the report. While appreciating the tireless support of various people and institutions towards these noble endeavours; promoting good governance and deterring corruption in Tanzania, the CPS Management Team hopes the cooperation established shall remain in force and be transcended to the subsequent CPS phases and stages. Whereas the technical and network support contributed towards production of this CPS findings report by professionals and stakeholders are ever acknowledged with thanks, the shortcomings, in the report, shall always remain the responsibility of CPS Management Team. Bubelwa Kaiza Team Leader
Corruption Perception Surveys Report: TANZANIA 2008
1
EXECUTIVE SUMMARY
INTRODUCTION The consensus from the latest discourse involving several ‘gurus’ on corruption, including the global anti-corruption watchdog, Transparency International (TI), is that corruption means abuse of ‘public trust for private gain’. Since early 1990s impeccable evidence attests to Tanzania’s country worsening corruption status, which is by and large pervasive. To that effect, Tanzania is referred to as a country largely suffering from poor governance, and tainted by corruption. According to documented literature in the media, research institutions, and various reports/statements authored by Development Partners (DPs), multilateral institutions, inter-faith organisations, political parties, designated Government Ministries Departments and Agencies (MDAs), core reform programmes, international watchdog organisations and Civil Society Organisations (CSOs), Tanzania is marred by corruption – grand and petty – in the public domain. It is corruption that has thus persistently undermined the Government and Tanzanians’ efforts to eradicate poverty. Objectives of the Corruption Perception Surveys (CPS) CPS is broadly dedicated to promote increased dialogue between political bureaucracies and leadership, on the one hand, and the civil society and private sector stakeholders, on the other, in order to attain the following objectives: i. To measure the magnitude and comprehensive picture of corruption across
villages, wards, constituency and districts in the country, in effect augmenting efforts initiated to promote good governance and fight corruption at all levels.
ii. To create civic awareness, knowledge and skills (competence) amongst the electorate at the grassroots level of society by encouraging the citizenry to hold the government at their level accountable, through existing governance structures, but maintaining political stability, tolerance, peace and security.
iii. To encourage citizens’ participation in the development policy-making process by creating and maintaining trust, promotion of demand for accountability and strengthening stakeholders’ commitment towards improved information flow and transparency that will eventually act as a ‘deterrent’ to corruption.
Significance of CPS LGA is the unit of analysis of the survey in which the data is analyzed across the service delivery sectors. The Analyses are used to assess service users’ perceptions across sex, age, rural-urban divide, income and employment status in terms of quality and quantity of deliverables in the health, education, energy, and land allocation, administration of justice, business licenses and public works sectors. Survey findings will inform the series of LGAs-coordinated public dialogues. Equally important, CPS findings will augment public and investigative media, the Government (PCCB, GGCU, and CHRGG) and Development Partners with authoritative evidence on corruption.
Corruption Perception Surveys Report: TANZANIA 2008
2
Methodology The standard survey instruments including both qualitative and quantitative social research methods were used to conduct the study.
Sample size Design The regions included in the sample are Kagera, Shinyanga, Mtwara, Ruvuma, Mbeya, Morogoro, Lindi and Coast. LGAs were not sampled; the survey intended to accommodate all LGAs available in a region. Fifty LGAs were earmarked for CPS year ONE. Tanzania population census data (2002) was used to design the CPS sample. The survey sample size was 400 key informants plus 1200 households. Eight key informants and 24 household respondents were interviewed in every LGA. Two hundred and fifty (250) focus groups were planned; targeting 5 focus group discussions per LGA. The sample is considered adequately representative of the whole population in the LGAs covered by the survey – male and female children, youth, elders and vulnerable social groups. Specific variables were considered for sample unit choice in urban, semi-urban or rural areas. The variables considered include availability of time, transport and communication facilities (physical accessibility), availability of core social service facilities (service accessibility) – health, education, energy utility, piped water, administration of justice – and proximity to economic and administrative centres. Accordingly, the research survey adopted the methodology, which is largely practical: the mixture of convenient, judgement, purposeful and systematic random sampling techniques. Individual adults were selected randomly by the interval method from both urban and rural areas – 2 streets or 2 villages1 – in one ward in the LGA; 12 respondents were chosen from one street or village, meaning 24 respondents were interviewed from one ward in the LGA. One person was interviewed from one household after every 50th house in the selected streets in urban areas. In the rural areas one person was interviewed from one household per neighbourhood. A cluster-like sampling method was adopted, especially in rural areas, but also relying on systematic random sampling techniques in urban and semi-urban areas.
Focus Group Discussion (FGD) participants were chosen depending on the judgement and convenience of respective focus authority; teachers, ward or village leaders, employers and opinion leaders.
1 The definition of area coverage of the village or street is consistent with the LGA law that mandates and determines geopolitical boundaries of the governing authorities in either case.
Corruption Perception Surveys Report: TANZANIA 2008
3
Surveys data was collected from 7 regions, 35 LGAs, 35 wards, 70 streets/villages. Eight hundred respondents, one from each household, were interviewed. These were composed of 433 male and 344 female respondents respectively. As regards key informants, 263 respondents were interviewed constituting 179 males and 70 females. Ninety one (91) focus-group discussions, each composed of between 8 and 12 participants, were conducted.
FACTORS INFLUENCING GOVERNANCE/ANTI-CORRUPTION POLICY ENVIRONMENT
The anti-corruption policy environment in Tanzania consists of both internal and external factors. The extent to which external factors influence the anti-corruption policy depends in part on internal features of the Tanzanian state. External factors include donor agencies, international and regional intergovernmental instruments against corruption while internal factors consist of particularly political, economic and social policy architecture of the Tanzanian state. We also need to appreciate that the effects of external influences depend largely on internal governance policy and practices. This happens because internal factors favourable to external influence tend to magnify the effects of external influences whereas, internal conditions unfavourable to adoption of external influences tend to diminish their effects. The influence of several factors has manifested istelf in the nomenclature of National Anti-Corruption Strategy and Action Plan II (NACSAP II) as a policy framework and mechanism of preventing corruption and promoting good governance in the country. The configuration of various state anti-corruption institutions such as the Prevention and Combating of Corruption Bureau (PCCB), the Ethics Secretariat, the Financial Intelligence Unit and the Commission for Human Rights and Good Governance is also the function of power leverage of different actors, forces and the context of governance in the country. Not the least, is the behaviour of actors, in their actions and inactions. The anti-corruption struggle is also a function of power balance between actors and their interests within the existing political context. SURVEYS FINDINGS The findings largely represent corruption perceptions, views and experiences of many ordinary Tanzanians. The sample is largely determined practically; the mixture of judgement, convenient, purposeful and systematic random sampling techniques. Sample characteristics include men and women of 18 years and above and residents of rural and urban areas living under different social-economic conditions. Respondents in both rural and urban areas had equal chances of being targeted and selected for interviews. The inference drawn from respondents’ collective views is believed to represent Tanzania’s public consensus on the country’s status of governance and corruption. A combination of qualitative and quantitative data is analysed to establish the surveys findings presented in this report. The margin of error is plus or minus 5 percent at a 95 percent confidence level.
Corruption Perception Surveys Report: TANZANIA 2008
4
The survey was organised in line with the plan to extract and analyse information from ten family groups as follows:-
i. Level of public awareness on (civic competence against) corruption; ii. Driving forces for corruption behaviour and acts; iii. Corruption actors in the LGAs; iv. Rationale for and analysis of corruption actors; v. Attitude towards demand for and/or supply of corruption; vi. Form of, and experience in, corruption; vii. Analysis of magnitude of corruption as basis of the perceptions; viii. Assessment of LGAs current anti-corruption policy/legal measures; ix. Determining the lowest vs. highest corruption perception LGAs; and x. Statistical analysis and description of the findings. Sample description Households and key informants combined, male representation is 63.8 percent while 36.2 percent constitutes female representation in the sample. Key informants are adequately literate while peasants (58.2 percent) constitute the majority of households. Level of awareness about corruption Majority Tanzanians are aware of what constitutes corruption; 91.9 percent of ordinary Tanzanians and 98.8 percent of opinion leaders. Driving forces for corruption behaviour and acts Nine against eight reasons were mentioned by ordinary Tanzanians and opinion leaders respectively, as corruption driving forces. “Greed” and “selfishness” is ranked the highest driving force by 49.3 percent of ordinary Tanzanians while ‘pressure to get service’ is ranked the highest (45.2 percent) by opinion leaders. Corruption actors Due to LGAs’ role as official social service providers, and in formal contact with public, leading corruption actors are the departments of education, health, lands and housing, license and revenue, judiciary, police, office of the District Development Director (DED), natural resources, water and sewerage, power utility (TANESCO), TACAIDS, cooperatives, road works, and Ward Development Councils (WDCs). LGAs were subjected to rigorous governance assessment by household respondents, representing the views of ordinary Tanzanians, and the key informant respondents, representing the views of leaders to inform the LGAs performance-based perceptions.
Corruption Perception Surveys Report: TANZANIA 2008
5
Generally, the perception is that employees in the service delivery sectors are leading: 83.2 percent (TANESCO), 82.0 percent (Police), 78.5 percent (Licensing & revenue department), 76.9 percent (Health department), 76.3 percent (Water & sewerage), 73.5 percent (Natural resources), 71.8 percent (Education), 70.4 percent (Land & housing). WDCs employees score the least (42.7 percent) corruption perception rate. Analysis of magnitude of corruption as basis for perceptions Overall, police and the Judiciary are perceived the prominent recipients of corruption proceeds in the LGAs (ranked by 82.8 percent and 80.4 percent of respondents respectively). Health ranked by 62.7 percent is also the significant recipient of corruption proceeds in the LGAs. The departments of lands & housing, licensing & revenue, WDCs, DED office, natural resources, power utility (TANESCO) and road construction works are also noted as active recipients of corruption proceeds in the LGAs. Experience in corruption Fifty five percent of household respondents replied they had never been involved while 15.7 percent replied they had been involved once. Eighteen point six (18.6) percent replied they sometimes had to pay bribes and 8.6 percent replied they always pay bribes to access service provided by designated LGAs departments. By implication, 43 percent of ordinary Tanzanians confess to have, at least once, paid corruption as a means to access services in the LGAs. Moreover, analyses of the category of staff who actually receive bribes indicate that 50.3 percent is received by ordinary employees of LGAs departments dealing with services, 34.2 percent goes to middle level staff, 12 percent is received by senior staff, while 3.5 percent is indicated to have been distributed across the categories of LGAs staff. Sixty two point four (62.4) percent of corruption is paid for, and by direct users/beneficiaries of social services, while 37.6 percent is paid for secondary users of social services, e.g. children. Means/forms of corruption transactions Money, valuables/properties, services, sex and favouritism are the most popularly mentioned forms/means for transacting corruption. A significant 81.8 percent rank cash the most preferred form of corruption; 39.6 percent rank sex the second most preferred form of corruption; while 39.3 percent rank favouritism the third most preferred form of corruption. Valuables are ranked the rarely preferred form of corruption. 96.8 percent of household respondents confessed to have paid corruption by cash. 2.5 percent confirmed to have paid corruption in kind, while 0.6 percent confessed they transacted sex.
Corruption Perception Surveys Report: TANZANIA 2008
6
Attitude towards demand for and/or supply of corruption 78.4 percent are aware corruption offer is against the law, while 21.6 percent are not aware about criminal liability associated offer bribery/corruption. On the same note, 95.4 percent of service users are forced to offer bribes/corruption to access services in the LGAs. Only 4.6 percent of service users pay corruption voluntarily. Moreover, 73.9 percent of service users transact corruption proceeds directly with final recipients, while 26.1 percent use agents to facilitate it. 49.3 percent of corruption transactions have been witnessed by third party. Selective assessment of current anti-corruption measures Corruption in the LGAs is increasing amid relatively adequate legislations and policy. Only 36.8 percent of opinion leaders and 35.4 percent of ordinary Tanzanians are aware about existing institutional or similar anti-corruption measures. 63.2 percent of opinion leaders and 40.7 percent of ordinary Tanzanians indicate such anti-corruption strategy/mechanism do not practically exist or function in their places of work. However, PCCB is adequately known (76.8 percent–opinion leaders and 76.9 percent– ordinary Tanzanians) as anti-corruption watchdog. Police is ranked by minority – 8.7 percent. Public confusion to distinguish between voluntary endeavours of CSOs and PCCB/police is noted. The public is narrowly informed about CSOs; both the notion and those on the forefront fighting corruption. Qualitative assessment of Government efforts to fight corruption in LGAs 71.3 percent of opinion leaders (majority) believe Government anti-corruption efforts have failed; 45.5 percent, 42.6 percent and 11.9 percent respectively believe the success is little, medium or satisfactory. However, 66.7 percent are ready to support establishment of anti-corruption committees in the LGAs; councils, wards and villages. Recognition of inter-faith potential to fighting corruption It is strongly asserted that corruption is positively correlated with immorality. The strong influence of interfaith organisations as regards human behaviour is considered potentially important to fight corruption through morality restoration. The majority 94.6 percent of respondents reaffirm preaching is the most useful forum for religious leaders fighting corruption. Lowest vs. highest corruption perception LGAs An examination of corruption trends and ratings across actors is done consistent with observation and selection of the first ten LGAs with lowest or highest corruption perception ratings. This approach is only meant to confirm consistency between outcomes based on the statistical description provided by other data, vis-à-vis
Corruption Perception Surveys Report: TANZANIA 2008
7
outcomes based on the analysis of statistical description of control question. The control question requested respondents to state whether they perceive corruption to exist, and at what rate; very low, low, high or very high. Four iterations are applied to finally conclude the lowest or highest corruption perception status of LGAs.
POLICY RECOMMENDATIONS The policy recommendations are established by both direct recommendations of interviewees and CPS key findings. The recommendations assign specific role for Government and NSAs as promoters of good governance and anti-corruption. Specific policy recommendations details are provided in chapter four of the report.
Corruption Perception Surveys Report: TANZANIA 2008
8
CHAPTER ONE
1.0 INTRODUCTION The consensus from the latest discourse involving several ‘gurus’ on corruption, including the global anti-corruption watchdog, Transparency International (TI), is that corruption means abuse of ‘public trust for private gain’. Since early 1990s impeccable evidence on Tanzania’s country corruption status attests to the fact that it is pervasive. To the effect, Tanzania is referred to as the country largely suffering from poor governance, and tainted by corruption. According to documented literature in the media, research institutions, and various reports/statements authored by Development Partners (DPs), multilateral institutions, inter-faiths organisations, political parties, designated Government Ministries Departments and Agencies (MDAs), core reform programmes, international watchdog organisations and Civil Society Organisations (CSOs), Tanzania is marred by corruption – grand and petty – in the public domain. It is corruption that has thus persistently undermined the Government and Tanzanians’ efforts to eradicate poverty.
On its part, the Government of the United Republic (URT) has taken a lot of corrective measures. A number of policy, strategies, programmes or projects; legislative, economic, political or institutional developments have been put in place. The efforts such as the establishment of the Office of Permanent Commission of Inquiry (Ombudsman, 1966); enactment of the Prevention of Corruption Act No. 16 (1971) that later set in the Anti-corruption Squad (1975); establishment of the Prevention of Corruption Bureau (1991); enactment of the Economic Sabotage and Organised Crime Control Act (1983/4); appointment of the Presidential Commission of Inquiry Against Corruption (PCIAC, 1996); enactment of the Leadership code of Ethics Act No. 13 of 1995; design and development of the National Anti-Corruption Strategy and Action Plans (NACSAP); establishment of the Good Governance Coordination Unit (GGCU, 2001); and lately, the enactment of Anti Money Laundering Act (2006)/establishment of Financial Intelligence Unit, enactment of Public Procurement Regulatory Act (2004)/establishment of PPRA and enactment of PCCA (2007)/establishment of PCCB are examples of the Government’s notable efforts.
Public concern on petty and grand corruption is rife. Corruption has affected the social service delivery system with obvious repercussions on education, health, water, administration of justice, and land allocations. The resulting endemic poverty – income and livelihoods vulnerability is quantitatively noted. The political, social and economic life of majority Tanzanians is largely at risk. Children, women, youth and those with disabilities in rural and urban areas are the most affected social groups.
Indeed strategically placed, the Local Government Authorities (LGAs) are critical for augmenting the analysis of the impact of corruption to ordinary people, and possibly
Corruption Perception Surveys Report: TANZANIA 2008
9
recommend appropriate policy reforms. The governance and corruption research surveys were of the conclusion that LGAs are the best placed units of analysis for the study and recommending the required policy changes. LGAs-based CSOs and networks may rightly provide the useful links and backup to governance and corruption surveys.
This report presents the findings of Corruption Perception Surveys (CPS), which was conducted with financial support from the Foundation for Civil Society by the Concern for Development Initiatives in Africa (ForDIA) in 35 LGAs. The report submits findings on the governance and corruption status pursuant to the 35 LGAs2 in Tanzania Mainland. CPS has the timeframe of three years, commencing January 2007; and will cover all 137 LGAs in Tanzania Mainland. Subsequent reports will be published for years 2008/9 and 2009/10.
During the design, planning and implementation stages of the surveys, ForDIA mobilised, identified, recruited and contracted the LGAs-based CSOs and/or networks to augment smooth implementation and ownership of the project in the 35 LGAs. Fieldwork activities, involving collection of the data commenced in the middle of February and ended in May 2008, and were immediately followed by analysis of the survey data, which ended in June, 2008.
Readers and active good governance stakeholders, including political and bureaucratic executives, media, DPs, CSOs activists, governance and political researchers, political parties and the interested general public, will in this report, find the analyses of corruption perceptions as well as identification of the LGAs with lowest or highest corruption indicators. The policy recommendations and the proposed way forward activities are also provided at the end of the report. Governance stakeholders in the LGAs are expected to use the sector-specific findings to conduct the CSOs-led governance dialogues, to engage with LGAs bureaucrats in a bid to eventually improve the status of good governance and reduce corruption in the LGAs in which social service delivery is at stake.
1.1 COUNTRY CORRUPTION/GOVERNANCE GENERAL OVERVIEW Measures that strengthen governance institutions and systems to ensure best practices are critical to improve good governance and control of corruption. An overview of Tanzania country corruption status is basically an examination of policy and legal measures adopted by Government over time to improve the country’s governance status. Citizens and the Government are fully aware of corruption and its negative impact on national development – undermining economic growth, democracy and social 2 See Annex III for the list of LGAs
Corruption Perception Surveys Report: TANZANIA 2008
10
stability; compromising professional efficiency and competitiveness; and exacerbating poverty. Cluster III of the National Strategy for Growth and Reduction of Poverty (MKUKUTA) is starkly clear about the importance of good governance; recognition that good governance is the ‘bedrock’ of the other two clusters of MKUKUTA3. There are major policy and legal reforms initiated to strengthen governance institutions, structures and systems – to promote good governance and deter corruption. The notable reforms are the Public Sector Reform Programme (PSRP), Public Finance Management Reform Programme (PFMRP), Legal Sector Reform Programme (LSRP), Local Government Reform Programme (LGRP), National Anti-Corruption Strategy and Action Plans (NACSAP) I & II, Good Governance Coordination Unit (GGCU), institutional strengthening of the Prevention and Combating of Corruption Bureau4 (PCCB), and enactment of some specific legislations5. The reforms equally respond to specific recommendations of the Presidential Commission of Inquiry Against Corruption, popularly known as, the “Warioba Report”6.
Moreover, consistent with steady Government leadership, Tanzania has domesticated or ratified existing regional and international intergovernmental conventions7 geared towards controlling corruption and promote good governance. The African Union Convention on Preventing and Combating Corruption (AU Convention), the United Nations Convention Against Corruption (UNCAC) and the Southern African Development Community Protocol Against Corruption (the SADC Protocol) are noted in that regard.
Efforts to combat corruption are echoed in various government documents. The 2007 Poverty and Human Development Report (PHDR)8 indicates some positive trends towards improving governance practices in the social service delivery domain. The Views of the People (VOP) Surveys (2007), Controller and Auditor General’s (CAG) Report, Natural Resources Participatory Management Strategy, and Access to Governance Information in Local Governments are similarly showing a positive
3 MKUKUTA page 31 (June , 2005) 4 PCCB, which until April 2007 was known as the Prevention of Corruption Bureau (PCB), has extended its physical presence from only regional headquarters, 1991, to cover all 127 districts by 2007. 5 The Prevention of Corruption Act (PCA, 1991) was narrow (4 offences) focusing on corruption in the public service domain; Prevention and Combating of Corruption Act (PCCA, 2007) – the new legislation, is relatively comprehensive (24 offences) focusing on corruption in the public and private domains. Another legislation is the Public Procurement Act (PPA) No.21 of 2004 6 PCIAC was established by former President Benjamin Mkapa in 1996, to help analyse corruption and advise Government on appropriate policy options for addressing corruption and improving governance practices. The Commission was headed by former Prime Minister and First Vice President, Joseph Sinde Warioba. 7 The URT ratified the AU Convention on February 22nd 2005. The Convention came into force on 5th August 2006. URT again, signed the UNCAC on 9th December 2003 and ratified it on 25th May 2005. UNCAC came into force on 14th December 2005. URT also signed on the SADC Protocol in 2001, and ratified it on 20th August 2003. SADC Protocol is not yet fully ratified by member states so as it comes into force 8 Annual reporting on corruption trends are reported under MKUKUTA Cluster III: Governance and Accountability.
Corruption Perception Surveys Report: TANZANIA 2008
11
picture. However, the administration of justice sector (police and the legal system) is still reported as a more corrupt sector.
The Afro-barometer Briefing Paper (April 2006) is probably more conclusive by stating that its overall findings suggest that the Government (Tanzania) could be achieving at least modest success given efforts to combat corruption and promote good governance. The U4 Anti-Corruption Resource Centre suggests that perception of corruption in the police force has declined from 80% in 2003 to 72% in 2005 (U4 Anti-Corruption Resource Centre Report, 2007). The Research on Poverty Alleviation (REPOA)9 indicates ordinary citizens as number one perpetrators of corrupt behaviour, followed by local government officials while police occupy third position (REPOA, 2007). The findings of Core Welfare Indicators (CWI)10, focussing on and collecting raw data from households (grassroots), reveal interesting results about the general picture of governance and corruption in Tanzania. Conducted between the second half of 2006 and the first half of 2007 in five districts, the CWIs indicate that citizens are generally complacent with governance practices as then exercised within Local Government structures. The World Bank Institute’s governance indicators11 (1996 to 2006) also indicate that Tanzania has gained momentum, and place the country in a group of countries that are improving towards good governance (Kaufmann, Kraay & Mastruzzi, 2007). In the same vein, the Transparency International’s Corruption Perception Index (CPI) indicates that Tanzania has improved, gaining momentum from 2.9 score points in 2005 to 3.2 score points by 200712.
Despite the gains highlighted above, significant evidence still indicates a gloomy picture of the status of Tanzania governance and anti-corruption. The Tanzania Construction Sector Transparency Initiative (CoST)13, indicates the rising incidence of corruption in the construction sector (according to assessment of key stakeholders, the consulting engineers and contractors) (CoST, 2007). The Tanzania Civil Engineering Contractors Association (TACECA) estimates 90% of contractors pay 10%-15% of contract value in bribes. The sector is worth about 30% of GDP or US$1885 million. Moreover, in 2004, the Engineers Registration Board (ERB) and the Association of Consulting Engineers Tanzania (ACET) estimated that over 90% of
9 “Citizens Demand Tougher Actions on Corruption in Tanzania,” REPOA-conducted study findings 10 CWI surveys were conducted in Bukombe district, Bukoba rural district, Korogwe district, Dodoma Municipality and Temeke Municipality. CWI is sponsored by Government (PMO-RALG), and carried out by Economic Development Initiatives (EDI) 11 WBI’s governance indicators: ) Voice & Accountability, ii) Political Stability and Lack of Violence/Terrorism, iii) Government Effectiveness, iv) Regulatory Quality, v) Rule of Law, and vi) Control of Corruption. 12 Tanzania ranked 88th in 2005 CPI (globally) and 14th (regionally-Africa); the rankings were 94th in the 2007 CPI (globally) and 14th in the region (Africa). 13 CoST is currently piloted in Tanzania, Zambia, Vietnam and the Philippines with financial support from DfID – designed to function in the constructive industry function the way EITI functions in the extractive industry.
Corruption Perception Surveys Report: TANZANIA 2008
12
construction contract awards and about 70% of consultancy assignments were secured through corruption.
Another U4 report14, quoting various authentic documents, underlines the existence of a complex corruption network at the highest level of political leadership. The report confirms systemic, grand and large-scale corruption, and state capture with specific reference to revelations from the in-depth study of governance in the forestry sector (Traffic International, 2007), and corruption in the wildlife sector. The forestry report reveals an estimated colossal (annual) loss of US$ 58 million or 96% of the potential revenue from forestry resources. The energy sector and the Bank of Tanzania have been in the media for over a year now, implicated in grand corruption scandals – including the grossly inflated and corruptly procured construction of the twin towers, the new building for the Central Bank; misappropriation of over US$133 million in the External Payment Arrears (EPA) Account; corruptly procured emergency power service contract worth US$173 million (Richmond LLC); illegal acquisition of Kiwira Power Project worth US$4 billion; and the Serious Fraud Office’s (SFO) revelation (with possibility for indictment) indicating the former Tanzania Attorney General pocketed US$1 million as bribe from BAE Systems of UK15. Brian Cooksey16 reveals relatively high corruption perception associated with inefficiency and waste in HIV/AIDS spending in Tanzania (Brian COOKSEY, 2006), stressing that HIV/AIDS spending is lacking clarity in exactly how the funds are spent in drugs and supplies, and staff allowances and travel. Another revelation marks the difficulties associated with obtaining a coherent picture of health income and expenditure at district hospital and council level (Health Sector PER report update, 2003)17.
The media in Tanzania have been instrumental in reporting/uncovering numerous grand corruption scandals, including those discussed in the preceding paragraphs and others not discussed. Judicial proceedings, Parliamentary debates proceedings (live and Hansards), Parliamentary/Presidential Select Committees’ official reports, specific governance/policy research reports, MKUKUTA implementation status and progress reports (Cluster Working Group III),18 and corporate sector annual reports, to mention only a few, remain the impeccable sources for mainstream media reportages on grand corruption in Tanzania.
14 The report, authored in 2007, is titled, “Tanzania Anti-Corruption Policy Making in Practice” 15 Apparently against the public opinion, in 2002 the Government controversially procured the quasi-military-ware aviation watchdog (radar) from the UK. 16 Health and corruption in Tanzania by Brian Cooksey (2006) 17 Tanzania Public Expenditure Review Multi-sectoral Review: HIV-AIDS 2003 update 18 Performance analysis and status reports consistent with ongoing governance policy reforms; PSRP, LSRP, LGRP, NACSAPII, and other public accountability reforms across Government Ministries, Departments and Agencies (MDAs)
Corruption Perception Surveys Report: TANZANIA 2008
13
1.2 PUBLIC DEMAND FOR GOOD GOVERNANCE AND ACCOUNTABILITY: RATIONALE
Public demand for accountability and good governance is rationalised by the convention and inherent consensus that modern democratic states are obligated to provide entitlements to citizens; provision of public goods to people, which constitutes the raison d’être for state existence. The realisation that peace, security, infrastructure, education, collective clean environment, and other similar public goods cannot be consumed in isolation or bought from the market, makes it mandatory for citizens to pay taxes to states so that the latter ensures equitable provision of public goods. People expect governments to coordinate, direct, control and supervise allocation and distribution of resources, optimally and fairly. According to this view, governments are obligated to indiscriminately provide entitlements, including social services, to citizens. However, this is possible only if the state is entirely reliant on its citizens for revenue through taxation in exchange for policy influence19 (Maal, 2007). The less a government is dependent on its citizens for revenue through taxation, the less it is likely to be accountable to the electorate. State revenue sources that are independent of the citizens’ taxes compromise accountability of the former to the latter. Tanzania has a very narrow tax base; taxation only accounts for 12 percent of its GDP (Maal, 2007). By 2008 there were 370 direct taxpayers20, mainly medium and large formal sector businesses that pay over 70% of domestic taxes. The large share of state revenue in Tanzania comes from foreign aid and the natural resource sector. The state is almost independent of ordinary citizen taxpayers for its revenue, rationalising public perceptions that there is waste, mismanagement and corruption in the country. The situation is even more worse in the LGAs, which almost entirely rely on Central Government subventions and subsidies. 1.3 MEASURING OF GOOD GOVERNANCE PERFORMANCE: VARIOUS INDICATORS CPS recognises the existing methods, techniques and tools that attempt to measure good governance performance and corruption status. There are national and global indicators developed to measure governance performance and corruption status. Global governance performance indicators These are the conventional “good governance” indicators developed and applied nationally but across countries to measure relative governance best practices. Common amongst others is the Corruption Perception Index (CPI) published annually by Transparency International (TI). CPI scores relate to perceptions of the degree of corruption as seen by business people, and country analysts, and ranges between 10
19 See many similar arguments in Simen Jansen Maal; Masters of Economics thesis (unpublished), Department of Economics, University of Oslo, 2007 20 EastAfrican No. 726 September 29-October 5, 2008, page 3 story: Cellphone firms under scrutiny over tax planning.
Corruption Perception Surveys Report: TANZANIA 2008
14
(highly clean) and 0 (highly corrupt)21. Afrobarometer22 is another measure for good governance, giving a comparative series of national public attitude surveys on democracy, markets and civil society in Africa. Afrobarometer annual reports have not been regular. The initiative is coordinated and published by the Department of Political Science, Michigan State University in collaboration with African counterparts – the Institute for Democracy in South Africa (IDASA) and Ghana Centre for Democratic Development (CDD-Ghana). Another global scale measure of governance is the World Bank Institute (WBI) governance indices, which apply the country data based on six aggregate governance indicators, namely Voice & Accountability, Political Stability and Lack of Violence/Terrorism, Government Effectiveness, Regulatory Quality, Rule of Law, and Control of Corruption to measure the quality of governance practices. The WBI index for 1996-2006 indicates Tanzania to be improving (WBI, June 2007) on governance best practices23. The Global Integrity uses independent information on governance and corruption to assess good governance index across countries. It assesses the existing mechanisms to fight corruption, after which countries are ranked as “very weak” (below 60%), “weak” (60+ %), “moderate” (70+ %), “strong” (80+ %) or “very strong” (90+ %). Using a comprehensive methodological process, ten indicators, namely Civil Society Organizations, Media, and Public Access to Information, Voting & Citizen Participation, Election Integrity, Political Financing, Executive Accountability, Legislative Accountability, Judicial Accountability and Budget Processes are scrutinised to reach the Global Integrity Index on good governance. Tanzania scored little above 60%, thus ranking “weak” in the 2007 Global Integrity Index24. The Freedom House is also on records for global governance performance indicators: population, capital, political rights and civil liberties – rated as “Free”, “Partly Free”, or “Not Free”. National governance performance indicators Tanzania started the core policy reforms during third phase Government. The reforms are meant to improve efficiency in Government institutions, hence promote good governance and deter corruption. The notable core reforms include the Public Finance Management Reform Programme (PFMRP), Legal Sector Reform Programme (LSRP), Local Government Reform Programme (LGRP), Public Sector Reform Programme (PSRP) and the National Anti-Corruption Strategy and Action Plans (NACSAP). The National Strategy for Growth and Reduction of Poverty (NSGRP) is the
21 TI released 2008 CPI on Tuesday 23rd September, 2008. Tanzania has scored 3.0; 102nd least corrupt country out of 180 countries. Information available at http://www.icgg.org/corruption.cpi_2008_press.html, accessed September 26, 2008. 22 Afrobarometer is more like opinion polling on attitudes to democracy and elections across countries in Africa. Specific information available at http://www.afrobarometer.org. 23 Full report available at http://www.govindicators.org and http://www.worldbank.org/wbi/governance/. 24 More information is available at http://www.globalintegrity.org
Corruption Perception Surveys Report: TANZANIA 2008
15
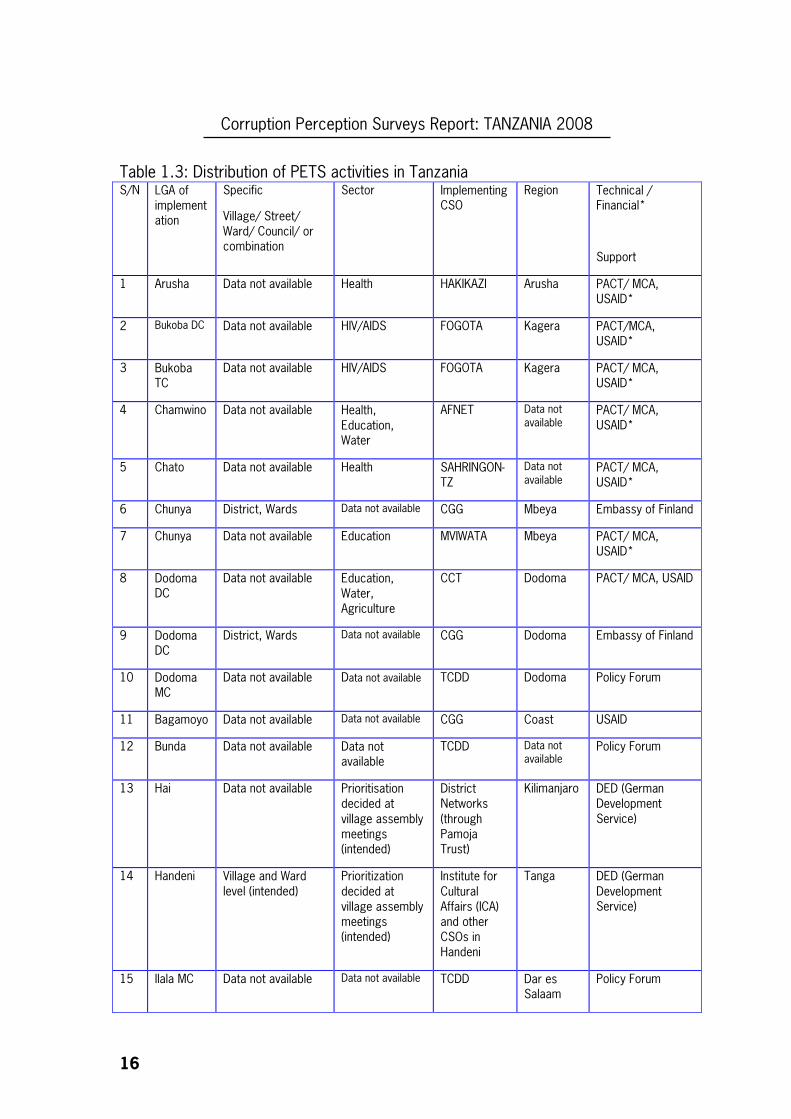
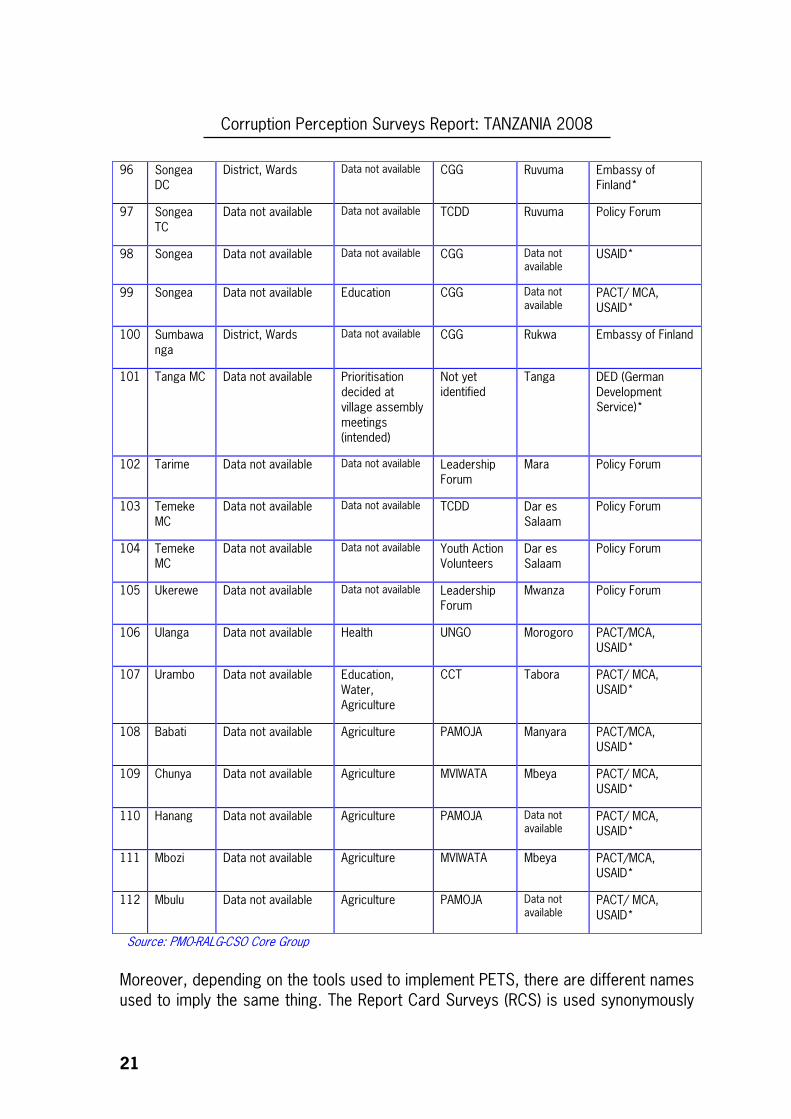
mainstream policy defining the direction for core reforms, to reduce poverty (income) and boost social-economic wellbeing. Capability to carry out the core policy reforms to successful levels is eventually critical to measure improving governance performance status in the country. Specific agreed targets in the General Budget Support (GBS) Performance Assessment Framework (PAF) are seen as indicators to help measure good governance performance in Tanzania25. The Policy and Service Satisfaction Survey (PSSS) is another indicator that measures good governance performance at national level. The survey is used to investigate public knowledge and perceptions about the Government’s pro-poor policy initiatives (REPOA, 2003). PSSS also documents people’s views on the availability, quality and cost of basic social and economic services26. However, REPOA has not published subsequent PSSS reports findings since release of the first results/report in 2003. Participatory Service Delivery Assessment27 (PSDA) is noted as a mechanism to measure good governance performance status. Although so far there is no documented evidence of PSDA findings in Tanzania – at TANGO or UNDP – the initiative is intended to track social service delivery thus ensure qualitative and quantitative delivery of the services to ultimate users at local level. National level PSDA report would inform the status of good governance in the country. Despite capacity limitation, Public Expenditure Tracking Surveys (PETS) is probably the current most popular national governance performance indicator amongst civil society and development partners. Supported by over 8 development partners, 26 CSOs have implemented over 112 PETS activities in 77 districts in 21 regions in Tanzania since 2006. PETS create the opportunity for stakeholders (citizens) to track, trough the participatory and transparent process, execution of budgets expended at local level in the LGAs expenditure system. PETS compare budgetary allocations to actual spending, hence ‘following the money’ to where it is spent, comparing budgetary allocations with records of transfers and receipts at each level of government. Finally PETS show how much of the funds intended for public service providers actually reach the intended beneficiaries and therefore identify the leakage or diversion and the level at which the leakage takes place. PETS’ findings are shared amongst stakeholders across the horizontal and vertical accountability architectures in the LGAs. However, perhaps because of its newness, there is no documented evidence yet, indicating the impact of PETS on governance status in the LGAs. Table 1.3 below indicates the distribution of PETS activities so far implemented in Tanzania since 2006.
25 NACSAP II progress report, PCCB/GGCU, update to CWG III, May 2008 26 Policy and Service Satisfaction Survey: Main Results document, REPOA 2003 27 TNAGO had on many occasions during 2007 PMO-RALG-CSO Core Group meetings in Dar es Salaam reported to have collaborated with UNDP to implement PSDA in Kilosa and Same districts. See PMO-RALG/CSO Core Group meeting minutes dated 10th December 2007.
Corruption Perception Surveys Report: TANZANIA 2008
16
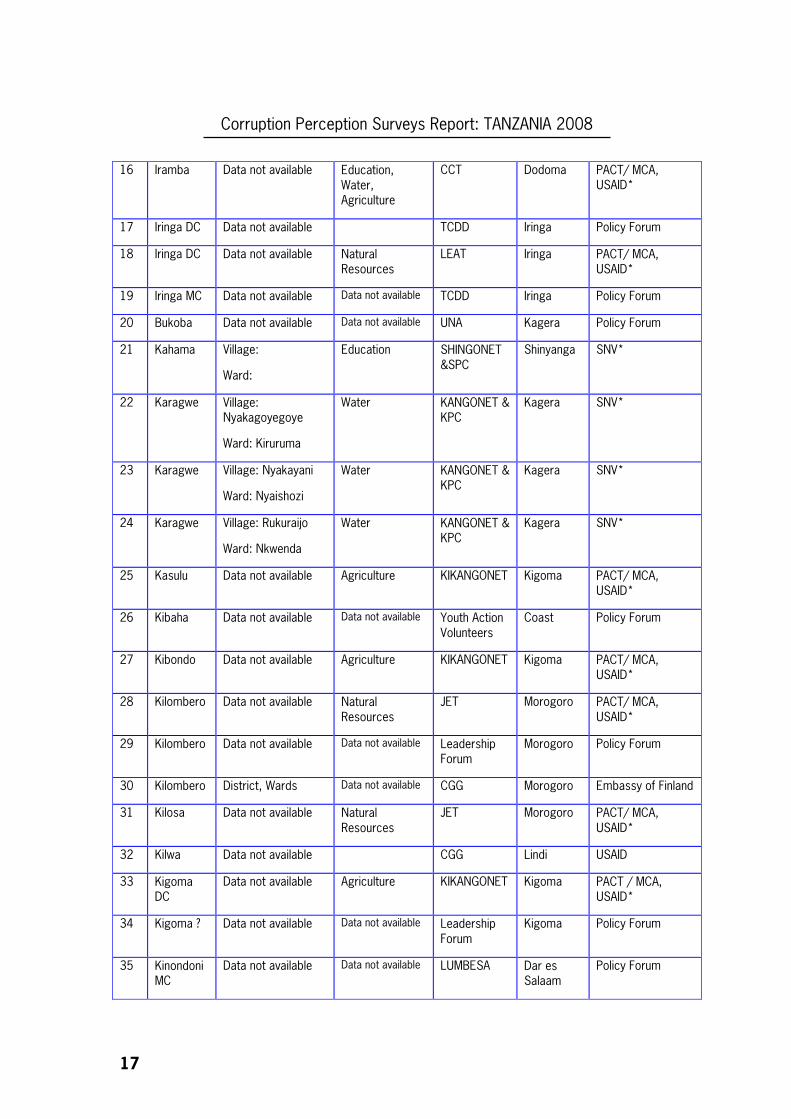
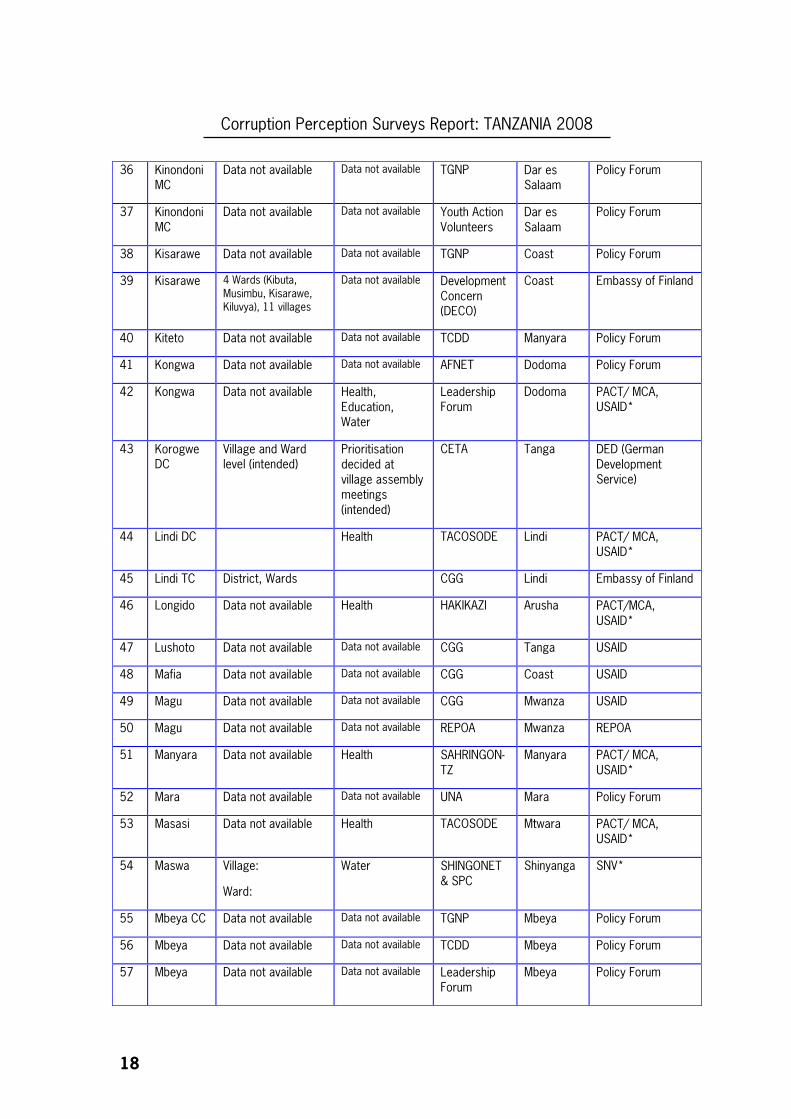
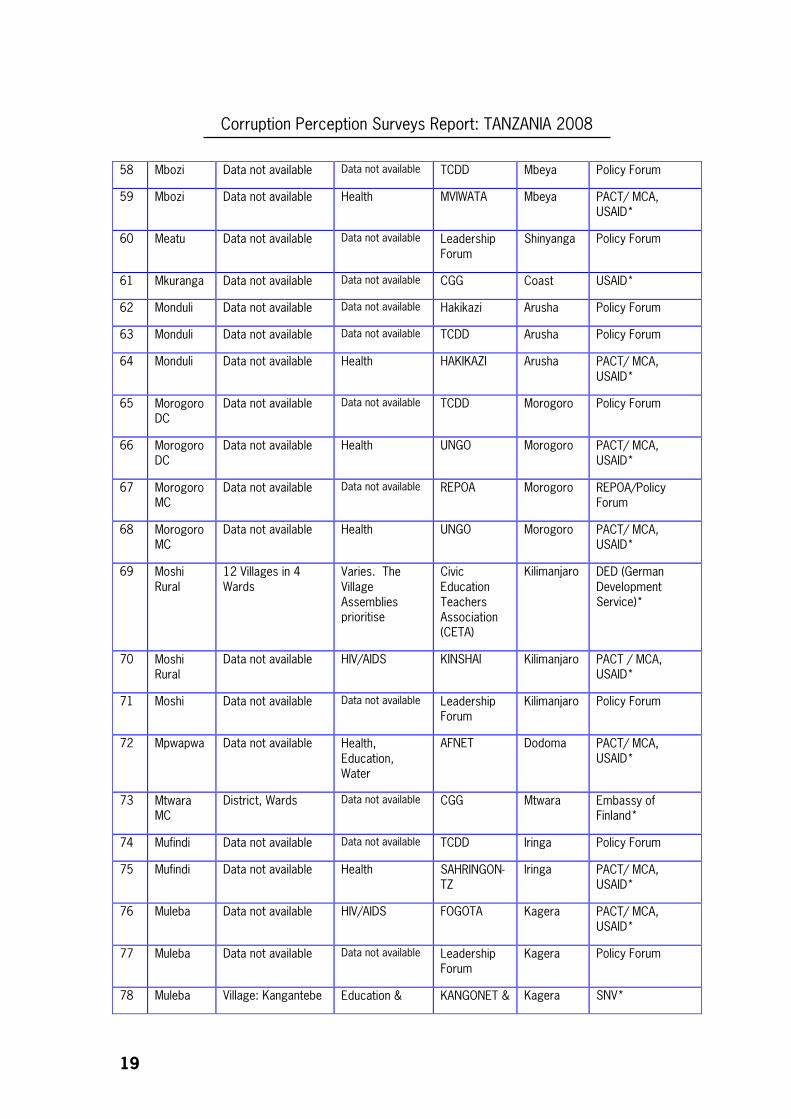
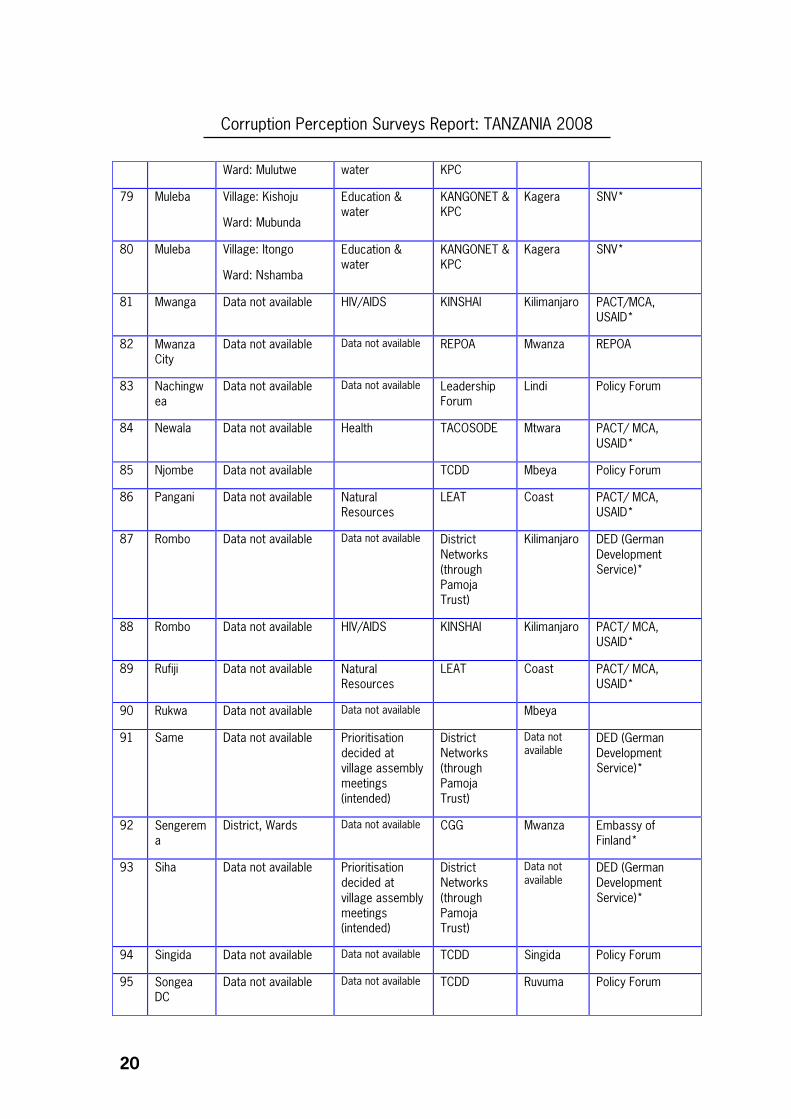
Table 1.3: Distribution of PETS activities in Tanzania S/N LGA of
implementation
Specific
Village/ Street/ Ward/ Council/ or combination
Sector Implementing CSO
Region Technical / Financial*
Support
1 Arusha Data not available Health HAKIKAZI Arusha PACT/ MCA, USAID*
2 Bukoba DC Data not available HIV/AIDS FOGOTA Kagera PACT/MCA, USAID*
3 Bukoba TC
Data not available HIV/AIDS FOGOTA Kagera PACT/ MCA, USAID*
4 Chamwino Data not available Health, Education, Water
AFNET Data not available
PACT/ MCA, USAID*
5 Chato Data not available Health SAHRINGON-TZ
Data not available
PACT/ MCA, USAID*
6 Chunya District, Wards Data not available CGG Mbeya Embassy of Finland
7 Chunya Data not available Education MVIWATA Mbeya PACT/ MCA, USAID*
8 Dodoma DC
Data not available Education, Water, Agriculture
CCT Dodoma PACT/ MCA, USAID
9 Dodoma DC
District, Wards Data not available CGG Dodoma Embassy of Finland
10 Dodoma MC
Data not available Data not available TCDD Dodoma Policy Forum
11 Bagamoyo Data not available Data not available CGG Coast USAID
12 Bunda Data not available Data not available
TCDD Data not available
Policy Forum
13 Hai Data not available Prioritisation decided at village assembly meetings (intended)
District Networks (through Pamoja Trust)
Kilimanjaro DED (German Development Service)
14 Handeni Village and Ward level (intended)
Prioritization decided at village assembly meetings (intended)
Institute for Cultural Affairs (ICA) and other CSOs in Handeni
Tanga DED (German Development Service)
15 Ilala MC Data not available Data not available TCDD Dar es Salaam
Policy Forum
Corruption Perception Surveys Report: TANZANIA 2008
17
16 Iramba Data not available Education, Water, Agriculture
CCT Dodoma PACT/ MCA, USAID*
17 Iringa DC Data not available TCDD Iringa Policy Forum
18 Iringa DC Data not available Natural Resources
LEAT Iringa PACT/ MCA, USAID*
19 Iringa MC Data not available Data not available TCDD Iringa Policy Forum
20 Bukoba Data not available Data not available UNA Kagera Policy Forum
21 Kahama Village:
Ward:
Education SHINGONET &SPC
Shinyanga SNV*
22 Karagwe Village: Nyakagoyegoye
Ward: Kiruruma
Water KANGONET & KPC
Kagera SNV*
23 Karagwe Village: Nyakayani
Ward: Nyaishozi
Water KANGONET & KPC
Kagera SNV*
24 Karagwe Village: Rukuraijo
Ward: Nkwenda
Water KANGONET & KPC
Kagera SNV*
25 Kasulu Data not available Agriculture KIKANGONET Kigoma PACT/ MCA, USAID*
26 Kibaha Data not available Data not available Youth Action Volunteers
Coast Policy Forum
27 Kibondo Data not available Agriculture KIKANGONET Kigoma PACT/ MCA, USAID*
28 Kilombero Data not available Natural Resources
JET Morogoro PACT/ MCA, USAID*
29 Kilombero Data not available Data not available Leadership Forum
Morogoro Policy Forum
30 Kilombero District, Wards Data not available CGG Morogoro Embassy of Finland
31 Kilosa Data not available Natural Resources
JET Morogoro PACT/ MCA, USAID*
32 Kilwa Data not available CGG Lindi USAID
33 Kigoma DC
Data not available Agriculture KIKANGONET Kigoma PACT / MCA, USAID*
34 Kigoma ? Data not available Data not available Leadership Forum
Kigoma Policy Forum
35 Kinondoni MC
Data not available Data not available LUMBESA Dar es Salaam
Policy Forum
Corruption Perception Surveys Report: TANZANIA 2008
18
36 Kinondoni MC
Data not available Data not available TGNP Dar es Salaam
Policy Forum
37 Kinondoni MC
Data not available Data not available Youth Action Volunteers
Dar es Salaam
Policy Forum
38 Kisarawe Data not available Data not available TGNP Coast Policy Forum
39 Kisarawe 4 Wards (Kibuta, Musimbu, Kisarawe, Kiluvya), 11 villages
Data not available Development Concern (DECO)
Coast Embassy of Finland
40 Kiteto Data not available Data not available TCDD Manyara Policy Forum
41 Kongwa Data not available Data not available AFNET Dodoma Policy Forum
42 Kongwa Data not available Health, Education, Water
Leadership Forum
Dodoma PACT/ MCA, USAID*
43 Korogwe DC
Village and Ward level (intended)
Prioritisation decided at village assembly meetings (intended)
CETA Tanga DED (German Development Service)
44 Lindi DC Health TACOSODE Lindi PACT/ MCA, USAID*
45 Lindi TC District, Wards CGG Lindi Embassy of Finland
46 Longido Data not available Health HAKIKAZI Arusha PACT/MCA, USAID*
47 Lushoto Data not available Data not available CGG Tanga USAID
48 Mafia Data not available Data not available CGG Coast USAID
49 Magu Data not available Data not available CGG Mwanza USAID
50 Magu Data not available Data not available REPOA Mwanza REPOA
51 Manyara Data not available Health SAHRINGON-TZ
Manyara PACT/ MCA, USAID*
52 Mara Data not available Data not available UNA Mara Policy Forum
53 Masasi Data not available Health TACOSODE Mtwara PACT/ MCA, USAID*
54 Maswa Village:
Ward:
Water SHINGONET & SPC
Shinyanga SNV*
55 Mbeya CC Data not available Data not available TGNP Mbeya Policy Forum
56 Mbeya Data not available Data not available TCDD Mbeya Policy Forum
57 Mbeya Data not available Data not available Leadership Forum
Mbeya Policy Forum
Corruption Perception Surveys Report: TANZANIA 2008
19
58 Mbozi Data not available Data not available TCDD Mbeya Policy Forum
59 Mbozi Data not available Health MVIWATA Mbeya PACT/ MCA, USAID*
60 Meatu Data not available Data not available Leadership Forum
Shinyanga Policy Forum
61 Mkuranga Data not available Data not available CGG Coast USAID*
62 Monduli Data not available Data not available Hakikazi Arusha Policy Forum
63 Monduli Data not available Data not available TCDD Arusha Policy Forum
64 Monduli Data not available Health HAKIKAZI Arusha PACT/ MCA, USAID*
65 Morogoro DC
Data not available Data not available TCDD Morogoro Policy Forum
66 Morogoro DC
Data not available Health UNGO Morogoro PACT/ MCA, USAID*
67 Morogoro MC
Data not available Data not available REPOA Morogoro REPOA/Policy Forum
68 Morogoro MC
Data not available Health UNGO Morogoro PACT/ MCA, USAID*
69 Moshi Rural
12 Villages in 4 Wards
Varies. The Village Assemblies prioritise
Civic Education Teachers Association (CETA)
Kilimanjaro DED (German Development Service)*
70 Moshi Rural
Data not available HIV/AIDS KINSHAI Kilimanjaro PACT / MCA, USAID*
71 Moshi Data not available Data not available Leadership Forum
Kilimanjaro Policy Forum
72 Mpwapwa Data not available Health, Education, Water
AFNET Dodoma PACT/ MCA, USAID*
73 Mtwara MC
District, Wards Data not available CGG Mtwara Embassy of Finland*
74 Mufindi Data not available Data not available TCDD Iringa Policy Forum
75 Mufindi Data not available Health SAHRINGON-TZ
Iringa PACT/ MCA, USAID*
76 Muleba Data not available HIV/AIDS FOGOTA Kagera PACT/ MCA, USAID*
77 Muleba Data not available Data not available Leadership Forum
Kagera Policy Forum
78 Muleba Village: Kangantebe Education & KANGONET & Kagera SNV*
Corruption Perception Surveys Report: TANZANIA 2008
20
Ward: Mulutwe water KPC
79 Muleba Village: Kishoju
Ward: Mubunda
Education & water
KANGONET & KPC
Kagera SNV*
80 Muleba Village: Itongo
Ward: Nshamba
Education & water
KANGONET & KPC
Kagera SNV*
81 Mwanga Data not available HIV/AIDS KINSHAI Kilimanjaro PACT/MCA, USAID*
82 Mwanza City
Data not available Data not available REPOA Mwanza REPOA
83 Nachingwea
Data not available Data not available Leadership Forum
Lindi Policy Forum
84 Newala Data not available Health TACOSODE Mtwara PACT/ MCA, USAID*
85 Njombe Data not available TCDD Mbeya Policy Forum
86 Pangani Data not available Natural Resources
LEAT Coast PACT/ MCA, USAID*
87 Rombo Data not available Data not available District Networks (through Pamoja Trust)
Kilimanjaro DED (German Development Service)*
88 Rombo Data not available HIV/AIDS KINSHAI Kilimanjaro PACT/ MCA, USAID*
89 Rufiji Data not available Natural Resources
LEAT Coast PACT/ MCA, USAID*
90 Rukwa Data not available Data not available Mbeya
91 Same
Data not available Prioritisation decided at village assembly meetings (intended)
District Networks (through Pamoja Trust)
Data not available
DED (German Development Service)*
92 Sengerema
District, Wards Data not available CGG Mwanza Embassy of Finland*
93 Siha Data not available Prioritisation decided at village assembly meetings (intended)
District Networks (through Pamoja Trust)
Data not available
DED (German Development Service)*
94 Singida Data not available Data not available TCDD Singida Policy Forum
95 Songea DC
Data not available Data not available TCDD Ruvuma Policy Forum
Corruption Perception Surveys Report: TANZANIA 2008
21
96 Songea DC
District, Wards Data not available CGG Ruvuma Embassy of Finland*
97 Songea TC
Data not available Data not available TCDD Ruvuma Policy Forum
98 Songea Data not available Data not available CGG Data not available
USAID*
99 Songea Data not available Education CGG Data not available
PACT/ MCA, USAID*
100 Sumbawanga
District, Wards Data not available CGG Rukwa Embassy of Finland
101 Tanga MC Data not available Prioritisation decided at village assembly meetings (intended)
Not yet identified
Tanga DED (German Development Service)*
102 Tarime Data not available Data not available Leadership Forum
Mara Policy Forum
103 Temeke MC
Data not available Data not available TCDD Dar es Salaam
Policy Forum
104 Temeke MC
Data not available Data not available Youth Action Volunteers
Dar es Salaam
Policy Forum
105 Ukerewe Data not available Data not available Leadership Forum
Mwanza Policy Forum
106 Ulanga Data not available Health UNGO Morogoro PACT/MCA, USAID*
107 Urambo Data not available Education, Water, Agriculture
CCT Tabora PACT/ MCA, USAID*
108 Babati Data not available Agriculture PAMOJA Manyara PACT/MCA, USAID*
109 Chunya Data not available Agriculture MVIWATA Mbeya PACT/ MCA, USAID*
110 Hanang Data not available Agriculture PAMOJA Data not available
PACT/ MCA, USAID*
111 Mbozi Data not available Agriculture MVIWATA Mbeya PACT/MCA, USAID*
112 Mbulu Data not available Agriculture PAMOJA Data not available
PACT/ MCA, USAID*
Source: PMO-RALG-CSO Core Group
Moreover, depending on the tools used to implement PETS, there are different names used to imply the same thing. The Report Card Surveys (RCS) is used synonymously
Corruption Perception Surveys Report: TANZANIA 2008
22
to PETS. HakiKazi Catalyst uses RCS to implement the PETS project in Monduli district in Arusha. Political Opinion Polls (POP) is yet another governance indicator. POP is popular amongst democracy think tanks that use it to test the level of public support (popularity) of state policy. POP is also used to test support to political office elective contenders during elections campaigns. The Research and Education for Democracy in Tanzania (REDET) is in record for conducting POP and releasing its findings to the general public28. LGAs governance performance indicators The governance indicators elucidated in the preceding sub-section above are noted as being also applicable in the LGAs. However, other governance indicators meant to specifically measure governance performance and/or corruption status in the LGAs exist. The Core Welfare Indicators are in record for LGA exclusive applicability in Tanzania. As noted on page 11 above, experts use the Core Welfare Indicator Questionnaire (CWIQ) to collect raw data from households in the LGAs. The data are then analysed and disaggregated across key social indicators to determine the level, and if users are satisfied with changes in the delivery of social services; education, health, water, public health infrastructure, employment level, land allocation, political leadership and administration of justice, and status of food security and social wellbeing. Governance specific elements are reflected in the reasons cited for dissatisfaction with policy decisions in which corruption, accountability, transparency, favouritism, lack of policy impact and bureaucratic unilateral decisions are rated. The findings29 of the CWIs conducted between the second half of 2006 and the first half of 2007, in Bukombe, Bukoba rural, Dodoma municipality, Korogwe and Temeke municipality generally portray improvement in good governance performance and corruption status in those LGAs.
The Urban Bribery Index (UBI) is another indicator that measures corruption status in urban LGAs. Unlike PETS and PSDA, there is no empirical evidence showing UBI results in any of the LGAs in Tanzania. UBI indicators are based on the information provided on organizations/departments in which service users encounter bribery, if bribes were actually paid, monetary value of the bribery paid and the service/goods for which bribery was paid. UBI is vital for measuring the status of petty corruption in mostly urban LGAs. The key bribery information blocks (purpose) for UBI data include law enforcement (avoiding the legal consequences of wrong doing, or harassment by the relevant authority); regulatory compliance (e.g. obtaining licenses); access to services (e.g. health, school places, utilities); business (e.g. to obtain a contract or expedite payment); and employment (e.g. to get a job, promotion, transfer, training).
28 REDET is the Programme of the Political Science and Public Administration in the Faculty of Arts of the University of Dar es Salaam. See Mwananchi No. 02732of 5th December 2007 for the latest release of POP findings “Government popularity falling down” 29 For additional information visit http://www.edi-africa.com CWIs reports also available at LGRP and PMO-RALG
Corruption Perception Surveys Report: TANZANIA 2008
23
The UBI data are used to construct six indicators that capture different dimensions of the magnitude and impact of problem as follows30: i. Incidence: This ranks an organization/department according to the likelihood
(probability) that a person visiting the organization/department will be asked, or feel it is necessary, to offer a bribe.
ii. Prevalence: This ranks organizations/departments in order of the percentage of population affected by bribery in them.
iii. Severity: This captures the level of impunity, that is, whether service is denied for declining to bribe.
iv. Frequency: This ranks organizations/departments according to the level of bribery activity, measured by the average number of bribes paid per person per year.
v. Cost: This ranks organizations/departments according to the estimated proceeds from bribes, and can be interpreted as the “bribery tax” per adult citizen.
vi. Size: This ranks organizations/departments according to the average size of bribes paid, and is reflective of the cost to the individuals who pay the bribes.
1.4 PROMOTION OF GOOD GOVERNANCE AND ANTI-CORRUPTION: EFFORTS AND TRENDS
Efforts to promote good governance and checking of corruption are not new in Tanzania. A historical epoch observation traces these efforts from the pre-colonial era, during colonial and post-independence periods. Pre-colonial to colonial epoch There is evidence showing that corruption existed in communities during the medieval Tanzania. This is vindicated by vernaculars across tribes with translation of corruption in tribal dialectics not connected to alien languages originating from contacts with the colonialists. Amongst the Wachagga (sile), Wamatumbi (luboko), Wagogo (rusuo), Wahaya (kyemenyo) and Wapare (mbuta), to mention only a few ethnic groups in Tanzania, do have the local, non-Kiswahili-connected linguistic for corruption. This infers to existence of corruption in the early Tanzanian societies even before advent of colonial rule; formation and influence of modern state. The British colonialists, in the mid 1930’s, had to amend the penal code so as to criminalise acts of corruption, which were rampant at the time. Also, latter in 1958, the British colonial government again had to enact the Prevention of Corruption Ordinance, Chapter 400, in response to rampant acts of corruption. Receiving
30 This section is derived from The Kenya Bribery Index 2004 report available at Transparency International-Kenya http://www.tikenya.org/
Corruption Perception Surveys Report: TANZANIA 2008
24
commissions and rewards by civil servants in the colonial public offices were declared offences under the law and therefore outlawed31. The post-independent epoch, 1961-1995 Corruption was one of the challenges facing Tanzania immediately after independence. The political leadership, social service delivery and administration of justice were invariably challenged. Amongst other measures, the Government responded by drafting the Bill in 1971 to enact the Prevention of Corruption Act (PCA) No. 16 of 1971. Later in 1975, through Government Notice (GN) Number 17, the Government established the National Anti-corruption Squad, which was later in 1991 transformed into the Prevention of Corruption Bureau32 (PCB) after amending the PCA and the GN No. 17. However, the PCA was narrow, confining corruption in the public sector alone – recognising only four corruption offences33. The offences, as noted under the PCA, are giving and receiving, attempting to give or receive bribes; use of documents intended to mislead principal; public officer obtaining advantage without consideration or inadequate consideration; and being in possession of property obtained corruptly (ESRF/FACEIT, 2002:30).
An analysis of efforts and policy decisions taken during the period indicates two salient features; firstly, that the Government was the sole role player in the anti-corruption field, and secondly, that legislation is seen as the only Government strategy to combat corruption and promote good governance.
In 1966 the law to establish the Office of Permanent Commission of Inquiry (Ombudsman) was enacted, and in 1983/4 the law to control Economic Sabotage and Organised Crime was enacted34.
Observation: establishment of the legal and institutional framework to fight corruption is the only remarkable anti-corruption achievements by 1995.
The period between 1995 and 2005 Corruption was the powerful political election campaign agenda of Benjamin William Mkapa, who won the presidency in the 1995 general elections. Immediately after the elections, President Benjamin William Mkapa appointed the Presidential Commission
31 NATPP phase one report available at ForDIA and PTF website, http://www.partnershipfortransparency.info/uploads/completed%20projects/natppannualprogressreport2005%20Main%20text%2016may06.pdf 32 PCB was since placed in the President’s Office, and mandated to investigate, apprehend and prosecute corruption offences; conduct operational research to inform analyses and building of corruption data base; and undertake community education to mobilise and empower the general public fighting against corruption. 33 Restated in the 2002 Annual report, pg. 30: The State of Corruption in Tanzania compiled by ESRF and FACEIT 34 The Economic Sabotage and Organised Crime Act was Government response to public hording against then rationing policy for scarce goods and services due to post Uganda war economic crisis, early 1980s.
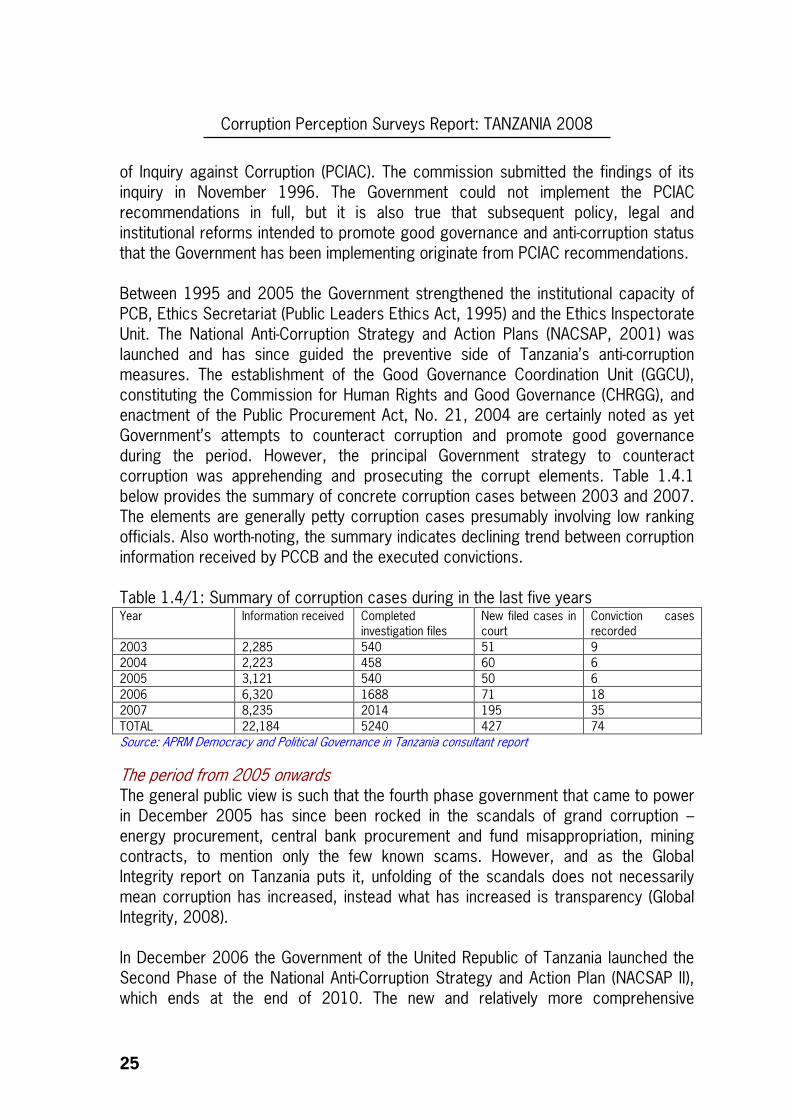
Corruption Perception Surveys Report: TANZANIA 2008
25
of Inquiry against Corruption (PCIAC). The commission submitted the findings of its inquiry in November 1996. The Government could not implement the PCIAC recommendations in full, but it is also true that subsequent policy, legal and institutional reforms intended to promote good governance and anti-corruption status that the Government has been implementing originate from PCIAC recommendations. Between 1995 and 2005 the Government strengthened the institutional capacity of PCB, Ethics Secretariat (Public Leaders Ethics Act, 1995) and the Ethics Inspectorate Unit. The National Anti-Corruption Strategy and Action Plans (NACSAP, 2001) was launched and has since guided the preventive side of Tanzania’s anti-corruption measures. The establishment of the Good Governance Coordination Unit (GGCU), constituting the Commission for Human Rights and Good Governance (CHRGG), and enactment of the Public Procurement Act, No. 21, 2004 are certainly noted as yet Government’s attempts to counteract corruption and promote good governance during the period. However, the principal Government strategy to counteract corruption was apprehending and prosecuting the corrupt elements. Table 1.4.1 below provides the summary of concrete corruption cases between 2003 and 2007. The elements are generally petty corruption cases presumably involving low ranking officials. Also worth-noting, the summary indicates declining trend between corruption information received by PCCB and the executed convictions. Table 1.4/1: Summary of corruption cases during in the last five years Year
Information received Completed investigation files
New filed cases in court
Conviction cases recorded
2003 2,285 540 51 9 2004 2,223 458 60 6 2005 3,121 540 50 6 2006 6,320 1688 71 18 2007 8,235 2014 195 35 TOTAL 22,184 5240 427 74 Source: APRM Democracy and Political Governance in Tanzania consultant report
The period from 2005 onwards The general public view is such that the fourth phase government that came to power in December 2005 has since been rocked in the scandals of grand corruption – energy procurement, central bank procurement and fund misappropriation, mining contracts, to mention only the few known scams. However, and as the Global Integrity report on Tanzania puts it, unfolding of the scandals does not necessarily mean corruption has increased, instead what has increased is transparency (Global Integrity, 2008). In December 2006 the Government of the United Republic of Tanzania launched the Second Phase of the National Anti-Corruption Strategy and Action Plan (NACSAP II), which ends at the end of 2010. The new and relatively more comprehensive
Corruption Perception Surveys Report: TANZANIA 2008
26
legislation; the Prevention and Combating of Corruption Act (PCCA) No 11 of 2007 with 24 corruption offences, was enacted during the first quarter of 2007. The Prevention of Corruption Act (PCA) of 1971 was repealed by the new law. The oversight role of the Auditor and Controller General (CAG) has been strengthened, and the Financial Intelligence Unit (FIU) has been established at the Ministry of Finance and Economic Affairs with legal mandate to inhibit money laundering. The Government has been revisiting the Public Leadership Code of Ethics Act in response to the State House policy directive to stop mingling public and private business interests meant to allay the risk of “conflict of interest”. Moreover plans are underway to review and amend the Political Parties Act No 5 of 1992 and the National Elections Act No. 1 of 1985 in order to control money in politics, including political campaigns and political party funding. The Whistle Blowers Protection Bill and the Freedom of Information Bill are in the pipeline (GGCU, 2008). The project for Strengthening Anti-Corruption Strategies in Tanzania (SACST) meant to strengthen the national integrity institutions (PCCB, DPP, and GGCU), the Parliament, the Judiciary, NSAs and the core policy reforms has been launched. Other projects put up in order to augment the implementation of NACSAP II are as noted below;
i. The Accountability, Transparency and Integrity Project (ATIP) - 2007-2017 ii. Ethics, Accountability and Transparency Project (Facility) 2007-2010 iii. The National Governance and Corruption Survey - 2008 iv. Millennium Challenge Account Project - 2006 - 2008 v. Deepening Democracy in Tanzania - 2007-2010 vi. Tackling Corruption Project - 2008 - 2012 vii. The APRM process 2008 – 2009 viii. Construction Sector Transparency Initiative (CoST)
Moreover, the URT Government has signed the Partnership Framework Memorandum (PFM) governing General Budget Support35 (GBS) for implementation of MKUKUTA (MoFEA, 2006). The terms of Performance Assessment Framework (PAF) for GBS agreed between the Government and development partners are intentional to enhance good governance and integrity in the budgetary allocations predefined by MKUKUTA and MDGs. Furthermore, there are six key areas of GBS performance (PAF) earmarked for concurrent implementation to improve good governance standard. The said areas are the 3 Clusters of MKUKUTA – growth and reduction of income poverty, improvements of quality of life and social well being and governance and accountability; Resource allocation and budget consistency; Public financial management; and Macroeconomic stability. 35 14 DP members signed the PFM for GBS: African Development Bank, Canada, Denmark, EU, Finland, Ireland, Japan, Germany/KfW, The Netherlands, Norway, Sweden, Switzerland, United Kingdom and World Bank
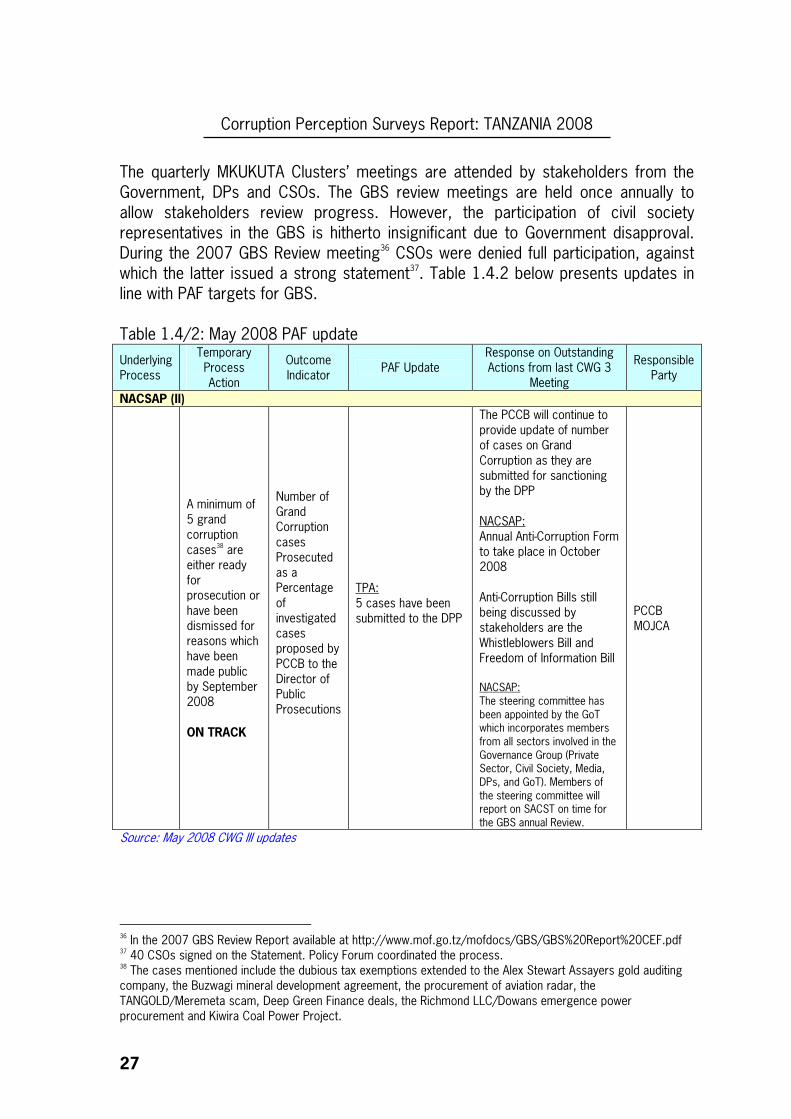
Corruption Perception Surveys Report: TANZANIA 2008
27
The quarterly MKUKUTA Clusters’ meetings are attended by stakeholders from the Government, DPs and CSOs. The GBS review meetings are held once annually to allow stakeholders review progress. However, the participation of civil society representatives in the GBS is hitherto insignificant due to Government disapproval. During the 2007 GBS Review meeting36 CSOs were denied full participation, against which the latter issued a strong statement37. Table 1.4.2 below presents updates in line with PAF targets for GBS. Table 1.4/2: May 2008 PAF update
Underlying Process
Temporary Process Action
Outcome Indicator
PAF Update Response on Outstanding Actions from last CWG 3
Meeting
Responsible Party
NACSAP (II)
A minimum of 5 grand corruption cases38 are either ready for prosecution or have been dismissed for reasons which have been made public by September 2008 ON TRACK
Number of Grand Corruption cases Prosecuted as a Percentage of investigated cases proposed by PCCB to the Director of Public Prosecutions
TPA: 5 cases have been submitted to the DPP
The PCCB will continue to provide update of number of cases on Grand Corruption as they are submitted for sanctioning by the DPP NACSAP: Annual Anti-Corruption Form to take place in October 2008 Anti-Corruption Bills still being discussed by stakeholders are the Whistleblowers Bill and Freedom of Information Bill NACSAP: The steering committee has been appointed by the GoT which incorporates members from all sectors involved in the Governance Group (Private Sector, Civil Society, Media, DPs, and GoT). Members of the steering committee will report on SACST on time for the GBS annual Review.
PCCB MOJCA
Source: May 2008 CWG III updates
36 In the 2007 GBS Review Report available at http://www.mof.go.tz/mofdocs/GBS/GBS%20Report%20CEF.pdf 37 40 CSOs signed on the Statement. Policy Forum coordinated the process. 38 The cases mentioned include the dubious tax exemptions extended to the Alex Stewart Assayers gold auditing company, the Buzwagi mineral development agreement, the procurement of aviation radar, the TANGOLD/Meremeta scam, Deep Green Finance deals, the Richmond LLC/Dowans emergence power procurement and Kiwira Coal Power Project.
Corruption Perception Surveys Report: TANZANIA 2008
28
The role of NSAs The term Non-State Actors (NSAs) is used to explain a terrain of governance actors operating outside the government domain. NSA is in itself not a formal institution but a pro-good governance alliance of organisations and individuals from civil society, private/corporate sector and the media. It is noted in this report that until 2003 corruption was an exclusive domain of Central Government. Only the media, though inadequately too, could investigate and report on mere petty corruption cases. The media, with information that creates and maintains public awareness, ideally dominated by state through a number of strategies, has remained crucial even before independence. Only a few state controlled media outlets existed between 1965 and 1992 when Tanzania was a one party state. The Media Bill that the Government drafted in 1993 to control the media39 was vehemently opposed by a handful but strong independent media professionals and emerging pro-democracy elements. By 2006 private media had grown to more than 785 publications40 – newspapers, in-house publications, and periodicals, including 14 active dailies and more than 20 weeklies. About 33 radio stations and nine television stations, including 16 cable networks, most of them broadcasting in Dar es Salaam and a few other urban areas exist on the Mainland Tanzania. All radio and television stations are privately owned except the Tanzania Broadcasting Corporation (TBC) radio and television outlets. The Newspaper legislation of 1976 bestows powers to the Government Minister to control the media. The Media Council of Tanzania (MCT) that formally started to operate in 1996 has been instrumental, supporting the media to promote transparency and expose corruption. In 2006 MCT successfully halted another Government attempt to enact the law to control freedom of information in Tanzania. Tanzania National Media Policy was published since 2005. The current Tanzania media trend has been the emergence of investigative journalists and tabloids41 with specific editorial policy to expose and report on corruption. This has resulted into increasing public confidence in the media reports. The ESRF/FACEIT report of 2002 notes that 60 to 66 percent of the respondents interviewed were confident in the role of the media as frontline fighters against corruption42; feeding the public with credible messages to create awareness about corruption in the country (TI, 2003:26). However, the media have sustained many challenges including the legal constraints, poor working environment, lack of commitment to fight corruption on the part of some media owners, and poor rural-urban information networks.
39 Ndimara Tegambwage, a senior journalist, press freedom activist and then amongst leaders of pro-democracy pressure groups, mobilized journalist to oppose the Media Bill the effect of which resulted into formation of the current self regulation none-statutory Media Council of Tanzania (MCT). The state Media Bill amongst other regulatory strategies intended to establish the statutory Media Council to regulate media activities in the country. 40 World Association of Newspapers – World Press Trends 2007, page 688 41 The weeklies This Day, Kulikoni and MwanaHalisi, registered in 2006, are noted. 42 Quoted from the Transparency International National Integrity Systems Country Study Report for Tanzania 2003.
Corruption Perception Surveys Report: TANZANIA 2008
29
The civil society in its broadest sense; trade union, cooperatives, inter-faith-based organisations, community-based organisations and the thematic non-governmental organisations have been instrumental in promoting good governance and counteracting corruption in Tanzania. The trade union and cooperative movements are on record for their struggles against colonialism, and latter, promotion of good governance and anti-corruption in Tanzania. The documented evidence about the theme-based contemporary civil society organisations, NGOs inclusive, indicates rapid growth from an estimated 100 or less registered CSOs/NGOs by mid- 1980s, rising to over 200 in early 1990s, over 2,700 by 2000 and over 400043 by 2007 (FCS and UDSM, 2008:19). The increasing quantitative trend of civil society since mid 1990s is associated with their overly involvement in promoting good governance and fight corruption. The United National Development Programme (UNDP) had, in 2004, funded about 13 CSOs to carry out various project activities44. The Partnership for Transparency Fund (PTF)45 had also, during the same period, funded about 4 CSOs to carry out governance promotion and anti-corruption project activities, including PETS, research and advocacy (PTF, 2006). The Legal and Human Rights Centre (LHRC), has during the last seven years, done and documented recommendable reports, including leading public litigations, following up and reporting on acts of human rights violations – event-specific and on the annual basis. The inter-faith organisations have at different occasions, issued strong statements condemning corruption and poor governance practices in public institutions46. By way of carrying out training and advocacy activities based on findings from research, CSOs have, painstakingly, supported the on going core policy reforms in Tanzania, especially the LGRP, LSRP and NACSAP. Paradoxically, some CSOs have themselves been accused of facilitating corruption (TI, 2003:27). The report of the 11 member Presidential Advisory Committee on Reviving and Advancing Cooperatives, appointed after the national cooperative revival conference47 in Mwanza, published in 2001, cited corruption and poor governance as key reason for cooperative failures in Tanzania (Ministry of Cooperatives and marketing, 2001). The once strong cooperative societies (movement) are virtually weak and rocked into corruption and the public strongly feels the state is involved.
43 The literature gives contradictory figures, partly because of definitional problems and the fact that NGOs/CSOs [and CBOs] are registered in at least six different places and under different laws. Mushi and Killian (2002) gave an estimate of 4,000 by 2001 which was probably on the high side by then. Kiondo’s (2001) estimate put the number of NGOs at 3,700, and estimates by Ndumbaro and Mvungi (2007:21) put the figure for NGOs at 3,880. 44 The CSOs groups were funded under NACSAP I as strategy to bring civil society into the scheme. 45 Through online communication and negotiation PTF funded governance project activities for RIRA, VETO, PORIS and ForDIA. 46 Between 1994 and 2008 CCT, TEC and BAKWATA issued timely strong statements concerned with governance deterioration 47 The conference was convened by then President Benjamin Mkapa on 24th-25th March 2000 to chart out way forward to revive erstwhile dwindling cooperatives.
Corruption Perception Surveys Report: TANZANIA 2008
30
Generally, the civil society sector is still nascent and weak, which partly explains the existence of a weak social movement in the country. Civil society in the country is still characterised by networks defined by geopolitical divisions and functional themes i.e. education, human rights, gender and HIV/AIDS. There are no clearly discernible anti-corruption networks or movement in the country. Weak institutional capacity – poor knowledge, skills and experience base – is noted as being the key exogenous causal factors for the failures of civil society to attain strong internal governance structures, financial sustainability and public support. This has in turn, undermined the legitimacy of CSOs to mastermind strong anti-corruption networks and social movements. Moreover, the Non-Governmental Organisations Act (No.24 of 2002) is too narrow to help civil society grow into strong anti-corruption social movements. Similarly, the private sector in Tanzania is also nascent, suffocated by red-tapping, and struggling to emerge, survive and grow, and therefore still too weak to withstand corruption. Some principal elements in the private sector are conventionally known as significant corruption actors standing on the supply side of corruption in a supply-demand conceived equation. There is strong perception amongst the general public that a significant number of Foreign Direct Investments have tended to supply corruption to key Government officials. However, the Tanzania Chamber of Commerce, Industry and Agriculture (TCCIA)48 have been vocal and have come out with a clear strategic plan to counteract corruption. Local Government Authorities (LGAs) The local government system in the country is based on Articles 145 and 146 of the National Constitution. There is a uniform system of local government based on Acts 7, 8, 9, 10 and 11 as amended from time to time. The Regional Administration Act No. 6 of 1999 provides for, among other things, a relationship between the central and local government (TI, 2003:28). During the pre-colonial era, Tanzania had a system of local government in most communities that was based on councils of elders. These councils deliberated on important matters that affected tribal security and welfare including serious diseases, famine, environmental conservation, and management of wild animals. There are certain elements of local government in Tanzania today which can be traced back to the period of colonial administration (Liviga, 2007). With the onset of German colonial rule the country was ruled “Directly” but the colonial government introduced limited local government in some urban areas mainly to address issues of concern to the expatriate community. The British government introduced the Native Authorities, which were not democratically constituted and which were groomed to prop the colonial system. 48 TCCIA is a party in the NACSAP Triangular Partnership Programme (NATPP) launched by ForDIA October 2004 and a member of the NSAs Committee for implementing NACSAP II also coordinated by ForDIA, February 2007.
Corruption Perception Surveys Report: TANZANIA 2008
31
A comprehensive system of Local Government was introduced in 1953 with the passing of the Local Government Ordinance that established Municipal, Town and District Councils (PMORALG). The Ordinance had racial overtones with voters being compelled to vote for three candidates: an African, a European and an Asian in each constituency. In urban areas services were provided on racial lines. Since independence in 1961, local governance in Tanzania can be divided into four major phases as follows: i. The first decade of independence (1961–1971) during which chiefdoms were
abolished to consolidate independence and nationhood, a revolutionary system of socio-economic development known as Ujamaa-socialism was introduced and, which among other things, involved the re-organization of rural settlements into communal villages and the supremacy of the one Party in all aspects of political and economic life of the country.
ii. The Decentralization period (1972-1982), which was characterized by the abolition of local governments (66 district councils and 15 urban councils), and the merging of the central and local government functions49. According to official government explanation, the aim was to decentralize power to the population by involving the population in planning, which was to be centrally coordinated.
iii. The re-instatement of Local Governments (1983/84 – 1995) was done through the instigation of the ruling “Chama cha Mapinduzi” political party leading to the establishment of Village Councils, Township Authorities and District Councils in the rural areas and Town, Municipal and City Councils as Local Authorities in urban areas through a series of Acts50.
iv. The reform period (1996 to-date); The Local Government Reform Agenda (URT, 1996) and the Policy Paper on Local Government Reform (URT, 1998) are important policy documents to understand (study) the local council governance oversight role in Tanzania. The Local Government Policy Paper notes that local government would be free to make policy and operational decisions consistent with the laws and government policies. The Policy Paper mentions that the local
49 It was not local governments only that were abolished in 1972; the once strong cooperative unions were also abolished, and re-introduced back in 1984. Studying the combined impact of trends in both the weak local governments and cooperatives could appropriately inform policy option. Having recollected his previous mistakes, Founder of the Nation, Julius K. Nyerere, once remarked: “There are certain things I would not do if I were to start again. One of them is the abolition of Local Government, and the other is the disbanding of cooperatives... We had these two useful instruments of participation, and we got rid of them.” 50 Local Authorities in Tanzania were re-established in 1984 after several laws were passed in 1982 and 1983; i.e. i) The Local Government (District Authorities), Act 1982 (Act No.7 of 1982).ii) The Local Government (Urban Authorities), Act 1982 (Act No. 8 of 1982). iii) The Local Government Finance Act, 1982 (Act No.9 of 1982). iv), The Local Government Service Act, 1982 (Act No.1 0 of 1982). v) The Urban Authorities Rating Act, 1983 (Act No.2 of 1983). Moreover, these laws had been consistently amended in 1992, 1993, 1999, 2002, 2004 and 2006
Corruption Perception Surveys Report: TANZANIA 2008
32
government system is to be based on political devolution and decentralization of functions and finances (ibid.).
Although the grassroots elections are competitive, involving all, including the ruling party, Chama Cha Mapinduzi (CCM), the elections are directly controlled and managed by central government, [de facto the ruling party], under the ministry responsible for local government, which has tended to oscillate between the Prime Minister’s Office and the President’s Office. Unlike grassroots elections, ward councillors, the local government political representatives (leaders), are elected during the normal general elections calendar, managed by National Electoral Commission (NEC). The LGAs legal set up is such that, unlike wards, village councils are corporate bodies (Act No.7 of 1982) guaranteed by law to continued existence (Ngware and Haule, 1993). LGAs, as a governance system are noted by Warioba Commission (1996) for being tarnished by corruption. According to the report, corruption occurs in human resource management sector through bribery that takes place during staff recruitment, promotions and deployment; land allocation and issuing of business trading licenses; in the award of tenders; allocation of plots and marketing stocks; and in the procurement of goods and services. Following the report by the Warioba Commission, LGAs have taken a number of anti-corruption measures, consistent with the reforms carried out within the LGRP, and the NACSAP II51 framework. However, social service delivery has not yet been expanded, improved and liberalized enough to reduce incidences of corruption in education, health land allocation and administration of justice in the LGAs geopolitics (TI, 2003:29). The past and latest reports of the Controller and Auditor-General provide ample evidence implicating LGAs in that regard. Corruption in the electoral process Political corruption, which due to its nature, has in recent years been referred to as “state capture”, is by and large synonymous to grand corruption. Although the CPS tools were not designed to capture issues of grand corruption, and therefore political corruption, it is worth-noting that in the future, CPS expands to encompass assessment of political corruption indicators in the LGAs. Prince Bagenda, in his interim report to PTF,52 notes the need to expand governance research with a focus on political corruption (PORIS, 2004:8), which in effect starts with corruption in the electoral process.
51 LGAs have to design and implement their own anti-corruption plans as spelled out in the NACSAP II document. 52 PTF had in 2004 funded the project proposed by the African International Group of Political Risk Analysis (PORIS) to conduct research on Corruption in the Electoral Process.
Corruption Perception Surveys Report: TANZANIA 2008
33
Gender dimension of promoting governance and anti-corruption The gender dimension of governance and corruption is basically a description of social service delivery in relation to gender. Evidence based on empirical literatures indicates ‘gender’ as a factor for organising division of labour, control over resources and decision making. The women-men dichotomy places corruption in a gender-specific experience, which is expected to affect men and women differently. Women and men are subjects and objects of different corrupt practises and behaviour (Maaria Seppänen and Pekka Virtanen, 2008)53. Both Government and gender activists support the mainstreaming of gender policy destined to increase the number of women in decision-making positions. However, empirical revelations indicate the contrary. It is eventually concluded that putting in place mechanisms of accountability within the political system is more important in fighting corruption than increasing the number of women decision-makers. This conclusion is based on observations that in countries where the levels of corruption declined due to increasing the number of women in the higher positions of power it was due to the fact that such opportunities for women tend to be commensurate with a social and political structure that is generally more open and accountable towards all social groups, including women. That it is actually the presence of liberal democratic institutions which promote both gender equality and good governance that is the factor at play in reducing corruption. Increasing the number of women in public office alone does not resolve the problem of corruption. The relatively high percentage of women in parliament or the high proportion of women in the justice department does not seem to have changed the corruption status of Tanzania. As gender is always a social construction, the differences between men and women in their attitudes and behaviour towards corruption are more likely to reflect their social roles, powers and positions. Many women-rights focused organisations and networks are implementing the health, education, land, budget and HIV/AIDS projects; carrying out anti-corruption and good governance advocacy for improved delivery of social services. The Tanzania Gender Networking Programme (TGNP) is implementing the Gender Budget Initiative (GBI) project and the HIV/AIDS resources campaign project intended to attain equitable redistribution of resources to users of social service delivery. Gender equity is seen as rationale for almost all projects that TGNP has been implementing. Women’s Dignity Project (WDP) is involved in advocacy and capacity-building supporting women to address the Fistula malady, and other maternal health services perturbing many women in the country. The Tanzania Media Women’s Association (TAMWA) is currently implementing the advocacy campaign addressing corruption in allocations of plots and land management generally. Although it is generally felt that there is inadequate 53 Maaria Seppänen and Pekka Virtanen are the authors of Corruption, Poverty and Gender with Case Studies of Nicaragua and Tanzania, for the Ministry of Foreign Affairs, Finland
Corruption Perception Surveys Report: TANZANIA 2008
34
good governance; transparent information flow and accountability in the management of HIV/AIDS resources, no meaningful anti-corruption advocacy project has been executed to the effect.
1.5 OBJECTIVES OF THE CORRUPTION PERCEPTION SURVEYS The survey is broadly dedicated to promote increased dialogue between the political bureaucracies and leadership, on one hand and civil society and private sector stakeholders on the other hand, in order to attain the following objectives: i. To measure the magnitude and comprehensive picture of corruption across
villages, wards, constituency and districts in the country, in effect augmenting efforts initiated to promote good governance and fight corruption at all levels.
ii. To create civic awareness, knowledge and skills (competence) amongst the electorate at the grassroots level of society by encouraging the citizenry to hold the government at their level accountable, through existing governance structures, but maintaining political stability, tolerance, peace and security.
iii. To encourage citizens’ participation in the development policy-making process by creating and maintaining trust, promotion of demand for accountability and strengthening stakeholders’ commitment towards improved information flow and transparency that will eventually act as a ‘deterrent’ to corruption.
iv. To share information and engage the community in open dialogues with LGAs so that the views of the citizens get reflected and influence development policy decisions, making LGAs responsive and accountable to public/users of social service delivery.
v. To promote transparency and encourage openness in the LGAs, build ownership of development policy decisions and social development programmes/projects.
vi. To nurture and empower, through capacity-building and collaboration, the LGAs-based CSOs whose capacity-building support is crucial for supporting the respective NSAs-led dialogues given the findings of the CPS on governance and corruption status of LGAs.
vii. To promote the LGAs-based networks for good governance and anti-corruption involving activists and stakeholders supporting CPS project annual functions in the LGAs.
1.6 SIGNIFICANCE OF THE CORRUPTION PERCEPTION SURVEYS LGA is the unit of analysis of the survey in which the data are analysed across the service delivery sectors. The Analyses are used to assess perceptions of service users across sex, age, rural-urban divide, income and employment status as regards the quality and quantity of deliverables in health, education, energy, land allocation, administration of justice and business licenses. This is meant to find out the extent of public perceptions as regards the existence of corruption in the LGAs. The research findings will inform the series of LGAs-coordinated public dialogues. The dialogues will zero-in counteracting corruption in the public service delivery sectors perceived as
Corruption Perception Surveys Report: TANZANIA 2008
35
highly corrupt. CPS project host-organisations in the LGAs are charged with organising and coordinating the public dialogue forums and engaging strategic stakeholders in the LGAs to carryout CPS subsequent functions. The public dialogue forums will take the form of seminars, symposia, and workshops; media briefs, press conferences, press releases; and paying official visits to full council meetings, heads of departments and the office of the Executive Directors (DED) in the LGAs. The activities carried out following the CPS findings will inform the entire monitoring and evaluation (M&E) system of the project. Equally important, the surveys findings will also be used by public and investigative media to report about the status of corruption in the country. The national integrity system bodies; PCCB, the police, the Commission for Human Rights and Good Governance, GGCU and the Ethics Secretariat will use the surveys findings to evaluate the impact of core policy reforms (LSRP, LGRP, PFMRP, PSRP and NACSAP II). Moreover, development partners will most likely find the surveys findings as useful input for engagement with Government on the MKUKUTA/GBS PAF. The findings are also expected to immensely contribute to professional and activist engagements; research, training, lobbying and advocacy activities involving such entities as human rights groups, broad policy reform groups, PETS coalitions, private sector groups and others in Tanzania and beyond. The quality, quantity and pattern of social service delivered by LGAs are intended to change from the conditions perceived undesirable to better ones. LGAs are expected to adjust and transform into the accountable and transparent governance structures consistent with CPS recommendations and LGRP targets. 1.7 METHODOLOGY The simultaneously standard survey instruments, namely qualitative and quantitative methods were used to conduct the study. The quantitative instruments comprised two categories of questionnaire; household and key informant questionnaires. Both questionnaires are very long and loaded so as to extract enough data. The household questionnaire has 39 principal probing items while the key informant questionnaire has similar 38 items.
Focus-Group Discussions were used to explore the corruption perceptions of ordinary people. The basis of analysis was the personal experiences in relation to accessibility; quality and quantity of social services delivery, which eventually help to explain the responsiveness and accountability of existing governance structures, or behaviour of governance systems in LGAs. Social services delivery is the foundation of CPS assessment, focussing on health, education, land allocation, administration of
Corruption Perception Surveys Report: TANZANIA 2008
36
justice, business licensing, HIV/AIDS resources, functions of cooperative societies’ and civil (road) construction.
The quantitative method used included questionnaires, which were used in conducting face to face interviews with key informants and individual households’ members. Interviews with key informants explored institutional specific determinants of corruption (bribery, nepotism, negligence, fraud and embezzlement), accountability and transparency. The household questionnaires used a combination of open and closed questions from which respondents selected responses that best matched their views or experiences; giving inference on corruption in the LGAs. The use of questionnaire to extract perceptions is rationalised by citizens’ role as intended ultimate users of public services, abiders of law and regulations, and clients of licenses and permits. Desktop research (literature review) has augmented the study with is additional data and information.
Quantitative data was analysed by the SPSS package, whereas qualitative data transcripts were translated into the social service delivery categories that LGAs are mandated to provide. Analysis from focus group discussions has been noted, given tentative titles, and grouped with demonstrative quotes from participants’ views along with preliminary interpretations. The analyses on the themes were clarified, refined and summarized for infusion into the quantitative data analysis.
1.7.1 SAMPLE SIZE AND DESIGN The regions included in the sample are Kagera, Shinyanga, Mtwara, Ruvuma, Mbeya, Morogoro, Lindi and Coast. LGAs were not sampled since the survey intended to accommodate all LGAs available in a region. Fifty (50) LGAs were earmarked for study during the first year of study. Tanzania population census data (2002) was used to design the CPS sample. The survey sample size was 400 key informants plus 1200 households; 8 key informants and 24 household respondents in every LGA. A total of 250 focus groups were planned targeting 5 focus group discussions per LGA. The sample is considered adequately representing the whole population in the LGAs covered by the survey – men and women, children, the youth, elders and the vulnerable social groups. Variables used/considered in the selection of sample units in urban, semi-urban or rural areas include availability of time, transport and communication facilities (physical accessibility), availability of core social service facilities and proximity to economic and administrative centres. To that effect, the research survey adopted the methodology, which is largely practical, i.e. the mixture of convenient, judgement, purposeful and systematic random sampling techniques.
Corruption Perception Surveys Report: TANZANIA 2008
37
Household surveys were conduced by means of ‘face to face’ interviews; respondents were selected randomly by the interval method from both urban and rural areas – 2 streets or 2 villages54 – in one ward in an LGA. The sample comprised 12 respondents chosen from one street or village, totalling 24 respondents who were interviewed from one ward in each LGA. Respondents were both men and women at or above the age of 18 years in the household. One person was interviewed from one household after every 50th houses in the selected streets in urban areas. In the rural areas one person was interviewed from one household per neighbourhood in the sampled neighbourhoods of the sampled villages.
Key informants were conveniently selected for interviews from the same wards, which were sampled for household questionnaire administration, in a cluster-like sampling pattern especially in rural areas. The survey also relied on systematic random sampling techniques in urban and semi-urban areas. The contacts for interviews relied on availability of leadership in the departments or institutions, across the board of social and political spectrum, with leaders above the age of 18 years.
Participants in Focus Group Discussions (FGDs) were selected on the basis of the judgement and convenience of respective heads; teachers, ward or village leaders, employers and opinion leaders. Students’ groups targeted secondary schools in rural or urban areas, involving students from form I to form VI over the age of 16 years. Pupils were drawn from amongst standard 5 to 7 with the age bracket ranging between 12 and 17 years. Female and male groups were targeted and selected from amongst the adults over the age of 18 years in urban, semi- urban or rural areas. The employees’ focus groups were targeted and selected from amongst the public and private sector employees, aged 18 years and above, in urban and semi-urban areas. Surveys data were collected from 7 regions, 35 LGAs, 35 wards, 70 streets/villages. Data collection from the Coast region was later dropped due to logistical mishap. The list of LGAs, wards, and villages/streets in which the data were collected is indicated in table 1.7.1/1 below. Data from the field was collected by strategically targeted, selected, recruited, contracted, trained and deployed assistants from LGAs-based host organizations or networks. The fieldwork activities were conducted for three months (mid February-mid May 2008).
54 The definition of the area coverage of the village or street is consistent with the LGA law that mandates and determines geopolitical boundaries of the governing authorities in either case.
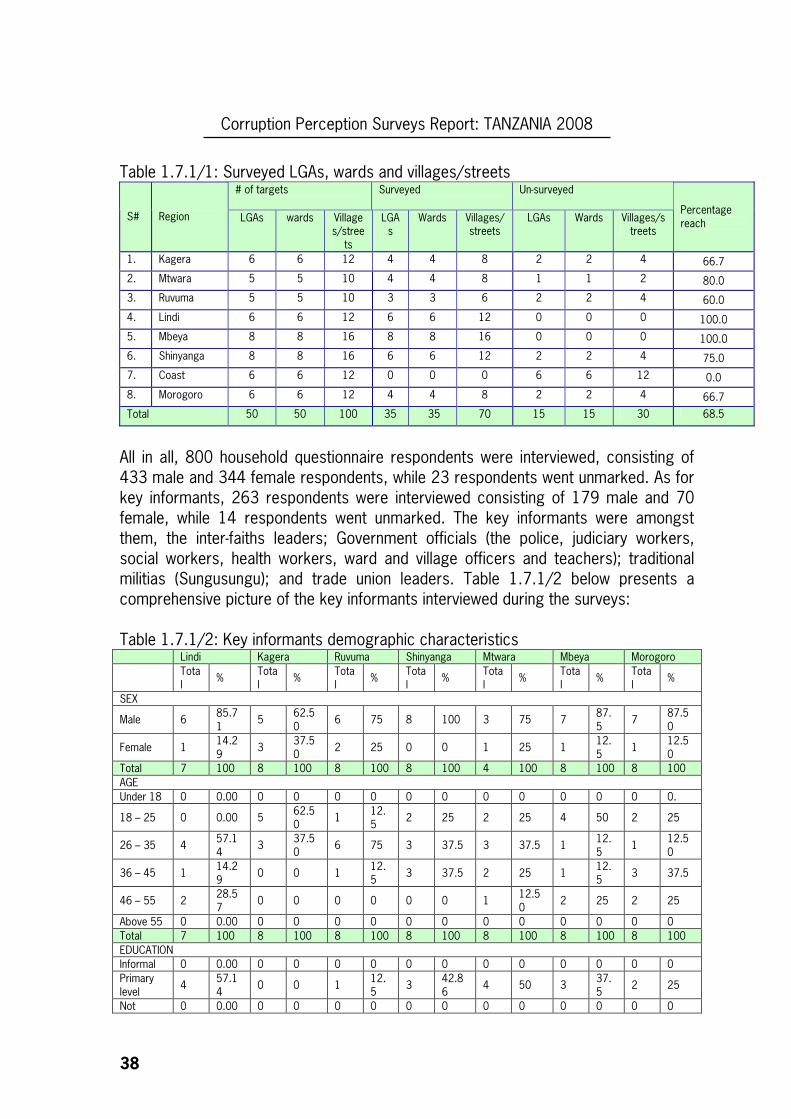
Corruption Perception Surveys Report: TANZANIA 2008
38
Table 1.7.1/1: Surveyed LGAs, wards and villages/streets # of targets
Surveyed
Un-surveyed
S# Region LGAs wards Villages/stree
ts
LGAs
Wards Villages/streets
LGAs Wards Villages/streets
Percentage reach
1. Kagera 6 6 12 4 4 8 2 2 4 66.7
2. Mtwara 5 5 10 4 4 8 1 1 2 80.0
3. Ruvuma 5 5 10 3 3 6 2 2 4 60.0
4. Lindi 6 6 12 6 6 12 0 0 0 100.0
5. Mbeya 8 8 16 8 8 16 0 0 0 100.0
6. Shinyanga 8 8 16 6 6 12 2 2 4 75.0
7. Coast 6 6 12 0 0 0 6 6 12 0.0
8. Morogoro 6 6 12 4 4 8 2 2 4 66.7
Total 50 50 100 35 35 70 15 15 30 68.5
All in all, 800 household questionnaire respondents were interviewed, consisting of 433 male and 344 female respondents, while 23 respondents went unmarked. As for key informants, 263 respondents were interviewed consisting of 179 male and 70 female, while 14 respondents went unmarked. The key informants were amongst them, the inter-faiths leaders; Government officials (the police, judiciary workers, social workers, health workers, ward and village officers and teachers); traditional militias (Sungusungu); and trade union leaders. Table 1.7.1/2 below presents a comprehensive picture of the key informants interviewed during the surveys: Table 1.7.1/2: Key informants demographic characteristics Lindi Kagera Ruvuma Shinyanga Mtwara Mbeya Morogoro
Total
% Total
% Total
% Total
% Total
% Total
% Total
%
SEX
Male 6 85.71
5 62.50
6 75 8 100 3 75 7 87.5
7 87.50
Female 1 14.29
3 37.50
2 25 0 0 1 25 1 12.5
1 12.50
Total 7 100 8 100 8 100 8 100 4 100 8 100 8 100 AGE Under 18 0 0.00 0 0 0 0 0 0 0 0 0 0 0 0.
18 – 25 0 0.00 5 62.50
1 12.5
2 25 2 25 4 50 2 25
26 – 35 4 57.14
3 37.50
6 75 3 37.5 3 37.5 1 12.5
1 12.50
36 – 45 1 14.29
0 0 1 12.5
3 37.5 2 25 1 12.5
3 37.5
46 – 55 2 28.57
0 0 0 0 0 0 1 12.50
2 25 2 25
Above 55 0 0.00 0 0 0 0 0 0 0 0 0 0 0 0 Total 7 100 8 100 8 100 8 100 8 100 8 100 8 100 EDUCATION Informal 0 0.00 0 0 0 0 0 0 0 0 0 0 0 0 Primary level
4 57.14
0 0 1 12.5
3 42.86
4 50 3 37.5
2 25
Not 0 0.00 0 0 0 0 0 0 0 0 0 0 0 0
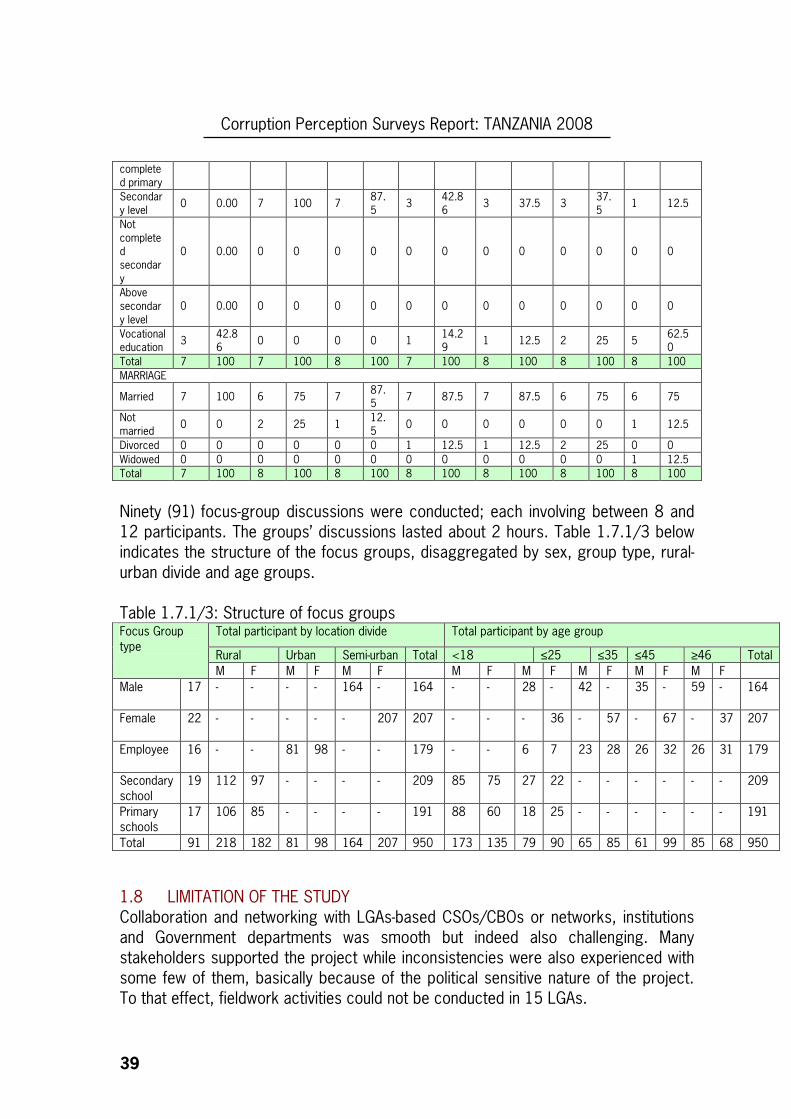
Corruption Perception Surveys Report: TANZANIA 2008
39
completed primary Secondary level
0 0.00 7 100 7 87.5
3 42.86
3 37.5 3 37.5
1 12.5
Not completed secondary
0 0.00 0 0 0 0 0 0 0 0 0 0 0 0
Above secondary level
0 0.00 0 0 0 0 0 0 0 0 0 0 0 0
Vocational education
3 42.86
0 0 0 0 1 14.29
1 12.5 2 25 5 62.50
Total 7 100 7 100 8 100 7 100 8 100 8 100 8 100 MARRIAGE
Married 7 100 6 75 7 87.5
7 87.5 7 87.5 6 75 6 75
Not married
0 0 2 25 1 12.5
0 0 0 0 0 0 1 12.5
Divorced 0 0 0 0 0 0 1 12.5 1 12.5 2 25 0 0 Widowed 0 0 0 0 0 0 0 0 0 0 0 0 1 12.5 Total 7 100 8 100 8 100 8 100 8 100 8 100 8 100
Ninety (91) focus-group discussions were conducted; each involving between 8 and 12 participants. The groups’ discussions lasted about 2 hours. Table 1.7.1/3 below indicates the structure of the focus groups, disaggregated by sex, group type, rural-urban divide and age groups. Table 1.7.1/3: Structure of focus groups
Total participant by location divide Total participant by age group
Rural Urban Semi-urban Total <18 ≤25 ≤35 ≤45 ≥46 Total
Focus Group type
M F M F M F M F M F M F M F M F Male 17 - - - - 164 - 164 - - 28 - 42 - 35 - 59 - 164
Female 22 - - - - - 207 207 - - - 36 - 57 - 67 - 37 207
Employee 16 - - 81 98 - - 179 - - 6 7 23 28 26 32 26 31 179
Secondary school
19 112 97 - - - - 209 85 75 27 22 - - - - - - 209
Primary schools
17 106 85 - - - - 191 88 60 18 25 - - - - - - 191
Total 91 218 182 81 98 164 207 950 173 135 79 90 65 85 61 99 85 68 950
1.8 LIMITATION OF THE STUDY Collaboration and networking with LGAs-based CSOs/CBOs or networks, institutions and Government departments was smooth but indeed also challenging. Many stakeholders supported the project while inconsistencies were also experienced with some few of them, basically because of the political sensitive nature of the project. To that effect, fieldwork activities could not be conducted in 15 LGAs.
Corruption Perception Surveys Report: TANZANIA 2008
40
A few public officials refused to disclose corruption-related information because they were of the opinion that that violated their employment code of confidentiality. In the same vein, due to fears of victimisation, some respondents felt too insecure to be interviewed, unless immediate bosses granted permissions. Moreover, due to lack of confidence, rationalised by patriarchy, some female respondents could not be interviewed unless permission was granted by husbands.
1.9 ORGANIZATION OF THE REPORT This report is organised in six sections as indicated below. The first section covers the Executive Summary in which a summary of the goal, methodology, major findings and recommendations are covered. This is followed by Chapter One, an introductory chapter of the report, setting the CPS conceptual framework, thus covering an overview of Tanzania country governance and corruption status, the rationale for public demand for good governance and accountability, various indicators for measuring good governance performance, efforts and trends to promote good governance and anti-corruption in Tanzania, objectives and significance of the CPS project, significance of the corruption perception surveys, methodological issues, including sample size design; and the limitations of the study. Chapter Two looks into factors influencing the governance and anti-corruption policy environment in Tanzania. Chapter Three draws and presents the CPS findings, principally based on the quantitative and qualitative data analysis. Chapter Four presents the recommendations based on the findings; lessons and policy implications. Annexes are attached to deepen the readers’ insight of the CPS findings.
Corruption Perception Surveys Report: TANZANIA 2008
41
CHAPTER TWO
2.0 FACTORS INFLUENCING THE GOVERNANCE AND ANTI-CORRUPTION POLICY ENVIRONMENT IN TANZANIA
The anti-corruption policy environment is a complex phenomenon involving interactions of different factors within and without a particular political system. It involves dynamic interactions of actors and factors involved in the country’s governance system. This policy environment is, thus, a complex scenario with multiple factors and institutions in the country’s governance system. The influence in which each actor has on the formulation and implementation of the country’s anti-corruption policy depends on the leverage, which a group of actors wields over others. This chapter discusses the main factors which influence the governance and anti-corruption policy environment in Tanzania. Both internal and external actors will be explored. 2.1 INTERNAL FACTORS Distribution /Balance of Powers within State Organs One of the basic tenets of democratic governance in a society is the existence of checks and balance system among the principal state organs. The checks and balance system of government entails separation of powers among the three branches of government (the Executive, Legislature and Judiciary) to deter abuse of power by any of the principal organs. The modern division of state power into executive, judicial and legislative powers owes its origin to the French, Political Philosopher, Montesquieu (1689-1755). In this regard, he posits thus:
‘’ when the legislative and executive powers are united in the same person or in the same body of magistrates, there can not be liberty, because apprehensions may rise, lest the same monarch or senate should enact tyrannical laws and execute them in tyrannical manner. Again, there is no liberty if judicial power be not separated from the legislative and executive. Were it joined with legislative, the life and liberty of subjects would be exposed to arbitrary control; for the judge would be then the legislator. Were it joined to the executive power, the judge might behave with violence and oppression. There would be an end of everything were the same man or the same body, whether nobles or the people, to exercise these three powers, that of enacting laws, that of executing the public resolutions, and of trying the cases of individuals’’55
Tanzania is a united Republic formed by formerly independent countries namely Tanganyika (now Tanzania mainland) and Zanzibar. The doctrine of distribution of
55 Montesquieu, 1978. L’Espirit des Lois, Book xi. The quotation is from Finer, Herman, 1965. Theory and Practice of Modern Government. London: Methuen& Co Ltd, pp 94-95.
Corruption Perception Surveys Report: TANZANIA 2008
42
powers among principal state organs is enshrined in the country’s constitution. The union constitution states, categorically, that;
‘’All state authority in Tanzania shall be exercised and controlled by two organs vested with executive powers, two organs vested with judicial powers and two organs vested with legislative and supervisory over the conduct of public affairs. The Organs vested with executive powers shall be the Government of the United Republic of Tanzania and the Revolutionary Government of Tanzania Zanzibar; the organs vested with judiciary powers shall be the judiciary of the United Republic and the Judiciary of Tanzania Zanzibar; and organs vested with legislative and supervisory powers over public affairs shall be the Parliament of the United Republic and the House of Representatives of Zanzibar’’.56
Union organs also have jurisdiction over all affairs of Tanzania mainland .The subject matter of the study was corruption which is a non-union matter. As a result, we only examined the role of the Government, the Judiciary and the Legislature of the United Republic of Tanzania in influencing anti-corruption policies in the country. These organs will, henceforth, be referred as the Executive, Judiciary and Legislature, respectively. We now move to examine the powers of each organ in influencing governance and anti-corruption policy in Tanzania. The Legislature The Legislature is the arm of government that is charged with the responsibility of making laws for the governance of the country. The legislature is the principal organ of the state in the United Republic of Tanzania as it represents the voice and sovereignty of the people57. Functionally, the legislature is made up of two distinct parts namely the National Assembly and the President. That is to say, every Bill discussed and adopted by the National Assembly becomes law only after being assented by the President of the United Republic. It is the two organs that form the legislature58. Therefore, any reference to the control of the Executive by the legislature actually refers to the National Assembly in this regard. In the course of explaining various issues in this chapter, the term legislature will be used to mean the National Assembly/Parliament. The Parliament in Tanzania is an important and powerful institution. It approves the name of the person appointed by the President to hold the position of the Prime Minister. Therefore, although it has not happened up to now, practically, the legislature can block appointments to this important office if the person appointed is
56 The Constitution of United Republic o Tanzania,1977, chapter 1,part 1, Article 4, sub-articles 1-2.
57 See article 63(2) of URT constitution 58 It is also popularly known as the parliament. The two words will be used interchangeably
Corruption Perception Surveys Report: TANZANIA 2008
43
not, in their opinion, suitable to the appointment. Also, the Parliament can impeach the President or the Vice-President when the holders of these top offices in the country contravene the Constitution or the provisions of the Public Leaders Ethics Act, 1995 or contravenes the ethics regarding registration of political parties or if any of them does things, which bring their offices to disrepute. This power of impeachment does not end with the holders of the two top officers of the State only. The Prime Minister also falls under parliamentary scrutiny and may be removed from office through the vote of ‘no confidence’ if she or he behaves ultravires. The Constitution provides elaborate procedures to be followed when the Parliament intends to invoke these powers. The National Assembly is empowered vide Articles 4 (2) and 63 (2) (3) to enact laws, and to oversee and advise the government and all its organs in the discharge of its various functions. This can be done through the following ways: First, through standing committees of the Parliament, various ministries, agencies and departments can be called to account for their performances on various activities under their jurisdictions. The legislature has, thus, powers to hold, accountable, the executive on ultravire actions. These committees cover the whole range of activities and areas in which the executive operates. Second, accountability can be sought through questions posed in plenary sessions of the Parliament. Each Member of Parliament (MP) is allowed to ask questions to the ministries. The procedure, the nature and conditions of exercising this right is explained in Section 33 of the Parliamentary Standing Orders, the main requirement being that the question must be lodged with the Clerk to the National Assembly in writing, not less than 21 days before the date on which a reply is sought. Under Section 37A, Ministers are duty bound to answer the questions asked thoroughly including the addition questions added on the floor either by the original questioner or other Members of the House. Third, enacting legislation where policy implementation requires legislation. The legislature also deliberates upon and ratifies all international treaties and agreements in which the United Republic is a part.
Effectiveness of the legislature in performing its oversight functions Most laws, which are enacted by the National Assembly, emanate from the executive through its ministries. It is rare for Bills to come from individual members of the house. On one occasion a member of parliament tabled a private Bill aimed at curbing corruption in elections but it did not go far. MPs are unable to fully utilize their position in the House to initiate Bills, not because of lack of knowledge and issues to raise, but because of poor facilities available to
Corruption Perception Surveys Report: TANZANIA 2008
44
them. The Bunge library in Dodoma is virtually empty and legislators are not given support staff for both research and follow up of issues they would like to pursue. Therefore, notwithstanding the fact that they have the right to access all the information they desire from the government, under Act No. 3 of 1998, they are incapable of fully utilizing that existing facility. Thus, their contributions to debate remain to be of very general nature. However, major exception to this rule are the few opposition legislators, particularly Dr. Wilbroad Slaa and Zitto Kabwe, who from time to time come with “some bombs” – well-researched and as a result often put the Government under its knees. There are practical and legal problems, which the House experiences and thus undermining its capacity as a people’s representative organ. The main problems inhibiting the Parliament from optimum functioning include the following. Firstly, the very existence of the House is dependent on the whims of the President. Article 90 (2) of the Constitution of the United Republic of Tanzania, 1977 provides for various situations in which the President can actually dissolve the Legislature. Of particular interest is a situation where the Legislature refuses to approve a Budget Bill proposed by the Government; when it refuses to pass a Bill which the President is of the opinion that it is important; and when it refuses to pass a motion considered of fundamental importance to Government policies. The fact that the President can dissolve Parliament instils fear in Legislators and this limits their argument with the Executive. Secondly, is the party affiliation. Political parties nominate the candidates to be elected to the legislature. There are no independent candidates59 in the Tanzanian electoral process so far. Thus, the legislators are supposed to tow the party line when it comes to critical issues. A legislator can only ignore the party dictates – particularly when it comes to voting on an issue in the plenary at his or her own peril. This is because loss of party membership goes hand in hand with loss of the parliamentary seat. This indirect coercion by the party undermines the independence of Legislators to discuss and initiate motions of interests to their constituencies. In other words, the party takes precedence over the voters. A case in point is the tug-of-war between the government and the people of Tanzania over the legitimacy of giving the management of the Tanzania Electric Supply Corporation (TANESCO) to the South African Net Group Solutions Company. Several MPs from the ruling party – Chama Cha Mapinduzi (CCM) – had registered with the Speaker requesting for a debate in the House over the issue. The Chairman of the ruling party, who is also the President of the United Republic of Tanzania, visited them in Dodoma60. All he did was to remind them that as they oppose his Government, they should not forget that he would be
59 The issue of private candidates is still contested in Tanzanian politics. There are currently legal wrangles in courts of law between the government and human rights activists on private candidates phenomenon 60 By then the office holder was President Benjamin William Mkapa
Corruption Perception Surveys Report: TANZANIA 2008
45
around in 2005 scrutinizing their applications when seeking for re-election. That was the end of the debate about TANESCO and Net Group Solutions Company in the House. Party discipline becomes a real huddle to the effectiveness of the legislature in influencing governance and policies particularly because it is overwhelmingly dominated by one party- Chama cha Mapinduzi (CCM)61. Thirdly, the use of ‘certificate of urgency’ by the government is another technique of limiting the ability of the Legislators in performing their oversight functions effectively. It happens quite often that when there is a very sensitive issue, instead of adhering to the normal legislative process, bills will be sent to the legislature under the ‘certificate of urgency’. This procedure is allowed under the law and therefore, Legislators will have no alternative when faced with this ‘fait accompli’ but debate and pass the Bill without any preparation. More often than not, the Government will achieve what it had intended. Fourthly, is the capacity of the Government to bulldoze the Legislators at committee level. Although MPs are supposed to assist the Government through discussions in the committees, there are limitations to this exercise. In the first place, the committees are not supposed to change the Bills they scrutinize. Furthermore, the Government can choose to ignore any recommendations made by the committees and take the Bill in the plenary the way they like. It will still be discussed and passed. The most absurd situation is where the Government decides to print the final law completely ignoring what was agreed upon in the plenary. This happened in relation to the National Bank of Commerce Bill. When queried about this in subsequent sessions of the House, the Attorney-General rudely told the Legislators that they can do nothing about it. This forced the Prime Minister to intervene and apologize on behalf of the government. The issue as to who is actually in charge of the process, between the Executive and Parliament, had already been delivered. Under the Constitution and the law, the Parliament of the United Republic of Tanzania is supposed to approve and fully supervise both taxation and public expenditure (fiscal policy). At the same time, the Constitution prohibits the Legislature from dealing with legislation in financial matters, save only when the President has proposed, through a minister or deputy minister, that the matter be dealt with the Legislature. The Legislature is restricted from, among other things, enacting a law for the levying of taxes or altering of taxation other than by reduction; the imposition of any charge upon the consolidated fund or any other public funds of any moneys not charged thereon, or any increases in the amount of such payment, issue or withdrawal; the composition or remission of any debt for payment to the United
61 Over 80% of legislators are members of the ruling party CCM
Corruption Perception Surveys Report: TANZANIA 2008
46
Republic62. The influence of the Legislature over policies is thus, minimal as this terrain largely remains the preserve of the Executive branch of the State. The last time the Parliament attempted to argue with the Executive over taxation policy was in 1973. The arguments generated into a serious acrimony with the then President threatening to dissolve Parliament in order for him and the Members of Parliament (MPs) to go back to the people and seek fresh mandate. The MPs surrendered and accepted what the Government was recommending. Once in a while, one comes across questions in Parliament over tax holidays and other forms of relief given to investors but nothing much about taxation policy. In fact, there are situations where the Government has introduced new taxes and then referred the matter to the Parliament later for ratification. For instance, at the end of 1982 the then President of the United Republic of Tanzania, the late Mwalimu Julius K. Nyerere, announced new taxes without any legal basis. They were to apply immediately and get parliamentary blessings later. In his New Year Message broadcast live on Radio Tanzania on 31st December, 1982, Mwalimu explained: You will already have heard of the new taxes which come into force tomorrow, the first of January, 1983. These tax measures will be debated in Parliament in its next sitting, but in the meantime they have to be paid by everyone. The President knew what he was talking about. The Parliament can discuss the new taxes, praise or condemn them, but at the end of the day it will endorse them. When it comes to approve and supervising public expenditure, the Parliament benefits immensely from the work done by the office of the Controller and Auditor-General. The Controller and Auditor-General (CAG), on behalf of the Parliament examines, inquires into and audits accounts submitted to him under Section 25 of the Public Finance Act, 2001. CAG has a duty to ensure that all expenditure or public moneys has been properly authorized and applied to the purposes for which they were appropriated.
In conclusion suffice it to point out that although constitutionally the Parliament is supposed to be a ‘supreme’ watchdog institution over other branches of the government, it falls short of performing its role effectively because there are several legal encumbrances which compromise its independence. There is thus a need to enhance its independence for it to be able to have its deserved influence on the country’s anti-corruption policies. An independent and effective Legislature is also one of several key institutions for controlling corruption since it plays an important role in identifying corrupt practices, and passing legislation to limit its corrosive impact on both governance and everyday life.
62 See Article 99(1)(2)(a) and (d)
Corruption Perception Surveys Report: TANZANIA 2008
47
The Executive The Executive branch of Government works under the President of the United Republic of Tanzania. The President is the Head of State, the Head of Government and the Commander –in- Chief of the Armed Forces63. The Constitution, vide Article 33(27) and Article 35(1) has that all executive functions of the state shall be discharged by the President and any other officers on behalf of the President. Recruitment and management of officers of this branch, as a principle, follows a strict merit based system.
The Constitution has empowered the President to constitute and abolish any office in the service of the Government as well as to promote, to remove, to dismiss and to discipline officers in the service of the government. The major organs and officers that mainly discharge executive duties include: the Cabinet, which consists of the President of the United Republic as its chair, the Vice President, the President of Zanzibar, the Prime Minister and the ministers. Other offices include the Office of Regional Commissioner and District Commissioner which represent the President at regional and district level, respectively. Others include security and armed forces organs like the police force led by the Inspector General of Police assisted by Regional Police Commanders, the Chief of Tanzania People’s Defence Forces, Chief of Intelligence Service, Principal Commissioner of Prisons and the like.
The Executive branch discharges its functions and responsibilities drawing from, and depending heavily on, the professional competence of the Public Service. To guarantee that, the Public Service is supposed to be professionally competent, its recruitment is, in most cases, based on competence or merit whereby experience also counts. However patrimonial and clientelistic connections are also influential in the recruitment process of public servants. The public service sector is currently under reforms in order to improve the quality of service delivery to the public. All anti-corruption agencies, including the Prevention and Combating of Corruption Bureau (PCCB), the Ethics Secretariat, the Commission for Human Rights and Good Governance and the Intelligence Unit are structurally under the arm of the Executive. As a result, these agencies have been frequently proved to be ineffective in dealing with corruption in high levels of government due to conflicts of interests of the actors of these organs. As a result, these agencies have been accused of working as public relations instrument of the Executive rather than being effective anti-corruption watchdogs64.
63 See Article 36 and 37 of the Union Constitution of 1977. 64 See the comments of the Parliamentary Investigative Committee on Richmond scandal on PCCB, see also the comments of Jingu (2006) Civil Society and the Politics of Public Accountability; University of Dar es Salaam.
Corruption Perception Surveys Report: TANZANIA 2008
48
The executive has wide discretionary powers and controls most of the resources needed by other organs to influence governance and policy processes in the country. As we saw above, it also controls the coercive apparatus of the state. The practice shows that the executive dictates policy processes in Tanzania and it uses such powers to control other organs, through ultravires actions,65 without reprisal from other organs. Although, there are many formal and informal instruments under the disposal of the Executive in influencing other organs, imbalance of powers between the three organs of the State, gives undue leeway to the Executive in influencing governance and anti-corruption policy in the country. Until recently66, the Legislature has always acted as an agent of the Executive. Furthermore, powers of the Executive are reinforced by the fact that Tanzania is a defacto one party state67. Although, Tanzania has eighteen registered political parties, it is CCM which has, not only won all three presidential elections since 1995 when the country embarked on a multi party system, but it has also won more than two thirds of parliamentary seats. CCM uses its control of the Government and the Parliament to dictate and manipulate policy processes to work at its advantage and the interests of the people who control it, and impliedly, at the expense of public interests.68
The Judiciary An independent, impartial and informed judiciary has a central role in anti-corruption crusade in a country. The judiciary power of reviewing actions taken by the Executive and its various agents requires a strong, independent, and responsible judiciary, which is accessible to all members of the society. The powers of the judiciary in checking other organs of the state depend on the ability of citizens to challenge the actions and decisions of other organs in the courts of law. This is because courts do not initiate cases but rely on actions of citizens to challenge abuse of power practices by the two organs. The courts of the land are relatively free to decide sensitive cases against the other two organs. For example, in 2006, the High Court struck off Section 98(2) and 98(3) of the Elections Act of 1985 as amended by the Electoral Law (Miscellaneous Amendments) Act Number 4 of 2000. Sections 130(b) and (c) were also nullified on the argument that the Act legalized electoral corruption in the name of African Hospitality (Takrima). The legislation was widely condemned by members of civil society as the 65 Actions done outside the authority given by the country’s constitution or law legislated by Parliament. 66 The Legislature formed a committee to investigate the corruption scandal related to the contract with Richmond Development Company LLC contract. The company was awarded a contract by the Government to produce energy. The Parliamentary Committee came to the view that the contract was awarded under corrupt circumstances. This scandal led to the resignation of the Prime Minister on 7th February, 2008 followed by two former cabinet ministers and subsequent sacking of the entire cabinet by the President. 67 See Makulilo A., (2007), Tanzania a De Facto One Party State?, University of Dar es Salaam. 68 Until, recently, CCM never tolerated any motion to criticize the government in the parliament. Its members of parliament were required to defend the Government under all circumstances even when it is against public interest.
Corruption Perception Surveys Report: TANZANIA 2008
49
institutionalization of the culture of buying voters during elections. However, the Executive has more than often ousted courts’ decisions through a ruling party- dominated Parliament. For example, in 1993 Reverend Christopher Mtikila challenged, successfully, the provisions in the Election Act No. 1 of 1985, which subjected candidature to any political post to membership of a political party.
In some cases, the Executive can influence the judicial system, using covert punishment threats, such as appointments to less attractive locations in distant parts of the country, or can completely ignore court decisions. Using its control of the Legislature, the Executive can also enact ouster clauses in the constitution and other laws to restrict the courts from exercising its authority. For example, Article 74(12), of the Constitution forbids any court to inquire anything done by the Electoral Commission when discharging its functions in accordance to the Constitution. This provision in effect, limits the ability of the judiciary in dealing with corruption practices done by the commission while performing it functions. There are several such ouster clauses in the constitution and other laws in Tanzania. The Judiciary is also dependent on the Executive on its resources. Such dependence compromises its independence and effectiveness.
In summary, it is important to appreciate that the doctrine of separation of powers is enshrined in the country’s Constitution. The Constitution provides for separation of powers guaranteeing the independence of the Executive, Legislature, and Judiciary, as well as a system of checks and balances enabling them to oversee the actions of one another and prevent abuse of power by agents of each organ. However, in practice, the system of checks and balances has been working in favour of the Executive with the two other organs, failing to adequately ensure public accountability of the executive and the legislature. As a result, anti-corruption policy in the country has been largely initiated and work in favour of Executive interests. 2.2 INFLUENCE OF NSAs ON GOVERNANCE AND ANTI-CORRUPTION POLICY Civil society No combination of formal democratic institutions will bear fruit in the anti-corruption crusade, without a strong civil society, which enables social groups – trade and professional associations, community groups – to function as “whistle-blowers”. Although formal institutions have more power and authority to address the incidence of corruption, the importance of informal institutions and civil society should not be underestimated. Neither the internal control mechanisms nor the Judiciary is immune from corruption, and more importantly, they often need incentives to function properly. An independent and self-motivated press, responsive opposition groups and well-established non-governmental organizations can express themselves given that civil liberties exist to secure free access to information on government operations. In
Corruption Perception Surveys Report: TANZANIA 2008
50
many empirical studies political and civil rights organisations have been found to have a positive impact on governance69. There are relatively well established non-governmental organizations like HakiElimu, Legal and Human Rights Centre (LHRC), Lawyers Environmental Action Team, TAMWA, which are playing a significant role in monitoring corrupt practices by state agents70. For example, EAT and LHRC and National Organization for Legal Aid (NOLA) successfully moved the high court in 2006 to strike off Section 98(2) and 98(3) of the Elections Act of 1985 as amended by the Electoral Law (Miscellaneous Amendments) Act number 4 of 2000. Sections 130(b) and (c) were also nullified on the argument that the Act legalized electoral corruption in the name of African Hospitality (Takrima). Media The role of media in promoting good governance and controlling corruption can not be overemphasised. Free media does not only raise public awareness about corruption, its causes, consequences and possible remedies but it also carries investigations and reports incidences of corruption and other forms of bad governance practices. The effectiveness of the media, in turn, depends on access to information and freedom of expression, as well as a professional and ethics-abiding cadre of investigative journalists. The media in Tanzania is relatively free. There are several independent newspapers, radio and TV stations, which play a big role in revealing corrupt practices by public officials. Such revelations often prompt investigations by official oversight bodies. For example, revelation by media of corrupt cases has moved the Prevention and Combating of Corruption Bureau to initiate investigations on some of such cases. The cases in point include the Radar deal with BAE, Bank of Tanzania Twin Tower scandal, Alex Stewart (ASSAYERS), Buzwagi Mining contract, Mchuchuma mining deal, Mwananchi Gold deal, Meremeta Limited, Tangold Limited, Mwananchi Trust Co. Ltd, Chimela Co. Ltd and VMB holdings Co and the 172.9bn/- worth emergency power generation contract with Richmond LLC. The media also provides space for members of civil society to pressurize for change of laws and regulations that create a climate favourable to corruption. It also provides space to pass on views for redressing governance/maladministration practices. Indeed, the media has been, as a matter of routine, scrutinizing the activities of state agencies from various standpoints. Currently, the media fraternity is in the forefront in advocating for freedom of information in the country. However, the influence of media on the governance and anti-corruption policy environment is limited by the
69 See for example, Jingu (2006) Civil Society and the Politics of Public Administration in Tanzania: University of Dar es Salaam 70 ibid
Corruption Perception Surveys Report: TANZANIA 2008
51
existence of laws which inhibit their freedom. Such laws include the Newspaper Act of 1976 and the National Security Act of 1970. Newspapers are registered and regulated by the Newspaper Act of 1976. Newspapers in this case also include magazines and tabloids. The Newspaper Act of 1976 is restrictive on journalistic freedom and independence of the media in investigating the government apparatus. The Act provides criminal sanctions for libel, for any organ, which publishes information considered by the government to be offensive. The Act’s heavy-handedness may also be viewed from the point of the overwhelming powers it gives to the Minister of the time being responsible for information to suspend or ban publications. Some of the newspapers which were suspended or banned from 1996 todate on the argument that the suspension or ban was in the interests of the public include; Michapo, Cheka, Arusha Leo, Kasheshe, Nyundo, Chombeza, Majira, Motomoto, and Tanzania Daima, and very recently, MwanaHalisi. In reality, the suspension or ban of these newspapers had nothing to do with public interests but only because the newspapers were critical of the government. The banning of Majira, for example was due to its criticism of the then Zanzibar President, Salmin Amour. The editorial of the paper had condemned the detention without trial, of CUF members who had protested against election results. The paper also covered a story on the alleged burning of CUF offices by CCM supporters. Tanzania Daima, on its part, was banned in December 2005 for using caricatures to criticize the performance of the then President of United Republic of Tanzania, Benjamin Mkapa. Recently, the Minister has used such powers to suspend the publication (and circulation) of MwanaHalisi newspaper for three months. The paper is renowned for its boldness in exposing especially grand corruption practices in the government and ruling party. Another law, which seriously infringes upon the freedom of the press in Tanzania is the National Security Act, 1970 CAP 47. The Act gives absolute powers to the government to define what should be disclosed or withheld from access by the public and makes it a criminal offence to investigate, obtain, possess, comment on, pass on or publish any document or information, which the government considers to be classified. Classified matter means “any information or thing declared to be classified by an authorized officer”. It includes documents or information related to any entity such as parastatal organizations, the ruling party and its affiliated leaders, a company duly registered under companies Act, Cap 212 of laws, R.E,2002 whose 50 percent shares are owned by the Government or Local Government Authority. Further, the Act provides sanctions against any person who provides or receives classified matters. The Act provides the penalty of up to twenty years of imprisonment if found guilty of offending this law (URT, 1970).
Corruption Perception Surveys Report: TANZANIA 2008
52
The National Security Act further threatens the freedom of expression by criminalizing contacts with foreign agencies such as news agencies, trade unions and international agencies. Section 12(1) of the Act states that “communication with or attempts to communicate with a foreign agent in the United Republic or elsewhere” will be presumed to be “for a purpose prejudicial to the safety or interest of the United Republic” and “directly or indirectly useful to a foreign power”. Unless an accused can prove the contrary, she/he will be held to be guilty. Furthermore, refusing to provide information to investigators is punishable by an imprisonment of a term not exceeding five years. The Act vests too much power on some individuals to define and interpret the term ‘national security’ and absolute powers to define some matters as ‘classified’. Lack of proper definitions and interpretation of terms may lead to abuse of discretionary powers either deliberately or accidentally, but in either case such abuses are done at the expense of freedom of access to information, and freedom of expression. Indeed, the vague concept “classified matters” may be used to protect the government from embarrassment or exposure of ultra vires behaviours or to conceal information about the abuse by entrusted powers. The example of the case of Adam Mwaibabile in the matter of Republic Vs Adam Mwaibabile, High Court of Tanzania, Criminal Appeal No 1 of 1997 (Unreported) is relevant. The Appellant was first arrested and then sentenced to one year in jail by the District Court in Songea for possessing a ‘classified matter’ related to national security. In reality and as it came to be known later on, it was a letter written maliciously under the order of the Regional Commissioner to deny him a business license due to personal grudges between him and the appellant. The letter, however, was defined as a classified matter, though it had no connection whatsoever to national security. Further, the law denies journalists the right to professional secrecy in relation to the source of the information published or broadcast. It thus makes many, a would-be source of information on abuse of power to refrain from doing that, given the fact that the law shifts the burden of proof to the accused. Lack of guarantee on professional secrecy on the part of journalists undoubtedly is inhibitive of journalists and media houses in carrying investigative journalism (Jingu, 2006). Therefore, although the media is increasingly becoming influential on positively shaping the governance and anti-corruption policy environment in the country, there are laws which inhibit its effectiveness. As a result of such inhibitive laws, journalists who uncover dubious undertakings of government agencies and their compatriots run the risk of being criminally prosecuted or their respective news medium banned.
Corruption Perception Surveys Report: TANZANIA 2008
53
Corporate sector The corporate sector is now thriving in Tanzania. A significant portion of activities that used to take place entirely inside the State are now organized in the private sector. It is on this ground that the corporate sector now constitutes one of the key forces in the country. Corruption has a corrosive effect on the ability of businesses to flourish. As such, corruption must be addressed to make the business environment conducive. The corporate sector has been advocating for the reform of Government regulation and bureaucracy in order to create an environment where fewer opportunities for corruption exist, as well as reducing the demand side of corruption (from Government officials). The corporate sector has been using the established structures based on their cooperation with the Government to advocate for reforms on problem areas. Such structures include Tanzania National Business Council (TNBC). TNBC is a forum for public/private sector dialogue to improve the business environment in the country. Its ownership is 50% public and 50% private, with President of the country as the Chair. The Vice Chairperson of the Council is the Chairperson of Tanzania Private Sector Foundation, under which corporate entities, local and international, meet at round table discussions. At the national level, the Tanzania Private Sector Foundation (TPSF) has been established as a focal point for advocacy and lobbying the Government on behalf of its members for governance and anti-corruption policy environment in Tanzania. Through this forum, the corporate sector identifies the pathologies in a bureaucratic system, which often provide the basis for corruption to occur. Such pathologies include complicated tax codes, red-tape in the issuance of business licenses, inefficient judicial system and existence of laws and regulations conducive to corruption. The Government has been addressing the concern of corporate sector as part of the Business Environment Strengthening for Tanzania (BEST). However, we know that corporate the sector is not a monolith entity. In every economy, there are small and medium companies, large firms, state-owned companies and multinational corporations. Amongst them, there are those which thrive through corruption. There are, thus, some sections of the corporate sector in Tanzania that negatively affect the governance and anti-corruption policy environment. Usually, these sections of corporate sector consist of big businesses, which seek not only to buyoff officials in charge of new regulatory authorities created to manage the excesses of the unregulated market, but also to outright capture of key political and bureaucratic officials through corrupt payoffs. Think tanks and high learning institutions Think tanks and academic institutions conduct research and offer consultancies with the view of informing national policy processes. These institutions should also inform the citizenry about civic rights and obligations. They also carry out activities of
Corruption Perception Surveys Report: TANZANIA 2008
54
empowering the citizenry in order to enable it utilise its entitlements. In the view of promoting good governance and fight corruption, think tanks and academic institutions develop different initiatives, which seek to promote transparency and accountability of public institutions and empower citizens to exercise their democratic responsibility of promoting public accountability. The cases of Research on Poverty Alleviation (REPOA), a non-profit think tank and Research and Education for Democracy in Tanzania (REDET), a research unit of the Department of Political Science and Public Administration of the University of Dar es Salaam, attest to the contribution of the said think tanks in influencing the governance and anti-corruption policy environment in Tanzania. REPOA has initiated what is known as Public Expenditure Tracking Surveys for Public Funds as a strategy of dealing with corruption and mismanagement of funds. Public Expenditure Tracking Surveys (PETS) literally means following money where it goes to be spent. It includes comparing budgetary allocations and actual spending. This strategy is one of the most effective ways of checking whether budgetary resources have reached the intended beneficiaries. As a strategy, PETS also contributes to a national debate about how to ensure that public money reaches intended beneficiaries. REPOA also maintains the Tanzania Governance Notice Board to facilitate effective use of existing information on governance in the LGAs, which is useful in national policy processes. It also maintains a database, which consists of strategic data useful for informed policy dialogue. It also trains media, civil society organisations and Members of Parliament on effective use of notice boards, to facilitate effective, expenditure tracking, policy monitoring and perform their oversight functions. REPOA also carries studies on various aspects of corruption and bad governance in the country. For instance, REPOA had on behalf of the URT Government, during 2007, conducted the study (Views of the People 2007) to evaluate people’s opinion and inform the Government of the consequences of the implementation of MKUKUTA at the household level. REDET, on its part, has been carrying studies and providing information on various aspects of democracy since the introduction of liberal politics in the early 1990s. REDET activities are geared towards the widening of democratic space and hence promote public accountability in the country. REDET programmes, for example, seek to promote political tolerance, promote political competence of citizens and strengthen political/governance institutions in the country. In short, think tanks are in the business of policy analysis. They market that analysis and attempt to sell their views to the public and Government. For example, both
Corruption Perception Surveys Report: TANZANIA 2008
55
REDET and REPOA maintain a reputation for reporting results of their research through books and other forms of publications. They also carry out several initiatives, which seek to strengthen both the demand and supply side of public accountability. For example, through training activities, they empower the citizenry to be active participants in governance processes and, hence, strengthen demand side of public accountability. On the other hand, training of public officials creates readiness and ability to be responsive to public needs and demands. In both ways, think tanks/academic institutions have contributed significant inputs to the development of good governance and the anti-corruption policy environment in Tanzania. In that regard, think tanks/academic institutions tend to stimulate enlightened policy decisions. However, the sector is still largely undeveloped and wanting. The country still has only a handful of active actors in this area. The contribution of the sector to governance and policy processes could be improved by increasing the number of active think-tank organisations. 2.3 THE INFLUENCE OF POLITICAL PARTIES ON GOVERNANCE AND ANTI-
CORRUPTION POLICY AGENDA Ruling party CCM still maintains a strong fusion with the State as the boundary between the two is to a large extent porous. This situation makes Tanzania a defacto one party state. The party is dominated by a cartel of core elites of the country (business figures, groups of influential politicians, members of academia, top bureaucracy and civil society organizations). In that regard, the party controls the political space of the country. CCM has successfully created makeshift institutions to manage change without affecting its dominance in the politics of the country. As a result, the political institutions and policy options in the country are largely the reflection of CCM. CCM has the power to make and unmake any governance institution or policy. The interpenetration of the party and state affects the ability of opposition parties and other civic groups in the country to influence formation of an effective anti-corruption policy. This political context has largely affected the design and behaviour of anti-corruption agencies, news media, civil society organisations and academics in pushing for changes in governance systems and anti-corruption policy framework for fear of risking their survival. By being critical of the Government and the party, members of civil society risk being termed ‘opposition members’ and thereby cutting themselves out of the patronage and other benefits assumed to be accruing from the State. In this regard, the ruling party has a strong influence I shaping the governance and anti-corruption policy of the country.
Corruption Perception Surveys Report: TANZANIA 2008
56
Opposition parties The Opposition political parties, particularly the loose coalition of the four main opposition parties in Tanzania, namely CHADEMA, CUF, TLP and NCCR-MAGEUZI have been in the forefront in uncovering corrupt practices in the country within and outside the Legislature. Exposition of the External Payment Arrears (EPA) account, a corruption scandal in the Bank of Tanzania (BoT) in 2007 and the emergency-power procurement (Richmond LLC), which culminated into historic dissolution of the cabinet in 2008 following the forced resignation of Prime Minister and two ministers, were vehemently pressurised by the opposition. The major weakness of the opposition political parties is their limited number of representation in the Legislature. Their dismal number (44 against 279) makes it absolutely impossible to successfully move any motion in the Legislature without the consent and support of the ruling party. Unfortunately, the ruling party members have always supported the Government against all motions moved by opposition members, particularly those, aimed at exposing corruption deals involving the Executive branch. The success of opposition political parties and civil society organizations in reinforcing the corruption agenda in Tanzania’s politics is largely owed from the work of the media in exposing corruption deals in the management of public affairs. 2.4 EXTERNAL FACTORS Influence of international financial institutions on anti-corruption policies Corruption is bad for donor business. As a result donor agencies, like International Financial Institutions, pay attention to corruption. Two most important institutions in International Finance are the World Bank and International Monetary Fund (IMF).The role that the twin Bretton Woods Institutions play in the architecture of governance policy in Tanzania has greatly influenced anti-corruption policies in the country. For example, the twin institutions, in collaboration with other donors, made the enactment of anti-corruption legislation as one of the conditionalities for budgetary support. Further, the governance condition for Tanzania to qualify for ‘Heavily Indebted Poor Counties (HIPC)’71 Initiative was straight forward – adoption of a National Action Plan for the Control of Corruption72. Bilateral agreements between donor agencies/governments and a recipient country have also brought large influence on anti-corruption policies in Tanzania. The World Bank, for example, designed what it termed as Perceived Areas of Comparative Advantage in Combating Corruption, which were given as conditionality to parties in the agreement like Tanzania. Areas of comparative advantage include public
71 This is an initiative which was designed to reduce debt burden to the levels that the highly indebted countries could comfortably service their debts through export earnings, aid, and capital inflows. 72 ‘see, the decision point document. http:www.worldbank.org/hipc/country-cases/Tanzania/Tanzania-FIN.pdf. Accessed on 27th January 2003
Corruption Perception Surveys Report: TANZANIA 2008
57
economics (economic analysis of the role and functioning of the public sector), decentralization of government functions, public service reforms, including public expenditure tracking and management. Areas in which the support recipient country shares expertise include, revenue policy and administration, legal and judicial reform, other oversight institutions like ombudsmen and anti-corruption agencies73. Other Bilateral Donors have, in many occasions, also come up with their perceived areas of comparative advantage in combating corruption. For instance, UNDP area of comparative advantage is the political side of anti-corruption work; USAID – Civil society; DfID – the political side of anti-corruption work; DIDC (Finland) – Provides example of best practice in the public sector; NORAD (Norway) – unique expertise and network of ‘resource-persons’; SDC (Switzerland) – has not stated comparative advantage. Donors even publicly debate the effectiveness of their own work in the fight74 against corruption. It appears that both bilateral and multilateral agreements have a great influence in the nomenclature of the current anti-corruption policies. Tanzania is a state party to the WTO agreements. Among other things, members are supposed to abide to a multilateral framework on the so-called Singapore issues75 that include investment and competition policy, trade facilitation and liberalization and transparency in government procurement. Transparency is aimed at, among other things, contribution to efforts aimed at the reduction of corruption. However, much as foreign direct investment and liberalization of government procurement may enhance economic growth and prevent corruption respectively, the former has been accused of being the cloak for corruption. Indeed, most foreign direct investment in African countries uses corrupt means to win business deals by means of bribing state officials. Consequently, most mega corruption scandals in the country have an international dimension76. The EU and ACP countries have been participating in negotiations to enter into Economic Partnership Agreements (EPAs) by early 2008. However, most ACP countries have been hesitant to sign the agreements. Notwithstanding that, the European Commission initialled the interim Economic Partnership Agreements with SADC, East and Southern Africa and key trading partners in the Pacific by the end of 2007. These interim agreements cover market access and other areas, including development cooperation. Furthermore, on 23rd November 2007 in Uganda, the
73 Source: World Bank (2000). Reforming Public Institutions & Strengthening Governance: A World Bank Strategy. Washington DC: World Bank, p. 62. 74 Marquette, H. (2001) Bilateral Donors and Anti-Corruption Work: The Myth of ‘Comparative Advantage’. Paper presented at the Leeds University Centre for African Studies (LUCAS) Seminar Series 75 A far-reaching set of institutional reforms that Europe linked to market liberalization, they were first introduced into trade negotiations by rich nations at the WTO meeting in Singapore in 1996. 76 See Jingu (2008) State Capture in Tanzania: Dar es Salaam (mimeo)
Corruption Perception Surveys Report: TANZANIA 2008
58
European Commission and the East African Community (EAC) initialled an interim EPA agreement. This agreement applies to the EU and members of the EAC, namely Kenya, Uganda, Tanzania, Rwanda and Burundi. Tanzania is a member of both EAC and SADC.
The Cotonou Treaty and the Economic Partnership Agreements (EPAs) between the EU and ACP countries is made up of World Trade Organization (WTO)-compatible agreements. The economic partnership agreements between EU and ACP countries put the world’s most advanced economies against the world’s poorest economies. The Agreements should serve as an opportunity to accelerate the ACP global and regional trade integration, as an important tool for development and the eradication of poverty. However, the huge economic imbalance between the European Union and African, Caribbean and Pacific countries, works to the advantage of the former.77 Unfortunately, liberalization of trade have led to weakening of governments and entrenched poverty to the vast majority of African countries, thus rendered inability to prevent and combat corruption. Indeed, the EPAs are more of a Trojan horse that could wreck Africa’s economic development and add very little to its political self-determination. It is on this ground that critics have accused EPAs to be a ‘‘blank cheque’’ for European business to profit from African economies without guaranteeing ‘‘a positive balance sheet for development’’ in return78. The ultimate impact of implementation of EPAs is loss of independent policy space for the pursuit of development strategies such as anti- corruption policies by poor countries.
Influence of intergovernmental instruments on anti-corruption policies Tanzania is a signatory and party to several international anti-corruption instruments. One among those is the United Nations Convention Against Corruption (UNCAC, 2003). The convention was adopted by the General Assembly of the United Nations on 31st October 2003 at UN headquarters in New York. Tanzania signed it on 09 December 2003, and then ratified it on 25th May 2005. UNCAC came into force on 14th December 2005. The second instrument is the African Union (AU) Convention on Preventing and Combating Corruption (AU convention). This instrument was adopted by the General Assembly of the AU on 11 July 2003 in Maputo, Mozambique. Tanzania signed it on 5 November 2003 and ratified it on February 22nd 2005. The AU Convention came into force on 5th August 2006. The other instrument is The SADC Protocol Against Corruption. This instrument was adopted by the SADC Heads of State and Government at their August 2001 Summit held in Malawi, making it the first sub-regional anti-corruption treaty in Africa. The Protocol was signed by Heads of State and Government of all 14 SADC member States. It became operational in July
77
Trade arrangements between Europe and its former colonies have historically worked in the advantage of the
former and in the expense of the latter. 78 See the position of Dr Sanoussi Bilal, co-coordinator of the European trade co-operation programme for the European Centre for Development Policy Management, who has been an observer on EPAs negotiations.
Corruption Perception Surveys Report: TANZANIA 2008
59
2005, 30 days after its ratification by two thirds of the member states. Tanzania ratified the protocol on 20th August 2003. All these instruments stipulate the ideal design of anti-corruption policy, legislation and institutions. The ratification of these instruments means that they have significant influence on the nomenclature of national anti-corruption policies. Enactment of the Prevention and Combating of Corruption Act (PCCA, 2007) is meant to align the national anti-corruption framework with specific provisions in the UNCAC and the AU convention79. 2.5 VULNERABILITY OF LGAs ARCHITECTURE TO RESIST CORRUPTION The Tanzanian local government system is based on political devolution and decentralization of administrative and fiscal functions within a unitary state80. Empirical evidence suggests that decentralization has managed to open up greater opportunities for reducing corruption due to increased people’s voice and choice and thereby making the public sector more responsive and accountable to citizens/voters. The potential for enhancing the reduction of corruption comes with the potential for increased accountability at local level. Accountability becomes better at the local level, since local citizens who are better informed about government performance can vote these governments out of office at the next elections. On its part, administrative decentralization has increase efficiency, in effect relieving lower-level staff from corruption-motivated arbitrary interference of seniors. Moreover, it also lowers the expected gains from corruption since, following the act of decentralization, corrupt agents are duty-bound to bear the consequences of their actions. In addition, increased fiscal decentralization is associated with enhanced quality of governance as measured by citizen participation, political and bureaucratic accountability, social justice, improved economic management and reduced corruption by local people. Furthermore, local government authorities reduce the scope of powers and the probability of engaging in massive corruption due to inter-jurisdictional competition. The realization of these potentials for reduced corruption has different manifestations to different local authorities depending on the level of awareness of the local people as to their civic rights and responsibilities.
79 See A Brief Report on the Review of the National Anti-Corruption Strategy and Action Plan (NACSAP II) 2008 – 2011, GGCU State House, May 2008. 80 Refer to policy paper on local government reform,1998
Corruption Perception Surveys Report: TANZANIA 2008
60
On the other hand, decentralization has made Local Government Authorities highly vulnerable to corruption and the promise of reduced corruption in some authorities is sometimes hollow and counterproductive due to various reasons. First, decentralization brings officials in close contact with citizens. This in effect promotes personalisation and may reduce professionalism due to arms-length relationships. Personalisation in this view breeds corruption as officials pay greater attention to individual needs sometimes at the expense of public interests. Second, decentralization at some authorities have led to increased influence of interest groups at local level81, greater discretion available to local officials and long tenure of local officials at the same place making it easier to establish corrupt relationships82. Third, decentralization also reduces impediments to corrupt practices as local politicians and bureaucrats collude to advance narrow self-interests while the influence of media and anti-corruption agencies wanes. All specialized anti-corruption agencies, save for the Prevention and Combating of Corruption Bureau, the Ethics Secretariat, the Financial Intelligence Unit and the Commission for Human Rights and Good Governance are controlled by the Central Government, and do not have a wide presence at local level. Local governments also have the responsibility for social development and public service delivery. However, most local government authorities lack the necessary financial and human resources to effectively discharge their responsibilities. Lack of adequate resources creates scarcity in public service delivery, which also increases the potential for corruption as a means of service distribution among many competing users. Shortage of resources also means that remuneration for local government personnel is inadequate. Poor remuneration also contributes to corruption at local level. This is because the respective staff find it necessary to engage in corrupt practices in order to make the ends meet for their lives.83 The Local Government Reform Programme (LGRP) aims at making local government authorities effective agencies of good governance and quality service delivery. Local government authorities are thought to be in a better position to identify people’s needs by encouraging citizens’ participation in democratic governance, and thus provide the appropriate form and level of public services. The Local Government covers issues related to citizens as service users, participation in formulating and implementing plans for local development. Other issues, which should be carefully analysed include Local Government autonomy in staffing, working relations between
81 For example, the influence of business groups has led to corruptly selling of open spaces. 82 Annual reports of the Controller and Auditor General have, for several years, shown massive misuse and unaccounted expenditure, which suggests widespread corruption at local authorities. 83 See also Warioba Commission report on causes of corruption in Tanzania
Corruption Perception Surveys Report: TANZANIA 2008
61
council staff and elected councillors, improving transparency and accountability in management of public affairs at local level. Significant progress has also been recorded over the process of involving citizens in Local Government planning and decision-making processes. The major huddle appears to be the technicality of the existing planning and budgeting processes. The technicality of council plans and budgets means that many citizens at local level can not comprehend the information contained therein. Moreover, some local authorities consider council health plans as ‘’ state secret’’ and thus deny accessibility to the very citizens who are supposed to follow-up the implementation of the same. Lack of transparency is also enhanced by lack of effective ‘voicing’ mechanism at local level. As it was pointed earlier, corruption is a serious problem at local level in Tanzania. Average citizens directly experience corruption more at Local than at Central level of government as most public services are provided at the former level. Existing studies show that corruption at local level thrives because the respective officers are unwilling or unable to provide the needed information84 to the citizens. Studies also show that in most Local Government Authorities in Tanzania, once the funds are provided to local authorities, issues of priority are not considered at all and instead, funds are used in accordance to the personal wishes of leaders85. Furthermore, previous studies have shown that corruption at local level occur due to weak internal control systems by most local authorities, weak accounting mechanisms, mostly due to lack of competent personnel and lack of any effective monitoring by oversight institutions86. An analysis of expenditure on ‘other charges’ for education and health in several authorities show that most of funds at local authorities do not reach the intended targets. In most authorities, less than 50% of funds are spent on activities that benefit service delivery stations including items such as ‘examinations’ and ‘school material’, ‘training’, and ‘medical supplies’ and ‘equipment’.87 On top of that, the evidence collected in the course of development of Tanzania National Anti-corruption Strategy and Action Plan Two (NACSAP II 2006-2010) indicates that corruption and abuse of power is widespread at the local level. Sectors pointed out to be mostly affected, include health,88 education89, staff recruitment and transfers, management of funds collected by Local Government Authorities, and land allocations90. The reports of the Controller and Auditor General on Local Government 84 See Odd-Helge Fieldstad, Einar Braathen and Amon Chaligha (2006) on Local Government Authorities in Tanzanial Government Reform in Tanzania 2002 - 2005:Summary of Research Findings on Governance, Finance and Service Delivery 85 See PWC 1999, 23 86 See USAID (2004) Public Expenditure and Service Delivery Monitoring in Tanzania 87 This also confirms the findings from the 1999 survey noted above. 88 Youth Action Volunteers 2007 survey also revealed massive corruption in health service delivery at local level 89 Several findings by HakiElimu routinely show that there is widespread corruption in Education sector. 90 See NACSAP II page 47 and 50. See also Afrobarometer surveys accessed from http://www.repoa.or.tz/documents_storage/PART%20I.pdf.
Corruption Perception Surveys Report: TANZANIA 2008
62
Authorities have always identified gross misuse and misappropriation of funds by local authorities due to bad governance practices91 There are also several other surveys which show that the menace of corruption is widespread at the local level. Corruption in service delivery is pointed to be particularly widespread in the administration of justice, education, health, land allocation, issuing of business licences and on HIV/AIDS funds92. It also affects the quantity, quality and equity of services provided by Local and Central Government. In understanding the gravity of the problems at the local level, the Government, within the National Framework for Good Governance, the National Anti-corruption Strategy and Action Plan (NACSAP) has been reviewed and reformulated to address the problem of corruption and accountability at local level. The guidelines have been developed for Local Governments under NACSAP II (2006-2010). However, a comprehensive data on the current status of corruption at the local level is not yet available. LGAs functional relationship with cooperative societies Tanzania's cooperatives have a long history which goes back to the early 1930s. In the first decade of independence, the cooperative societies were strong, with a complex structure of primary cooperative societies, secondary cooperative organizations and a national cooperative union. Since then, however, the history has become less responsive to the needs and demands of its members mostly due to corruption, theft and poor leadership. Empirically, there is evidence in history of existing regular informal interface and swapping of political and cooperative leadership in most LGAs. Local Government Authorities have the role of supporting the cooperative societies and promotion of cooperative activities in order to promote incomes of their people. Likewise, corruption at the local level has compromised the ability of cooperatives to promote income generation activities of the people, particularly the peasants, due to interfaces between corruption at LGAs and the cooperatives. Several local leaders are associated with maladministration or corruption when it comes to their dealings with cooperative societies. It is for this reason that the image of cooperatives in the country has continually become negative. Indeed, for many people in the country, cooperative societies are seen as nests of corruption. Incidences of embezzlement or misuse of cooperative funds are common stories in the country. Surveys of several credit and thrift/savings cooperative societies at local
91 See for example, the report of the controller and auditor general on the financial statements of local government authorities for the year ended 30th June, 2007. 92 See Cooksey, Brian (2006), Corruption and Governance in Tanzania. What Does Literature Say? HakiElimu Special Paper. REPOA 2003.
Corruption Perception Surveys Report: TANZANIA 2008
63
level show that most of them lure citizens; most of them being low income earners like school teachers and peasants, to invest their hard –earned incomes and savings with promises of attractive returns and profits. This is often done in collaboration with and facilitation by, local authority officials. Business licensing services Local Government Authorities have the mandate of issuing business licences within their areas of jurisdiction. Corruption often thrives during the issuance or regulation of business licences as a result of the discretionary powers bestowed upon the said LGAs officials and lack of adequate transparent and efficient regulatory environment. Lack of clear complaint mechanisms (if a business licence request is denied or unfair penalties are given), also encourages corruption at the local level. The problem of corruption in the granting of business licenses is also exacerbated by lack of proper records in apprehending and prosecution of the perpetrators. Business people are often compelled to ‘grease up the wheels’ a little in order to speed up the process of getting through the maze of bureaucratic red tape, which might otherwise take a protracted length of time to get business licences sorted out. On the other hand, most local officials engage in corrupt practices in issuing licences as a means of supplementing their meagre incomes in order to make ends meet. However, there are also some officials who receive bribes in order to provide licence services out of greed for accumulation of wealth and egoistic pontification. Poverty vis-à-vis ignorance and weak civic competence In summary, as the foregoing discussion shows, the anti-corruption policy environment in Tanzania consists of both internal and external factors. The extent to which external factors influence the anti-corruption policy depends in part on internal features of the Tanzanian state. External factors include donor agencies, international and regional intergovernmental instruments against corruption while internal factors consist of political, economic and social policy structure of the Tanzanian State. We also need to appreciate that the effects of external influences depend largely on internal governance policy and practices. This is basically a function of the fact that internal factors favourable to external influence tend to magnify the effects of external influences whereas internal conditions unfavourable to adoption of external influences tend to diminish their effects. The influence of several factors has manifested itself in the nomenclature of National Anti-Corruption Strategy and Action Plan II (NACSAP II) as a policy framework and mechanism of preventing corruption and promoting good governance in the country. The structural design of various state anti-corruption institutions such as the Prevention and Combating of Corruption Bureau (PCCB), the Ethics Secretariat, the
Corruption Perception Surveys Report: TANZANIA 2008
64
Financial Intelligence Unit and the Commission for Human Rights and Good Governance is also the function of power leverage of different actors, forces and the context of governance in the country. Not least, is the behaviour of actors, in their actions and inactions. The anti-corruption struggle is also influenced by the balance of power between actors and their interests within the existing political context.
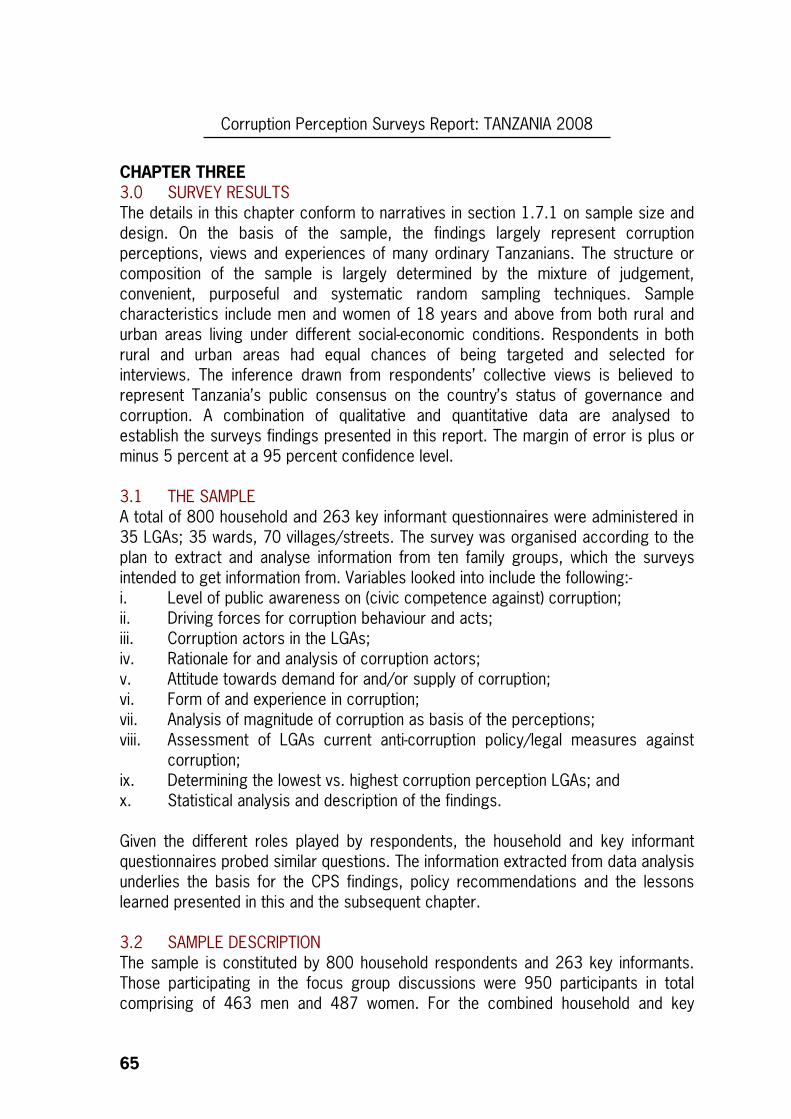
Corruption Perception Surveys Report: TANZANIA 2008
65
CHAPTER THREE
3.0 SURVEY RESULTS The details in this chapter conform to narratives in section 1.7.1 on sample size and design. On the basis of the sample, the findings largely represent corruption perceptions, views and experiences of many ordinary Tanzanians. The structure or composition of the sample is largely determined by the mixture of judgement, convenient, purposeful and systematic random sampling techniques. Sample characteristics include men and women of 18 years and above from both rural and urban areas living under different social-economic conditions. Respondents in both rural and urban areas had equal chances of being targeted and selected for interviews. The inference drawn from respondents’ collective views is believed to represent Tanzania’s public consensus on the country’s status of governance and corruption. A combination of qualitative and quantitative data are analysed to establish the surveys findings presented in this report. The margin of error is plus or minus 5 percent at a 95 percent confidence level. 3.1 THE SAMPLE A total of 800 household and 263 key informant questionnaires were administered in 35 LGAs; 35 wards, 70 villages/streets. The survey was organised according to the plan to extract and analyse information from ten family groups, which the surveys intended to get information from. Variables looked into include the following:- i. Level of public awareness on (civic competence against) corruption; ii. Driving forces for corruption behaviour and acts; iii. Corruption actors in the LGAs; iv. Rationale for and analysis of corruption actors; v. Attitude towards demand for and/or supply of corruption; vi. Form of and experience in corruption; vii. Analysis of magnitude of corruption as basis of the perceptions; viii. Assessment of LGAs current anti-corruption policy/legal measures against
corruption; ix. Determining the lowest vs. highest corruption perception LGAs; and x. Statistical analysis and description of the findings. Given the different roles played by respondents, the household and key informant questionnaires probed similar questions. The information extracted from data analysis underlies the basis for the CPS findings, policy recommendations and the lessons learned presented in this and the subsequent chapter. 3.2 SAMPLE DESCRIPTION The sample is constituted by 800 household respondents and 263 key informants. Those participating in the focus group discussions were 950 participants in total comprising of 463 men and 487 women. For the combined household and key
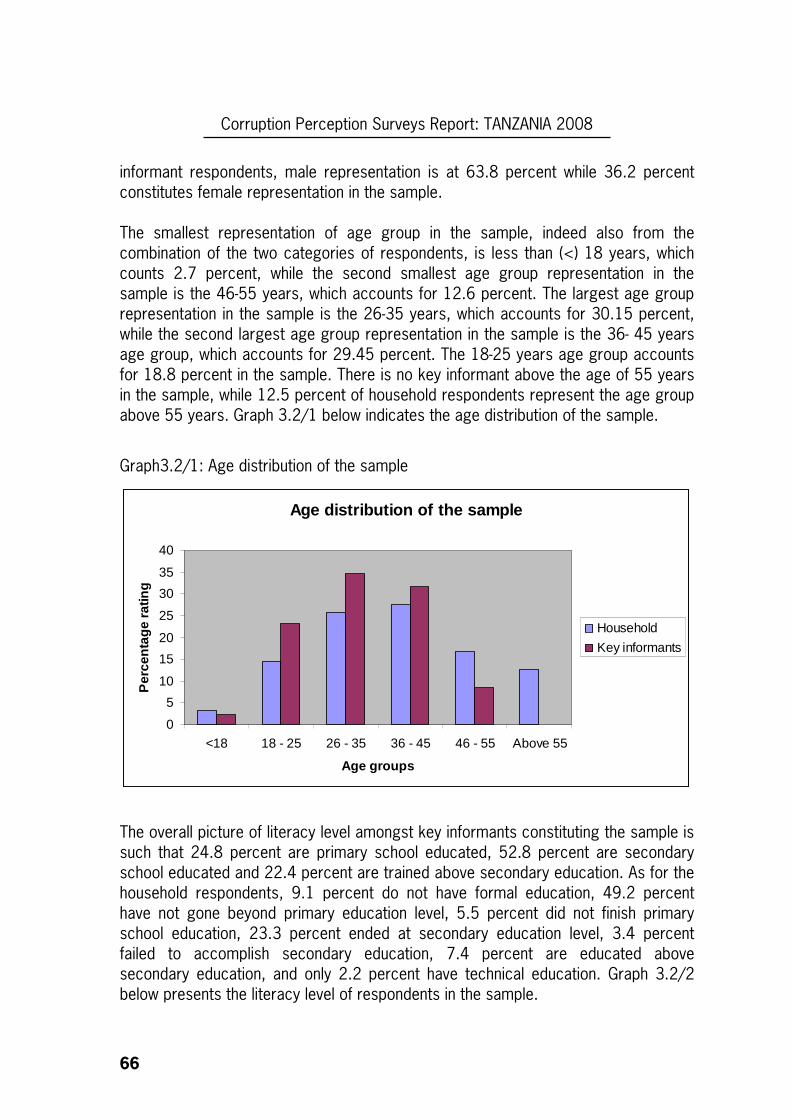
Corruption Perception Surveys Report: TANZANIA 2008
66
informant respondents, male representation is at 63.8 percent while 36.2 percent constitutes female representation in the sample. The smallest representation of age group in the sample, indeed also from the combination of the two categories of respondents, is less than (<) 18 years, which counts 2.7 percent, while the second smallest age group representation in the sample is the 46-55 years, which accounts for 12.6 percent. The largest age group representation in the sample is the 26-35 years, which accounts for 30.15 percent, while the second largest age group representation in the sample is the 36- 45 years age group, which accounts for 29.45 percent. The 18-25 years age group accounts for 18.8 percent in the sample. There is no key informant above the age of 55 years in the sample, while 12.5 percent of household respondents represent the age group above 55 years. Graph 3.2/1 below indicates the age distribution of the sample.
Graph3.2/1: Age distribution of the sample
Age distribution of the sample
0
5
10
15
20
25
30
35
40
<18 18 - 25 26 - 35 36 - 45 46 - 55 Above 55
Age groups
Per
cent
age
ratin
g
Household
Key informants
The overall picture of literacy level amongst key informants constituting the sample is such that 24.8 percent are primary school educated, 52.8 percent are secondary school educated and 22.4 percent are trained above secondary education. As for the household respondents, 9.1 percent do not have formal education, 49.2 percent have not gone beyond primary education level, 5.5 percent did not finish primary school education, 23.3 percent ended at secondary education level, 3.4 percent failed to accomplish secondary education, 7.4 percent are educated above secondary education, and only 2.2 percent have technical education. Graph 3.2/2 below presents the literacy level of respondents in the sample.
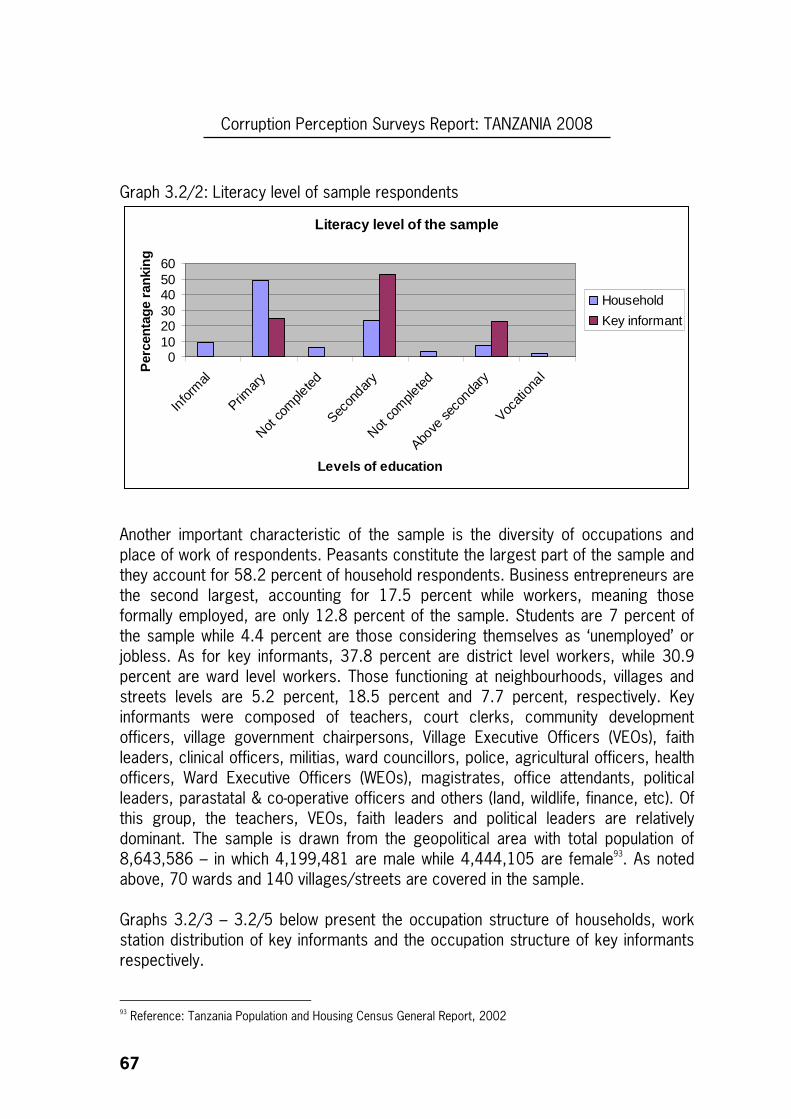
Corruption Perception Surveys Report: TANZANIA 2008
67
Graph 3.2/2: Literacy level of sample respondents
Literacy level of the sample
0102030405060
Infor
mal
Primar
y
Not co
mple
ted
Secon
dary
Not co
mple
ted
Above
seco
ndary
Vocati
onal
Levels of education
Per
cent
age
rank
ing
Household
Key informant
Another important characteristic of the sample is the diversity of occupations and place of work of respondents. Peasants constitute the largest part of the sample and they account for 58.2 percent of household respondents. Business entrepreneurs are the second largest, accounting for 17.5 percent while workers, meaning those formally employed, are only 12.8 percent of the sample. Students are 7 percent of the sample while 4.4 percent are those considering themselves as ‘unemployed’ or jobless. As for key informants, 37.8 percent are district level workers, while 30.9 percent are ward level workers. Those functioning at neighbourhoods, villages and streets levels are 5.2 percent, 18.5 percent and 7.7 percent, respectively. Key informants were composed of teachers, court clerks, community development officers, village government chairpersons, Village Executive Officers (VEOs), faith leaders, clinical officers, militias, ward councillors, police, agricultural officers, health officers, Ward Executive Officers (WEOs), magistrates, office attendants, political leaders, parastatal & co-operative officers and others (land, wildlife, finance, etc). Of this group, the teachers, VEOs, faith leaders and political leaders are relatively dominant. The sample is drawn from the geopolitical area with total population of 8,643,586 – in which 4,199,481 are male while 4,444,105 are female93. As noted above, 70 wards and 140 villages/streets are covered in the sample. Graphs 3.2/3 – 3.2/5 below present the occupation structure of households, work station distribution of key informants and the occupation structure of key informants respectively.
93 Reference: Tanzania Population and Housing Census General Report, 2002
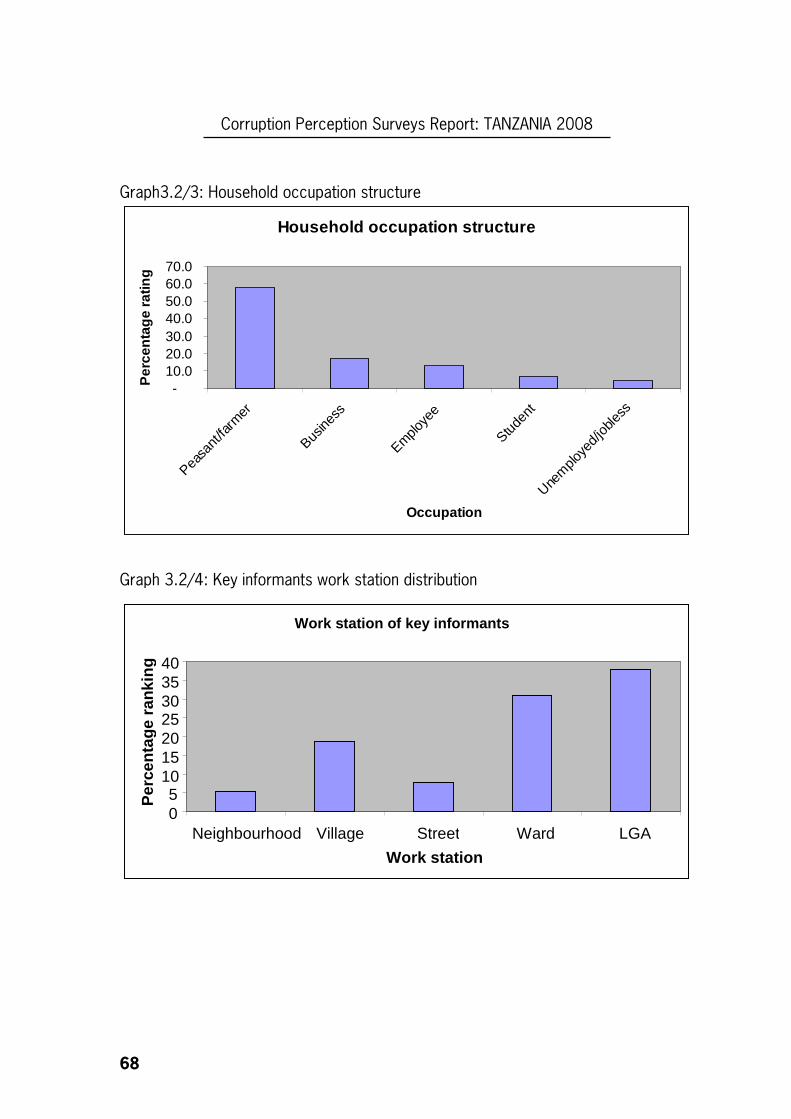
Corruption Perception Surveys Report: TANZANIA 2008
68
Graph3.2/3: Household occupation structure
Household occupation structure
-10.020.030.040.050.060.070.0
Peasa
nt/fa
rmer
Busine
ss
Employe
e
Studen
t
Unem
ploye
d/job
less
Occupation
Per
cent
age
ratin
g
Graph 3.2/4: Key informants work station distribution
Work station of key informants
05
10152025303540
Neighbourhood Village Street Ward LGA
Work station
Per
cent
age
rank
ing
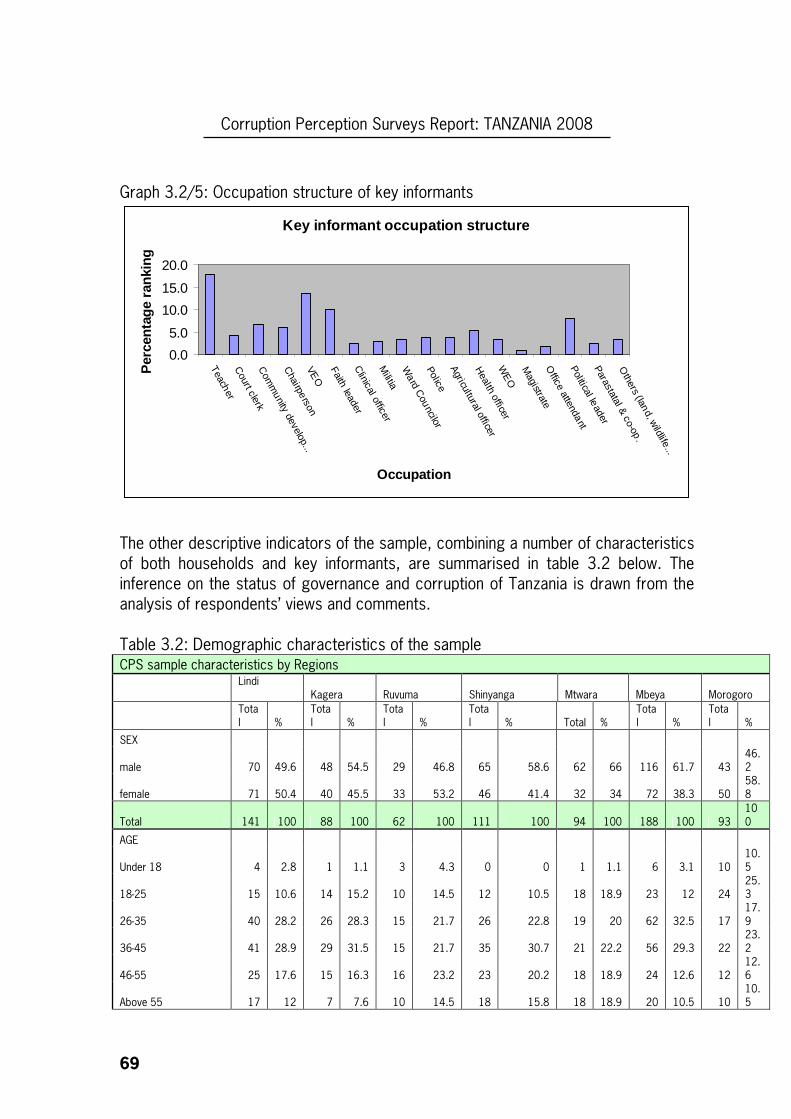
Corruption Perception Surveys Report: TANZANIA 2008
69
Graph 3.2/5: Occupation structure of key informants
Key informant occupation structure
0.0
5.0
10.0
15.0
20.0
TeacherC
ourt clerkC
omm
unity develop...
Chairperson
VEO
Faith leaderC
linical officerM
ilitiaW
ard Councilor
PoliceAgricultural officerH
ealth officerW
EO
Magistrate
Office attendant
Political leaderParastatal & co-op.
Others (land, w
ildlife...
Occupation
Per
cent
age
rank
ing
The other descriptive indicators of the sample, combining a number of characteristics of both households and key informants, are summarised in table 3.2 below. The inference on the status of governance and corruption of Tanzania is drawn from the analysis of respondents’ views and comments. Table 3.2: Demographic characteristics of the sample CPS sample characteristics by Regions
Lindi Kagera Ruvuma Shinyanga Mtwara Mbeya Morogoro
Total %
Total %
Total %
Total % Total %
Total %
Total %
SEX
male 70 49.6 48 54.5 29 46.8 65 58.6 62 66 116 61.7 43 46.2
female 71 50.4 40 45.5 33 53.2 46 41.4 32 34 72 38.3 50 58.8
Total 141 100 88 100 62 100 111 100 94 100 188 100 93 100
AGE
Under 18 4 2.8 1 1.1 3 4.3 0 0 1 1.1 6 3.1 10 10.5
18-25 15 10.6 14 15.2 10 14.5 12 10.5 18 18.9 23 12 24 25.3
26-35 40 28.2 26 28.3 15 21.7 26 22.8 19 20 62 32.5 17 17.9
36-45 41 28.9 29 31.5 15 21.7 35 30.7 21 22.2 56 29.3 22 23.2
46-55 25 17.6 15 16.3 16 23.2 23 20.2 18 18.9 24 12.6 12 12.6
Above 55 17 12 7 7.6 10 14.5 18 15.8 18 18.9 20 10.5 10 10.5
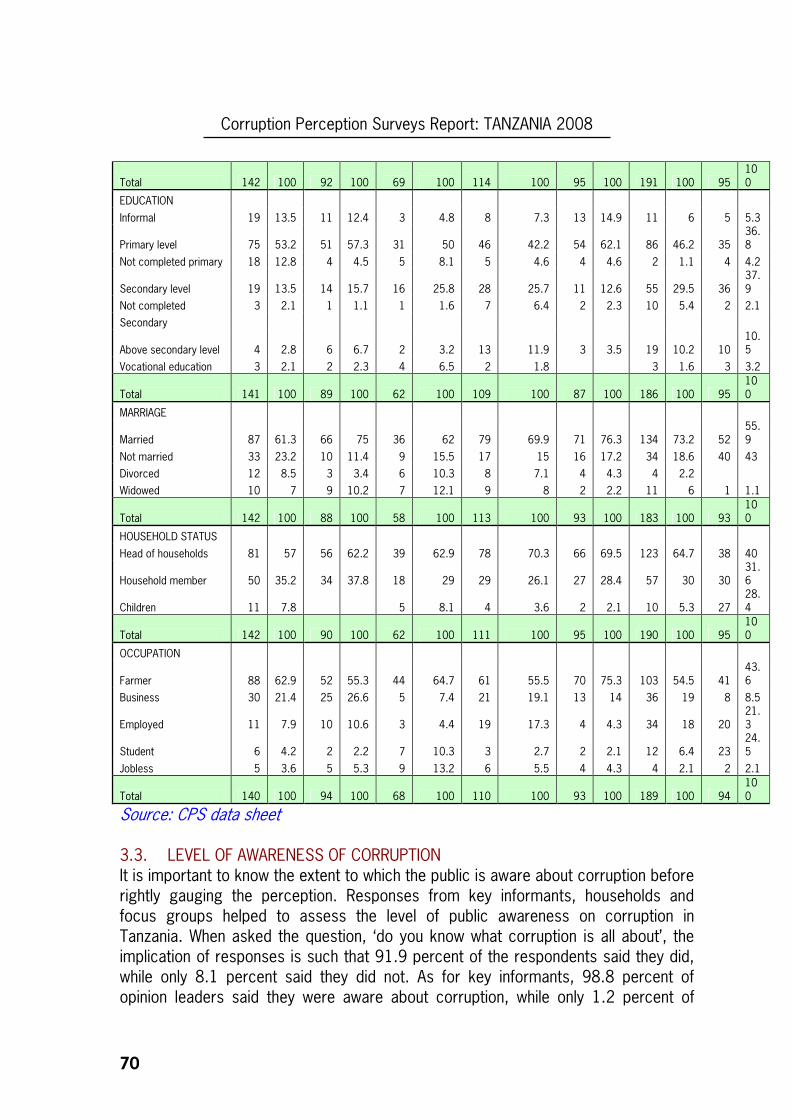
Corruption Perception Surveys Report: TANZANIA 2008
70
Total 142 100 92 100 69 100 114 100 95 100 191 100 95 100
EDUCATION
Informal 19 13.5 11 12.4 3 4.8 8 7.3 13 14.9 11 6 5 5.3
Primary level 75 53.2 51 57.3 31 50 46 42.2 54 62.1 86 46.2 35 36.8
Not completed primary 18 12.8 4 4.5 5 8.1 5 4.6 4 4.6 2 1.1 4 4.2
Secondary level 19 13.5 14 15.7 16 25.8 28 25.7 11 12.6 55 29.5 36 37.9
Not completed 3 2.1 1 1.1 1 1.6 7 6.4 2 2.3 10 5.4 2 2.1
Secondary
Above secondary level 4 2.8 6 6.7 2 3.2 13 11.9 3 3.5 19 10.2 10 10.5
Vocational education 3 2.1 2 2.3 4 6.5 2 1.8 3 1.6 3 3.2
Total 141 100 89 100 62 100 109 100 87 100 186 100 95 100
MARRIAGE
Married 87 61.3 66 75 36 62 79 69.9 71 76.3 134 73.2 52 55.9
Not married 33 23.2 10 11.4 9 15.5 17 15 16 17.2 34 18.6 40 43
Divorced 12 8.5 3 3.4 6 10.3 8 7.1 4 4.3 4 2.2
Widowed 10 7 9 10.2 7 12.1 9 8 2 2.2 11 6 1 1.1
Total 142 100 88 100 58 100 113 100 93 100 183 100 93 100
HOUSEHOLD STATUS
Head of households 81 57 56 62.2 39 62.9 78 70.3 66 69.5 123 64.7 38 40
Household member 50 35.2 34 37.8 18 29 29 26.1 27 28.4 57 30 30 31.6
Children 11 7.8 5 8.1 4 3.6 2 2.1 10 5.3 27 28.4
Total 142 100 90 100 62 100 111 100 95 100 190 100 95 100
OCCUPATION
Farmer 88 62.9 52 55.3 44 64.7 61 55.5 70 75.3 103 54.5 41 43.6
Business 30 21.4 25 26.6 5 7.4 21 19.1 13 14 36 19 8 8.5
Employed 11 7.9 10 10.6 3 4.4 19 17.3 4 4.3 34 18 20 21.3
Student 6 4.2 2 2.2 7 10.3 3 2.7 2 2.1 12 6.4 23 24.5
Jobless 5 3.6 5 5.3 9 13.2 6 5.5 4 4.3 4 2.1 2 2.1
Total 140 100 94 100 68 100 110 100 93 100 189 100 94 100
Source: CPS data sheet 3.3. LEVEL OF AWARENESS OF CORRUPTION It is important to know the extent to which the public is aware about corruption before rightly gauging the perception. Responses from key informants, households and focus groups helped to assess the level of public awareness on corruption in Tanzania. When asked the question, ‘do you know what corruption is all about’, the implication of responses is such that 91.9 percent of the respondents said they did, while only 8.1 percent said they did not. As for key informants, 98.8 percent of opinion leaders said they were aware about corruption, while only 1.2 percent of
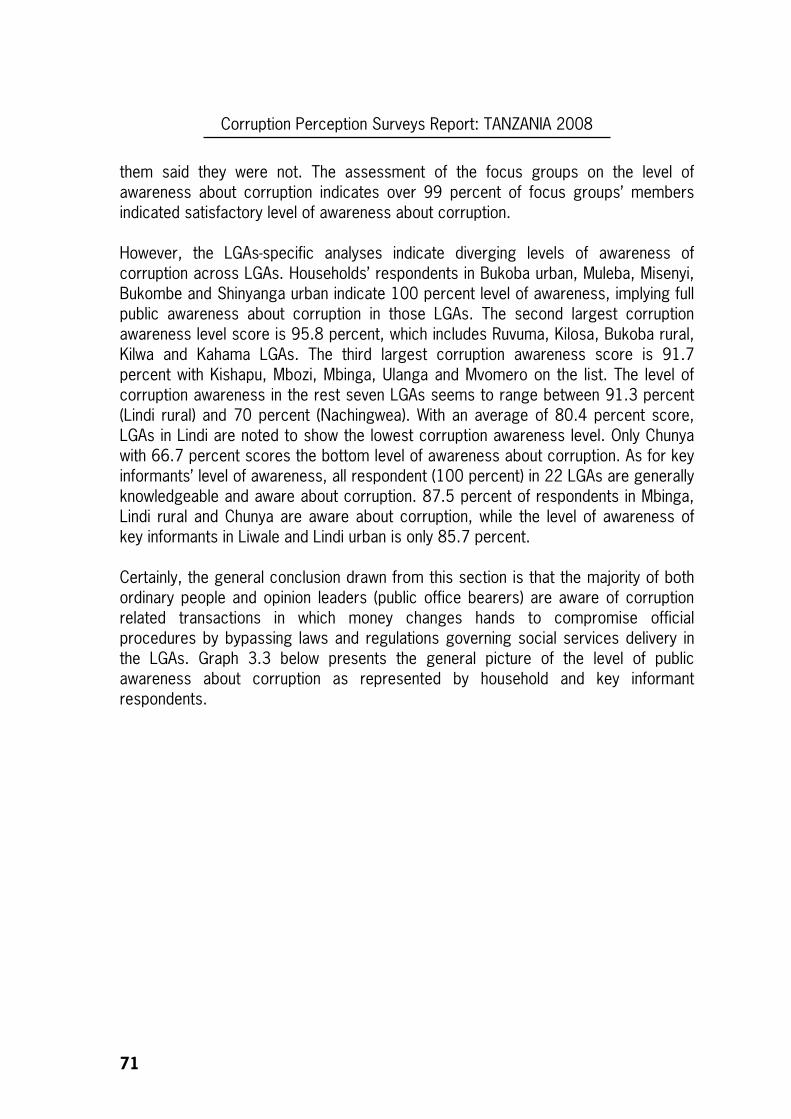
Corruption Perception Surveys Report: TANZANIA 2008
71
them said they were not. The assessment of the focus groups on the level of awareness about corruption indicates over 99 percent of focus groups’ members indicated satisfactory level of awareness about corruption. However, the LGAs-specific analyses indicate diverging levels of awareness of corruption across LGAs. Households’ respondents in Bukoba urban, Muleba, Misenyi, Bukombe and Shinyanga urban indicate 100 percent level of awareness, implying full public awareness about corruption in those LGAs. The second largest corruption awareness level score is 95.8 percent, which includes Ruvuma, Kilosa, Bukoba rural, Kilwa and Kahama LGAs. The third largest corruption awareness score is 91.7 percent with Kishapu, Mbozi, Mbinga, Ulanga and Mvomero on the list. The level of corruption awareness in the rest seven LGAs seems to range between 91.3 percent (Lindi rural) and 70 percent (Nachingwea). With an average of 80.4 percent score, LGAs in Lindi are noted to show the lowest corruption awareness level. Only Chunya with 66.7 percent scores the bottom level of awareness about corruption. As for key informants’ level of awareness, all respondent (100 percent) in 22 LGAs are generally knowledgeable and aware about corruption. 87.5 percent of respondents in Mbinga, Lindi rural and Chunya are aware about corruption, while the level of awareness of key informants in Liwale and Lindi urban is only 85.7 percent. Certainly, the general conclusion drawn from this section is that the majority of both ordinary people and opinion leaders (public office bearers) are aware of corruption related transactions in which money changes hands to compromise official procedures by bypassing laws and regulations governing social services delivery in the LGAs. Graph 3.3 below presents the general picture of the level of public awareness about corruption as represented by household and key informant respondents.
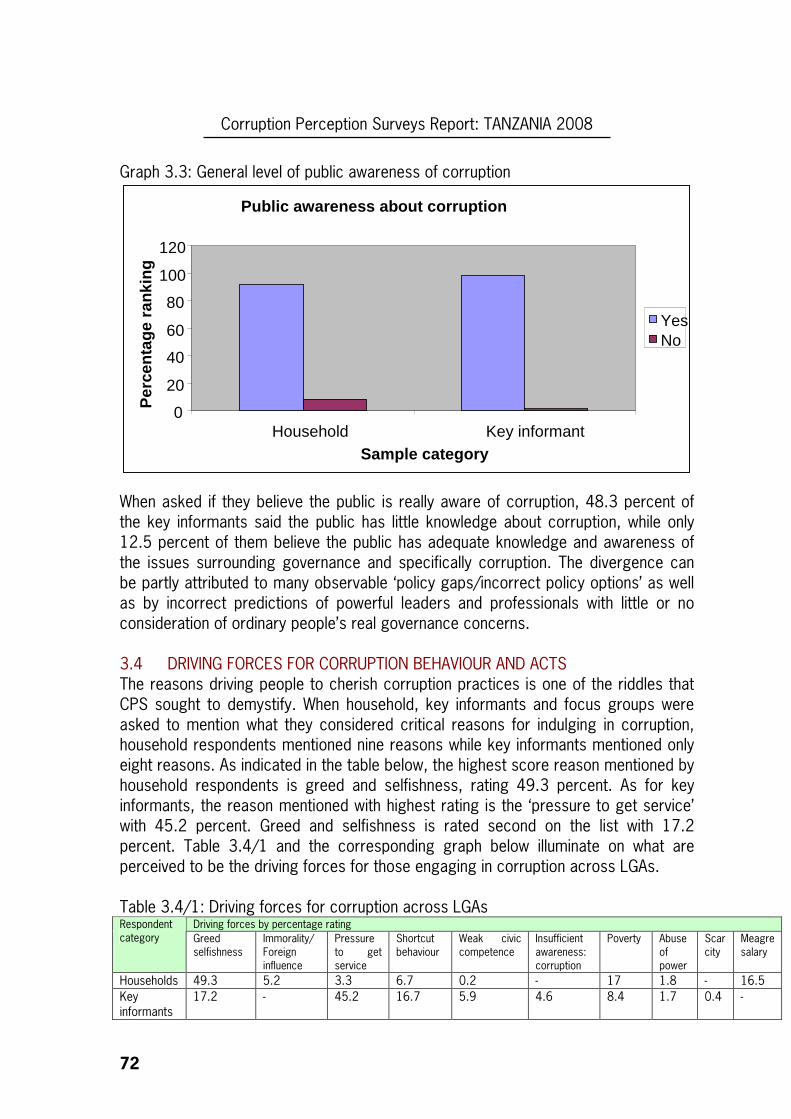
Corruption Perception Surveys Report: TANZANIA 2008
72
Graph 3.3: General level of public awareness of corruption
When asked if they believe the public is really aware of corruption, 48.3 percent of the key informants said the public has little knowledge about corruption, while only 12.5 percent of them believe the public has adequate knowledge and awareness of the issues surrounding governance and specifically corruption. The divergence can be partly attributed to many observable ‘policy gaps/incorrect policy options’ as well as by incorrect predictions of powerful leaders and professionals with little or no consideration of ordinary people’s real governance concerns. 3.4 DRIVING FORCES FOR CORRUPTION BEHAVIOUR AND ACTS The reasons driving people to cherish corruption practices is one of the riddles that CPS sought to demystify. When household, key informants and focus groups were asked to mention what they considered critical reasons for indulging in corruption, household respondents mentioned nine reasons while key informants mentioned only eight reasons. As indicated in the table below, the highest score reason mentioned by household respondents is greed and selfishness, rating 49.3 percent. As for key informants, the reason mentioned with highest rating is the ‘pressure to get service’ with 45.2 percent. Greed and selfishness is rated second on the list with 17.2 percent. Table 3.4/1 and the corresponding graph below illuminate on what are perceived to be the driving forces for those engaging in corruption across LGAs. Table 3.4/1: Driving forces for corruption across LGAs
Driving forces by percentage rating Respondent category Greed
selfishness Immorality/ Foreign influence
Pressure to get service
Shortcut behaviour
Weak civic competence
Insufficient awareness: corruption
Poverty Abuse of power
Scarcity
Meagre salary
Households 49.3 5.2 3.3 6.7 0.2 - 17 1.8 - 16.5 Key informants
17.2 - 45.2 16.7 5.9 4.6 8.4 1.7 0.4 -
Public awareness about corruption
0
20
40
60
80
100
120
Household Key informantSample category
Per
cent
age
rank
ing
Yes No
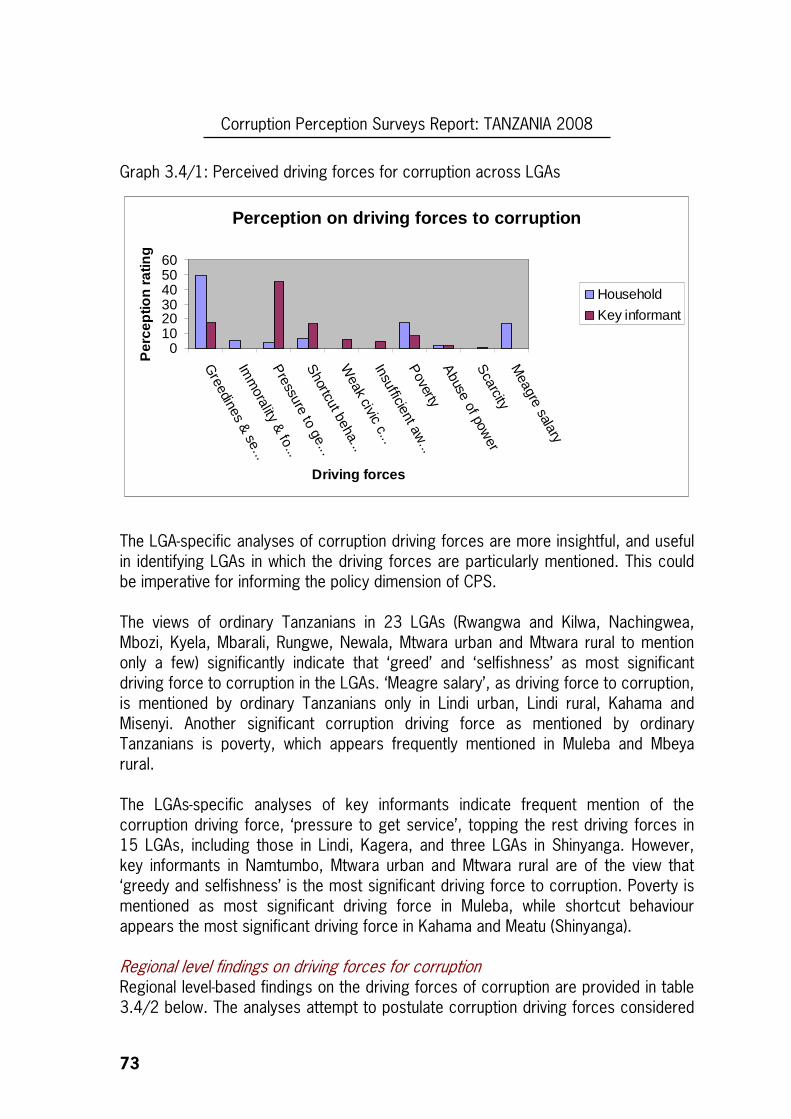
Corruption Perception Surveys Report: TANZANIA 2008
73
Graph 3.4/1: Perceived driving forces for corruption across LGAs
Perception on driving forces to corruption
0102030405060
Greedines &
se...Im
morality &
fo...P
ressure to ge...S
hortcut beha...W
eak civic c...Insufficient aw
...P
overtyA
buse of power
Scarcity
Meagre salary
Driving forces
Per
cept
ion
ratin
g
Household
Key informant
The LGA-specific analyses of corruption driving forces are more insightful, and useful in identifying LGAs in which the driving forces are particularly mentioned. This could be imperative for informing the policy dimension of CPS. The views of ordinary Tanzanians in 23 LGAs (Rwangwa and Kilwa, Nachingwea, Mbozi, Kyela, Mbarali, Rungwe, Newala, Mtwara urban and Mtwara rural to mention only a few) significantly indicate that ‘greed’ and ‘selfishness’ as most significant driving force to corruption in the LGAs. ‘Meagre salary’, as driving force to corruption, is mentioned by ordinary Tanzanians only in Lindi urban, Lindi rural, Kahama and Misenyi. Another significant corruption driving force as mentioned by ordinary Tanzanians is poverty, which appears frequently mentioned in Muleba and Mbeya rural. The LGAs-specific analyses of key informants indicate frequent mention of the corruption driving force, ‘pressure to get service’, topping the rest driving forces in 15 LGAs, including those in Lindi, Kagera, and three LGAs in Shinyanga. However, key informants in Namtumbo, Mtwara urban and Mtwara rural are of the view that ‘greedy and selfishness’ is the most significant driving force to corruption. Poverty is mentioned as most significant driving force in Muleba, while shortcut behaviour appears the most significant driving force in Kahama and Meatu (Shinyanga). Regional level findings on driving forces for corruption Regional level-based findings on the driving forces of corruption are provided in table 3.4/2 below. The analyses attempt to postulate corruption driving forces considered
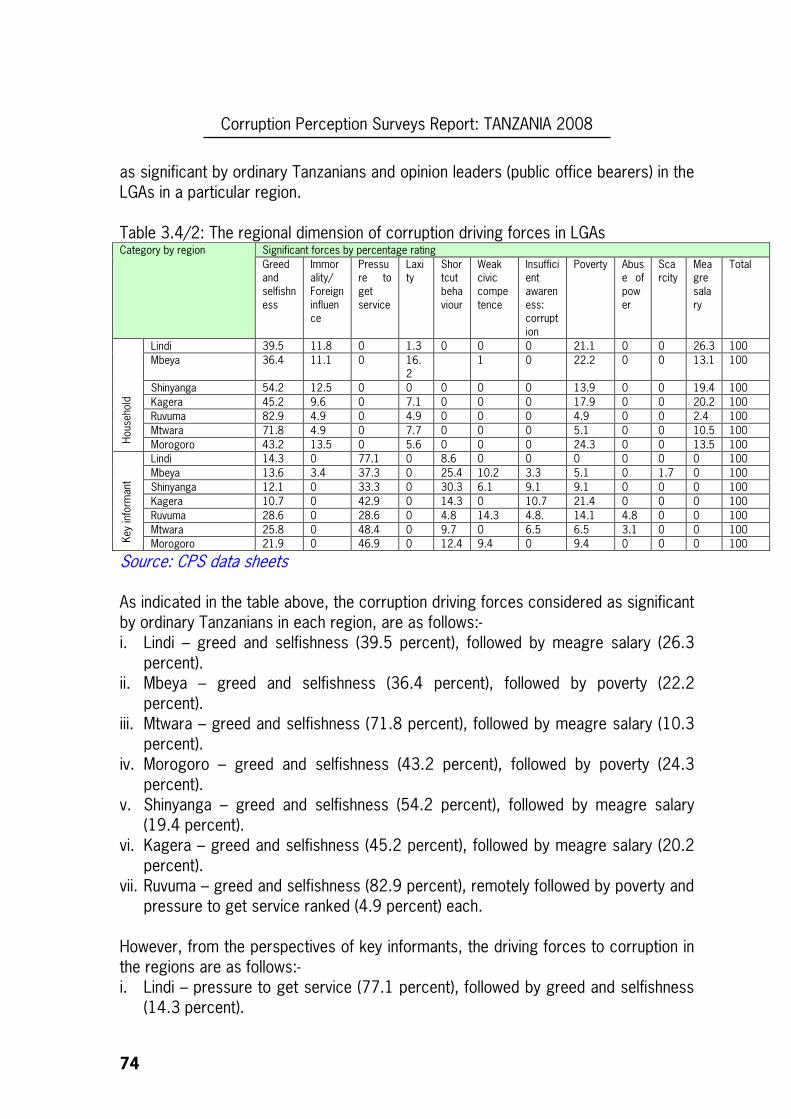
Corruption Perception Surveys Report: TANZANIA 2008
74
as significant by ordinary Tanzanians and opinion leaders (public office bearers) in the LGAs in a particular region. Table 3.4/2: The regional dimension of corruption driving forces in LGAs
Significant forces by percentage rating Category by region Greed and selfishness
Immorality/ Foreign influence
Pressure to get service
Laxity
Shortcut behaviour
Weak civic competence
Insufficient awareness: corruption
Poverty Abuse of power
Scarcity
Meagre salary
Total
Lindi 39.5 11.8 0 1.3 0 0 0 21.1 0 0 26.3 100 Mbeya 36.4 11.1 0 16.
2 1 0 22.2 0 0 13.1 100
Shinyanga 54.2 12.5 0 0 0 0 0 13.9 0 0 19.4 100 Kagera 45.2 9.6 0 7.1 0 0 0 17.9 0 0 20.2 100 Ruvuma 82.9 4.9 0 4.9 0 0 0 4.9 0 0 2.4 100 Mtwara 71.8 4.9 0 7.7 0 0 0 5.1 0 0 10.5 100
Hous
ehold
Morogoro 43.2 13.5 0 5.6 0 0 0 24.3 0 0 13.5 100 Lindi 14.3 0 77.1 0 8.6 0 0 0 0 0 0 100 Mbeya 13.6 3.4 37.3 0 25.4 10.2 3.3 5.1 0 1.7 0 100 Shinyanga 12.1 0 33.3 0 30.3 6.1 9.1 9.1 0 0 0 100 Kagera 10.7 0 42.9 0 14.3 0 10.7 21.4 0 0 0 100 Ruvuma 28.6 0 28.6 0 4.8 14.3 4.8. 14.1 4.8 0 0 100 Mtwara 25.8 0 48.4 0 9.7 0 6.5 6.5 3.1 0 0 100
Key
info
rman
t
Morogoro 21.9 0 46.9 0 12.4 9.4 0 9.4 0 0 0 100
Source: CPS data sheets As indicated in the table above, the corruption driving forces considered as significant by ordinary Tanzanians in each region, are as follows:- i. Lindi – greed and selfishness (39.5 percent), followed by meagre salary (26.3
percent). ii. Mbeya – greed and selfishness (36.4 percent), followed by poverty (22.2
percent). iii. Mtwara – greed and selfishness (71.8 percent), followed by meagre salary (10.3
percent). iv. Morogoro – greed and selfishness (43.2 percent), followed by poverty (24.3
percent). v. Shinyanga – greed and selfishness (54.2 percent), followed by meagre salary
(19.4 percent). vi. Kagera – greed and selfishness (45.2 percent), followed by meagre salary (20.2
percent). vii. Ruvuma – greed and selfishness (82.9 percent), remotely followed by poverty and
pressure to get service ranked (4.9 percent) each. However, from the perspectives of key informants, the driving forces to corruption in the regions are as follows:- i. Lindi – pressure to get service (77.1 percent), followed by greed and selfishness
(14.3 percent).
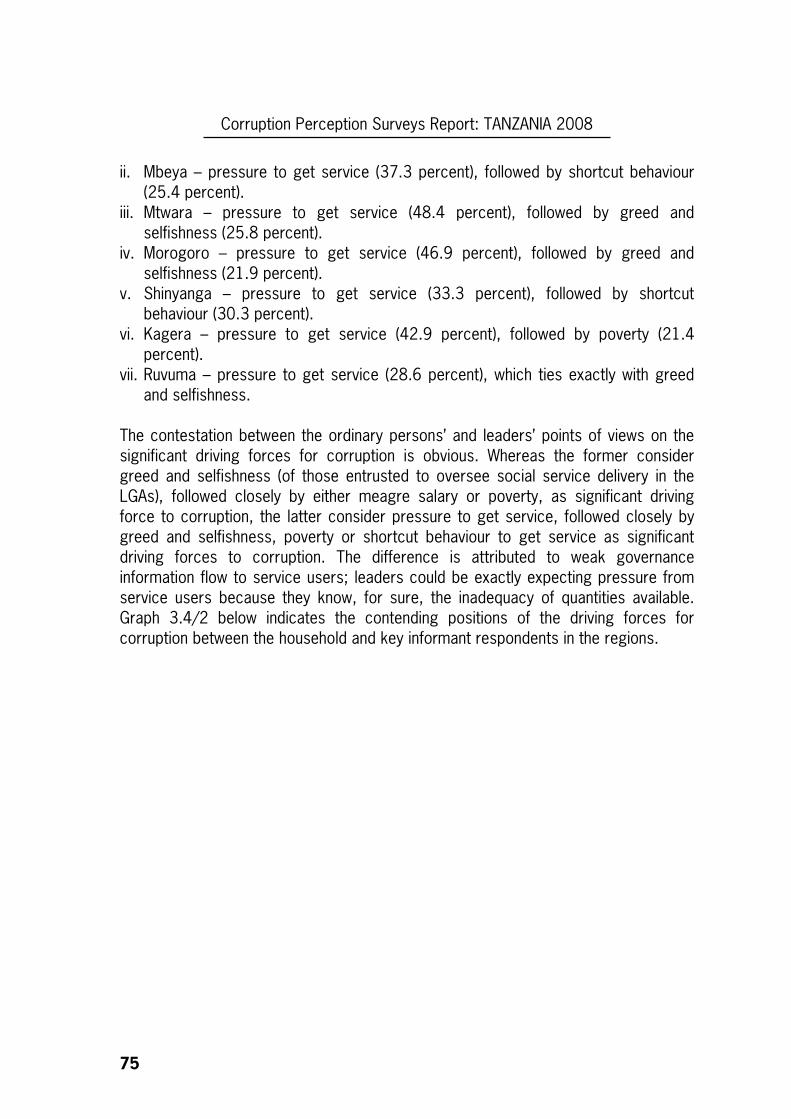
Corruption Perception Surveys Report: TANZANIA 2008
75
ii. Mbeya – pressure to get service (37.3 percent), followed by shortcut behaviour (25.4 percent).
iii. Mtwara – pressure to get service (48.4 percent), followed by greed and selfishness (25.8 percent).
iv. Morogoro – pressure to get service (46.9 percent), followed by greed and selfishness (21.9 percent).
v. Shinyanga – pressure to get service (33.3 percent), followed by shortcut behaviour (30.3 percent).
vi. Kagera – pressure to get service (42.9 percent), followed by poverty (21.4 percent).
vii. Ruvuma – pressure to get service (28.6 percent), which ties exactly with greed and selfishness.
The contestation between the ordinary persons’ and leaders’ points of views on the significant driving forces for corruption is obvious. Whereas the former consider greed and selfishness (of those entrusted to oversee social service delivery in the LGAs), followed closely by either meagre salary or poverty, as significant driving force to corruption, the latter consider pressure to get service, followed closely by greed and selfishness, poverty or shortcut behaviour to get service as significant driving forces to corruption. The difference is attributed to weak governance information flow to service users; leaders could be exactly expecting pressure from service users because they know, for sure, the inadequacy of quantities available. Graph 3.4/2 below indicates the contending positions of the driving forces for corruption between the household and key informant respondents in the regions.
Corruption Perception Surveys Report: TANZANIA 2008
76
Graph 3.4/2: Driving forces for corruption: contending positions of ‘ordinary persons’ and ‘leaders’
Driving forces for corruption: contending positions of 'ordinary persons' and 'leaders'
0
10
20
30
40
50
60
70
80
90
Lind
i
Mbe
ya
Shi
nyan
ga
Kag
era
Ruv
uma
Mtw
ara
Mor
ogor
o
Lind
i
Mbe
ya
Shi
nyan
ga
Kag
era
Ruv
uma
Mtw
ara
Mor
ogor
o
Household Key Informant
Regions
Cor
rupt
ion
driv
ing
forc
es r
anki
ng
Greed&selfishness
Short-cut behaviour
Pressure to get service
Poverty
Meagre salary
3.5 CORRUPTION ACTORS IN THE LGAs For convenient purposes, corruption actors in the LGAs, , are referred to as ‘a set of persons, organisations, institutions, departments and/or agencies’ with interest in the governance functions across LGAs. A set of questions were targeted to the two major groups of the respondents starting with the household respondents. These were asked whether they thought corruption was a socially bad or negative phenomena and to give the basis of their responses. A total of 71.6 percent said it was a socially bad phenomenon. Of these, 30.4 percent said it was bad because it denied people of their erstwhile rights to access and use the social services. They were followed by another 22.8 percent who said corruption diverted/eroded public trust in the judicial system while another 18.4 percent said it was bad because it made them pay bribes to access social services, which are supposed to be provided free of charge. When key informants were asked the same question, their responses were such that 34.1 percent hate corruption because it denies people of their basic rights; the opinion of 26.6 percent was that corruption further discriminates against the poor; and that corruption exacerbates poverty and it is against the law (17.1 percent and
Corruption Perception Surveys Report: TANZANIA 2008
77
13.9 percent respectively). The message emanating from these responses is that corruption actors are full aware about the negative effect and impact that corruption causes to society, which indeed, is against to the tenets of good governance. In the same vein, 91.4 percent of key informants (leaders) believe the citizens know that corruption is rampant in the LGAs, and therefore, a social problem. However, only 3.4 percent of the key informant respondents believe the cooperation of non-state actors with the Government is the right strategy to eliminate corruption from the society. But 20.7 percent of the same category considers corruption as normal act that gives option for those who afford to pay to get the social services they need. When asked about whether and the extent to which the departments under their charge are suspected of corruption by the public, 49.2 percent confirmed the suspicions, while 50.8 percent rejected. For those who conceded, 25.4 percent rate such suspicions as ‘very little’, 34.5 percent rate them as ‘little’, while 28.2 percent are aware that the suspicions are ‘significant’, with 12 percent rating corruption suspicions against their departments as ‘above tolerable level’. When household respondents were asked to opine whether or not corruption is on the increase or is declining, 84.6 percent responded that it is increasing, while only 15.4 said it is going downwards. 3.6 RATIONALE FOR AND ANALYSIS OF CORRUPTION ACTORS Relying on the existing literature, including media reports, the departments/institutions charged with social service and ‘public goods’ delivery in the LGAs were primarily targeted and selected as potential corruption actors in the LGAs. To that effect, there is an underlying assumption that provision of public goods or delivery of social services brings the public (users) and LGAs (Government) into regular contacts in which the application of good governance principles is considered critical. To this end, the departments, agencies organisations and institutions in the LGAs are considered as potential corruption actors under CPS. The rigorous assessment measures are then applied to evaluate the practices, systems and structures of governance in the LGAs departments, institutions, agencies and organisations. The departments of education, health, lands and housing, license and revenue, Judiciary, police, office of the District Development Director (DED), natural resources, water and sewerage, power utility (TANESCO), TACAIDS, cooperatives, road works, and Ward Development Councils (WDCs) were subjected to evaluation by household respondents, representing the views of ordinary Tanzanians and the key informant respondents representing the views of leaders. When requested to rank those they consider principal final recipients of proceeds of corruption in each sector/department, household respondents ranked employees in the power utility (TANESCO), police, licensing/ revenue and health departments amongst the frequent recipients of bribes. The respective percentage rankings were
Corruption Perception Surveys Report: TANZANIA 2008
78
86.7 percent, 84.3 percent, 82.2 percent and 80.8 percent. This means therefore, LGAs corruption perception is basically due to the reception of bribes by employees in the respective departments, institutions, agencies and organisations in LGAs. Public office bearers at higher level of LGAs and their counterparts in the wards and villages are perceived as second and third frequent recipients of the proceeds of corruption/briberies. The trend of perceptions changes only in the WDCs, indicating ward/village-level public office bearers the frequent recipients of corruption proceeds/bribery, followed by employees in the LGAs departments, and finally LGAs office bearers in the offices of the DED. Leaders of political parties were perceived the least corrupt across all sectors. Their rating of corruption perception is between 2.8 percent in the judiciary, and 10.3 percent in the cooperatives. The higher percentage in the latter could be attributed to the historical relationship between politics and cooperatives in Tanzania. The perceptions of key informants are tallying exactly with those of ordinary Tanzanians, again pointing-out employees in the power utility (TANESCO), police, licensing/revenue and health departments as being amongst the frequent recipients of corruption proceeds, with the respective ranking of 79.6 percent, 79.7 percent, 74.8 percent and 72.9 percent. However, unlike the perceptions of ordinary Tanzanians, 74.5 percent of key informants rank employees in the water and sewerage agency, among the frequent recipients of corruption proceeds. Also unlike the perceptions of ordinary Tanzanians, key informants view public office bearers in the wards and villages under WDCs as less corrupt than are employees in the top most level of LGAs sectors/departments. The latter are ranked 45.4 percent while the former are ranked 31.6 percent. Generally, the perceptions of key informants retain similarities with those of perceptions of ordinary Tanzanians as noted above. The leaders of political parties again have the lowest corruption perception score, ranking of 4.6 percent for police, and 10.1 percent for cooperatives. Finally, the data was collated to get the full picture of corruption perception. The general picture of corruption perception is such that employees in the power utility (TANESCO) are leading, ranked by 83.2 percent, followed in descending order by police (82.0 percent), licensing & revenue (78.5 percent), health (76.9 percent), water & sewerage (76.3 percent), natural resources (73.5 percent), education (71.8 percent) and land & housing (70.4 percent). WDCs employees ranked by 42.7 percent, score the least corruption perception across departments in LGAs. There is conspicuous low ranking corruption perception for office bearers in the wards, villages, LGAs (top most level) and for leaders of political parties across the actors. This principally indicates existence of weak accountability mechanisms across LGAs. Table 3.6 and the corresponding graphs below present the overview of corruption perception ranking across actors – departments, institutions, organisations or
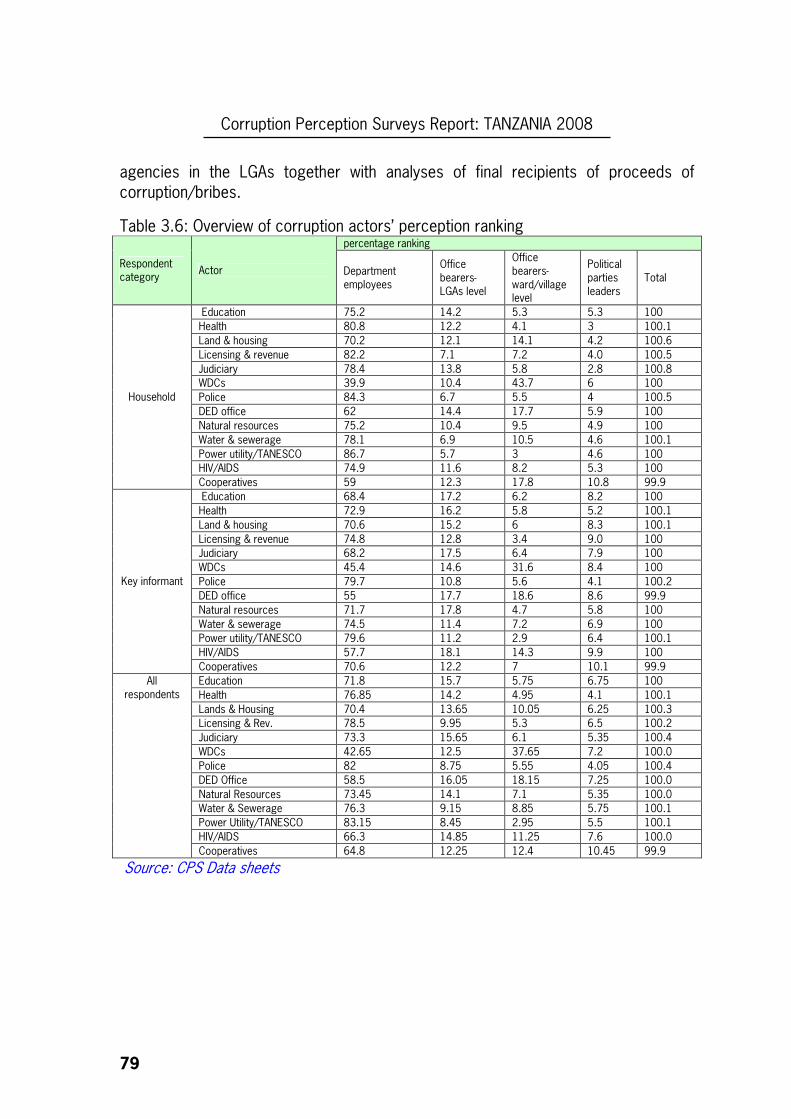
Corruption Perception Surveys Report: TANZANIA 2008
79
agencies in the LGAs together with analyses of final recipients of proceeds of corruption/bribes.
Table 3.6: Overview of corruption actors’ perception ranking percentage ranking
Respondent category
Actor Department employees
Office bearers-LGAs level
Office bearers-ward/village level
Political parties leaders
Total
Education 75.2 14.2 5.3 5.3 100 Health 80.8 12.2 4.1 3 100.1 Land & housing 70.2 12.1 14.1 4.2 100.6 Licensing & revenue 82.2 7.1 7.2 4.0 100.5 Judiciary 78.4 13.8 5.8 2.8 100.8 WDCs 39.9 10.4 43.7 6 100 Police 84.3 6.7 5.5 4 100.5 DED office 62 14.4 17.7 5.9 100 Natural resources 75.2 10.4 9.5 4.9 100 Water & sewerage 78.1 6.9 10.5 4.6 100.1 Power utility/TANESCO 86.7 5.7 3 4.6 100 HIV/AIDS 74.9 11.6 8.2 5.3 100
Household
Cooperatives 59 12.3 17.8 10.8 99.9 Education 68.4 17.2 6.2 8.2 100 Health 72.9 16.2 5.8 5.2 100.1 Land & housing 70.6 15.2 6 8.3 100.1 Licensing & revenue 74.8 12.8 3.4 9.0 100 Judiciary 68.2 17.5 6.4 7.9 100 WDCs 45.4 14.6 31.6 8.4 100 Police 79.7 10.8 5.6 4.1 100.2 DED office 55 17.7 18.6 8.6 99.9 Natural resources 71.7 17.8 4.7 5.8 100 Water & sewerage 74.5 11.4 7.2 6.9 100 Power utility/TANESCO 79.6 11.2 2.9 6.4 100.1 HIV/AIDS 57.7 18.1 14.3 9.9 100
Key informant
Cooperatives 70.6 12.2 7 10.1 99.9 Education 71.8 15.7 5.75 6.75 100 Health 76.85 14.2 4.95 4.1 100.1 Lands & Housing 70.4 13.65 10.05 6.25 100.3 Licensing & Rev. 78.5 9.95 5.3 6.5 100.2 Judiciary 73.3 15.65 6.1 5.35 100.4 WDCs 42.65 12.5 37.65 7.2 100.0 Police 82 8.75 5.55 4.05 100.4 DED Office 58.5 16.05 18.15 7.25 100.0 Natural Resources 73.45 14.1 7.1 5.35 100.0 Water & Sewerage 76.3 9.15 8.85 5.75 100.1 Power Utility/TANESCO 83.15 8.45 2.95 5.5 100.1 HIV/AIDS 66.3 14.85 11.25 7.6 100.0
All respondents
Cooperatives 64.8 12.25 12.4 10.45 99.9
Source: CPS Data sheets
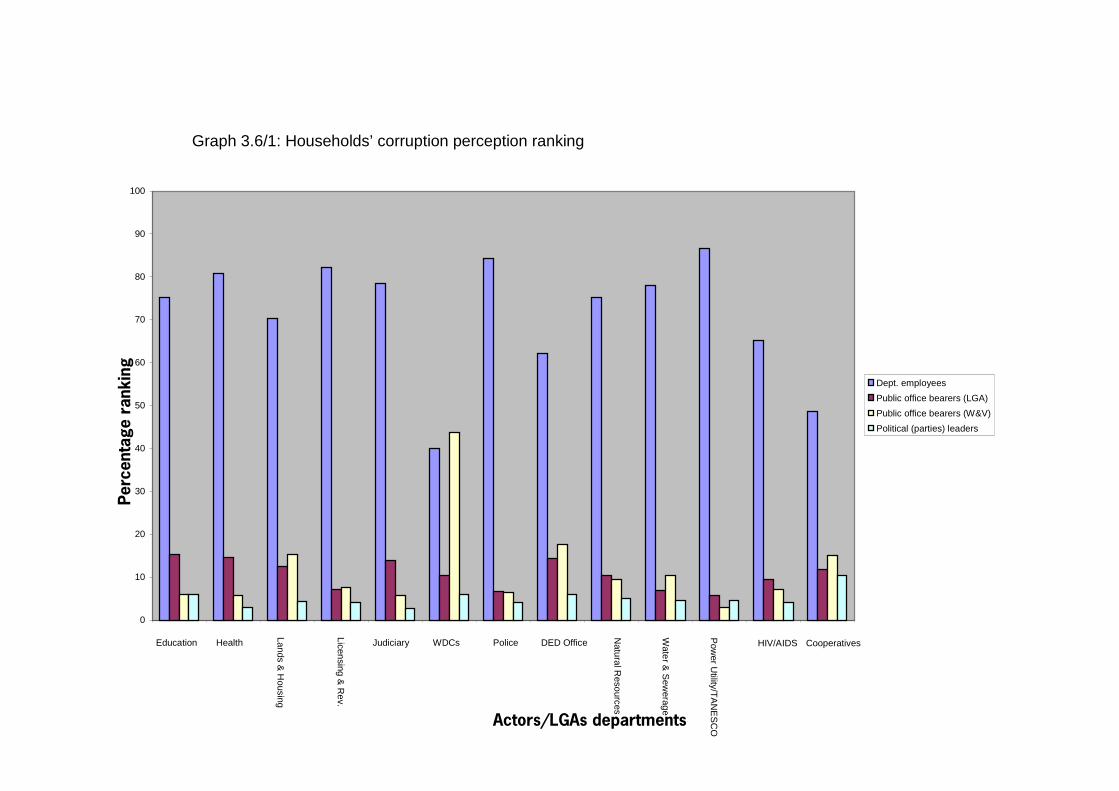
Graph 3.6/1: Households’ corruption perception ranking
0
10
20
30
40
50
60
70
80
90
100
Education Health Lands & H
ousing
Licensing & R
ev.
Judiciary WDCs Police DED Office Natural R
esources
Water &
Sew
erage
Pow
er Utility/T
AN
ES
CO
HIV/AIDS Cooperatives
Actors/LGAs departments
Perc
enta
ge r
ankin
g
Dept. employees Public office bearers (LGA) Public office bearers (W&V) Political (parties) leaders
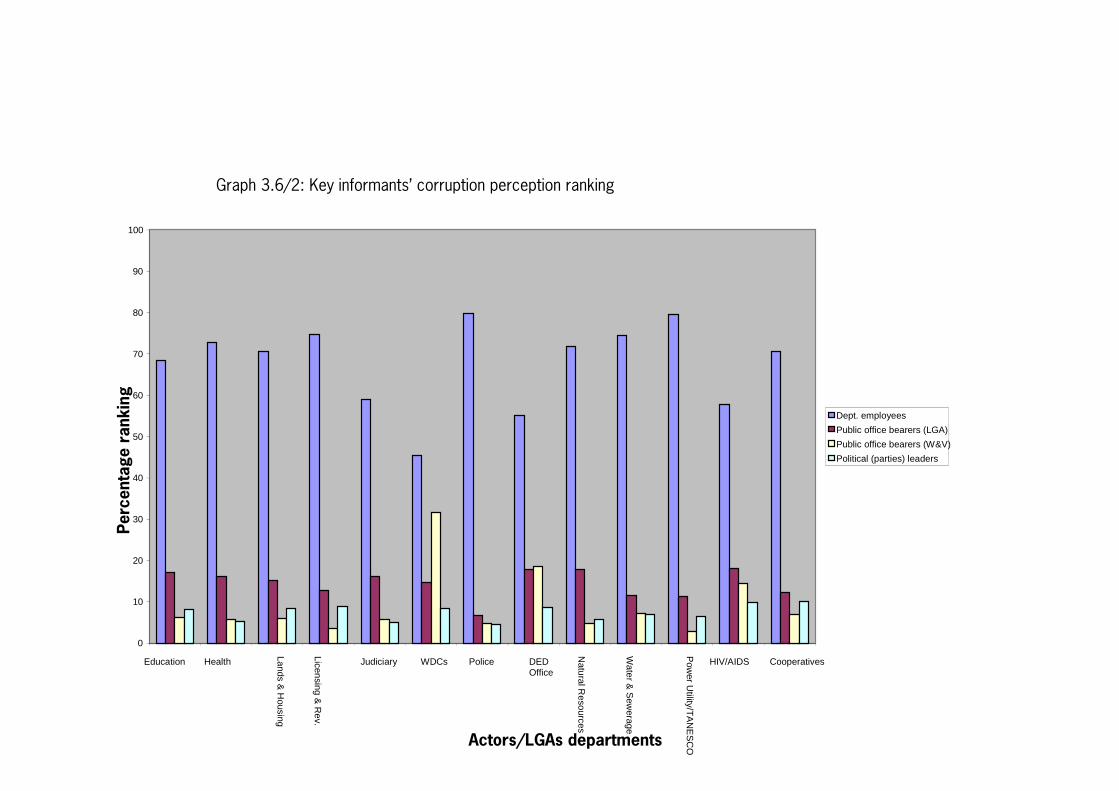
Graph 3.6/2: Key informants’ corruption perception ranking
0
10
20
30
40
50
60
70
80
90
100
Education Health Lands & H
ousing
Licensing & R
ev.
Judiciary WDCs Police DED Office
Natural R
esources
Water &
Sew
erage
Pow
er Utility/T
AN
ES
CO
HIV/AIDS Cooperatives
Actors/LGAs departments
Perc
enta
ge r
ankin
g
Dept. employees Public office bearers (LGA) Public office bearers (W&V)
Political (parties) leaders
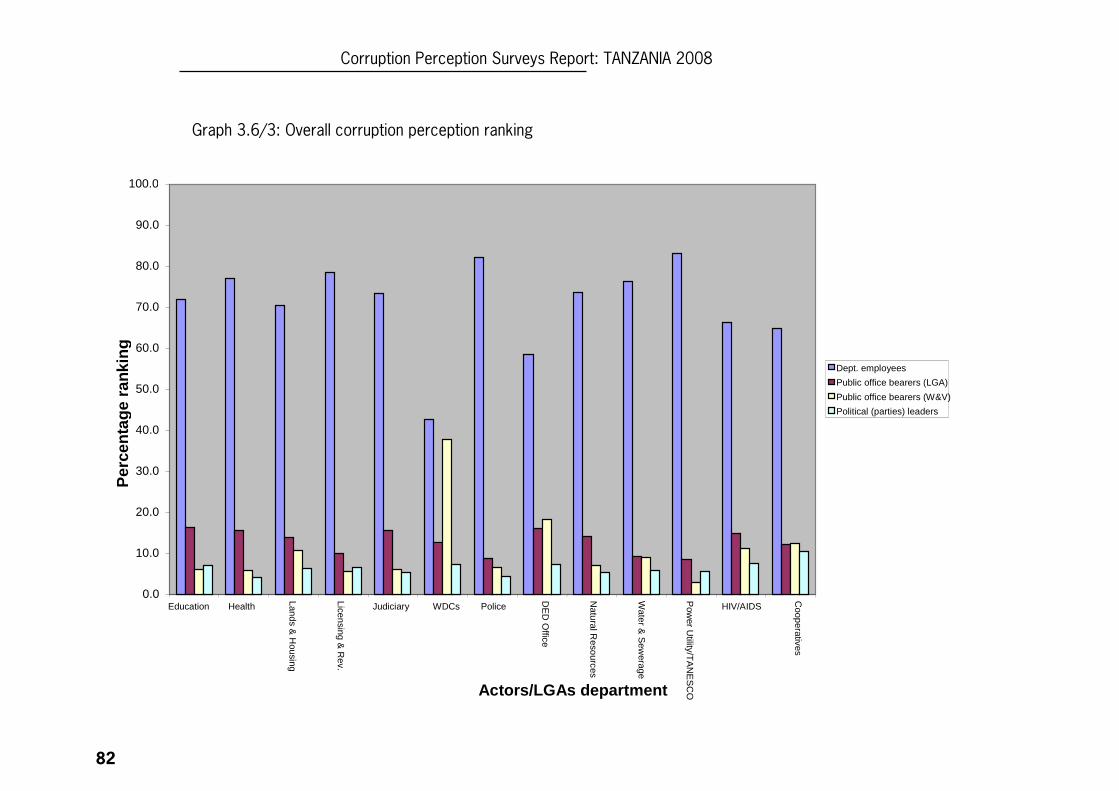
Corruption Perception Surveys Report: TANZANIA 2008
82
Graph 3.6/3: Overall corruption perception ranking
0.0
10.0
20.0
30.0
40.0
50.0
60.0
70.0
80.0
90.0
100.0
Education Health Lands & H
ousing
Licensing & R
ev.
Judiciary WDCs Police DE
D O
ffice
Natural R
esources
Water &
Sew
erage
Pow
er Utility/T
AN
ES
CO
HIV/AIDS
Cooperatives
Actors/LGAs department
Per
cent
age
rank
ing
Dept. employees Public office bearers (LGA) Public office bearers (W&V)
Political (parties) leaders
3.7 ANALYSIS OF MAGNITUDE OF CORRUPTION AS BASIS FOR PERCEPTIONS Sufficient evidence is the basis of making any conclusion about the corruption perception status of LGAs. To this end, respondents were required to respond to the question specifically designed to gauge their assessment of the magnitude of corruption in the LGAs. Respondents were asked to qualitatively assess the magnitude of corruption, i.e. if according to their assessment, corruption in the LGAs (departments, institutions, agencies or organisations) is ‘very low’, ‘low’, ‘average’, ‘high’ or ‘very high’. The frequencies of ‘very low’ and ‘low’ valuations as well as those for ‘high’ and ‘very high’ were then merged in order to get the low-high outcome dichotomy. As indicated in the table and corresponding graphs in this section below, prevalence of corruption in the departments/sectors, institutions, agencies or organisations across LGAs is noted. Key informants indicate that corruption in the police and judiciary is alarmingly on the higher side (ranked by 80 percent and 78.7 percent respectively). The analysis also indicates that corruption is significantly high in the health, lands & housing, licensing & revenue and power utility (TANESCO) (ranked by 57.4 percent, 55.3 percent, 54.2 percent and 48.7 percent, respectively). The sectors/departments in the LGAs in which opinion leaders perceive corruption to be on the low side are education ranked by 43.6 percent, WDCs, 40.4 percent, DED office, 27.7 percent, water & sewerage, 29.1 percent and cooperatives, 27.7 percent. Moreover, the findings note salient trend regarding the extent to which corruption proceeds are shared within LGAs departments. The perception in the department of education is such that those believing corruption is on average tally with those perceiving corruption is on the high side (23.4 percent and 24.7 percent respectively). Also interestingly, a good number of opinion leaders are not aware as to whether or not there is corruption in the respective departments of natural resources (19.1 percent), water & sewerage (21.8 percent), power utility (TANESCO) (23.6 percent), HIV/AIDS (36.4 percent) and cooperatives (33.7 percent). The analytical perspective of reasons for a significant number of opinion leaders to lack awareness of whether or not there is corruption in the aforesaid departments, is possibly due to Central Government excessive control of the departments (for example, natural resources) in which the Central Government is the defacto sole regulatory authority. Another reason could probably be due to uneven distribution of the services in question. Water & sewerage and power utility departments, for example, are phenomenally urban life utilities, hence becoming difficult to opinion leaders living in rural areas to know whether or not there is corruption in those departments. Another reason could be weak visibility/influence of institutions or organisations, cooperatives and HIV/AIDS committees (CMACs, WACs and VACs), for
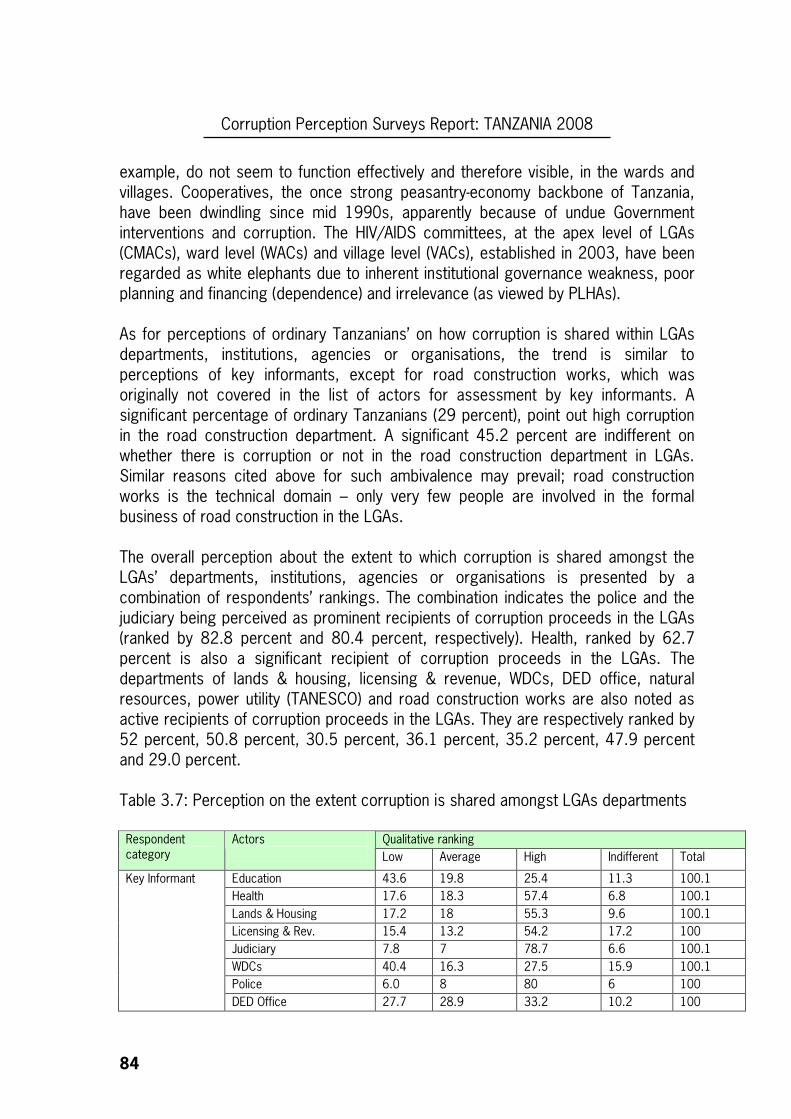
Corruption Perception Surveys Report: TANZANIA 2008
84
example, do not seem to function effectively and therefore visible, in the wards and villages. Cooperatives, the once strong peasantry-economy backbone of Tanzania, have been dwindling since mid 1990s, apparently because of undue Government interventions and corruption. The HIV/AIDS committees, at the apex level of LGAs (CMACs), ward level (WACs) and village level (VACs), established in 2003, have been regarded as white elephants due to inherent institutional governance weakness, poor planning and financing (dependence) and irrelevance (as viewed by PLHAs). As for perceptions of ordinary Tanzanians’ on how corruption is shared within LGAs departments, institutions, agencies or organisations, the trend is similar to perceptions of key informants, except for road construction works, which was originally not covered in the list of actors for assessment by key informants. A significant percentage of ordinary Tanzanians (29 percent), point out high corruption in the road construction department. A significant 45.2 percent are indifferent on whether there is corruption or not in the road construction department in LGAs. Similar reasons cited above for such ambivalence may prevail; road construction works is the technical domain – only very few people are involved in the formal business of road construction in the LGAs. The overall perception about the extent to which corruption is shared amongst the LGAs’ departments, institutions, agencies or organisations is presented by a combination of respondents’ rankings. The combination indicates the police and the judiciary being perceived as prominent recipients of corruption proceeds in the LGAs (ranked by 82.8 percent and 80.4 percent, respectively). Health, ranked by 62.7 percent is also a significant recipient of corruption proceeds in the LGAs. The departments of lands & housing, licensing & revenue, WDCs, DED office, natural resources, power utility (TANESCO) and road construction works are also noted as active recipients of corruption proceeds in the LGAs. They are respectively ranked by 52 percent, 50.8 percent, 30.5 percent, 36.1 percent, 35.2 percent, 47.9 percent and 29.0 percent. Table 3.7: Perception on the extent corruption is shared amongst LGAs departments
Qualitative ranking Respondent category
Actors Low Average High Indifferent Total
Education 43.6 19.8 25.4 11.3 100.1
Health 17.6 18.3 57.4 6.8 100.1
Lands & Housing 17.2 18 55.3 9.6 100.1
Licensing & Rev. 15.4 13.2 54.2 17.2 100
Judiciary 7.8 7 78.7 6.6 100.1
WDCs 40.4 16.3 27.5 15.9 100.1
Police 6.0 8 80 6 100
Key Informant
DED Office 27.7 28.9 33.2 10.2 100
Corruption Perception Surveys Report: TANZANIA 2008
85
Natural Resources 23.9 21.7 35.2 19.1 99.9
Water & Sewerage 29.1 23.6 25.5 21.8 100
Power Utility/TANESCO 11.4 16.4 48.7 23.6 100.1
HIV/AIDS 21.5 17.8 24.3 36.4 100.1
Cooperatives 27.7 15.8 22.8 33.7 100
Road construction 0.0 0 0 0 0.0
Education 34.8 26.9 24 14.3 100
Health 10.1 17.2 67.9 4.8 100
Lands & Housing 15.9 18.7 48.7 16.6 99.9
Licensing & Rev. 16.6 16.4 47.4 19.6 100
Judiciary 4.8 8.1 82.1 5.1 100.1
WDCs 33.1 14.3 33.4 19.4 100.2
Police 4.8 6 85.5 3.7 100
DED Office 25.3 17.8 39 17.9 100
Natural Resources 25.7 16.4 35.2 22.7 100
Water & Sewerage 27.6 13.9 17.7 40.9 100.1
Power Utility/TANESCO 11.1 9.6 47.1 32.2 100
HIV/AIDS 15.2 9.8 24.4 50.6 100
Cooperatives 21.5 14 20.6 43.9 100
Household
Road construction 16.2 9.7 29 45.2 100.1
Education 39.2 23.4 24.7 12.8 100.1
Health 13.9 17.8 62.7 5.8 100.2
Lands & Housing 16.6 18.4 52.0 13.1 100.1
Licensing & Rev. 16.0 14.8 50.8 18.4 100
Judiciary 6.3 7.6 80.4 5.9 100.2
WDCs 36.8 15.3 30.5 17.7 100.3
Police 5.4 7.0 82.8 4.9 100.1
DED Office 26.5 23.4 36.1 14.1 100.1
Natural Resources 24.8 19.1 35.2 20.9 100
Water & Sewerage 28.4 18.8 21.6 31.4 100.2
Power Utility/TANESCO 11.3 13.0 47.9 27.9 100.1
HIV/AIDS 18.4 13.8 24.4 43.5 100.1
Cooperatives 24.6 14.9 21.7 38.8 100
Key Informant & Household combined
Road construction 16.2 9.7 29.0 45.2 100.1
Source: CPS data sheets
Corruption Perception Surveys Report: TANZANIA 2008
86
Graph 3.7/1: Key informant qualitative ranking on share of corruption in LGAs
0.0
20.0
30.0
40.0
50.0
60.0
70.0
80.0
90.0
100.0
Education Health
Lands & H
ousing
Licensing & R
ev.
Judiciary WDCs Police
DE
D O
ffice
Natural R
esources
Water &
Sew
erage
Pow
er Utility/T
AN
ES
CO
HIV/AIDS
Cooperatives
Road construction
Actors/LGAs departments
Low AverageHigh Indifferent
Qua
litat
ive
rank
ing
Corruption Perception Surveys Report: TANZANIA 2008
87
Graph 3.7/2: Household qualitative ranking on share of corruption in LGAs
0.0
10.0
20.0
30.0
40.0
50.0
60.0
70.0
80.0
90.0
100.0
Education Health
Lands & H
ousing
Licensing & R
ev.
Judiciary WDCs Police
DE
D O
ffice
Natural R
esources
Water &
Sew
erage
Pow
er Utility/T
AN
ES
CO
HIV/AIDS
Cooperatives
Road construction
Actors/LGAs departments
Low AverageHigh Indifferent
Qua
litat
ive
rank
ing
Corruption Perception Surveys Report: TANZANIA 2008
88
3.8 FORMS OF AND EXPERIENCES IN CORRUPTION Another variable of the survey was to determine whether the responses of interviewees’ were based on personal experiences in corruption or hearsay about it. Moreover, it was imperative to examine, the forms through which corruption is regularly transacted. When asked if one had been involved in corruption transactions, 55 percent of household respondents replied they had never been involved, with 15.7 percent saying they had been involved once, while 18.6 percent replied they sometimes had to pay bribes, and 8.6 percent replied they always pay bribes to access service provided by designated LGAs departments.
Implication: 43 percent of ordinary Tanzanians confess to have, at least once, paid a bribe as means to access services in the LGAs.
Graph 3.8/1 and the table below present the household confessions to have or not paid corruption.
Graph 3.7/3: Overall qualitative ranking on share of corruption in LGAs
0.0
10.0
20.0
30.0
40.0
50.0
60.0
70.0
80.0
90.0
100.0
Education Health
Lands & H
ousing
Licensing & R
ev.
Judiciary WDCs Police
DE
D O
ffice
Natural R
esources
Water &
Sew
erage
Pow
er Utility/T
AN
ES
CO
HIV/AIDS
Cooperatives
Road construction
Actors/LGAs departments
Low AverageHigh Indifferent
Qua
litat
ive
rank
ing
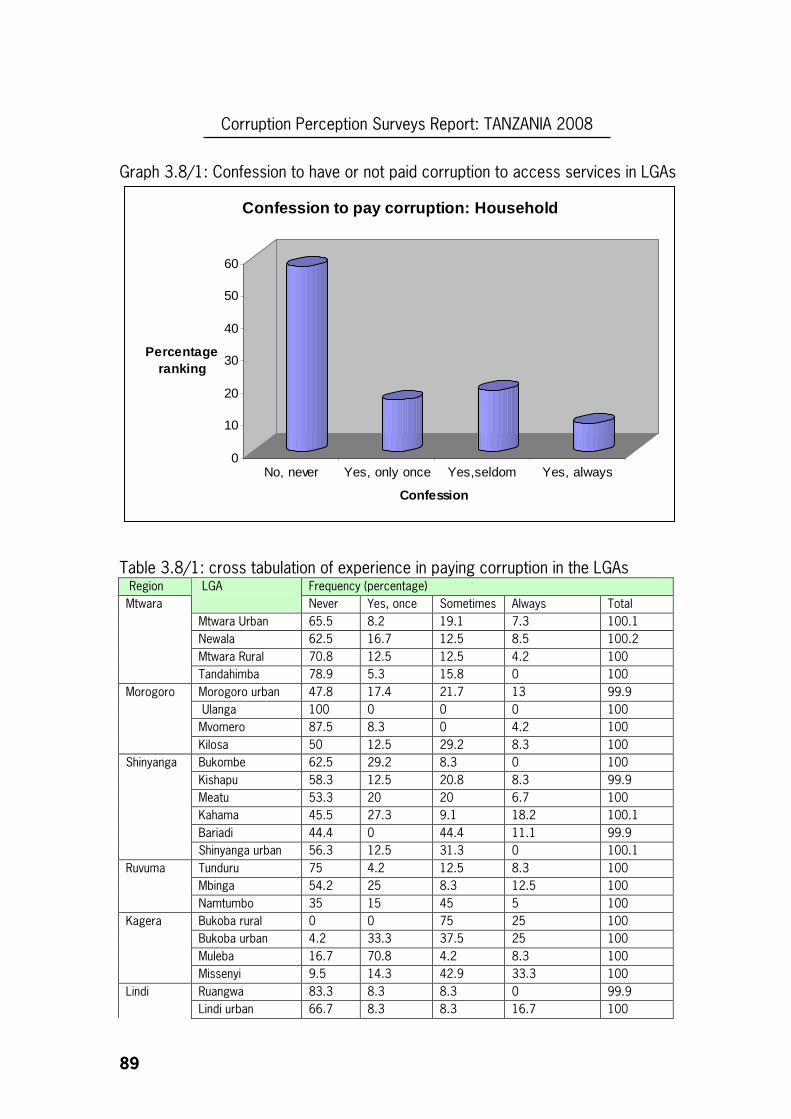
Corruption Perception Surveys Report: TANZANIA 2008
89
Graph 3.8/1: Confession to have or not paid corruption to access services in LGAs
0
10
20
30
40
50
60
Percentage ranking
No, never Yes, only once Yes,seldom Yes, always
Confession
Confession to pay corruption: Household
Table 3.8/1: cross tabulation of experience in paying corruption in the LGAs Region Frequency (percentage) LGA
Never Yes, once Sometimes Always Total
Mtwara Urban 65.5 8.2 19.1 7.3 100.1
Newala 62.5 16.7 12.5 8.5 100.2
Mtwara Rural 70.8 12.5 12.5 4.2 100
Mtwara
Tandahimba 78.9 5.3 15.8 0 100
Morogoro urban 47.8 17.4 21.7 13 99.9
Ulanga 100 0 0 0 100
Mvomero 87.5 8.3 0 4.2 100
Morogoro
Kilosa 50 12.5 29.2 8.3 100
Bukombe 62.5 29.2 8.3 0 100
Kishapu 58.3 12.5 20.8 8.3 99.9
Meatu 53.3 20 20 6.7 100
Kahama 45.5 27.3 9.1 18.2 100.1
Bariadi 44.4 0 44.4 11.1 99.9
Shinyanga
Shinyanga urban 56.3 12.5 31.3 0 100.1
Tunduru 75 4.2 12.5 8.3 100
Mbinga 54.2 25 8.3 12.5 100
Ruvuma
Namtumbo 35 15 45 5 100
Bukoba rural 0 0 75 25 100
Bukoba urban 4.2 33.3 37.5 25 100
Muleba 16.7 70.8 4.2 8.3 100
Kagera
Missenyi 9.5 14.3 42.9 33.3 100
Ruangwa 83.3 8.3 8.3 0 99.9 Lindi
Lindi urban 66.7 8.3 8.3 16.7 100
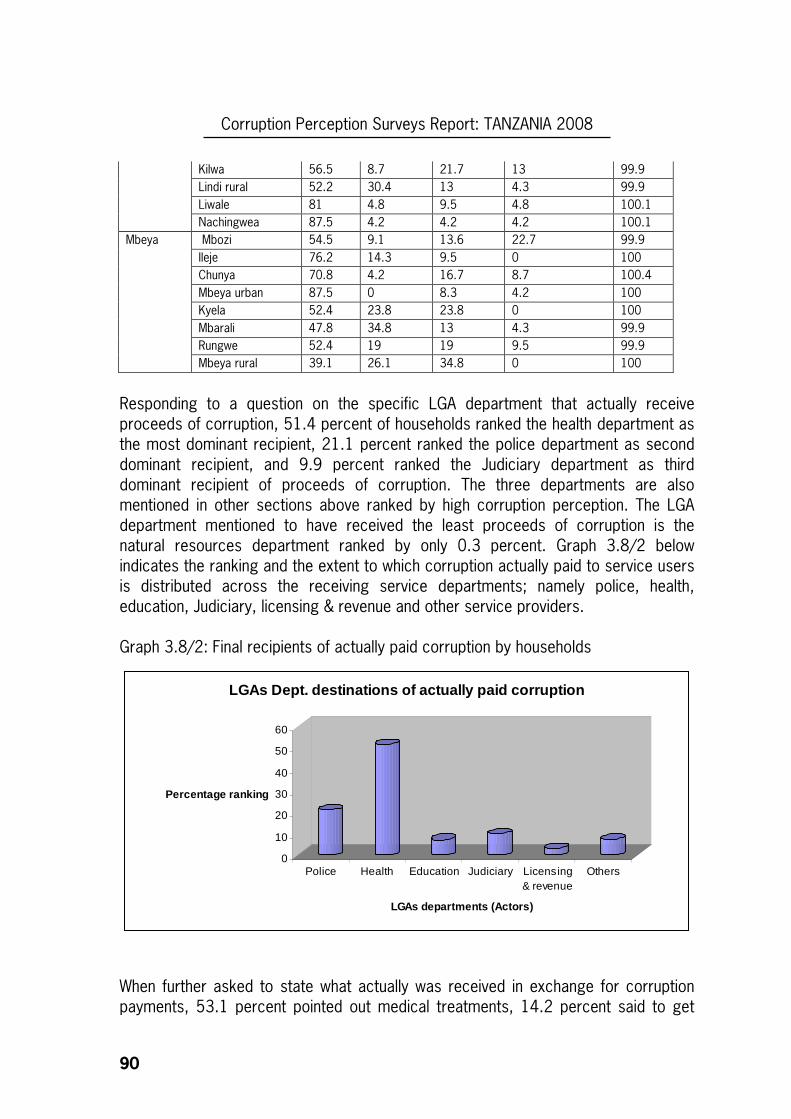
Corruption Perception Surveys Report: TANZANIA 2008
90
Kilwa 56.5 8.7 21.7 13 99.9
Lindi rural 52.2 30.4 13 4.3 99.9
Liwale 81 4.8 9.5 4.8 100.1
Nachingwea 87.5 4.2 4.2 4.2 100.1
Mbozi 54.5 9.1 13.6 22.7 99.9
Ileje 76.2 14.3 9.5 0 100
Chunya 70.8 4.2 16.7 8.7 100.4
Mbeya urban 87.5 0 8.3 4.2 100
Kyela 52.4 23.8 23.8 0 100
Mbarali 47.8 34.8 13 4.3 99.9
Rungwe 52.4 19 19 9.5 99.9
Mbeya
Mbeya rural 39.1 26.1 34.8 0 100
Responding to a question on the specific LGA department that actually receive proceeds of corruption, 51.4 percent of households ranked the health department as the most dominant recipient, 21.1 percent ranked the police department as second dominant recipient, and 9.9 percent ranked the Judiciary department as third dominant recipient of proceeds of corruption. The three departments are also mentioned in other sections above ranked by high corruption perception. The LGA department mentioned to have received the least proceeds of corruption is the natural resources department ranked by only 0.3 percent. Graph 3.8/2 below indicates the ranking and the extent to which corruption actually paid to service users is distributed across the receiving service departments; namely police, health, education, Judiciary, licensing & revenue and other service providers. Graph 3.8/2: Final recipients of actually paid corruption by households
0
10
20
30
40
50
60
Percentage ranking
Police Health Education Judiciary Licensing& revenue
Others
LGAs departments (Actors)
LGAs Dept. destinations of actually paid corruption
When further asked to state what actually was received in exchange for corruption payments, 53.1 percent pointed out medical treatments, 14.2 percent said to get
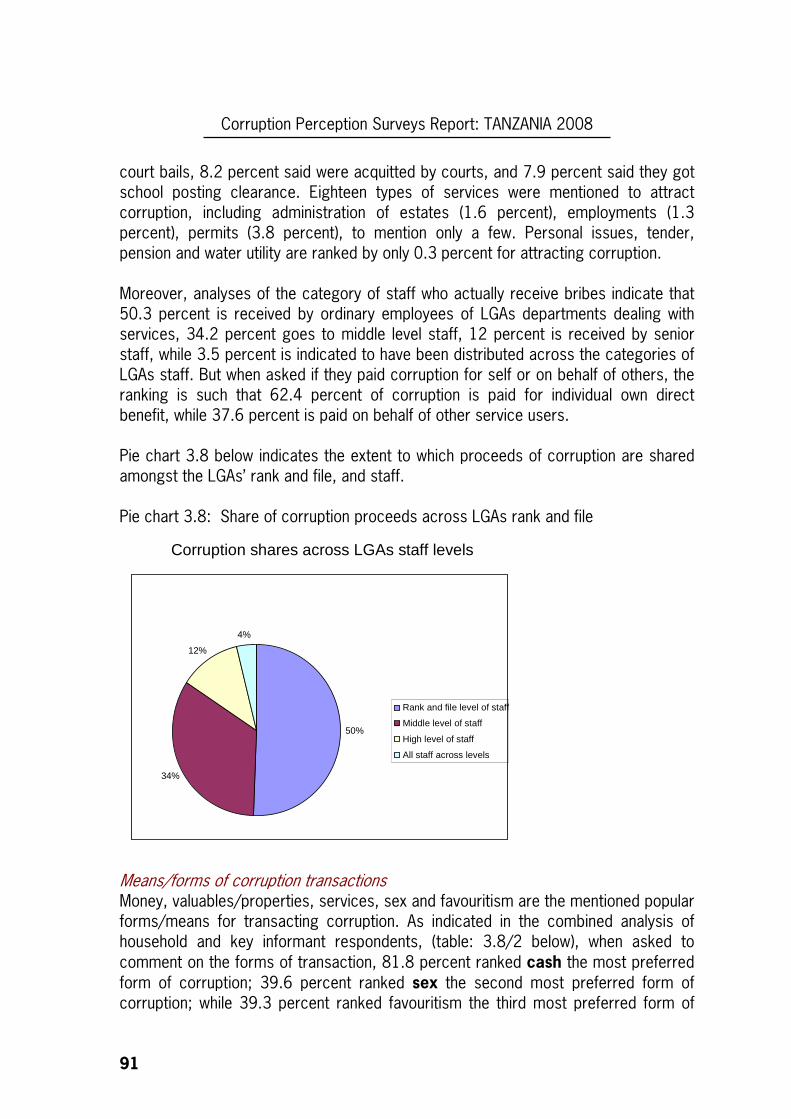
Corruption Perception Surveys Report: TANZANIA 2008
91
court bails, 8.2 percent said were acquitted by courts, and 7.9 percent said they got school posting clearance. Eighteen types of services were mentioned to attract corruption, including administration of estates (1.6 percent), employments (1.3 percent), permits (3.8 percent), to mention only a few. Personal issues, tender, pension and water utility are ranked by only 0.3 percent for attracting corruption. Moreover, analyses of the category of staff who actually receive bribes indicate that 50.3 percent is received by ordinary employees of LGAs departments dealing with services, 34.2 percent goes to middle level staff, 12 percent is received by senior staff, while 3.5 percent is indicated to have been distributed across the categories of LGAs staff. But when asked if they paid corruption for self or on behalf of others, the ranking is such that 62.4 percent of corruption is paid for individual own direct benefit, while 37.6 percent is paid on behalf of other service users. Pie chart 3.8 below indicates the extent to which proceeds of corruption are shared amongst the LGAs’ rank and file, and staff. Pie chart 3.8: Share of corruption proceeds across LGAs rank and file
Means/forms of corruption transactions Money, valuables/properties, services, sex and favouritism are the mentioned popular forms/means for transacting corruption. As indicated in the combined analysis of household and key informant respondents, (table: 3.8/2 below), when asked to comment on the forms of transaction, 81.8 percent ranked cash the most preferred form of corruption; 39.6 percent ranked sex the second most preferred form of corruption; while 39.3 percent ranked favouritism the third most preferred form of
Corruption shares across LGAs staff levels
50%
34%
12% 4%
Rank and file level of staff Middle level of staff High level of staff All staff across levels
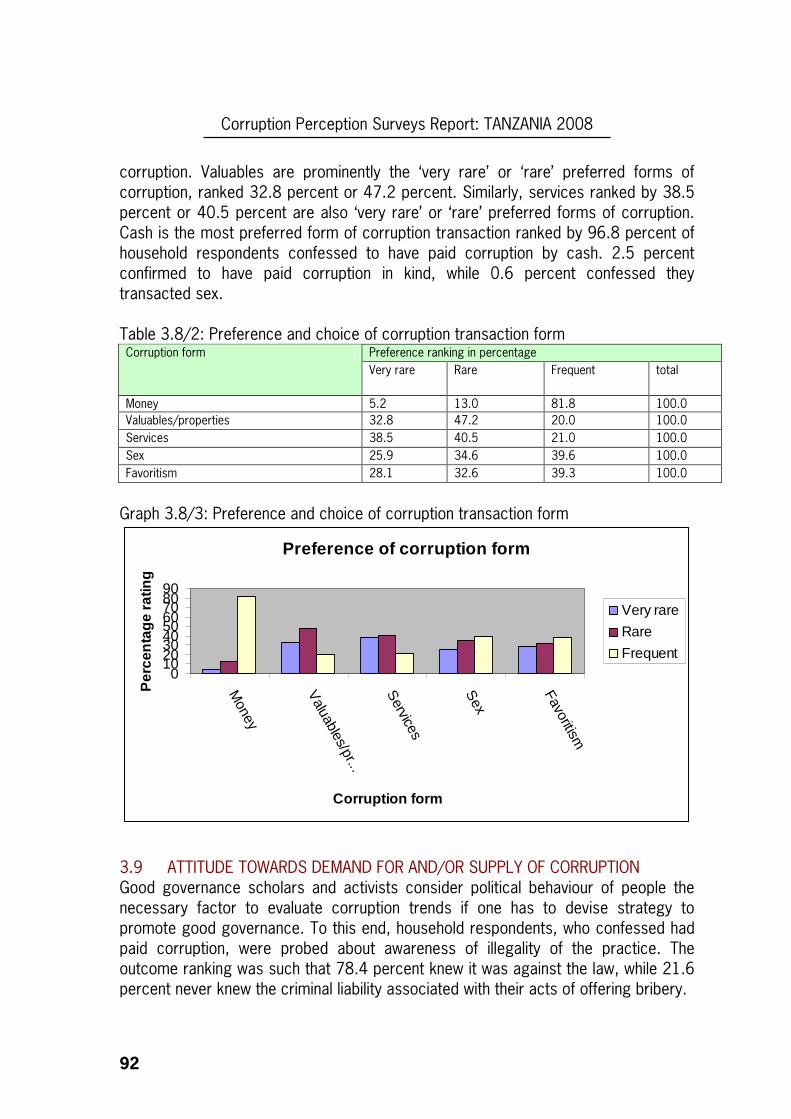
Corruption Perception Surveys Report: TANZANIA 2008
92
corruption. Valuables are prominently the ‘very rare’ or ‘rare’ preferred forms of corruption, ranked 32.8 percent or 47.2 percent. Similarly, services ranked by 38.5 percent or 40.5 percent are also ‘very rare’ or ‘rare’ preferred forms of corruption. Cash is the most preferred form of corruption transaction ranked by 96.8 percent of household respondents confessed to have paid corruption by cash. 2.5 percent confirmed to have paid corruption in kind, while 0.6 percent confessed they transacted sex. Table 3.8/2: Preference and choice of corruption transaction form
Preference ranking in percentage Corruption form
Very rare Rare Frequent total
Money 5.2 13.0 81.8 100.0
Valuables/properties 32.8 47.2 20.0 100.0
Services 38.5 40.5 21.0 100.0
Sex 25.9 34.6 39.6 100.0
Favoritism 28.1 32.6 39.3 100.0
Graph 3.8/3: Preference and choice of corruption transaction form
Preference of corruption form
0102030405060708090
Money
Valuables/pr...
Services
Sex
Favoritism
Corruption form
Per
cent
age
ratin
g
Very rare
Rare
Frequent
3.9 ATTITUDE TOWARDS DEMAND FOR AND/OR SUPPLY OF CORRUPTION Good governance scholars and activists consider political behaviour of people the necessary factor to evaluate corruption trends if one has to devise strategy to promote good governance. To this end, household respondents, who confessed had paid corruption, were probed about awareness of illegality of the practice. The outcome ranking was such that 78.4 percent knew it was against the law, while 21.6 percent never knew the criminal liability associated with their acts of offering bribery.
Corruption Perception Surveys Report: TANZANIA 2008
93
Holding true the assumption that paying corruption is not a business of amateurs but one is forced into it, household respondents were further asked the question meant to substantiate the environment under which corruption is transacted. The outcomes are such that 4.6 percent of Tanzanians pay corruption because they volitionally feel to do so; 56.8 percent are forced to pay corruption in response to the bureaucratic design that service users are subjected to; 33.1 percent are enticed by staff/employees in the LGAs’ service delivery outlets to pay corruption; and 5.5 percent pay corruption because they are hinted (whispered) by friends to do so.
Interpreting the above findings, 95.4 percent of service users paying corruption to access services in the LGAs do so forcefully, only a few corruption amateurs, accounting to 4.6 percent, do so voluntarily.
Moreover, when asked about the strategy used to facilitate corruption transactions, the outcome was such that 73.9 percent of service users disburse corruption proceeds direct to final recipients, while 26.1 percent use agents to facilitate it. The latter finding is critical because it exposes existence of informal
institutionalisation and networking for corruption (agencies) in the LGAs.
Furthermore, 49.3 percent of household respondents conceded to have witnessed LGA staff, on various occasions, transacting corruption. Public abhorrence against corrupt persons in the LGAs is but rife. When asked to give views on how the public perceive persons receiving or paying corruption; 96 percent of household respondents said they hate persons receiving corruption, while 88.9 percent said they hate persons paying corruption. Corrupt persons are generally regarded as useless and socially unwanted. Only 1.7 percent indicated they would tolerate corruption demanding persons, while 7.2 percent would similarly tolerate those funning to pay corruption. Similarly, key informants were asked a question meant to essentially evaluate whether or not persons aggrieved by corruption have enough confidence to report grievances to public office bearers in LGAs. The outcome was such that 65.2 percent of leaders had never received any corruption-related complaints from individual members of the public; 22.8 percent have seldom received the corruption-related complaints from individual members of public; while 12 percent said they regularly receive corruption-related complaints. Interpreting the findings, it means that substantial public confidence and fearlessness to report corruption to public office bearers in the LGAs exist (ranked by 34.8 percent). Pie chart 3.9 below indicates the extent to which aggrieved citizens have reported corruption incidents to public office bearers in the LGAs.
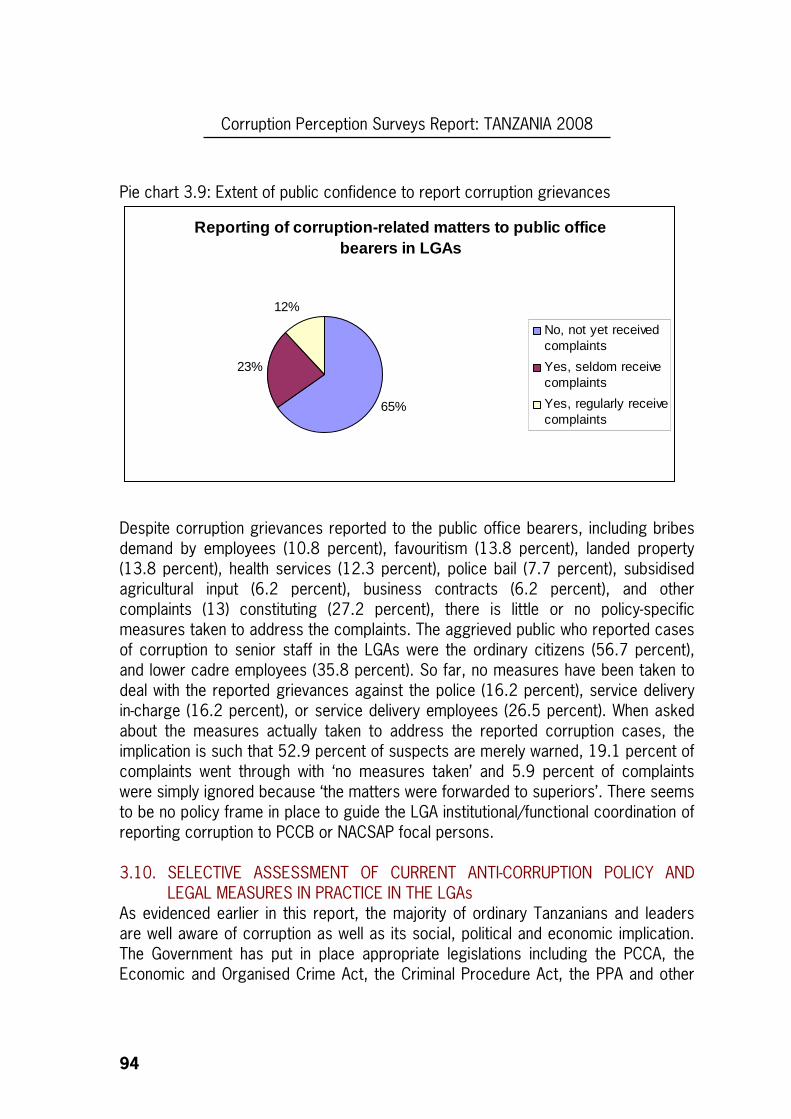
Corruption Perception Surveys Report: TANZANIA 2008
94
Pie chart 3.9: Extent of public confidence to report corruption grievances
Reporting of corruption-related matters to public o ffice bearers in LGAs
65%
23%
12%
No, not yet receivedcomplaints
Yes, seldom receivecomplaints
Yes, regularly receivecomplaints
Despite corruption grievances reported to the public office bearers, including bribes demand by employees (10.8 percent), favouritism (13.8 percent), landed property (13.8 percent), health services (12.3 percent), police bail (7.7 percent), subsidised agricultural input (6.2 percent), business contracts (6.2 percent), and other complaints (13) constituting (27.2 percent), there is little or no policy-specific measures taken to address the complaints. The aggrieved public who reported cases of corruption to senior staff in the LGAs were the ordinary citizens (56.7 percent), and lower cadre employees (35.8 percent). So far, no measures have been taken to deal with the reported grievances against the police (16.2 percent), service delivery in-charge (16.2 percent), or service delivery employees (26.5 percent). When asked about the measures actually taken to address the reported corruption cases, the implication is such that 52.9 percent of suspects are merely warned, 19.1 percent of complaints went through with ‘no measures taken’ and 5.9 percent of complaints were simply ignored because ‘the matters were forwarded to superiors’. There seems to be no policy frame in place to guide the LGA institutional/functional coordination of reporting corruption to PCCB or NACSAP focal persons. 3.10. SELECTIVE ASSESSMENT OF CURRENT ANTI-CORRUPTION POLICY AND
LEGAL MEASURES IN PRACTICE IN THE LGAs As evidenced earlier in this report, the majority of ordinary Tanzanians and leaders are well aware of corruption as well as its social, political and economic implication. The Government has put in place appropriate legislations including the PCCA, the Economic and Organised Crime Act, the Criminal Procedure Act, the PPA and other
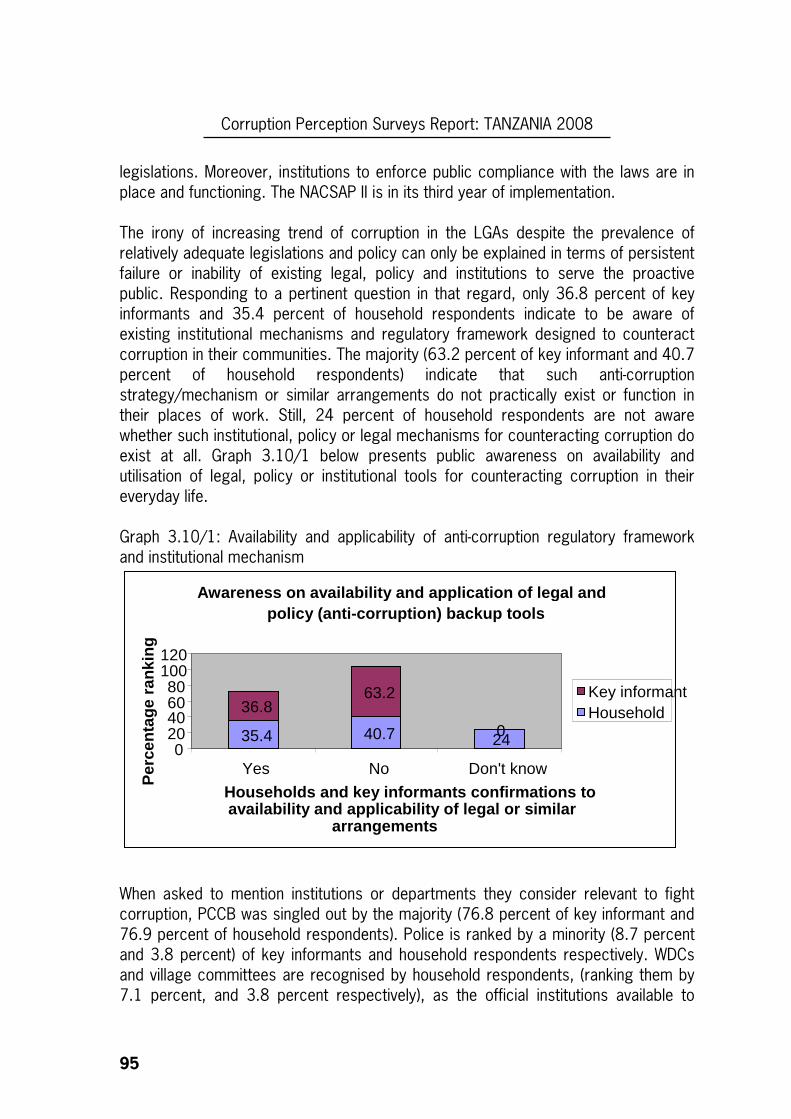
Corruption Perception Surveys Report: TANZANIA 2008
95
legislations. Moreover, institutions to enforce public compliance with the laws are in place and functioning. The NACSAP II is in its third year of implementation. The irony of increasing trend of corruption in the LGAs despite the prevalence of relatively adequate legislations and policy can only be explained in terms of persistent failure or inability of existing legal, policy and institutions to serve the proactive public. Responding to a pertinent question in that regard, only 36.8 percent of key informants and 35.4 percent of household respondents indicate to be aware of existing institutional mechanisms and regulatory framework designed to counteract corruption in their communities. The majority (63.2 percent of key informant and 40.7 percent of household respondents) indicate that such anti-corruption strategy/mechanism or similar arrangements do not practically exist or function in their places of work. Still, 24 percent of household respondents are not aware whether such institutional, policy or legal mechanisms for counteracting corruption do exist at all. Graph 3.10/1 below presents public awareness on availability and utilisation of legal, policy or institutional tools for counteracting corruption in their everyday life. Graph 3.10/1: Availability and applicability of anti-corruption regulatory framework and institutional mechanism
When asked to mention institutions or departments they consider relevant to fight corruption, PCCB was singled out by the majority (76.8 percent of key informant and 76.9 percent of household respondents). Police is ranked by a minority (8.7 percent and 3.8 percent) of key informants and household respondents respectively. WDCs and village committees are recognised by household respondents, (ranking them by 7.1 percent, and 3.8 percent respectively), as the official institutions available to
Awareness on availability and application of legal and policy (anti-corruption) backup tools
35.4 40.7 24
36.863.2
0 0
20406080
100120
Yes No Don't know
Households and key informants confirmations to availability and applicability of legal or similar
arrangements
Per
cent
age
rank
ing
Key informantHousehold
Corruption Perception Surveys Report: TANZANIA 2008
96
which to report corruption. Moreover, 7.2 percent of key informant respondents indicate the existence and functioning of anti-corruption committees in the health service department. Though slightly noted, there seems to be some public confusion when it comes to distinguishing between the voluntary initiative of CSOs and the official enforcement of anti-corruption laws. One percent and 6.7 percent of household respondents mistakenly refer to ForDIA and SKUVI as official institutions assigned to counteract corruption. When asked to mention NSAs known in the field of fighting corruption, very few CSOs are mentioned. This implies weak visibility of NSAs fighting corruption. Only 7 out of 800 household respondents said they know ForDIA, and 6 said they know TNIB. HakiElimu and TGNP each, was mentioned by one out of 800 respondents. Only a few FGD members confirmed to know TAMWA. This trend is indeed repeated by key informant respondents, 25 percent of which confirm to know CSOs fighting corruption, while a significant 54.3 percent have never heard about CSOs fighting corruption. Also, interestingly, 20.7 percent of key informants are completely unaware about the CSOs notion; leave alone their voluntary engagement to fight corruption. Whereas 58 key informant respondents indicated to know the CSOs, which are active fighting against corruption, only 32 of them could mention the names of CSOs they claim to know (HakiElimu by 18.8 percent, inter-faith organisations by 6.3 percent, ForDIA by 28.1 percent and SKUVI by 9.1 percent). Assessment of Government efforts to fight corruption in LGAs To rightly contextualise perceptions, the closely-related questions were thrown to household and key informant respondents. Household respondents were required to state if they are aware of the current and past Government efforts to fight corruption, and together with that, key informant respondents, they were further required to assess the performance of current Government efforts to fight corruption. Whereas 64.8 percent (compared to 35.2 percent of key informants) of household respondents are well aware of the current Government efforts to fight corruption, those mentioned as known efforts include establishment of the institutional hierarch of PCCB at national, regional and district levels (54.7 percent), prosecution of corruption suspects (11.6 percent), and the Government directives/announcements on corruption through the public media (26.9 percent). Only 6.8 percent of household respondents reckon community anti-corruption information Education and Communication (IEC) as Government efforts to fight corruption. However, 71.3 percent of key informant respondents (compared to 28.7 percent of households) are of the view that Government anti-corruption efforts have failed. And when requested to assess the extent to which they believe the Government has
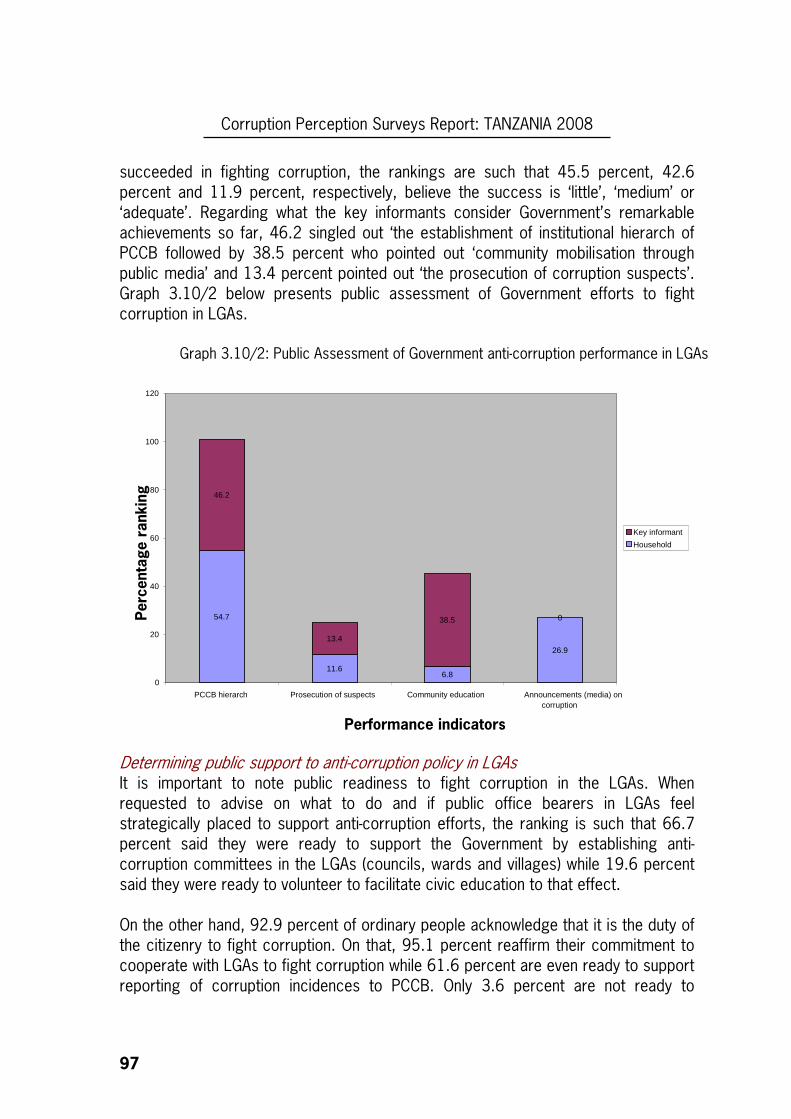
Corruption Perception Surveys Report: TANZANIA 2008
97
succeeded in fighting corruption, the rankings are such that 45.5 percent, 42.6 percent and 11.9 percent, respectively, believe the success is ‘little’, ‘medium’ or ‘adequate’. Regarding what the key informants consider Government’s remarkable achievements so far, 46.2 singled out ‘the establishment of institutional hierarch of PCCB followed by 38.5 percent who pointed out ‘community mobilisation through public media’ and 13.4 percent pointed out ‘the prosecution of corruption suspects’. Graph 3.10/2 below presents public assessment of Government efforts to fight corruption in LGAs.
Determining public support to anti-corruption policy in LGAs It is important to note public readiness to fight corruption in the LGAs. When requested to advise on what to do and if public office bearers in LGAs feel strategically placed to support anti-corruption efforts, the ranking is such that 66.7 percent said they were ready to support the Government by establishing anti-corruption committees in the LGAs (councils, wards and villages) while 19.6 percent said they were ready to volunteer to facilitate civic education to that effect. On the other hand, 92.9 percent of ordinary people acknowledge that it is the duty of the citizenry to fight corruption. On that, 95.1 percent reaffirm their commitment to cooperate with LGAs to fight corruption while 61.6 percent are even ready to support reporting of corruption incidences to PCCB. Only 3.6 percent are not ready to
Graph 3.10/2: Public Assessment of Government anti-corruption performance in LGAs
54.7
11.66.8
26.9
46.2
13.4
38.5 0
0
20
40
60
80
100
120
PCCB hierarch Prosecution of suspects Community education Announcements (media) oncorruption
Performance indicators
Perc
enta
ge r
ankin
g
Key informant Household
Corruption Perception Surveys Report: TANZANIA 2008
98
support anti-corruption efforts for various reasons, including fear of risk of personal security/safety due to foreseeable retribution. Impediments against public determination to fight corruption Practical and policy impediments against public support to fight corruption are noted. Interviewees mentioned such impediments as low prevalence of CSOs with genuine cause to fight corruption. Other respondents mentioned ‘lack of political commitment on the part of Government to genuinely and fearlessly fight corruption’. Lack of legal protection and incentives to ‘whistleblowers’ are cited as obstacles counteracting public support in the fight against corruption. When key informants were asked to comment on the views of weak political will, which is regarded as impediment to fight corruption, the ranking was such that 57.1 percent believe it is because the political leadership is itself involved in the breeding of corruption. Another 13.7 percent cited fears of reprisals noting current social, political and economic equilibrium is still controlled by networks of corrupt business and political elites across Central Government and LGAs. However, both household and key informant respondents are relatively aware of the current Government proposed ‘Whistleblowers’ Protection Draft Bill (23.7 percent of ordinary people and 37.6 percent of key informants reaffirm such awareness, about the Whistleblowers Protection Draft Bill). A significant 76.3 percent of household and 62.4 percent of key informant respondents are not aware about the legal protection initiative for whistleblowers. But both key informants and household respondents are strongly supportive of the proposed law (65.9 percent household and 69.5 percent key informant respondents respectively). Recognition of inter-faith potential to fighting corruption There is strong assertion that corruption is positively correlated with immorality. The strong influence of interfaith organisations to human behaviour is considered potentially important to fight corruption through morality restoration. When requested to state if religious leaders are on the forefront fighting corruption, 68.9 percent of household respondents were affirmative, while only 17.4 percent believe the statement is away from truth. On a similar note, 94.6 percent of respondents reaffirm preaching is the most useful forum for religious leaders fighting corruption. 3. 11. DETERMINING LOWEST Vs. HIGHEST CORRUPTION PERCEPTION LGAs One of the principal objectives of the CPS project was to identify LGAs with lowest or highest corruption perception. It was also the underlying rationale of selecting the LGAs as units of CPS analysis. Interview questions were designed in such a way that household, key informant or focus groups respondents would finally be required to respond to a question demanding each respondent to conclude/confirm his/her perception on whether or not corruption exists in the LGA of own experience, and at
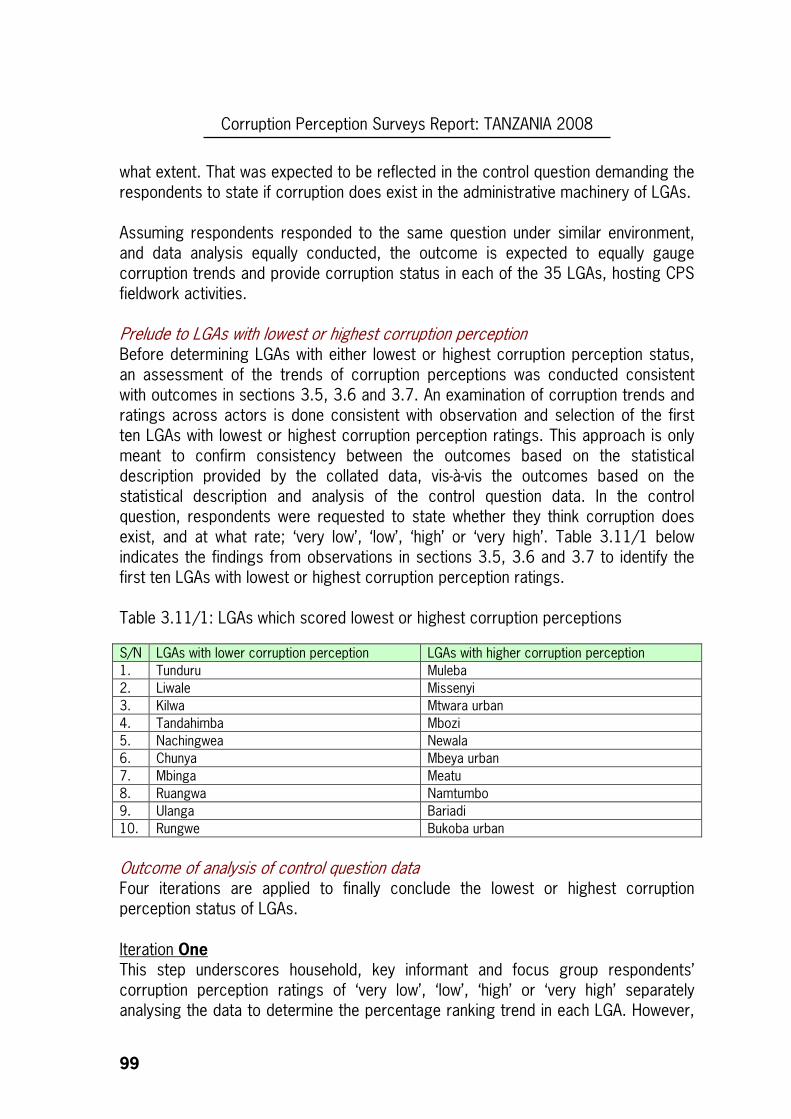
Corruption Perception Surveys Report: TANZANIA 2008
99
what extent. That was expected to be reflected in the control question demanding the respondents to state if corruption does exist in the administrative machinery of LGAs. Assuming respondents responded to the same question under similar environment, and data analysis equally conducted, the outcome is expected to equally gauge corruption trends and provide corruption status in each of the 35 LGAs, hosting CPS fieldwork activities. Prelude to LGAs with lowest or highest corruption perception Before determining LGAs with either lowest or highest corruption perception status, an assessment of the trends of corruption perceptions was conducted consistent with outcomes in sections 3.5, 3.6 and 3.7. An examination of corruption trends and ratings across actors is done consistent with observation and selection of the first ten LGAs with lowest or highest corruption perception ratings. This approach is only meant to confirm consistency between the outcomes based on the statistical description provided by the collated data, vis-à-vis the outcomes based on the statistical description and analysis of the control question data. In the control question, respondents were requested to state whether they think corruption does exist, and at what rate; ‘very low’, ‘low’, ‘high’ or ‘very high’. Table 3.11/1 below indicates the findings from observations in sections 3.5, 3.6 and 3.7 to identify the first ten LGAs with lowest or highest corruption perception ratings. Table 3.11/1: LGAs which scored lowest or highest corruption perceptions
S/N LGAs with lower corruption perception LGAs with higher corruption perception 1. Tunduru Muleba 2. Liwale Missenyi 3. Kilwa Mtwara urban 4. Tandahimba Mbozi 5. Nachingwea Newala 6. Chunya Mbeya urban 7. Mbinga Meatu 8. Ruangwa Namtumbo 9. Ulanga Bariadi 10. Rungwe Bukoba urban
Outcome of analysis of control question data Four iterations are applied to finally conclude the lowest or highest corruption perception status of LGAs. Iteration One This step underscores household, key informant and focus group respondents’ corruption perception ratings of ‘very low’, ‘low’, ‘high’ or ‘very high’ separately analysing the data to determine the percentage ranking trend in each LGA. However,
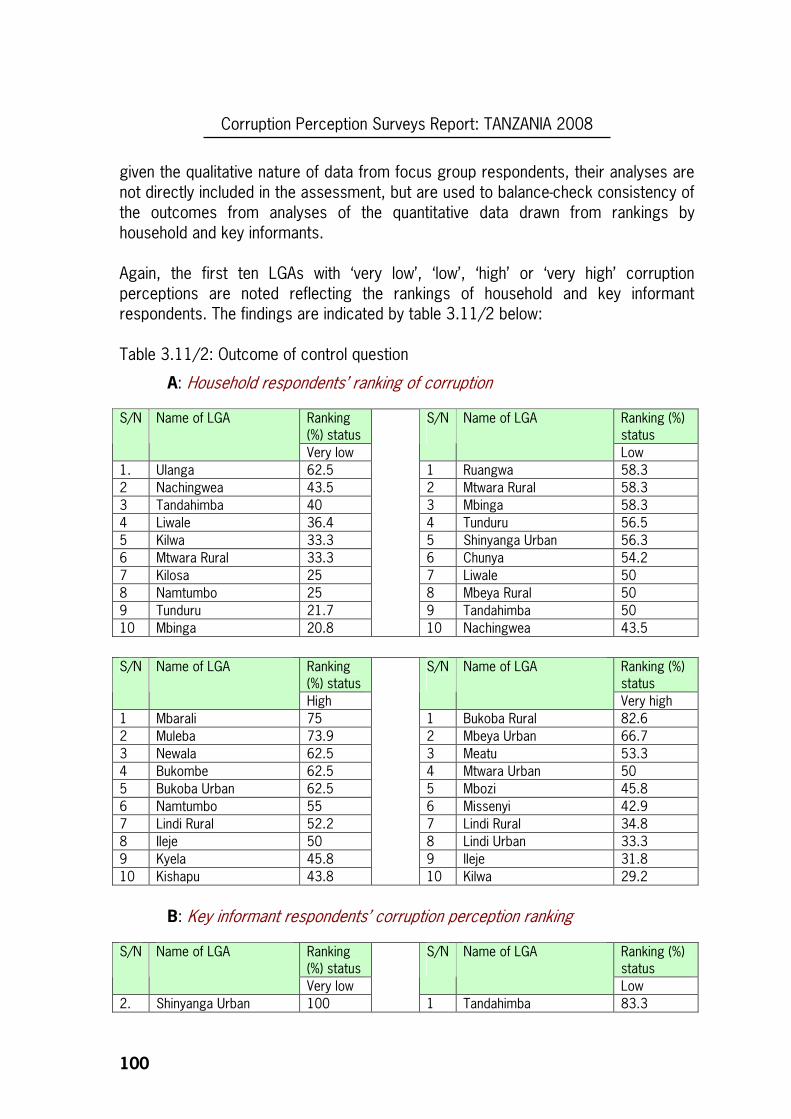
Corruption Perception Surveys Report: TANZANIA 2008
100
given the qualitative nature of data from focus group respondents, their analyses are not directly included in the assessment, but are used to balance-check consistency of the outcomes from analyses of the quantitative data drawn from rankings by household and key informants. Again, the first ten LGAs with ‘very low’, ‘low’, ‘high’ or ‘very high’ corruption perceptions are noted reflecting the rankings of household and key informant respondents. The findings are indicated by table 3.11/2 below: Table 3.11/2: Outcome of control question
A: Household respondents’ ranking of corruption
Ranking (%) status
Ranking (%) status
S/N Name of LGA
Very low
S/N
Name of LGA
Low 1. Ulanga 62.5 1 Ruangwa 58.3 2 Nachingwea 43.5 2 Mtwara Rural 58.3 3 Tandahimba 40 3 Mbinga 58.3 4 Liwale 36.4 4 Tunduru 56.5 5 Kilwa 33.3 5 Shinyanga Urban 56.3 6 Mtwara Rural 33.3 6 Chunya 54.2 7 Kilosa 25 7 Liwale 50 8 Namtumbo 25 8 Mbeya Rural 50 9 Tunduru 21.7 9 Tandahimba 50 10 Mbinga 20.8
10 Nachingwea 43.5
Ranking (%) status
Ranking (%) status
S/N Name of LGA
High
S/N
Name of LGA
Very high 1 Mbarali 75 1 Bukoba Rural 82.6 2 Muleba 73.9 2 Mbeya Urban 66.7 3 Newala 62.5 3 Meatu 53.3 4 Bukombe 62.5 4 Mtwara Urban 50 5 Bukoba Urban 62.5 5 Mbozi 45.8 6 Namtumbo 55 6 Missenyi 42.9 7 Lindi Rural 52.2 7 Lindi Rural 34.8 8 Ileje 50 8 Lindi Urban 33.3 9 Kyela 45.8 9 Ileje 31.8 10 Kishapu 43.8
10 Kilwa 29.2
B: Key informant respondents’ corruption perception ranking
Ranking (%) status
Ranking (%) status
S/N Name of LGA
Very low
S/N
Name of LGA
Low 2. Shinyanga Urban 100
1 Tandahimba 83.3
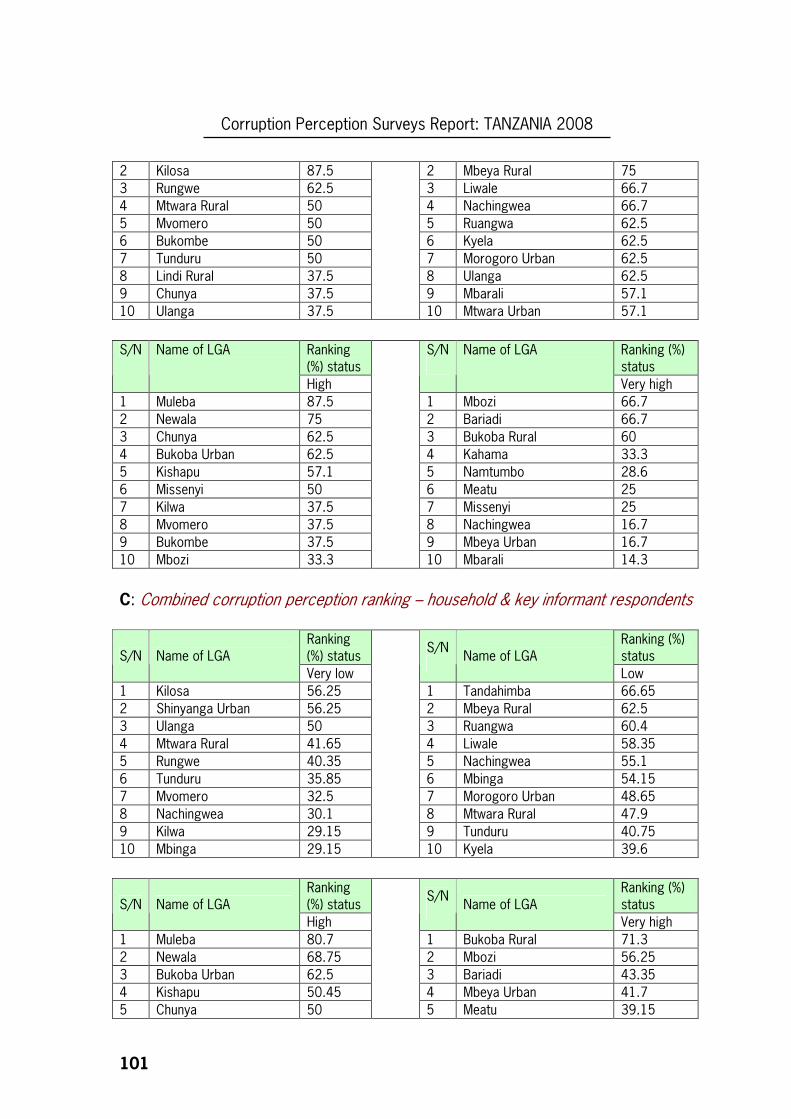
Corruption Perception Surveys Report: TANZANIA 2008
101
2 Kilosa 87.5 2 Mbeya Rural 75 3 Rungwe 62.5 3 Liwale 66.7 4 Mtwara Rural 50 4 Nachingwea 66.7 5 Mvomero 50 5 Ruangwa 62.5 6 Bukombe 50 6 Kyela 62.5 7 Tunduru 50 7 Morogoro Urban 62.5 8 Lindi Rural 37.5 8 Ulanga 62.5 9 Chunya 37.5 9 Mbarali 57.1 10 Ulanga 37.5 10 Mtwara Urban 57.1
Ranking (%) status
Ranking (%) status
S/N Name of LGA
High
S/N
Name of LGA
Very high 1 Muleba 87.5 1 Mbozi 66.7 2 Newala 75 2 Bariadi 66.7 3 Chunya 62.5 3 Bukoba Rural 60 4 Bukoba Urban 62.5 4 Kahama 33.3 5 Kishapu 57.1 5 Namtumbo 28.6 6 Missenyi 50 6 Meatu 25 7 Kilwa 37.5 7 Missenyi 25 8 Mvomero 37.5 8 Nachingwea 16.7 9 Bukombe 37.5 9 Mbeya Urban 16.7 10 Mbozi 33.3
10 Mbarali 14.3
C: Combined corruption perception ranking – household & key informant respondents
Ranking (%) status
Ranking (%) status S/N Name of LGA
Very low
S/N
Name of LGA Low
1 Kilosa 56.25 1 Tandahimba 66.65 2 Shinyanga Urban 56.25 2 Mbeya Rural 62.5 3 Ulanga 50 3 Ruangwa 60.4 4 Mtwara Rural 41.65 4 Liwale 58.35 5 Rungwe 40.35 5 Nachingwea 55.1 6 Tunduru 35.85 6 Mbinga 54.15 7 Mvomero 32.5 7 Morogoro Urban 48.65 8 Nachingwea 30.1 8 Mtwara Rural 47.9 9 Kilwa 29.15 9 Tunduru 40.75 10 Mbinga 29.15
10 Kyela 39.6
Ranking (%) status
Ranking (%) status S/N Name of LGA
High
S/N
Name of LGA Very high
1 Muleba 80.7 1 Bukoba Rural 71.3 2 Newala 68.75 2 Mbozi 56.25 3 Bukoba Urban 62.5 3 Bariadi 43.35 4 Kishapu 50.45 4 Mbeya Urban 41.7 5 Chunya 50
5 Meatu 39.15
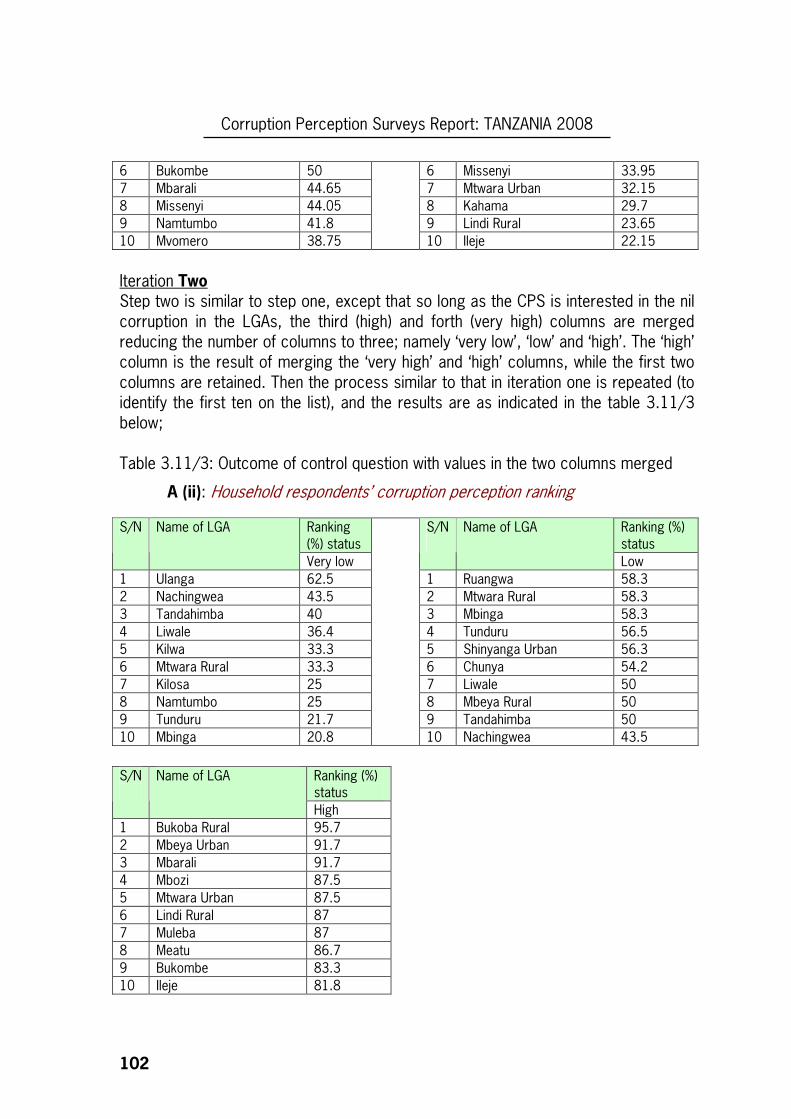
Corruption Perception Surveys Report: TANZANIA 2008
102
6 Bukombe 50 6 Missenyi 33.95 7 Mbarali 44.65 7 Mtwara Urban 32.15 8 Missenyi 44.05 8 Kahama 29.7 9 Namtumbo 41.8 9 Lindi Rural 23.65 10 Mvomero 38.75 10 Ileje 22.15
Iteration Two Step two is similar to step one, except that so long as the CPS is interested in the nil corruption in the LGAs, the third (high) and forth (very high) columns are merged reducing the number of columns to three; namely ‘very low’, ‘low’ and ‘high’. The ‘high’ column is the result of merging the ‘very high’ and ‘high’ columns, while the first two columns are retained. Then the process similar to that in iteration one is repeated (to identify the first ten on the list), and the results are as indicated in the table 3.11/3 below; Table 3.11/3: Outcome of control question with values in the two columns merged
A (ii): Household respondents’ corruption perception ranking
Ranking (%) status
Ranking (%) status
S/N Name of LGA
Very low
S/N
Name of LGA
Low 1 Ulanga 62.5 1 Ruangwa 58.3 2 Nachingwea 43.5 2 Mtwara Rural 58.3 3 Tandahimba 40 3 Mbinga 58.3 4 Liwale 36.4 4 Tunduru 56.5 5 Kilwa 33.3 5 Shinyanga Urban 56.3 6 Mtwara Rural 33.3 6 Chunya 54.2 7 Kilosa 25 7 Liwale 50 8 Namtumbo 25 8 Mbeya Rural 50 9 Tunduru 21.7 9 Tandahimba 50 10 Mbinga 20.8
10 Nachingwea 43.5
Ranking (%) status
S/N
Name of LGA
High 1 Bukoba Rural 95.7 2 Mbeya Urban 91.7 3 Mbarali 91.7 4 Mbozi 87.5 5 Mtwara Urban 87.5 6 Lindi Rural 87 7 Muleba 87 8 Meatu 86.7 9 Bukombe 83.3 10 Ileje 81.8
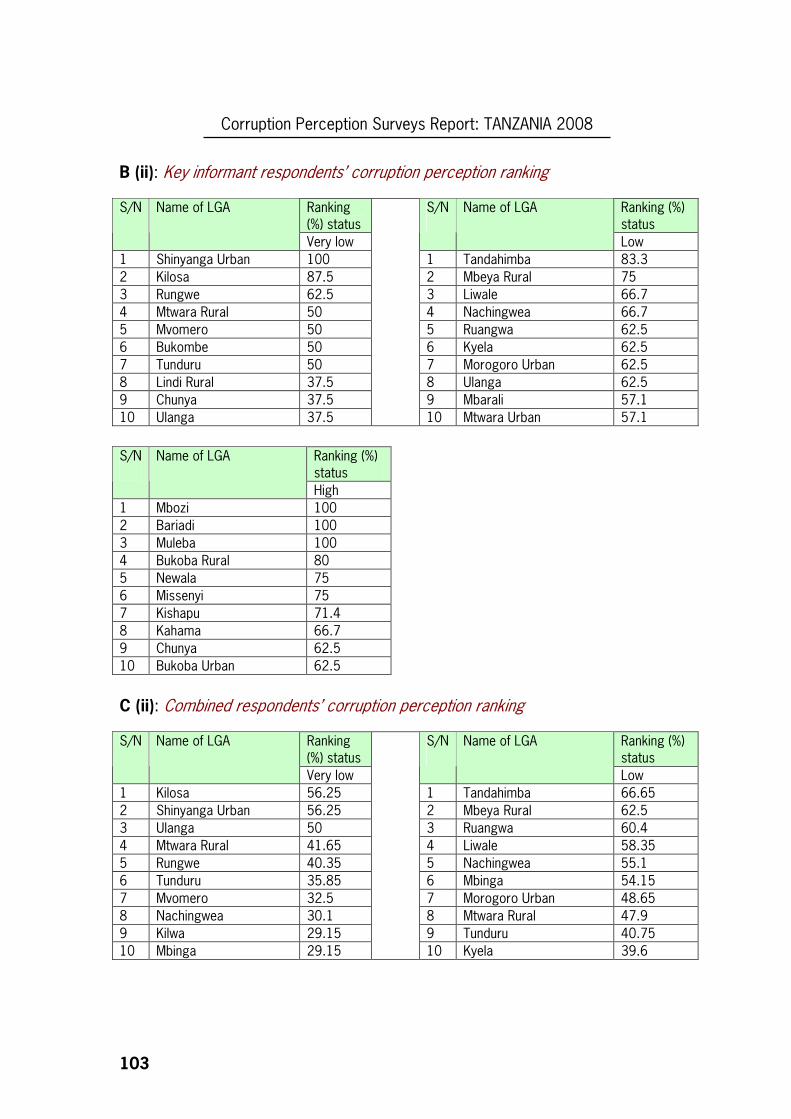
Corruption Perception Surveys Report: TANZANIA 2008
103
B (ii): Key informant respondents’ corruption perception ranking
Ranking (%) status
Ranking (%) status
S/N Name of LGA
Very low
S/N
Name of LGA
Low 1 Shinyanga Urban 100 1 Tandahimba 83.3 2 Kilosa 87.5 2 Mbeya Rural 75 3 Rungwe 62.5 3 Liwale 66.7 4 Mtwara Rural 50 4 Nachingwea 66.7 5 Mvomero 50 5 Ruangwa 62.5 6 Bukombe 50 6 Kyela 62.5 7 Tunduru 50 7 Morogoro Urban 62.5 8 Lindi Rural 37.5 8 Ulanga 62.5 9 Chunya 37.5 9 Mbarali 57.1 10 Ulanga 37.5
10 Mtwara Urban 57.1
Ranking (%) status
S/N
Name of LGA
High 1 Mbozi 100 2 Bariadi 100 3 Muleba 100 4 Bukoba Rural 80 5 Newala 75 6 Missenyi 75 7 Kishapu 71.4 8 Kahama 66.7 9 Chunya 62.5 10 Bukoba Urban 62.5
C (ii): Combined respondents’ corruption perception ranking
Ranking (%) status
Ranking (%) status
S/N Name of LGA
Very low
S/N
Name of LGA
Low 1 Kilosa 56.25 1 Tandahimba 66.65 2 Shinyanga Urban 56.25 2 Mbeya Rural 62.5 3 Ulanga 50 3 Ruangwa 60.4 4 Mtwara Rural 41.65 4 Liwale 58.35 5 Rungwe 40.35 5 Nachingwea 55.1 6 Tunduru 35.85 6 Mbinga 54.15 7 Mvomero 32.5 7 Morogoro Urban 48.65 8 Nachingwea 30.1 8 Mtwara Rural 47.9 9 Kilwa 29.15 9 Tunduru 40.75 10 Mbinga 29.15
10 Kyela 39.6
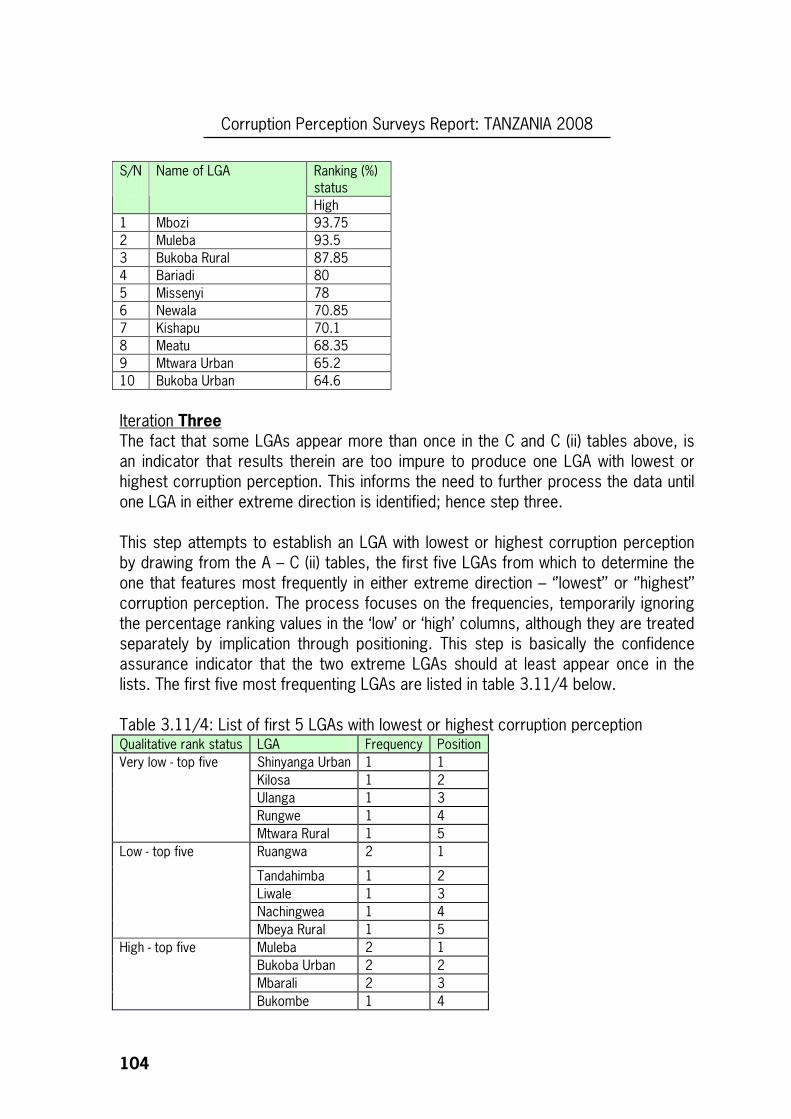
Corruption Perception Surveys Report: TANZANIA 2008
104
Ranking (%) status
S/N
Name of LGA
High 1 Mbozi 93.75 2 Muleba 93.5 3 Bukoba Rural 87.85 4 Bariadi 80 5 Missenyi 78 6 Newala 70.85 7 Kishapu 70.1 8 Meatu 68.35 9 Mtwara Urban 65.2 10 Bukoba Urban 64.6
Iteration Three The fact that some LGAs appear more than once in the C and C (ii) tables above, is an indicator that results therein are too impure to produce one LGA with lowest or highest corruption perception. This informs the need to further process the data until one LGA in either extreme direction is identified; hence step three. This step attempts to establish an LGA with lowest or highest corruption perception by drawing from the A – C (ii) tables, the first five LGAs from which to determine the one that features most frequently in either extreme direction – ‘’lowest’’ or ‘’highest’’ corruption perception. The process focuses on the frequencies, temporarily ignoring the percentage ranking values in the ‘low’ or ‘high’ columns, although they are treated separately by implication through positioning. This step is basically the confidence assurance indicator that the two extreme LGAs should at least appear once in the lists. The first five most frequenting LGAs are listed in table 3.11/4 below. Table 3.11/4: List of first 5 LGAs with lowest or highest corruption perception Qualitative rank status LGA Frequency Position
Shinyanga Urban 1 1
Kilosa 1 2
Ulanga 1 3
Rungwe 1 4
Very low - top five
Mtwara Rural 1 5
Ruangwa 2 1
Tandahimba 1 2
Liwale 1 3
Nachingwea 1 4
Low - top five
Mbeya Rural 1 5
Muleba 2 1
Bukoba Urban 2 2
Mbarali 2 3
High - top five
Bukombe 1 4
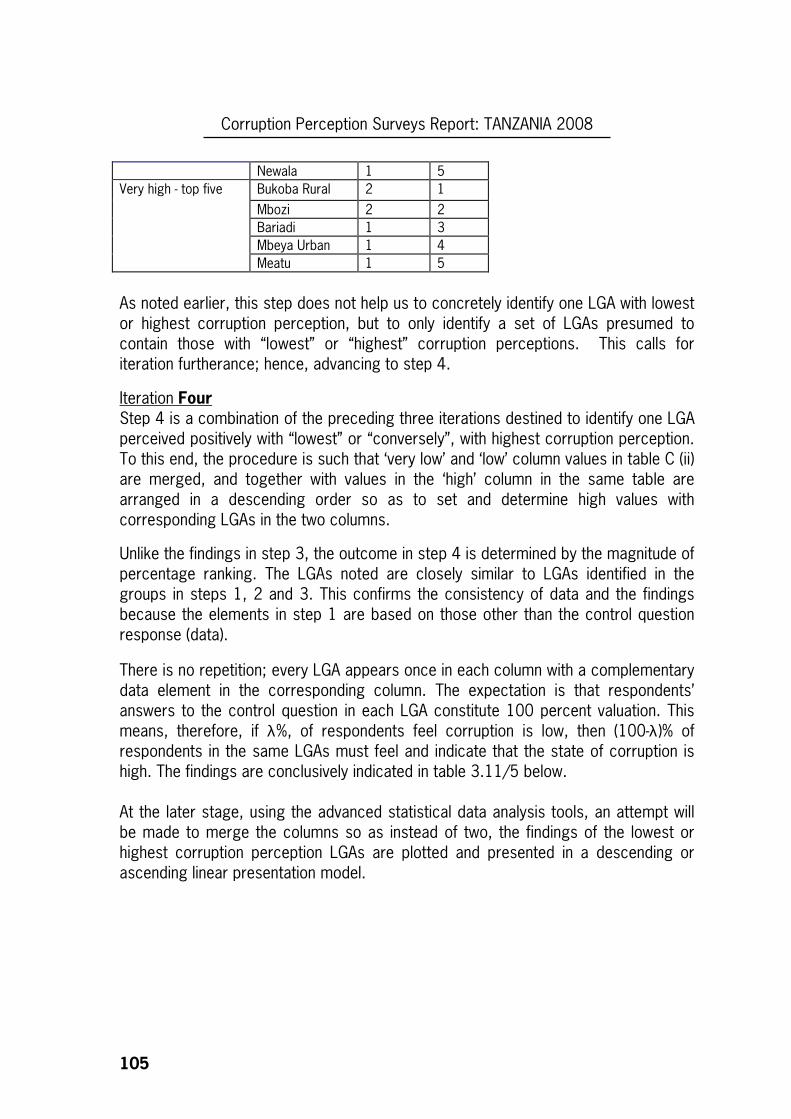
Corruption Perception Surveys Report: TANZANIA 2008
105
Newala 1 5
Bukoba Rural 2 1
Mbozi 2 2
Bariadi 1 3
Mbeya Urban 1 4
Very high - top five
Meatu 1 5
As noted earlier, this step does not help us to concretely identify one LGA with lowest or highest corruption perception, but to only identify a set of LGAs presumed to contain those with “lowest” or “highest” corruption perceptions. This calls for iteration furtherance; hence, advancing to step 4.
Iteration Four Step 4 is a combination of the preceding three iterations destined to identify one LGA perceived positively with “lowest” or “conversely”, with highest corruption perception. To this end, the procedure is such that ‘very low’ and ‘low’ column values in table C (ii) are merged, and together with values in the ‘high’ column in the same table are arranged in a descending order so as to set and determine high values with corresponding LGAs in the two columns.
Unlike the findings in step 3, the outcome in step 4 is determined by the magnitude of percentage ranking. The LGAs noted are closely similar to LGAs identified in the groups in steps 1, 2 and 3. This confirms the consistency of data and the findings because the elements in step 1 are based on those other than the control question response (data).
There is no repetition; every LGA appears once in each column with a complementary data element in the corresponding column. The expectation is that respondents’ answers to the control question in each LGA constitute 100 percent valuation. This means, therefore, if λ%, of respondents feel corruption is low, then (100-λ)% of respondents in the same LGAs must feel and indicate that the state of corruption is high. The findings are conclusively indicated in table 3.11/5 below. At the later stage, using the advanced statistical data analysis tools, an attempt will be made to merge the columns so as instead of two, the findings of the lowest or highest corruption perception LGAs are plotted and presented in a descending or ascending linear presentation model.
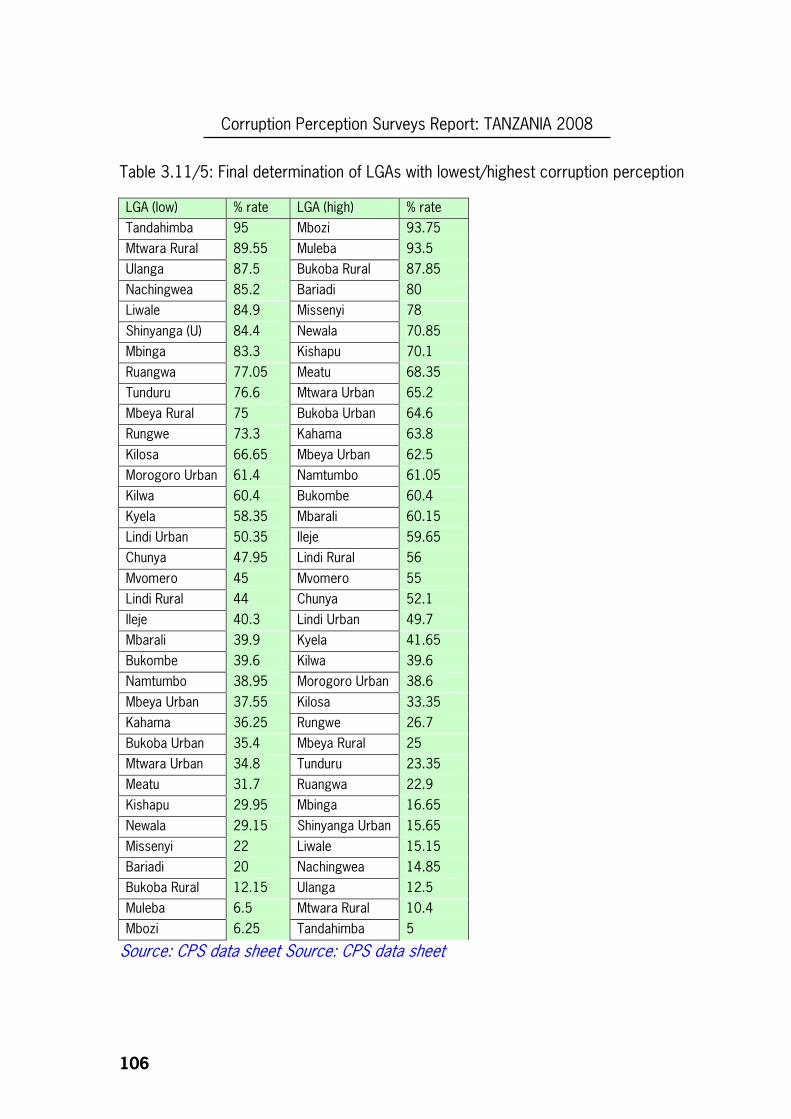
Corruption Perception Surveys Report: TANZANIA 2008
106
Table 3.11/5: Final determination of LGAs with lowest/highest corruption perception
Source: CPS data sheet Source: CPS data sheet
LGA (low) % rate LGA (high) % rate
Tandahimba 95 Mbozi 93.75
Mtwara Rural 89.55 Muleba 93.5
Ulanga 87.5 Bukoba Rural 87.85
Nachingwea 85.2 Bariadi 80
Liwale 84.9 Missenyi 78
Shinyanga (U) 84.4 Newala 70.85
Mbinga 83.3 Kishapu 70.1
Ruangwa 77.05 Meatu 68.35
Tunduru 76.6 Mtwara Urban 65.2
Mbeya Rural 75 Bukoba Urban 64.6
Rungwe 73.3 Kahama 63.8
Kilosa 66.65 Mbeya Urban 62.5
Morogoro Urban 61.4 Namtumbo 61.05
Kilwa 60.4 Bukombe 60.4
Kyela 58.35 Mbarali 60.15
Lindi Urban 50.35 Ileje 59.65
Chunya 47.95 Lindi Rural 56
Mvomero 45 Mvomero 55
Lindi Rural 44 Chunya 52.1
Ileje 40.3 Lindi Urban 49.7
Mbarali 39.9 Kyela 41.65
Bukombe 39.6 Kilwa 39.6
Namtumbo 38.95 Morogoro Urban 38.6
Mbeya Urban 37.55 Kilosa 33.35
Kahama 36.25 Rungwe 26.7
Bukoba Urban 35.4 Mbeya Rural 25
Mtwara Urban 34.8 Tunduru 23.35
Meatu 31.7 Ruangwa 22.9
Kishapu 29.95 Mbinga 16.65
Newala 29.15 Shinyanga Urban 15.65
Missenyi 22 Liwale 15.15
Bariadi 20 Nachingwea 14.85
Bukoba Rural 12.15 Ulanga 12.5
Muleba 6.5 Mtwara Rural 10.4
Mbozi 6.25 Tandahimba 5
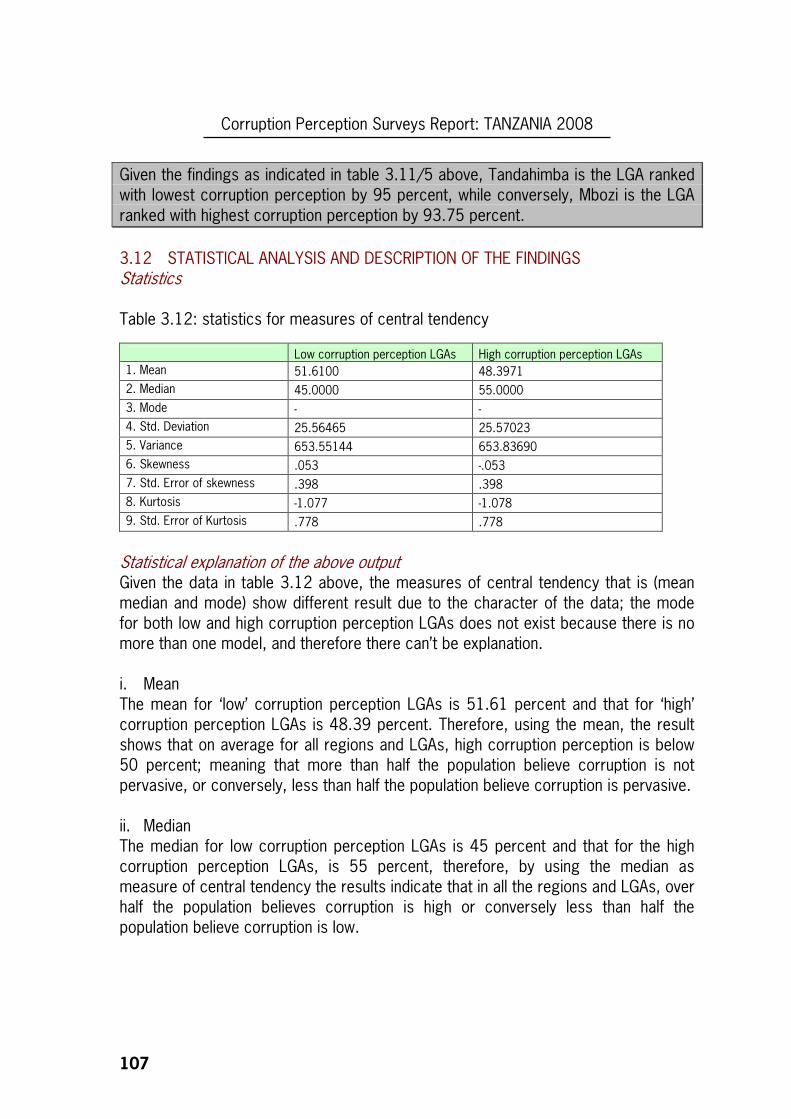
Corruption Perception Surveys Report: TANZANIA 2008
107
Given the findings as indicated in table 3.11/5 above, Tandahimba is the LGA ranked with lowest corruption perception by 95 percent, while conversely, Mbozi is the LGA ranked with highest corruption perception by 93.75 percent.
3.12 STATISTICAL ANALYSIS AND DESCRIPTION OF THE FINDINGS Statistics Table 3.12: statistics for measures of central tendency
Low corruption perception LGAs High corruption perception LGAs 1. Mean 51.6100 48.3971
2. Median 45.0000 55.0000
3. Mode - -
4. Std. Deviation 25.56465 25.57023
5. Variance 653.55144 653.83690
6. Skewness .053 -.053
7. Std. Error of skewness .398 .398
8. Kurtosis -1.077 -1.078
9. Std. Error of Kurtosis .778 .778
Statistical explanation of the above output Given the data in table 3.12 above, the measures of central tendency that is (mean median and mode) show different result due to the character of the data; the mode for both low and high corruption perception LGAs does not exist because there is no more than one model, and therefore there can’t be explanation. i. Mean The mean for ‘low’ corruption perception LGAs is 51.61 percent and that for ‘high’ corruption perception LGAs is 48.39 percent. Therefore, using the mean, the result shows that on average for all regions and LGAs, high corruption perception is below 50 percent; meaning that more than half the population believe corruption is not pervasive, or conversely, less than half the population believe corruption is pervasive. ii. Median The median for low corruption perception LGAs is 45 percent and that for the high corruption perception LGAs, is 55 percent, therefore, by using the median as measure of central tendency the results indicate that in all the regions and LGAs, over half the population believes corruption is high or conversely less than half the population believe corruption is low.
Corruption Perception Surveys Report: TANZANIA 2008
108
Conclusions Given the two results above, the different results based on the mean or median is obvious. This difference is due to the kind of the data. It is, therefore recommended to use median as measure of central tendency and conclude that the corruption perception in LGAs is high on average. This is due to the fact that the data are affected by the extreme value, which by observation indicates that there is very high value and very low value (extreme value).
iii. Standard deviation and variance The standard deviation of the low corruption perception LGAs is 25.56 with the variance of 653.55, while that for high corruption perception LGAs is 25.57 with the variance of 653.84. This means that there is a big variation across the high and low corruption perception LGAs. iv. Skewness The coefficient of skewness for low corruption perception LGAs is 0.053, and its standard error of 0.398. If the standard error is multiplied by two the answer is 0.796. And the coefficient of skewness must lie between negative 2 standard error and positive 2 standard error, from (-0.796 and 0.796), then since 0.053 is between these two values or 0.053 is not far from zero then suffices to say that the data is symmetrically distributed. Also for high corruption perception LGAs the data is also symmetrically distributed since -0.053 is near to zero and it lies between (-0.796 and 0.796) However, the coefficient of kurtosis is -1.077 and -1.078 for low and high corruption perception LGAs respectively. These show that data form a leptokurtic distribution because numerical value of kurtosis is negative and far from zero. Statistical distribution Using skewness and kurtosis therefore, shows that although the data is symmetrical distributed, they are not following a normal distribution due to the fact that they have high negative value of kurtosis that form (leptokurtic) and therefore, concluding that the data are not normally distributed.
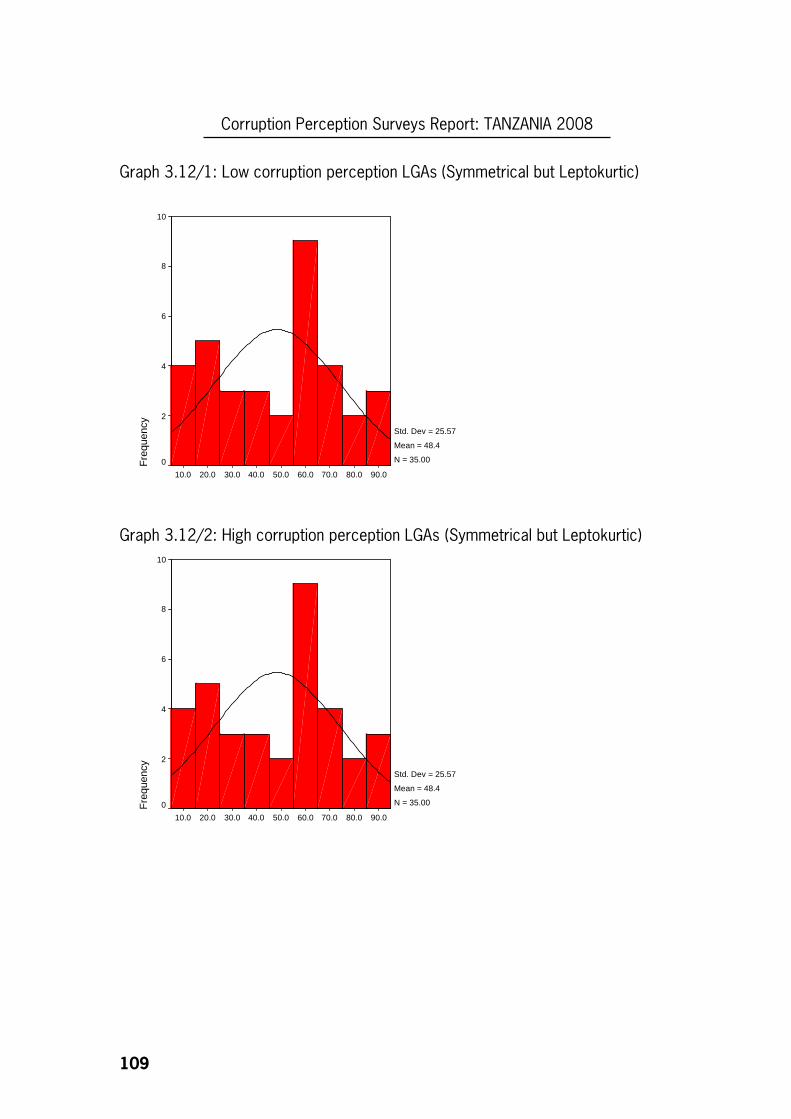
Corruption Perception Surveys Report: TANZANIA 2008
109
Graph 3.12/1: Low corruption perception LGAs (Symmetrical but Leptokurtic)
90.080.070.060.050.040.030.020.010.0
Fre
quen
cy
10
8
6
4
2
0
Std. Dev = 25.57
Mean = 48.4
N = 35.00
Graph 3.12/2: High corruption perception LGAs (Symmetrical but Leptokurtic)
90.080.070.060.050.040.030.020.010.0
Fre
quen
cy
10
8
6
4
2
0
Std. Dev = 25.57
Mean = 48.4
N = 35.00
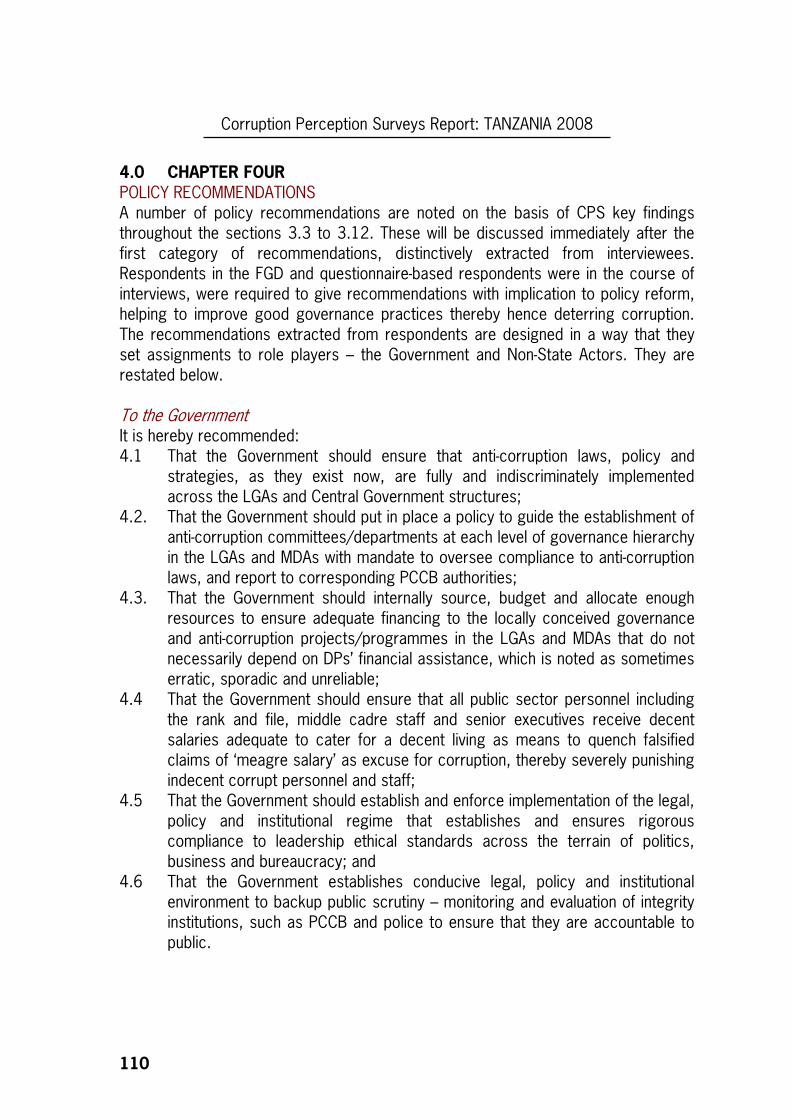
Corruption Perception Surveys Report: TANZANIA 2008
110
4.0 CHAPTER FOUR
POLICY RECOMMENDATIONS A number of policy recommendations are noted on the basis of CPS key findings throughout the sections 3.3 to 3.12. These will be discussed immediately after the first category of recommendations, distinctively extracted from interviewees. Respondents in the FGD and questionnaire-based respondents were in the course of interviews, were required to give recommendations with implication to policy reform, helping to improve good governance practices thereby hence deterring corruption. The recommendations extracted from respondents are designed in a way that they set assignments to role players – the Government and Non-State Actors. They are restated below. To the Government It is hereby recommended: 4.1 That the Government should ensure that anti-corruption laws, policy and
strategies, as they exist now, are fully and indiscriminately implemented across the LGAs and Central Government structures;
4.2. That the Government should put in place a policy to guide the establishment of anti-corruption committees/departments at each level of governance hierarchy in the LGAs and MDAs with mandate to oversee compliance to anti-corruption laws, and report to corresponding PCCB authorities;
4.3. That the Government should internally source, budget and allocate enough resources to ensure adequate financing to the locally conceived governance and anti-corruption projects/programmes in the LGAs and MDAs that do not necessarily depend on DPs’ financial assistance, which is noted as sometimes erratic, sporadic and unreliable;
4.4 That the Government should ensure that all public sector personnel including the rank and file, middle cadre staff and senior executives receive decent salaries adequate to cater for a decent living as means to quench falsified claims of ‘meagre salary’ as excuse for corruption, thereby severely punishing indecent corrupt personnel and staff;
4.5 That the Government should establish and enforce implementation of the legal, policy and institutional regime that establishes and ensures rigorous compliance to leadership ethical standards across the terrain of politics, business and bureaucracy; and
4.6 That the Government establishes conducive legal, policy and institutional environment to backup public scrutiny – monitoring and evaluation of integrity institutions, such as PCCB and police to ensure that they are accountable to public.
Corruption Perception Surveys Report: TANZANIA 2008
111
To Non State Actors It is hereby recommended: 4.7 That NSAs devise collective anti-corruption or good governance agenda,
strategies, plans and activities intended to harmonise and facilitate similar and coordinated engagements in LGAs and MDAs, through civic education, social movements, outreach to grassroots/rural areas, and M&E (compliance to leadership ethics);
4.8 That collectively, NSAs undertake critical self assessment to identify strategic entry points of cooperation with LGAs/MDAs so as to eradicate corruption and promote good governance;
4.9 That NSAs restore/reinforce public credibility/trust, promote their unique identity and visibility through media and community participatory projects and programmes meant to combat corruption and promote good governance;
4.10 That inter-faith leaders maintain ardent preaching against corruption in order to restore socially-acceptable morals, accountability, and good governance practices; and
4.11 That the general public resist tendencies for corruption demand or supply, but instead volunteer reporting corruption criminal offences to designated public institutions/organisations/departments across the LGAs and MDAs hierarchy.
Surveys findings-based policy recommendations As mentioned earlier in this chapter, the second category of policy recommendations is based on the surveys’ analyses and findings across the sections 3.3 through 3.12, as follows: 4.12 As confirmed by findings, the majority public members are aware of
corruption, in which case the relevant policy implication is for the Government and NSAs to strategically shift away from IEC activities towards focussing on specific and direct corruption reduction actions.
4.13 The forces driving people into corruption are largely related to weak governance structures/systems in the LGAs. The policy recommendation in this regard is to ensure legal guarantee to public access to information to strengthen public demand for accountability, transparency and rule of law, as well as obligate the bureaucracy in the LGAs and MDAs to release governance pertinent information on demand or otherwise, augmenting public demand for accountability. In this regard, LGAs should adopt the ongoing national-level underlying MKUKUTA PAF dialogue structure as an interim strategic framework for information exchange with NSAs.
4.14 The outcome of the analyses of corruption trends across actors, and indeed examining the internal elements perceived as seeking and directly appropriating the rent of corruption in the sectors/departments, point to existence of weak accountability in the administrative structures and systems of LGAs’ departments, institutions, agencies or organisations. Whereas we
Corruption Perception Surveys Report: TANZANIA 2008
112
recommend carrying-out an evaluation of the existing horizontal and vertical accountability systems in the LGAs in order to take appropriate corrective measures, the Government should immediately devise and fix the policy to strengthen [LGAs service delivery] users’ demand for accountability through improving the system of information flow, transparency and participation in policy-design.
4.15 [3.7 Policy implication recommendations]: i. The fact that the police and the Judiciary are the principal corruption
shareholders in LGAs, the implication is that keeping law and order in the LGAs is at stake. Elimination and permanent control of corruption from the police and the judiciary will bear positive results in fighting corrupt elements in other departments of the LGAs. An anti-corruption policy strategy specifically designed for police and the judiciary is imperative;
ii. Although the legal sector policy reform programme (LSRP) and the LGRP are being concurrently implemented, the imperative is to devise and fix the strategy that ensures harmonisation of the two reforms clearly focussing on LGAs; and
iii. PSRP is an overall public sector reform initiative with little or no specific strategy to overhaul the police force, which unfortunately, over the past 47 years it still retains and maintains the core philosophy, principles, and structures of the antiquated colonial state police. Because of the functioning ‘top-down’ disciplinary code of command, it is impossible for the ‘rank and file’ to check corruption within the police force from below, but instead, many low-ranking police officers have tended to ‘cope’ with it. It is therefore recommended to overhaul the police force, replacing its current philosophy, principles and structures with those for police service. The legitimate state policing should solely rely on professional practices rather than receiving and enforcing orders from political power holders.
4.16 Public readiness to counteract corruption exists amid preponderant weak legal and policy instruments to empower the citizenry to accomplish it duty in that regard. The Government should recognize such public readiness as formidable potential to design a policy that equally strengthens PCCB and similar institutions within the Government together with efforts to coordinate, accommodate and enhancing capacity of NSAs fighting corruption in the LGAs. Merely mentioning that NACSAP recognises NSAs is inadequate. In this regard, the areas requiring urgent Government policy and legal attention are noted to include: i. Activating the functional and institutional coordination structure to guide
anti-corruption actors in LGAs to coordinate reporting of corruption to PCCB;
Corruption Perception Surveys Report: TANZANIA 2008
113
ii. Review of PCCA with the goal of accommodating public litigation as strategic incentive to mobilise public support in the fight against corruption;
iii. Enactment of the whistleblowers protection law; iv. Launching of LGAs-NSAs Dialogues through a number of strategic entry-
points/engagements, including participatory budgeting process [planning, allocation review, monitoring and evaluation] and governance surveys findings/reports, e.g. CPS findings – aimed at reducing corruption and/or promoting good governance in the LGAs;
v. Launching of efforts and specific programmes dedicated at enhancing civic competence across communities in the LGAs; and
vi. Enactment of legislation to enforce public access to pertinent governance information in the LGAs.
4.17.1 Weak institutional link between PCCB and LGAs governance structures is observed as pervasive. There is little understanding/misconception or non awareness about the role and significance of CSOs involvement in fighting corruption, and how CSOs’ role differs from that of Government and LGAs in particular. This state of affairs calls for specific policy recommendations as follows: i. Need to put in place an efficient governance coordination structure and
system practically linking the structures of PCCB with those across the levels in the LGAs; and
ii. Reinforce the strategy enabling the CSOs to disseminate appropriate and relevant information about how similar or different is their anti-corruption role and significance in relation to that of Government.
4.17.2 The proposed whistleblowers protection legislation by Government is the positive move and, should therefore be supported. However, enabling the NSAs to effectively use the law when enacted and assented is imperative. This calls for supporting NSAs to translate and disseminate the Kiswahili version of the law. The policy direction is therefore needed to guide LGAs, NSAs and PCCB develop and adopt the collective strategy against corruption.
4.17.3 The strategic inclusion of inter-faith organisations to fight corruption is a noble innovation. However, the strategy must be comprehensive and holistic across different religions. This calls for the Government to lead the process to design the policy for cohabiting LGAs with inter-faith organisations across governance structures and levels of the former. Central Government should proactively put the policy in place to establish and formalise anti-corruption working relationship between inter-faith organisations and LGAs. To that end, we recommend establishment of the Joint Corruption Information Centres (CIC) coordinated by inter-faith organisations at different levels, responsible for
Corruption Perception Surveys Report: TANZANIA 2008
114
collecting pertinent information from public and equally feeding the same to the PCCB and LGAs governance structures.
Corruption Perception Surveys Report: TANZANIA 2008
115
SELECTED REFERENCES
1. Alice McIntyre, Participatory Action Research, Sage Publications, Inc., 2008. 2. Anti-Corruption Resource Centre: www.U4.no, Promoting an Informed Approach to
Anti-Corruption, Chr. Michelsen Institute, Berger Norway, Publication, 2007. 3. ARD, Inc. Democracy and Governance Assessment of Tanzania Transitions from
the Single-Party State, Report submitted to the United States Agency for International Development, November 2003.
4. Brian Cooksey, Tanzania Development Research Group, Corruption and Governance in Tanzania: What does the Literature say? Report for the Royal Norwegian Embassy and the Governance Working Group, August 2005.
5. Construction Sector Transparency Initiatives, Report on Construction Sector Transparency Initiative Design for Pilot Phase, July 2007.
6. URT, Operations and Financial Management Manual for the Facility for Ethics, Accountability and Transparency [FEAT]: Ethics Secretariat, September, 1999.
7. Department of Political Science and Public Administration, the University of Dar es Salaam, Tanzania, Report on Democracy and Political Governance in Tanzania, April 02, 2008.
8. Edward Dua Agycman, Auditor General of the Republic of Ghana, Lessons Learn from Global Good Practice–examples of Institutional Reforms in Audit Institution, Ghanaian Experience, A Paper Presented on the Seminar of Improving Accountability Regarding the use of Public Resources, 3 – 5 May, 2007.
9. Edward Olowo Okere, Regional Manager, Financial Management Africa Region, The World Bank, A paper on World Bank Support for Supreme Audit Institutions, May 3, 2007.
10. Gelase Mutahaba, Chief Technical Advisor/Policy Adviser: President’s Office Public Service Management, Dar es Salaam, Tanzania, Pay Reform and Corruption in Tanzania’s Public Service, A Paper Presented at the Seminar on Potential for Public Service Pay Reform to Eradicate Corruption among Civil Servants in Tanzania,26 May, 2005.
11. Hakikazi Catalyst, REPOA and TGNP, Follow the Money: A Resource Book for
Trainers on Public Expenditure Tracking in Tanzania. 12. Jack Smith, Mark Pieth and Guillermo Jorge at the Basel Institute on Governance,
International Centre for Asset Recovery, The Recovery of Stolen Assets: A Fundamental Principle of the UN Convention Against Corruption, Publication U4 Brief, www.U4.no: Chr. Michelsen Institute, Bergen Norway, February 2007 – No.2.
13. Jeremy Gould and Julia Ojanen, Merging in the Circle: Political Consequences of Tanzania’s Poverty Reduction Strategy: A Tanzania Case Study for a Research Project on Consultation and Empowerment: Political Implications of Participatory Public Policy Formulation in Five Developing Countries, Carried out in
Corruption Perception Surveys Report: TANZANIA 2008
116
Collaboration between the Institute of Development Studies, University of Helsinki and Chr. Michelsen Institute , Bergen Norway, December, 2002.
14. Jessica Schultz and Tina Sqreide, Corruption in Aid-Funded Emergency Procurement, Chr. Michelsen Institute, Bergen Norway, Publication, November 2006.
15. Legal and Human Rights Centre in collaboration with the Zanzibar Legal Service Centre, Tanzania Human Rights Report 2007: Incorporating Specific Part on Zanzibar, 2007.
16. Ludovick S.L. Utouh, The Controller and Auditor General, The United Republic of Tanzania, Improving Audit and Accountability in Tanzania, Paper presented at Tanzania Accountability Conference at Blue Pearl Hotel – Ubungo Plaza – Dar es Salaam, 3rd – 5th May, 2007.
17. Maaria Seppanen and Pekka Virtanen, Corruption, Poverty and Gender: With Case Studies of Micargue and Tanzania, Erueko Painotuote Oy, 2008.
18. Melakou Tegegn (Ethiopia), Institute of Social Studies, The Hague, 1990, Origin and Development of the Conflicting Relationship Between State and Society in the Soviet Union, MA thesis ISS, 1994.
19. URT, The Controller and Auditor General’s Report on the Financial Statements of Local Government Authorities for the Financial Year ended 30th June, 2006, The Government Printers, Dar es Salaam, Tanzania, March, 2007.
20. URT, The Controller and Auditor General’s Report on the Financial Statements of the Central Government for the Financial Year ended 30th June, 2006, the Government Printer, Dar es Salaam, Tanzania, March, 2007.
21. Odd – Helge Fjeldstad, Revenue Administration and Corruption, Chr. Michelsen Institute, Bergen Norway, Publication, U4 ISSUE 2: 2005.
22. Odd-Helge Fjeldstad, Lucas Katera and Erasto Mgalewa, Out Sourcing Revenue Collection: Experiences from Local Government Authorities in Tanzania, Research on Poverty Alleviation, Brief 10 March, 2008.
23. URT, Mpango wa Utekelezaji wa Mapambano Dhidi ya Rushwa Katika Halmashauri (2005 – 2010), Government Press, GGCU 2005.
24. URT, Mwongozo wa Maandalizi ya Mipango ya Utekelezaji wa Mapambano Dhidi ya Rushwa Katika Serikali za Mitaa, Central Printing Works Limited, Dar es Salaam, Publication, Octoba 2004.
25. Policy Forum, Utawala wa Demokrasia Katika Jamii: Ushiriki wa Wananchi katika Serikali za Mitaa (Vitongoji, Vijiji na Mitaa), Tanzania Printers Limited, Dar es Salaam, Toleo la Pili 2008.
26. URT, The National Anti-Corruption Strategy and Sector Specific Action Plans for all Ministries, Plan Independent Government Departments and Executive Agencies Phase II, 2006 – 2010, Publication, GGCU, 2006.
27. REPOA/URT, Poverty and Human Development Report 2007, December 2007. 28. Odd-helge Fjeldstad, Erasto Mgalewa and Lucas Katera, Citizen Demand Tougher
Action on Corruption in Tanzania, REPOA working paper, No. 11, April 2008.
Corruption Perception Surveys Report: TANZANIA 2008
117
29. Robert Williams and Alan Dorg, Achieving Success and Avoiding Failure in Anti-Corruption Commissions: Developing the Role of Donors, Publication U4 brief, www.U4.no,Chr. Michelsen Institute, Bergen Norway , January 2007 – No.1.
30. Simon A.H Milledge, Ised K. Gelvas and Intje Ahrends, A Study Report on Forestry, Governance and National Development: Lessons Learned from a Logging boom in Southern Tanzania, TRAFFIC East/Southern Africa, 2007.
31. Simon Jansen Maal, Tax and Governance in Tanzania: An econometric study of how various sources revenue affects public expenditure in Local Governments, Master thesis for the Master of Economic Theory and Econometrics degree, Department of Economic University of Oslo, December, 2007.
32. The International EITI Secretariat in the UK Department for International Development (DFID): Source Book of Extractive Industries Transparency Initiatives, March, 2005.
33. URT, Commission Report on the State of Corruption in the Country, Executive Summary, Tanzania, December, 1996.
34. Tim Kelsall, Going with the grain in African Development?, The overseas Development Institute, No 1 June, 2008.
35. Transparent International, the Coalition Against Corruption, Press Release on Africa and the Middle East Regional Highlights Corruption Perception Index 2005.
36. U4 Anti-Corruption Resource Centre, U4 Report on Tanzania Anti-Corruption Policy Making Practice, 2007.
37. URT, Government Press on the Constitution of the United Republic of Tanzania of 1977, April, 1998.
38. URT/REPOA, Views of the People 2007: Tanzania give their Opinions on Growth and Reduction of Income Poverty, Their Quality of Life and Social Well-being, and Governance and Accountability, http://www.repoa.or.tz/content/blogcategory/35/67/#people, December, 2007.
39. URT, Matokeo ya Utafiti wa CWIQ, http://www.edi-africa.com; 2007. 40. Oxford Policy Management/ REPOA/Chr. Michelsen Institute, Understanding
Patterns of Accountability in Tanzania, Final Synthesis Report, August, 2005 41. www.worldbank.org/wbi/governance/, Worldwide Governance Indicators, 1996 –
2006, Country Data Report for Tanzania, 1996 – 2006, Governance matter 2007.
42. ESRF/FACEIT, Annual Report 2002 on the State of Corruption in Tanzania, Oct, 2002.
43. Liviga A.J., 2007. Participatory Democracy and Decentralized Governance in Tanzania: Paper presented at the Workshop on Participatory Democracy organized by REDET, held at Bwawani Hotel, Zanzibar, 2nd – 3rd May, 2007, REDET.
44. Ngware S. and .Haule M., The Forgotten Level: Village Government in Tanzania, Institute of African Affairs, Hamburg; 1993
Corruption Perception Surveys Report: TANZANIA 2008
118
45. WBI, Country Data Report for TANZANIA, 1996-2006 in Governance Matters 2007-Worldwide Governance Indicators, 1996-2006; WBI, 2007.
46. TI, National Integrity Systems Transparency International Country Study Report, Tanzania 2003.
47. World Press Trends (2007). World Association of Newspapers, Paris. Retrieved in July 2008: http://www.wan-press.org
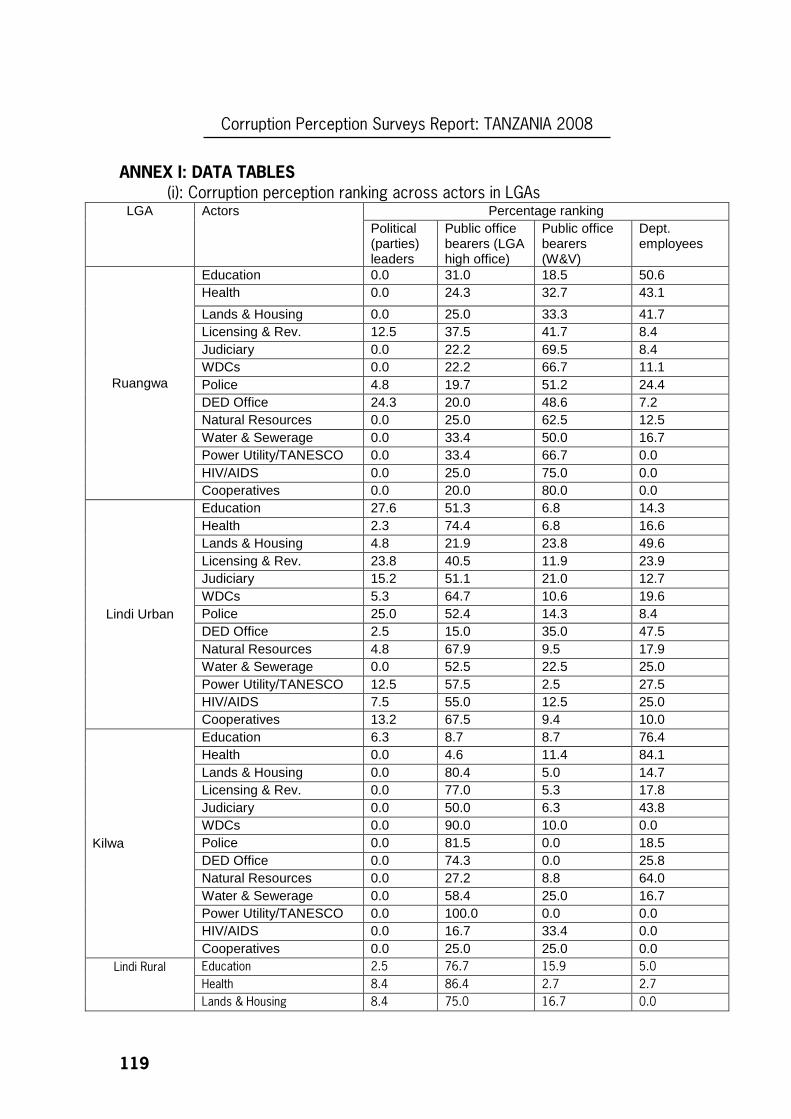
Corruption Perception Surveys Report: TANZANIA 2008
119
ANNEX I: DATA TABLES
(i): Corruption perception ranking across actors in LGAs Actors Percentage ranking LGA Political
(parties) leaders
Public office bearers (LGA high office)
Public office bearers (W&V)
Dept. employees
Education 0.0 31.0 18.5 50.6 Health 0.0 24.3 32.7 43.1
Lands & Housing 0.0 25.0 33.3 41.7 Licensing & Rev. 12.5 37.5 41.7 8.4 Judiciary 0.0 22.2 69.5 8.4 WDCs 0.0 22.2 66.7 11.1 Police 4.8 19.7 51.2 24.4 DED Office 24.3 20.0 48.6 7.2 Natural Resources 0.0 25.0 62.5 12.5 Water & Sewerage 0.0 33.4 50.0 16.7 Power Utility/TANESCO 0.0 33.4 66.7 0.0 HIV/AIDS 0.0 25.0 75.0 0.0
Ruangwa
Cooperatives 0.0 20.0 80.0 0.0 Education 27.6 51.3 6.8 14.3 Health 2.3 74.4 6.8 16.6 Lands & Housing 4.8 21.9 23.8 49.6 Licensing & Rev. 23.8 40.5 11.9 23.9 Judiciary 15.2 51.1 21.0 12.7 WDCs 5.3 64.7 10.6 19.6 Police 25.0 52.4 14.3 8.4 DED Office 2.5 15.0 35.0 47.5 Natural Resources 4.8 67.9 9.5 17.9 Water & Sewerage 0.0 52.5 22.5 25.0 Power Utility/TANESCO 12.5 57.5 2.5 27.5 HIV/AIDS 7.5 55.0 12.5 25.0
Lindi Urban
Cooperatives 13.2 67.5 9.4 10.0 Education 6.3 8.7 8.7 76.4 Health 0.0 4.6 11.4 84.1 Lands & Housing 0.0 80.4 5.0 14.7 Licensing & Rev. 0.0 77.0 5.3 17.8 Judiciary 0.0 50.0 6.3 43.8 WDCs 0.0 90.0 10.0 0.0 Police 0.0 81.5 0.0 18.5 DED Office 0.0 74.3 0.0 25.8 Natural Resources 0.0 27.2 8.8 64.0 Water & Sewerage 0.0 58.4 25.0 16.7 Power Utility/TANESCO 0.0 100.0 0.0 0.0 HIV/AIDS 0.0 16.7 33.4 0.0
Kilwa
Cooperatives 0.0 25.0 25.0 0.0 Education 2.5 76.7 15.9 5.0
Health 8.4 86.4 2.7 2.7
Lindi Rural
Lands & Housing 8.4 75.0 16.7 0.0
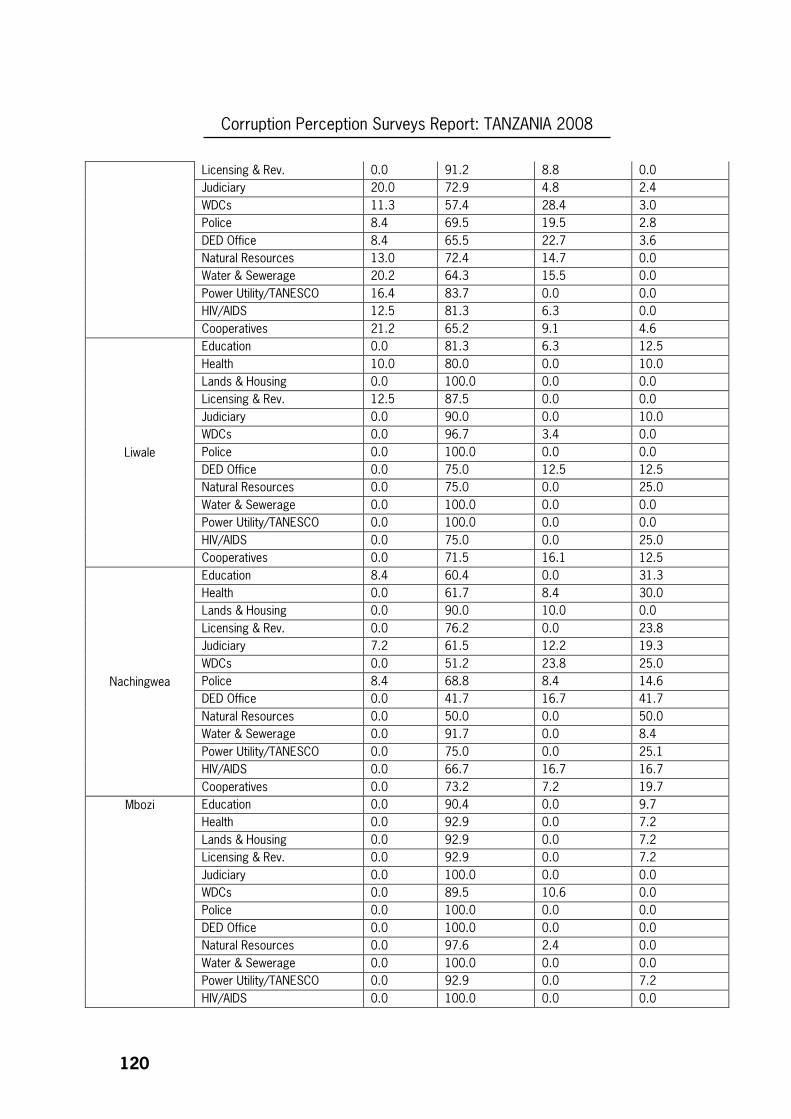
Corruption Perception Surveys Report: TANZANIA 2008
120
Licensing & Rev. 0.0 91.2 8.8 0.0
Judiciary 20.0 72.9 4.8 2.4
WDCs 11.3 57.4 28.4 3.0
Police 8.4 69.5 19.5 2.8
DED Office 8.4 65.5 22.7 3.6
Natural Resources 13.0 72.4 14.7 0.0
Water & Sewerage 20.2 64.3 15.5 0.0
Power Utility/TANESCO 16.4 83.7 0.0 0.0
HIV/AIDS 12.5 81.3 6.3 0.0
Cooperatives 21.2 65.2 9.1 4.6
Education 0.0 81.3 6.3 12.5
Health 10.0 80.0 0.0 10.0
Lands & Housing 0.0 100.0 0.0 0.0
Licensing & Rev. 12.5 87.5 0.0 0.0
Judiciary 0.0 90.0 0.0 10.0
WDCs 0.0 96.7 3.4 0.0
Police 0.0 100.0 0.0 0.0
DED Office 0.0 75.0 12.5 12.5
Natural Resources 0.0 75.0 0.0 25.0
Water & Sewerage 0.0 100.0 0.0 0.0
Power Utility/TANESCO 0.0 100.0 0.0 0.0
HIV/AIDS 0.0 75.0 0.0 25.0
Liwale
Cooperatives 0.0 71.5 16.1 12.5
Education 8.4 60.4 0.0 31.3
Health 0.0 61.7 8.4 30.0
Lands & Housing 0.0 90.0 10.0 0.0
Licensing & Rev. 0.0 76.2 0.0 23.8
Judiciary 7.2 61.5 12.2 19.3
WDCs 0.0 51.2 23.8 25.0
Police 8.4 68.8 8.4 14.6
DED Office 0.0 41.7 16.7 41.7
Natural Resources 0.0 50.0 0.0 50.0
Water & Sewerage 0.0 91.7 0.0 8.4
Power Utility/TANESCO 0.0 75.0 0.0 25.1
HIV/AIDS 0.0 66.7 16.7 16.7
Nachingwea
Cooperatives 0.0 73.2 7.2 19.7
Education 0.0 90.4 0.0 9.7
Health 0.0 92.9 0.0 7.2
Lands & Housing 0.0 92.9 0.0 7.2
Licensing & Rev. 0.0 92.9 0.0 7.2
Judiciary 0.0 100.0 0.0 0.0
WDCs 0.0 89.5 10.6 0.0
Police 0.0 100.0 0.0 0.0
DED Office 0.0 100.0 0.0 0.0
Natural Resources 0.0 97.6 2.4 0.0
Water & Sewerage 0.0 100.0 0.0 0.0
Power Utility/TANESCO 0.0 92.9 0.0 7.2
Mbozi
HIV/AIDS 0.0 100.0 0.0 0.0
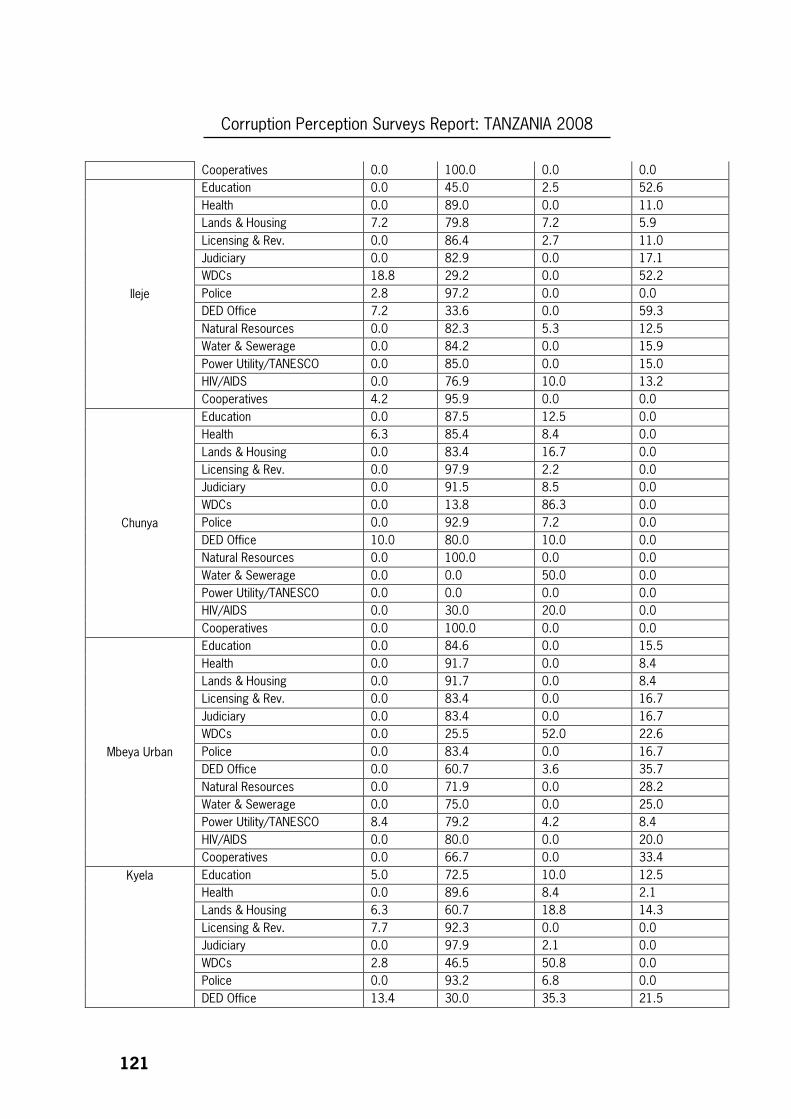
Corruption Perception Surveys Report: TANZANIA 2008
121
Cooperatives 0.0 100.0 0.0 0.0
Education 0.0 45.0 2.5 52.6
Health 0.0 89.0 0.0 11.0
Lands & Housing 7.2 79.8 7.2 5.9
Licensing & Rev. 0.0 86.4 2.7 11.0
Judiciary 0.0 82.9 0.0 17.1
WDCs 18.8 29.2 0.0 52.2
Police 2.8 97.2 0.0 0.0
DED Office 7.2 33.6 0.0 59.3
Natural Resources 0.0 82.3 5.3 12.5
Water & Sewerage 0.0 84.2 0.0 15.9
Power Utility/TANESCO 0.0 85.0 0.0 15.0
HIV/AIDS 0.0 76.9 10.0 13.2
Ileje
Cooperatives 4.2 95.9 0.0 0.0
Education 0.0 87.5 12.5 0.0
Health 6.3 85.4 8.4 0.0
Lands & Housing 0.0 83.4 16.7 0.0
Licensing & Rev. 0.0 97.9 2.2 0.0
Judiciary 0.0 91.5 8.5 0.0
WDCs 0.0 13.8 86.3 0.0
Police 0.0 92.9 7.2 0.0
DED Office 10.0 80.0 10.0 0.0
Natural Resources 0.0 100.0 0.0 0.0
Water & Sewerage 0.0 0.0 50.0 0.0
Power Utility/TANESCO 0.0 0.0 0.0 0.0
HIV/AIDS 0.0 30.0 20.0 0.0
Chunya
Cooperatives 0.0 100.0 0.0 0.0
Education 0.0 84.6 0.0 15.5
Health 0.0 91.7 0.0 8.4
Lands & Housing 0.0 91.7 0.0 8.4
Licensing & Rev. 0.0 83.4 0.0 16.7
Judiciary 0.0 83.4 0.0 16.7
WDCs 0.0 25.5 52.0 22.6
Police 0.0 83.4 0.0 16.7
DED Office 0.0 60.7 3.6 35.7
Natural Resources 0.0 71.9 0.0 28.2
Water & Sewerage 0.0 75.0 0.0 25.0
Power Utility/TANESCO 8.4 79.2 4.2 8.4
HIV/AIDS 0.0 80.0 0.0 20.0
Mbeya Urban
Cooperatives 0.0 66.7 0.0 33.4
Education 5.0 72.5 10.0 12.5
Health 0.0 89.6 8.4 2.1
Lands & Housing 6.3 60.7 18.8 14.3
Licensing & Rev. 7.7 92.3 0.0 0.0
Judiciary 0.0 97.9 2.1 0.0
WDCs 2.8 46.5 50.8 0.0
Police 0.0 93.2 6.8 0.0
Kyela
DED Office 13.4 30.0 35.3 21.5
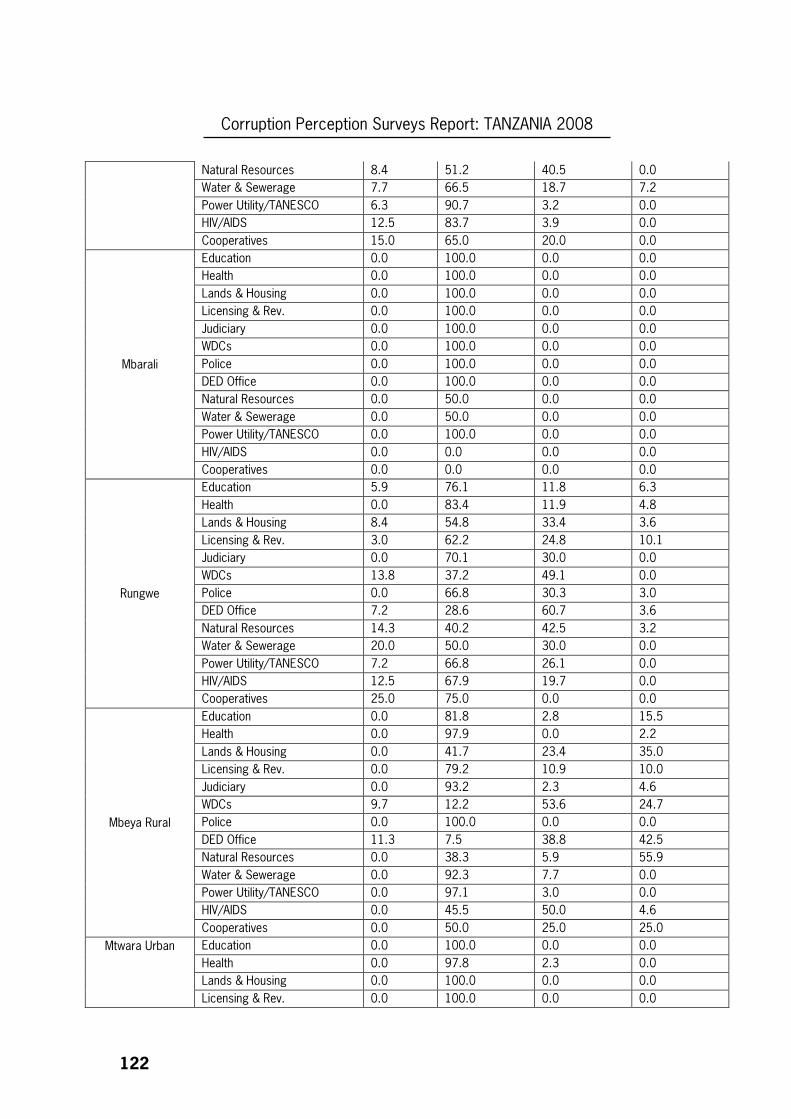
Corruption Perception Surveys Report: TANZANIA 2008
122
Natural Resources 8.4 51.2 40.5 0.0
Water & Sewerage 7.7 66.5 18.7 7.2
Power Utility/TANESCO 6.3 90.7 3.2 0.0
HIV/AIDS 12.5 83.7 3.9 0.0
Cooperatives 15.0 65.0 20.0 0.0
Education 0.0 100.0 0.0 0.0
Health 0.0 100.0 0.0 0.0
Lands & Housing 0.0 100.0 0.0 0.0
Licensing & Rev. 0.0 100.0 0.0 0.0
Judiciary 0.0 100.0 0.0 0.0
WDCs 0.0 100.0 0.0 0.0
Police 0.0 100.0 0.0 0.0
DED Office 0.0 100.0 0.0 0.0
Natural Resources 0.0 50.0 0.0 0.0
Water & Sewerage 0.0 50.0 0.0 0.0
Power Utility/TANESCO 0.0 100.0 0.0 0.0
HIV/AIDS 0.0 0.0 0.0 0.0
Mbarali
Cooperatives 0.0 0.0 0.0 0.0
Education 5.9 76.1 11.8 6.3
Health 0.0 83.4 11.9 4.8
Lands & Housing 8.4 54.8 33.4 3.6
Licensing & Rev. 3.0 62.2 24.8 10.1
Judiciary 0.0 70.1 30.0 0.0
WDCs 13.8 37.2 49.1 0.0
Police 0.0 66.8 30.3 3.0
DED Office 7.2 28.6 60.7 3.6
Natural Resources 14.3 40.2 42.5 3.2
Water & Sewerage 20.0 50.0 30.0 0.0
Power Utility/TANESCO 7.2 66.8 26.1 0.0
HIV/AIDS 12.5 67.9 19.7 0.0
Rungwe
Cooperatives 25.0 75.0 0.0 0.0
Education 0.0 81.8 2.8 15.5
Health 0.0 97.9 0.0 2.2
Lands & Housing 0.0 41.7 23.4 35.0
Licensing & Rev. 0.0 79.2 10.9 10.0
Judiciary 0.0 93.2 2.3 4.6
WDCs 9.7 12.2 53.6 24.7
Police 0.0 100.0 0.0 0.0
DED Office 11.3 7.5 38.8 42.5
Natural Resources 0.0 38.3 5.9 55.9
Water & Sewerage 0.0 92.3 7.7 0.0
Power Utility/TANESCO 0.0 97.1 3.0 0.0
HIV/AIDS 0.0 45.5 50.0 4.6
Mbeya Rural
Cooperatives 0.0 50.0 25.0 25.0
Education 0.0 100.0 0.0 0.0
Health 0.0 97.8 2.3 0.0
Lands & Housing 0.0 100.0 0.0 0.0
Mtwara Urban
Licensing & Rev. 0.0 100.0 0.0 0.0
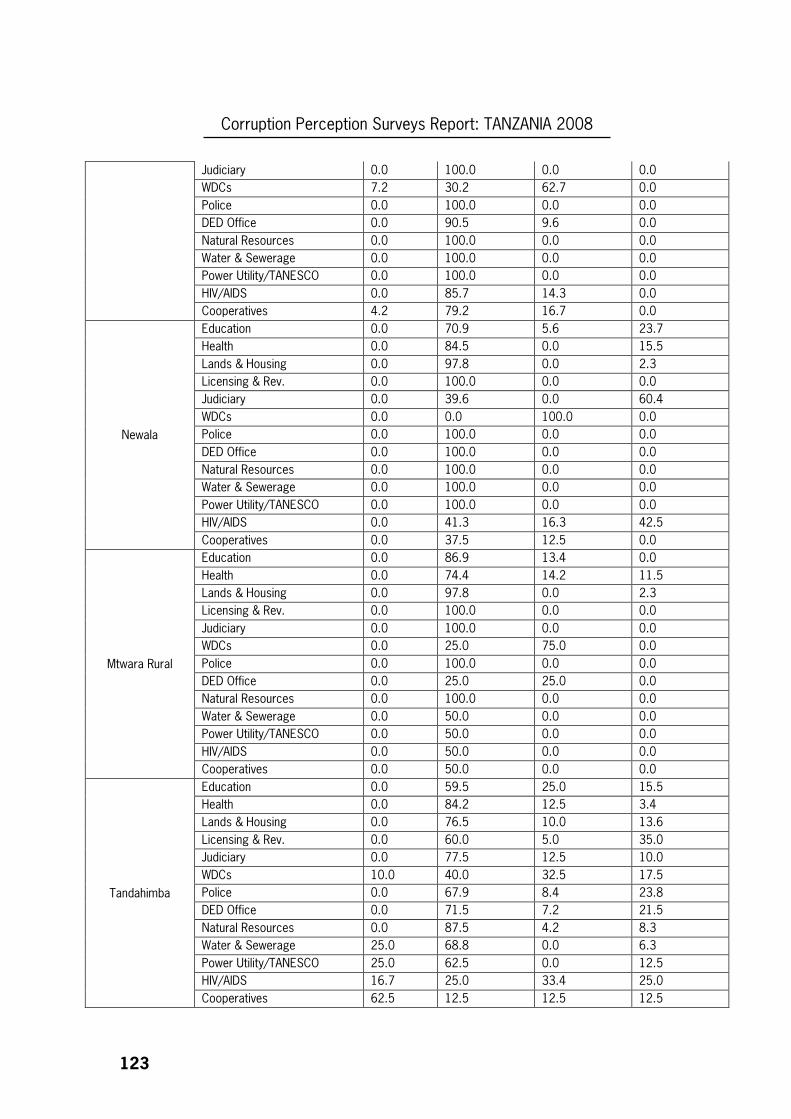
Corruption Perception Surveys Report: TANZANIA 2008
123
Judiciary 0.0 100.0 0.0 0.0
WDCs 7.2 30.2 62.7 0.0
Police 0.0 100.0 0.0 0.0
DED Office 0.0 90.5 9.6 0.0
Natural Resources 0.0 100.0 0.0 0.0
Water & Sewerage 0.0 100.0 0.0 0.0
Power Utility/TANESCO 0.0 100.0 0.0 0.0
HIV/AIDS 0.0 85.7 14.3 0.0
Cooperatives 4.2 79.2 16.7 0.0
Education 0.0 70.9 5.6 23.7
Health 0.0 84.5 0.0 15.5
Lands & Housing 0.0 97.8 0.0 2.3
Licensing & Rev. 0.0 100.0 0.0 0.0
Judiciary 0.0 39.6 0.0 60.4
WDCs 0.0 0.0 100.0 0.0
Police 0.0 100.0 0.0 0.0
DED Office 0.0 100.0 0.0 0.0
Natural Resources 0.0 100.0 0.0 0.0
Water & Sewerage 0.0 100.0 0.0 0.0
Power Utility/TANESCO 0.0 100.0 0.0 0.0
HIV/AIDS 0.0 41.3 16.3 42.5
Newala
Cooperatives 0.0 37.5 12.5 0.0
Education 0.0 86.9 13.4 0.0
Health 0.0 74.4 14.2 11.5
Lands & Housing 0.0 97.8 0.0 2.3
Licensing & Rev. 0.0 100.0 0.0 0.0
Judiciary 0.0 100.0 0.0 0.0
WDCs 0.0 25.0 75.0 0.0
Police 0.0 100.0 0.0 0.0
DED Office 0.0 25.0 25.0 0.0
Natural Resources 0.0 100.0 0.0 0.0
Water & Sewerage 0.0 50.0 0.0 0.0
Power Utility/TANESCO 0.0 50.0 0.0 0.0
HIV/AIDS 0.0 50.0 0.0 0.0
Mtwara Rural
Cooperatives 0.0 50.0 0.0 0.0
Education 0.0 59.5 25.0 15.5
Health 0.0 84.2 12.5 3.4
Lands & Housing 0.0 76.5 10.0 13.6
Licensing & Rev. 0.0 60.0 5.0 35.0
Judiciary 0.0 77.5 12.5 10.0
WDCs 10.0 40.0 32.5 17.5
Police 0.0 67.9 8.4 23.8
DED Office 0.0 71.5 7.2 21.5
Natural Resources 0.0 87.5 4.2 8.3
Water & Sewerage 25.0 68.8 0.0 6.3
Power Utility/TANESCO 25.0 62.5 0.0 12.5
HIV/AIDS 16.7 25.0 33.4 25.0
Tandahimba
Cooperatives 62.5 12.5 12.5 12.5
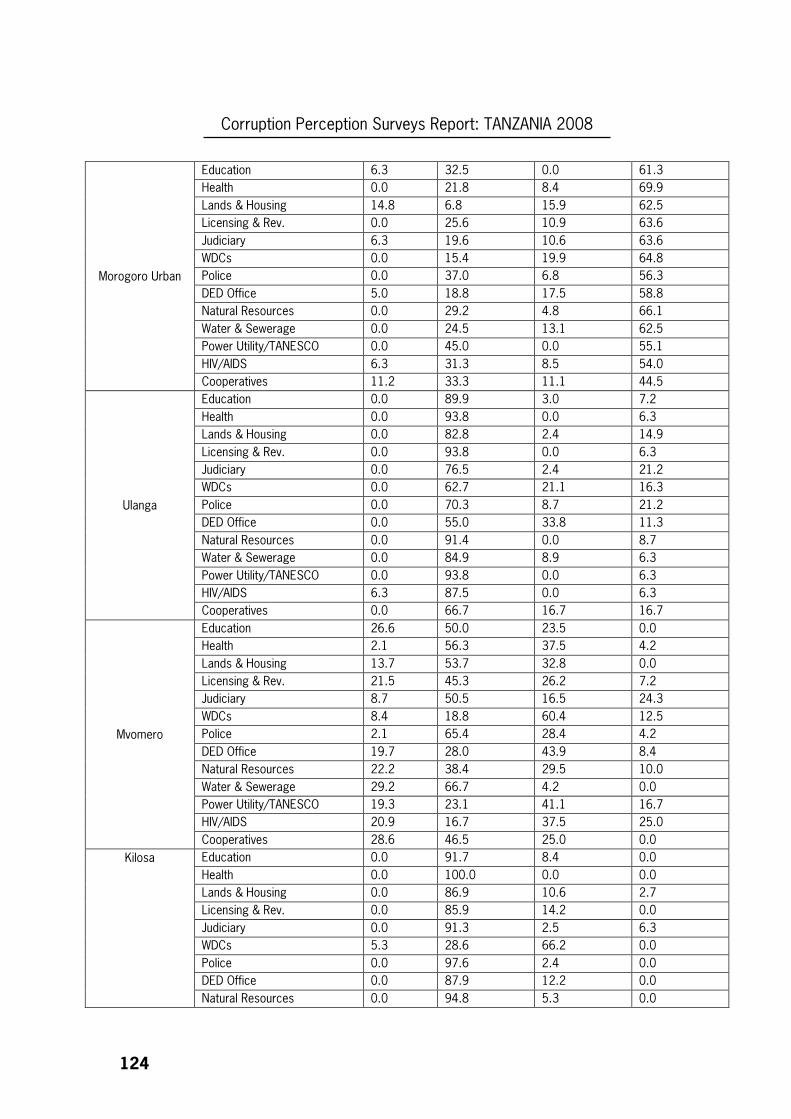
Corruption Perception Surveys Report: TANZANIA 2008
124
Education 6.3 32.5 0.0 61.3
Health 0.0 21.8 8.4 69.9
Lands & Housing 14.8 6.8 15.9 62.5
Licensing & Rev. 0.0 25.6 10.9 63.6
Judiciary 6.3 19.6 10.6 63.6
WDCs 0.0 15.4 19.9 64.8
Police 0.0 37.0 6.8 56.3
DED Office 5.0 18.8 17.5 58.8
Natural Resources 0.0 29.2 4.8 66.1
Water & Sewerage 0.0 24.5 13.1 62.5
Power Utility/TANESCO 0.0 45.0 0.0 55.1
HIV/AIDS 6.3 31.3 8.5 54.0
Morogoro Urban
Cooperatives 11.2 33.3 11.1 44.5
Education 0.0 89.9 3.0 7.2
Health 0.0 93.8 0.0 6.3
Lands & Housing 0.0 82.8 2.4 14.9
Licensing & Rev. 0.0 93.8 0.0 6.3
Judiciary 0.0 76.5 2.4 21.2
WDCs 0.0 62.7 21.1 16.3
Police 0.0 70.3 8.7 21.2
DED Office 0.0 55.0 33.8 11.3
Natural Resources 0.0 91.4 0.0 8.7
Water & Sewerage 0.0 84.9 8.9 6.3
Power Utility/TANESCO 0.0 93.8 0.0 6.3
HIV/AIDS 6.3 87.5 0.0 6.3
Ulanga
Cooperatives 0.0 66.7 16.7 16.7
Education 26.6 50.0 23.5 0.0
Health 2.1 56.3 37.5 4.2
Lands & Housing 13.7 53.7 32.8 0.0
Licensing & Rev. 21.5 45.3 26.2 7.2
Judiciary 8.7 50.5 16.5 24.3
WDCs 8.4 18.8 60.4 12.5
Police 2.1 65.4 28.4 4.2
DED Office 19.7 28.0 43.9 8.4
Natural Resources 22.2 38.4 29.5 10.0
Water & Sewerage 29.2 66.7 4.2 0.0
Power Utility/TANESCO 19.3 23.1 41.1 16.7
HIV/AIDS 20.9 16.7 37.5 25.0
Mvomero
Cooperatives 28.6 46.5 25.0 0.0
Education 0.0 91.7 8.4 0.0
Health 0.0 100.0 0.0 0.0
Lands & Housing 0.0 86.9 10.6 2.7
Licensing & Rev. 0.0 85.9 14.2 0.0
Judiciary 0.0 91.3 2.5 6.3
WDCs 5.3 28.6 66.2 0.0
Police 0.0 97.6 2.4 0.0
DED Office 0.0 87.9 12.2 0.0
Kilosa
Natural Resources 0.0 94.8 5.3 0.0
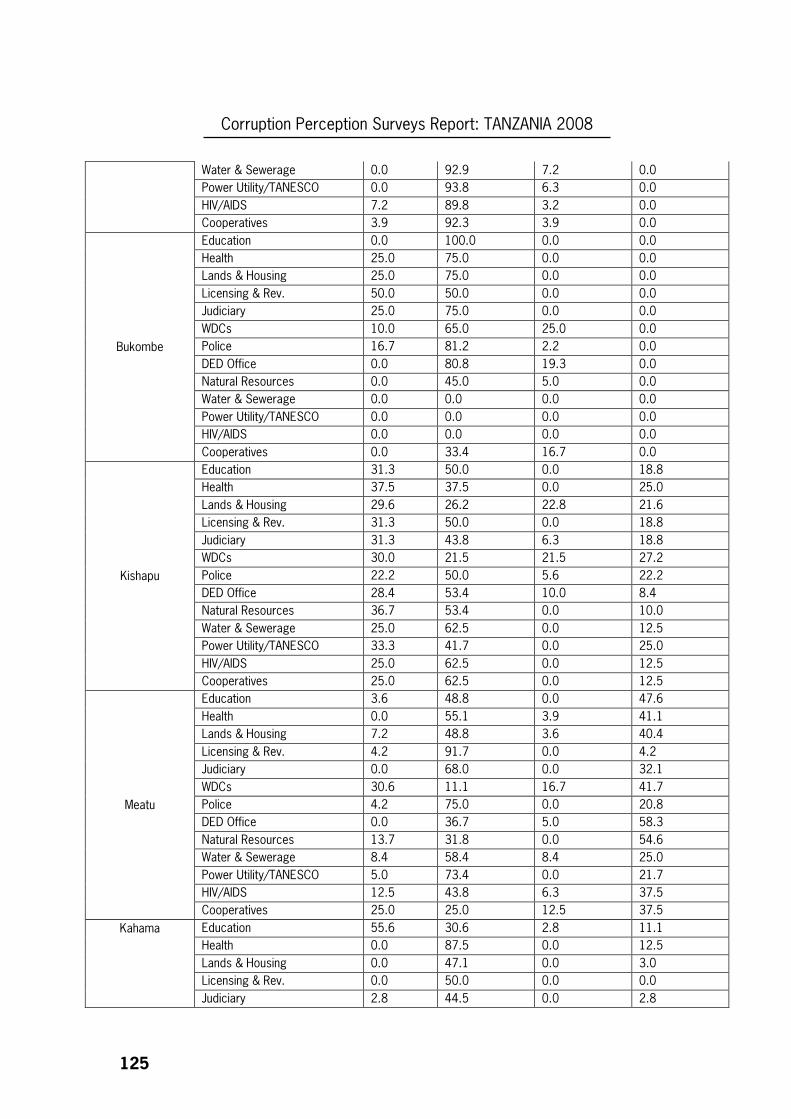
Corruption Perception Surveys Report: TANZANIA 2008
125
Water & Sewerage 0.0 92.9 7.2 0.0
Power Utility/TANESCO 0.0 93.8 6.3 0.0
HIV/AIDS 7.2 89.8 3.2 0.0
Cooperatives 3.9 92.3 3.9 0.0
Education 0.0 100.0 0.0 0.0
Health 25.0 75.0 0.0 0.0
Lands & Housing 25.0 75.0 0.0 0.0
Licensing & Rev. 50.0 50.0 0.0 0.0
Judiciary 25.0 75.0 0.0 0.0
WDCs 10.0 65.0 25.0 0.0
Police 16.7 81.2 2.2 0.0
DED Office 0.0 80.8 19.3 0.0
Natural Resources 0.0 45.0 5.0 0.0
Water & Sewerage 0.0 0.0 0.0 0.0
Power Utility/TANESCO 0.0 0.0 0.0 0.0
HIV/AIDS 0.0 0.0 0.0 0.0
Bukombe
Cooperatives 0.0 33.4 16.7 0.0
Education 31.3 50.0 0.0 18.8
Health 37.5 37.5 0.0 25.0
Lands & Housing 29.6 26.2 22.8 21.6
Licensing & Rev. 31.3 50.0 0.0 18.8
Judiciary 31.3 43.8 6.3 18.8
WDCs 30.0 21.5 21.5 27.2
Police 22.2 50.0 5.6 22.2
DED Office 28.4 53.4 10.0 8.4
Natural Resources 36.7 53.4 0.0 10.0
Water & Sewerage 25.0 62.5 0.0 12.5
Power Utility/TANESCO 33.3 41.7 0.0 25.0
HIV/AIDS 25.0 62.5 0.0 12.5
Kishapu
Cooperatives 25.0 62.5 0.0 12.5
Education 3.6 48.8 0.0 47.6
Health 0.0 55.1 3.9 41.1
Lands & Housing 7.2 48.8 3.6 40.4
Licensing & Rev. 4.2 91.7 0.0 4.2
Judiciary 0.0 68.0 0.0 32.1
WDCs 30.6 11.1 16.7 41.7
Police 4.2 75.0 0.0 20.8
DED Office 0.0 36.7 5.0 58.3
Natural Resources 13.7 31.8 0.0 54.6
Water & Sewerage 8.4 58.4 8.4 25.0
Power Utility/TANESCO 5.0 73.4 0.0 21.7
HIV/AIDS 12.5 43.8 6.3 37.5
Meatu
Cooperatives 25.0 25.0 12.5 37.5
Education 55.6 30.6 2.8 11.1
Health 0.0 87.5 0.0 12.5
Lands & Housing 0.0 47.1 0.0 3.0
Licensing & Rev. 0.0 50.0 0.0 0.0
Kahama
Judiciary 2.8 44.5 0.0 2.8
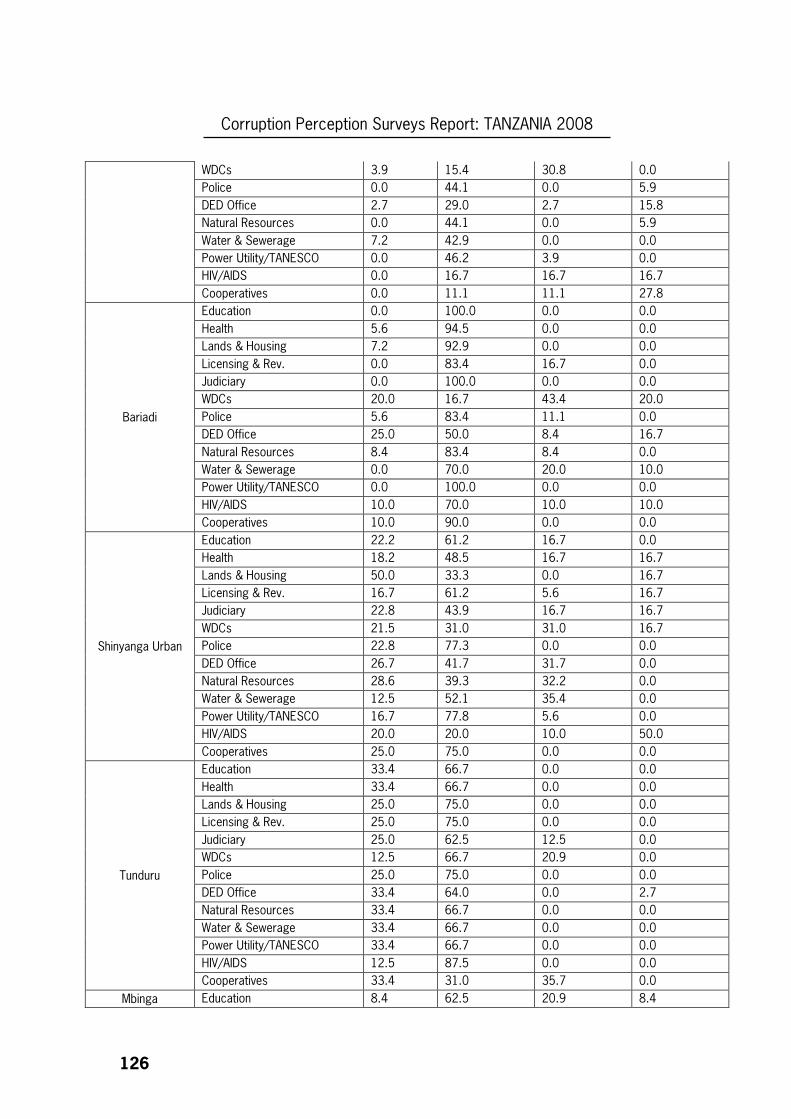
Corruption Perception Surveys Report: TANZANIA 2008
126
WDCs 3.9 15.4 30.8 0.0
Police 0.0 44.1 0.0 5.9
DED Office 2.7 29.0 2.7 15.8
Natural Resources 0.0 44.1 0.0 5.9
Water & Sewerage 7.2 42.9 0.0 0.0
Power Utility/TANESCO 0.0 46.2 3.9 0.0
HIV/AIDS 0.0 16.7 16.7 16.7
Cooperatives 0.0 11.1 11.1 27.8
Education 0.0 100.0 0.0 0.0
Health 5.6 94.5 0.0 0.0
Lands & Housing 7.2 92.9 0.0 0.0
Licensing & Rev. 0.0 83.4 16.7 0.0
Judiciary 0.0 100.0 0.0 0.0
WDCs 20.0 16.7 43.4 20.0
Police 5.6 83.4 11.1 0.0
DED Office 25.0 50.0 8.4 16.7
Natural Resources 8.4 83.4 8.4 0.0
Water & Sewerage 0.0 70.0 20.0 10.0
Power Utility/TANESCO 0.0 100.0 0.0 0.0
HIV/AIDS 10.0 70.0 10.0 10.0
Bariadi
Cooperatives 10.0 90.0 0.0 0.0
Education 22.2 61.2 16.7 0.0
Health 18.2 48.5 16.7 16.7
Lands & Housing 50.0 33.3 0.0 16.7
Licensing & Rev. 16.7 61.2 5.6 16.7
Judiciary 22.8 43.9 16.7 16.7
WDCs 21.5 31.0 31.0 16.7
Police 22.8 77.3 0.0 0.0
DED Office 26.7 41.7 31.7 0.0
Natural Resources 28.6 39.3 32.2 0.0
Water & Sewerage 12.5 52.1 35.4 0.0
Power Utility/TANESCO 16.7 77.8 5.6 0.0
HIV/AIDS 20.0 20.0 10.0 50.0
Shinyanga Urban
Cooperatives 25.0 75.0 0.0 0.0
Education 33.4 66.7 0.0 0.0
Health 33.4 66.7 0.0 0.0
Lands & Housing 25.0 75.0 0.0 0.0
Licensing & Rev. 25.0 75.0 0.0 0.0
Judiciary 25.0 62.5 12.5 0.0
WDCs 12.5 66.7 20.9 0.0
Police 25.0 75.0 0.0 0.0
DED Office 33.4 64.0 0.0 2.7
Natural Resources 33.4 66.7 0.0 0.0
Water & Sewerage 33.4 66.7 0.0 0.0
Power Utility/TANESCO 33.4 66.7 0.0 0.0
HIV/AIDS 12.5 87.5 0.0 0.0
Tunduru
Cooperatives 33.4 31.0 35.7 0.0
Mbinga Education 8.4 62.5 20.9 8.4
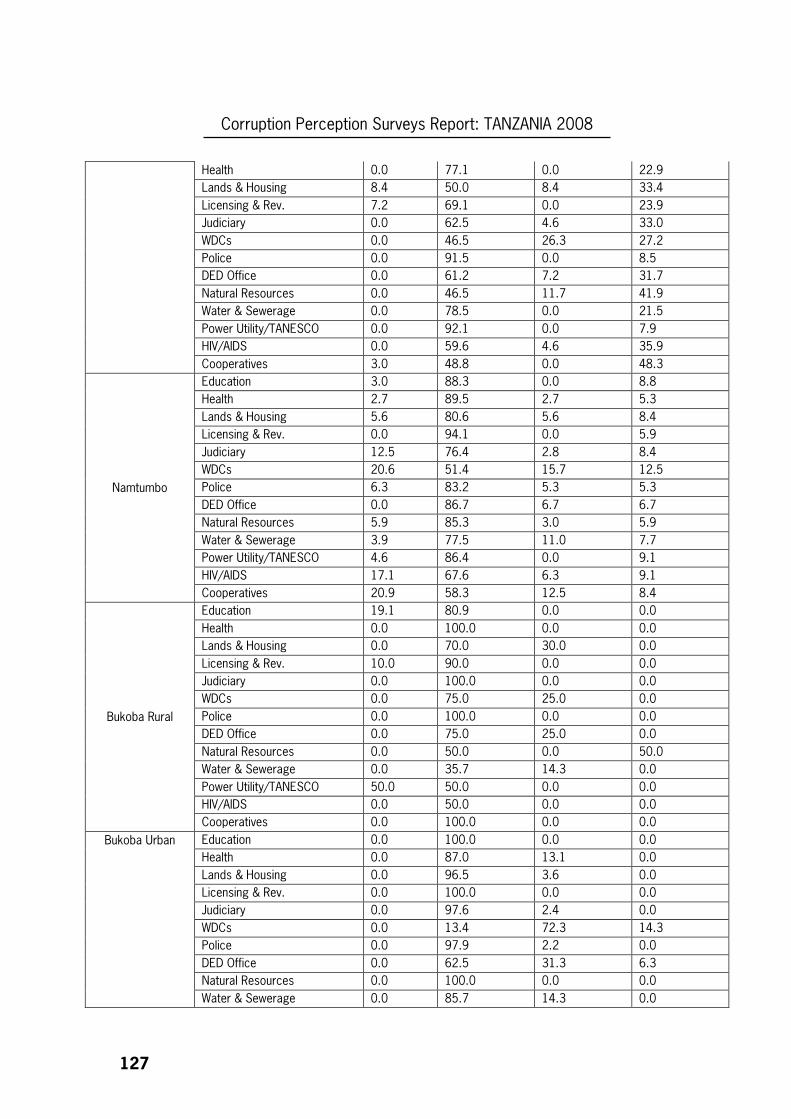
Corruption Perception Surveys Report: TANZANIA 2008
127
Health 0.0 77.1 0.0 22.9
Lands & Housing 8.4 50.0 8.4 33.4
Licensing & Rev. 7.2 69.1 0.0 23.9
Judiciary 0.0 62.5 4.6 33.0
WDCs 0.0 46.5 26.3 27.2
Police 0.0 91.5 0.0 8.5
DED Office 0.0 61.2 7.2 31.7
Natural Resources 0.0 46.5 11.7 41.9
Water & Sewerage 0.0 78.5 0.0 21.5
Power Utility/TANESCO 0.0 92.1 0.0 7.9
HIV/AIDS 0.0 59.6 4.6 35.9
Cooperatives 3.0 48.8 0.0 48.3
Education 3.0 88.3 0.0 8.8
Health 2.7 89.5 2.7 5.3
Lands & Housing 5.6 80.6 5.6 8.4
Licensing & Rev. 0.0 94.1 0.0 5.9
Judiciary 12.5 76.4 2.8 8.4
WDCs 20.6 51.4 15.7 12.5
Police 6.3 83.2 5.3 5.3
DED Office 0.0 86.7 6.7 6.7
Natural Resources 5.9 85.3 3.0 5.9
Water & Sewerage 3.9 77.5 11.0 7.7
Power Utility/TANESCO 4.6 86.4 0.0 9.1
HIV/AIDS 17.1 67.6 6.3 9.1
Namtumbo
Cooperatives 20.9 58.3 12.5 8.4
Education 19.1 80.9 0.0 0.0
Health 0.0 100.0 0.0 0.0
Lands & Housing 0.0 70.0 30.0 0.0
Licensing & Rev. 10.0 90.0 0.0 0.0
Judiciary 0.0 100.0 0.0 0.0
WDCs 0.0 75.0 25.0 0.0
Police 0.0 100.0 0.0 0.0
DED Office 0.0 75.0 25.0 0.0
Natural Resources 0.0 50.0 0.0 50.0
Water & Sewerage 0.0 35.7 14.3 0.0
Power Utility/TANESCO 50.0 50.0 0.0 0.0
HIV/AIDS 0.0 50.0 0.0 0.0
Bukoba Rural
Cooperatives 0.0 100.0 0.0 0.0
Education 0.0 100.0 0.0 0.0
Health 0.0 87.0 13.1 0.0
Lands & Housing 0.0 96.5 3.6 0.0
Licensing & Rev. 0.0 100.0 0.0 0.0
Judiciary 0.0 97.6 2.4 0.0
WDCs 0.0 13.4 72.3 14.3
Police 0.0 97.9 2.2 0.0
DED Office 0.0 62.5 31.3 6.3
Natural Resources 0.0 100.0 0.0 0.0
Bukoba Urban
Water & Sewerage 0.0 85.7 14.3 0.0
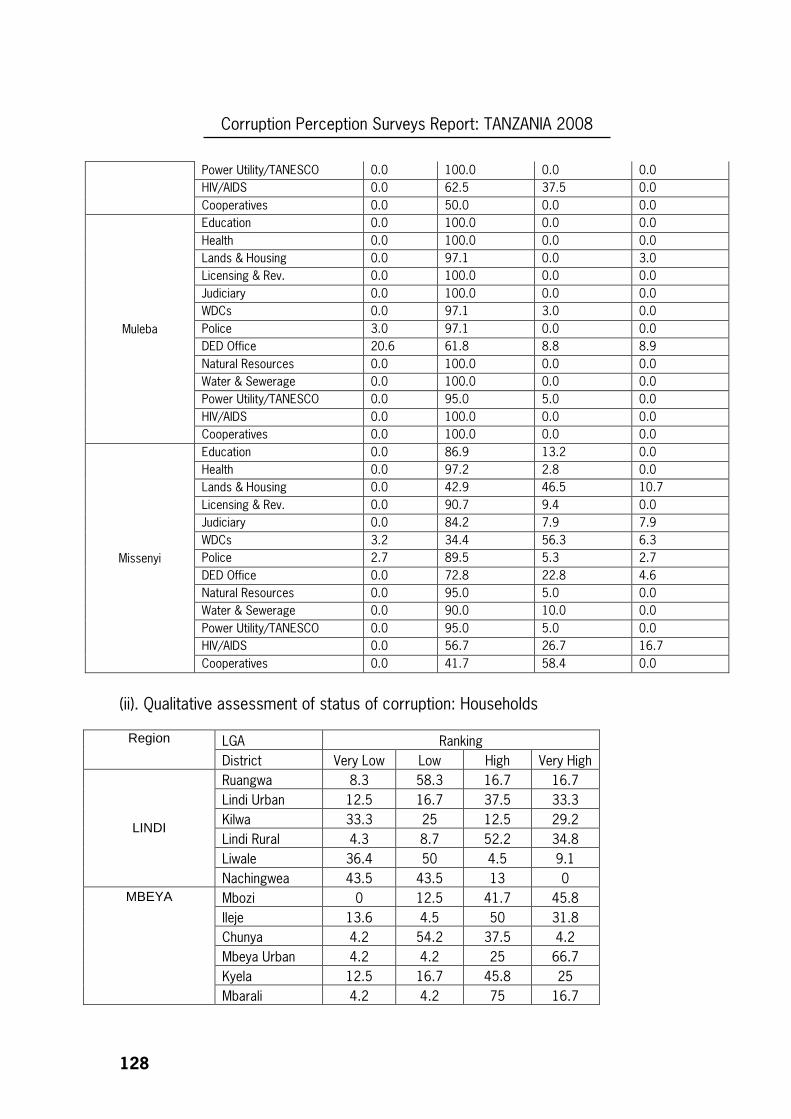
Corruption Perception Surveys Report: TANZANIA 2008
128
Power Utility/TANESCO 0.0 100.0 0.0 0.0
HIV/AIDS 0.0 62.5 37.5 0.0
Cooperatives 0.0 50.0 0.0 0.0
Education 0.0 100.0 0.0 0.0
Health 0.0 100.0 0.0 0.0
Lands & Housing 0.0 97.1 0.0 3.0
Licensing & Rev. 0.0 100.0 0.0 0.0
Judiciary 0.0 100.0 0.0 0.0
WDCs 0.0 97.1 3.0 0.0
Police 3.0 97.1 0.0 0.0
DED Office 20.6 61.8 8.8 8.9
Natural Resources 0.0 100.0 0.0 0.0
Water & Sewerage 0.0 100.0 0.0 0.0
Power Utility/TANESCO 0.0 95.0 5.0 0.0
HIV/AIDS 0.0 100.0 0.0 0.0
Muleba
Cooperatives 0.0 100.0 0.0 0.0
Education 0.0 86.9 13.2 0.0
Health 0.0 97.2 2.8 0.0
Lands & Housing 0.0 42.9 46.5 10.7
Licensing & Rev. 0.0 90.7 9.4 0.0
Judiciary 0.0 84.2 7.9 7.9
WDCs 3.2 34.4 56.3 6.3
Police 2.7 89.5 5.3 2.7
DED Office 0.0 72.8 22.8 4.6
Natural Resources 0.0 95.0 5.0 0.0
Water & Sewerage 0.0 90.0 10.0 0.0
Power Utility/TANESCO 0.0 95.0 5.0 0.0
HIV/AIDS 0.0 56.7 26.7 16.7
Missenyi
Cooperatives 0.0 41.7 58.4 0.0
(ii). Qualitative assessment of status of corruption: Households
LGA Ranking Region
District Very Low Low High Very High
Ruangwa 8.3 58.3 16.7 16.7
Lindi Urban 12.5 16.7 37.5 33.3
Kilwa 33.3 25 12.5 29.2
Lindi Rural 4.3 8.7 52.2 34.8
Liwale 36.4 50 4.5 9.1
LINDI
Nachingwea 43.5 43.5 13 0
Mbozi 0 12.5 41.7 45.8
Ileje 13.6 4.5 50 31.8
Chunya 4.2 54.2 37.5 4.2
Mbeya Urban 4.2 4.2 25 66.7
Kyela 12.5 16.7 45.8 25
MBEYA
Mbarali 4.2 4.2 75 16.7
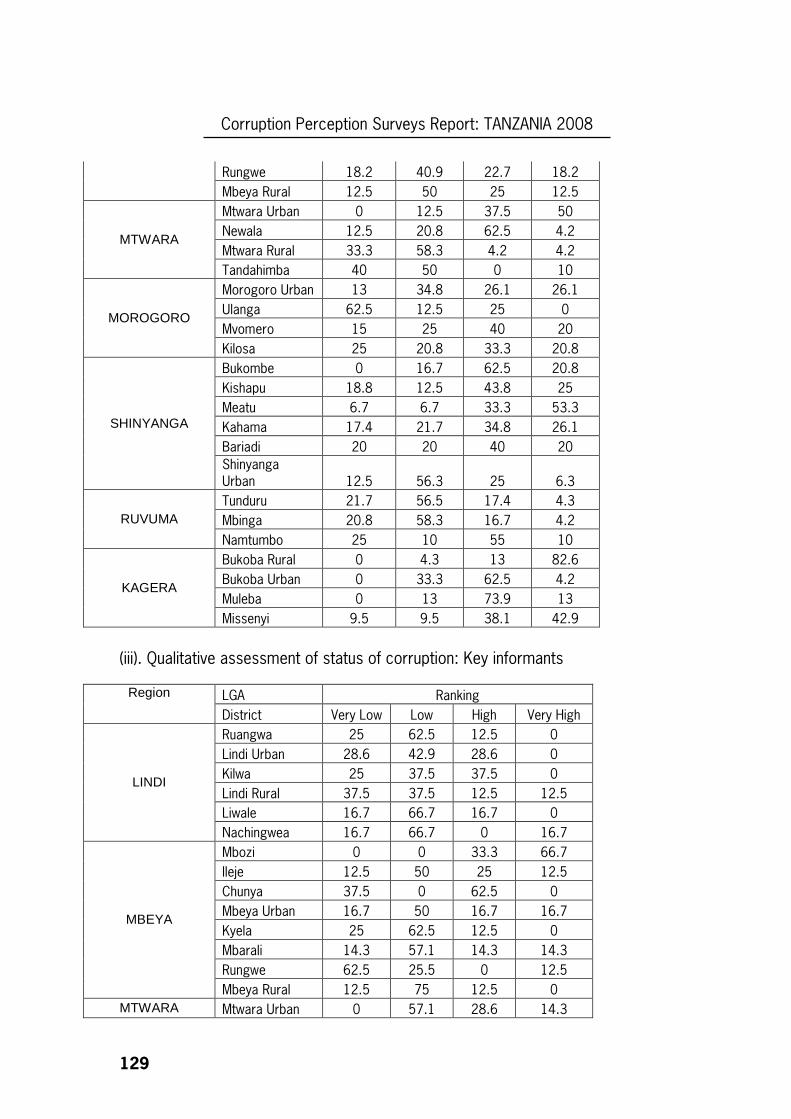
Corruption Perception Surveys Report: TANZANIA 2008
129
Rungwe 18.2 40.9 22.7 18.2
Mbeya Rural 12.5 50 25 12.5
Mtwara Urban 0 12.5 37.5 50
Newala 12.5 20.8 62.5 4.2
Mtwara Rural 33.3 58.3 4.2 4.2 MTWARA
Tandahimba 40 50 0 10
Morogoro Urban 13 34.8 26.1 26.1
Ulanga 62.5 12.5 25 0
Mvomero 15 25 40 20 MOROGORO
Kilosa 25 20.8 33.3 20.8
Bukombe 0 16.7 62.5 20.8
Kishapu 18.8 12.5 43.8 25
Meatu 6.7 6.7 33.3 53.3
Kahama 17.4 21.7 34.8 26.1
Bariadi 20 20 40 20
SHINYANGA
Shinyanga Urban 12.5 56.3 25 6.3
Tunduru 21.7 56.5 17.4 4.3
Mbinga 20.8 58.3 16.7 4.2 RUVUMA
Namtumbo 25 10 55 10
Bukoba Rural 0 4.3 13 82.6
Bukoba Urban 0 33.3 62.5 4.2
Muleba 0 13 73.9 13 KAGERA
Missenyi 9.5 9.5 38.1 42.9
(iii). Qualitative assessment of status of corruption: Key informants
LGA Ranking Region
District Very Low Low High Very High
Ruangwa 25 62.5 12.5 0
Lindi Urban 28.6 42.9 28.6 0
Kilwa 25 37.5 37.5 0
Lindi Rural 37.5 37.5 12.5 12.5
Liwale 16.7 66.7 16.7 0
LINDI
Nachingwea 16.7 66.7 0 16.7
Mbozi 0 0 33.3 66.7
Ileje 12.5 50 25 12.5
Chunya 37.5 0 62.5 0
Mbeya Urban 16.7 50 16.7 16.7
Kyela 25 62.5 12.5 0
Mbarali 14.3 57.1 14.3 14.3
Rungwe 62.5 25.5 0 12.5
MBEYA
Mbeya Rural 12.5 75 12.5 0
MTWARA Mtwara Urban 0 57.1 28.6 14.3
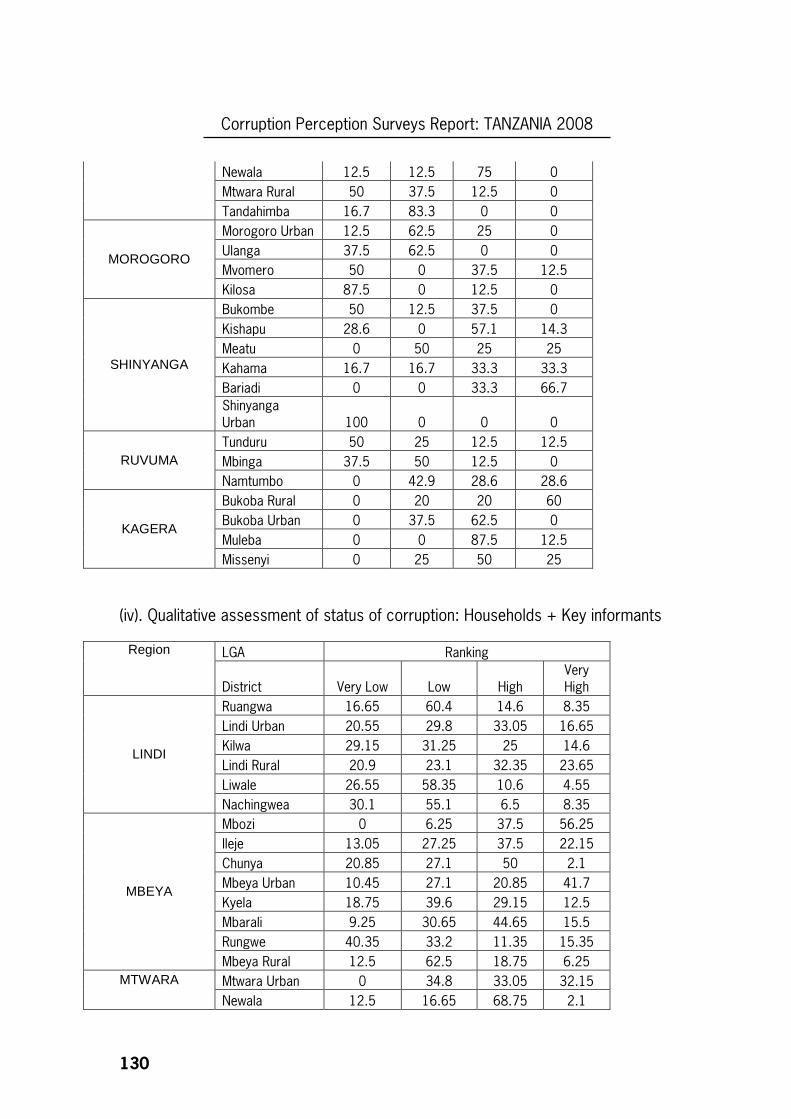
Corruption Perception Surveys Report: TANZANIA 2008
130
Newala 12.5 12.5 75 0
Mtwara Rural 50 37.5 12.5 0
Tandahimba 16.7 83.3 0 0
Morogoro Urban 12.5 62.5 25 0
Ulanga 37.5 62.5 0 0
Mvomero 50 0 37.5 12.5 MOROGORO
Kilosa 87.5 0 12.5 0
Bukombe 50 12.5 37.5 0
Kishapu 28.6 0 57.1 14.3
Meatu 0 50 25 25
Kahama 16.7 16.7 33.3 33.3
Bariadi 0 0 33.3 66.7
SHINYANGA
Shinyanga Urban 100 0 0 0
Tunduru 50 25 12.5 12.5
Mbinga 37.5 50 12.5 0 RUVUMA
Namtumbo 0 42.9 28.6 28.6
Bukoba Rural 0 20 20 60
Bukoba Urban 0 37.5 62.5 0
Muleba 0 0 87.5 12.5 KAGERA
Missenyi 0 25 50 25
(iv). Qualitative assessment of status of corruption: Households + Key informants
LGA Ranking Region
District Very Low Low High Very High
Ruangwa 16.65 60.4 14.6 8.35
Lindi Urban 20.55 29.8 33.05 16.65
Kilwa 29.15 31.25 25 14.6
Lindi Rural 20.9 23.1 32.35 23.65
Liwale 26.55 58.35 10.6 4.55
LINDI
Nachingwea 30.1 55.1 6.5 8.35
Mbozi 0 6.25 37.5 56.25
Ileje 13.05 27.25 37.5 22.15
Chunya 20.85 27.1 50 2.1
Mbeya Urban 10.45 27.1 20.85 41.7
Kyela 18.75 39.6 29.15 12.5
Mbarali 9.25 30.65 44.65 15.5
Rungwe 40.35 33.2 11.35 15.35
MBEYA
Mbeya Rural 12.5 62.5 18.75 6.25
Mtwara Urban 0 34.8 33.05 32.15 MTWARA
Newala 12.5 16.65 68.75 2.1
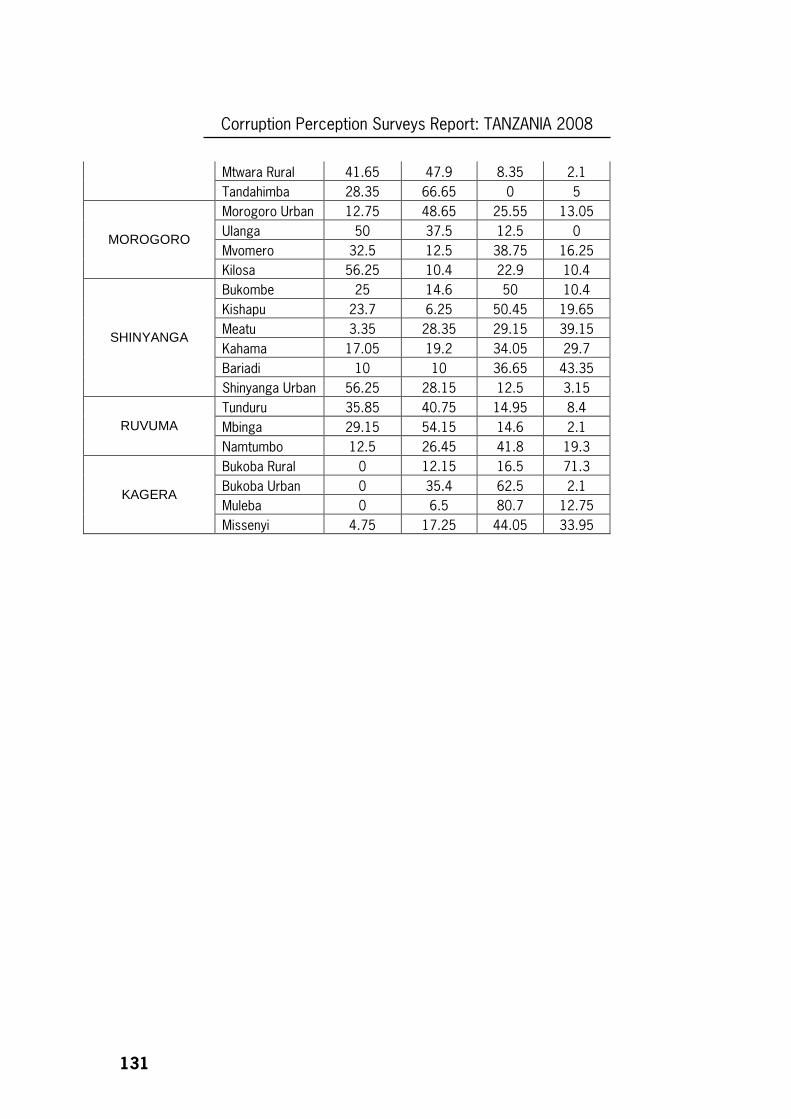
Corruption Perception Surveys Report: TANZANIA 2008
131
Mtwara Rural 41.65 47.9 8.35 2.1
Tandahimba 28.35 66.65 0 5
Morogoro Urban 12.75 48.65 25.55 13.05
Ulanga 50 37.5 12.5 0
Mvomero 32.5 12.5 38.75 16.25 MOROGORO
Kilosa 56.25 10.4 22.9 10.4
Bukombe 25 14.6 50 10.4
Kishapu 23.7 6.25 50.45 19.65
Meatu 3.35 28.35 29.15 39.15
Kahama 17.05 19.2 34.05 29.7
Bariadi 10 10 36.65 43.35
SHINYANGA
Shinyanga Urban 56.25 28.15 12.5 3.15
Tunduru 35.85 40.75 14.95 8.4
Mbinga 29.15 54.15 14.6 2.1 RUVUMA
Namtumbo 12.5 26.45 41.8 19.3
Bukoba Rural 0 12.15 16.5 71.3
Bukoba Urban 0 35.4 62.5 2.1
Muleba 0 6.5 80.7 12.75 KAGERA
Missenyi 4.75 17.25 44.05 33.95
Corruption Perception Surveys Report: TANZANIA 2008
132
ANNEX II: CONTACTS OF CPS PARTNER/HOST ORGANISATIONS
1. Organization: Mtwara Region NGOs network (MRENGO) Name: Mr. Allan Peter Mkopoka Field Title: CPS Project host organization Region: Mtwara P.O.Box: 395 Region: Mtwara, Tanzania E-mail: [email protected] Tel.: +255 232 334 298 or +255 784 355 201
2. Organization: Lindi NGO Network (LINGONET) Name: Mr. Sharif. Maloya Field Title: CPS Project host organization Region: Lindi P.O. Box: 92 Lindi E-mail: [email protected] or [email protected] Tel.: +255 232 202 630 or +255 787 187 008
3. Organization: Tanzania Teachers Union (TTU) Name: Mr. Joseph Yangole Field Title: CPS Project host organization contact Region: Shinyanga P.O. Box: 189 Shinyanga Tel.: +255 282 763 260 or +255 756 032 919
4. Organization: Union of NGOs in Morogoro (UNGO) Name: Mr.Venance A. Mlali Field Title: CPS Project host organization Region: Morogoro P.O.Box: 6075 Morogoro E-mail: [email protected] Tel.: +255 232 600 362 or +255 754 310 762
5. Organization: Malezi Alive Pioneers (MAP) / ForDIA Coordinator Name: Mr. Ulimboka Mwakilili Field Title: CPS Project host organization Region: Mbeya Postal Box: 2034 Mbeya E-mail: [email protected] Tel.: +255 713 521 533 or +255 713 521 533
6. Organization: Nindai Poverty Alleviation Association (NIPAA)
Corruption Perception Surveys Report: TANZANIA 2008
133
Name: Mr. Michael Wilson Sadiki Field Title: CPS Project host organization Region: Ruvuma P.O. Box: 150 Ruvuma, Tanzania E-mail: [email protected] Tel.: +255 252 600 222 or +255 713 570 861
7. Organization: Gerlaidina Orphanage& Education Centre Name: Mr. Thaddeus Mashebe Field Title: CPS Project host organization
Region: Kagera E-mail: [email protected] Tel.: +255 787 579957
Corruption Perception Surveys Report: TANZANIA 2008
134
ANNEX III: LIST OF LGAs
1. Bariadi 2. Bukoba Rural 3. Bukoba Urban 4. Bukombe 5. Chunya 6. Ileje 7. Kahama 8. Kilosa 9. Kilwa 10. Kishapu 11. Kwela 12. Lindi Rural 13. Lindi Urban 14. Liwale 15. Mbarali 16. Mbeya Rural 17. Mbeya Urban 18. Mbinga 19. Mbozi 20. Meatu 21. Missenyi 22. Morogoro Urban 23. Mtwara Rural 24. Mtwara Urban 25. Muleba 26. Mvomero 27. Nachingwea 28. Namtumbo 29. Newala 30. Ruangwa 31. Rungwe 32. Shinyanga Urban 33. Tandahimba 34. Tunduru 35. Ulanga
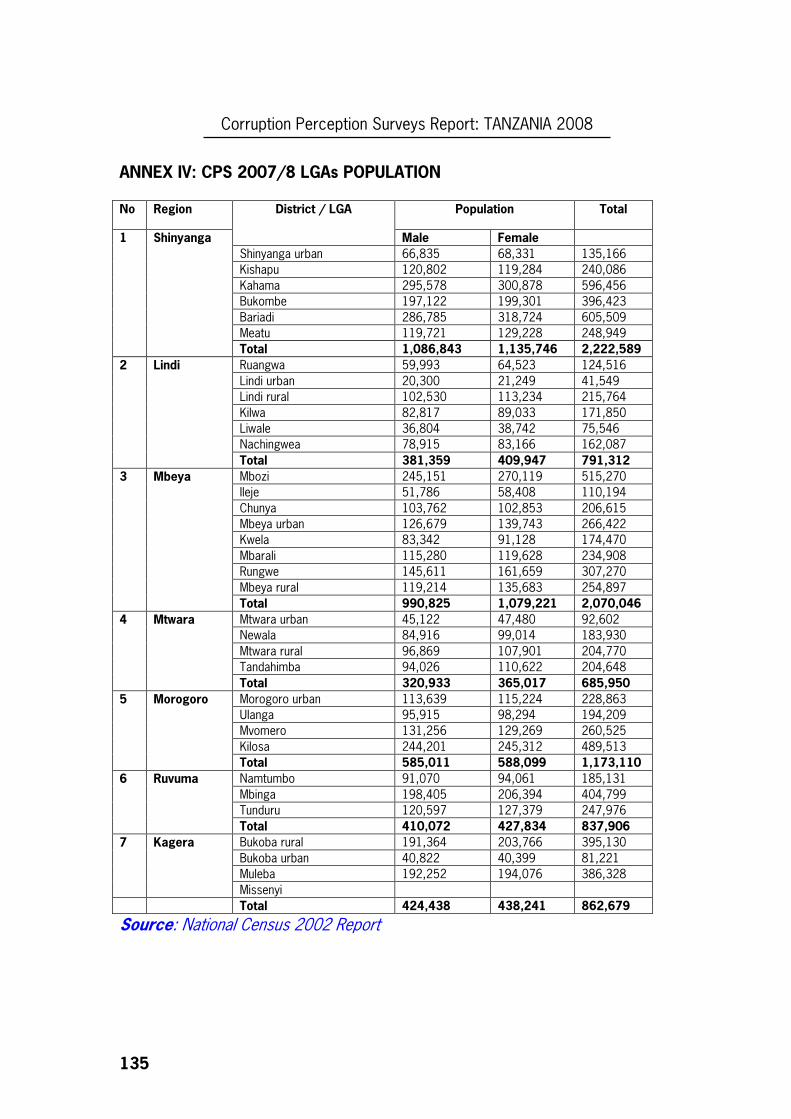
Corruption Perception Surveys Report: TANZANIA 2008
135
ANNEX IV: CPS 2007/8 LGAs POPULATION No Region Population Total District / LGA
Male Female
Shinyanga urban 66,835 68,331 135,166
Kishapu 120,802 119,284 240,086
Kahama 295,578 300,878 596,456 Bukombe 197,122 199,301 396,423 Bariadi 286,785 318,724 605,509 Meatu 119,721 129,228 248,949
1 Shinyanga
Total 1,086,843 1,135,746 2,222,589
Ruangwa 59,993 64,523 124,516 Lindi urban 20,300 21,249 41,549 Lindi rural 102,530 113,234 215,764 Kilwa 82,817 89,033 171,850 Liwale 36,804 38,742 75,546 Nachingwea 78,915 83,166 162,087
2 Lindi
Total 381,359 409,947 791,312
Mbozi 245,151 270,119 515,270 Ileje 51,786 58,408 110,194 Chunya 103,762 102,853 206,615 Mbeya urban 126,679 139,743 266,422 Kwela 83,342 91,128 174,470 Mbarali 115,280 119,628 234,908 Rungwe 145,611 161,659 307,270 Mbeya rural 119,214 135,683 254,897
3 Mbeya
Total 990,825 1,079,221 2,070,046
Mtwara urban 45,122 47,480 92,602 Newala 84,916 99,014 183,930 Mtwara rural 96,869 107,901 204,770 Tandahimba 94,026 110,622 204,648
4 Mtwara
Total 320,933 365,017 685,950
Morogoro urban 113,639 115,224 228,863 Ulanga 95,915 98,294 194,209 Mvomero 131,256 129,269 260,525 Kilosa 244,201 245,312 489,513
5 Morogoro
Total 585,011 588,099 1,173,110
Namtumbo 91,070 94,061 185,131 Mbinga 198,405 206,394 404,799 Tunduru 120,597 127,379 247,976
6 Ruvuma
Total 410,072 427,834 837,906
Bukoba rural 191,364 203,766 395,130 Bukoba urban 40,822 40,399 81,221 Muleba 192,252 194,076 386,328
7 Kagera
Missenyi Total 424,438 438,241 862,679
Source: National Census 2002 Report


![THE 13th INTERNATIONAL ANTI – CORRUPTION CONFERENCE [IACC]: Athens, Greece. THE EMPIRICAL TOOLS FOR GOVERNANCE AND CORRUPTION ANALYSIS: The case for Tanzania](https://img.pdfslide.net/doc/110x75/56649e025503460f94aed1f4/the-13th-international-anti-corruption-conference-iacc-athens-greece.jpg)