Embed Size (px)
Citation preview
FORECASTING MALAYSIAN AUTOMOTIVE INDUSTRY:
THE CASE OF PROTON
Presented by:Mohamad Rizal Abdul Hamid
RA8967130Iman Harymawan
RA6967558Hsu-Yuan Sun
RA7974011
Brief Introduction of Proton
Established in May 1983, and entrusted to undertake the “Malaysian National Car” project.Began to produce the first model, SAGA, in 1985.Initially the components of the car were entirely manufactured by Mitsubishi, but slowly technologies were transferred to the local plant.
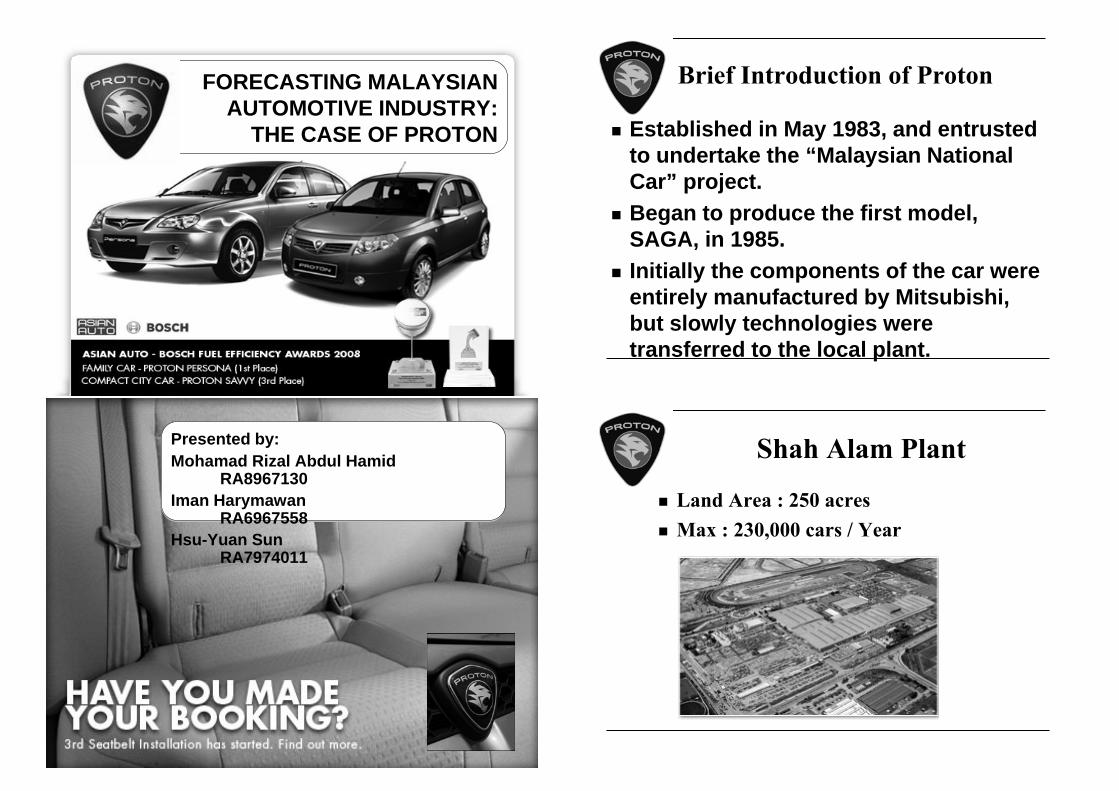
Shah Alam Plant
Land Area : 250 acresMax : 230,000 cars / Year
Tanjung Malim Plant
Land Area : 1,280 acresMax : 1 million cars / Year
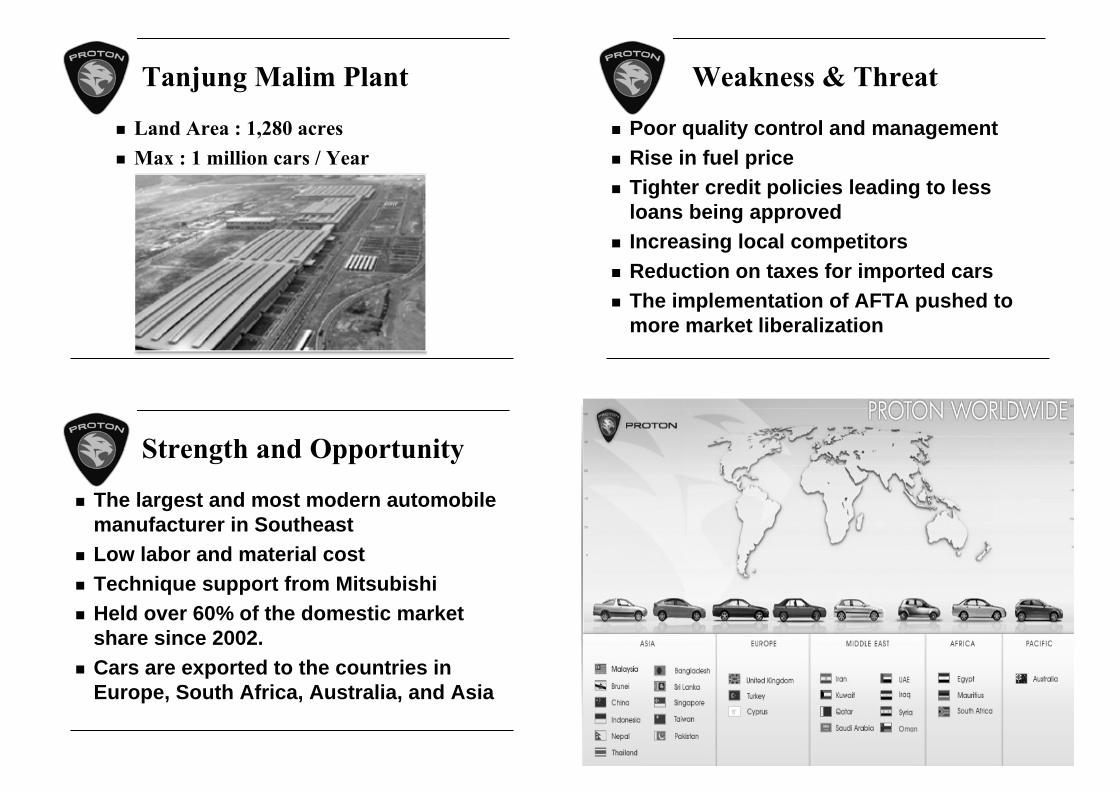
Strength and Opportunity
The largest and most modern automobile manufacturer in Southeast Low labor and material costTechnique support from MitsubishiHeld over 60% of the domestic market share since 2002.Cars are exported to the countries in Europe, South Africa, Australia, and Asia
Weakness & Threat
Poor quality control and managementRise in fuel priceTighter credit policies leading to less loans being approvedIncreasing local competitorsReduction on taxes for imported carsThe implementation of AFTA pushed to more market liberalization
Literature ReviewIn European car market, the income tax, oil price, wage and the standard of livings will affect the willingness of people buying a car.The fuel price will affect the demand of cars in countries.The sharp oil price is one of the external factors having a significant influence on Malaysian inflation in 1973 and 1974
~ Cheng and Tan (2002)
Literature Review
Rising income leads to higher car ownership.~ J.M. Dargay (2001)
The effect of price on fuel consumption and on motorists’ demand and the demand for owning cars is heavily dependent on income.
~Graham & Glaister (2002)
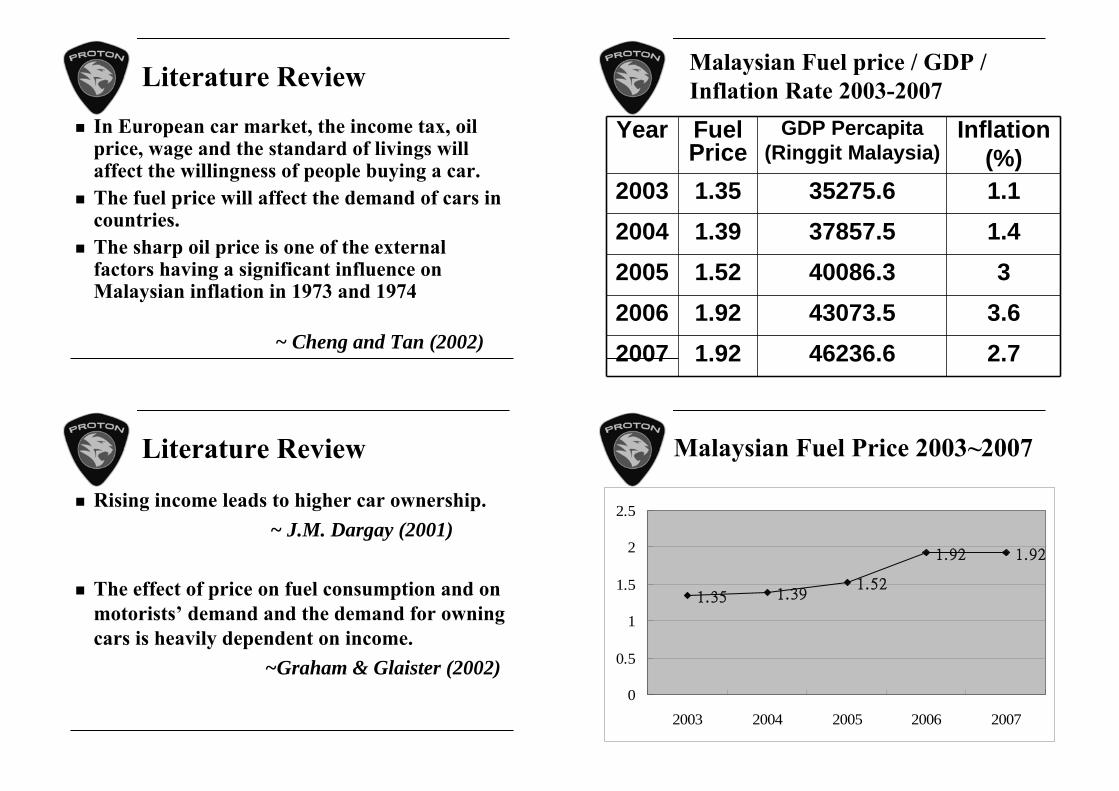
Malaysian Fuel price / GDP / Inflation Rate 2003-2007
Year Fuel Price
GDP Percapita(Ringgit Malaysia)
Inflation(%)
2003 1.35 35275.6 1.12004 1.39 37857.5 1.42005 1.52 40086.3 32006 1.92 43073.5 3.62007 1.92 46236.6 2.7
Malaysian Fuel Price 2003~2007
1.35 1.391.52
1.92 1.92
0
0.5
1
1.5
2
2.5
2003 2004 2005 2006 2007
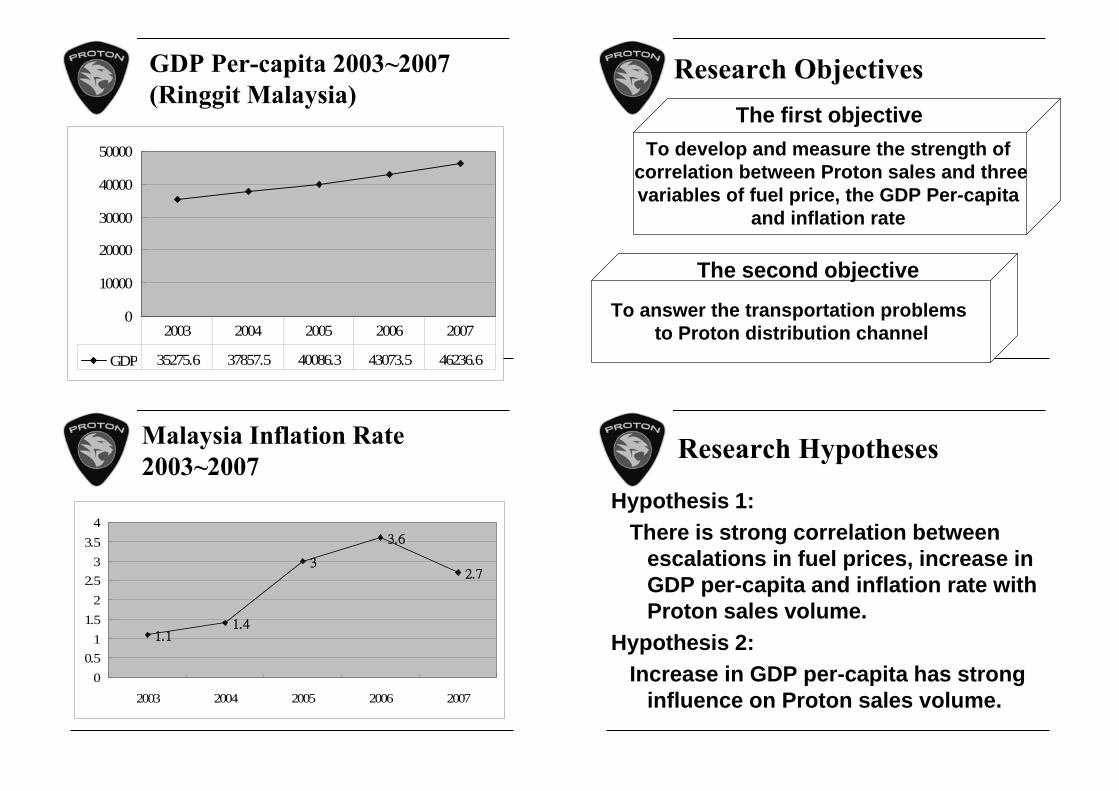
GDP Per-capita 2003~2007 (Ringgit Malaysia)
0
10000
20000
30000
40000
50000
GDP 35275.6 37857.5 40086.3 43073.5 46236.6
2003 2004 2005 2006 2007
Malaysia Inflation Rate 2003~2007
1.11.4
3
3.6
2.7
00.5
11.5
22.5
33.5
4
2003 2004 2005 2006 2007
Research Objectives
To develop and measure the strength of correlation between Proton sales and threevariables of fuel price, the GDP Per-capita
and inflation rate
The first objective
To answer the transportation problems to Proton distribution channel
The second objective
Research Hypotheses
Hypothesis 1: There is strong correlation between
escalations in fuel prices, increase in GDP per-capita and inflation rate with Proton sales volume.
Hypothesis 2: Increase in GDP per-capita has strong
influence on Proton sales volume.
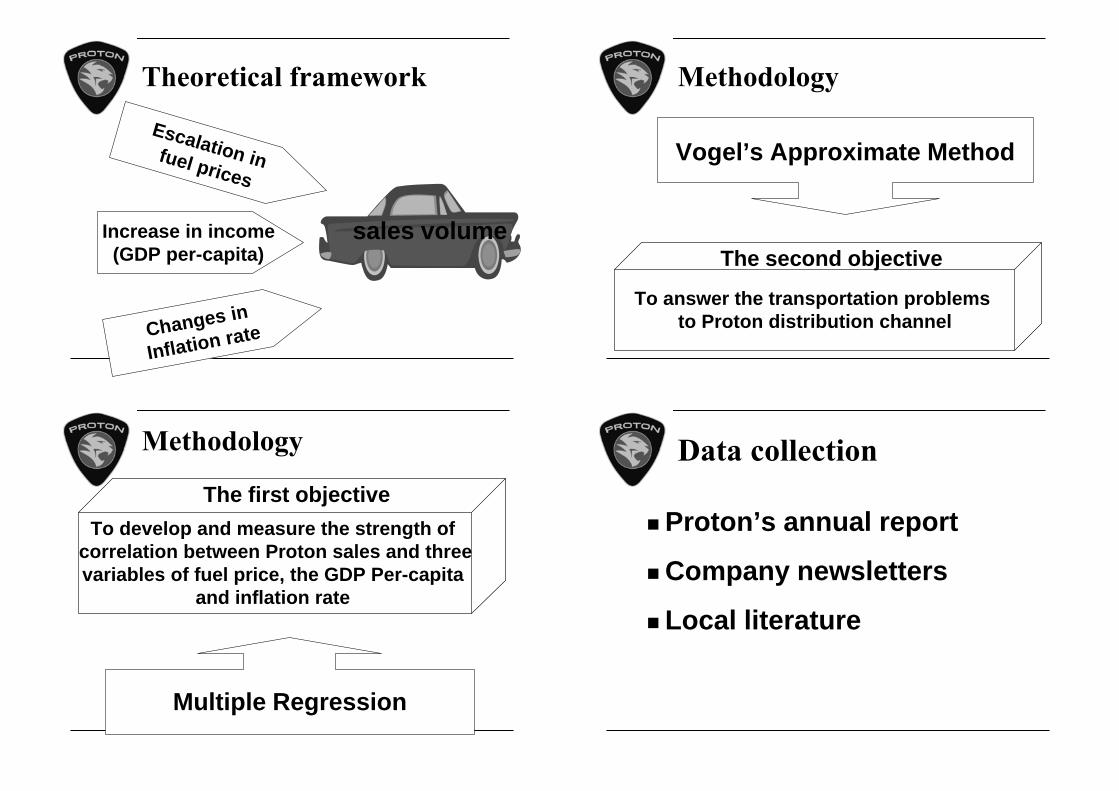
Theoretical framework
Escalation in fuel prices
Increase in income(GDP per-capita)
Changes in
Inflation rate
sales volume
Methodology
To develop and measure the strength of correlation between Proton sales and threevariables of fuel price, the GDP Per-capita
and inflation rate
The first objective
Multiple Regression
Methodology
To answer the transportation problems to Proton distribution channel
The second objective
Vogel’s Approximate Method
Data collection
Proton’s annual report
Company newsletters
Local literature
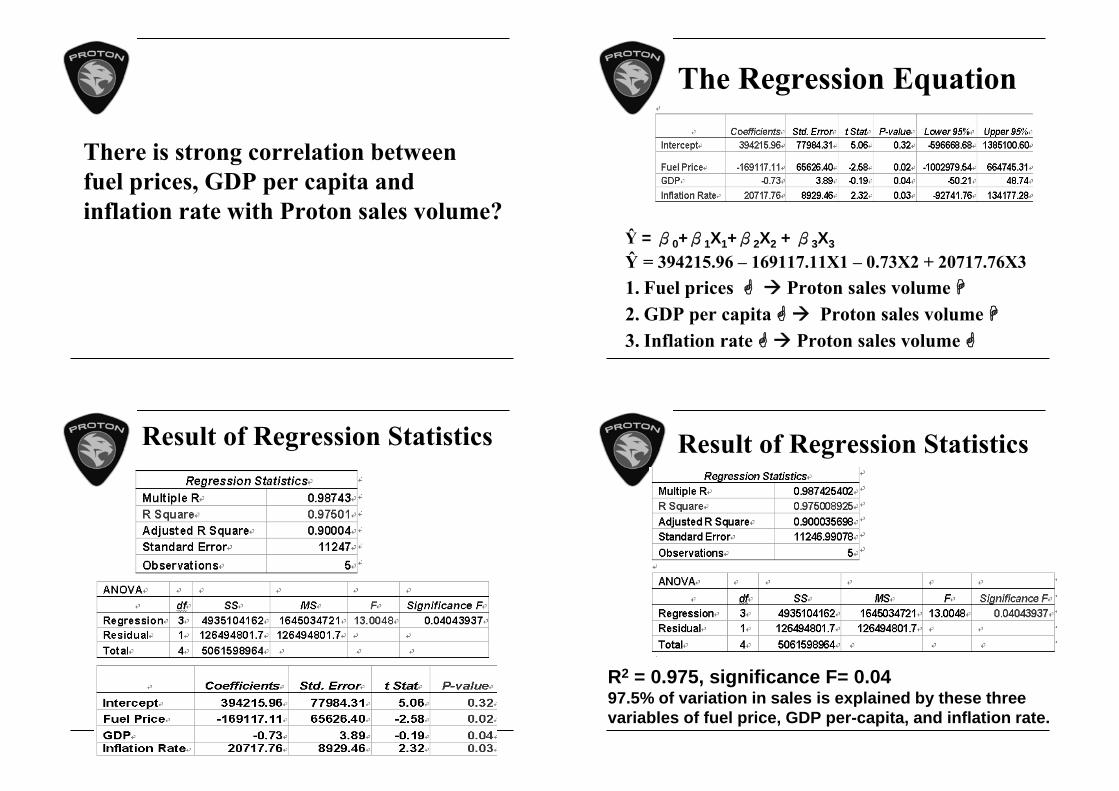
There is strong correlation between fuel prices, GDP per capita and inflation rate with Proton sales volume?
Result of Regression Statistics
The Regression Equation
Ŷ = β0+β1X1+β2X2 + β3X3
Ŷ = 394215.96 – 169117.11X1 – 0.73X2 + 20717.76X31. Fuel prices Proton sales volume 2. GDP per capita Proton sales volume 3. Inflation rate Proton sales volume
Result of Regression Statistics
R2 = 0.975, significance F= 0.0497.5% of variation in sales is explained by these threevariables of fuel price, GDP per-capita, and inflation rate.
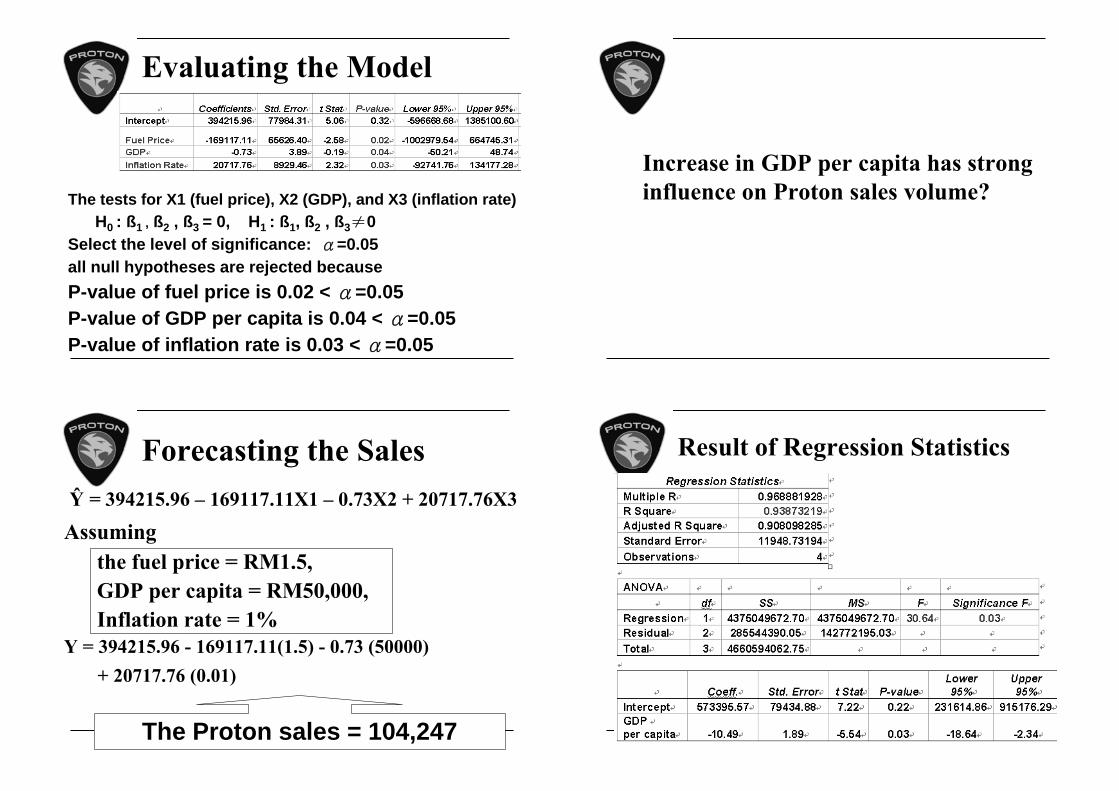
Evaluating the Model
The tests for X1 (fuel price), X2 (GDP), and X3 (inflation rate)H0 : ß1 , ß2 , ß3 = 0, H1 : ß1, ß2 , ß3≠0
Select the level of significance: α=0.05all null hypotheses are rejected becauseP-value of fuel price is 0.02 < α=0.05P-value of GDP per capita is 0.04 < α=0.05P-value of inflation rate is 0.03 < α=0.05
Forecasting the SalesŶ = 394215.96 – 169117.11X1 – 0.73X2 + 20717.76X3
Assumingthe fuel price = RM1.5,GDP per capita = RM50,000,Inflation rate = 1%
Y = 394215.96 - 169117.11(1.5) - 0.73 (50000)+ 20717.76 (0.01)
The Proton sales = 104,247
Increase in GDP per capita has strong influence on Proton sales volume?
Result of Regression Statistics
GDP per-capita & Sales volume
The regression equation :Ŷ = 573395.57 – 10.49X1With an increase of customer GDP per capitawill negatively affected Proton sales.
Testing the model for significance
1. Specify the null & alternative hypotheses:H0 : ß1 =0H1 : ß1 ≠0
2. Select the level of significance: α=0.053. F = 30.644. P(F > 30.64) = 0.03 < α=0.05 reject H0
There is a statistically significant relationship between Proton sales and GDP per capita.
GDP per-capita & Sales volume
r2 = 0.938 represents 93.8% of variability in Proton sales is explained by the regression equation based on GDP per capita.
PRO TO N TRAN SPO RTATIO N CO ST PER
UN IT
ASSUM PTIO N
1. Proton only used three m ain facilities to produce its vehicles— Shah Alam , Tanjung M alim and Cikarang.
2. There were only 10 States of warehouses/destination centre.
3. All the production for Proton units of vehicles are prim arily for the M alaysian m arket, whilst the unsold will be exported overseas.
4. The cost per unit of Proton vehicles will be the sam e, regardless for its m odel of m ake.
5. The others cost such as wages, taxes and prices for the fuel are constant.
CAPACITY
Factory Capacity
No Name Capacity/year Percentage
1 Shah Alam Plant 200000 51.28%
2 Tanjung Malim 150000 38.46%
3 Cikarang 40000 10.26%
390000 100%
SALES PER REGIO N
No Distribution Channel Total Sales Population Population (%) Sales/Region
1 Johor 115500 2,565,701 13.08% 15103
2 Kedah 115500 1,572,107 8.01% 9254
3 Kelantan 115500 1,289,199 6.57% 7589
4 Kuala Lumpur 115500 1,297,526 6.61% 7638
5 Pahang 115500 1,231,176 6.27% 7247
6 Perak 115500 2,030,382 10.35% 11952
7 Pulau Pinang 115500 1,225,501 6.25% 7214
8 Sabah 115500 2,449,389 12.48% 14418
9 Sarawak 115500 2,012,616 10.26% 11847
10 Selangor 115500 3,947,527 20.12% 23237
19,621,124 115500
CO ST PER UN IT
No Distribution Channel
Ware House
Shah Alam Tanjung Malim Cikarang
Distances RM Cost/Car Distances RMCost/Car
Distances RM
1 Johor 356 6234 0.41 437 7653 0.51 929 16269 1.08
2 Kedah 436 7635 0.83 355 6217 0.67 1512 26478 2.86
3 Kelantan 477 8353 1.10 452 7916 1.04 1465 25655 3.38
4 Kuala Lumpur 28.2 494 0.06 84 1471 0.19 1194 20910 2.74
5 Pahang 219 3835 0.53 228 3993 0.55 1238 21680 2.99
6 Perak 233 4080 0.34 152 2662 0.22 1367 23939 2.00
7 Pulau Pinang 345 6042 0.84 264 4623 0.64 1472 25778 3.57
8 Sabah 1707 29893 2.07 1726 30226 2.10 1682 29456 2.04
9 Sarawak 1268 22206 1.87 1280 22416 1.89 1188 20805 1.76
10 Selangor 61.8 1082 0.05 37 648 0.03 1230 21540 0.93
5131 89855 5015 87824 13277 232510
CO ST PER UN IT
Distribution Cost RM 410189Total Distances 23423 KMDistribution cost/Distance
e.g. Johor = 356 KM / 23423 KM x RM 410189= RM 6234 – Total cost for transporting vehicles to Johor
Cost per unit = RM 6234 / 15103 total units demanded/sales in Johor
= RM 0.41
Example – Distance from Proton Manufacturing (Shah Alam to Kuala Lumpur) = 28.2KM
M EASURIN G D ISTAN CE
Degeneracy Problems
The number of occupied route must be equal to 10+3-1=12 squares used, but only 10 squares routes occupied.
Result of Transportation Problems by VAM & Stepping-stone Methods
Iteration 1
Closed path for IShah Alam Pahang= -0.02, for ICikarang Sabah= -0.06Closed path for IShah Alam Sarawak= -0.02, for ICikarang Sarawak= -0.13
Start
Iteration 2
Result of Transportation Problems by VAM & Stepping-stone Methods
Closed path for IShah Alam Pahang= -0.02
Closed path for IShah Alam Sabah= -0.03, for ICikarang Sabah = -0.06
Start
Iteration 3
Result of Transportation Problems by VAM & Stepping-stone Methods
Closed path for IShah Alam Pahang = -0.02
Start
Iteration 4
Result of Transportation Problems by VAM & Stepping-stone Methods
No closed path is with negative value.
Minimum Transportation Cost
Total Cost : RM82,754.36 (NTD774,878.73)Shah Johor: 15013 units*RM0.41 = RM6155.33Shah Kuala: 7639 units*RM0.06 = RM458.34Shah Pahang: 7247units*RM0.53 = RM3841Tanjung Kedah: 9245units*RM0.67 = RM6200.18Tanjung Kelantan: 7589units*RM1.04 = RM7892.56Tanjung Perak: 11952units*RM0.22 = RM2629.44Tanjung Pulau: 7214units*RM0.64 = RM4616.96Tanjung Selangor: 23237units*RM0.03 = RM697.11Cikarang Sabah: 14418units*RM2.04 = RM29412.72Cikarang Sarawak: 11847units*RM1.76 = RM20850.72
Conclusion
There is strong correlation between escalations in fuel prices, increase in GDP per-capita and inflation rate with Proton sales volume.Increase in GDP per-capita has strong but inverse influence on Proton sales volume.Future development of Proton Malaysia
partnership with Detroit to develop electric carsDevelop the most fuel efficient carsCapture a larger market in China
Thank You for Your Attention