Embed Size (px)
Citation preview

HAL Id: hal-01768531https://hal.inria.fr/hal-01768531
Submitted on 17 Apr 2018
HAL is a multi-disciplinary open accessarchive for the deposit and dissemination of sci-entific research documents, whether they are pub-lished or not. The documents may come fromteaching and research institutions in France orabroad, or from public or private research centers.
L’archive ouverte pluridisciplinaire HAL, estdestinée au dépôt et à la diffusion de documentsscientifiques de niveau recherche, publiés ou non,émanant des établissements d’enseignement et derecherche français ou étrangers, des laboratoirespublics ou privés.
Distributed under a Creative Commons Attribution| 4.0 International License
Forecasting the 2016 US Presidential Elections UsingSentiment Analysis
Prabhsimran Singh, Ravinder Sawhney, Karanjeet Kahlon
To cite this version:Prabhsimran Singh, Ravinder Sawhney, Karanjeet Kahlon. Forecasting the 2016 US PresidentialElections Using Sentiment Analysis. 16th Conference on e-Business, e-Services and e-Society (I3E),Nov 2017, Delhi, India. pp.412-423, �10.1007/978-3-319-68557-1_36�. �hal-01768531�

Forecasting the 2016 US Presidential Elections using
Sentiment Analysis
Prabhsimran Singh1, Ravinder Singh Sawhney2, Karanjeet Singh Kahlon3
1,3Department of Computer Science, 2Department of Electronics Technology,
1,2,3Guru Nanak Dev University, Amritsar, India. [email protected], [email protected], [email protected]
Abstract. The aim of this paper is to make a zealous effort towards true
prediction of the 2016 US Presidential Elections. We propose a novel
technique to predict the outcome of US presidential elections using sentiment
analysis. For this data was collected from a famous social networking website
(SNW) Twitter in form of tweets within a period starting from September 1,
2016 to October 31, 2016. To accomplish this mammoth task of prediction, we
build a model in WEKA 3.8 using support vector machine which is a supervised
machine learning algorithm. Our results showed that Donald Trump was likely
to emerge winner of 2016 US Presidential Elections.
Keywords: Forecasting, Twitter, Sentiment Analysis, Support Vector Machine,
WEKA.
1 Introduction
Accurate future prediction of an event has always been a tedious task for researchers,
but with advancement in technologies and availability of powerful computing devices
researchers have started taking keen interest in this research area. One of the key
factor in these advancement has been the popularity of social networking websites
(SNW) especially Twitter. Twitter is one of the most popular social networking
media, with 695,750,000 registered users till date and approximately 135,000 new
users are registering every day [1]. This large audience is responsible for tons of
tweeting happening everyday i.e. sharing their view in relatively fewer words and
hence providing researchers a large pool of tweets, which may contain anger or love
towards an entity like an election. Using the concept of sentiment analysis as
suggested by Liu [2], we can extract their sentiments from these tweets and use these
in predicting the outcome of any event, be it elections. Since US is a developed
country [3], with an established fact that 88.5% of the population has access to the
internet [4] and approx 67 million Twitter users in the US [5], all these factors give us
a perfect platform to carry out our research on 2016 US Presidential Elections.
For this research paper, we have collected the tweets through Twitter. Then we
synthesized these tweets using sentiment analysis that helped us to have a better
insight into the outcome of 2016 US Presidential Elections. We would be discussing
our approach towards our predicted results in the upcoming sections.

2 Background of US Presidential Elections
US Presidential elections were scheduled to be held on November 8, 2016 to elect the
new President of United States of America for the next 4 years, as the second term of
the current President Mr. Barack Obama was going to expire on January 2017. Since
Obama was holding the presidential chair for the second term, so as per the US
presidential ordinances he could not contest these elections. The event became more
engaging, as both the candidates contesting the election were first timers. As we know
Democratic Party and Republican Party were the two main parties, so the entire paper
has been focused on these parties as well as their Presidential candidates.
The selection of both presidential candidates was made through primaries held
between February to June 2016. In the Democratic Party Presidential primaries Ms.
Hillary Clinton defeated Mr. Bernie Sanders, thus becoming the first female
Presidential candidate in the history of United States, to be nominated by a major
political party. While the Republican Party Presidential primaries saw 17 candidates
were entering the primaries, making it the largest ever presidential primary contesting
for any political party in United States history. In the finals Mr. Donald Trump, a
businessman manages to defeat Mr. Ted Cruz to be selected as Republican Party
Presidential candidate.
None of the candidates had an absolute cakewalk, and both faced their respective ups
and downs during the course of their campaign and debates. Donald Trump had easy
primaries while Hillary Clinton had a tough fight with Bernie Sanders. During
debates, Hillary Clinton always had an edge over Donald Trump. Donald Trump was
highly criticized for various comments and attitude toward other nations during
campaigns and speeches while Hillary Clinton had tough times for her email
controversies. So even up to week before the elections, there was ambiguity about the
winner and the lead was constantly swinging among both candidates.
3 Related Work
Twitter and Elections share a strong bond since a longtime now. With advancement in
technology and increase in a number of people using Twitter, the researchers working
in this domain have a perfect opportunity to work on Twitter based emotions towards
election predictions. Though this approach was rather crude and had many flaws yet it
provided useful insights that helped us towards making a realistic prediction with
some modern prediction tools the task seems realistic.
Tumasjan et al. [6] were the first to make use of Twitter to predict the results of
German Federal election held in September 2009. They collected 104,003 tweets over
the period of 27 days for the six popular political parties of Germany. Their technique
was quite simple and dependent on a basic counting of the number of tweets that a
party or its prominent leaders get. Using this simple technique, they were successful
in predicting the winner of 2009 German Federal Elections. However this simple

technique faced huge criticism, in particular, Jungherr et al. [7] pointed the lack of
methodological justification while Gayo-Avello [8-9] stressed on the need to make
true prediction i.e. predictions made prior to the actual election. Another point
highlighted by Gayo-Avello [8-9] was to make use of sentiment analysis in order to
know the sentiment of the tweet, which indeed will help to produce more accurate
results. The subsequent studies DiGrazia et al. [10], Franch [11], Ceron et al. [12],
Caldarelli at al. [13], Burnap et al. [14] have all taken the advice of Gayo-Avello and
made use of sentiment analysis in order to produce more accurate results.
Our work is also influenced by the advice of Gayo-Avello [8-9]. We made a true
prediction for 2016 US Presidential elections, instead of simply relying on the amount
of tweets for making the prediction we have used sentiment analysis in our
methodology along with some scientific tools to make predictions.
4 Proposed Methodology
Data collection is a trivial task and in our case as well the initial hurdle was efficient
data collection. So we gathered data from Twitter in form of tweets. For this, we built
a system in ASP.Net 2012. Since a person can post multiple tweets on Twitter, so in
order to avoid biased results, we have first removed multiple tweets from single
source so that only one tweet could be considered from one person. Next we applied
sentiment analysis to obtain polarity (positive or negative) of each tweet using WEKA
3.8. All these phases are discussed with suitable explanation in the upcoming sections.
The flowchart of the process is given in Figure 1.
Fig. 1. Flowchart of proposed Methodology
5 Data Collection
Data for our research was collected from Twitter. For this purpose, a system was
developed in ASP.Net using visual studio [15]. For tweet fetching we used tweetinvi
API [16] which is freeware and can be easily integrated with Dot.Net framework. The
tweets were fetched using this system based on the hashtags (#) for both the

respective candidates. Table 1 shows the hashtags (#) that were used for fetching
tweets from Twitter.
Table 1. Hashtags (#) used for fetching tweets
Candidates Hillary Clinton Donald Trump
Hashtags(#) #Hillary, #HillaryClinton,
#ClintonKaine, #Votehillary
#DonaldTrump, #TrumpPence16,
#Trump, #VoteTrump
A total of 327,127 tweets were collected from September 1, 2016 to October 31, 2016
daily from the USA. This time period was chosen because the election campaigns
were in full swing so it was possible to get data from all type of Twitter users at this
time. Out of the 327,127 tweets collected from the USA, 194,753 (59.53%) of tweet
mentions were in favor of Donald Trump, while 132,374 (40.47%) of tweet mentions
were in favor of Hillary Clinton. Table 2 shows the daily tweet collection for both the
candidates.
Table 2. Daily tweet collection for both candidates
Date Donald Trump Hillary Clinton
01-09-16 3512 1356
02-09-16 2728 1499
03-09-16 2757 1329
04-09-16 2319 1160
05-09-16 2548 1122
06-09-16 2361 2638
07-09-16 2722 1520
08-09-16 3587 2193
09-09-16 2638 1475
10-09-16 1919 1644
11-09-16 2410 4649
12-09-16 2748 1667
13-09-16 2152 1552
14-09-16 2661 1596
15-09-16 3483 1803
16-09-16 3771 2027
17-09-16 3369 1554
18-09-16 3184 1548
19-09-16 2280 1604
20-09-16 2818 1678
21-09-16 3253 4226
22-09-16 2960 1524
23-09-16 2902 1392
24-09-16 2617 1454
25-09-16 2729 1640
26-09-16 3717 2491
27-09-16 1822 4344
28-09-16 3870 2073

29-09-16 3643 1775
30-09-16 4017 2028
01-10-16 3178 1814
02-10-16 3309 1672
03-10-16 3084 1978
04-10-16 2398 2008
05-10-16 3018 2326
06-10-16 2742 1468
07-10-16 3289 1841
08-10-16 4039 3078
09-10-16 3790 2299
10-10-16 4205 3666
11-10-16 3903 2574
12-10-16 3998 3379
13-10-16 4279 3247
14-10-16 4198 2705
15-10-16 3858 2442
16-10-16 3868 2120
17-10-16 1502 954
18-10-16 3769 2150
19-10-16 4255 2705
20-10-16 3897 2938
21-10-16 3441 2195
22-10-16 3144 2090
23-10-16 3035 2312
24-10-16 2775 2688
25-10-16 3575 2966
26-10-16 3485 2145
27-10-16 3813 2492
28-10-16 2918 1760
29-10-16 3530 2753
30-10-16 3596 2520
31-10-16 3365 2528
Total 194,753 132,374
Since in the actual elections, a person can vote only once. We have also applied a
similar restriction, that only one tweet would be considered per person. The reason for
this restriction was that nowadays many companies and agencies are being hired by
the candidates in order to make the analysis bias. To rule out this anomaly, we had
simply used the coding skills that if a person who tweeted multiple times, then the
first tweet by that person would be considered for evaluation of results. Table 3 shows
an example how this restriction works. In this "Roy" has tweeted 3 tweets, while
"Sheral" has tweeted 2 tweets. So we set flag '1' for all tweets except the initial/first
tweet. So for "Roy" and "Sheral" only one tweet will be counted, hence eliminating
the effect of multiple tweets.

Table 3. Example for applying restriction of one tweet per person
Sr. No. Tweet Sender Flag
1 I support Donald Trump Roy 0
2 Trump you are my hero Roy 1
3 Hillary we win this elections Sheral 0
4 Trump: Make US Great again Roy 1
5 Hillary we support you Sheral 1
After applying this restriction, we were left with 136,192 (41.64%) tweets, while
190,935 (58.36%) duplicate tweets were removed. This highlights an important point
that the number of people posting multiple tweets was quite high. Out of the 136,192
tweets collected from the USA, 81,946 (60.16%) of tweet mentions were in favor of
Mr. Donald Trump, while 54,246 (39.84%). Table 4 shows the daily tweet collection
for both candidates after applying the restriction of one tweet per person. Our entire
experimentation was to be dependent on these 136,192 tweets.
Table 4. Daily tweet collection (With Restriction)
Date Donald Trump Hillary Clinton
01-09-16 1372 554
02-09-16 1097 564
03-09-16 1054 523
04-09-16 892 451
05-09-16 966 506
06-09-16 1540 1529
07-09-16 1013 600
08-09-16 1302 823
09-09-16 1063 594
10-09-16 832 668
11-09-16 926 1686
12-09-16 1040 718
13-09-16 927 682
14-09-16 1073 712
15-09-16 1306 638
16-09-16 1547 1963
17-09-16 1257 607
18-09-16 1161 590
19-09-16 945 641
20-09-16 1163 690
21-09-16 1277 2058
22-09-16 1237 643
23-09-16 1219 583
24-09-16 1119 542
25-09-16 1171 627
26-09-16 1666 918
27-09-16 1016 1973

28-09-16 1547 895
29-09-16 1466 716
30-09-16 1623 756
01-10-16 1315 725
02-10-16 1334 635
03-10-16 1313 874
04-10-16 1038 772
05-10-16 1418 939
06-10-16 1299 643
07-10-16 1540 762
08-10-16 1786 1064
09-10-16 1679 918
10-10-16 1854 1506
11-10-16 1685 1009
12-10-16 1677 1100
13-10-16 1802 1111
14-10-16 1828 995
15-10-16 1655 963
16-10-16 1604 863
17-10-16 791 515
18-10-16 1500 900
19-10-16 1676 1120
20-10-16 1659 1193
21-10-16 1362 904
22-10-16 1285 793
23-10-16 1294 757
24-10-16 1213 892
25-10-16 1444 930
26-10-16 1593 944
27-10-16 1585 966
28-10-16 1360 888
29-10-16 1557 1068
30-10-16 1498 992
31-10-16 1485 1055
Total 81,946 54,246

6 Results and Findings
As mentioned earlier, volume of tweets is not the deciding factor for the victory of
any specific candidate, we computed polarity (positive or negative) for each tweet by
applying sentiment analysis. Sentiment analysis is the study of analyzing people's
opinions, sentiments, evaluations, appraisals, attitudes and emotions towards entities
such as products, services, organizations, individuals, issues, events, topics, and their
attributes [2].
For this, we developed a classification model in WEKA 3.8 [17], which is open
source software and consists of a collection of machine learning algorithms for data
mining tasks. Further we applied support vector machines (SVM) which is a
supervised machine learning approach for performing the sentiment analysis. The
SVM is a learning machine for two-group classification problems that transforms the
attribute space into multidimensional feature space using a kernel function to separate
dataset instances by an optimal hyperplane [18]. The reason for building the model
using SVM was that it is often regarded as one of the best classification algorithm
[19].
The training data set was same as used by Kotzias et al. [20], which contains reviews
and scores from three different datasets i.e. Amazon [21], IMDb [22], Yelp [23]. Each
dataset contains a total of 500 positive and 500 negative sentences, so in total the
dataset had 1500 positive and 1500 negative sentences. The data set contained two
columns first the sentence and second the sentiment of each sentence in form of "0"
(negative) and "1" (positive).
For classification, we used filtered classifiers, which enable us to build a classifier
with a filter of our choice. As discussed earlier SVM is used as classifier while
"StringToWordVector" is used as a filter which convert a string attribute to a vector
that represents word occurrence frequencies. In addition to this we used 10 fold cross
validation which is also known as rotation estimation to analyze how a predictive
model would perform on an unknown dataset. The training set got an efficiency of
79.26%, this means 2378 instances from the training set were correctly classified
while 622 instances were incorrectly classified. According to the confusion matrix
1191 negative instances (Class a) were correctly classified while 1167 positive
instances (Class b) were correctly classified. The detailed results along with
confusion matrix are shown in Figure 2, while Figure 3 shows the graph showing area
under the curve (ROC=0.793).
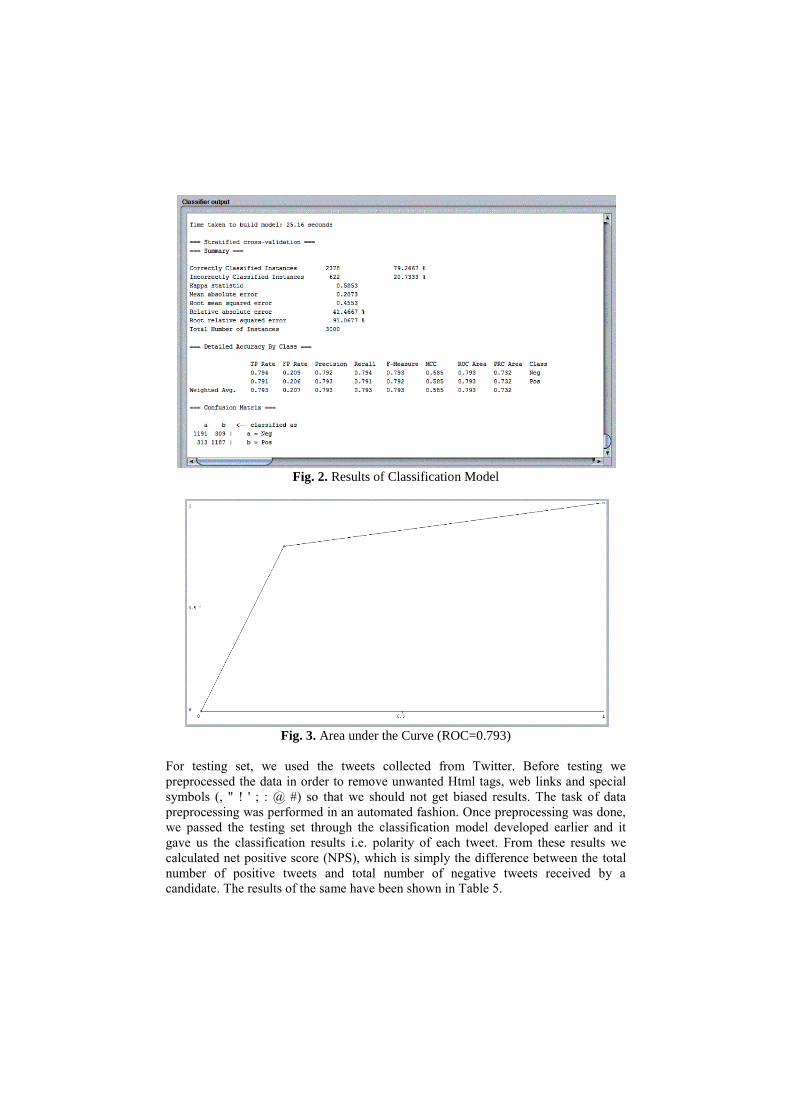
Fig. 2. Results of Classification Model
Fig. 3. Area under the Curve (ROC=0.793)
For testing set, we used the tweets collected from Twitter. Before testing we
preprocessed the data in order to remove unwanted Html tags, web links and special
symbols (, " ! ' ; : @ #) so that we should not get biased results. The task of data
preprocessing was performed in an automated fashion. Once preprocessing was done,
we passed the testing set through the classification model developed earlier and it
gave us the classification results i.e. polarity of each tweet. From these results we
calculated net positive score (NPS), which is simply the difference between the total
number of positive tweets and total number of negative tweets received by a
candidate. The results of the same have been shown in Table 5.

Table 5. Result of Sentiment Analysis for both candidates
Number of Tweets
Donald Trump Hillary Clinton
Positive 42518 27582
Negative 39428 26664
Net Positive Score (NPS) 3090 918
Out of the total 81,946 tweet for Donald Trump got, 42,518 (51.88%) tweets were
positive and 27,582 (48.12%) tweets were negative. Similarly out of the total 54,246
tweets Hillary Clinton got, 27,582 (50.84%) tweets were positive and 26,664
(49.16%) tweets were negative. The net positive score (NPS) of Donald Trump was
observed to be significantly higher than that of Hillary Clinton. Based upon our
experimental results it was evident that Donald Trump would be winning the 2016 US
Presidential Elections. Figure 4 shows the results of the same in graphical form.
Fig. 4. Final Results
7 Conclusions and Future Work
Predicting an event is always an uphill task. There are lots of factors that ought to be
considered for making a truthful prediction. The aim of this paper was to predict the
winner of 2016 US Presidential Elections. For this we collected data from Twitter.
Further we applied a restriction that only one tweet per person will be considered for
evaluation. Finally, we build a classification model in WEKA using SVM for
performing sentiment analysis. Based upon the results of sentiment analysis we
calculated the NPS. The results of our experiments clearly indicate that Donald
Trump would be winning the 2016 US Presidential Elections.
42518
27582
3090
27582 26664
918
0
5000
10000
15000
20000
25000
30000
35000
40000
45000
Positive Negative Net Positive Score
Donald Trump Hillary Clinton

Our experiments gave us the probability that the winner will be Donald Trump,
however the actual winner in the US presidential election is based on the electoral
vote and not the percentage of votes, and we should build a mathematical model that
can convert the results of sentiment analysis into electoral votes which indeed will be
our future aim.
References
1. Statisticbrain Twitter Facts, "http://www.statisticbrain.com/Twitter-statistics/"
2. Liu, Bing. "Sentiment analysis and opinion mining."Synthesis lectures on human
language technologies 5, no. 1 (2012): 1-167. doi:
10.2200/S00416ED1V01Y201204HLT016
3. IMF Report, "http://www.imf.org/external/pubs/ft/weo/2015/01/weodata/groups.htm"
4. CIA Internet User Report,"https://www.cia.gov/library/publications/resources/the-
world-factbook/rankorder/2153rank.html"
5. Statisticbrain US Twitter Facts, "https://www.statista.com/statistics/274564/monthly-
active-Twitter-users-in-the-united-states/"
6. Tumasjan, Andranik, Timm Oliver Sprenger, Philipp G. Sandner, and Isabell M. Welpe
(2010). "Predicting elections with Twitter: What 140 characters reveal about political
sentiment." ICWSM 10: 178-185.
7. Jungherr, Andreas (2013). "Tweets and votes, a special relationship: The 2009 federal
election in germany." In Proceedings of the 2nd workshop on Politics, elections and
data, pp. 5-14. Doi: 10.1145/2508436.2508437
8. Gayo Avello, Daniel, Panagiotis T. Metaxas, and Eni Mustafaraj. "Limits of electoral
predictions using twitter." In Proceedings of the Fifth International AAAI Conference on
Weblogs and Social Media. Association for the Advancement of Artificial Intelligence,
2011.
9. Gayo-Avello, Daniel. "I Wanted to Predict Elections with Twitter and all I got was this
Lousy Paper A Balanced Survey on Election Prediction using Twitter Data." arXiv
preprint arXiv:1204.6441 (2012).
10. DiGrazia, Joseph, Karissa McKelvey, Johan Bollen, and Fabio Rojas. "More tweets,
more votes: Social media as a quantitative indicator of political behavior." PloS one 8,
no. 11 (2013): e79449. doi: 10.1371/journal.pone.0079449
11. Franch, Fabio. "(Wisdom of the Crowds) 2: 2010 UK election prediction with social
media." Journal of Information Technology & Politics 10, no. 1 (2013): 57-71. doi:
10.1080/19331681.2012.705080
12. Ceron, Andrea, Luigi Curini, Stefano M. Iacus, and Giuseppe Porro. "Every tweet
counts? How sentiment analysis of social media can improve our knowledge of citizens’
political preferences with an application to Italy and France." New Media & Society 16,
no. 2 (2014): 340-358. doi: 10.1177/1461444813480466
13. Caldarelli, Guido, Alessandro Chessa, Fabio Pammolli, Gabriele Pompa, Michelangelo
Puliga, Massimo Riccaboni, and Gianni Riotta. "A multi-level geographical study of
Italian political elections from Twitter data." PloS one 9, no. 5 (2014): e95809. doi:
10.1371/journal.pone.0095809
14. Burnap, Pete, Rachel Gibson, Luke Sloan, Rosalynd Southern, and Matthew Williams.
"140 characters to victory?: Using Twitter to predict the UK 2015 General Election."
Electoral Studies 41 (2016): 230-233. doi: 10.1016/j.electstud.2015.11.017

15. Visual Studio 2012, "https://www.visualstudio.com/en-us/downloads/download-visual-
studio-vs.aspx"
16. Tweetinvi API, "https://www.nuget.org/packages/TweetinviAPI/"
17. Eibe Frank, Mark A. Hall, and Ian H. Witten (2016). The WEKA Workbench. Online
Appendix for "Data Mining: Practical Machine Learning Tools and Techniques",
Morgan Kaufmann, Fourth Edition, 2016.
18. Hearst, Marti A., Susan T. Dumais, Edgar Osuna, John Platt, and Bernhard Scholkopf.
"Support vector machines." IEEE Intelligent Systems and their Applications 13, no. 4
(1998): 18-28. doi: 10.1109/5254.708428
19. Petrova, Natalia V., and Cathy H. Wu. "Prediction of catalytic residues using Support
Vector Machine with selected protein sequence and structural properties." BMC
bioinformatics 7, no. 1 (2006): 312. doi: 10.1186/1471-2105-7-312
20. Kotzias, Dimitrios, Misha Denil, Nando De Freitas, and Padhraic Smyth. "From group
to individual labels using deep features." In Proceedings of the 21th ACM SIGKDD
International Conference on Knowledge Discovery and Data Mining, pp. 597-606.
ACM, 2015. doi: 10.1145/2783258.2783380
21. McAuley, Julian, and Jure Leskovec. "Hidden factors and hidden topics: understanding
rating dimensions with review text." In Proceedings of the 7th ACM conference on
Recommender systems, pp. 165-172. ACM, 2013. doi: 10.1145/2507157.2507163
22. Maas, Andrew L., Raymond E. Daly, Peter T. Pham, Dan Huang, Andrew Y. Ng, and
Christopher Potts. "Learning word vectors for sentiment analysis." In Proceedings of the
49th Annual Meeting of the Association for Computational Linguistics: Human
Language Technologies-Volume 1, pp. 142-150. Association for Computational
Linguistics, 2011. 23. Yelp Dataset, "https://www.yelp.com/dataset_challenge"