Embed Size (px)
Citation preview
Forecasting the spatial extent of the annual flood
in the Okavango delta, Botswana
T. Gumbrichta, P. Wolskib, P. Frostc, T.S. McCarthya,*
aDepartment of Geology, University of the Witwatersrand, P.O. Box 3, Wits 2050, Johannesburg 4-27125, South AfricabHarry Openheimer Okavango Research Centre, University of Botswana, Private Bag 285, Maun, Botswana
cInstitute for Soil, Climate and Water, Private Bag X79, Pretoria 0001, South Africa
Received 9 October 2002; revised 31 October 2003; accepted 7 November 2003
Abstract
The pristine Okavango Delta wetland of northern Botswana is potentially under threat due to water abstraction from its
tributaries. We have developed a statistical model which makes it possible to predict the extent of wetland loss which will arise
from water abstraction. The model also permits prediction of the maximum area of flooding, and its spatial distribution, three
months in advance of the flood maximum. The model was calibrated using maximum areas of seasonal inundation extracted
from satellite imagery covering the period 1985–2000, which were correlated with rainfall and total flood discharge. A
technique was developed to translate the modelled flood area into a flood map. The methodology can predict maximum area of
flooding and its distribution with better than 90% accuracy. An important, although relatively minor, source of error in the
spatial distribution of the flood arises from a secular change in flood distribution in the distal Delta which has taken place over
the last 15 years. Reconstruction of flooding history back to 1934 suggests that the Delta may be subject to a quasi 80 year
climatic oscillation. If this oscillation continues, the extent of flooding will increase in the coming decades.
q 2004 Elsevier B.V. All rights reserved.
Keywords: Okavango delta; Seasonal flood; Flood forecast; Flood area
1. Introduction
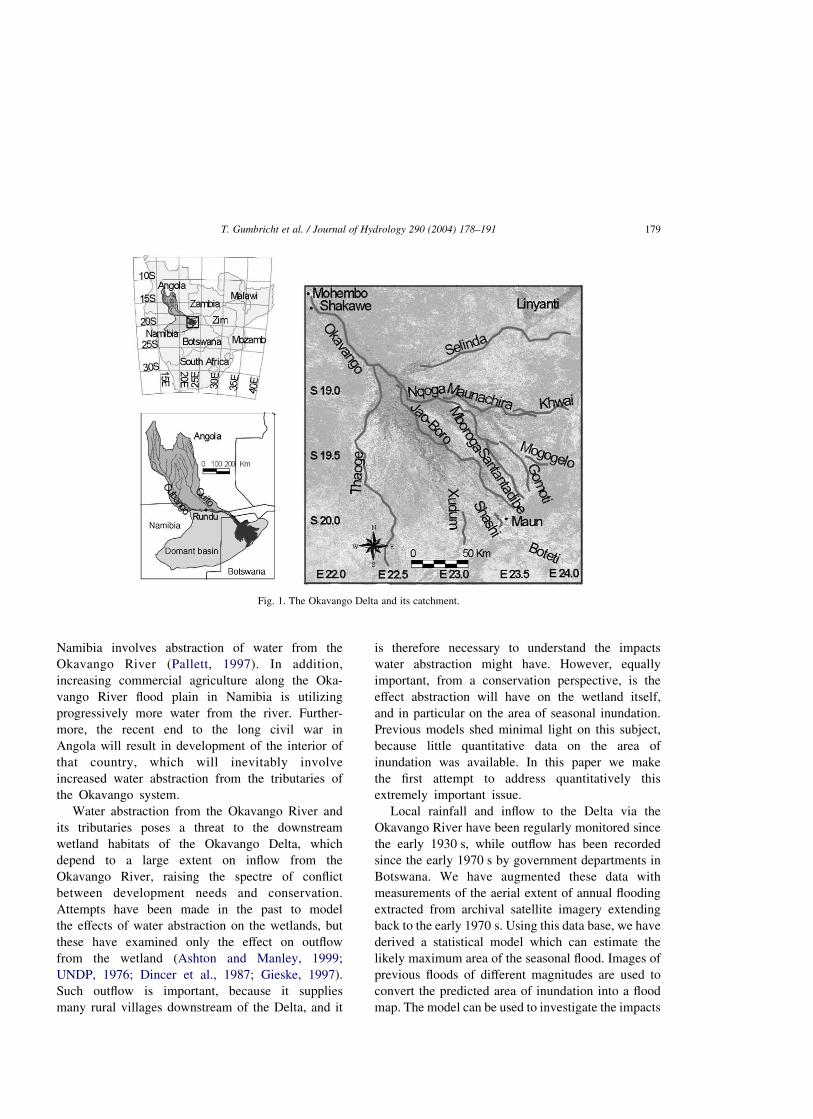
The Okavango Delta of northern Botswana
(Fig. 1) is perhaps the most pristine of Africa’s
large wetlands, and a major, international tourist
destination. Because of its remoteness, it largely
escaped colonial development, and its primary
sources of water, the Quito and Cubango Rivers,
which arise in central Angola and combine to form
the Okavango River, also remain undeveloped.
However, in recent years there has been growing
interest in the water resources of the region,
prompted initially by severe drought conditions in
northern Botswana (Scudder, 1993). More recently,
a drought in Namibia led to a proposal to pump
water from the Okavango River at Rundu as an
emergency measure to supply the national water
distribution network of that country (Ashton and
Manley, 1999). Improved rainfall, however,
resulted in temporary suspension of the scheme,
but the long term water development plan for
Journal of Hydrology 290 (2004) 178–191
www.elsevier.com/locate/jhydrol
0022-1694/$ - see front matter q 2004 Elsevier B.V. All rights reserved.
doi:10.1016/j.jhydrol.2003.11.010
* Corresponding author. Fax: þ27-11-717-6579.
E-mail address: [email protected] (T.S.
McCarthy).
Namibia involves abstraction of water from the
Okavango River (Pallett, 1997). In addition,
increasing commercial agriculture along the Oka-
vango River flood plain in Namibia is utilizing
progressively more water from the river. Further-
more, the recent end to the long civil war in
Angola will result in development of the interior of
that country, which will inevitably involve
increased water abstraction from the tributaries of
the Okavango system.
Water abstraction from the Okavango River and
its tributaries poses a threat to the downstream
wetland habitats of the Okavango Delta, which
depend to a large extent on inflow from the
Okavango River, raising the spectre of conflict
between development needs and conservation.
Attempts have been made in the past to model
the effects of water abstraction on the wetlands, but
these have examined only the effect on outflow
from the wetland (Ashton and Manley, 1999;
UNDP, 1976; Dincer et al., 1987; Gieske, 1997).
Such outflow is important, because it supplies
many rural villages downstream of the Delta, and it
is therefore necessary to understand the impacts
water abstraction might have. However, equally
important, from a conservation perspective, is the
effect abstraction will have on the wetland itself,
and in particular on the area of seasonal inundation.
Previous models shed minimal light on this subject,
because little quantitative data on the area of
inundation was available. In this paper we make
the first attempt to address quantitatively this
extremely important issue.
Local rainfall and inflow to the Delta via the
Okavango River have been regularly monitored since
the early 1930 s, while outflow has been recorded
since the early 1970 s by government departments in
Botswana. We have augmented these data with
measurements of the aerial extent of annual flooding
extracted from archival satellite imagery extending
back to the early 1970 s. Using this data base, we have
derived a statistical model which can estimate the
likely maximum area of the seasonal flood. Images of
previous floods of different magnitudes are used to
convert the predicted area of inundation into a flood
map. The model can be used to investigate the impacts
Fig. 1. The Okavango Delta and its catchment.
T. Gumbricht et al. / Journal of Hydrology 290 (2004) 178–191 179
of water abstraction on the wetland, and can also be
used to predict the likely maximum area and spatial
extent of flooding in the wetland three months prior to
peak flooding.
2. Hydrological functioning of the okavango
delta wetland
The Okavango Delta wetland is a large, low
gradient (1:3300) alluvial fan, of very low local
relief, situated within a depression related to an
extension of the East African Rift system (Gumbricht
et al., 2001). Upstream of the fan is an incised corridor
known as the Panhandle. The hydrology of the
wetland is generally well understood (Wilson and
Dincer, 1976; McCarthy et al., 1998). Water is
supplied by the Okavango River, whose tributaries,
the Quito and Cubango Rivers, rise in the highlands of
central Angola. Rain falls in the catchment between
December and March, and run-off accumulates in the
Okavango River. Peak discharge at the apex of the
Panhandle occurs in April. The average annual
discharge is 10.1 £ 109 m3, but is quite variable,
ranging from a low of 6.0 £ 109 m3 to a high of
16.4 £ 109 m3 over the last 60 years. The Okavango
River meanders down the length of the Panhandle, but
at its lower end splits into several distributary
channels which direct water to the west (Thaoge),
centre (Jao-Boro), and east (Nqoga-Maunachira and
Selinda), creating the classic delta shape (Fig. 1).
These channels undergo further bifurcation down-
stream. Channel margins consist mainly of vegetal
material and are permeable to water. Consequently,
water continually leaks from the channels, and
sustains vast backswamp areas. Base flow in the
Okavango River sustains about 3000 km2 of perma-
nent swamp in the Panhandle and around the apex of
the alluvial fan, but the area of inundation may
seasonally expand and can exceed 12,000 km2.
Because of the very low gradient, gently undulating
topography and dense vegetation, the annual flood
wave takes between four and five months to traverse
the fan, and maximum inundation on the fan usually
occurs in August, in mid-winter.
Whilst the annual inflow from the Okavango River
provides an import supply of water, local rainfall also
contributes significantly to the wetland. This falls
between October and May, and averages 490 mm/a.
Rainfall is derived mainly from convective thunder-
storms, is very scattered, and annually very variable.
Although the rainfall is moderate, the region is
nevertheless semi-arid, with an annual evaporation
of 2172 mm, four times annual rainfall. Unusually
high rainfall can produce extensive surface flooding
during the late summer, well before the normal
seasonal flood occurs. These uncommon flood
episodes differ from the seasonal flood in that they
produce more widespread flooding than the winter
seasonal flood, which propagates outward from the
apex of the alluvial fan.
The annual flood expands outwards from the
fringes of the permanent swamp by a combination
of channel and sheet flow. The advancing flood water
encounters dry ground, and infiltrates, raising the
groundwater table. A considerable proportion of
the flood water is thus lost to groundwater recharge.
The depth to the groundwater table is therefore an
important variable in the overall hydrology of the
Okavango Delta. Good summer rains raise the
groundwater table, and hence contribute to increasing
the area of inundation during the seasonal flood.
Antecedent conditions are also important. If the water
table is high due to extensive flooding in the previous
year, even moderate inflow and rainfall can produce a
large area of inundation. The maximum extent of
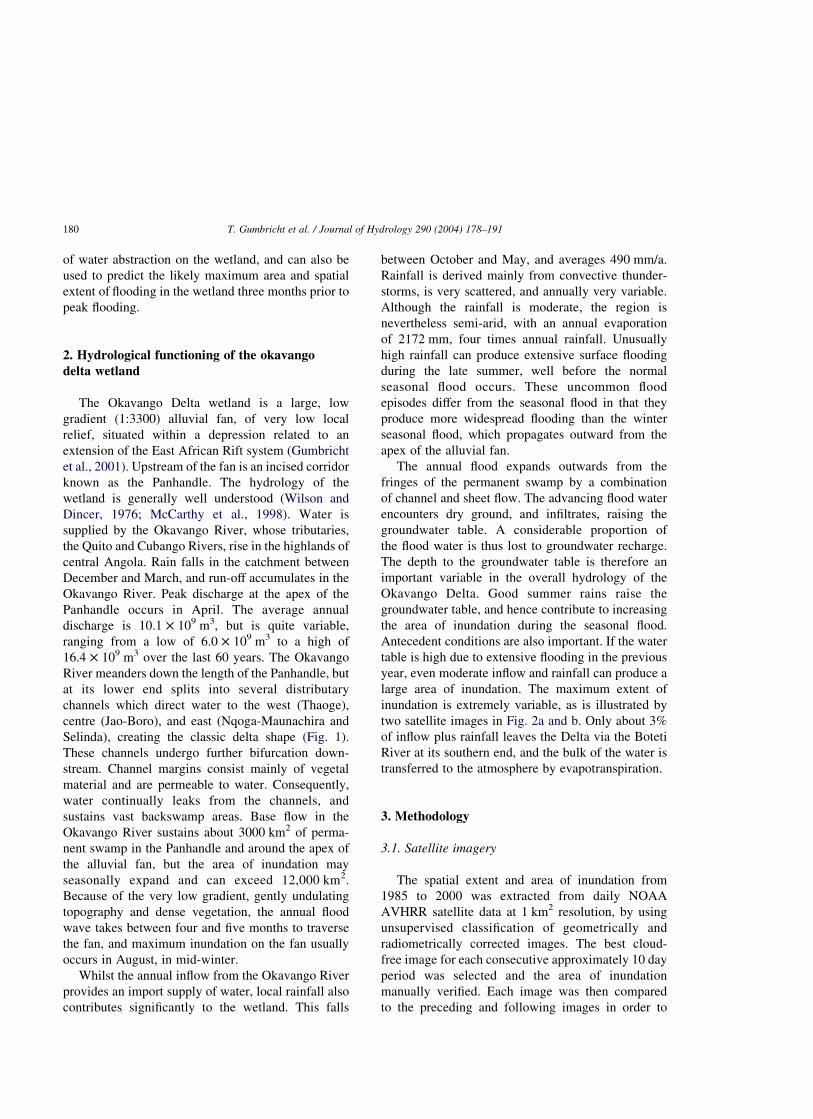
inundation is extremely variable, as is illustrated by
two satellite images in Fig. 2a and b. Only about 3%
of inflow plus rainfall leaves the Delta via the Boteti
River at its southern end, and the bulk of the water is
transferred to the atmosphere by evapotranspiration.
3. Methodology
3.1. Satellite imagery
The spatial extent and area of inundation from
1985 to 2000 was extracted from daily NOAA
AVHRR satellite data at 1 km2 resolution, by using
unsupervised classification of geometrically and
radiometrically corrected images. The best cloud-
free image for each consecutive approximately 10 day
period was selected and the area of inundation
manually verified. Each image was then compared
to the preceding and following images in order to
T. Gumbricht et al. / Journal of Hydrology 290 (2004) 178–191180
screen for possible erroneous data pixels, and to
eliminate the effect of any remaining cloud cover. The
areas inundated in the images for each month were
aggregated in order to obtain a representative water
distribution image for that month. Pixels will be
identified as flooded if more than a quarter of the area
in that pixel is inundated. For a few dates prior to
1985, LANDSAT TM and MSS data were used as no
NOAA data were available. For each image, the area
of inundation was extracted. Details of the method-
ology have been described elsewhere (McCarthy,
2002). The maximum inundated area for each year
was determined from the NOAA AVHRR images and
these data were used to calibrate the statistical model.
3.2. Subdivision of flooded areas
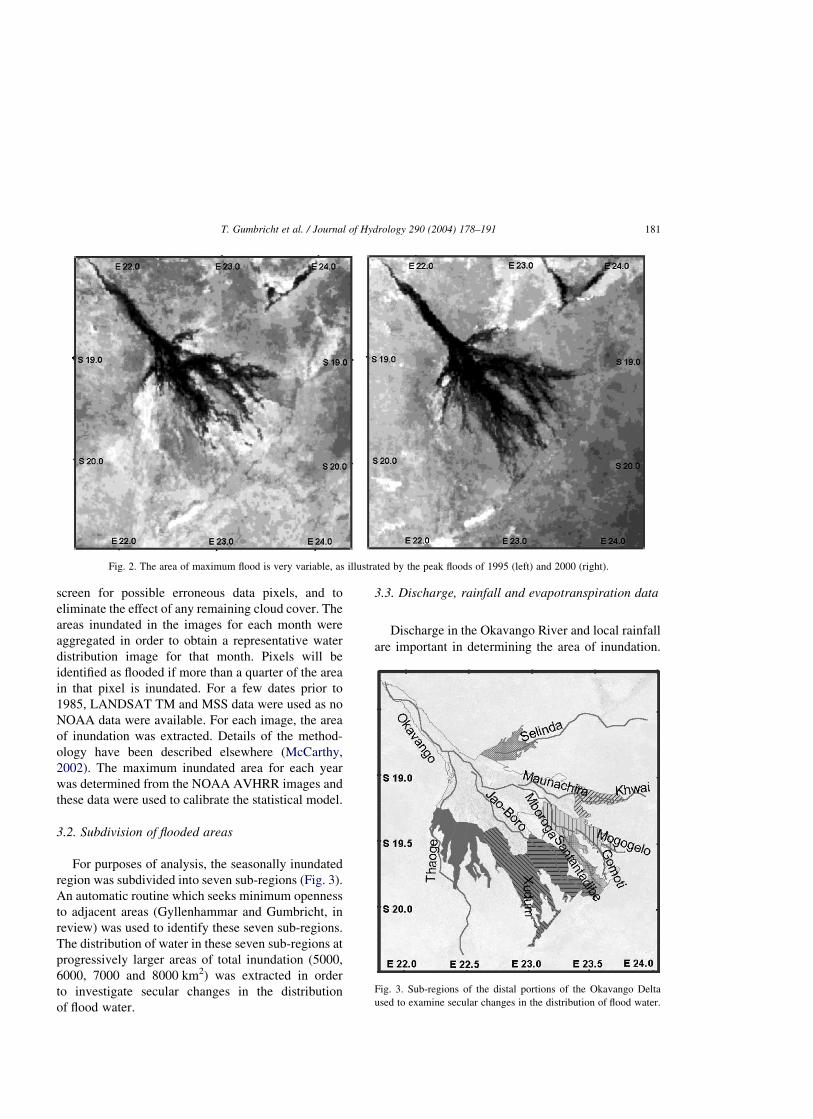
For purposes of analysis, the seasonally inundated
region was subdivided into seven sub-regions (Fig. 3).
An automatic routine which seeks minimum openness
to adjacent areas (Gyllenhammar and Gumbricht, in
review) was used to identify these seven sub-regions.
The distribution of water in these seven sub-regions at
progressively larger areas of total inundation (5000,
6000, 7000 and 8000 km2) was extracted in order
to investigate secular changes in the distribution
of flood water.
3.3. Discharge, rainfall and evapotranspiration data
Discharge in the Okavango River and local rainfall
are important in determining the area of inundation.
Fig. 2. The area of maximum flood is very variable, as illustrated by the peak floods of 1995 (left) and 2000 (right).
Fig. 3. Sub-regions of the distal portions of the Okavango Delta
used to examine secular changes in the distribution of flood water.
T. Gumbricht et al. / Journal of Hydrology 290 (2004) 178–191 181
Inflow to the Delta has been recorded at Mohembo
since 1933, and monthly total discharges were used in
this investigation. Rainfall records are available for
the villages of Maun from 1921 and Shakawe from
1932. An average of the monthly totals from these two
data sets was used as representing local rainfall over
the Delta. Rainfall in the region tends to result mainly
from local thunderstorms, and is scattered. In order to
investigate the possible local influence such scattered
showers might have, satellite derived precipitation
estimates were obtained for the period 1995–2000
over the entire area (Herman et al., 1997). The
variability of rainfall over the seven sub-regions was
then examined. Evapotranspiration data were
obtained from the weather station at Maun. Records
were only available for the period 1967–2000.
3.4. Recreating maps of regions of inundation from
a known area of inundation
All images representing the region flooded during
the rising flood period were stacked and the sequence
of successive filling of the pixels established. This
sequence represents the manner in which the flood
wave advances. Each pixel is 1 km2 in area, and hence
for any nominated flooded area, a map of the
distribution of the water can be constructed by simply
filling all the pixels in sequence up to the specified
total area. It should be noted that a pixel indicated as
flooded may not be entirely inundated, but at least a
quarter of that pixel will contain water.
4. Results and discussion
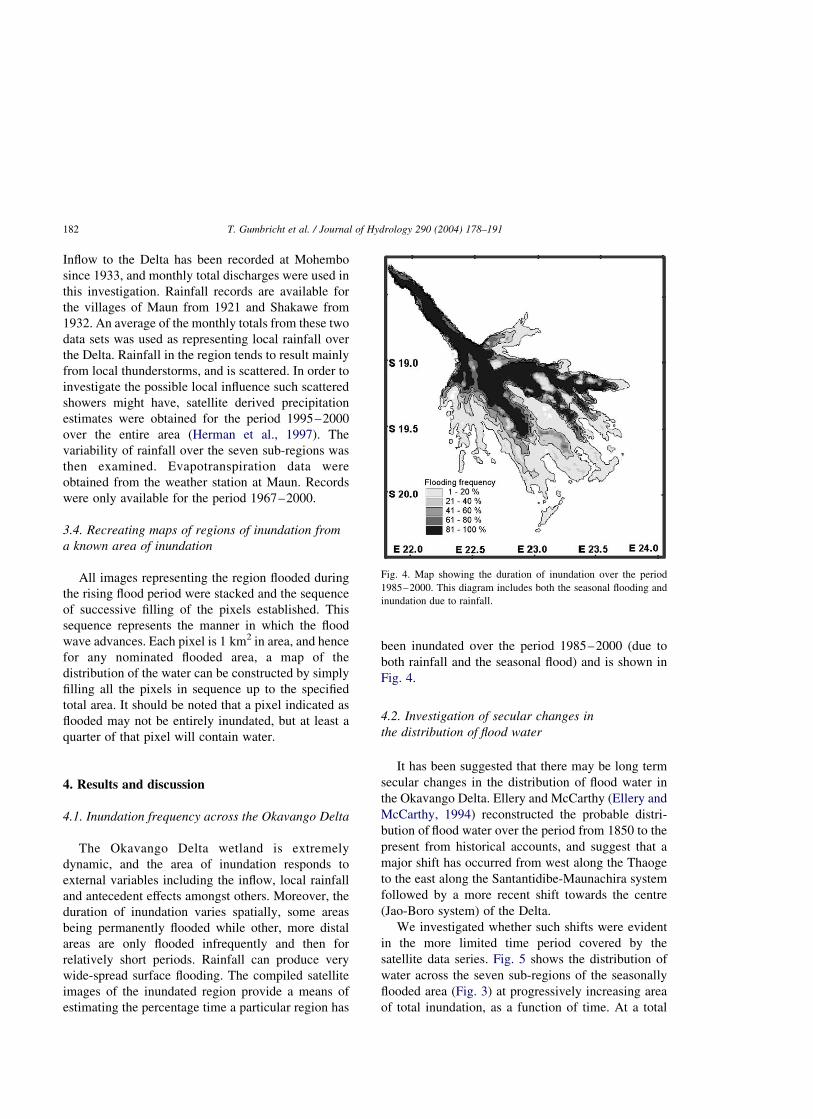
4.1. Inundation frequency across the Okavango Delta
The Okavango Delta wetland is extremely
dynamic, and the area of inundation responds to
external variables including the inflow, local rainfall
and antecedent effects amongst others. Moreover, the
duration of inundation varies spatially, some areas
being permanently flooded while other, more distal
areas are only flooded infrequently and then for
relatively short periods. Rainfall can produce very
wide-spread surface flooding. The compiled satellite
images of the inundated region provide a means of
estimating the percentage time a particular region has
been inundated over the period 1985–2000 (due to
both rainfall and the seasonal flood) and is shown in
Fig. 4.
4.2. Investigation of secular changes in
the distribution of flood water
It has been suggested that there may be long term
secular changes in the distribution of flood water in
the Okavango Delta. Ellery and McCarthy (Ellery and
McCarthy, 1994) reconstructed the probable distri-
bution of flood water over the period from 1850 to the
present from historical accounts, and suggest that a
major shift has occurred from west along the Thaoge
to the east along the Santantidibe-Maunachira system
followed by a more recent shift towards the centre
(Jao-Boro system) of the Delta.
We investigated whether such shifts were evident
in the more limited time period covered by the
satellite data series. Fig. 5 shows the distribution of
water across the seven sub-regions of the seasonally
flooded area (Fig. 3) at progressively increasing area
of total inundation, as a function of time. At a total
Fig. 4. Map showing the duration of inundation over the period
1985–2000. This diagram includes both the seasonal flooding and
inundation due to rainfall.
T. Gumbricht et al. / Journal of Hydrology 290 (2004) 178–191182
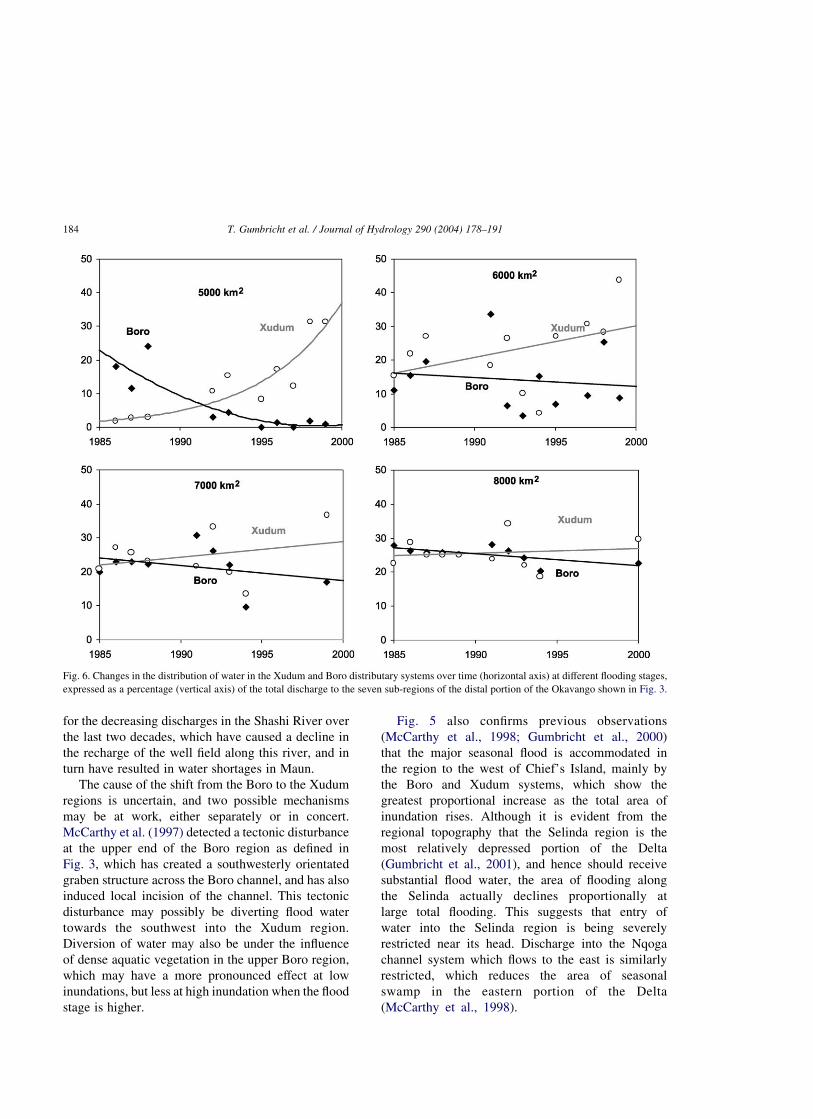
flooded area of 5000 km2, it can be seen that flooding
in the Xudum region has grown at the expense of the
Boro in the period between 1986 and 1999. However,
this increase, although present, is less dramatic at
greater areas of inundation. Shift towards the Xudum
is more clearly shown in Fig. 6. At low total
inundation, the shift is very pronounced, but less so
at higher total area of inundation. However, under
conditions of very large inflow, as occurred in 1992
and 1999, the Xudum area again appears to receive a
larger proportion of water compared to the Boro
(Fig. 5). This shift towards the Xudum system is
unlikely to be the result of uneven distribution of
rainfall. The distribution of rainfall, based on satellite-
derived precipitation estimates, was found to be
uniform across the Boro and Xudum areas in the
period 1995–2000, and this situation probably also
obtained in previous years.
There does therefore appear to be a progressive
shift towards the Xudum at the expense of the Boro,
which at intermediate levels of inundation tends to be
somewhat masked. This shift may be the explanation
Fig. 5. Distribution of flood waters across the regions shown in Fig. 3 at various stages of the rising flood over the period 1985–2000.
T. Gumbricht et al. / Journal of Hydrology 290 (2004) 178–191 183
for the decreasing discharges in the Shashi River over
the last two decades, which have caused a decline in
the recharge of the well field along this river, and in
turn have resulted in water shortages in Maun.
The cause of the shift from the Boro to the Xudum
regions is uncertain, and two possible mechanisms
may be at work, either separately or in concert.
McCarthy et al. (1997) detected a tectonic disturbance
at the upper end of the Boro region as defined in
Fig. 3, which has created a southwesterly orientated
graben structure across the Boro channel, and has also
induced local incision of the channel. This tectonic
disturbance may possibly be diverting flood water
towards the southwest into the Xudum region.
Diversion of water may also be under the influence
of dense aquatic vegetation in the upper Boro region,
which may have a more pronounced effect at low
inundations, but less at high inundation when the flood
stage is higher.
Fig. 5 also confirms previous observations
(McCarthy et al., 1998; Gumbricht et al., 2000)
that the major seasonal flood is accommodated in
the region to the west of Chief’s Island, mainly by
the Boro and Xudum systems, which show the
greatest proportional increase as the total area of
inundation rises. Although it is evident from the
regional topography that the Selinda region is the
most relatively depressed portion of the Delta
(Gumbricht et al., 2001), and hence should receive
substantial flood water, the area of flooding along
the Selinda actually declines proportionally at
large total flooding. This suggests that entry of
water into the Selinda region is being severely
restricted near its head. Discharge into the Nqoga
channel system which flows to the east is similarly
restricted, which reduces the area of seasonal
swamp in the eastern portion of the Delta
(McCarthy et al., 1998).
Fig. 6. Changes in the distribution of water in the Xudum and Boro distributary systems over time (horizontal axis) at different flooding stages,
expressed as a percentage (vertical axis) of the total discharge to the seven sub-regions of the distal portion of the Okavango shown in Fig. 3.
T. Gumbricht et al. / Journal of Hydrology 290 (2004) 178–191184
4.3. Statistical model of the area of inundation
It has been previously shown that the most
important variables in determining the magnitude of
seasonal flooding are seasonal inflow and total
summer rainfall (Gieske, 1997; McCarthy et al.,
1998). In addition, second order effects arise from
evapotranspirational loss of water and groundwater
recharge. Rainfall, inflow and evapotranspiraton data
exist for the period covered by the satellite data, but
the amount of water lost to groundwater recharge
cannot be determined. However, a proxy measure is
provided by the extent of flooding in the preceding
year.Maximum flooding in the Delta generally occurs
in August, in response to inflow which peaks in April,
and rainfall which peaks in February. For the purposes
of the statistical analysis, therefore, the total discharge
measured at Mohembo between November of the
preceding year and August (i.e. the seasonal flood
wave) and the rainfall in the same period were
compared with the maximum area of flooding,
extracted from the satellite data. The maximum area
of flooding in the preceding year was used to represent
the antecedent effect. Multiple regression was per-
formed, with maximum area of inundation serving as
the dependant variable. The regression yielded the
following equation:
Aðkm2Þ ¼ 0:79 £ Qð106m3Þ þ 5:59 £ PðmmÞ
þ 0:059 £ Lðkm2Þ2 817 ð1Þ
where A is the maximum inundated area, Q the inflow,
P the rainfall and L the area of flooding in the
preceding year. The correlation between calculated
and actual area of inundation yielded an R2 of 0.90,
with a standard error of 589 km2.Including evapo-
transpiration in the analysis yielded the following
equation:
Aðkm2Þ¼0:79£Qð106m3Þþ5:33£PðmmÞ
þ0:084£Lðkm2Þ2442£EðmmÞþ1386 ð2Þ
where E is the measured evapotranspiration. The
correlation between calculated and actual inundated
areas yielded an R2 of 0.90, with a standard error of
613 km2.
While a model based on inflow from November to
August is realistic in terms of including the entire
flood wave, it has a disadvantage in that it provides no
predictive capability. Peak discharge usually occurs in
April, and falls thereafter. The earliest date at which
the impact of seasonal inflow can begin to be assessed
is therefore the end of May. A model incorporating
inflow in this period could provide a predictive
capability on the extent of the impending seasonal
flood. Accordingly statistical models based on this
shorter time period were investigated. Regression
analysis using inflow and rainfall between November
and May yielded the following equation:
Aðkm2Þ ¼ 0:94 £ Qð106m3Þ þ 6:03 £ PðmmÞ
þ 0:107 £ Lðkm2Þ2 901 ð3Þ
Correlation between calculated and actual inun-
dated areas yielded an R2 of 0.87 and a standard error
of 667 km2.
Including evapotranspirational loss in the
regression yielded the following equation:
Aðkm2Þ ¼0:96£Qð106m3Þþ5:59£PðmmÞ
þ0:148£Lðkm2Þ2747£EðmmÞþ2811
ð4Þ
Correlation between predicted and actual inun-
dated areas yielded an R2 of 0.87 and a standard error
of 695 km2.
It is evident from the above analysis that adding
evapotranspiration provided no improvement. The
probable reason for this is that evapotranspiration
varies very little from year to year. There is a slight
loss of accuracy introduced by reducing the period
of inflow (standard error rises from 585 km2 using
Eq. (1) to 667 km2 using Eq. (3)), but this is more than
compensated for by the predictive capability resulting
from the statistical model based on the shorter time
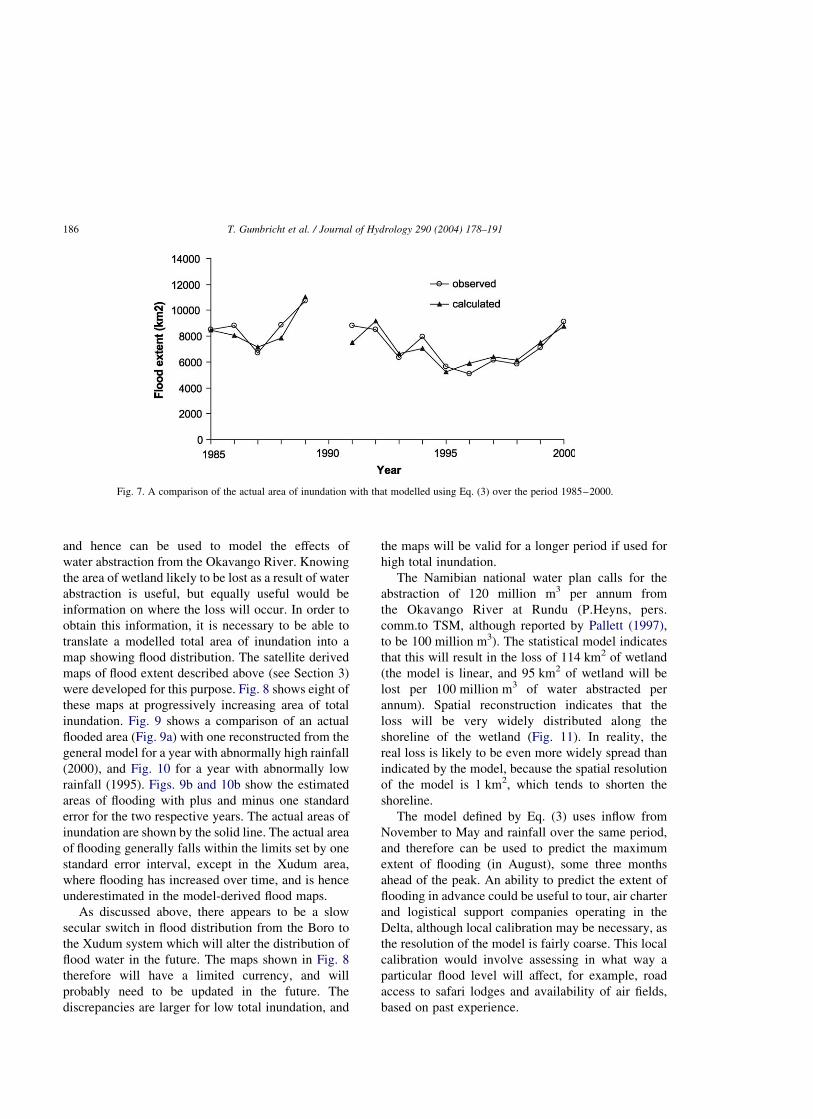
period. Modelled results (using Eq. (3)) are compared
with actual flooded areas over the investigation period
in Fig. 7.
4.4. Reconstructing maps showing the inundated
region from calculated total area of inundation
The statistical model described above can predict
the area of inundation fairly well, with an error margin
of less than 10% (mean area of maximum inundation
of the period used in the analysis was 7666 km2),
T. Gumbricht et al. / Journal of Hydrology 290 (2004) 178–191 185
and hence can be used to model the effects of
water abstraction from the Okavango River. Knowing
the area of wetland likely to be lost as a result of water
abstraction is useful, but equally useful would be
information on where the loss will occur. In order to
obtain this information, it is necessary to be able to
translate a modelled total area of inundation into a
map showing flood distribution. The satellite derived
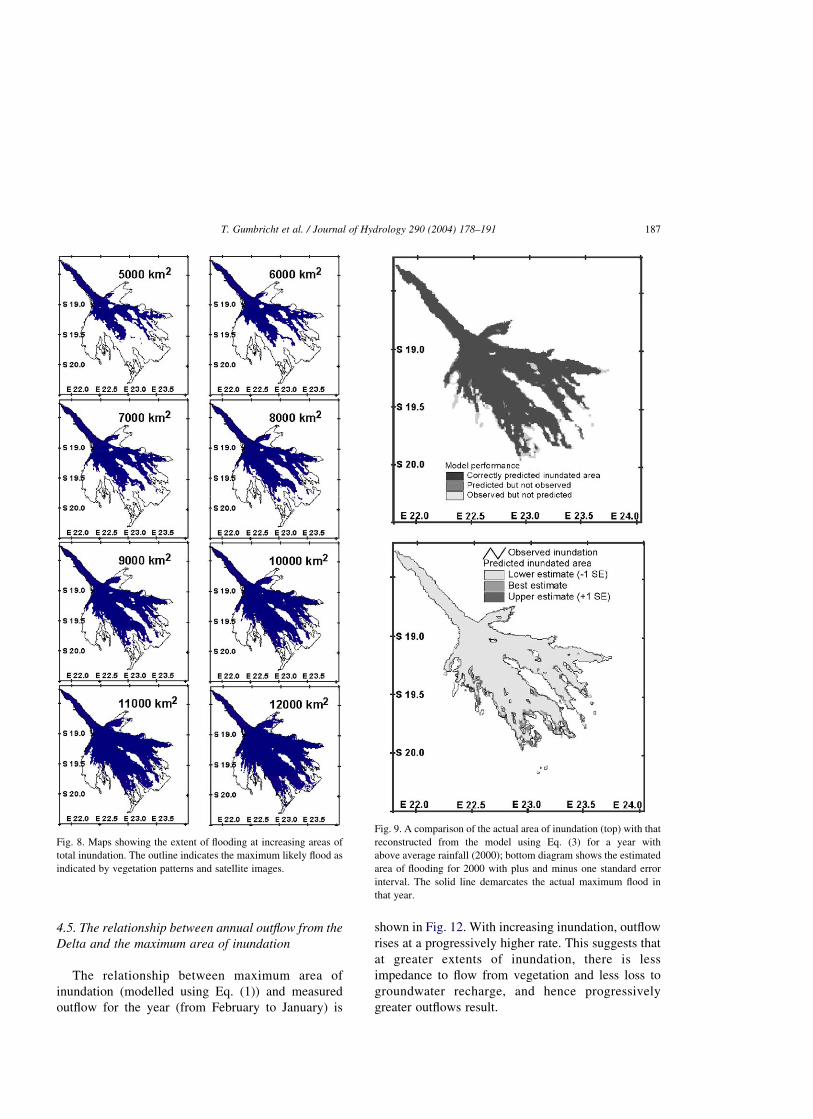
maps of flood extent described above (see Section 3)
were developed for this purpose. Fig. 8 shows eight of
these maps at progressively increasing area of total
inundation. Fig. 9 shows a comparison of an actual
flooded area (Fig. 9a) with one reconstructed from the
general model for a year with abnormally high rainfall
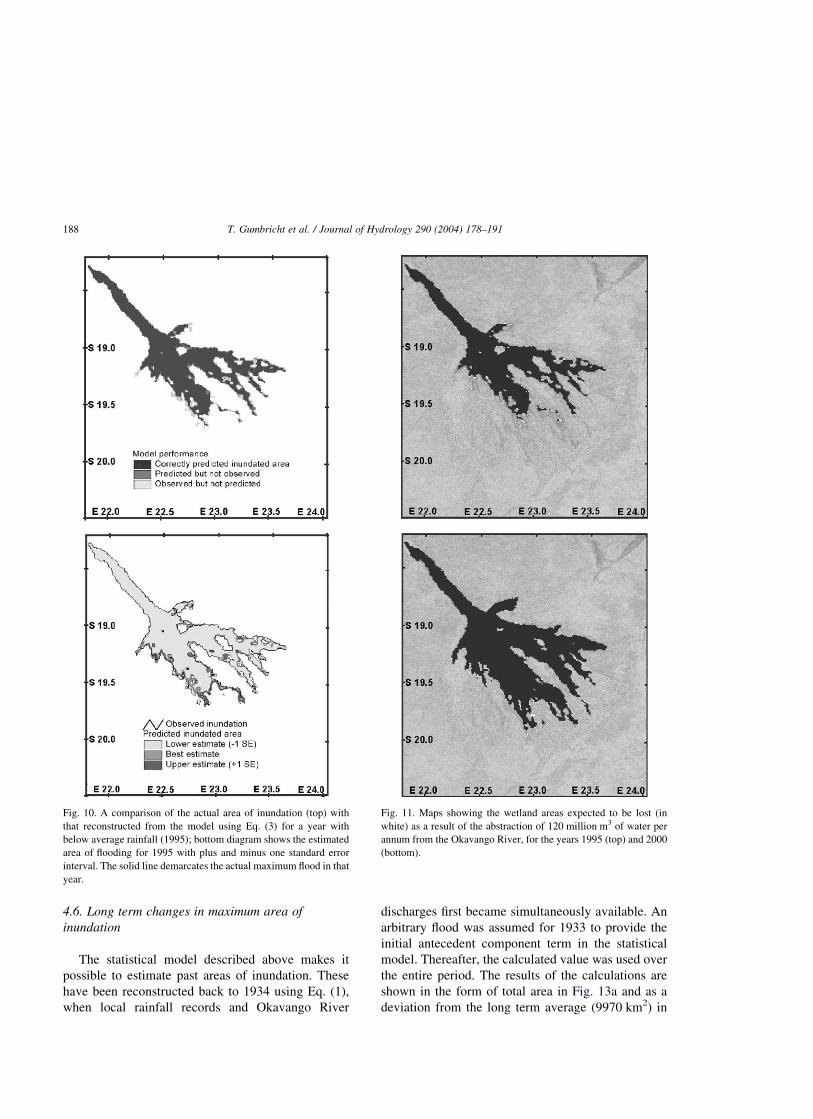
(2000), and Fig. 10 for a year with abnormally low
rainfall (1995). Figs. 9b and 10b show the estimated
areas of flooding with plus and minus one standard
error for the two respective years. The actual areas of
inundation are shown by the solid line. The actual area
of flooding generally falls within the limits set by one
standard error interval, except in the Xudum area,
where flooding has increased over time, and is hence
underestimated in the model-derived flood maps.
As discussed above, there appears to be a slow
secular switch in flood distribution from the Boro to
the Xudum system which will alter the distribution of
flood water in the future. The maps shown in Fig. 8
therefore will have a limited currency, and will
probably need to be updated in the future. The
discrepancies are larger for low total inundation, and
the maps will be valid for a longer period if used for
high total inundation.
The Namibian national water plan calls for the
abstraction of 120 million m3 per annum from
the Okavango River at Rundu (P.Heyns, pers.
comm.to TSM, although reported by Pallett (1997),
to be 100 million m3). The statistical model indicates
that this will result in the loss of 114 km2 of wetland
(the model is linear, and 95 km2 of wetland will be
lost per 100 million m3 of water abstracted per
annum). Spatial reconstruction indicates that the
loss will be very widely distributed along the
shoreline of the wetland (Fig. 11). In reality, the
real loss is likely to be even more widely spread than
indicated by the model, because the spatial resolution
of the model is 1 km2, which tends to shorten the
shoreline.
The model defined by Eq. (3) uses inflow from
November to May and rainfall over the same period,
and therefore can be used to predict the maximum
extent of flooding (in August), some three months
ahead of the peak. An ability to predict the extent of
flooding in advance could be useful to tour, air charter
and logistical support companies operating in the
Delta, although local calibration may be necessary, as
the resolution of the model is fairly coarse. This local
calibration would involve assessing in what way a
particular flood level will affect, for example, road
access to safari lodges and availability of air fields,
based on past experience.
Fig. 7. A comparison of the actual area of inundation with that modelled using Eq. (3) over the period 1985–2000.
T. Gumbricht et al. / Journal of Hydrology 290 (2004) 178–191186
4.5. The relationship between annual outflow from the
Delta and the maximum area of inundation
The relationship between maximum area of
inundation (modelled using Eq. (1)) and measured
outflow for the year (from February to January) is
shown in Fig. 12. With increasing inundation, outflow
rises at a progressively higher rate. This suggests that
at greater extents of inundation, there is less
impedance to flow from vegetation and less loss to
groundwater recharge, and hence progressively
greater outflows result.
Fig. 8. Maps showing the extent of flooding at increasing areas of
total inundation. The outline indicates the maximum likely flood as
indicated by vegetation patterns and satellite images.
Fig. 9. A comparison of the actual area of inundation (top) with that
reconstructed from the model using Eq. (3) for a year with
above average rainfall (2000); bottom diagram shows the estimated
area of flooding for 2000 with plus and minus one standard error
interval. The solid line demarcates the actual maximum flood in
that year.
T. Gumbricht et al. / Journal of Hydrology 290 (2004) 178–191 187
4.6. Long term changes in maximum area of
inundation
The statistical model described above makes it
possible to estimate past areas of inundation. These
have been reconstructed back to 1934 using Eq. (1),
when local rainfall records and Okavango River
discharges first became simultaneously available. An
arbitrary flood was assumed for 1933 to provide the
initial antecedent component term in the statistical
model. Thereafter, the calculated value was used over
the entire period. The results of the calculations are
shown in the form of total area in Fig. 13a and as a
deviation from the long term average (9970 km2) in
Fig. 10. A comparison of the actual area of inundation (top) with
that reconstructed from the model using Eq. (3) for a year with
below average rainfall (1995); bottom diagram shows the estimated
area of flooding for 1995 with plus and minus one standard error
interval. The solid line demarcates the actual maximum flood in that
year.
Fig. 11. Maps showing the wetland areas expected to be lost (in
white) as a result of the abstraction of 120 million m3 of water per
annum from the Okavango River, for the years 1995 (top) and 2000
(bottom).
T. Gumbricht et al. / Journal of Hydrology 290 (2004) 178–191188
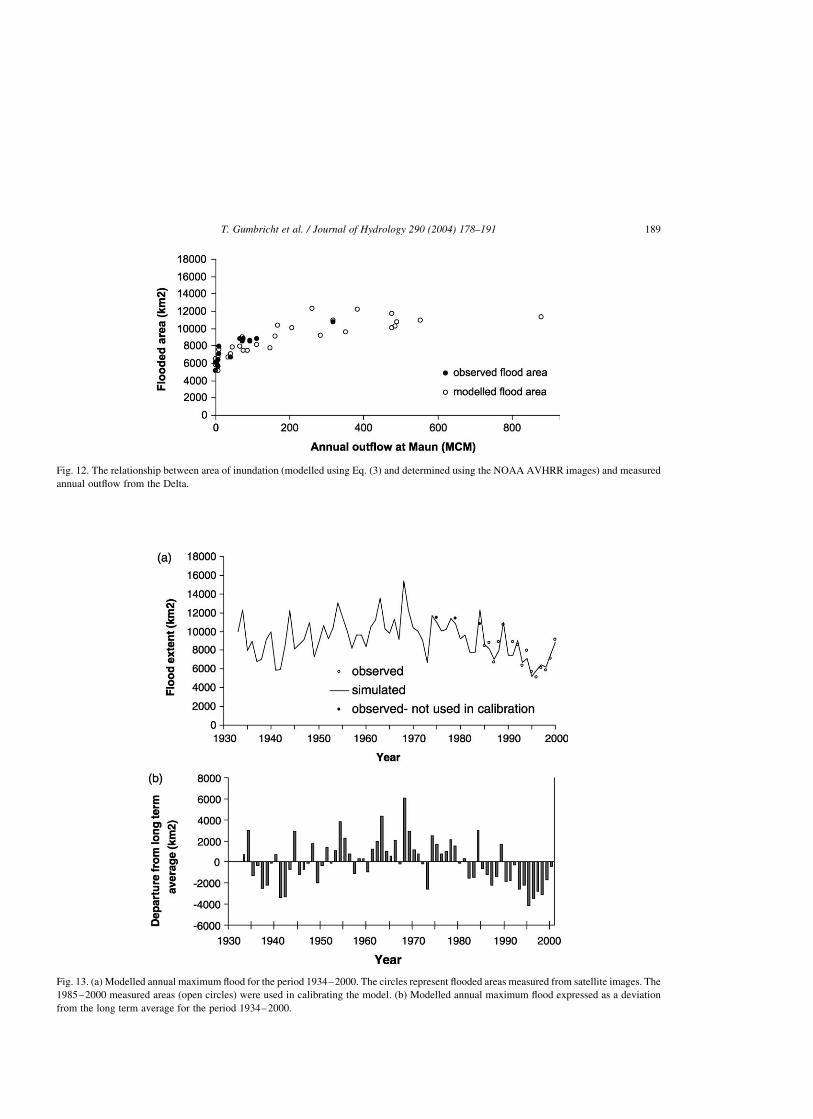
Fig. 12. The relationship between area of inundation (modelled using Eq. (3) and determined using the NOAA AVHRR images) and measured
annual outflow from the Delta.
Fig. 13. (a) Modelled annual maximum flood for the period 1934–2000. The circles represent flooded areas measured from satellite images. The
1985–2000 measured areas (open circles) were used in calibrating the model. (b) Modelled annual maximum flood expressed as a deviation
from the long term average for the period 1934–2000.
T. Gumbricht et al. / Journal of Hydrology 290 (2004) 178–191 189
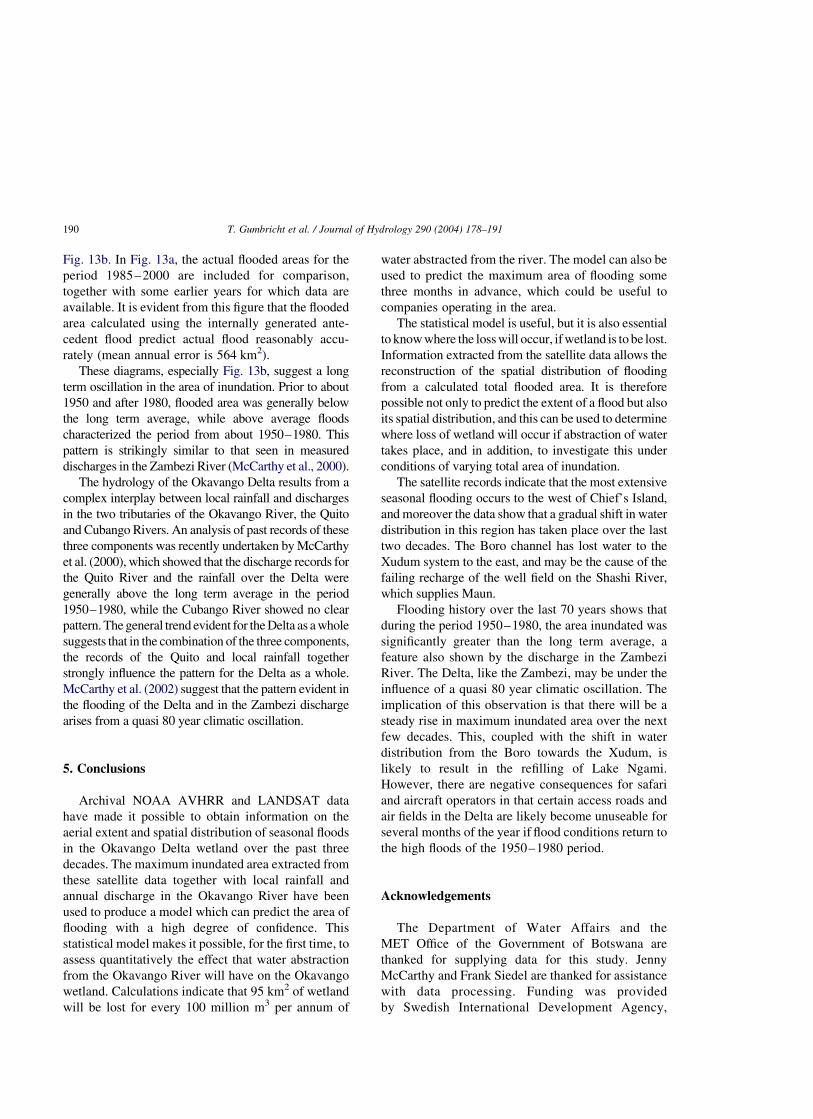
Fig. 13b. In Fig. 13a, the actual flooded areas for the
period 1985–2000 are included for comparison,
together with some earlier years for which data are
available. It is evident from this figure that the flooded
area calculated using the internally generated ante-
cedent flood predict actual flood reasonably accu-
rately (mean annual error is 564 km2).
These diagrams, especially Fig. 13b, suggest a long
term oscillation in the area of inundation. Prior to about
1950 and after 1980, flooded area was generally below
the long term average, while above average floods
characterized the period from about 1950–1980. This
pattern is strikingly similar to that seen in measured
discharges in the Zambezi River (McCarthy et al., 2000).
The hydrology of the Okavango Delta results from a
complex interplay between local rainfall and discharges
in the two tributaries of the Okavango River, the Quito
and Cubango Rivers. An analysis of past records of these
three components was recently undertaken by McCarthy
et al. (2000), which showed that the discharge records for
the Quito River and the rainfall over the Delta were
generally above the long term average in the period
1950–1980, while the Cubango River showed no clear
pattern. The general trend evident for the Delta as a whole
suggests that in the combination of the three components,
the records of the Quito and local rainfall together
strongly influence the pattern for the Delta as a whole.
McCarthy et al. (2002) suggest that the pattern evident in
the flooding of the Delta and in the Zambezi discharge
arises from a quasi 80 year climatic oscillation.
5. Conclusions
Archival NOAA AVHRR and LANDSAT data
have made it possible to obtain information on the
aerial extent and spatial distribution of seasonal floods
in the Okavango Delta wetland over the past three
decades. The maximum inundated area extracted from
these satellite data together with local rainfall and
annual discharge in the Okavango River have been
used to produce a model which can predict the area of
flooding with a high degree of confidence. This
statistical model makes it possible, for the first time, to
assess quantitatively the effect that water abstraction
from the Okavango River will have on the Okavango
wetland. Calculations indicate that 95 km2 of wetland
will be lost for every 100 million m3 per annum of
water abstracted from the river. The model can also be
used to predict the maximum area of flooding some
three months in advance, which could be useful to
companies operating in the area.
The statistical model is useful, but it is also essential
to know where the loss will occur, if wetland is to be lost.
Information extracted from the satellite data allows the
reconstruction of the spatial distribution of flooding
from a calculated total flooded area. It is therefore
possible not only to predict the extent of a flood but also
its spatial distribution, and this can be used to determine
where loss of wetland will occur if abstraction of water
takes place, and in addition, to investigate this under
conditions of varying total area of inundation.
The satellite records indicate that the most extensive
seasonal flooding occurs to the west of Chief’s Island,
and moreover the data show that a gradual shift in water
distribution in this region has taken place over the last
two decades. The Boro channel has lost water to the
Xudum system to the east, and may be the cause of the
failing recharge of the well field on the Shashi River,
which supplies Maun.
Flooding history over the last 70 years shows that
during the period 1950–1980, the area inundated was
significantly greater than the long term average, a
feature also shown by the discharge in the Zambezi
River. The Delta, like the Zambezi, may be under the
influence of a quasi 80 year climatic oscillation. The
implication of this observation is that there will be a
steady rise in maximum inundated area over the next
few decades. This, coupled with the shift in water
distribution from the Boro towards the Xudum, is
likely to result in the refilling of Lake Ngami.
However, there are negative consequences for safari
and aircraft operators in that certain access roads and
air fields in the Delta are likely become unuseable for
several months of the year if flood conditions return to
the high floods of the 1950–1980 period.
Acknowledgements
The Department of Water Affairs and the
MET Office of the Government of Botswana are
thanked for supplying data for this study. Jenny
McCarthy and Frank Siedel are thanked for assistance
with data processing. Funding was provided
by Swedish International Development Agency,
T. Gumbricht et al. / Journal of Hydrology 290 (2004) 178–191190
the National Research Foundation of South Africa,
and the Universities of the Witwatersrand and
Botswana.
References
Ashton, P., Manley, R., 1999. Potential hydrological implications of
water abstraction from the Okavango River in Namibia. Ninth
South African Hydrological Symposium, South Africa, Novem-
ber, 1–10.
Dincer, T., Child, S., Khupe, B., 1987. A simple mathematical
model of a complex hydrological system: Okavango swamp,
Botswana. Journal of Hydrology 93, 41–65.
Ellery, W.N., McCarthy, T.S., 1994. Principles of sustainable
utilization of the Okavango Delta ecosystem, Botswana.
Biological Conservation 70, 159–168.
Gieske, A., 1997. Modelling outflow from the Jao/Boro system in
the Okavango Delta, Botswana. Journal of Hydrology 193,
214–239.
Gumbricht, T., McCarthy, J., McCarthy, T. S., 2000. Portraying the
geophysiology of the Okavango Delta, Botswana. 28th
International Conference on Remote Sensing of the Environ-
ment. Cape Town, South Africa. CD ROM publication.
Gumbricht, T., McCarthy, T.S., Merry, C.L., 2001. The topography
of the Okavango Delta, Botswana, and its sedimentological and
tectonic implications. South African Journal of Geology 104,
243–264.
Herman, A., Kumar, V.B., Arkin, P.A., Kousky, J.V., 1997.
Objectively determined 10-day African rainfall estimates
created for famine early warning systems. International Journal
of Remote Sensing, 18(10): 2147–2159
Herman, A., Kumar, V. B., Arkin, P. A., Kousky, J. V. Objectively
determined ten-day African rainfall estimates created for famine
early warning systems. http://edcintl.cr.usgs.gov/adds.
McCarthy, J., 2002. Remote sensing for detection of landscape form
and function of the Okavango Delta. PhD Thesis TRITA-LWR.
PHD 1000, Department of Land and Water Resources
Engineering, Royal Institute of Technology, Stockholm,
Sweden, 50pp.
McCarthy, T.S., Barry, M., Bloem, A., Ellery, W.N., Heister, H.,
Merry, C.L., Ruther, H., Sternberg, H., 1997. The gradient of
the Okavango Fan Botswana, and its sedimentological and
tectonic implications. Journal of African Earth Sciences 24,
65–78.
McCarthy, T.S., Larkin, P.A., Bloem, A., 1998. Observations on the
hydrology and geohydrology of the Okavango Delta. South
African Journal of Geology, 101–117.
McCarthy, T.S., Cooper, G.R.J., Tyson, P.D., Ellery, W.N., 2000.
Seasonal flooding in the Okavango Delta Botswana—recent
history and future prospects. South African Journal of Science
96, 25–33.
Pallett, J., 1997. Sharing Water in Southern Africa,
Desert Research Foundation of Namibia, Windhoek, Nami-
bia, pp. 121.
Scudder, T., 1993. The IUCN review of the Southern Okavango
Integrated Water Development Project. IUCN, Gland, Switzer-
land, pp. 541.
UNDP, 1976. Investigation of the Okavango as a primary water
resource for Botswana. Technical Report, United Nations
Development Programme/Food and Agricultural Organization.
BOT/71/506. 3 volumes.
Wilson, B.H., Dincer, T., 1976. An introduction to the hydrology
and hydrography of the Okavango Delta, Proceedings of a
Symposium on the Okavango Delta, Botswana Society,
Gaberone, Botswana, pp. 33–48.
T. Gumbricht et al. / Journal of Hydrology 290 (2004) 178–191 191


![BOTSWANA WILD PARKS...Day 3 - 4 OKAVANGO DELTA [tented camp x2 BLD] We drive into the Okavango Delta to the launch station where we board our mekoro’s and pole to our tented camp](https://img.pdfslide.net/doc/110x75/6024111e889b9e642c2cc51c/botswana-wild-parks-day-3-4-okavango-delta-tented-camp-x2-bld-we-drive-into.jpg)