Embed Size (px)
Citation preview

DIEM
750
Zdenko CerovićUniversity of RijekaFaculty of Tourism and Hospitality Management Opatija, CroatiaE-mail: [email protected]
Sanda Grudić KvasićUniversity of RijekaFaculty of EconomicsE-mail: [email protected]
Ivana IvančićUniversity of RijekaFaculty of Tourism and Hospitality Management Opatija, CroatiaE-mail: [email protected]
FORECASTING TOURISM DEMAND – THE CASE OF THE CITY OF RIJEKA
Original scientific paperUDK: 005.521:338.48JEL classification: L83, Z32
AbstractTourism demand, as a set of goods and services people consume during their travels, greatly affects tourism development in a destination. Hence, forecasting tourism demand is the subject of numerous studies in the field of tourism. Many of these studies use a time series analysis approach to examine tourism demand, foremost through tourist arrivals but also through the number of overnights and tourist expenditure. The purpose of this paper is twofold: to examine trends in tourist arrivals in the city of Rijeka, Croatia over the last ten-year period and to forecast tourist arrivals in the near future. The time series analysis method is applied to this end, with tourism demand being measured by the overall number of tourist arrivals. The research findings provide deeper insights into, and a better understanding of, tourism demand forecasting as a factor of efficient tourism planning.
Keywords: tourism demand, forecasting, destination, tourism development

TOURISM
751
1. INTRODUCTIONAfter deindustrialization, the city of Rijeka, Croatia was faced with
the momentous question of how to define, and in which direction to focus, its development strategy. Given the city’s tangible resources and exceptional historical and architectural heritage, the logical perspective that arose referred to the development of tourism. However, since gaining competitive advantage no longer relies merely on natural resources, tourism forecasting plays a crucial role in Rijeka’s tourism planning. Such rationale led to the objective of this study, which was to find a quantitative solution to the number of tourists that could constitute tourism demand for Rijeka’s tourism facilities, services and programmes which are the result of the experience and knowledge of Rijeka Tourist Board which serves the role of destination management organization (DMO). Following this objective, the study employes the Holt-Winters triple exponential smoothing as a forecasting technique to predict tourism demand. The model estimation is based on the quarterly data of the realized number of tourist arrivals in the city of Rijeka in the period from the first quarter of 2006 to the last quarter of 2015 and was used to forecast values for the period from the first quarter of 2016 to the last quarter of 2020.
The remainder of this study is organized as follows. The next section considers the fundamental precepts and theoretical determinants of tourism demand and forecasting methods in tourism demand forecasting, followed by an extensive description of research methodology. The research results are discussed in the fourth section. The final part summarizes conclusions and implications of the study.
2. LITERATURE REVIEW2. 1. Conceptualisation of tourism demand
Tourism is seen as a highly-sophisticated integrated system within a national economy; its scope and structure exceeds the economic categories of activities, branches, industries and sectors, and it is composed of interrelated, heterogeneous, interdependent and complementary fragments of diverse economic branches and activities that together form a logical, functional and evenly balanced whole (Kesar, 2006, p. 86).
The development of a tourist destination is foremost determined and characterised by tourism demand. Notwithstanding the numerous definitions that exist, tourism demand is most often defined, for the purposes of tourism statistics, as the total number of persons participating in tourism traffic, or wishing to participate in tourism traffic, to consume various tourism services in places away from their usual places of residence and/or work (Cooper, Fletcher, Gilbert and Wanhill, 1998, p. 24). From an economic perspective, tourism demand can be defined as the quantity of goods and services that can be sold on the tourism market under specific conditions and at specific prices, that is, the quantity of goods and services for which potential tourism consumers show a realistic and objective interest (Vukonić and Čavlek, 2001, p. 329).

DIEM
752
Understanding tourism demand is an exceptionally complex process that is based on the following knowledge: a) demand is affected by an entire array of factors, in addition to prices; b) demand includes not only persons taking part in tourism traffic, but also those persons who wish to take part but are not able to for certain reasons; and c) tourism demand conditions relations in the tourism market. The first assumption implies that the creation of tourism demand is affected not only by people/tourists, but also by society, the state, the environment, suppliers and the entire economy. The second statement points to the conclusion that in addition to there being several types of demand – ideal, potential, real and effective – there is also suppressed demand. Finally, the last assumption indicates that potential tourism demand is the major determinant of tourism supply. Namely, the tourism market is based on the preferences of potential tourism demand that is willing to spend on products and services under specific conditions. In addition, tourism demand is dislocated (demand is physically separated from tourism supply), heterogeneous (the diversity of needs and motivations), elastic (in relation to the income of tourists), dynamic (mobility) and seasonal (due to climate constraints and free time available to tourists) (Čavlek et al., 2011, p. 57).
The characteristics of tourism demand and the many factors that affect it make it very difficult to forecast the scale of tourism demand. However, relevant research studies are nowdays focusing on investigating tourism demand trends to help transform potential demand into actual demand as the primary precondition to tourism development.
2.2. Forecasting tourism demand The distinctly competitive tourism market of today, where tourism
supply exceeds tourism demand (Čavlek et al., 2011, p. 57), is driving the need for the effective planning of tourism development in destinations, with tourism demand forecasting playing a crucial role (Burger, Dohnal, Kathrada and Law, 2001, p. 404). Tourism forecasts are valuable for both the private and public sector. Namely, they enable avoiding shortages or surpluses in goods and services, calculating tourism’s contribution to GDP and examining its impact on resources.
With regard to quantitative research methods, two basic groups of methods can be used to forecast tourism demand (Song and Li, 2008, p. 204): time series models and causal econometric approaches. Based on the assumption that historical data regarding an observed phenomenon are the key to predicting the future, time series methods use data patterns from the past to forecast future values of a given phenomenon. These methods include the naïve method, the moving average method, the exponential smoothing method and autoregressive integrated moving average models. On the other hand, causal methods mathematically simulate a cause-effect link between variables by using an array of explanatory variables that affect tourism demand. Causal methods include regression analysis and structural econometric models.
TOURISM
753
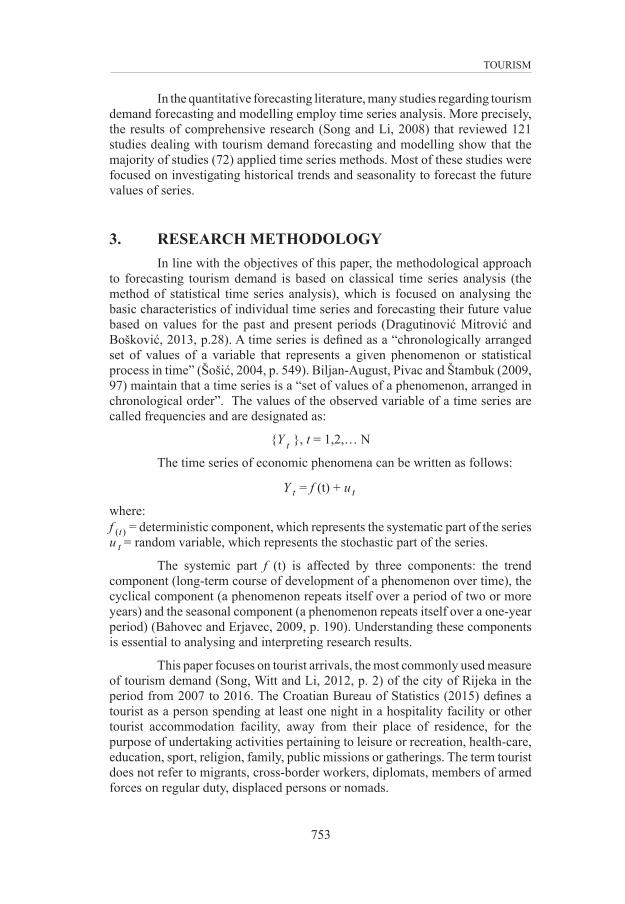
In the quantitative forecasting literature, many studies regarding tourism demand forecasting and modelling employ time series analysis. More precisely, the results of comprehensive research (Song and Li, 2008) that reviewed 121 studies dealing with tourism demand forecasting and modelling show that the majority of studies (72) applied time series methods. Most of these studies were focused on investigating historical trends and seasonality to forecast the future values of series.
3. RESEARCH METHODOLOGY In line with the objectives of this paper, the methodological approach
to forecasting tourism demand is based on classical time series analysis (the method of statistical time series analysis), which is focused on analysing the basic characteristics of individual time series and forecasting their future value based on values for the past and present periods (Dragutinović Mitrović and Bošković, 2013, p.28). A time series is defined as a “chronologically arranged set of values of a variable that represents a given phenomenon or statistical process in time” (Šošić, 2004, p. 549). Biljan-August, Pivac and Štambuk (2009, 97) maintain that a time series is a “set of values of a phenomenon, arranged in chronological order”. The values of the observed variable of a time series are called frequencies and are designated as:
{Y t }, t = 1,2,… N
The time series of economic phenomena can be written as follows:
Y t = f (t) + u t
where:f )(t = deterministic component, which represents the systematic part of the seriesu t = random variable, which represents the stochastic part of the series.
The systemic part f (t) is affected by three components: the trend component (long-term course of development of a phenomenon over time), the cyclical component (a phenomenon repeats itself over a period of two or more years) and the seasonal component (a phenomenon repeats itself over a one-year period) (Bahovec and Erjavec, 2009, p. 190). Understanding these components is essential to analysing and interpreting research results.
This paper focuses on tourist arrivals, the most commonly used measure of tourism demand (Song, Witt and Li, 2012, p. 2) of the city of Rijeka in the period from 2007 to 2016. The Croatian Bureau of Statistics (2015) defines a tourist as a person spending at least one night in a hospitality facility or other tourist accommodation facility, away from their place of residence, for the purpose of undertaking activities pertaining to leisure or recreation, health-care, education, sport, religion, family, public missions or gatherings. The term tourist does not refer to migrants, cross-border workers, diplomats, members of armed forces on regular duty, displaced persons or nomads.

DIEM
754
Data on the number of tourist arrivals in Rijeka were collected from the publications of the Croatian Bureau of Statistics. The sources of data on tourist arrivals in Rijeka at the annual level were the publications First Release – Tourist Arrivals and Overnights for 2015 and 2016, while the source of data on tourist arrivals in Rijeka by month were the publications First Release – Tourism, for the period January 2006 – December 2016. Following the recommendations of similar studies, the collected data are presented on a quarterly basis.
The time horizon of analysis covers the period from the 1st quarter of 2006 to the 4th quarter of 2020. A model was built based on data for the period from the 1st quarter of 2006 to the 4th quarter of 2015 and was used to forecast values for the period from the 1st quarter of 2016 to the last quarter of of 2020.
Time series modelling is based on decomposition, that is, on separating the time series into trend, seasonal and cyclical components to identify their influences. To this end, the Hodrick-Prescott filter was used to detrend the time series.
The Hodrick-Prescott filter is based on the resolution of the following minimisation problem:
min ( )∑=
−N
ttty
1
2τ +λ ( ) ( )[ ]∑−
=−+ −−−
1
211
N
ttttt ττττ 2
where y is the time series,τ is the trend component, and λ is the smoothing parameter (Kožić and Gatti, 2012, p. 489). Given the quarterly presentation of data, and as recommended by Hodrick and Prescott (1997), λ = 1600 is used in this study.
In accordance with the attributes of tourism demand in Rijeka in the observed period, the Holt-Winters model was used for the short-term forecasting of tourist arrivals. The Holt-Winters multiplier model involves triple exponential smoothing (overall smoothing, trend smoothing and seasonal smoothing) and is suitable for data that display a trend component and a seasonal component. After the values of level, trend and seasonality were calculated, the following equation was used for forecasting:
Y ht+ = (L t + hb t )S hst +−
where:
Y – forecast value of a phenomenonL – level of the seriesS – seasonal componentb – trend of the seriesh – number of periods of forecasting s – number of seasonal periods in one year t – time period
Triple exponential smoothing is based on the estimation of three smoothing constants – alpha, beta and gamma. In this paper, smoothing constants were chosen whose forecast values gave the lowest absolute percentage error
TOURISM
755
(α=0.1; β=0.3; γ=0.3).
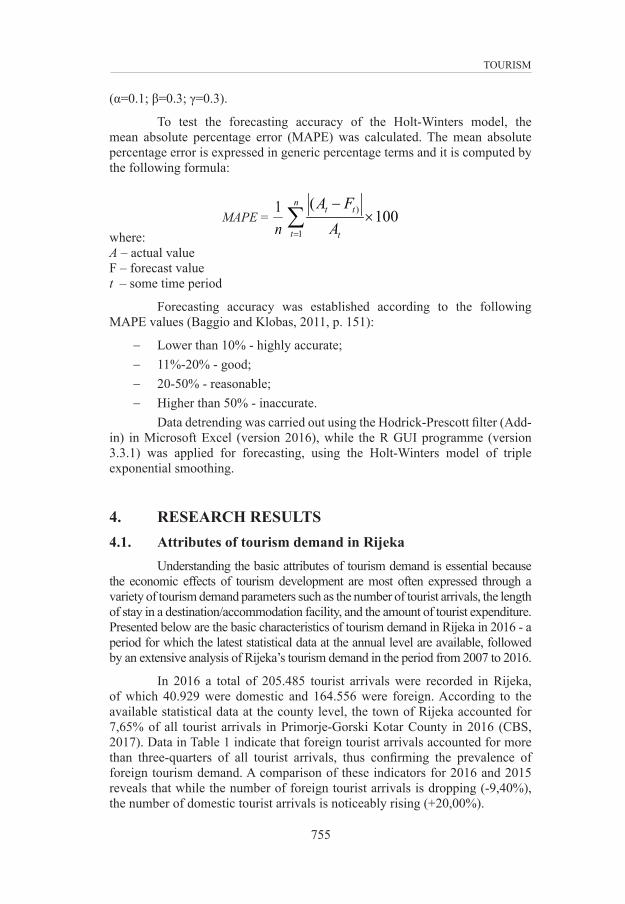
To test the forecasting accuracy of the Holt-Winters model, the mean absolute percentage error (MAPE) was calculated. The mean absolute percentage error is expressed in generic percentage terms and it is computed by the following formula:
where:A – actual valueF – forecast value t – some time period
Forecasting accuracy was established according to the following MAPE values (Baggio and Klobas, 2011, p. 151):
−− Lower than 10% - highly accurate;−− 11%-20% - good;−− 20-50% - reasonable;−− Higher than 50% - inaccurate.
Data detrending was carried out using the Hodrick-Prescott filter (Add-in) in Microsoft Excel (version 2016), while the R GUI programme (version 3.3.1) was applied for forecasting, using the Holt-Winters model of triple exponential smoothing.
4. RESEARCH RESULTS 4.1. Attributes of tourism demand in Rijeka
Understanding the basic attributes of tourism demand is essential because the economic effects of tourism development are most often expressed through a variety of tourism demand parameters such as the number of tourist arrivals, the length of stay in a destination/accommodation facility, and the amount of tourist expenditure. Presented below are the basic characteristics of tourism demand in Rijeka in 2016 - a period for which the latest statistical data at the annual level are available, followed by an extensive analysis of Rijeka’s tourism demand in the period from 2007 to 2016.
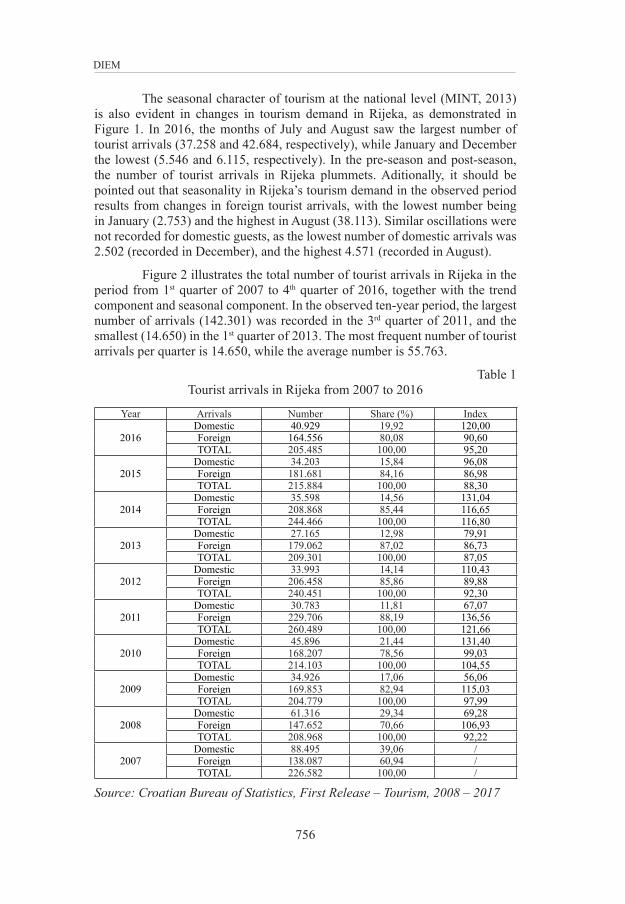
In 2016 a total of 205.485 tourist arrivals were recorded in Rijeka, of which 40.929 were domestic and 164.556 were foreign. According to the available statistical data at the county level, the town of Rijeka accounted for 7,65% of all tourist arrivals in Primorje-Gorski Kotar County in 2016 (CBS, 2017). Data in Table 1 indicate that foreign tourist arrivals accounted for more than three-quarters of all tourist arrivals, thus confirming the prevalence of foreign tourism demand. A comparison of these indicators for 2016 and 2015 reveals that while the number of foreign tourist arrivals is dropping (-9,40%), the number of domestic tourist arrivals is noticeably rising (+20,00%).
MAPE = n1 ∑
=
×−n
t t
tt
AFA
1
) 100(
DIEM
756
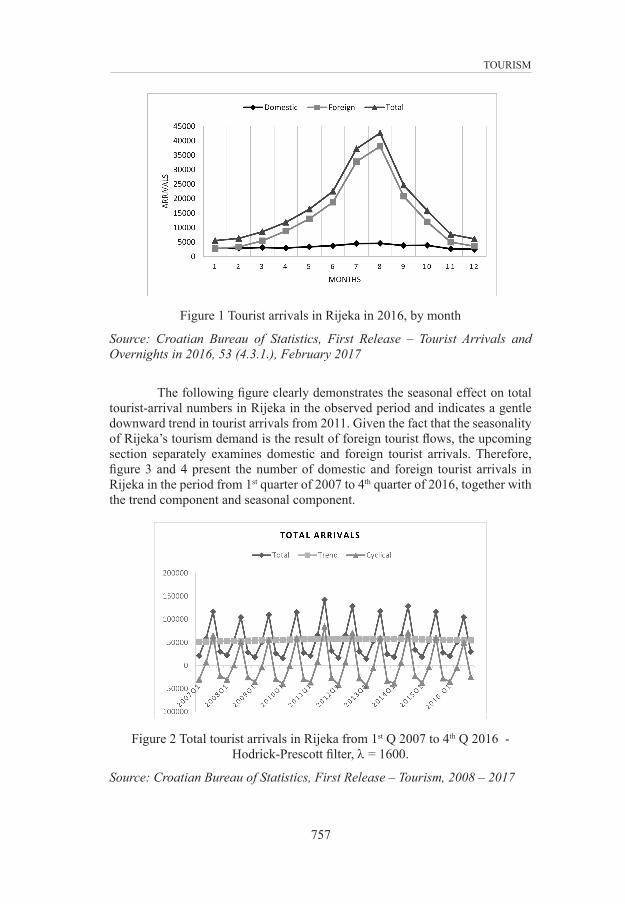
The seasonal character of tourism at the national level (MINT, 2013) is also evident in changes in tourism demand in Rijeka, as demonstrated in Figure 1. In 2016, the months of July and August saw the largest number of tourist arrivals (37.258 and 42.684, respectively), while January and December the lowest (5.546 and 6.115, respectively). In the pre-season and post-season, the number of tourist arrivals in Rijeka plummets. Aditionally, it should be pointed out that seasonality in Rijeka’s tourism demand in the observed period results from changes in foreign tourist arrivals, with the lowest number being in January (2.753) and the highest in August (38.113). Similar oscillations were not recorded for domestic guests, as the lowest number of domestic arrivals was 2.502 (recorded in December), and the highest 4.571 (recorded in August).
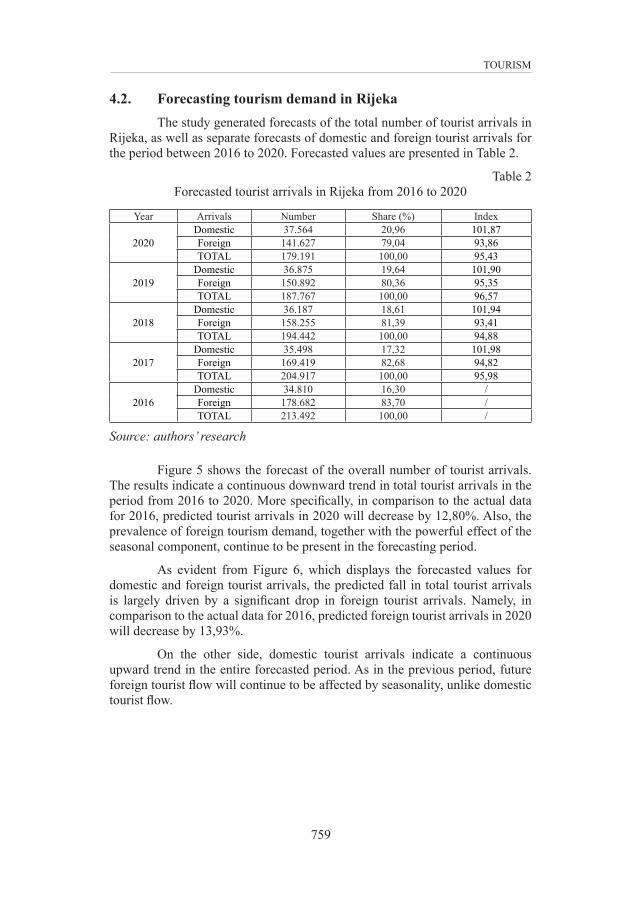
Figure 2 illustrates the total number of tourist arrivals in Rijeka in the period from 1st quarter of 2007 to 4th quarter of 2016, together with the trend component and seasonal component. In the observed ten-year period, the largest number of arrivals (142.301) was recorded in the 3rd quarter of 2011, and the smallest (14.650) in the 1st quarter of 2013. The most frequent number of tourist arrivals per quarter is 14.650, while the average number is 55.763.
Table 1Tourist arrivals in Rijeka from 2007 to 2016
Year Arrivals Number Share (%) Index
2016Domestic 40.929 19,92 120,00Foreign 164.556 80,08 90,60TOTAL 205.485 100,00 95,20
2015Domestic 34.203 15,84 96,08Foreign 181.681 84,16 86,98TOTAL 215.884 100,00 88,30
2014Domestic 35.598 14,56 131,04Foreign 208.868 85,44 116,65TOTAL 244.466 100,00 116,80
2013Domestic 27.165 12,98 79,91Foreign 179.062 87,02 86,73TOTAL 209.301 100,00 87,05
2012Domestic 33.993 14,14 110,43Foreign 206.458 85,86 89,88TOTAL 240.451 100,00 92,30
2011Domestic 30.783 11,81 67,07Foreign 229.706 88,19 136,56TOTAL 260.489 100,00 121,66
2010Domestic 45.896 21,44 131,40Foreign 168.207 78,56 99,03TOTAL 214.103 100,00 104,55
2009Domestic 34.926 17,06 56,06Foreign 169.853 82,94 115,03TOTAL 204.779 100,00 97,99
2008Domestic 61.316 29,34 69,28Foreign 147.652 70,66 106,93TOTAL 208.968 100,00 92,22
2007Domestic 88.495 39,06 /Foreign 138.087 60,94 /TOTAL 226.582 100,00 /
Source: Croatian Bureau of Statistics, First Release – Tourism, 2008 – 2017
TOURISM
757
Figure 1 Tourist arrivals in Rijeka in 2016, by month
Source: Croatian Bureau of Statistics, First Release – Tourist Arrivals and Overnights in 2016, 53 (4.3.1.), February 2017
The following figure clearly demonstrates the seasonal effect on total tourist-arrival numbers in Rijeka in the observed period and indicates a gentle downward trend in tourist arrivals from 2011. Given the fact that the seasonality of Rijeka’s tourism demand is the result of foreign tourist flows, the upcoming section separately examines domestic and foreign tourist arrivals. Therefore, figure 3 and 4 present the number of domestic and foreign tourist arrivals in Rijeka in the period from 1st quarter of 2007 to 4th quarter of 2016, together with the trend component and seasonal component.
Figure 2 Total tourist arrivals in Rijeka from 1st Q 2007 to 4th Q 2016 - Hodrick-Prescott filter, λ = 1600.
Source: Croatian Bureau of Statistics, First Release – Tourism, 2008 – 2017

DIEM
758
Figure 3 Domestic tourist arrivals in Rijeka from 1st Q 2007 to 4th Q 2016 - Hodrick-Prescott filter, λ = 1600.
Source: Croatian Bureau of Statistics, First Release – Tourism, 2008 – 2017
Figure 4 Foreign tourist arrivals in Rijeka from 1st Q 2007 to 4th Q 2016 - Hodrick-Prescott filter, λ = 1600.
Source: Croatian Bureau of Statistics, First Release – Tourism, 2008 – 2017
The smallest number of domestic tourist arrivals (4.982) was recorded in the 2nd quarter of 2010, and the largest (33.802) in the 2nd quarter of 2007. The number of foreign tourist arrivals was the lowest (4.709) in the 1st quarter of 2007 and the highest (134.370) in the 3rd quarter of 2010.
A downward trend in tourist arrivals is evident in the case of domestic tourists in the observed period, while foreign tourist arrival numbers are characterised by an upward trend. However, foreign tourism demand in Rijeka displays pronounced seasonality in comparison with domestic tourism demand.
TOURISM
759
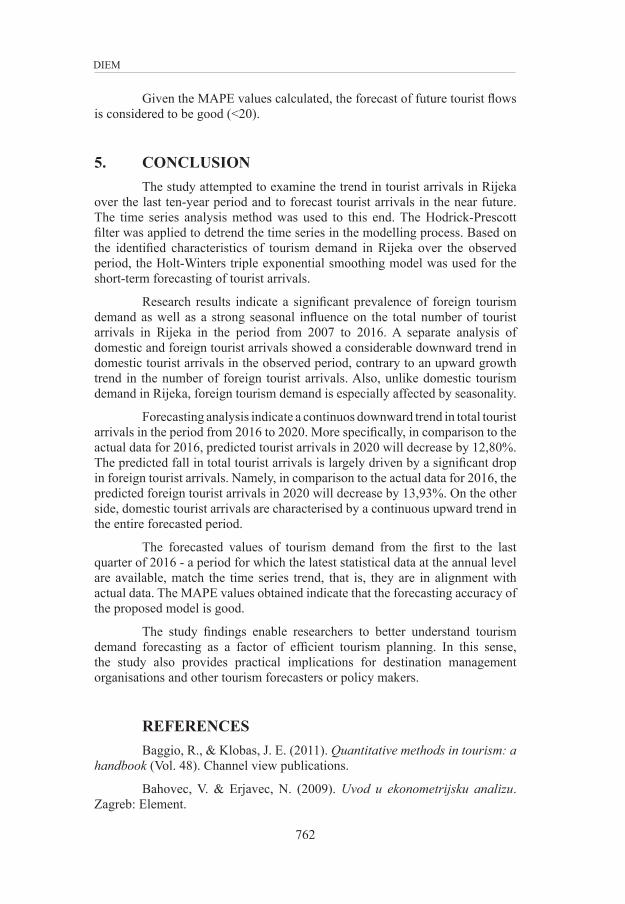
4.2. Forecasting tourism demand in RijekaThe study generated forecasts of the total number of tourist arrivals in
Rijeka, as well as separate forecasts of domestic and foreign tourist arrivals for the period between 2016 to 2020. Forecasted values are presented in Table 2.
Table 2Forecasted tourist arrivals in Rijeka from 2016 to 2020
Year Arrivals Number Share (%) Index
2020Domestic 37.564 20,96 101,87Foreign 141.627 79,04 93,86TOTAL 179.191 100,00 95,43
2019Domestic 36.875 19,64 101,90Foreign 150.892 80,36 95,35TOTAL 187.767 100,00 96,57
2018Domestic 36.187 18,61 101,94Foreign 158.255 81,39 93,41TOTAL 194.442 100,00 94,88
2017Domestic 35.498 17,32 101,98Foreign 169.419 82,68 94,82TOTAL 204.917 100,00 95,98
2016Domestic 34.810 16,30 /Foreign 178.682 83,70 /TOTAL 213.492 100,00 /
Source: authors’ research
Figure 5 shows the forecast of the overall number of tourist arrivals. The results indicate a continuous downward trend in total tourist arrivals in the period from 2016 to 2020. More specifically, in comparison to the actual data for 2016, predicted tourist arrivals in 2020 will decrease by 12,80%. Also, the prevalence of foreign tourism demand, together with the powerful effect of the seasonal component, continue to be present in the forecasting period.
As evident from Figure 6, which displays the forecasted values for domestic and foreign tourist arrivals, the predicted fall in total tourist arrivals is largely driven by a significant drop in foreign tourist arrivals. Namely, in comparison to the actual data for 2016, predicted foreign tourist arrivals in 2020 will decrease by 13,93%.
On the other side, domestic tourist arrivals indicate a continuous upward trend in the entire forecasted period. As in the previous period, future foreign tourist flow will continue to be affected by seasonality, unlike domestic tourist flow.

DIEM
760
Figure 5 Forecasted total tourist arrivals in Rijeka from 1st Q 2016 to 4th Q 2020
Source: authors’ research
Figure 6 Forecasted domestic and foreign tourist arrivals in Rijeka from 1st Q 2016 to 4th Q 2020
Source: authors’ research
After modelling and forecasting the number of tourist arrivals, the forecast values were compared with the actual number of tourist arrivals in Rijeka for the year 2016 - a period for which the latest statistical data at the annual level are available.

TOURISM
761
Figure 7 Actual and forecasted total tourist arrivals from 1st Q 2016 to 4th Q 2016
Source: authors’ research
Figure 8 Actual and forecasted domestic and foreign tourist arrivals from 1st Q 2016 to 4th Q 2016
Source: authors’ research
The above figures demonstrate that tourism demand forecasts are in line with the trend of time series; in other words, the forecasts are in alignment with the actual data. This is also confirmed by MAPE values:
−− Total arrivals forecast - MAPE 15.03322−− Domestic tourist arrivals forecast – MAPE 15.31565−− Foreign tourist arrivals forecast – MAPE 15.25278.
DIEM
762
Given the MAPE values calculated, the forecast of future tourist flows is considered to be good (<20).
5. CONCLUSIONThe study attempted to examine the trend in tourist arrivals in Rijeka
over the last ten-year period and to forecast tourist arrivals in the near future. The time series analysis method was used to this end. The Hodrick-Prescott filter was applied to detrend the time series in the modelling process. Based on the identified characteristics of tourism demand in Rijeka over the observed period, the Holt-Winters triple exponential smoothing model was used for the short-term forecasting of tourist arrivals.
Research results indicate a significant prevalence of foreign tourism demand as well as a strong seasonal influence on the total number of tourist arrivals in Rijeka in the period from 2007 to 2016. A separate analysis of domestic and foreign tourist arrivals showed a considerable downward trend in domestic tourist arrivals in the observed period, contrary to an upward growth trend in the number of foreign tourist arrivals. Also, unlike domestic tourism demand in Rijeka, foreign tourism demand is especially affected by seasonality.
Forecasting analysis indicate a continuos downward trend in total tourist arrivals in the period from 2016 to 2020. More specifically, in comparison to the actual data for 2016, predicted tourist arrivals in 2020 will decrease by 12,80%. The predicted fall in total tourist arrivals is largely driven by a significant drop in foreign tourist arrivals. Namely, in comparison to the actual data for 2016, the predicted foreign tourist arrivals in 2020 will decrease by 13,93%. On the other side, domestic tourist arrivals are characterised by a continuous upward trend in the entire forecasted period.
The forecasted values of tourism demand from the first to the last quarter of 2016 - a period for which the latest statistical data at the annual level are available, match the time series trend, that is, they are in alignment with actual data. The MAPE values obtained indicate that the forecasting accuracy of the proposed model is good.
The study findings enable researchers to better understand tourism demand forecasting as a factor of efficient tourism planning. In this sense, the study also provides practical implications for destination management organisations and other tourism forecasters or policy makers.
REFERENCESBaggio, R., & Klobas, J. E. (2011). Quantitative methods in tourism: a
handbook (Vol. 48). Channel view publications.
Bahovec, V. & Erjavec, N. (2009). Uvod u ekonometrijsku analizu. Zagreb: Element.

TOURISM
763
Biljan-August, M., Pivac, S., i Štambuk, A. (2009). Uporaba statistike u ekonomiji. Rijeka: Ekonomski fakultet Sveučilišta u Rijeci.
Burger, C. J. S. C., Dohnal, M., Kathrada, M., & Law, R. (2001). A practitioners guide to time-series methods for tourism demand forecasting—a case study of Durban, South Africa. Tourism management, 22(4), 403-409.
Cooper, C., Fletcher, J., Gilbert, D. & Wanhill, S. (1998). Tourism – Principles and Practice. London: Longman.
Čavlek, N., Bartoluci, M., Prebežac, D., Kesar, O., et al. (2011). Turizam - ekonomske osnove i organizacijski sustav. Zagreb: Školska knjiga.
Dragutinović Mitrović, R., & Bošković, O. (2013). Osnovi statističke analize-elementi analize vremenskih serija. Beograd: Centar za izdavačku delatnost Ekonomskog fakulteta u Beogradu.
Croatian Bureau of Statistics, First Release – Tourist Arrivals and Overnights, 2016 - 2017.
Croatian Bureau of Statistics, First Release – Tourism, 2008 – 2017.
Hodrick, R. J., & Prescott, E. C. (1997). Postwar US business cycles: an empirical investigation. Journal of Money, credit, and Banking, 1-16.
Kesar, O. (2006). Ekonomski učinci turističke potrošnje. Doktorska disertacija, Ekonomski fakultet Zagreb.
Kožić, I., & Gatti, P. (2012). Istraživanje ciklusa turističke potražnje. Ekonomska misao i praksa, (2), 479-496.
MINT Ministarstvo turizma. (2013). Strategija razvoja turizma Republike Hrvatske do 2020. godine, Dostupno na: http://www.mint.hr/UserDocsImages/Strategija-turizam-2020-editfinal.pdf, Pristup 12.08.2016.
Song, H., & Li, G. (2008). Tourism demand modelling and forecasting – A review of recent research. Tourism Management, 29(2), 203-220.
Song, H., Witt, S., & Li, G. (2012). The Advanced Econometrics of Tourism Demand. London: Routledge.
Šošić, I. (2004). Primijenjena statistika. Zagreb: Školska knjiga.
Vukonić, B. & Čavlek, N. (ed.) (2001). Rječnik turizma. Zagreb: Masmedia.